Automatic Shadow Detection for Multispectral Satellite Remote Sensing Images in Invariant Color Spaces

 ,
, 
Abstract
:
1. Introduction
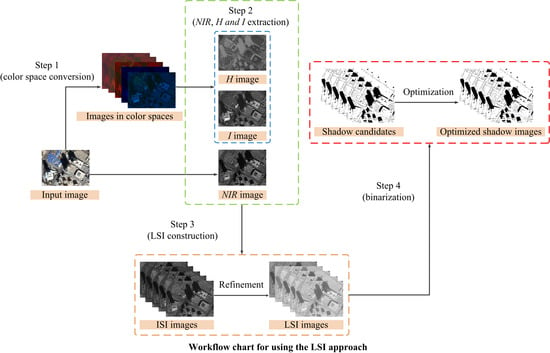
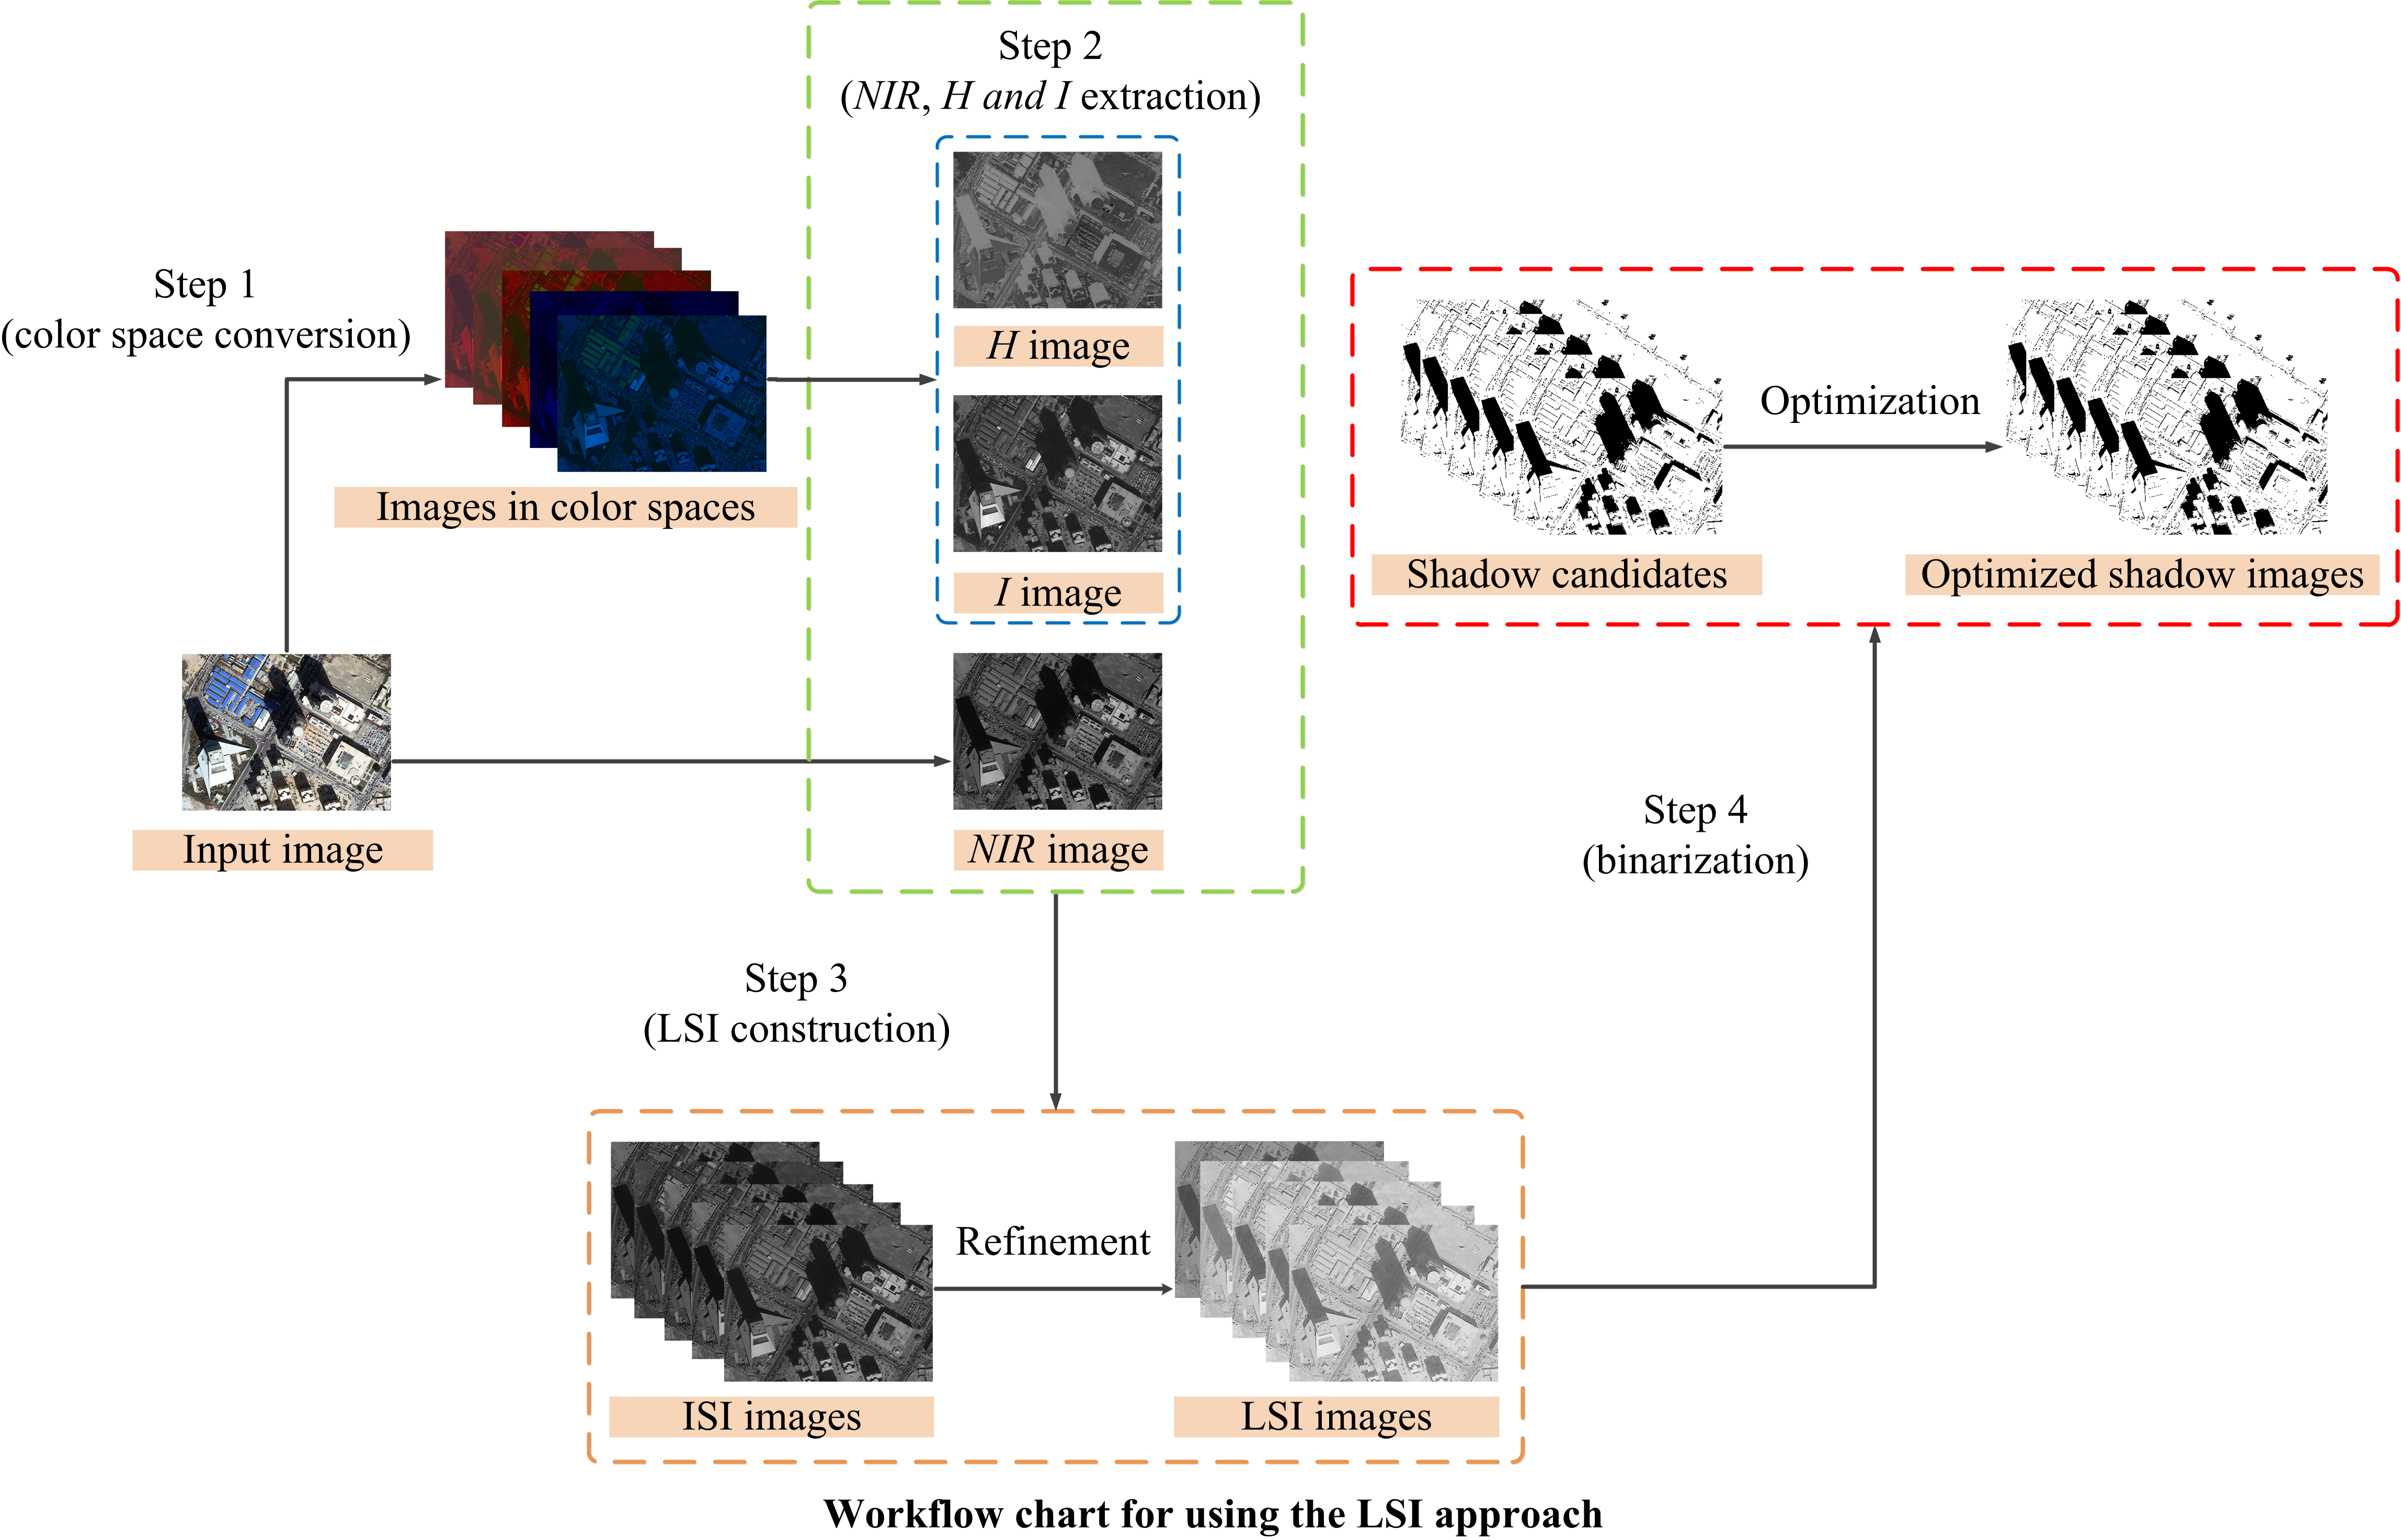
2. Method
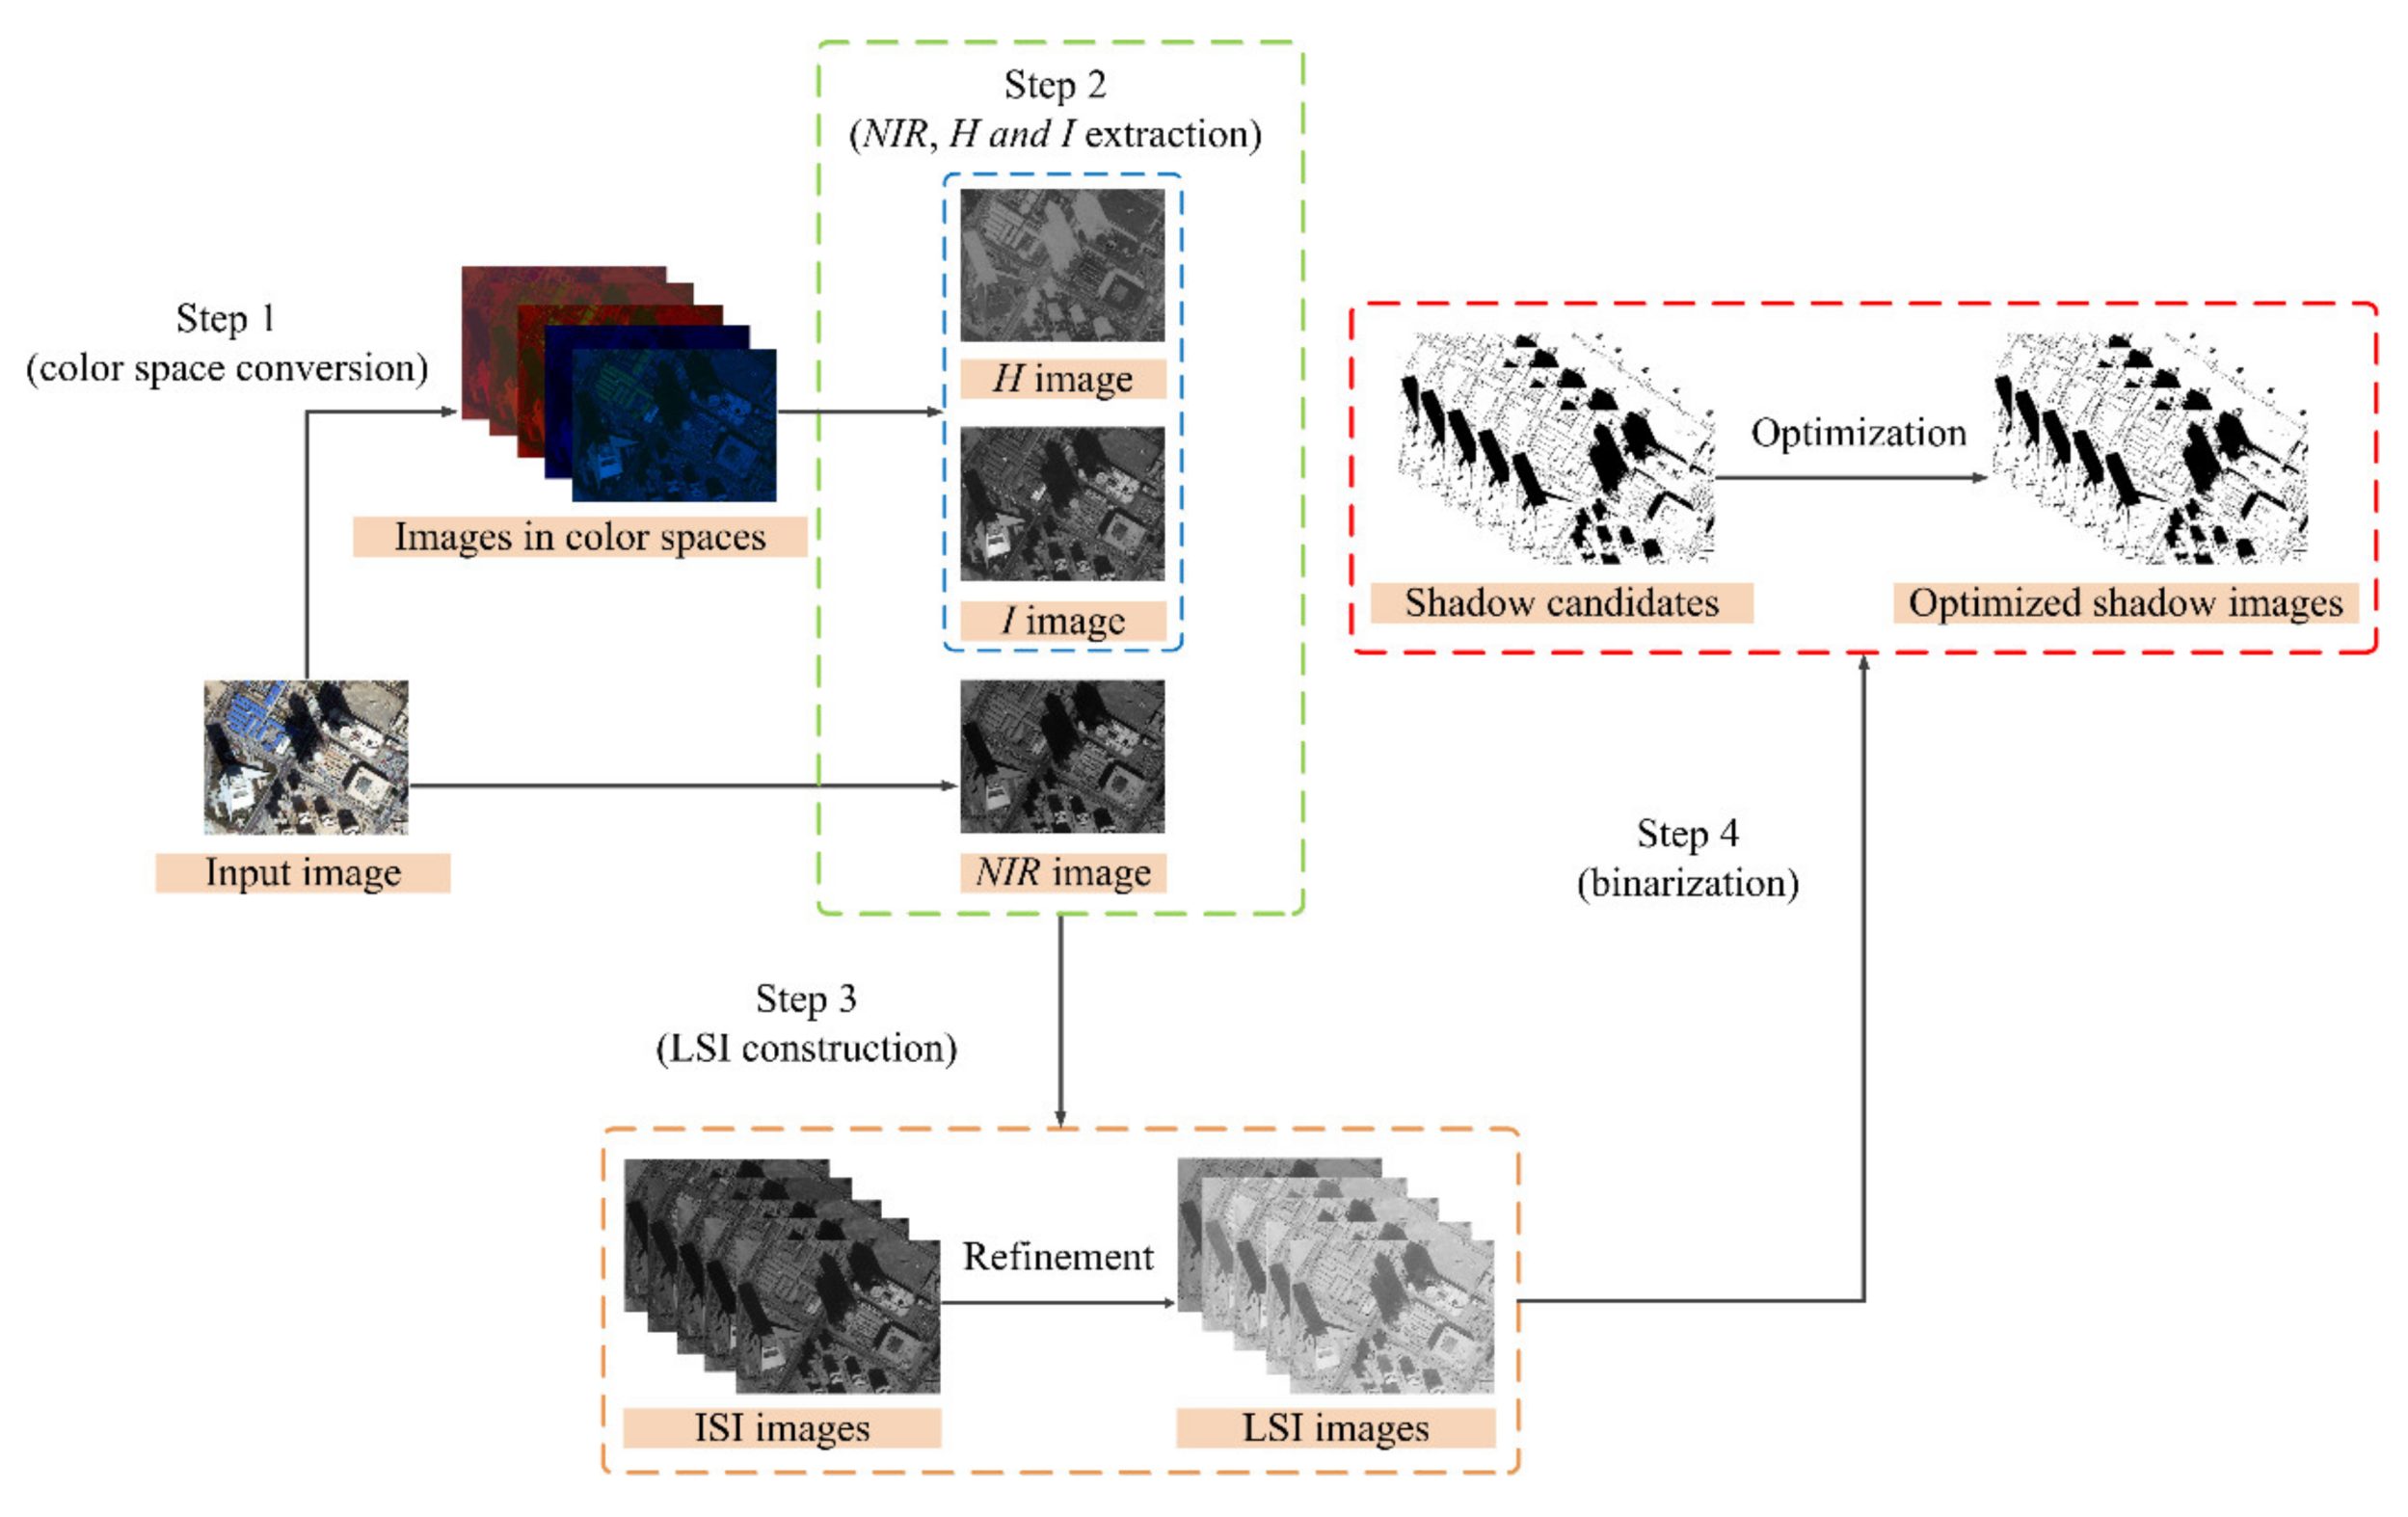
- Dramatic decrease in terms of NIR component compared with R, G and B components.
- Higher hue (H) values.
- Lower intensity (I) values.
2.1. Step 1: Color Space Conversion
2.2. Step 2: NIR, H and I Extraction
2.3. Step 3: LSI Construction
2.4. Step 4: Binarization
3. Experiments and Performance Assessment
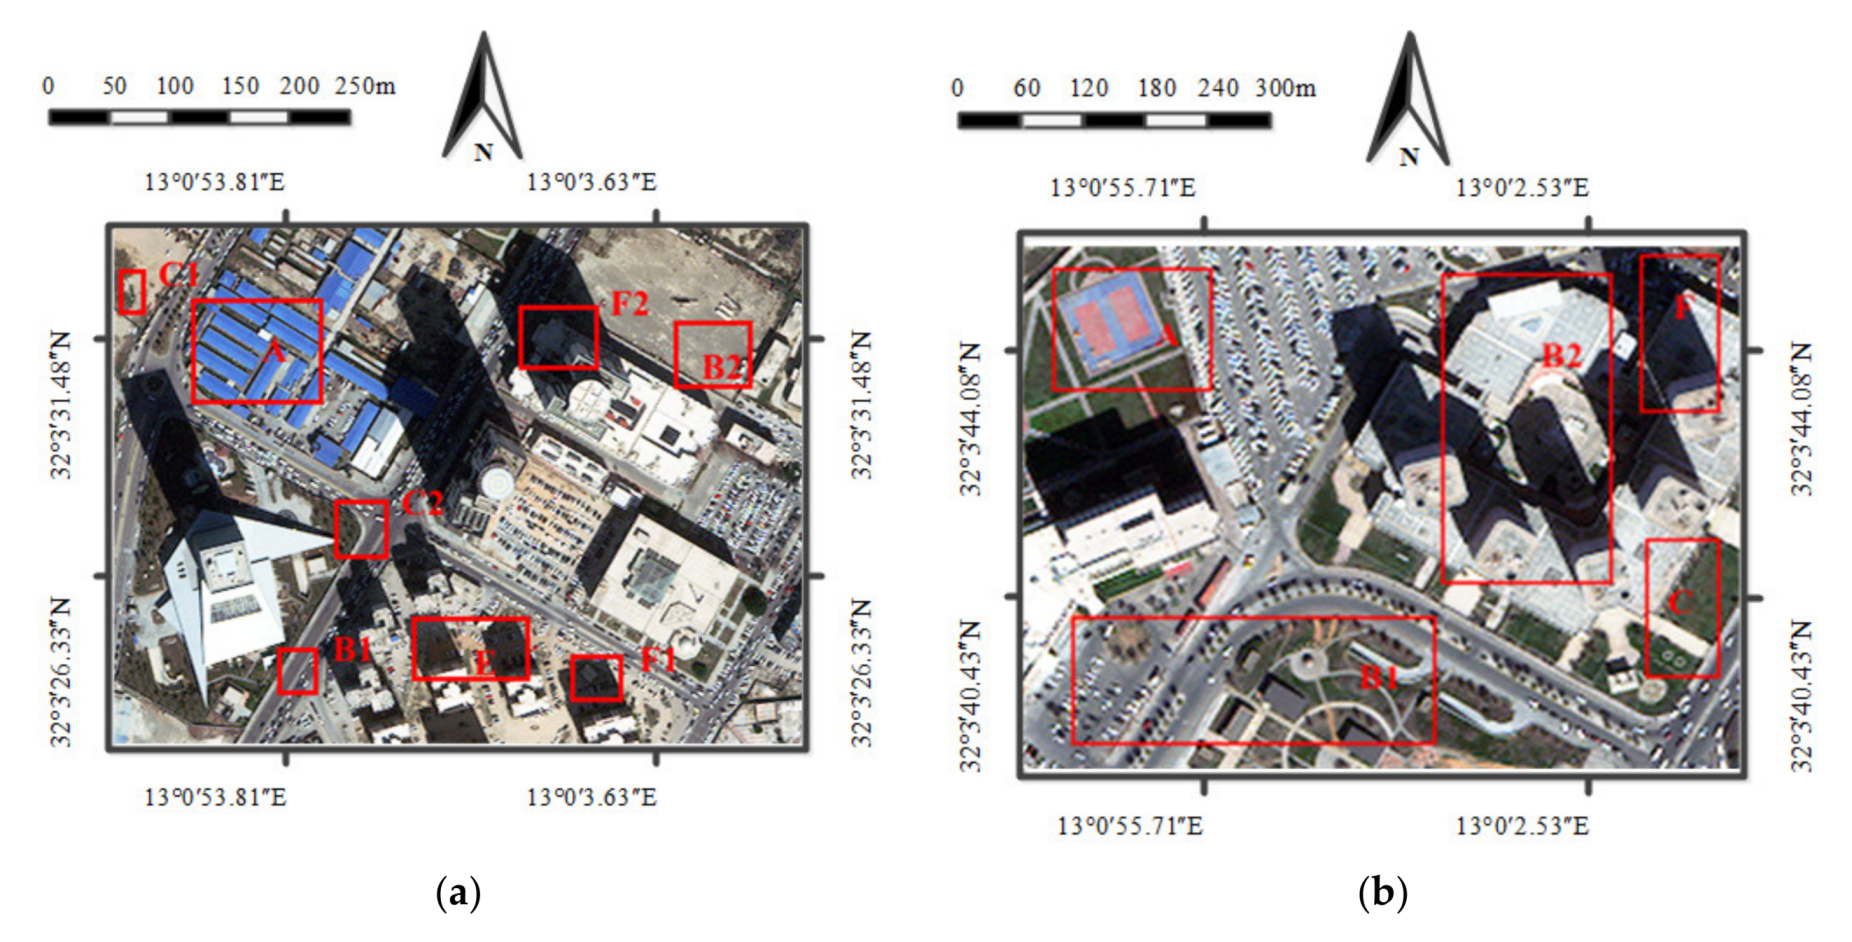
3.1. Test Images
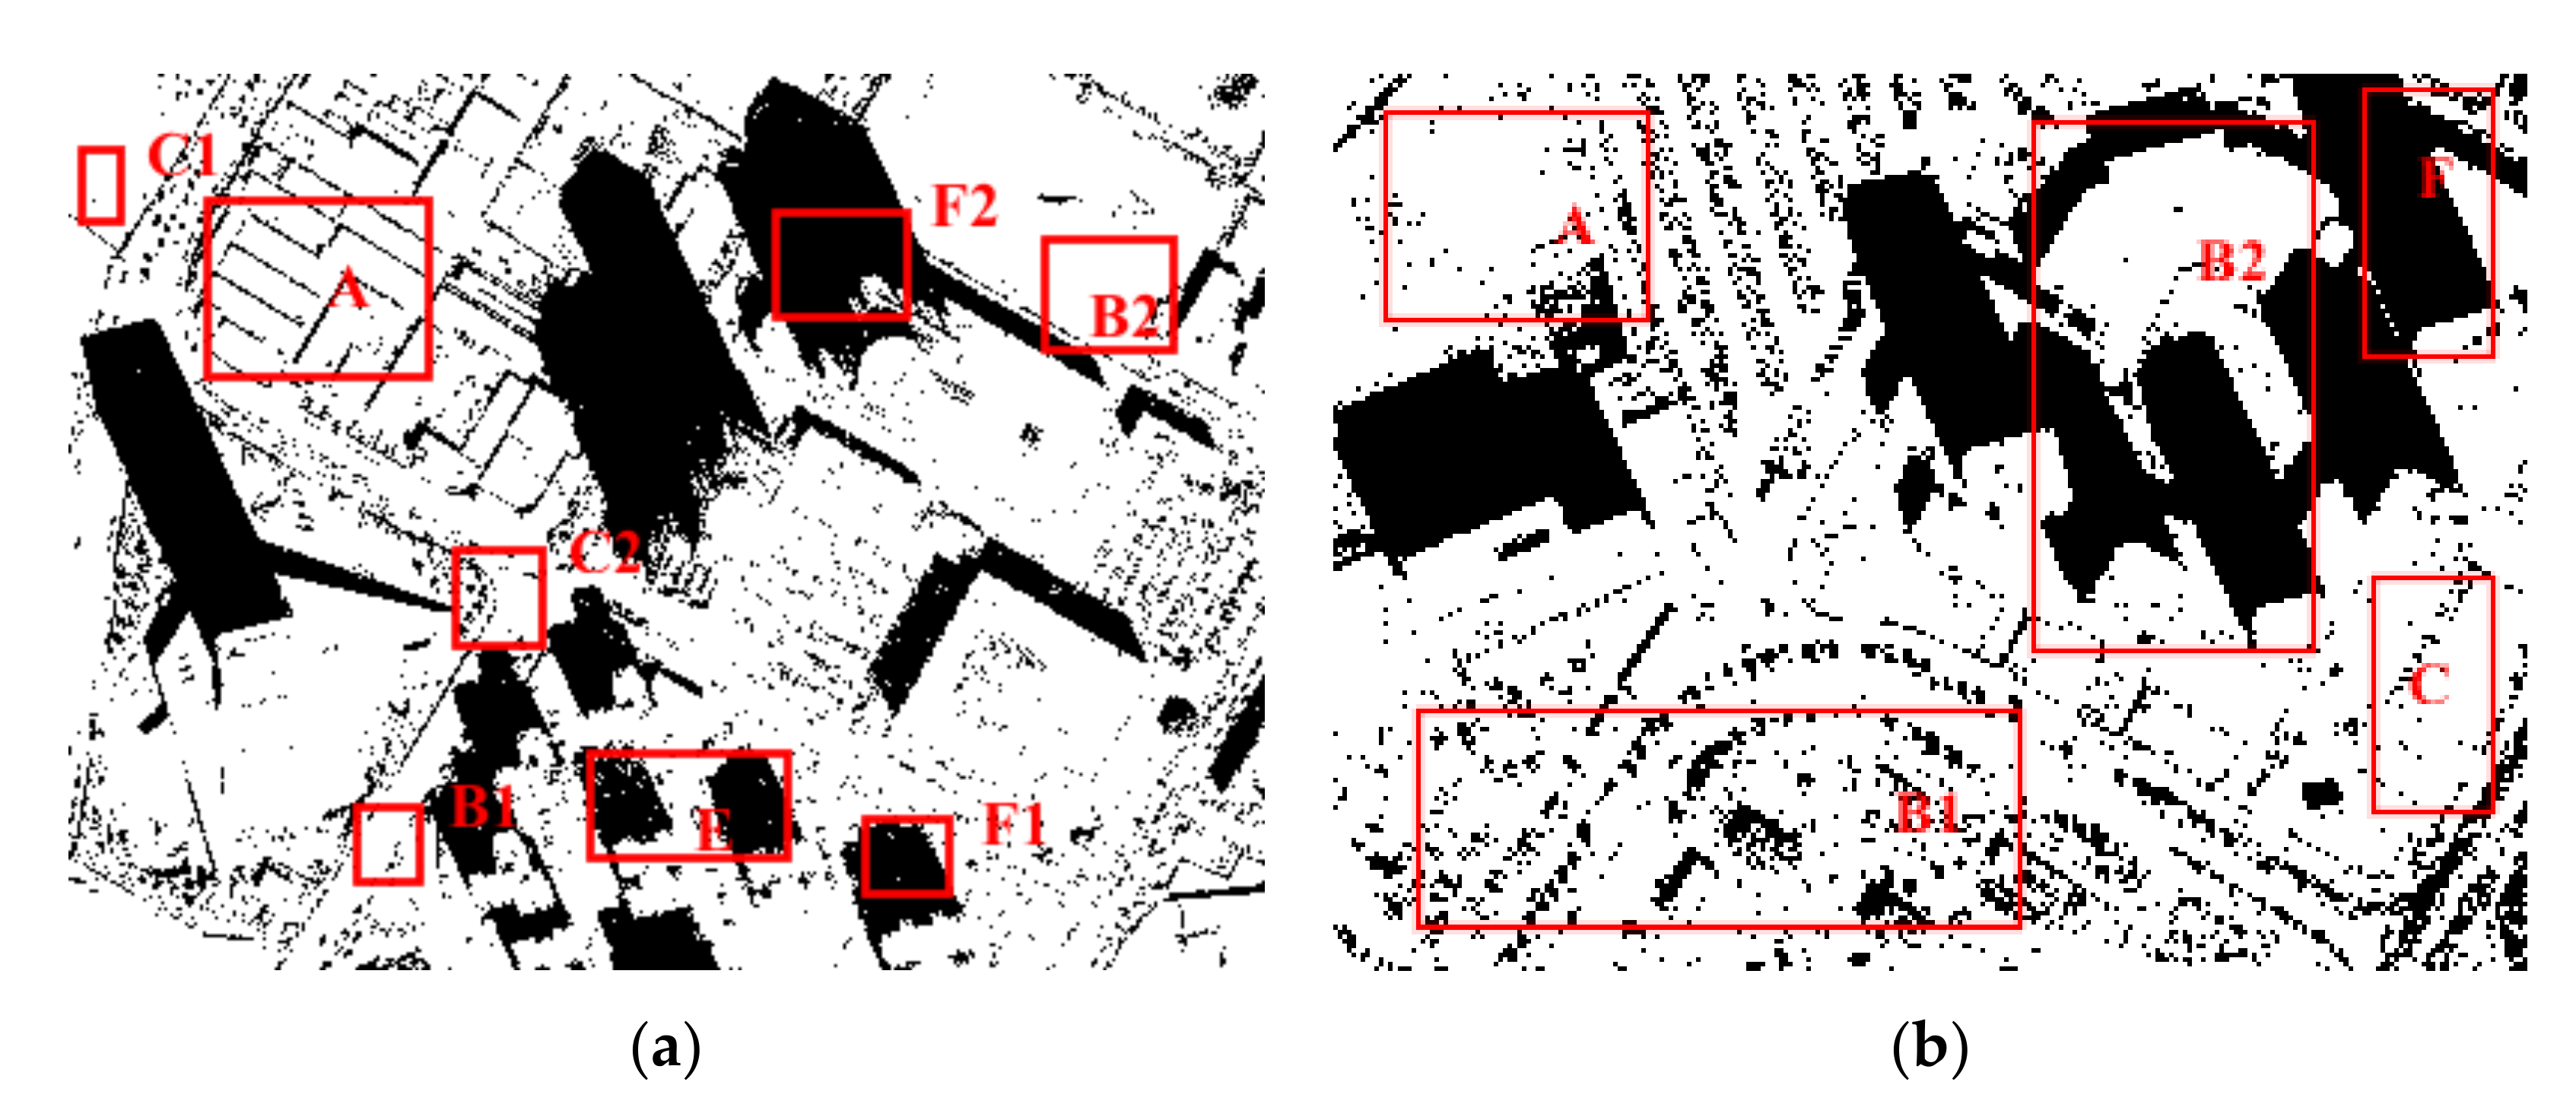
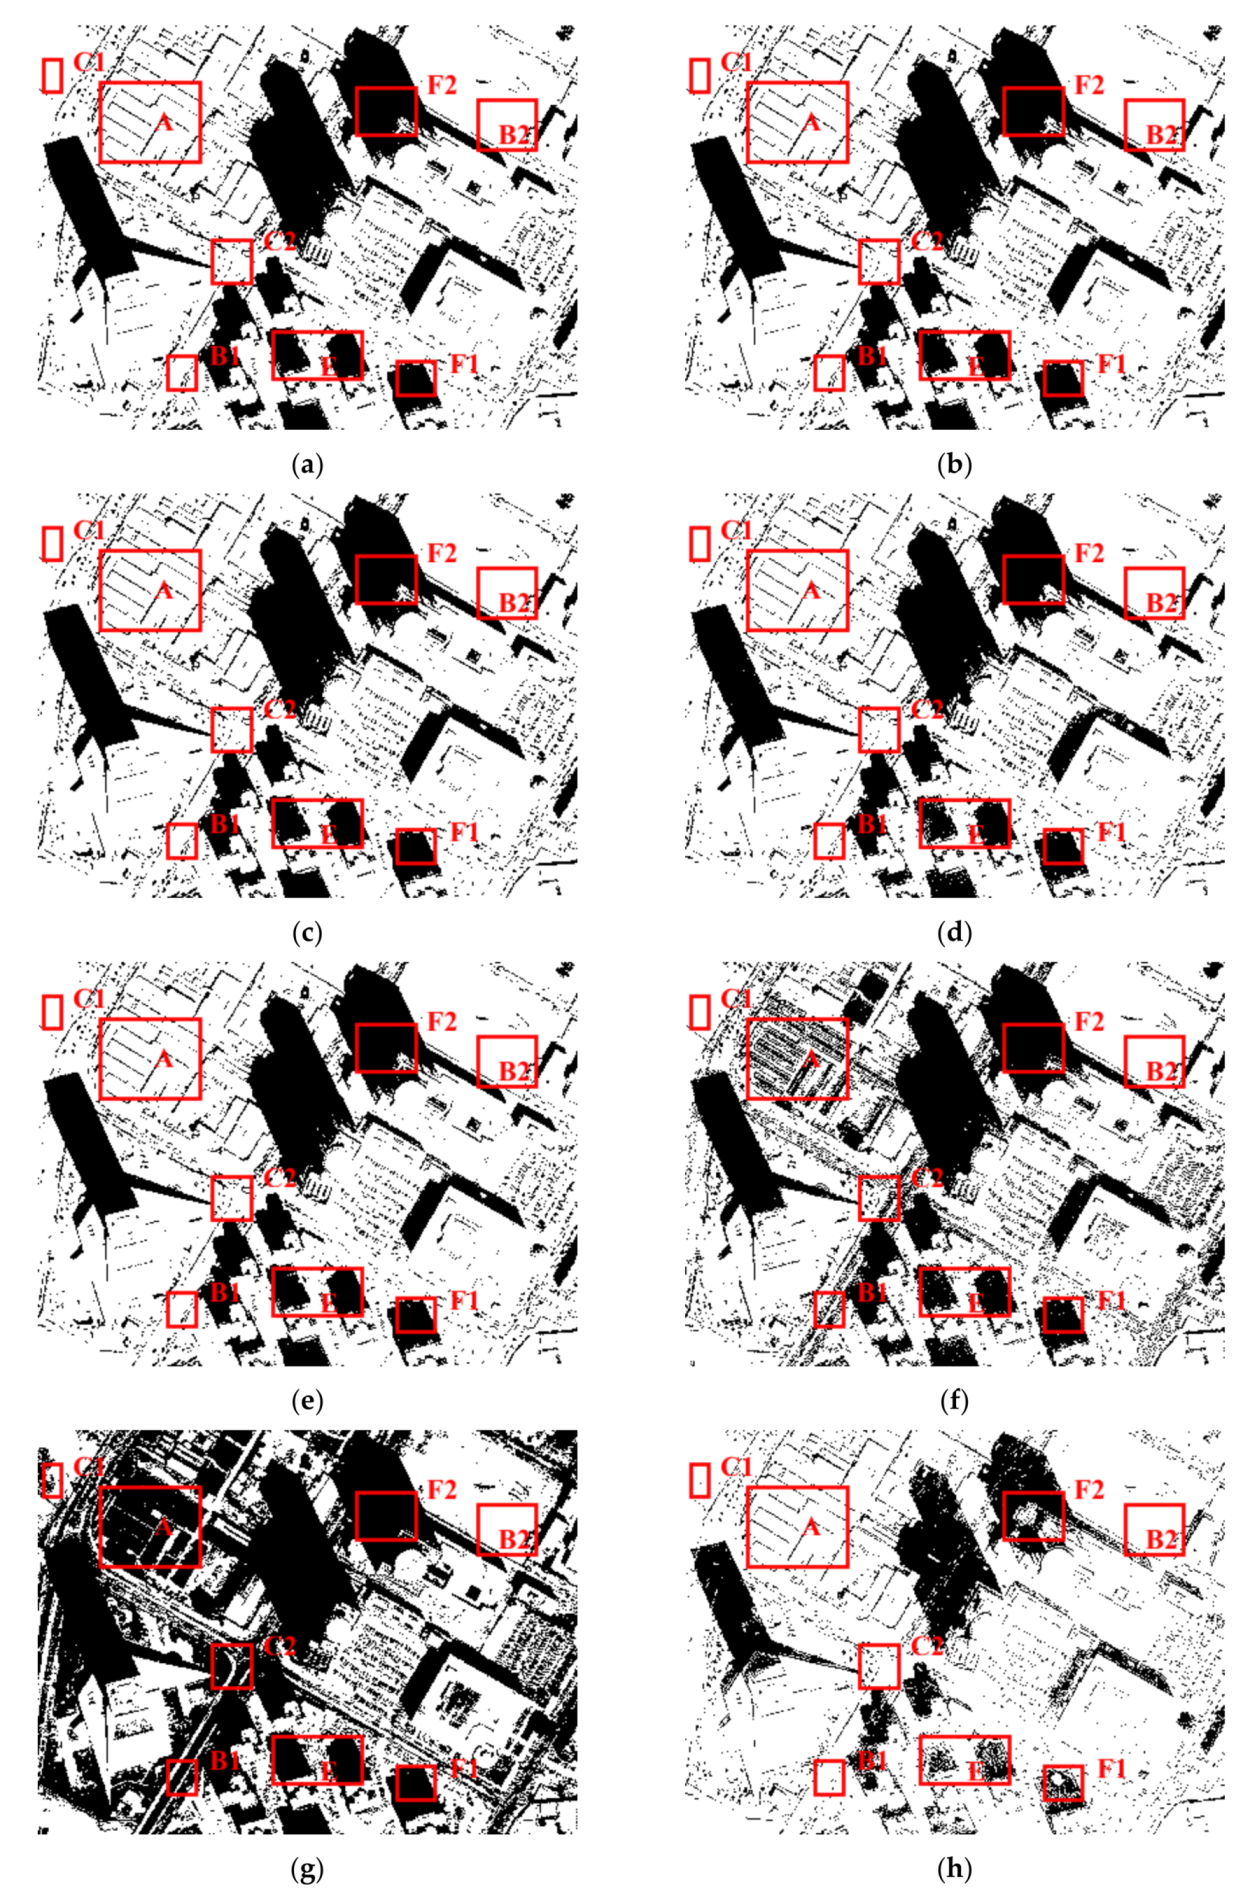
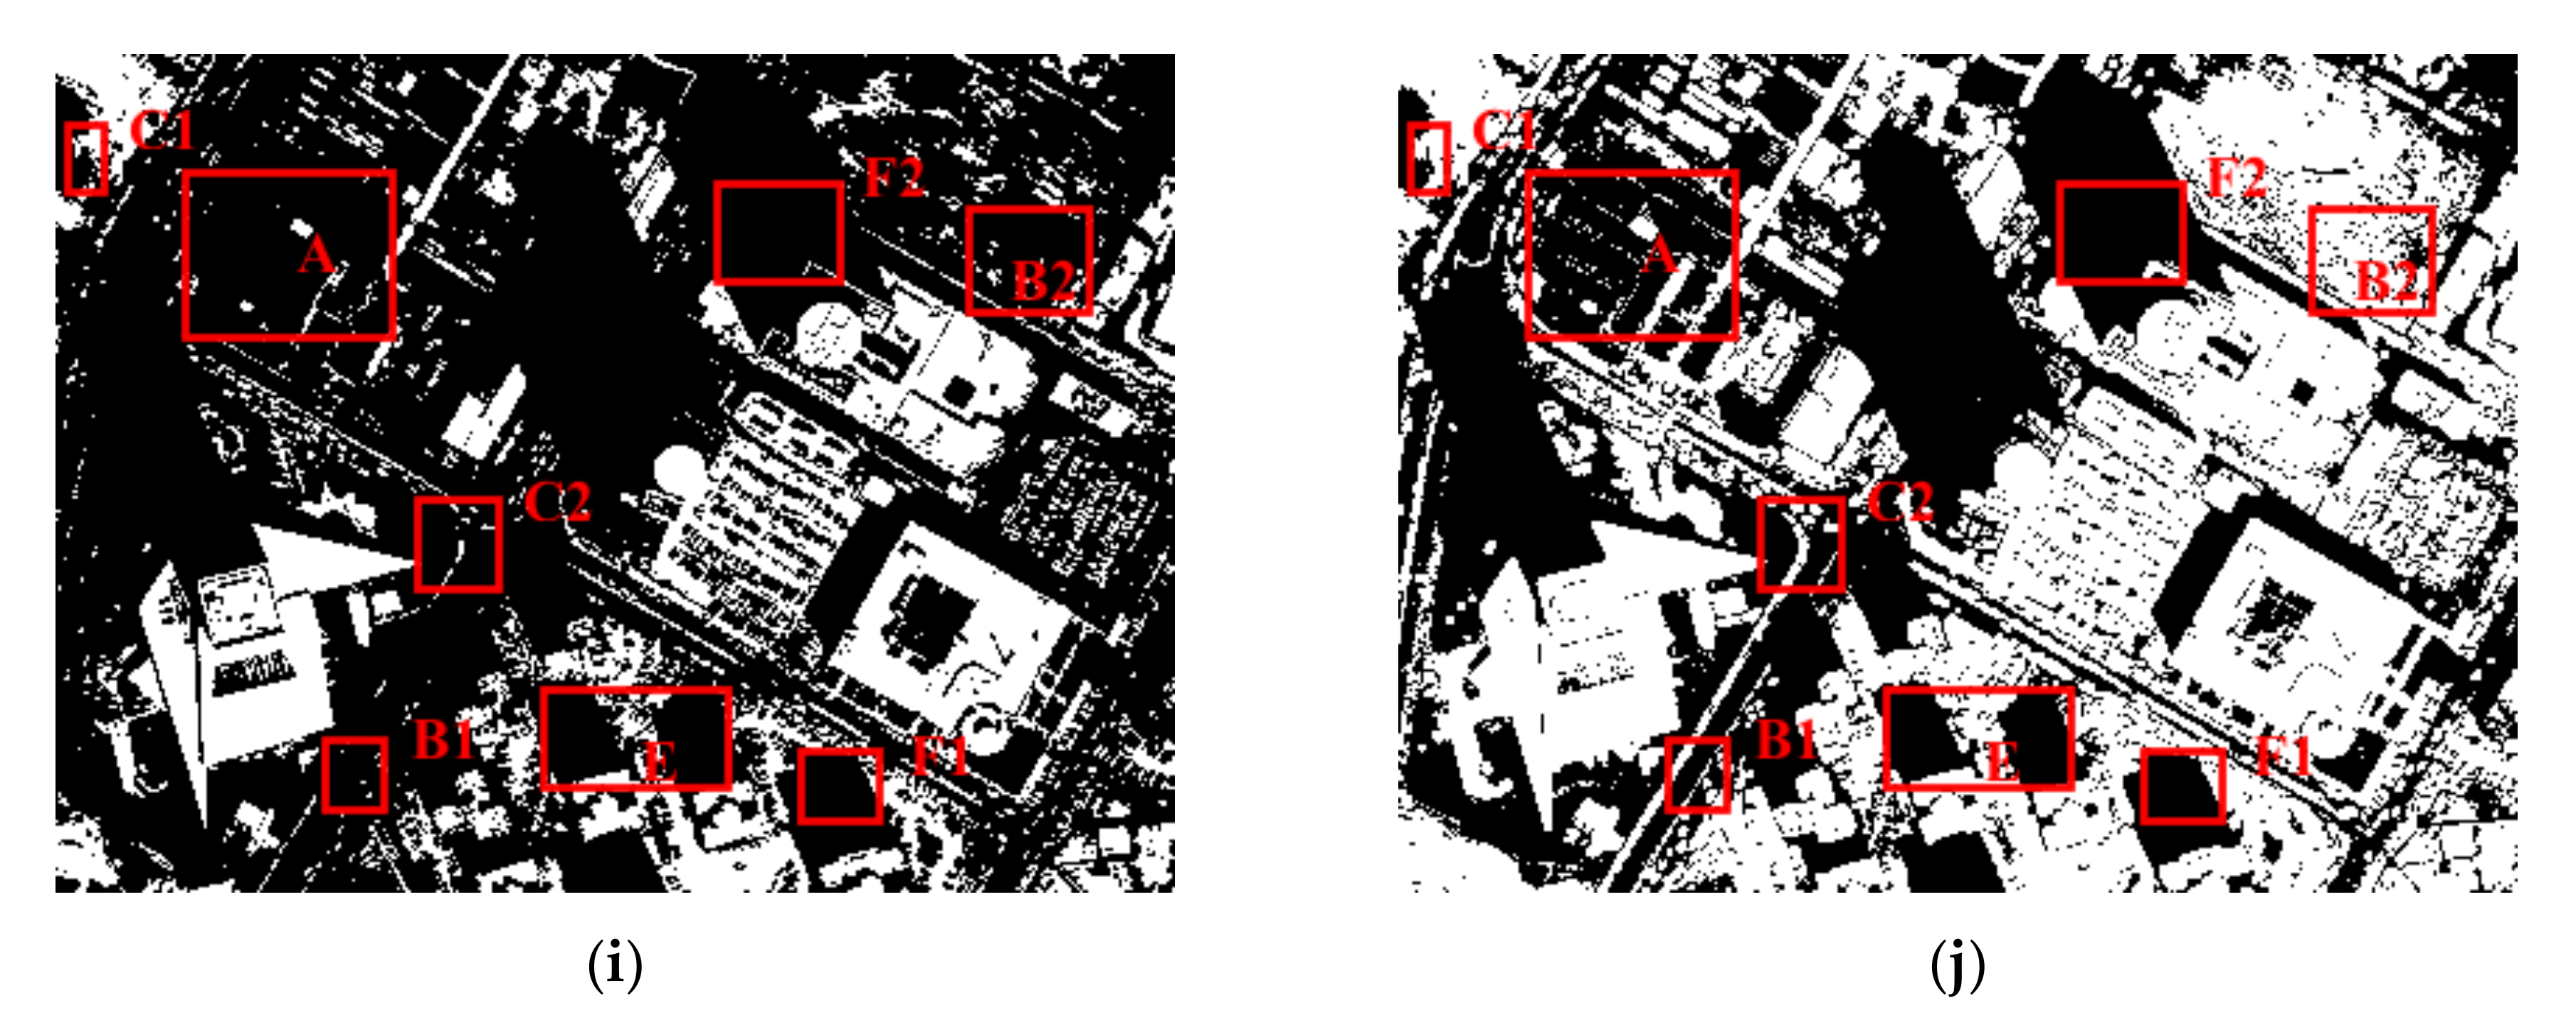
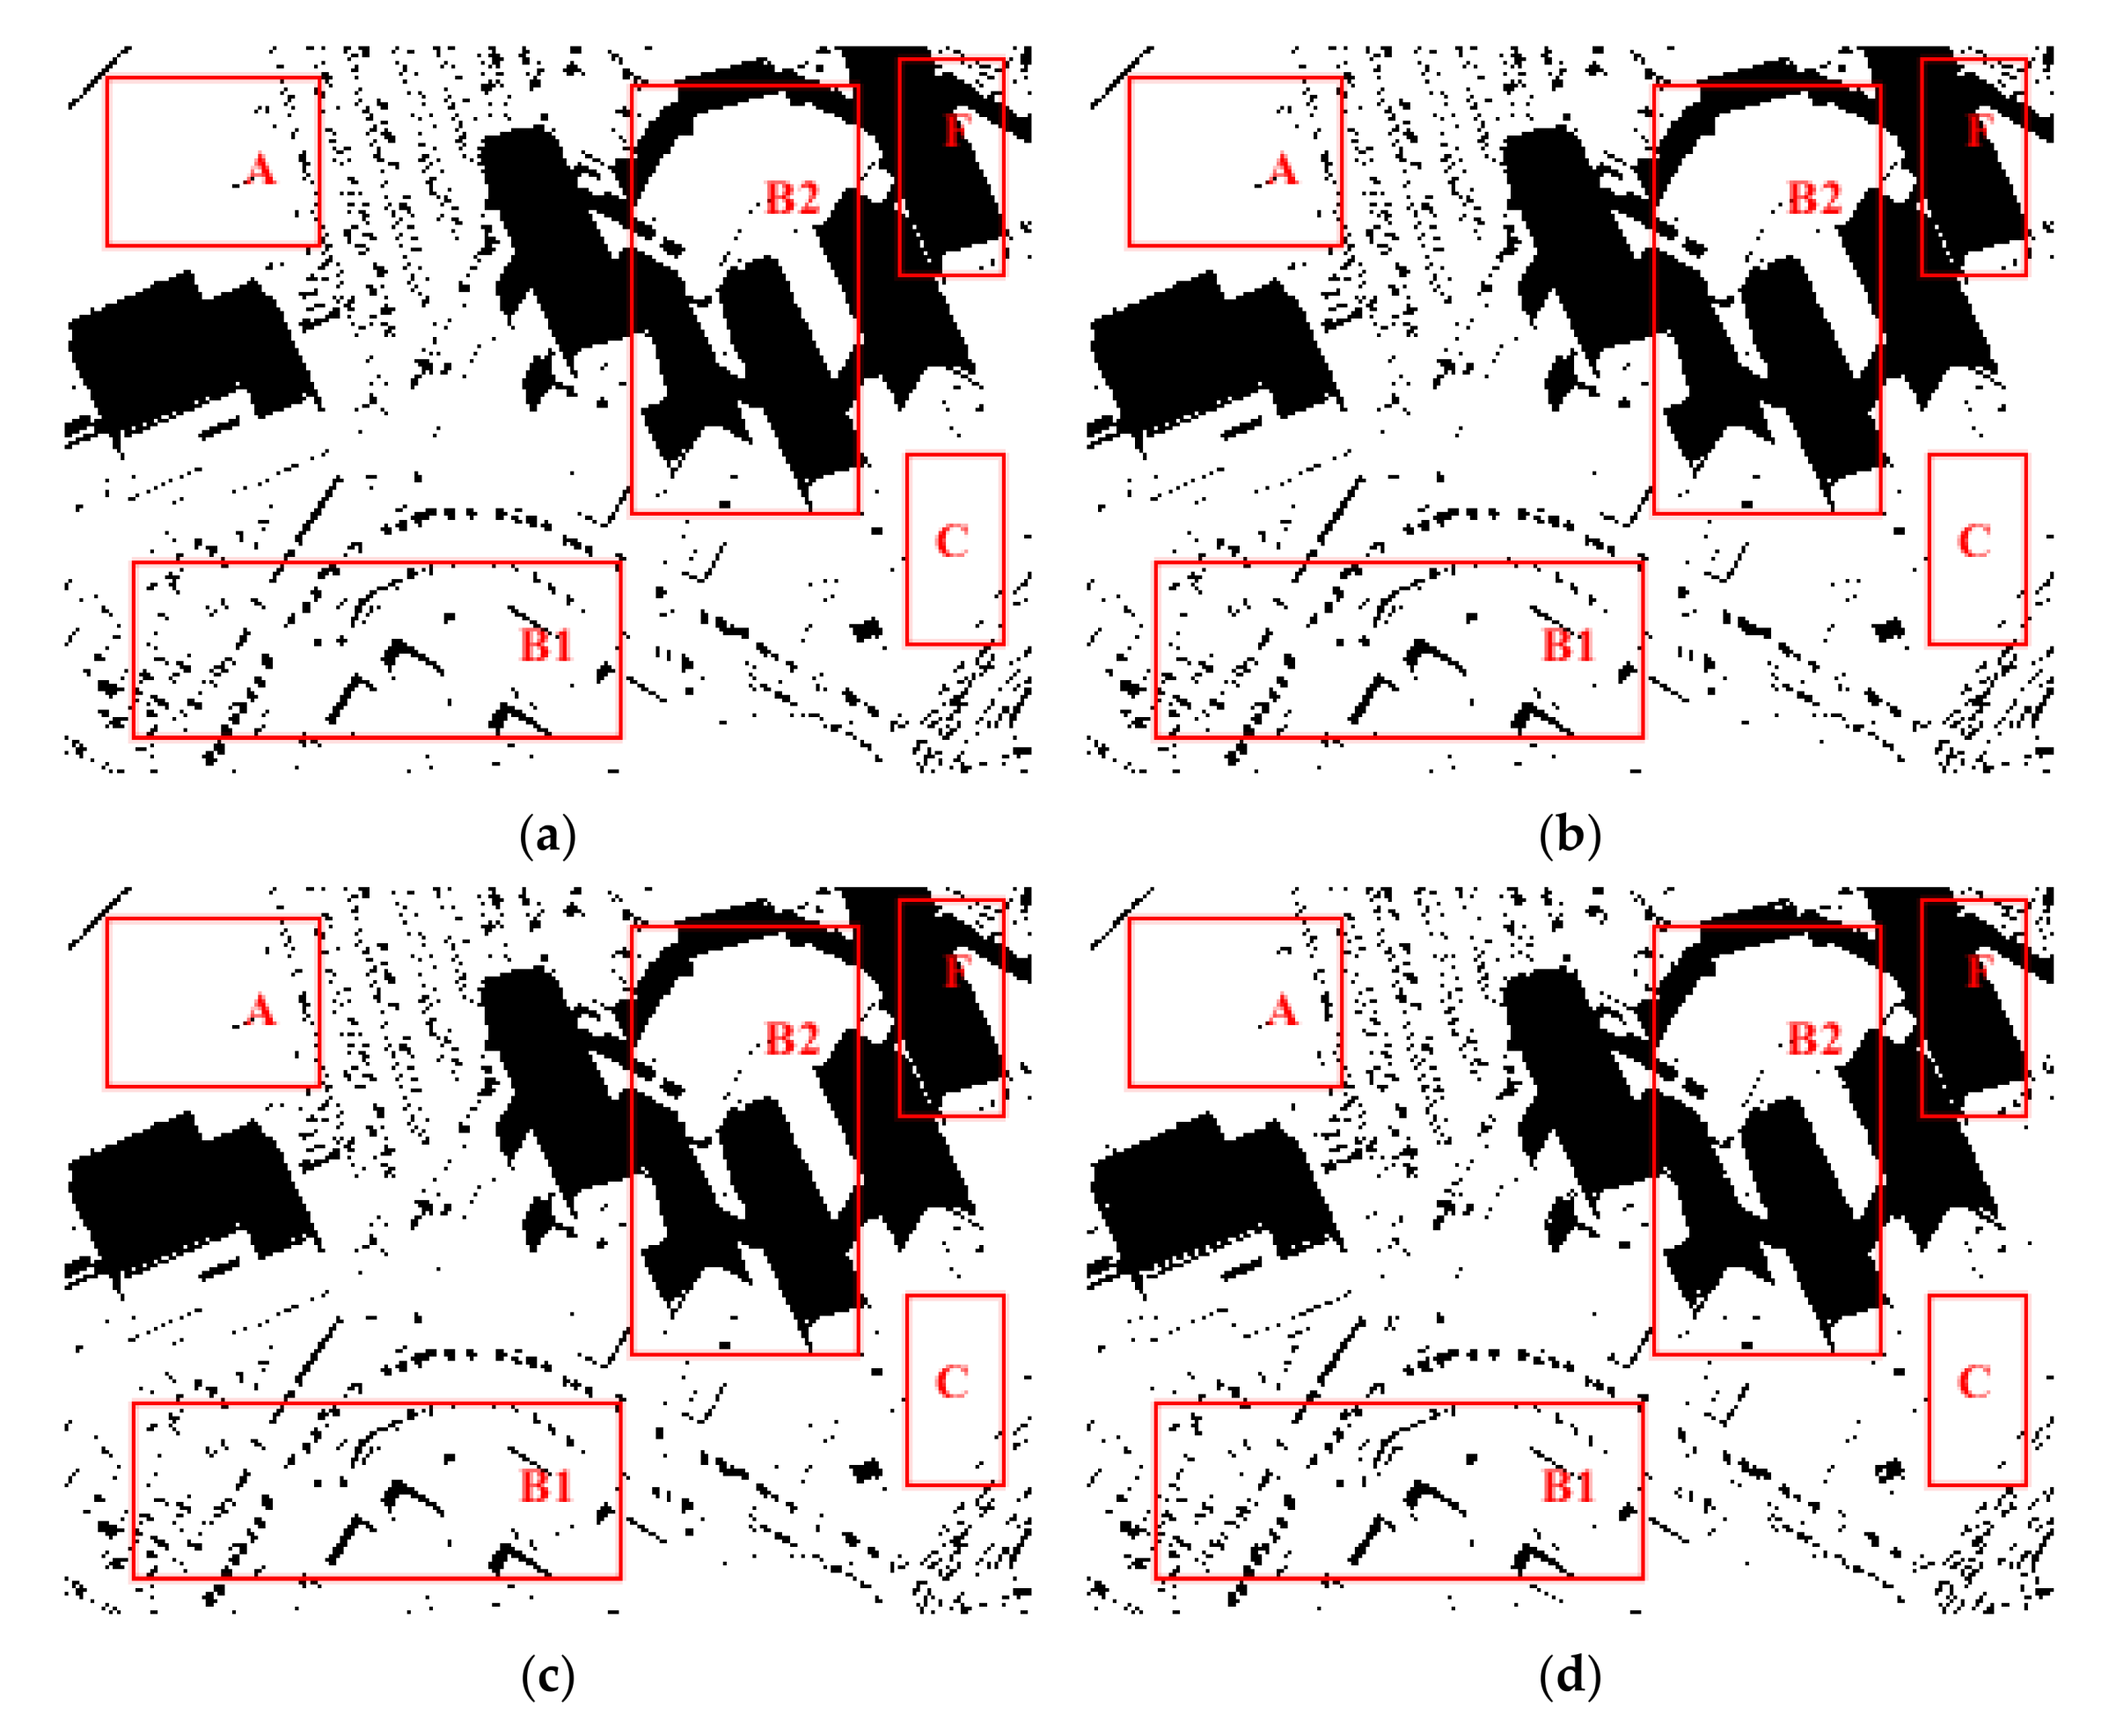
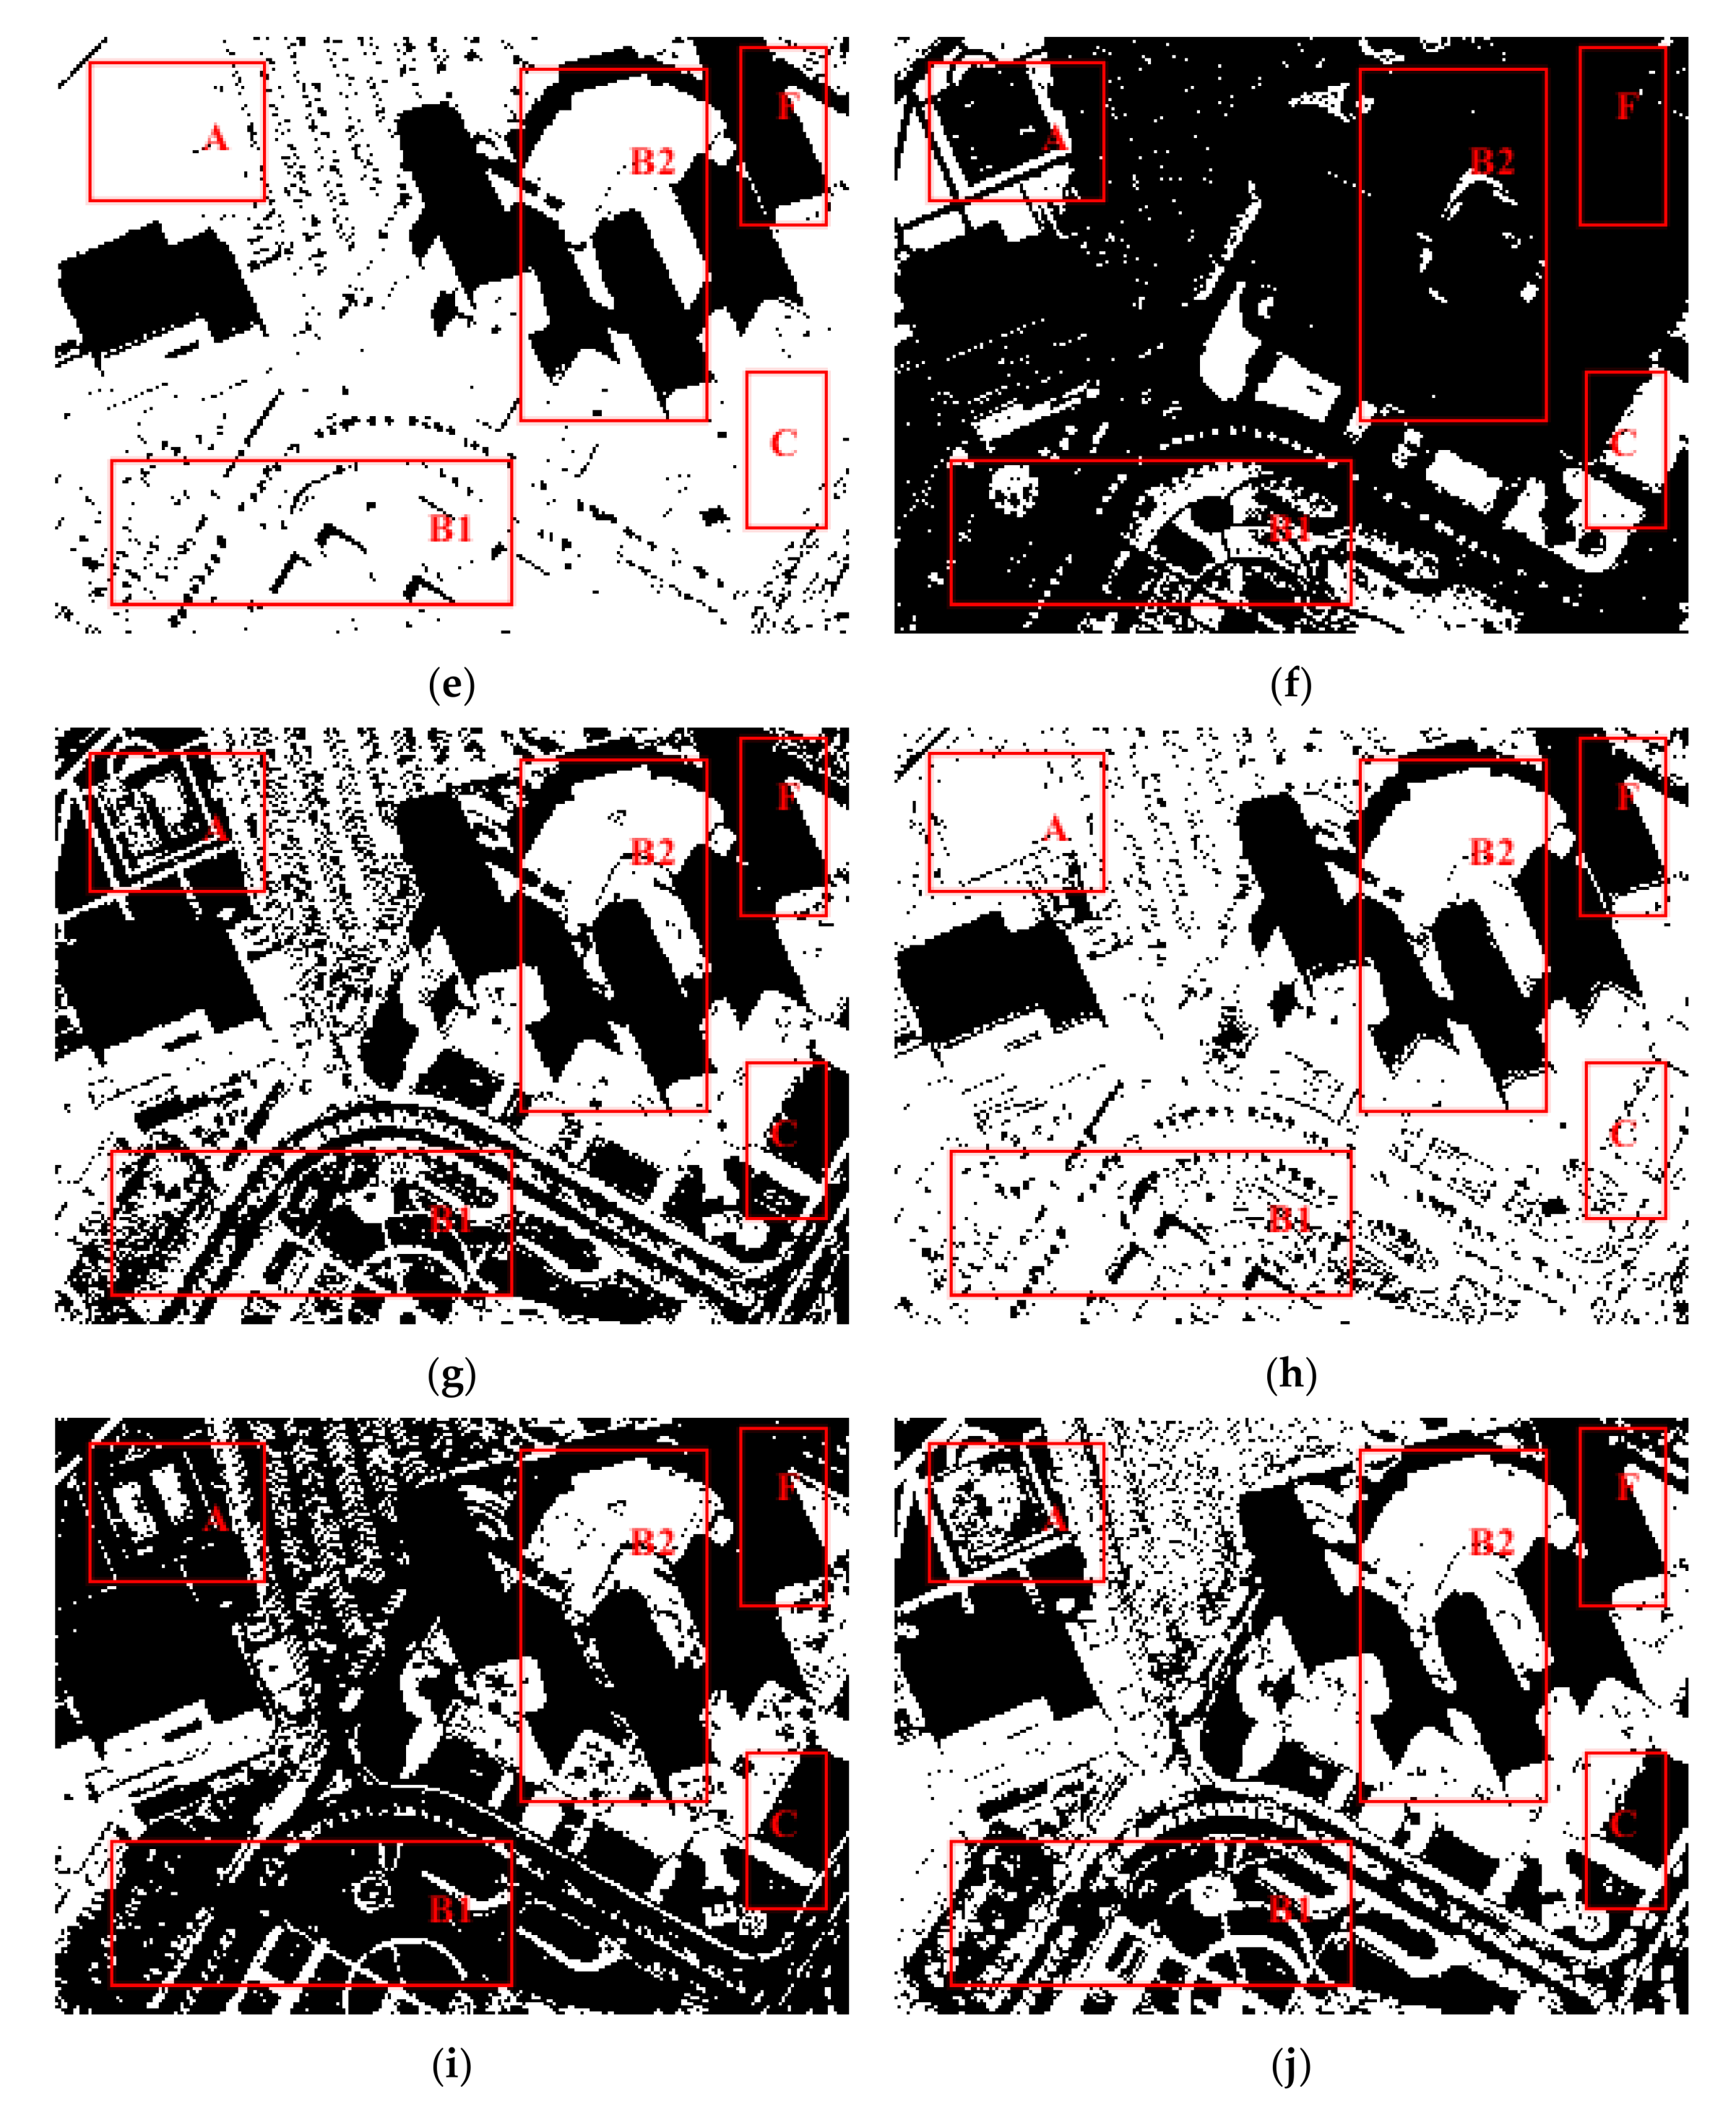
3.2. Qualitative Visual Sense Comparison
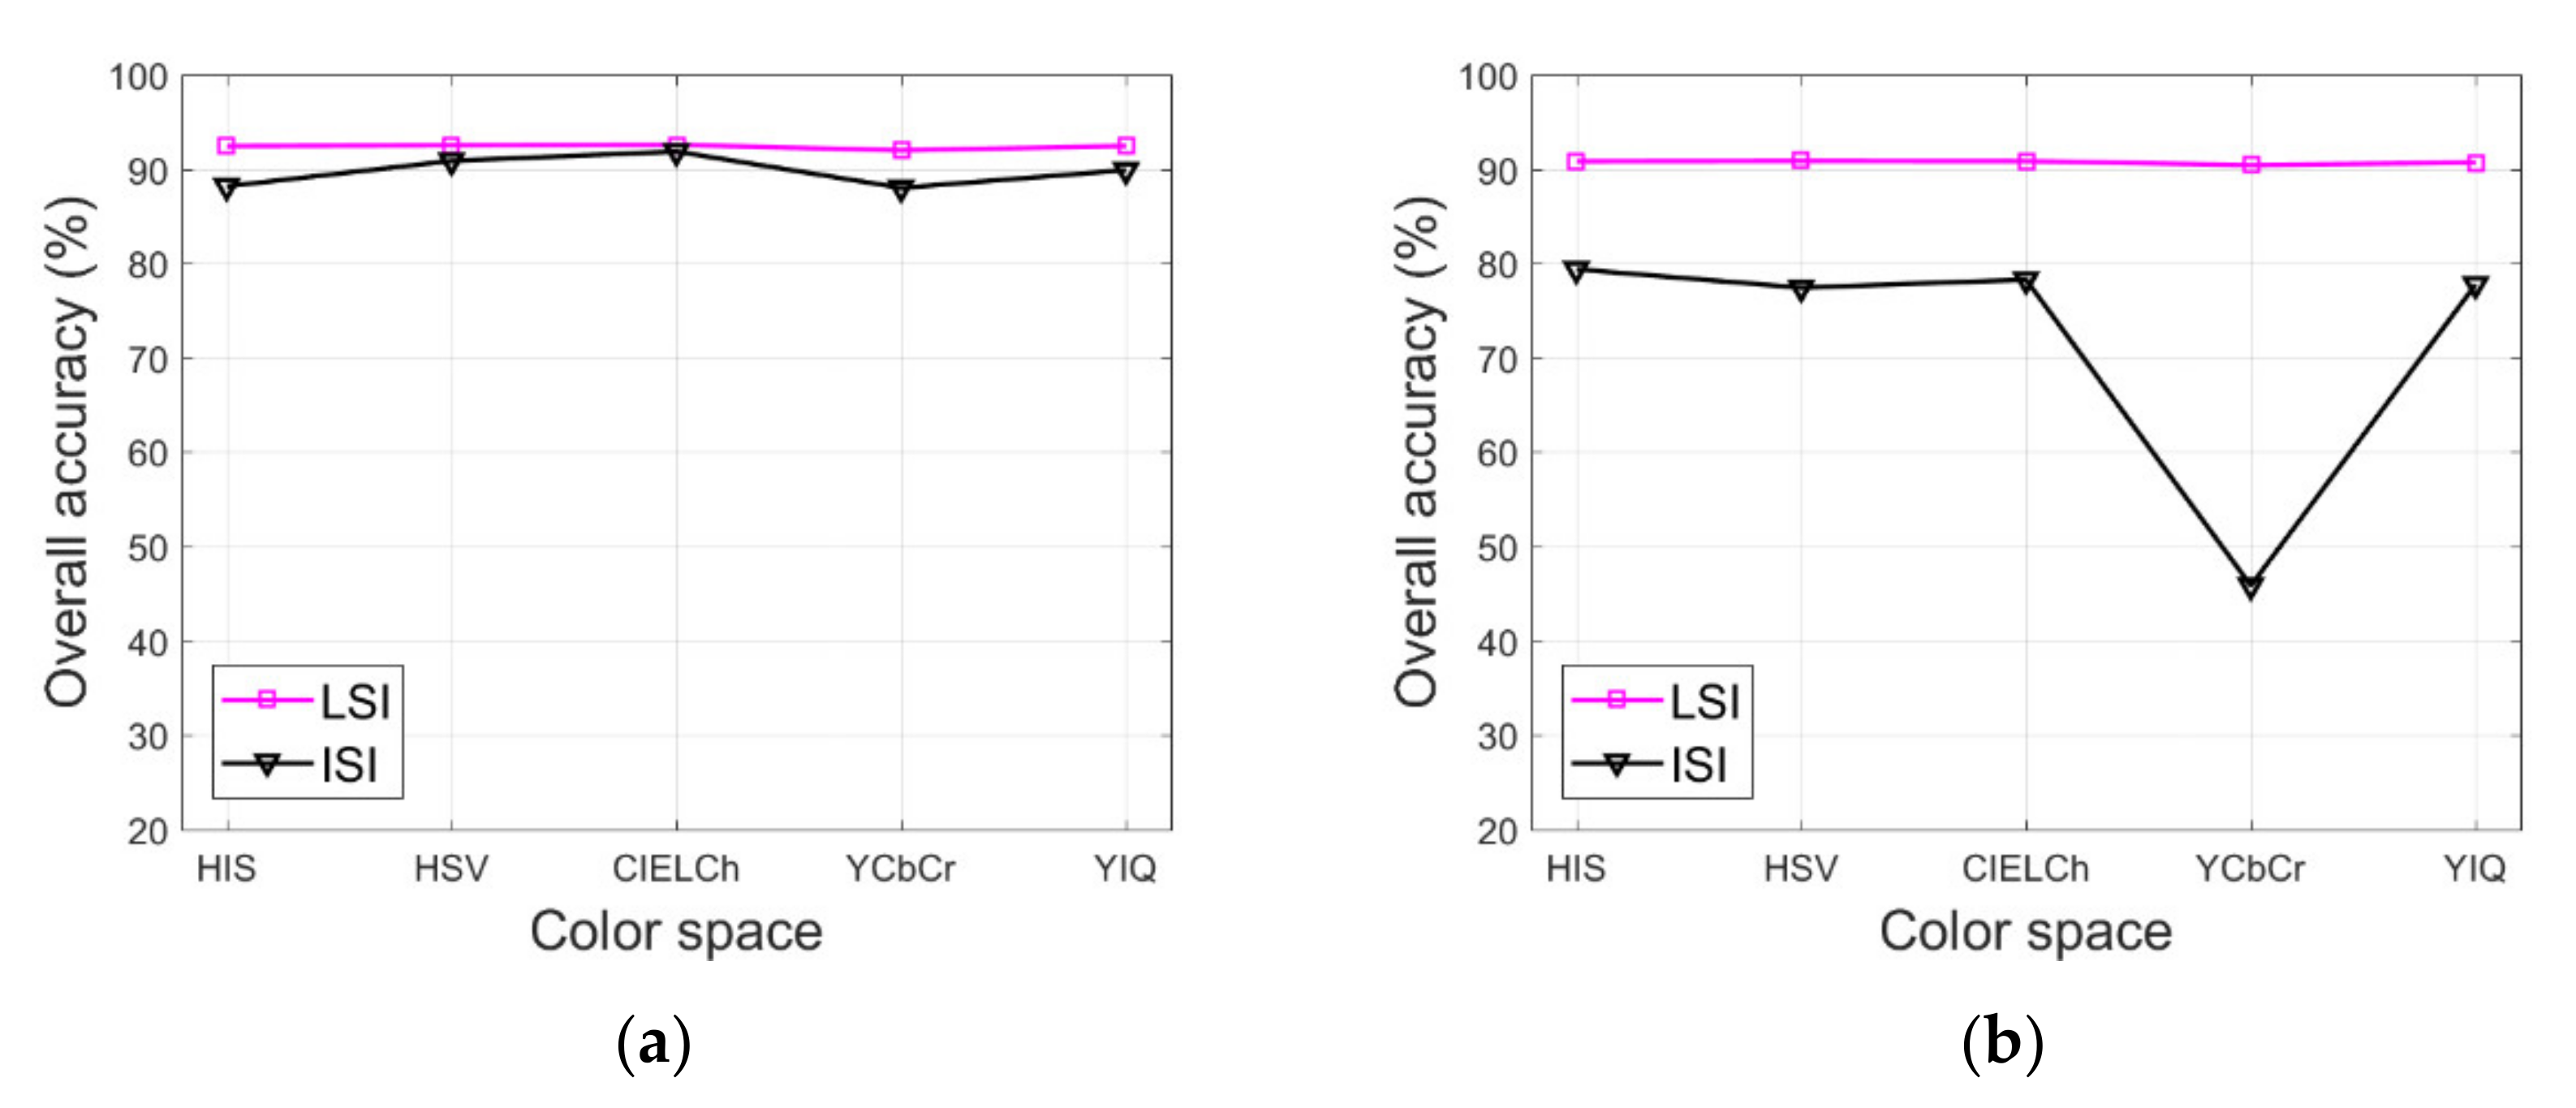
3.3. Quantitative Evaluation
4. Discussion
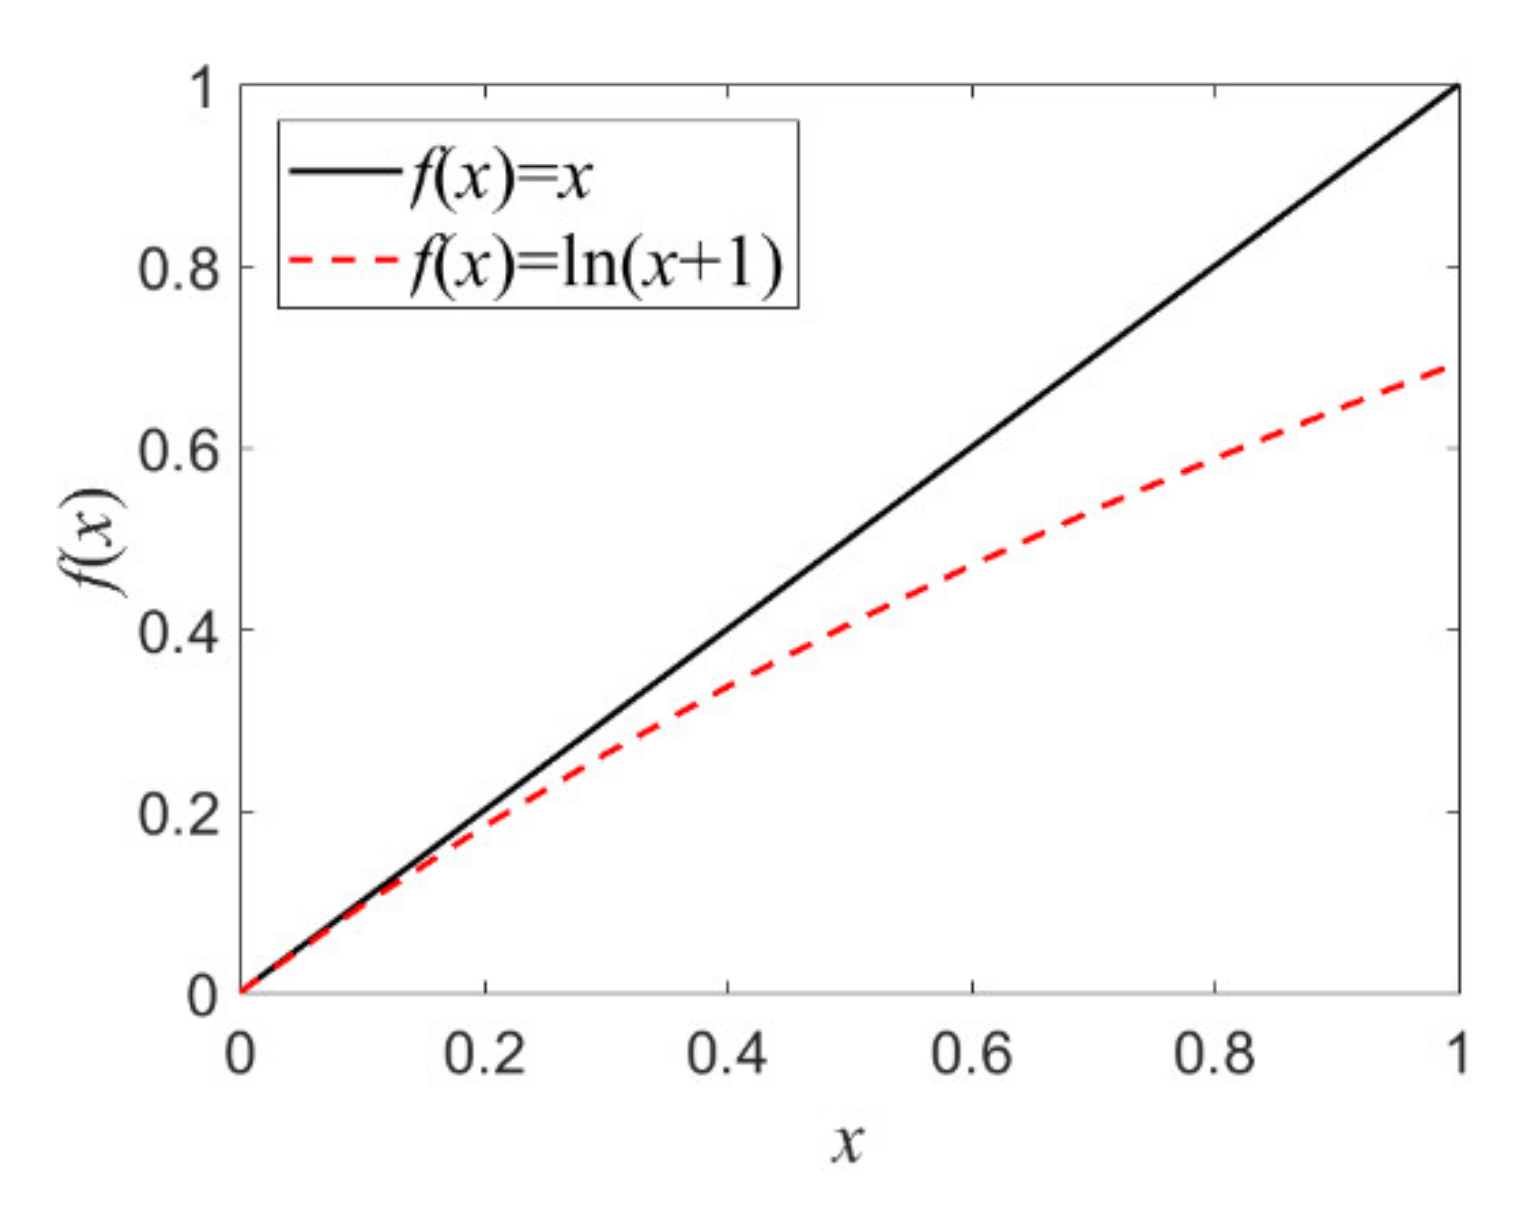
4.1. Influence Analysis of the Logarithmic Operation
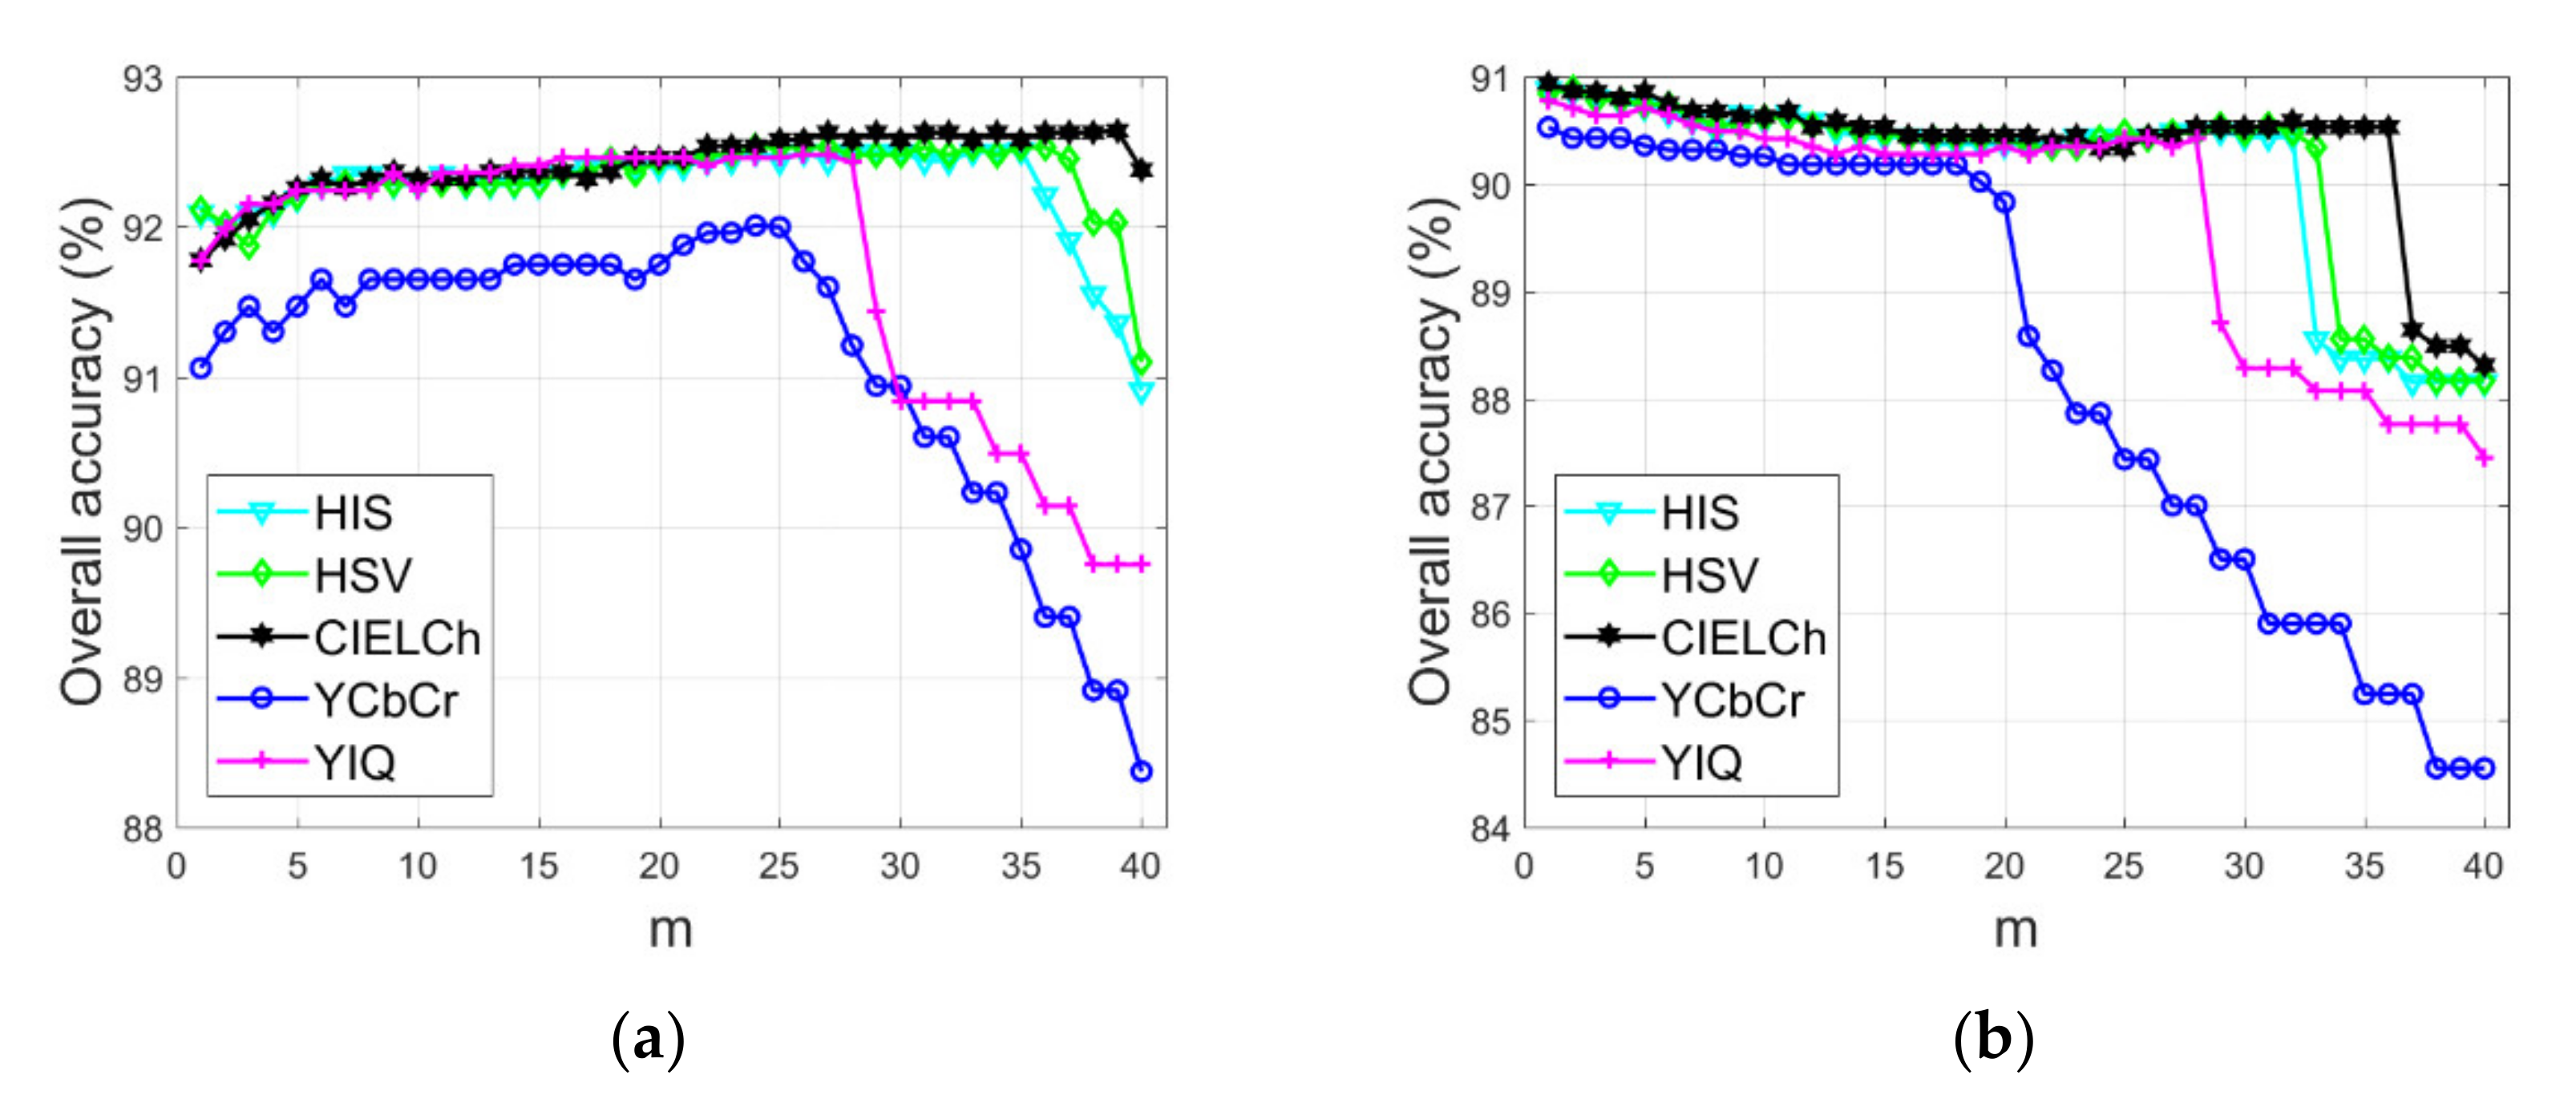
4.2. Sensitivity Analysis of the Neighborhood Parameter
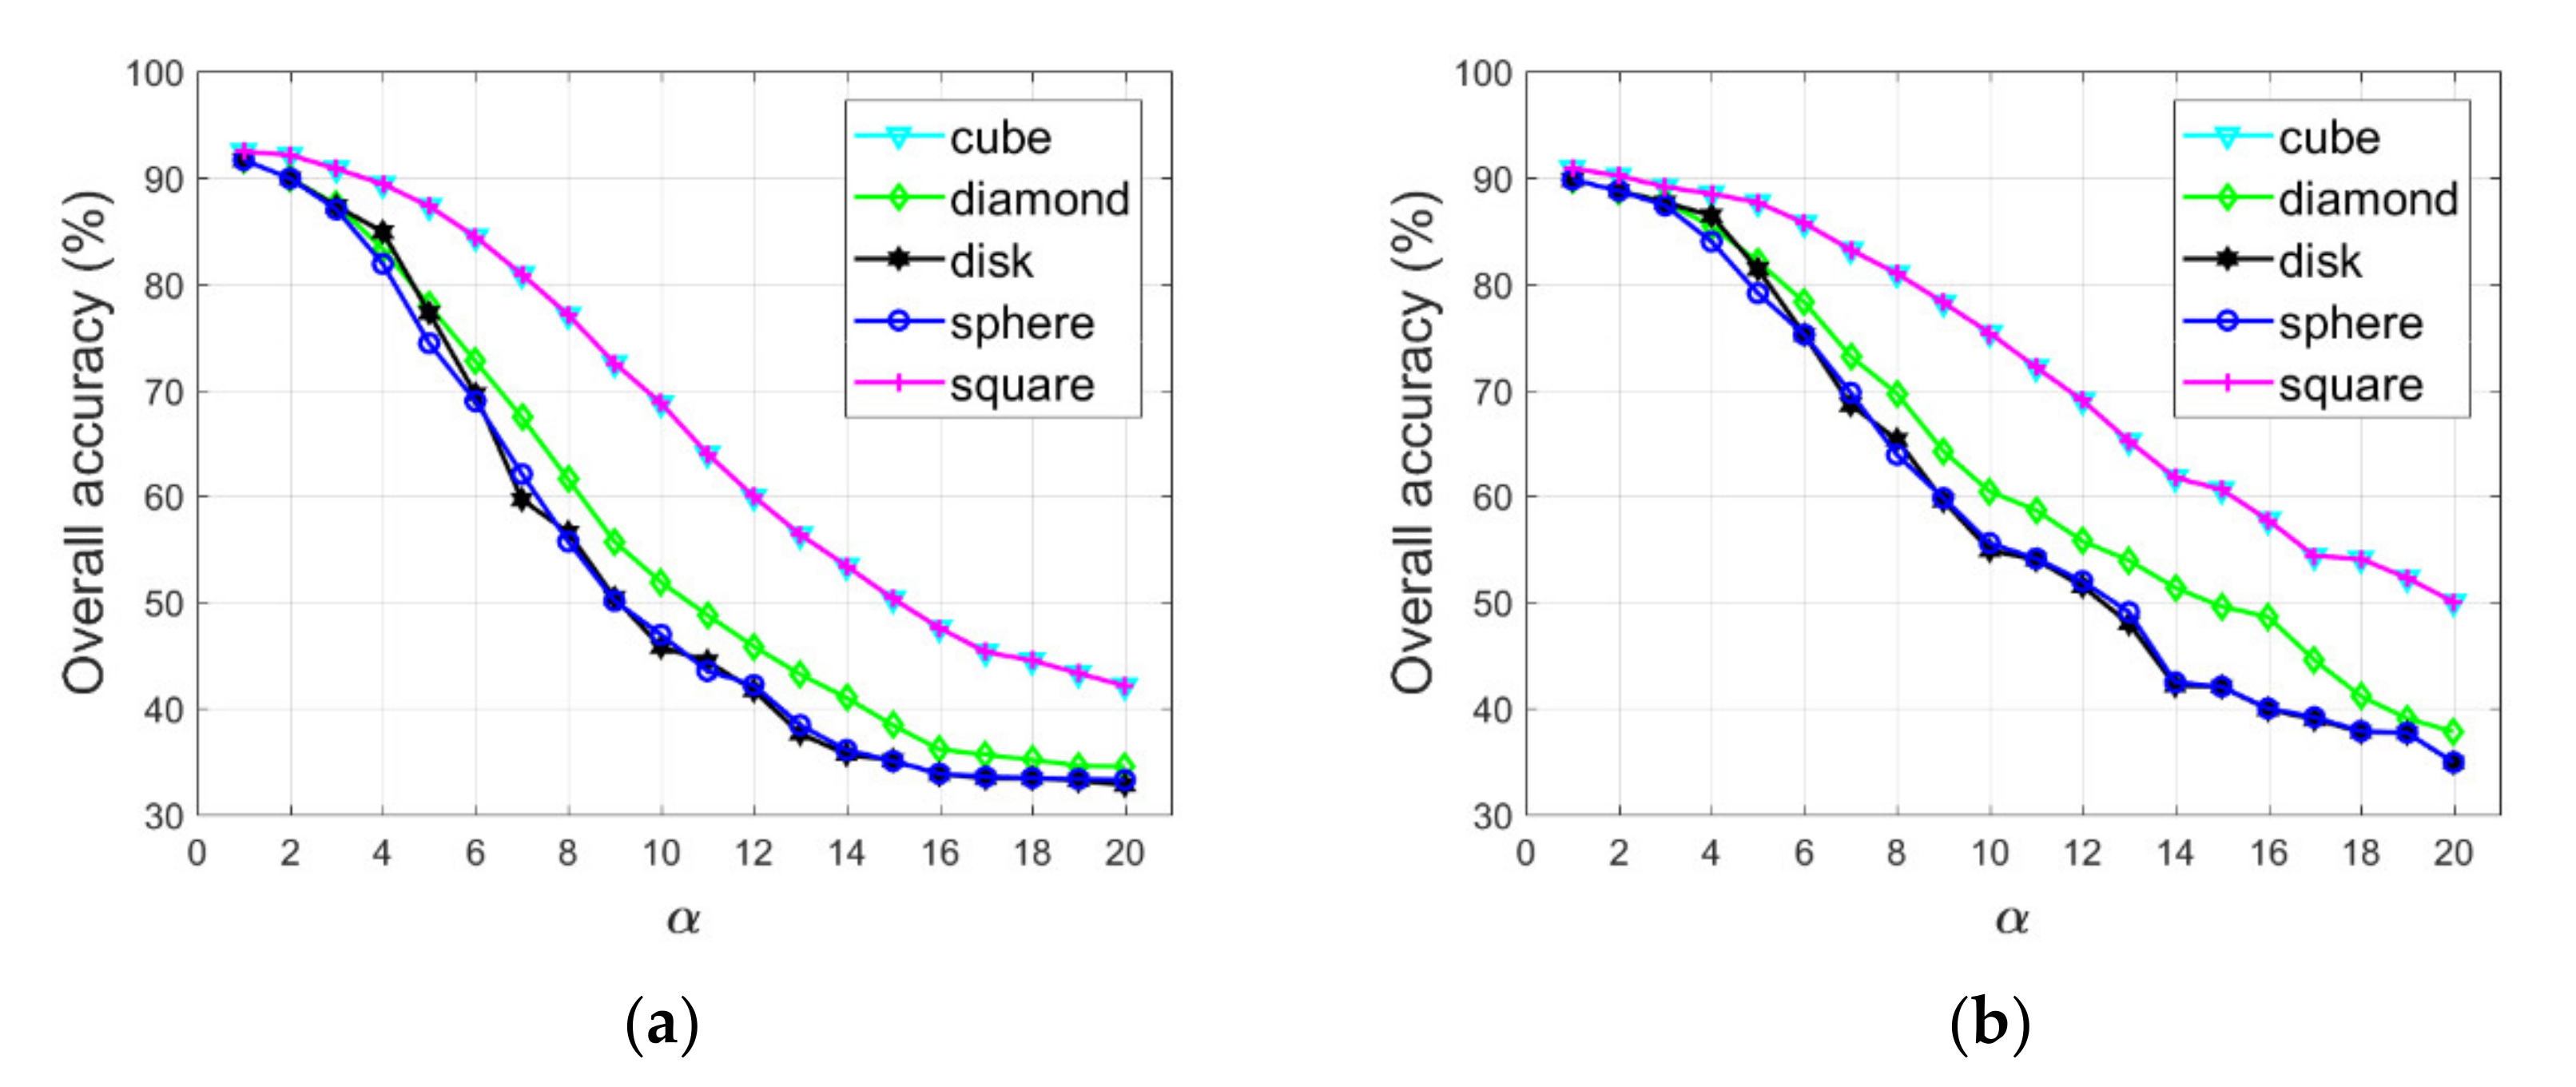
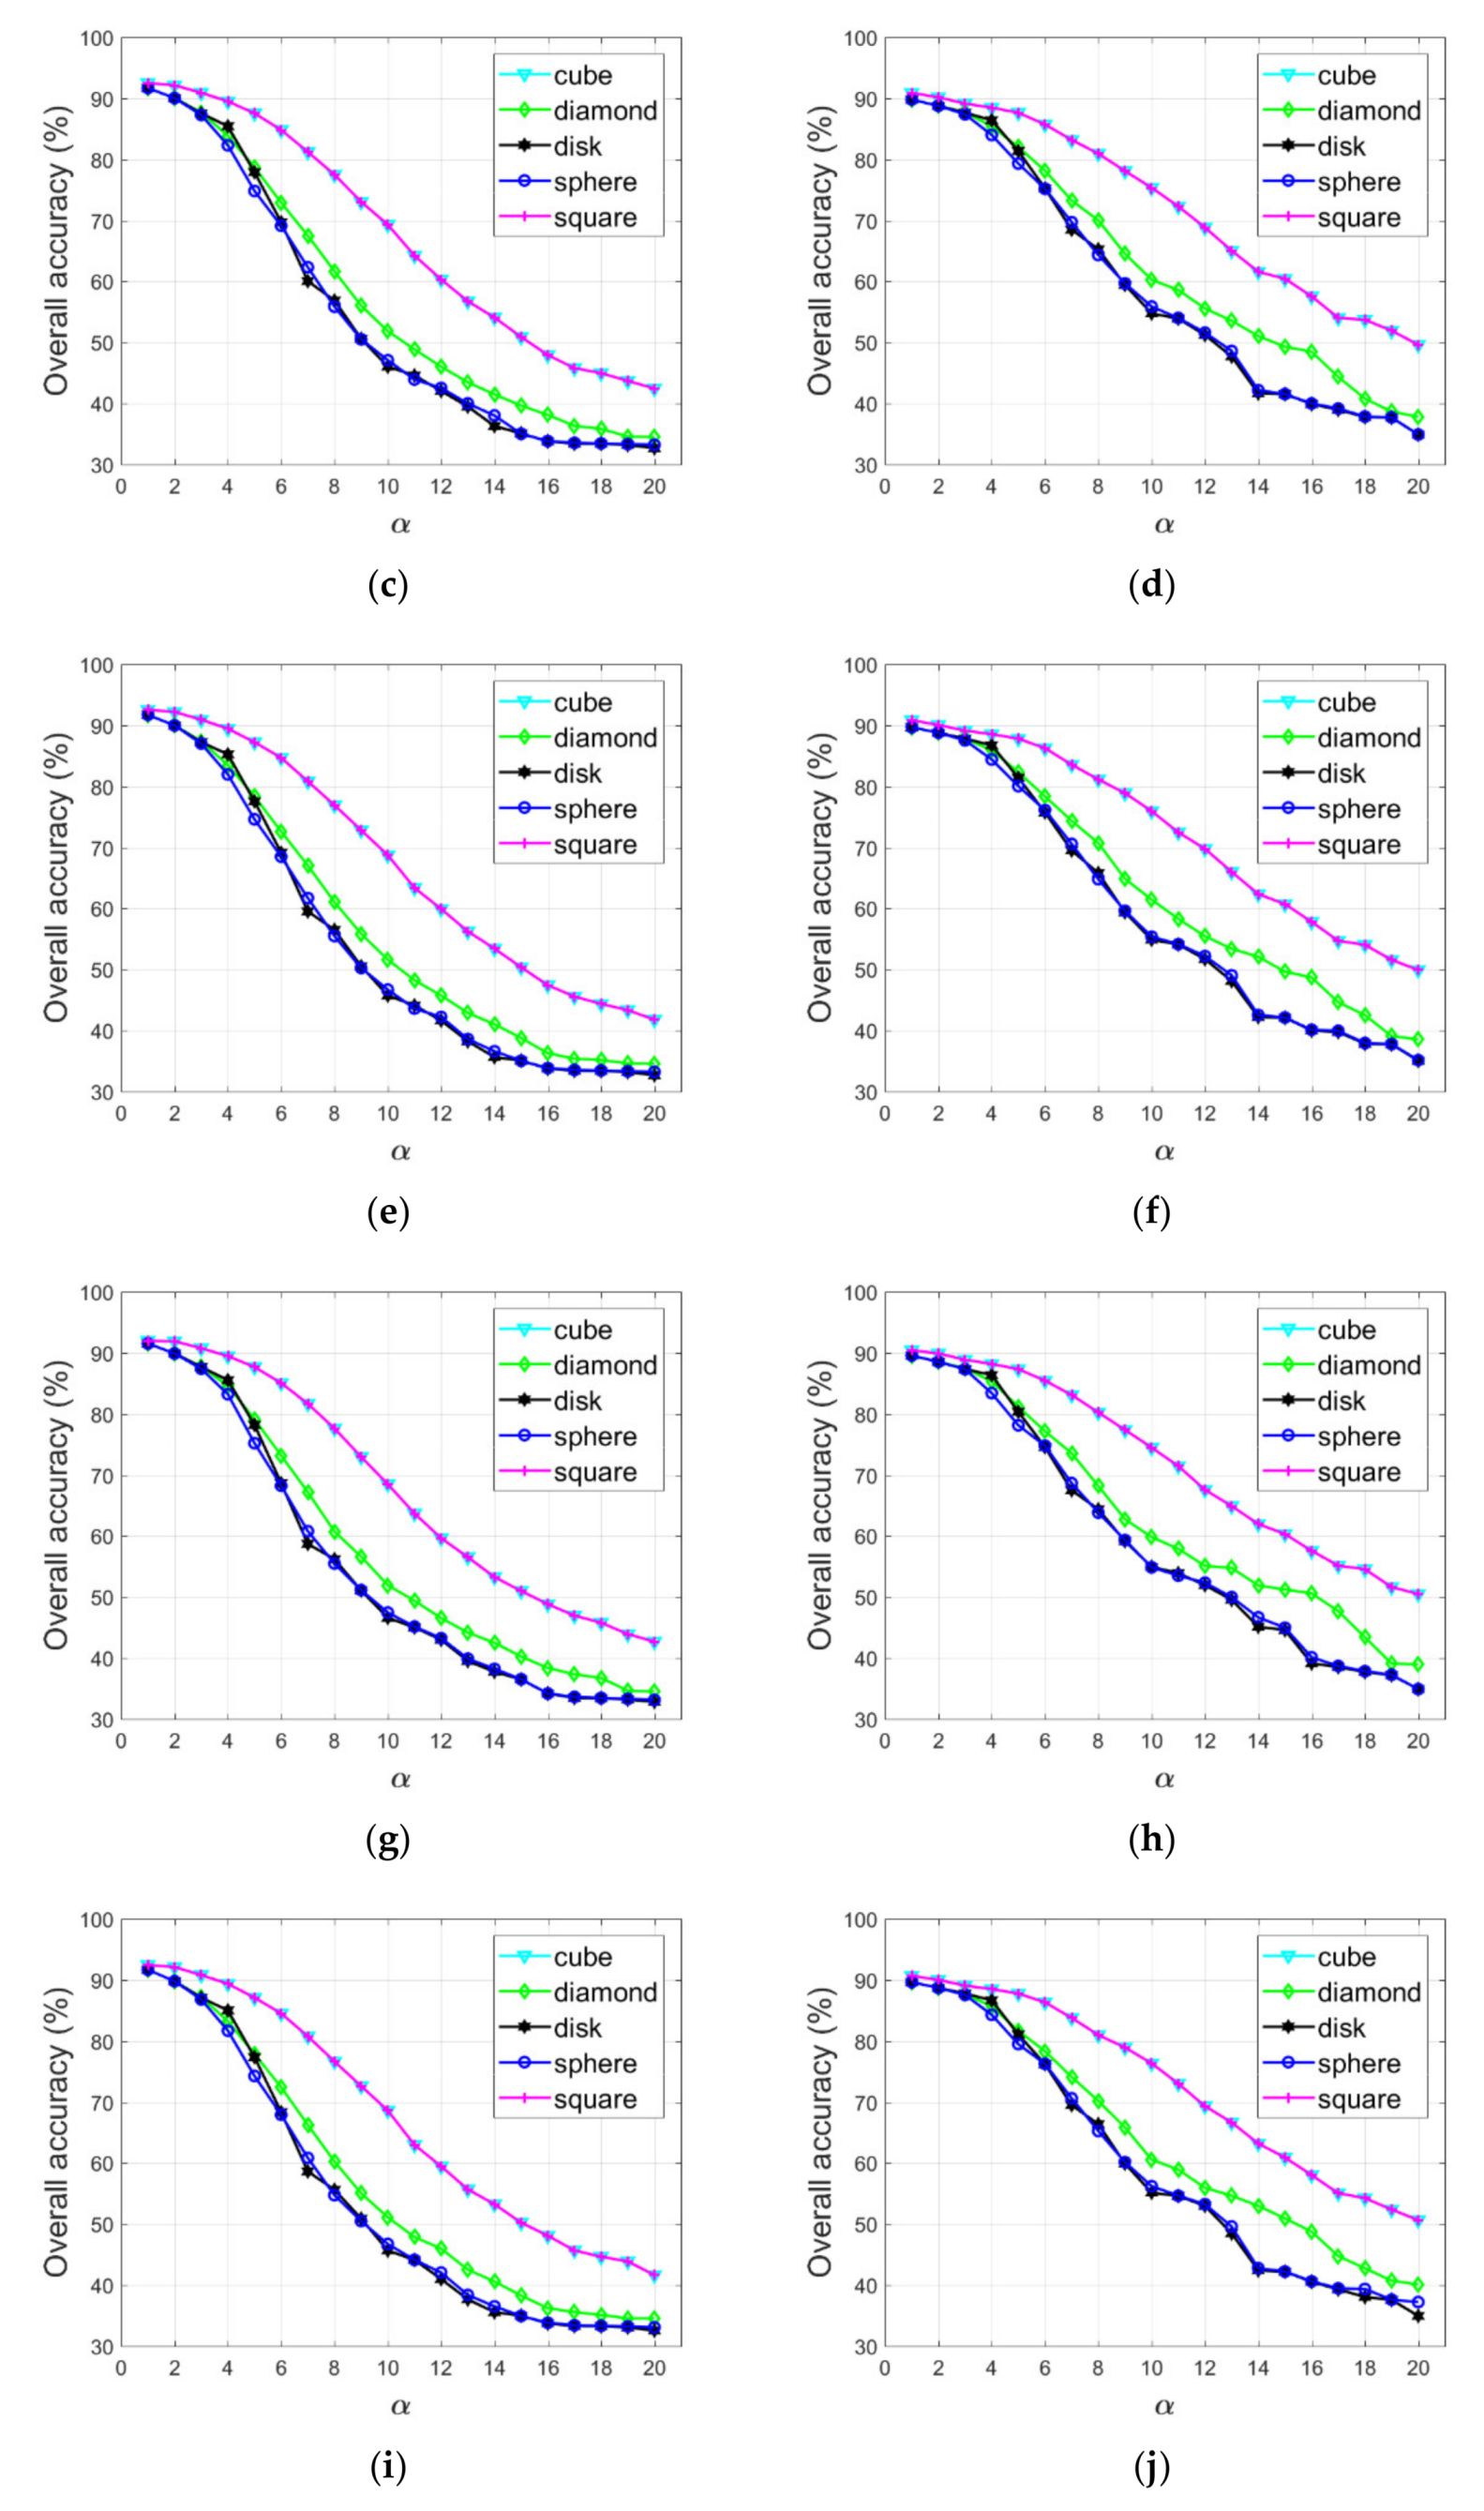
4.3. Sensitivity Analysis of the Morphological Operation
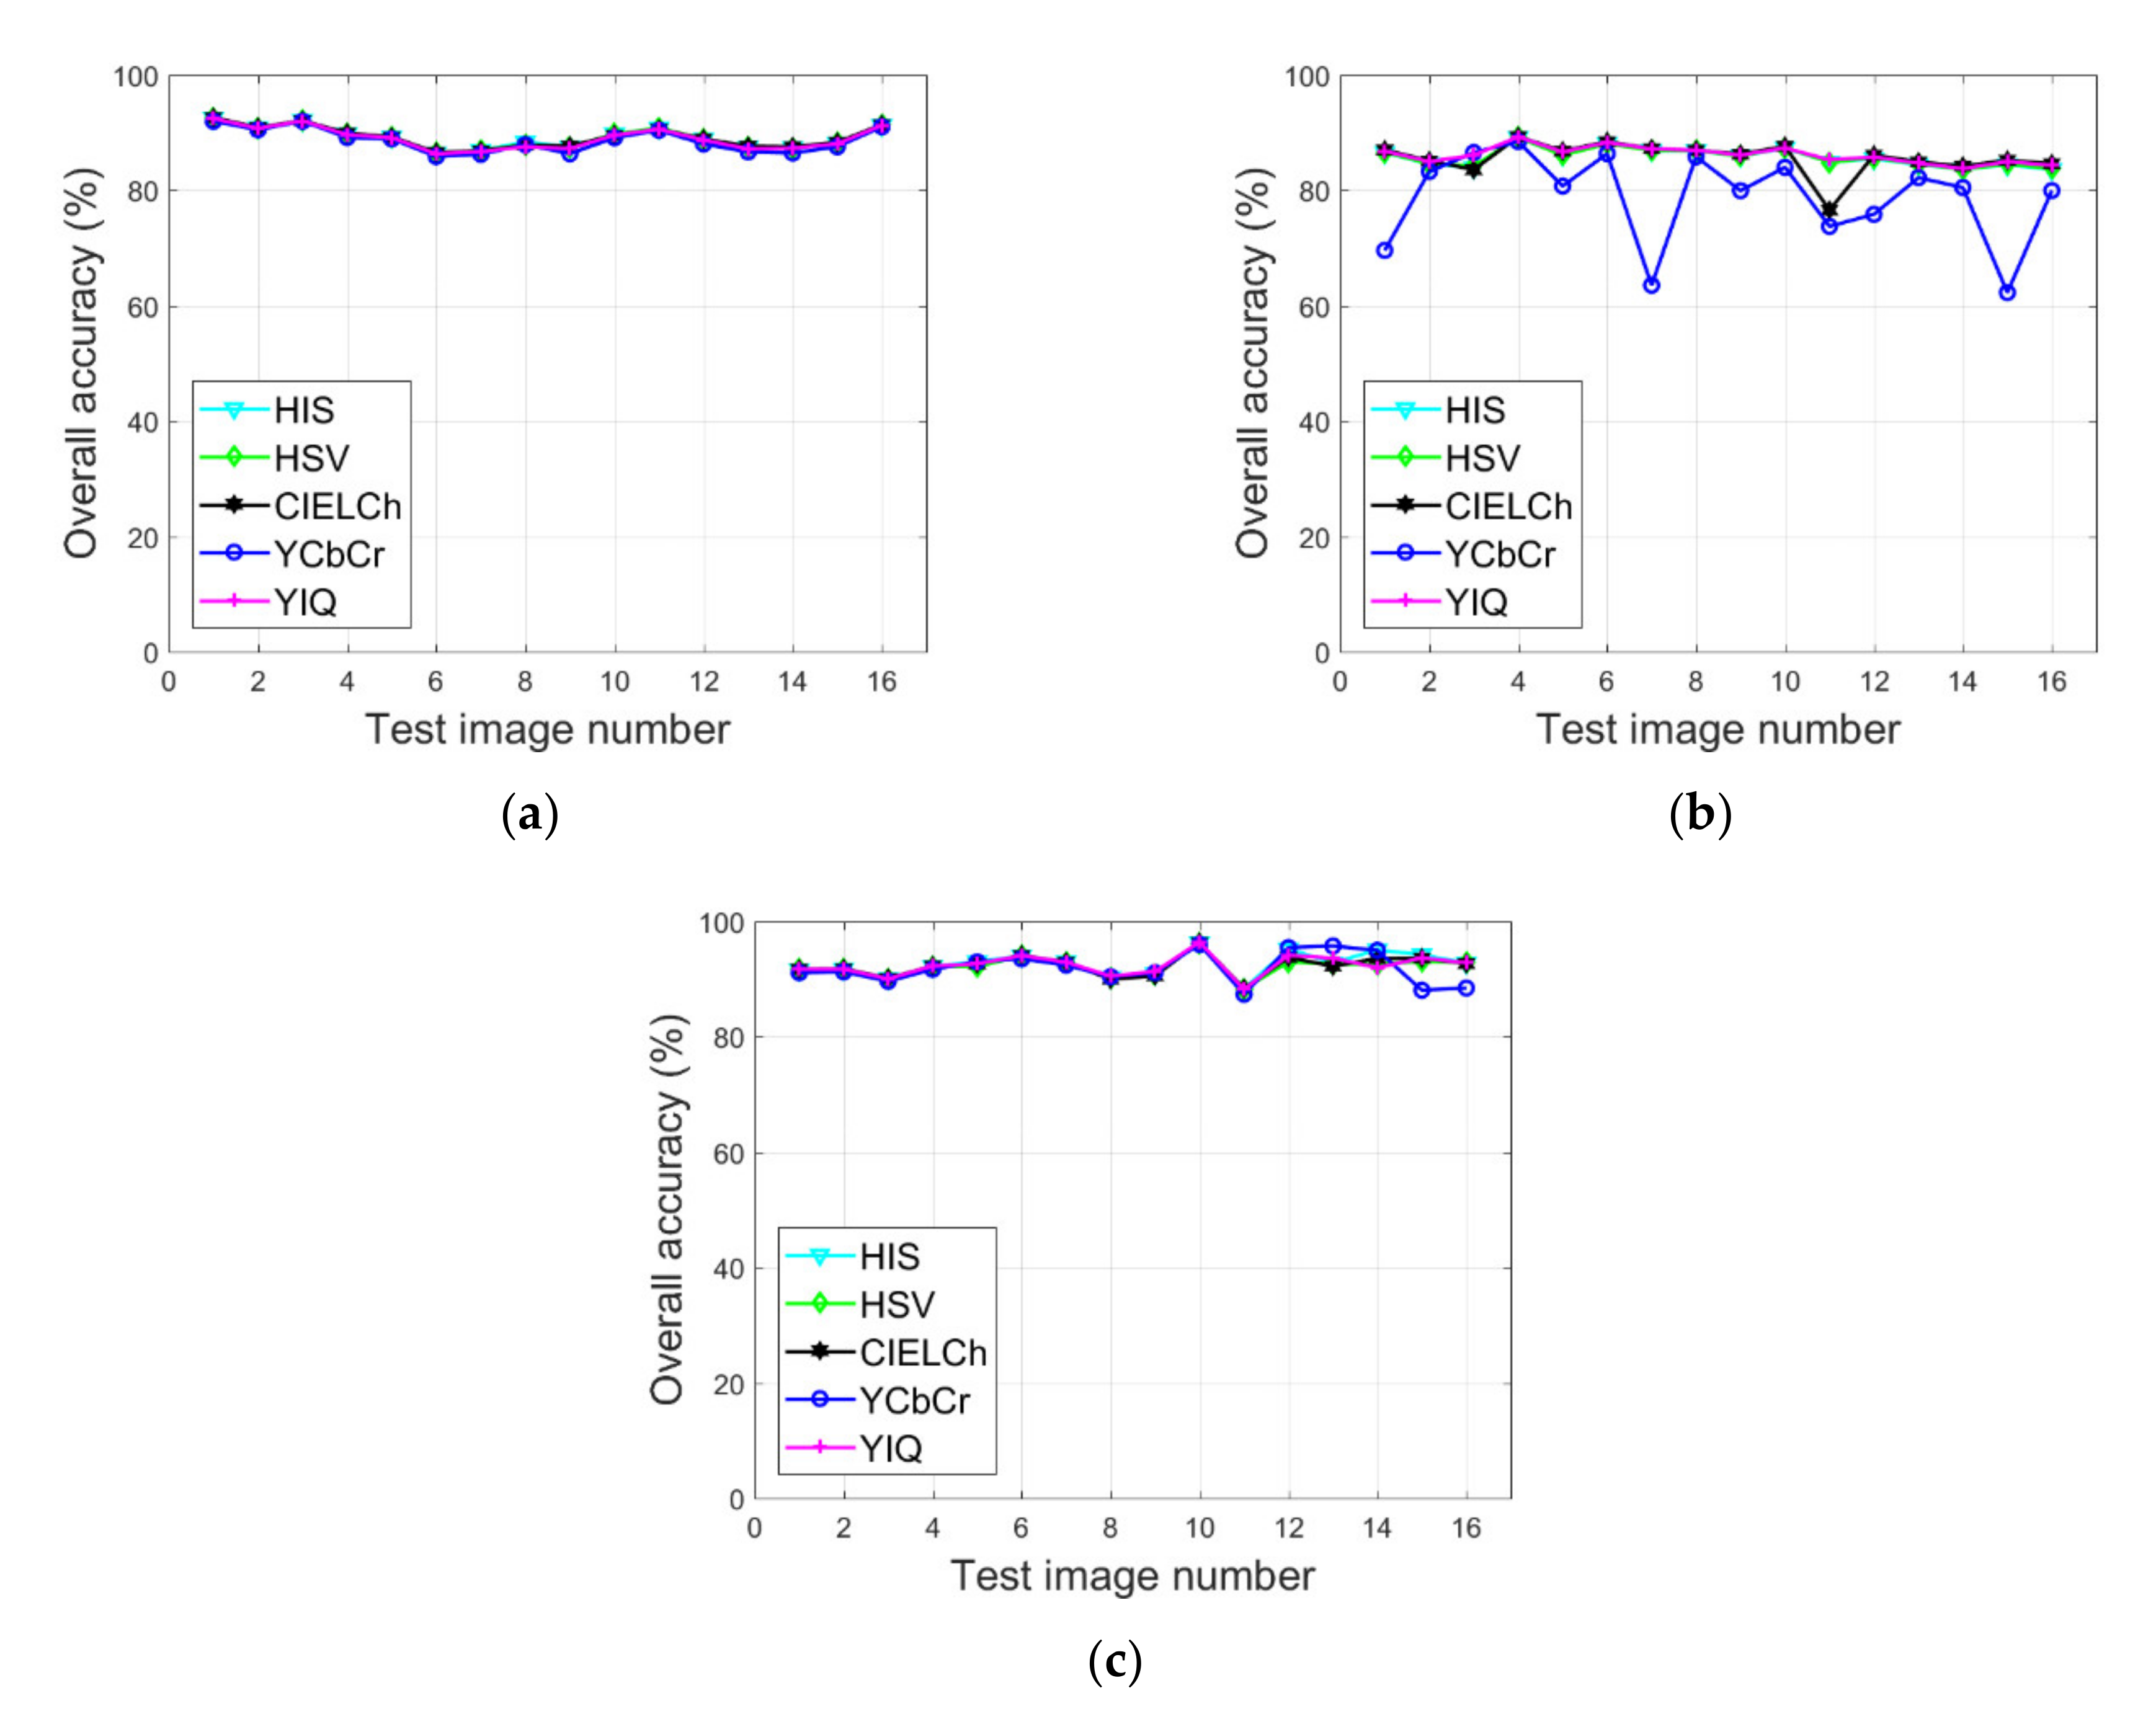
4.4. LSI Method Generalization Analysis
5. Conclusions
Author Contributions
Funding
Acknowledgments
Conflicts of Interest
References
- Prati, A.; Mikic, I.; Trivedi, M.M.; Cucchiara, R. Detecting moving shadows: Algorithms and evaluation. IEEE Trans. Pattern Anal. Mach. Intell. 2003, 25, 918–923. [Google Scholar] [CrossRef] [Green Version]
- Massalabi, A.; He, D.C.; Benie, G.B.; Beaudry, E. Detecting information under and from shadow in panchromatic Ikonos images of the city of Sherbrooke. In Proceedings of the 2004 IEEE International Geoscience and Remote Sensing Symposium, Anchorage, AK, USA, 20–24 September 2004. [Google Scholar]
- Finlayson, G.D.; Hordley, S.D.; Lu, C.; Drew, M.S. On the removal of shadows from images. IEEE Trans. Pattern Anal. Mach. Intell. 2006, 28, 59–68. [Google Scholar] [CrossRef] [PubMed]
- Tian, J.; Qi, X.; Qu, L.; Tang, Y. New spectrum ratio properties and features for shadow detection. Pattern Recognit. 2016, 51, 85–96. [Google Scholar] [CrossRef]
- Kang, X.; Li, S.; Huang, Y.; Lin, H.; Benediktsson, J.A. Extended random walker for shadow detection in very high resolution remote sensing images. IEEE Trans. Geosci. Remote Sens. 2017, 56, 867–876. [Google Scholar] [CrossRef]
- Schläpfer, D.; Hueni, A.; Richter, R. Cast shadow detection to quantify the aerosol optical thickness for atmospheric correction of high spatial resolution optical imagery. Remote Sens. 2018, 10, 200. [Google Scholar] [CrossRef] [Green Version]
- Zhao, J.; Zhong, Y.; Zhang, L. Detail-Preserving Smoothing Classifier Based on Conditional Random Fields for High Spatial Resolution Remote Sensing Imagery. IEEE Trans. Geosci. Remote Sens. 2015, 53, 2440–2452. [Google Scholar] [CrossRef]
- Dare, P.M. Shadow analysis in high-resolution satellite imagery of urban areas. Photogramm. Eng. Remote Sens. 2005, 71, 169–177. [Google Scholar] [CrossRef] [Green Version]
- Arevalo, V.; Gonzalez, J.; Ambeosio, G. Shadow detection in colour high-resolution satellite images. Int. J. Remote Sens. 2008, 29, 1945–1963. [Google Scholar] [CrossRef]
- Cai, D.; Li, M.; Bao, Z.; Chen, Z.; Wei, W.; Zhang, H. Study on shadow detection method on high resolution remote sensing image based on HIS space transformation and NDVI index. In Proceedings of the 2010 18th International Conference on Geoinformatics, Beijing, China, 18–20 June 2010. [Google Scholar]
- Al-Najdawi, N.; Bez, H.E.; Singhai, J.; Edirisinghe, E.A. A survey of cast shadow detection algorithms. Pattern Recognit. Lett. 2012, 33, 752–764. [Google Scholar] [CrossRef]
- Duan, G.Y.; Gong, H.; Zhao, W.J.; Tang, X.M.; Chen, B.B. An index-based shadow extraction approach on high-resolution images. In Proceedings of the International Symposium on Satellite Mapping Technology and Application, Nanjing, China, 6–8 November 2013. [Google Scholar]
- Zhu, X.; Chen, R.; Xia, H.; Zhang, P. Shadow removal based on YCbCr color space. Neurocomputing 2015, 151, 252–258. [Google Scholar] [CrossRef]
- Liu, J.; Fang, T.; Li, D. Shadow detection in remotely sensed images based on self-adaptive feature selection. IEEE Trans. Geosci. Remote Sens. 2011, 49, 5092–5103. [Google Scholar]
- Huang, J.J.; Xie, W.X.; Tang, L. Detection of and compensation for shadows in colored urban aerial images. In Proceedings of the 5th World Congress on Intelligent Control and Automation, Hangzhou, China, 15–19 June 2004. [Google Scholar]
- Sarabandi, P.; Yamazaki, F.; Matsuoka, M.; Kiremidjian, A. Shadow detection and radiometric restoration in satellite high resolution images. In Proceedings of the 2004 IEEE International Geoscience and Remote Sensing Symposium, Anchorage, AK, USA, 20–24 September 2004. [Google Scholar]
- Arevalo, V.; González, J.; Valdes, J.; Ambrosio, G. Dectecting shadows in Quickbird satellite images. In Proceedings of the ISPRS Commission VII Mid-term Symposium “Remote Sensing: From Pixels to Processes”, Enschede, The Netherlands, 8–11 May 2006. [Google Scholar]
- Besheer, M.; Abdelhafiz, A. Modified invariant color model for shadow detection. Int. J. Remote Sens. 2015, 36, 6214–6223. [Google Scholar] [CrossRef]
- Phong, B.T. Illumination for computer generated pictures. Graph. Image Process. 1975, 18, 311–317. [Google Scholar] [CrossRef] [Green Version]
- Tsai, V.J.D. A comparative study on shadow compensation of color aerial images in invariant color models. IEEE Trans. Geosci. Remote Sens. 2006, 44, 1661–1671. [Google Scholar] [CrossRef]
- Otsu, N. A threshold selection method from gray level histograms. IEEE Trans. Syst. Man Cybern. 1979, 9, 62–66. [Google Scholar] [CrossRef] [Green Version]
- Khekade, A.; Bhoyar, K. Shadow detection based on RGB and YIQ color models in color aerial images. In Proceedings of the 1st International Conference on Futuristic Trend in Computational Analysis and Knowledge Management (ABLAZE 2015), Greater Noida, India, 25–27 February 2015. [Google Scholar]
- Chung, K.-L.; Lin, Y.R.; Huang, Y.H. Efficient shadow detection of color aerial images based on successive thresholding scheme. IEEE Trans. Geosci. Remote Sens. 2009, 47, 671–681. [Google Scholar] [CrossRef]
- Silva, G.F.; Carneiro, G.B.; Doth, R.; Amaral, L.A.; Azevedo, D.F.G.d. Near real-time shadow detection and removal in aerial motion imagery application. J. Photogramm. Remote Sens. 2017, 2017, 104–121. [Google Scholar] [CrossRef]
- Ma, H.J.; Qin, Q.M.; Shen, X.Y. Shadow segmentation and compensation in high resolution satellite images. In Proceedings of the IEEE International Geoscience and Remote Sensing Symposium (IGARSS 2008), Boston, MA, USA, 7–11 July 2008. [Google Scholar]
- Mostafa, Y.; Abdelhafiz, A. Accurate shadow detection from high-resolution satellite images. IEEE Geosci. Remote Sens. Lett. 2017, 14, 494–498. [Google Scholar] [CrossRef]
- Fan, J.L.; Lei, B. A modified valley-emphasis method for automatic thresholding. Pattern Recognit. Lett. 2012, 33, 703–708. [Google Scholar] [CrossRef]
- Han, H.Y.; Han, C.S.; Xue, X.C.; Hu, C.H.; Huang, L.; Li, X.Z.; Lan, T.J.; Wen, M. A mixed property-based automatic shadow detection approach for VHR multispectral remote sensing images. Appl. Sci. 2018, 8, 1883. [Google Scholar] [CrossRef] [Green Version]
- Gonzalez, R.C.; Woods, R.E. Digital Image Processing, 3rd ed.; Publishing House of Electronics Industry: Beijing, China, 2010; pp. 58–65, 649–661. [Google Scholar]
- Kumar, P.; Sengupta, K.; Lee, A. A comparative study of different color spaces for foreground and shadow detection for traffic monitoring system. In Proceedings of the IEEE 5th International Conference on Intelligent Transportation Systems, Singapore, September 3–6 2002. [Google Scholar]
- Gonzalez, R.C.; Woods, R.E.; Eddins, S.L. Digital Image Processing Using MATLAB, 2nd ed.; Publishing House of Electronics Industry: Beijing, China, 2014; pp. 125–126. [Google Scholar]
- Ford, A.; Roberts, A. Colour Space Conversions; Westminster University: London, UK, 1998; pp. 1–31. [Google Scholar]
- Huang, H.; Sun, G.Y.; Rong, J.; Zhang, A.Z. Multi-feature combined for building shadow detection in GF-2 Images. In Proceedings of the 2018 5th International Workshop on Earth Observation and Remote Sensing Applications, Xi’an, China, 18–20 June 2018. [Google Scholar]
- Gevers, T.; Smeulders, A.W.M. Color-based object recognition. Pattern Recognit. 1999, 32, 453–464. [Google Scholar]
- Shafer, S.A. Using color to separate reflection component. Color Res. Appl. 1985, 10, 210–218. [Google Scholar]
- Ng, H.F. Automatic thresholding for defect detection. Pattern Recognit. Lett. 2006, 27, 1644–1649. [Google Scholar]
- DG2017_WorldView-3_DS. Available online: https://dg-cms-uploads-production.s3.amazon-aws.com/uploads/document/file/95/DG2017_WorldView-3_DS.pdf (accessed on 25 July 2018).
- Story, M.; Congalton, R.G. Accuracy assessment: A user’s perspective. Photogramm. Eng. Remote Sens. 1986, 52, 397–399. [Google Scholar]
- Sun, J. Principles and Applications of Remote Sensing, 3rd ed.; Wuhan University Press: Wuhan, China, 2016; pp. 18–21, 220–222. [Google Scholar]
- Congalton, R.G.; Green, K. Assessing the Accuracy of Remotely Sensed Data: Principles and Practices, 2nd ed.; Lewis Publishers: New York, NY, USA, 1999; pp. 56–61. [Google Scholar]


| Method | Color Space | |||||||
|---|---|---|---|---|---|---|---|---|
| LSI | HIS | 83.94 | 95.53 | 87.21 | 94.24 | 92.44 | 4.47 | 16.06 |
| HSV | 83.67 | 95.75 | 87.73 | 94.17 | 92.53 | 4.25 | 16.33 | |
| CIELCh | 84.24 | 95.61 | 87.45 | 94.35 | 92.58 | 4.39 | 15.76 | |
| YCbCr | 80.98 | 96 | 88.03 | 93.29 | 92 | 4 | 19.02 | |
| YIQ | 83.66 | 95.65 | 87.48 | 94.16 | 92.46 | 4.35 | 16.34 | |
| MC3 [18] | C1C2C3 | 85.52 | 87.47 | 71.26 | 94.33 | 86.96 | 12.53 | 14.48 |
| NSVDI [25] | HSV | 96.41 | 63.67 | 49.08 | 97.99 | 72.39 | 36.33 | 3.59 |
| LSRI [24] | CIELCh | 63.69 | 97.65 | 90.77 | 88.1 | 88.6 | 2.35 | 36.31 |
| SDI [26] | NIR-RGB | 99.2 | 33.73 | 35.22 | 99.14 | 51.17 | 66.27 | 0.8 |
| SRI [20] | HIS | 87.91 | 65.15 | 47.82 | 93.69 | 71.22 | 34.85 | 12.09 |
| Method | Color Space | |||||||
|---|---|---|---|---|---|---|---|---|
| LSI | HIS | 73.39 | 98.21 | 94.53 | 89.75 | 90.85 | 1.79 | 26.61 |
| HSV | 73.48 | 98.23 | 94.58 | 89.78 | 90.89 | 1.77 | 26.52 | |
| CIELCh | 72.89 | 98.43 | 95.15 | 89.6 | 90.86 | 1.57 | 27.11 | |
| YCbCr | 72.54 | 97.97 | 93.78 | 89.43 | 90.43 | 2.03 | 27.46 | |
| YIQ | 72.64 | 98.32 | 94.8 | 89.5 | 90.71 | 1.68 | 27.36 | |
| MC3 | C1C2C3 | 94.19 | 20.96 | 33.44 | 89.53 | 42.68 | 79.04 | 5.81 |
| NSVDI | HSV | 92.04 | 65.49 | 52.92 | 95.12 | 73.36 | 34.51 | 7.96 |
| LSRI | CIELCh | 75.06 | 94.84 | 85.99 | 90.02 | 88.98 | 5.16 | 24.94 |
| SDI | NIR-RGB | 97.61 | 40.35 | 40.82 | 97.56 | 57.33 | 59.65 | 2.39 |
| SRI | HIS | 79.61 | 65.14 | 49.05 | 88.34 | 69.43 | 34.86 | 20.39 |
| Time Used (ms) | Color Space | Tripoli-1 | Tripoli-2 |
|---|---|---|---|
| LSI | HIS | 23.22 | 9.90 |
| HSV | 16.72 | 6.32 | |
| CIELCh | 90.73 | 54.86 | |
| YCbCr | 23.13 | 13.41 | |
| YIQ | 29.30 | 12.93 | |
| MC3 | C1C2C3 | 18.24 | 10.94 |
| NSVDI | HSV | 21.48 | 14.09 |
| LSRI | CIELCh | 620.41 | 388.29 |
| SDI | NIR-RGB | 18.40 | 9.34 |
| SRI | HIS | 94.54 | 23.90 |
© 2020 by the authors. Licensee MDPI, Basel, Switzerland. This article is an open access article distributed under the terms and conditions of the Creative Commons Attribution (CC BY) license (http://creativecommons.org/licenses/by/4.0/).
Share and Cite
Han, H.; Han, C.; Lan, T.; Huang, L.; Hu, C.; Xue, X. Automatic Shadow Detection for Multispectral Satellite Remote Sensing Images in Invariant Color Spaces. Appl. Sci. 2020, 10, 6467. https://0-doi-org.brum.beds.ac.uk/10.3390/app10186467
Han H, Han C, Lan T, Huang L, Hu C, Xue X. Automatic Shadow Detection for Multispectral Satellite Remote Sensing Images in Invariant Color Spaces. Applied Sciences. 2020; 10(18):6467. https://0-doi-org.brum.beds.ac.uk/10.3390/app10186467
Chicago/Turabian StyleHan, Hongyin, Chengshan Han, Taiji Lan, Liang Huang, Changhong Hu, and Xucheng Xue. 2020. "Automatic Shadow Detection for Multispectral Satellite Remote Sensing Images in Invariant Color Spaces" Applied Sciences 10, no. 18: 6467. https://0-doi-org.brum.beds.ac.uk/10.3390/app10186467