Insights into Single Droplet Impact Models upon Liquid Films Using Alternative Fuels for Aero-Engines


1
AEROG, LAETA, Aeronautics and Astronautics Research Center, Universidade da Beira Interior, 6201-001 Covilhã, Portugal
2
ADAI, LAETA, Associação para o Desenvolvimento da Aerodinâmica Industrial, Universidade de Coimbra, 3030-788 Coimbra, Portugal
*
Author to whom correspondence should be addressed.
†
These authors contributed equally to this work.
Appl. Sci. 2020, 10(19), 6698; https://0-doi-org.brum.beds.ac.uk/10.3390/app10196698
Submission received: 29 August 2020
/
Revised: 17 September 2020
/
Accepted: 21 September 2020
/
Published: 25 September 2020
(This article belongs to the Special Issue Progress in Spray Science and Technology)
Abstract
:In aero-engines, the introduction of biofuels is among the best alternatives to fossil fuels, and this change is likely to affect the impact of droplets on interposed surfaces. Under this framework, this work reviews the main morphological hydrodynamic structures occurring upon the impact of a liquid droplet on a wetted surface, using jet fuel and biofuel mixtures as alternative fuels. The experiments performed allow investigating the effect of the liquid film thickness on the dynamic behavior of single drop impact, considering the relevancy of these phenomena to the optimization of engine operating parameters. Particular emphasis is given to the occurrence of crown splash, and the morphological differences in the outcomes of drop impact depending on the impact conditions and fluid properties. The four fluids tested included pure water (as reference), 100% Jet A-1, 75%/25%, and 50%/50% mixtures of Jet A-1 and NExBTL (Neste Renewable Diesel)—with the Weber impact number between 103 and 1625; Reynolds values 1411–16,889; and dimensionless film thicknesses of δ = 0.1, 0.5, and 1. The analysis on the secondary atomization for the different fluids evidences the predominance of prompt and crown splash, and jetting for alternative fuels. Finally, besides a systematic review of empirical correlations for the transition to splash, we investigate their universality by extrapolating the validation range to evaluate their ability to predict the outcome of impact accurately. One of the correlations studied show the highest degree of universality for the current experimental conditions, despite its limitation to thin liquid films ().
1. Introduction
The future of biofuels in the aviation industry depends on how much the induced changes in thermophysical properties affect the combustion process and all its stages, from spray formation to the preparation of the fuel/air mixture. One of the stages which produces a significant impact on the fuel/air mixture preparation is the impact of droplets on interposed surfaces. Additionally, due to the complexity of the several phenomena involved, the adequacy of numerical models to simulate the combustion process relies on accurately describing the outcome of drop impact on dry or wetted surfaces. This description includes the morphological behavior of hydrodynamic structures leading to the deposition of fuel or eventual secondary atomization, re-issuing part of the fuel to the combustion chamber, improving the fuel/air mixture preparation. However, due to the numerous variables that affect the outcome of drop impact, the best approach is to develop empirical correlations based on dimensionless numbers expressing the relation between the inertial, surface tension, and viscous forces involved.
1.1. Transition for Secondary Atomization after Drop Impact on Liquid Films
The two essential outcomes of drop impact on liquid films are the deposition of a liquid droplet in the film or the generation of secondary droplets through hydrodynamic mechanisms, such as a full or partial rebound of the initial droplet, or smaller droplets detaching from the bounding rim of an uprising crown associated with the splashing mechanism. However, the classification of these outcomes is not always unanimous.
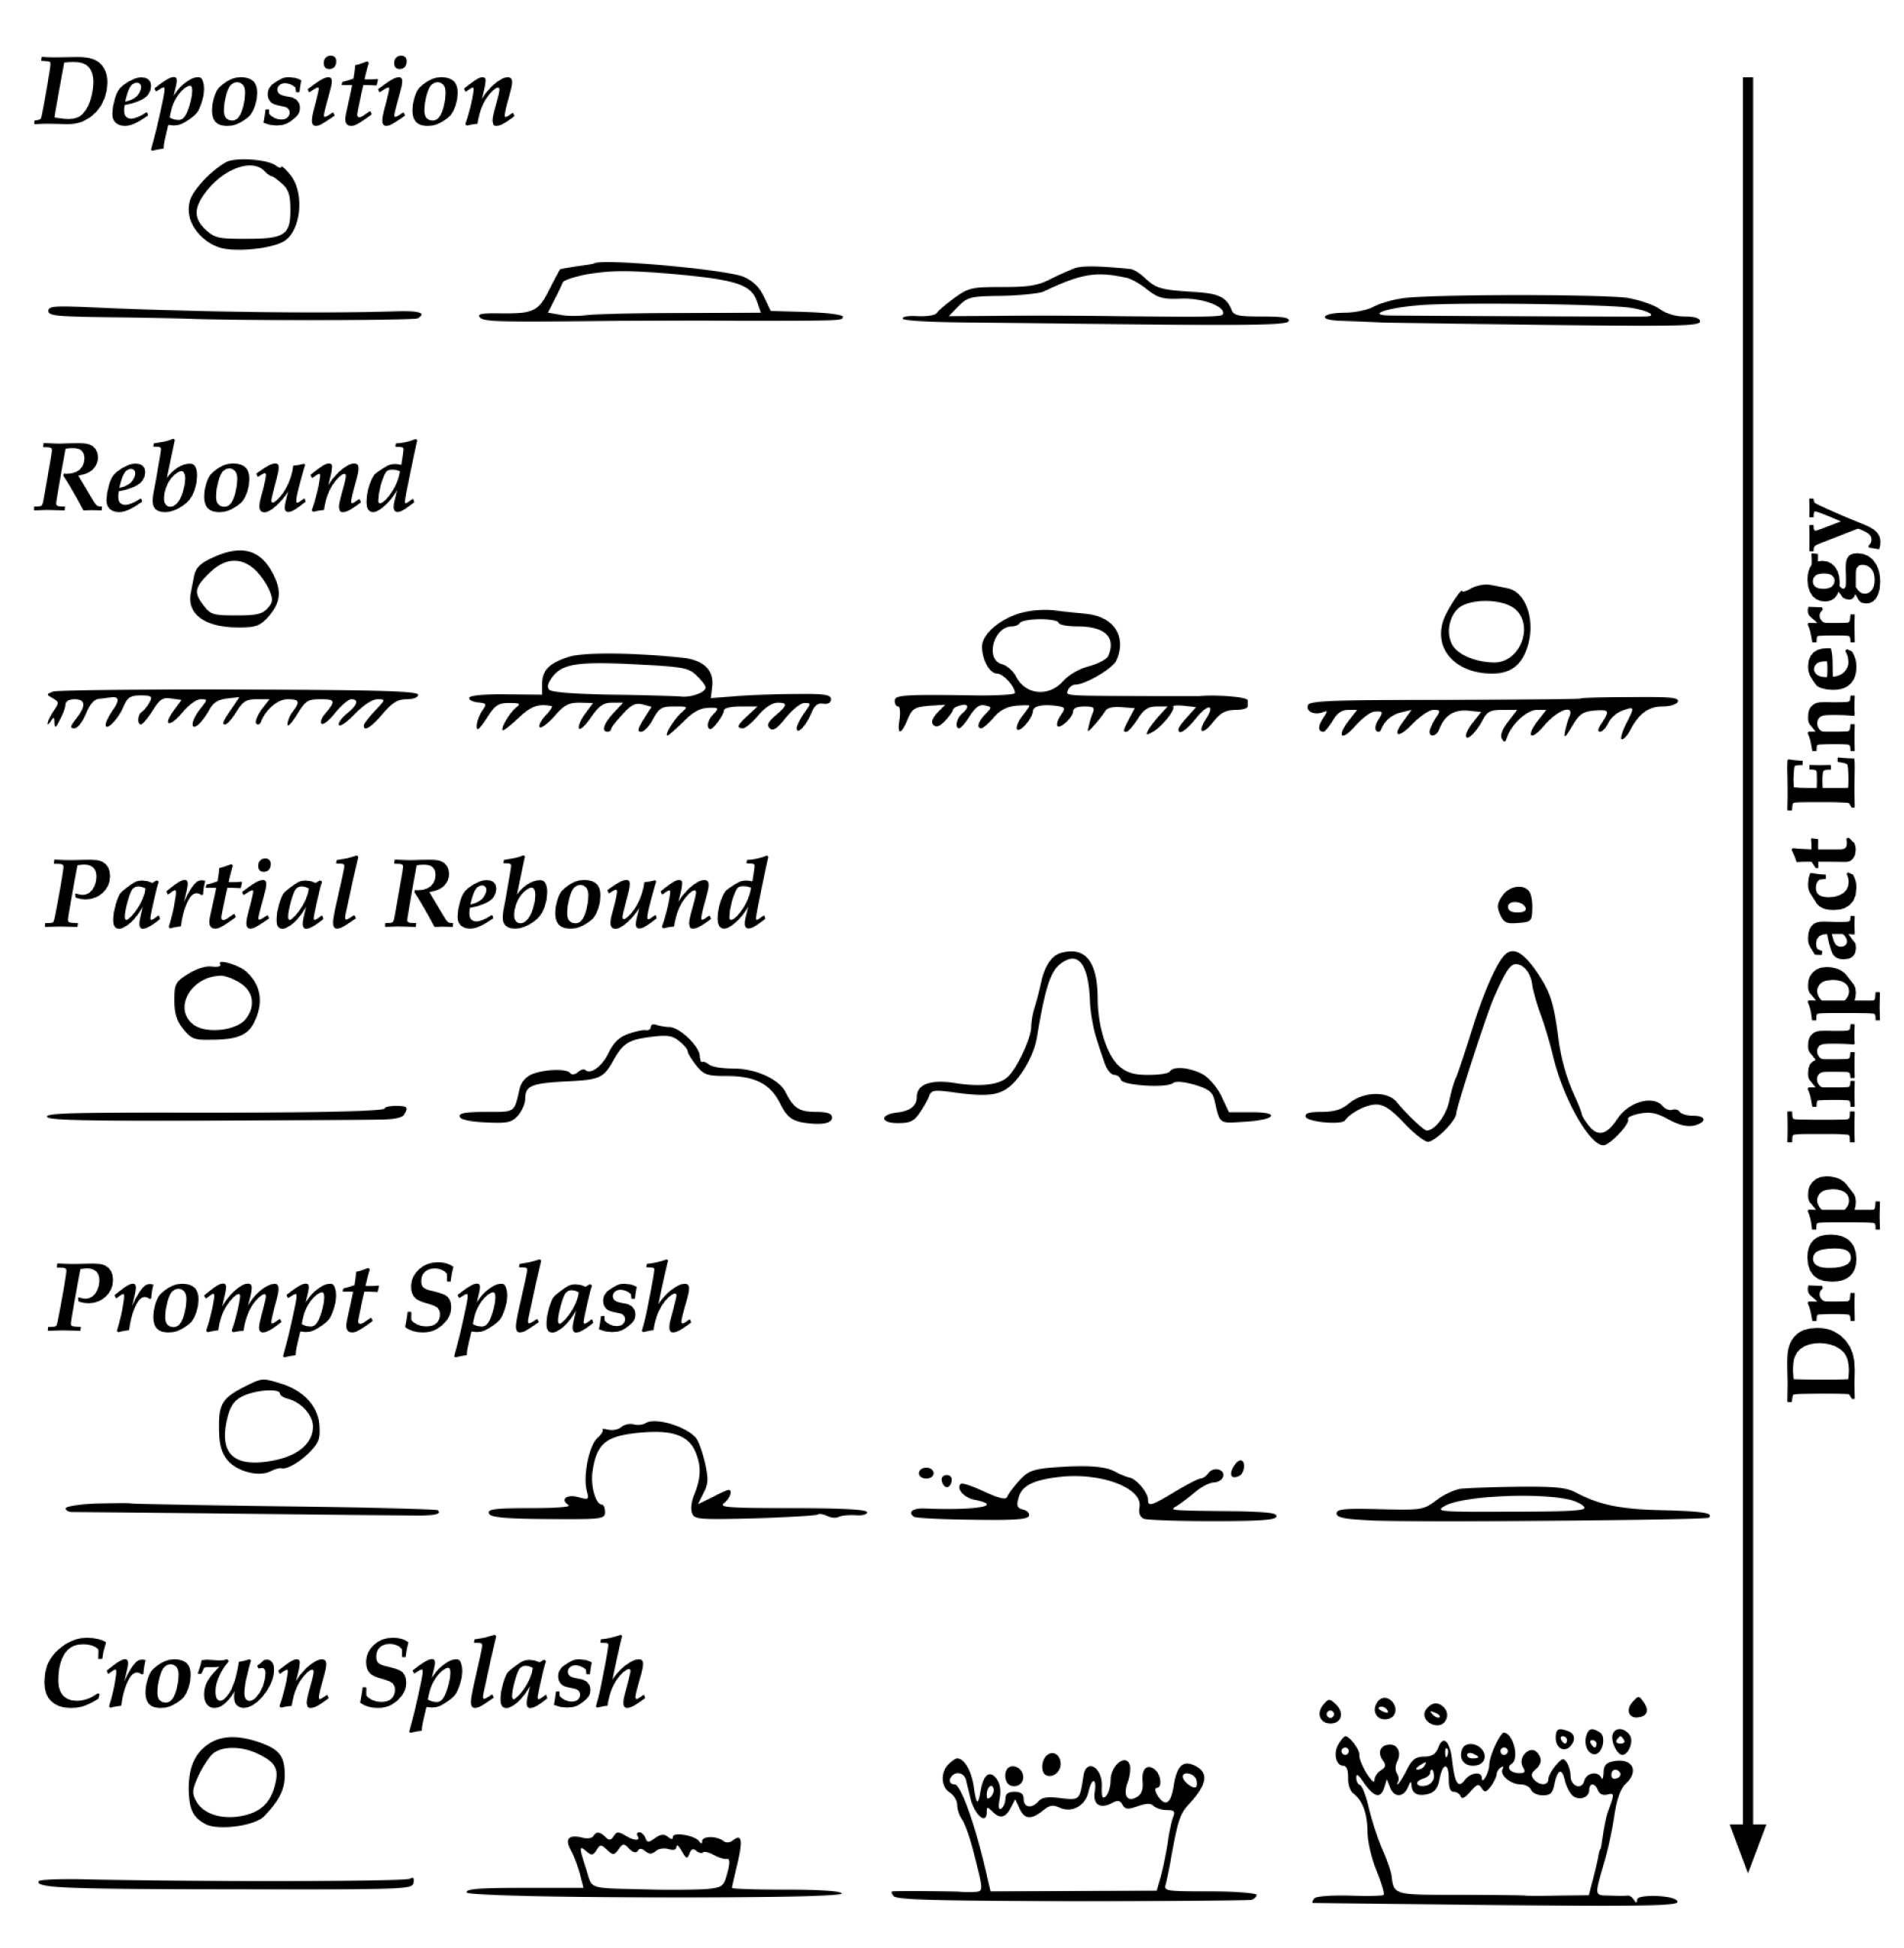
Rioboo et al. [1] defined detailed terminology for the several morphological structures emerging from drop impact—prompt splash, crown splash, rebound, and partial rebound being the most relevant for this study of droplet deposition. Figure 1 presents illustrations of these phenomena organized by the required drop impact energy.
Identifying the differences in the droplet hydrodynamic behavior depending on the liquid film thickness () was a concern. Namely, Chandra and Avedisian [2] reported that the spreading of the droplet changed significantly due to the liquid film. Later, focusing their work on distinguishing the spreading behavior between the impact on dry and wetted surfaces, Rioboo et al. [3] showed how maintaining all the impact parameters constant, except the surface conditions, resulted in entirely different drop impact morphological structures. Therefore, it is reasonable to include the effect of the liquid film characteristics in the empirical correlations (in a dimensionless form as , where is the droplet diameter before impact) discerning the transition between deposition and the splash which generates secondary atomization.
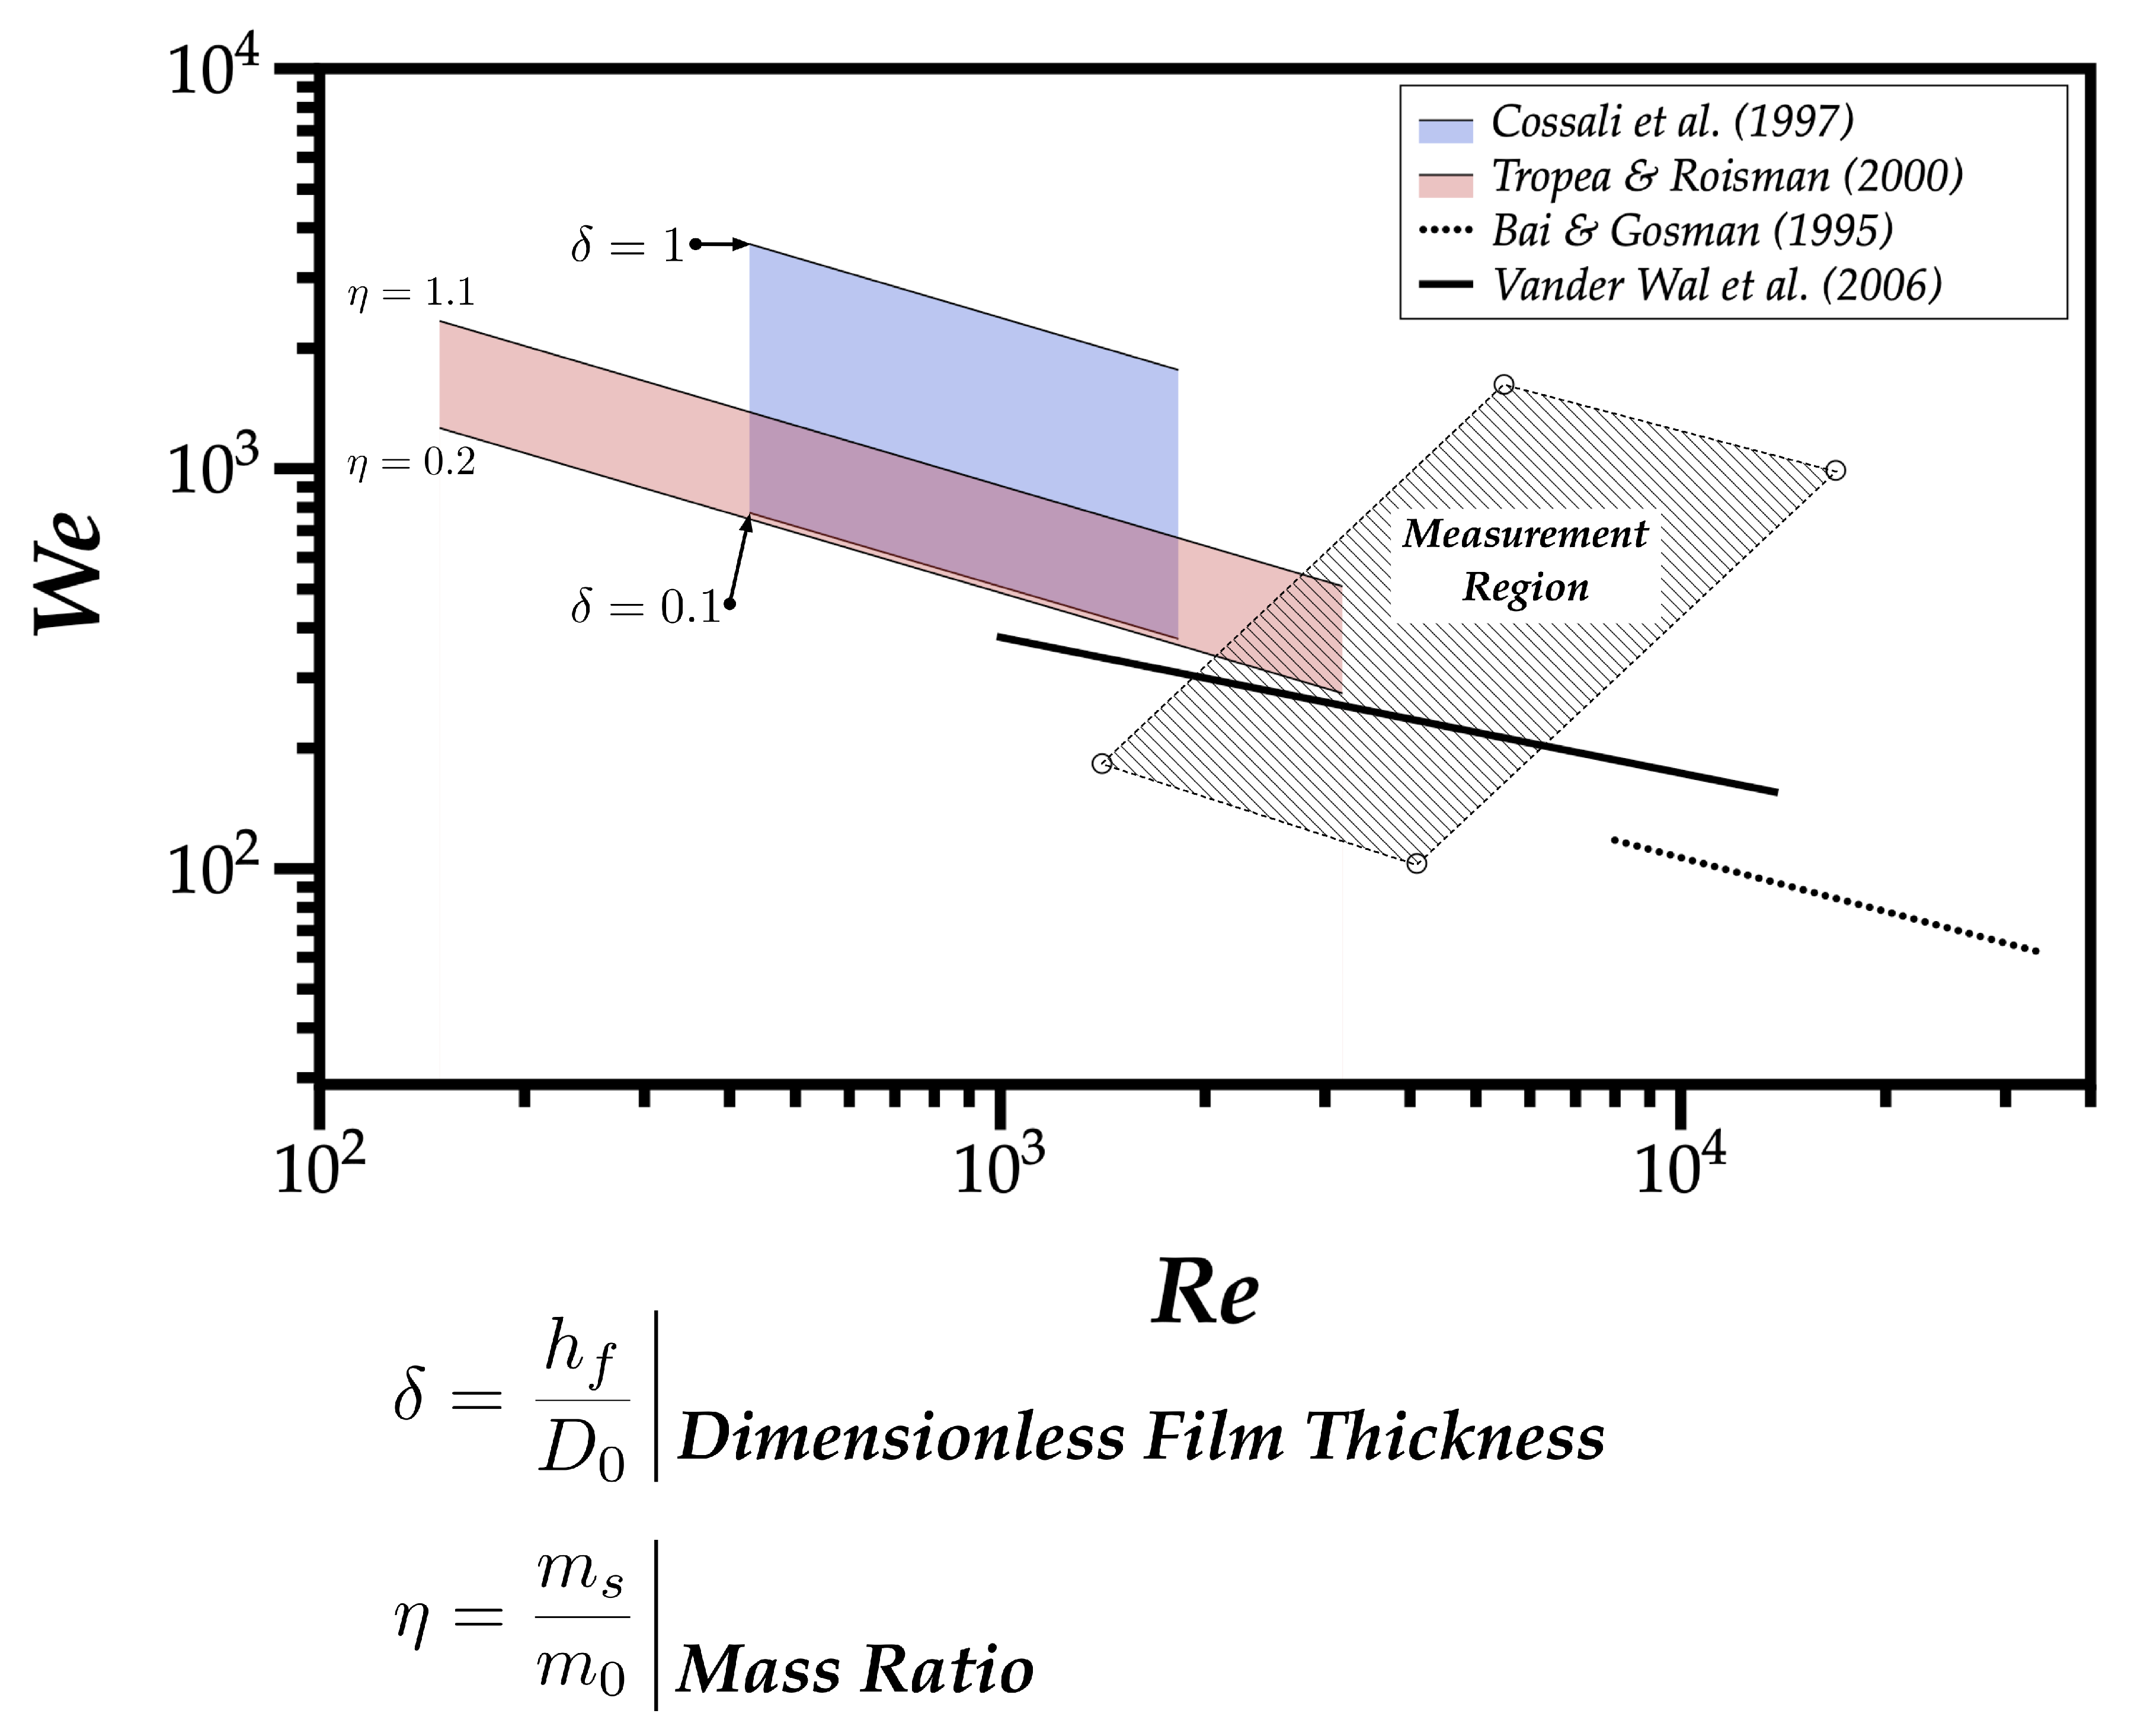
The empirical correlations that categorize the outcomes of impacts depend on dimensionless parameters, such as the Weber () and Reynolds () numbers, followed by the Ohnesorge () and Laplace () numbers, dependent on the former, where , , and are the density, surface tension, and dynamic viscosity of the liquid, respectively, and is the droplet impact velocity. Most empirical correlations follow a relation between Weber and Reynolds numbers expressed as
where is the criterion between a droplet spreading and splashing. Table 1 summarizes the proposals for this criterion for wetted surfaces. There are several considerations about the origin of these criteria.
The first relates to the criterion of Bai and Gosman [4], which considers the impact of a droplet on a wetted surface equivalent to its impact on a very rough surface (m), and the data can be traced back to the original contribution of Stow and Stainer [8] with experiments within the range indicated in Table 1. The second consideration is the criterion of Cossali et al. [5] which considers the influence of the liquid film thickness in the impact outcome. To enlarge their experimental data, they used not only pure water but also mixtures of glycerol and water, thereby increasing the range of thermophysical properties of the fluids. Additionally, they performed experiments using different dimensionless film thicknesses (). The validation range of this criterion can be consulted in Table 1. The third consideration refers to the correlation of Tropea and Roisman [6], which includes a random element in the criterion through the mass ratio . This mass ratio can be above 1 in the sense that part of the liquid film may contribute to the mass of secondary droplets emerging from splash. In fact, Bai and Gosman [4] consider a similar random element in the numerical model of spray impingement as . In Roisman and Tropea [9] a value for is suggested, which would correspond to ; however, no explanation for this value is provided. Thus, in this review, we opt for the most general form for this criterion. Lastly, Vander Wal et al. [7] determined an empirical correlation for the spreading/splashing transition of single droplets impinging on dry surfaces and thin liquid films. In the experimental data that they used to fit the correlation, different fluids were included providing a wide range of impact conditions. However, they only tested impacts with thin liquid films ().
Figure 2 plots the criteria organized in Table 1, showing the region for the Cossali et al. [5] correlations depending on the dimensionless liquid film () and the region for the Tropea and Roisman [6] correlation depending on . Most correlations have a similar logarithmic slope, except for the correlation proposed by Vander Wal et al. [7]. In scale, Vander Wall et al.’s correlation is close to the dimensionless film thickness condition of . However, their experiments covered a broader range of Reynolds values, eventually, leading to a lower influence of Re, as the corresponding exponent points to with its lower value.
Figure 2 also shows the measurement region of the droplet characteristics used in this work. The region covers fuel mixtures that can be implemented in aero-engines since the American Society for Testing and Materials (ASTM) presently authorizes jet fuel blends with 50% in volume with fuels derived from HEFA (hydroprocessed esters and fatty acids) in aviation turbines [10,11]. HEFA fuels have proven to be able to replace conventional jet fuels [12]. Gawron and Białecki [13] compared the performance of a Jet A-1/HEFA blend with Jet A-1 on a miniature turbojet engine. The most significant differences in terms of operating parameters concern the fuel consumption, which is smaller for the blend. Moreover, the emission indices of CO, CO, and NO are smaller in comparison to Jet A-1.
1.2. Morphological Considerations on the Hydrodynamics of Splashing
The splashing mechanism is one of (if not) the most relevant and studied factors in the literature. On a typical vertical impact of a single droplet on a steady liquid film the droplet is initially spherical, and it does not suffer any deformation during the fall. A recent study [14], using precisely the same fluids, studied the effect of a droplet’s initial deformation on the splashing dynamics. Due to the interaction between the droplet and an air flow before impact, the droplet deformed and assumed different shapes before impact. They reported that spherical droplets promote splashing, while deformed droplets promote spreading. The physical processes involved in fuel combustion include fuel atomization and impact, followed by the evaporation. The mixture preparation, including the impact upon dry and wetted surfaces, is recognized as of major importance. The secondary atomization produced by the splashing optimizes the fuel combustion efficiency. Considering this, a droplet falling vertically on a steady liquid film was studied for the fluids mentioned and the occurrence of splash was compared to the prediction of models presented in the literature. All models considered were designed for the impact of spherical droplets upon a liquid film. The morphology of this impact mechanism includes the formation of a crown with a rim in its upper bound, and from instabilities in this rim, the cusp can emerge, which disintegrates into droplets—thus, secondary atomization. Cossali et al. [15] were among the first to characterize the crown diameter, thickness, and maximum height. The authors noticed that higher values for the Weber number led to smaller secondary droplets. A few years later, Cossali et al. [16] focused their work on the time evolution of the crown of water droplets impinging upon thin liquid films. They reached several conclusions related to the crown diameter, the non-dimensional crown height, and the mean secondary droplet size. However, since they used only one fluid, it is not possible to identify whether their conclusions could be extended to other fluids.
Fedorchenko and Wang [17] studied experimentally and theoretically, the region of the fully developed splashing. They used water but also a 70% glycerol-water solution. They developed a model for the central jet formation at the cavity collapse. Some considerations were made about the viscosity of the fluids related to the cavity, the central jet, and the crown ejection. In fluids with low viscosity, the interaction between the capillary wave and the cavity wall has a major influence on the cavity shape, and by consequence, on the central jet speed. On the other hand, for fluids with high viscosity, the influence of capillary waves is minor. Understanding the roles of the fluid physical properties is essential to understanding how they influence the impact regimes. For example, Range and Feuillebois [18] reported that splashing is highly sensitive to surface tension values.
A parameter particularly relevant to the impacts of droplets on wetted surfaces is the dimensionless thickness of the liquid film and its influence in the droplet dynamic behavior. Vander Wal et al. [19] studied droplets splashing upon liquid films of different depths. They reported that thinner liquid films decreased the critical Weber number, setting the transition between deposition and splash. They also found that the size and number of the splashed droplets depend upon the presence and thickness of the liquid film, and also on the fluid’s viscosity and surface tension. For , both prompt and crown splash were spotted, but for , prompt splash was limited and crown splash inhibited. Moreover, the number of ejected droplets decreased while their mean size increased, an outcome attributed to the increase of the surface tension and viscosity. In addition, a higher viscosity leads to an increase of the damping forces involved in the morphological development of splash, delaying both prompt and crown types. Therefore, while viscosity promotes splash after drop impact on dry surfaces, in the presence of thin liquid films, its role reverts. Lastly, high surface tension inhibits splashing both for dry or wetted surfaces.
Over the years, researchers wanted to produce thinner liquid films and study these particular impacts. For example, Wang and Chen [20] did experiments centered on the splashing of a single droplet upon very thin liquid films (). They confirmed that the critical Weber number and the splashing dynamics remain influenced by the thickness of the liquid film. However, the authors also noticed that the critical Weber number converges to a minimum value as decreases, which depends on the fluid viscosity and surface characteristics underneath the liquid film.
In the study of drop impact on wetted surfaces, it is important to understand whether the surface underneath the liquid film influences the outcome. With that in mind, Vander Wal et al. [21] combined the influence of a rough surface and a thin liquid film upon the splashing limit and dynamics. They recognized that both cases substantially changed the splashing limit and dynamic. A rough surface decreased the critical Weber number drastically for the transition to splash, and the surface topography overtakes the importance of other governing parameters, especially in the splashing regime. For example, considerable differences in the surface tension and viscosity became less significant and made the outcome of impact very similar. The splashing behavior of a rough surface covered by a thin liquid film was a combination of both cases.
Boundaries between the different impact regimes are common and widely reported. Moreira et al. [22] synthesized several empirical correlations in the literature which established boundaries between the different impact regimes and classified them as very distinct. The main differences were due to the distinct impact conditions which originated them.
Concerning the effect of fluid properties, Zhang et al. [23] centered their work on the numerical simulation of a droplet impinging upon films and remarked that while surface tension and viscosity decreases, more momentum is imparted on the crown development, increasing its height and decreasing its thickness. In the same way, the formation of prompt splashing is enhanced by the decrease in surface tension and viscosity of the fluid. They found that Weber number plays a more important role in droplet impact behavior than the Reynolds number. Increasing the Weber number accelerates the impact process and increases the number of splashing droplets.
Other studies concern droplet impacts upon immiscible liquid films (e.g., water and oil), such as the work performed by Che and Matar [24]. Immiscibility induces completely different hydrodynamic behaviors. A water droplet impinging on an oil film creates a compound crown, followed by the formation of a central jet; contrarily, an oil droplet impinging on a water film causes quick spreading. They also studied the influences of some parameters, such as the Weber and Ohnesorge numbers, the viscosity ratio, and the dimensionless thickness of the liquid film. Namely, concerning the last parameter, thicker films show a behavior similar to miscible liquids, with the timescales delayed relative to thinner liquid films. Recently, Burzynski and Bansmer [25] studied the droplet splashing on a thin moving film only for high Weber number (). They reported that the liquid film velocity affects the crown geometry considerably. The high inertial force of the droplet enlarges the expansion of the crown, which causes a larger diameter. Increasing the liquid film velocity leads to an increase in crown thickness, and consequently, will decrease the dimensionless crown diameter, due to the higher inertial forces of the film that alter the spreading process.
In addition to those described above, several other research works have been developed [26], including multiple droplet impacts, impacts upon heated surfaces, and impacts upon inclined walls, among many others. There was something missing in all those studies. The most common fluids used were water, glycerol, ethanol, and solutions with different fluids. However, since one of the applications where drop impacts on liquid films is relevant concerns the fuel injection in internal combustion engines, fuel mixtures should be tested. Therefore, the assessment of empirical models, and the morphological hydrodynamic structures associated with drop impact on wetted surfaces, are worthy of further investigation.
One of the goals of this work is to contribute for the implementation of biofuels in the aviation sector. For this reason, the working fluids considered were 100% Jet A-1 and two mixtures with 75%/25% and 50%/50% of Jet A-1 and NExBTL (Neste Renewable Diesel), respectively. Pure water was also used as reference fluid. The designed and built experimental facility that visualizes drop impact outcomes, enables precise control over the liquid film thickness ( mm) [27]. According to its dimensionless thickness, the liquid films can be classified as thin, intermediate, and thick, and even as shallow or deep pool [28]. In the experiments reported, three relative thicknesses were considered and identified as thin (), intermediate (), and thick () liquid films. After this introduction, the following section details the experimental procedure used. Section 3 explores the results obtained in the experiments in three lines of research: (1) the morphology of drop impact; (2) its outcome; and (3) the application of transition criteria to evaluate their limitations when fuels are considered. These fuel mixtures fill all the demands defined by civil aviation to be applied in aero-engines, and predicting the splashing occurrence will enhance their efficiency in the combustion process. Finally, the article ends with some concluding remarks.
2. Experimental Procedure
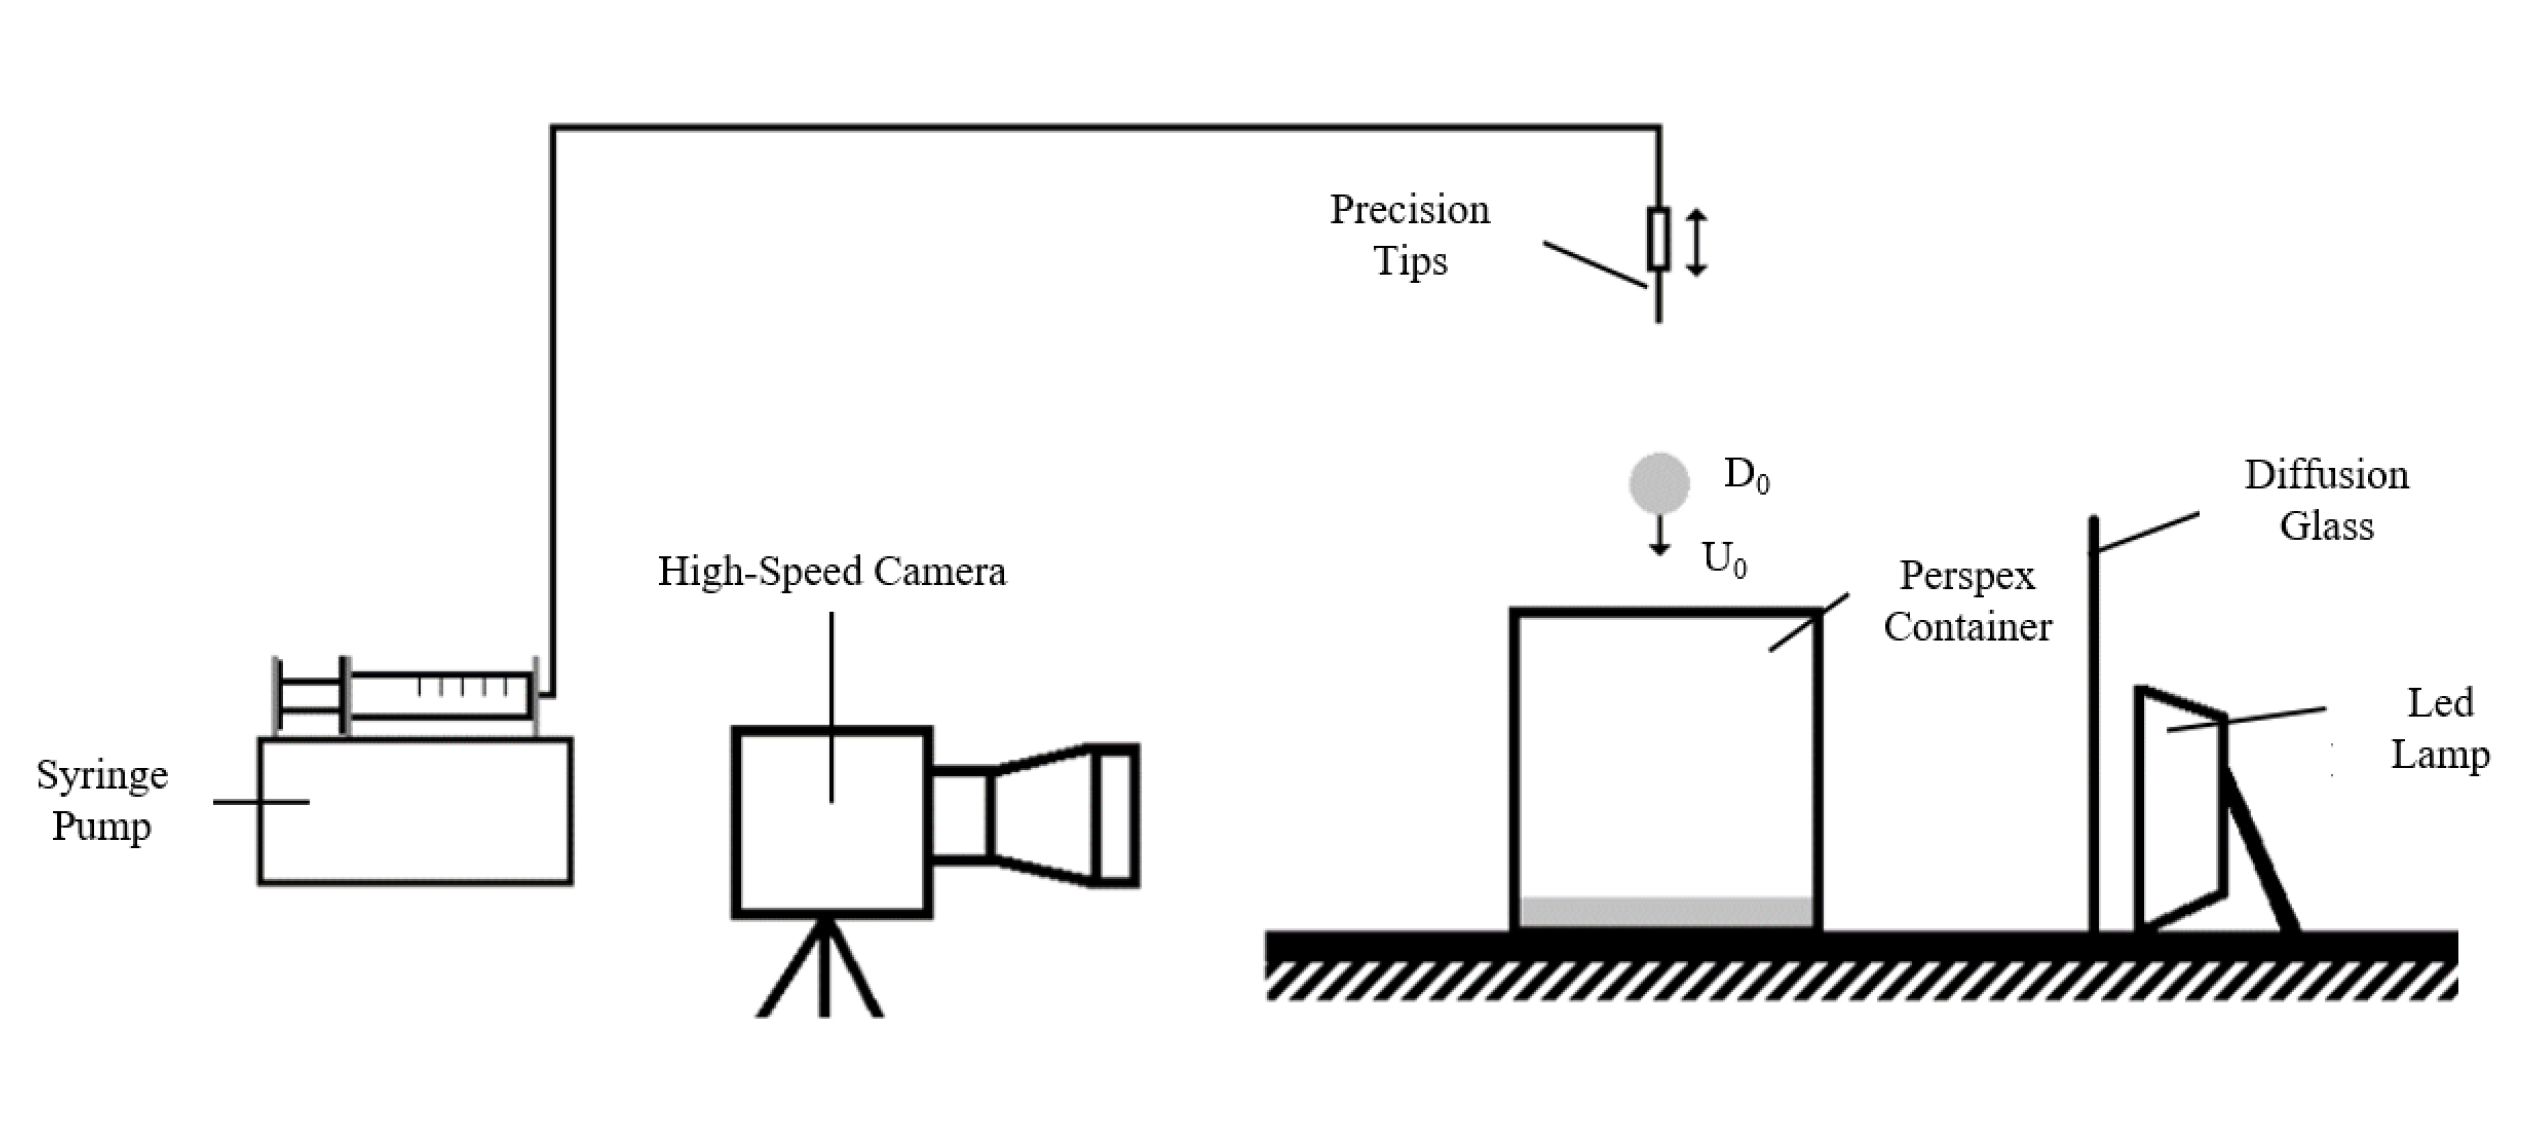
The experimental facility (Figure 3) is composed of four main parts: image acquisition, impact surface, droplet dispensing system, and impact site illumination. For image acquisition, we used a high-speed digital camera Photron FASTCAM mini UX50 with 1.3 Megapixel resolution at frame rates up to 2000 fps (frames per second) and at reduced image resolution for frame rates up to 160,000 fps. We used a Macro Lens Tokina AT-X M100 AF PRO D with a minimum focus distance of m, a focal length of 100 mm, a macro ratio of 1:1, and a filter size of 55 mm. The image resolution at first was , the exposure time was s, and the frame rate was 2000 fps. A topless right-angled perspex container was the impact surface and its dimensions were calculated based on the maximum droplet diameter (edge equal to ). To release the droplets, a syringe pump NE-1000 was used at a pumping rate of mL/min. To vary the droplet diameter, five stainless steel precision tips were used. They had straight tips and their inner diameters were: mm, mm, mm, mm, and mm. The illumination of the impact site is crucial, and the only light source in the room was a 20 W LED in front of the camera to provide backlighting. A piece of diffusion glass was placed between the impact site and the LED.
The physical properties of the three fuels used were measured to increase the precision of the study (density, surface tension, and dynamic viscosity) and can be seen in Table 2. It is possible to see that both the densities and the surface tensions of the three fluids are very similar, the major differences being in the dynamic viscosity values. As mentioned, pure water was also tested as a reference since its properties are well defined in the literature.
The experimental procedure has two parts. In the first part, the camera was kept parallel to the droplet falling plane and the droplet diameters and impact velocities were measured through the impact upon the dry surface to allow the determination of the liquid film thickness. In the second part, the camera was leaned 10 with the horizontal plane to improve visualization. In this part, the droplet impinged upon a liquid film with dimensionless thicknesses () of 0.1, 0.5, and 1. Since perspex is a hydrophobic surface, it was not possible to produce the thinner films for water. Water and perspex are a non-wetting system. In this way, the thinner films produced for HO were defined by the minimum volume that allowed the production of a homogeneous liquid film and it was then calculated for every droplet diameter. Table A1 in the Appendix A shows the values for the thinner dimensionless thicknesses for HO.
To measure the droplet diameter and the impact velocity, a MATLAB algorithm was created to subtract the background and the binarization of the image; the number of pixels corresponding to the droplet diameter were counted. By multiplying that by the pixel size, the droplet diameter was then determined. The maximum pixel size was m/pixel providing a maximum error of m. For the impact velocity, the image treatment was similar, but in this case, it was chosen the last droplet before impact and the droplet 5 ms before and again by pixel counting the values were determined. A more detailed description of the experimental work can be seen in Ribeiro [27].
In terms of the experimental conditions explored in this work, the five different inner diameters of the needle used resulted in the droplet diameters varying from, approximately, to 4.0 mm (see Table A2 in the Appendix A for the details). The differences between the three fuels are negligible, and water registered the largest diameters due to the higher surface tension. Table A3 in Appendix A contains the information on the impact velocity measured for the three falling impact heights used ( m, m, and m). Table 3 shows the ranges of dimensionless numbers calculated from the droplets’ dynamic characteristics.
3. Results and Discussion
The analysis of the results from the high-speed visualization follows three research questions. The first question addresses the morphological structures obtained after drop impact. The second question dives into the processes triggering secondary atomization. Finally, we evaluate the accuracy of transition criteria in predicting the outcome of drop’s impact on the liquid film using biofuels.
3.1. Morphological Structures of Drop Impact on Liquid Films
The impact of biofuel single droplet onto a liquid film resulted in six different observed phenomena: deposition, fingering, prompt-splash, crown splash, jetting, and bubble encapsulation. In Figure 4, it is possible to see two phenomena without the formation of secondary atomization: (a) spreading or deposition, when the droplet merges with the liquid film, occurring for low impact energies; (b) fingering, i.e., instabilities created in the outer rim of the liquid lamella and structures finger-like in shape grow. When the size of the fingers is larger, they tend to break up and form droplets by secondary atomization. The variable t expresses the time before and after impact— the instant of impact.
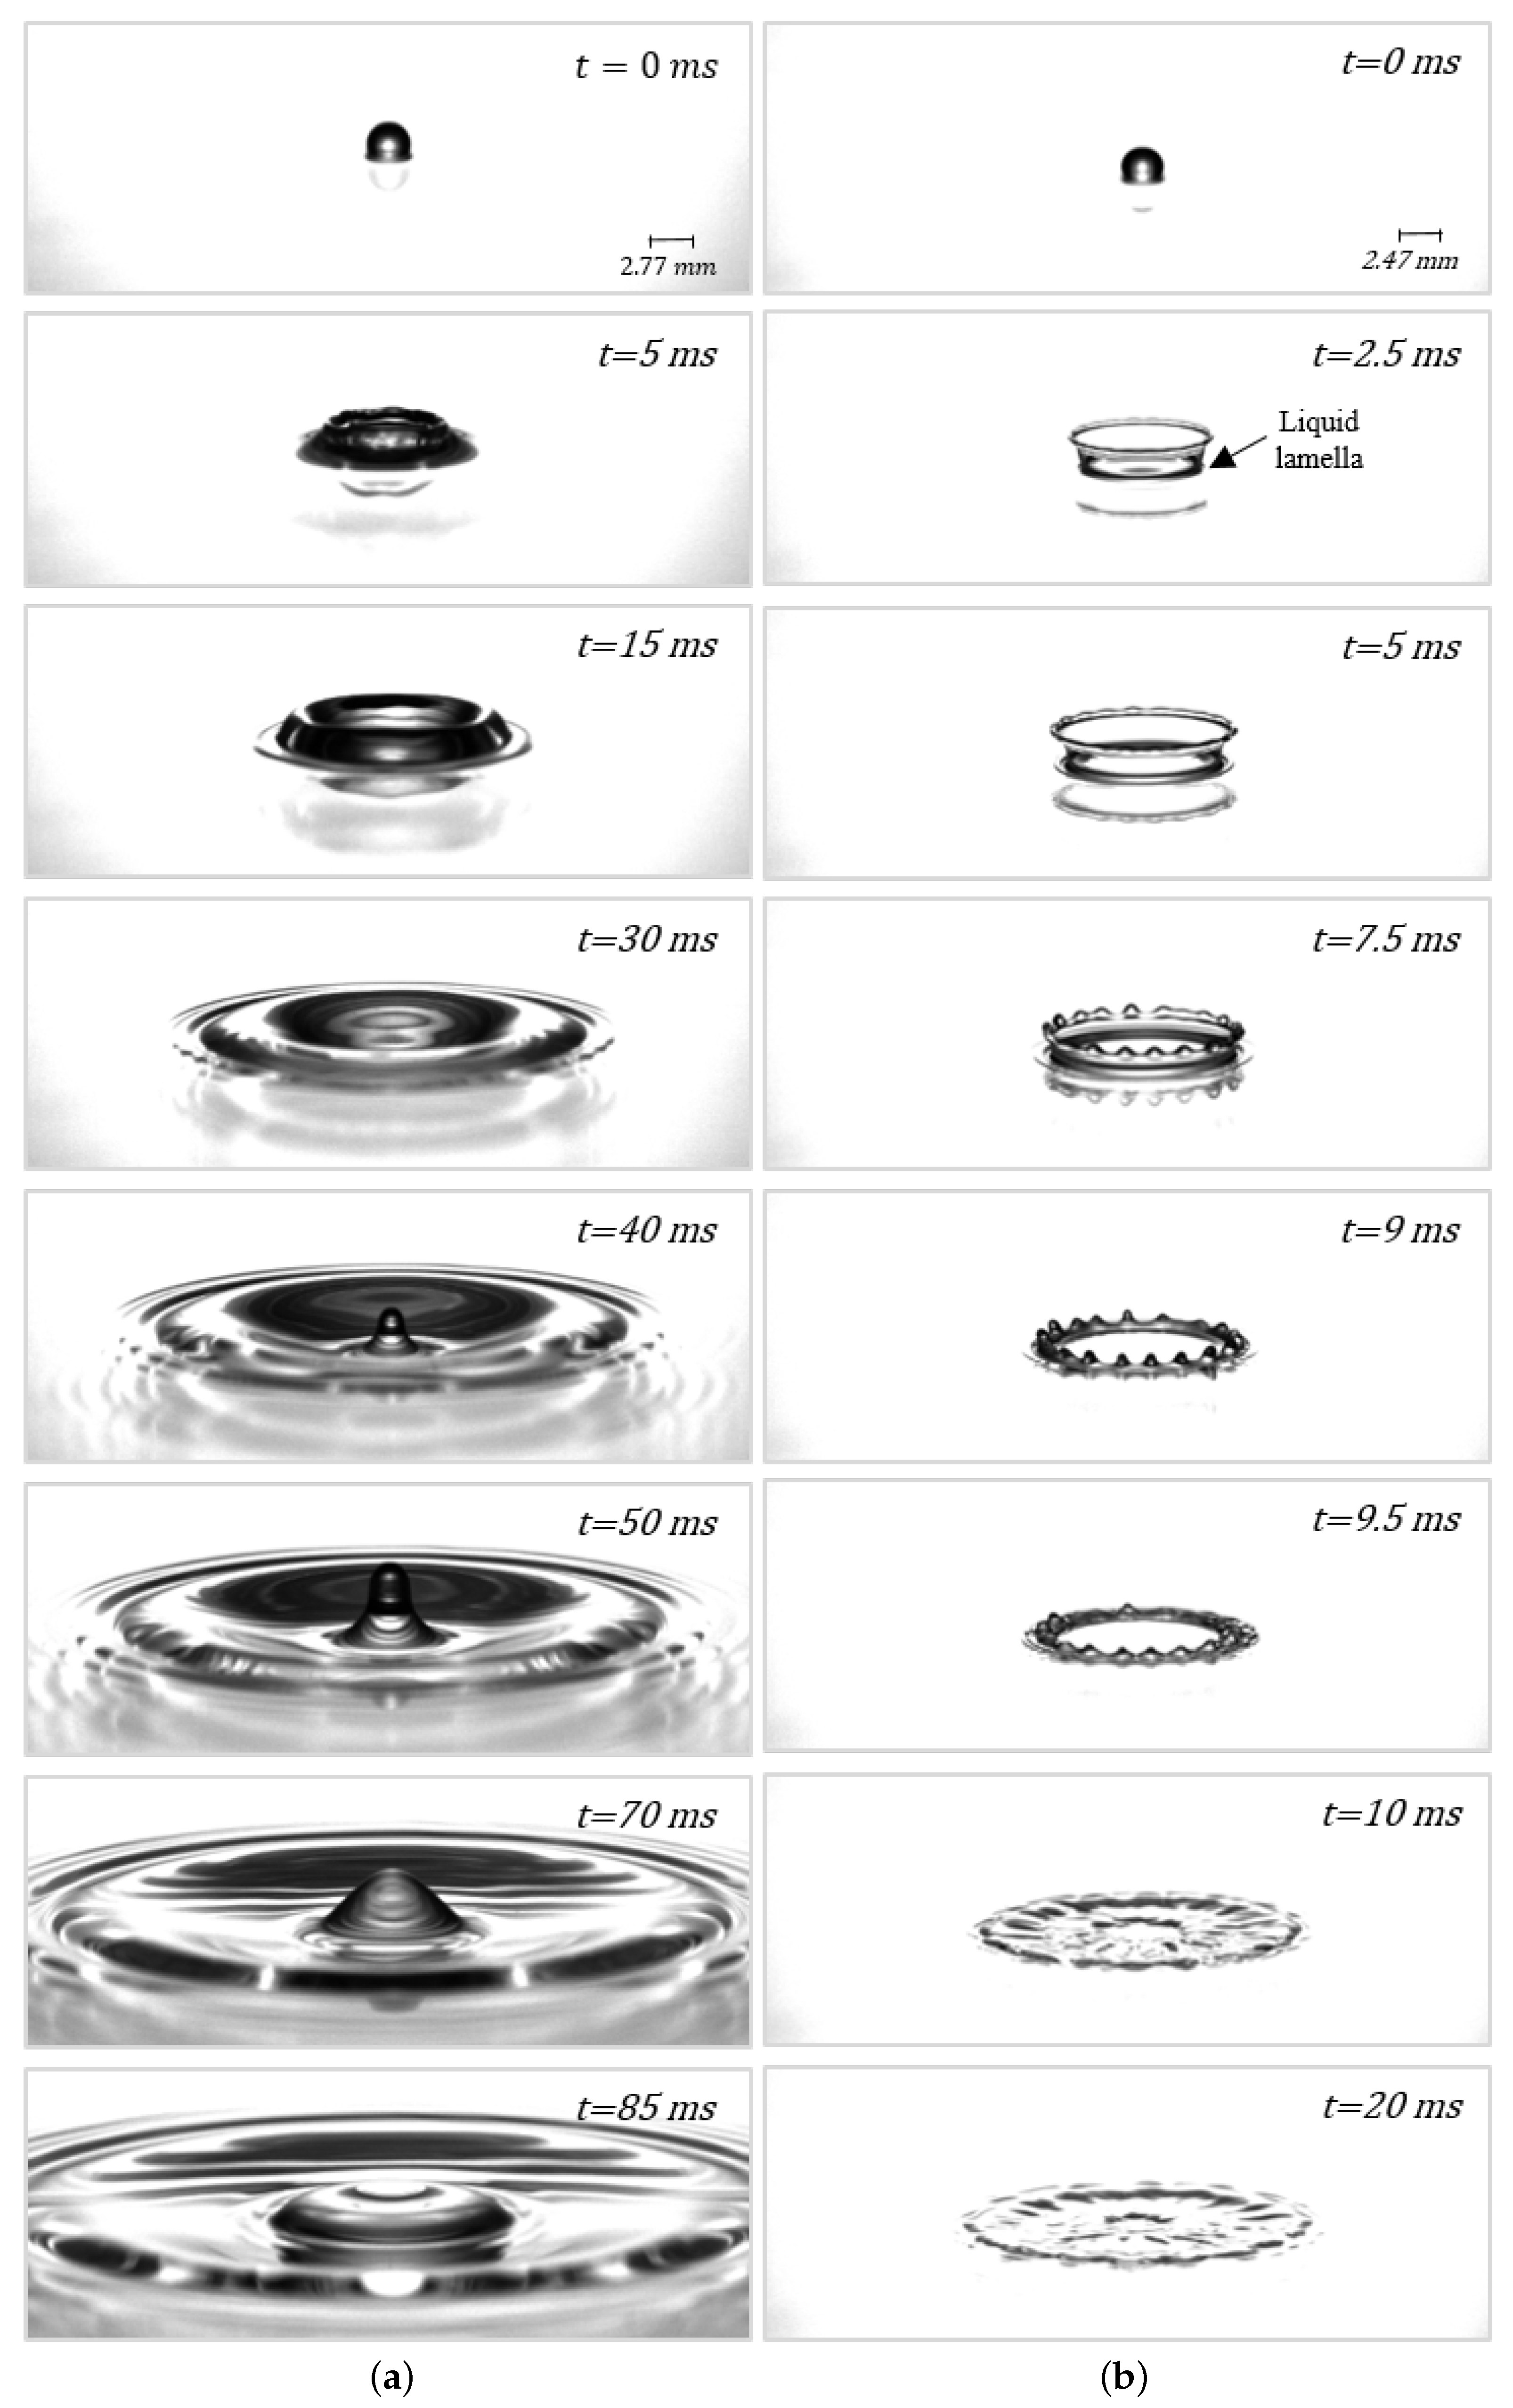
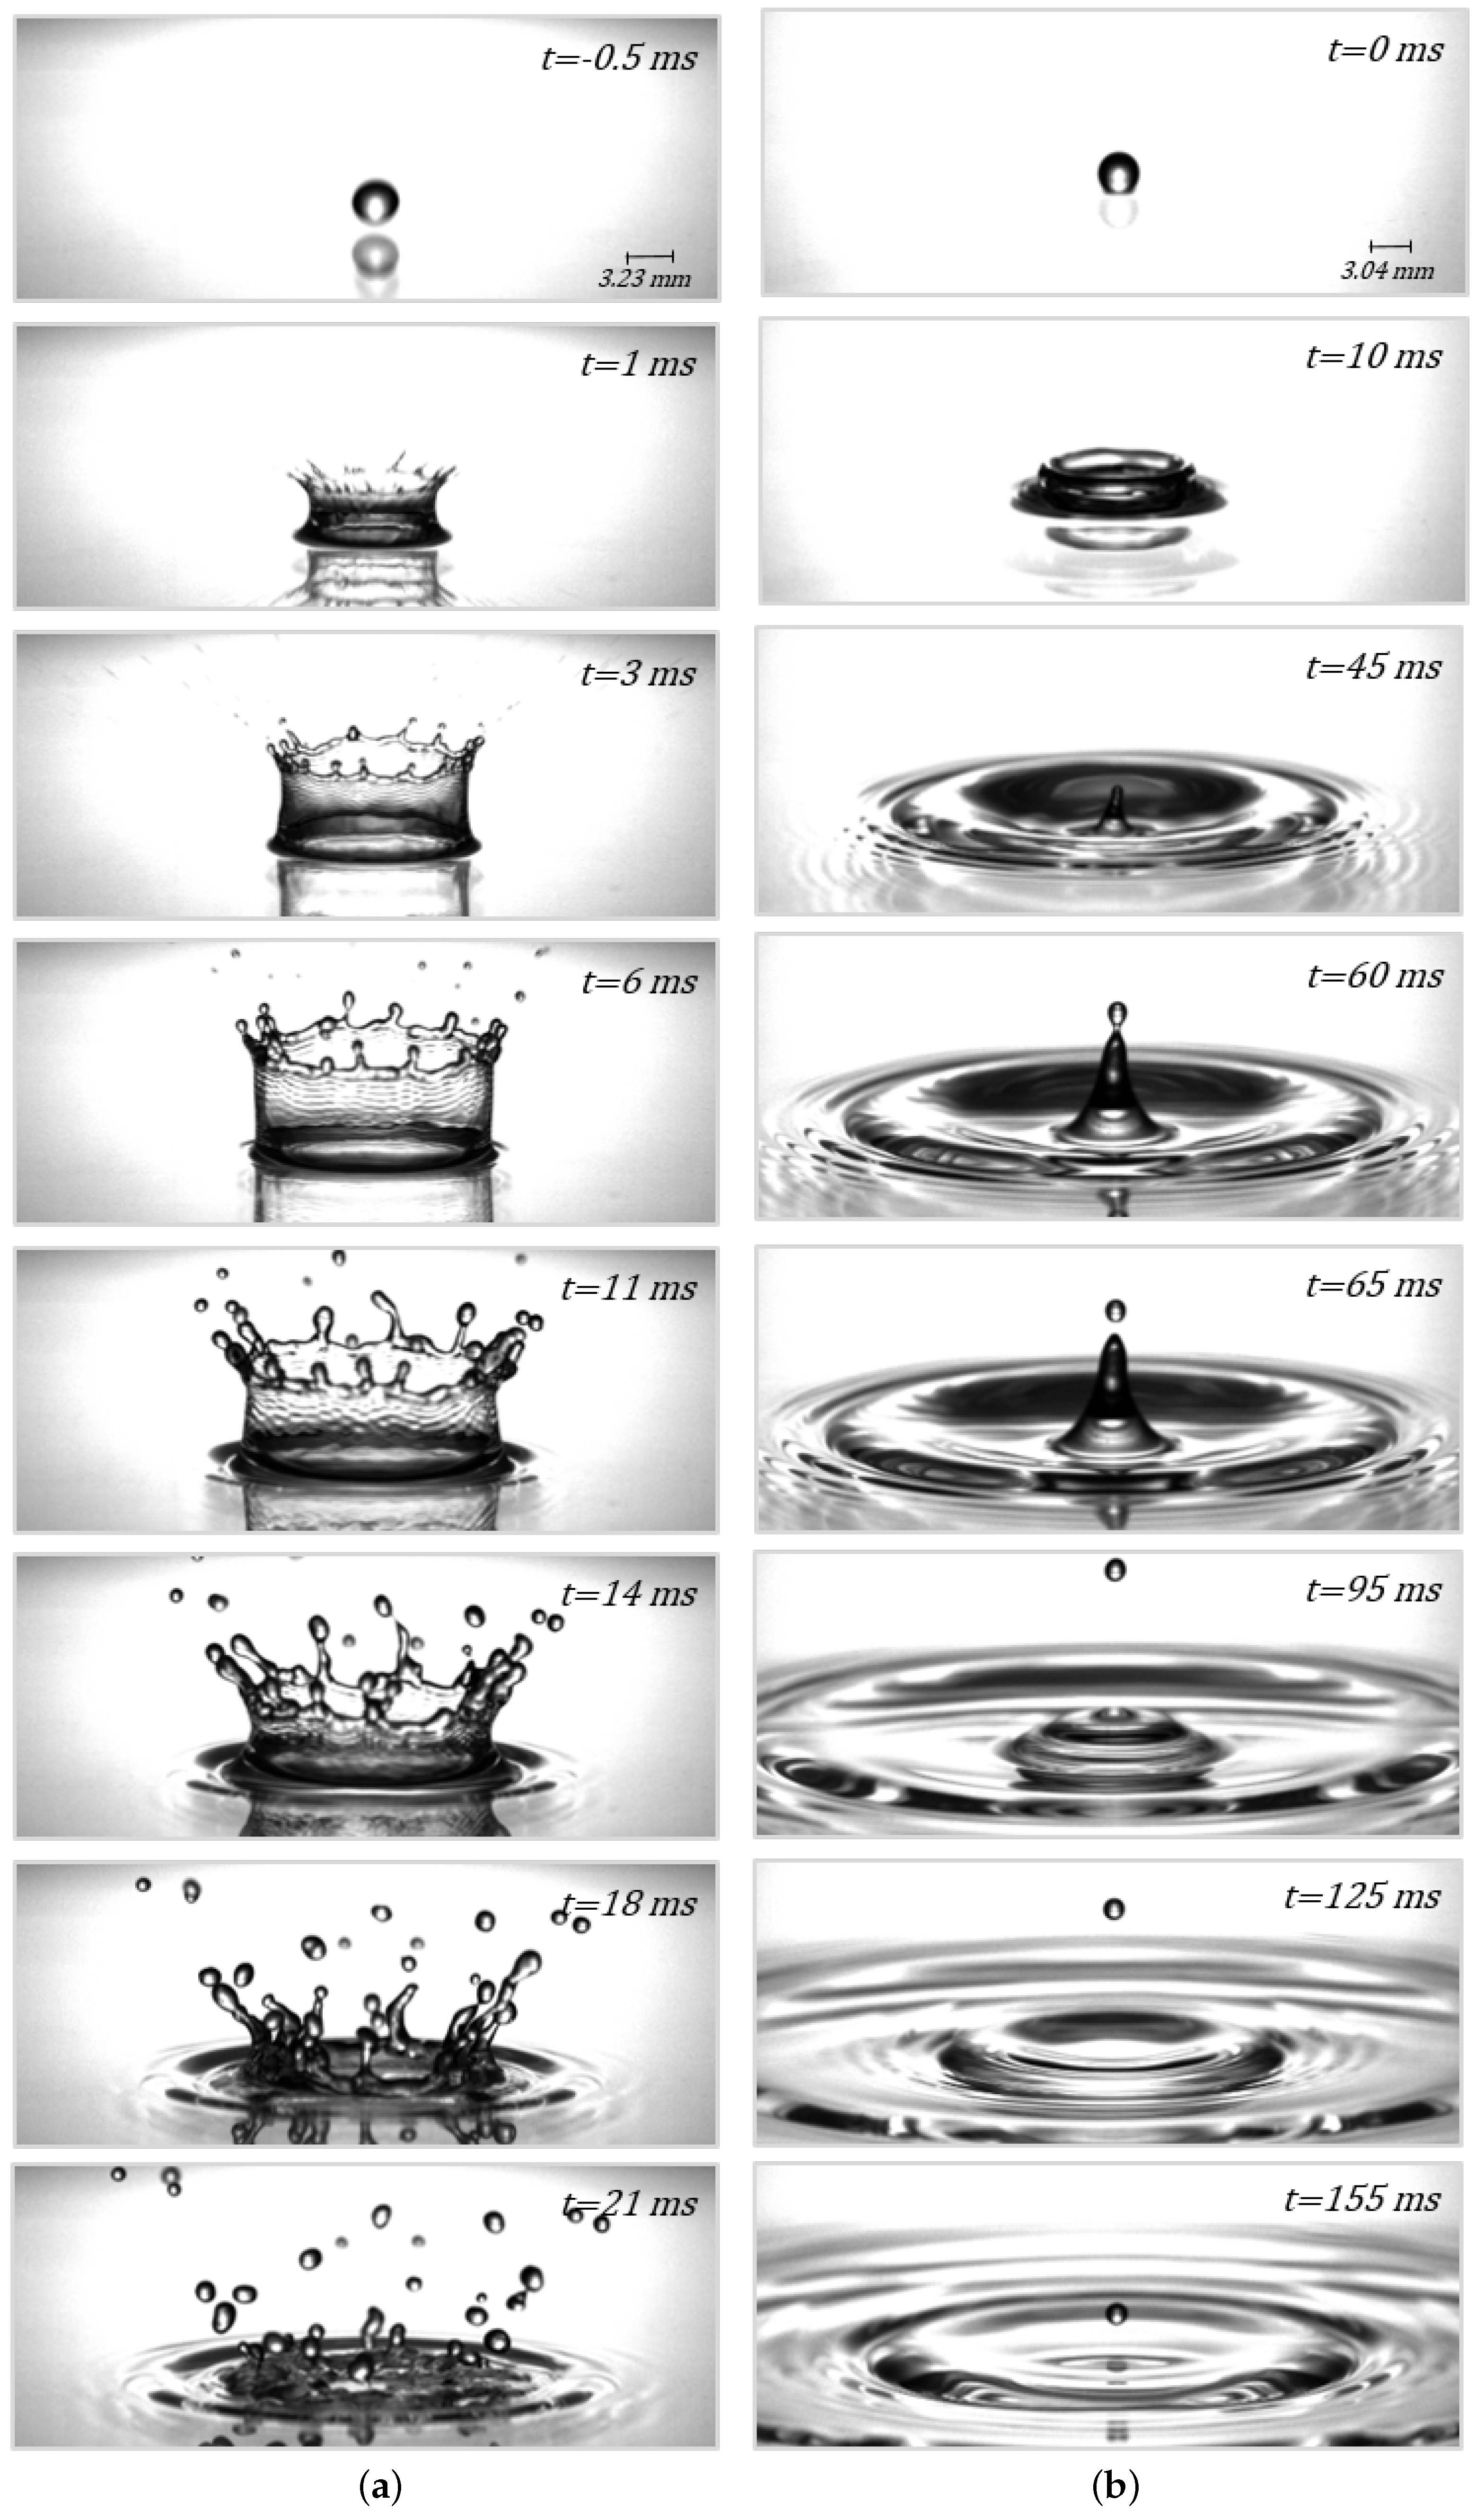
Prompt splash was also spotted (Figure 5) when the impact energy was high enough for the droplet to disintegrate in the first moments after impact. Tiny droplets eject from the liquid lamella periphery while the crown still rises or advances at its baseline. Since the sequence of images corresponds to an impact height of m, the impact velocity is high m/s). Therefore, the moment the droplet impinges onto the liquid, a film appears between subsequent impact frames.
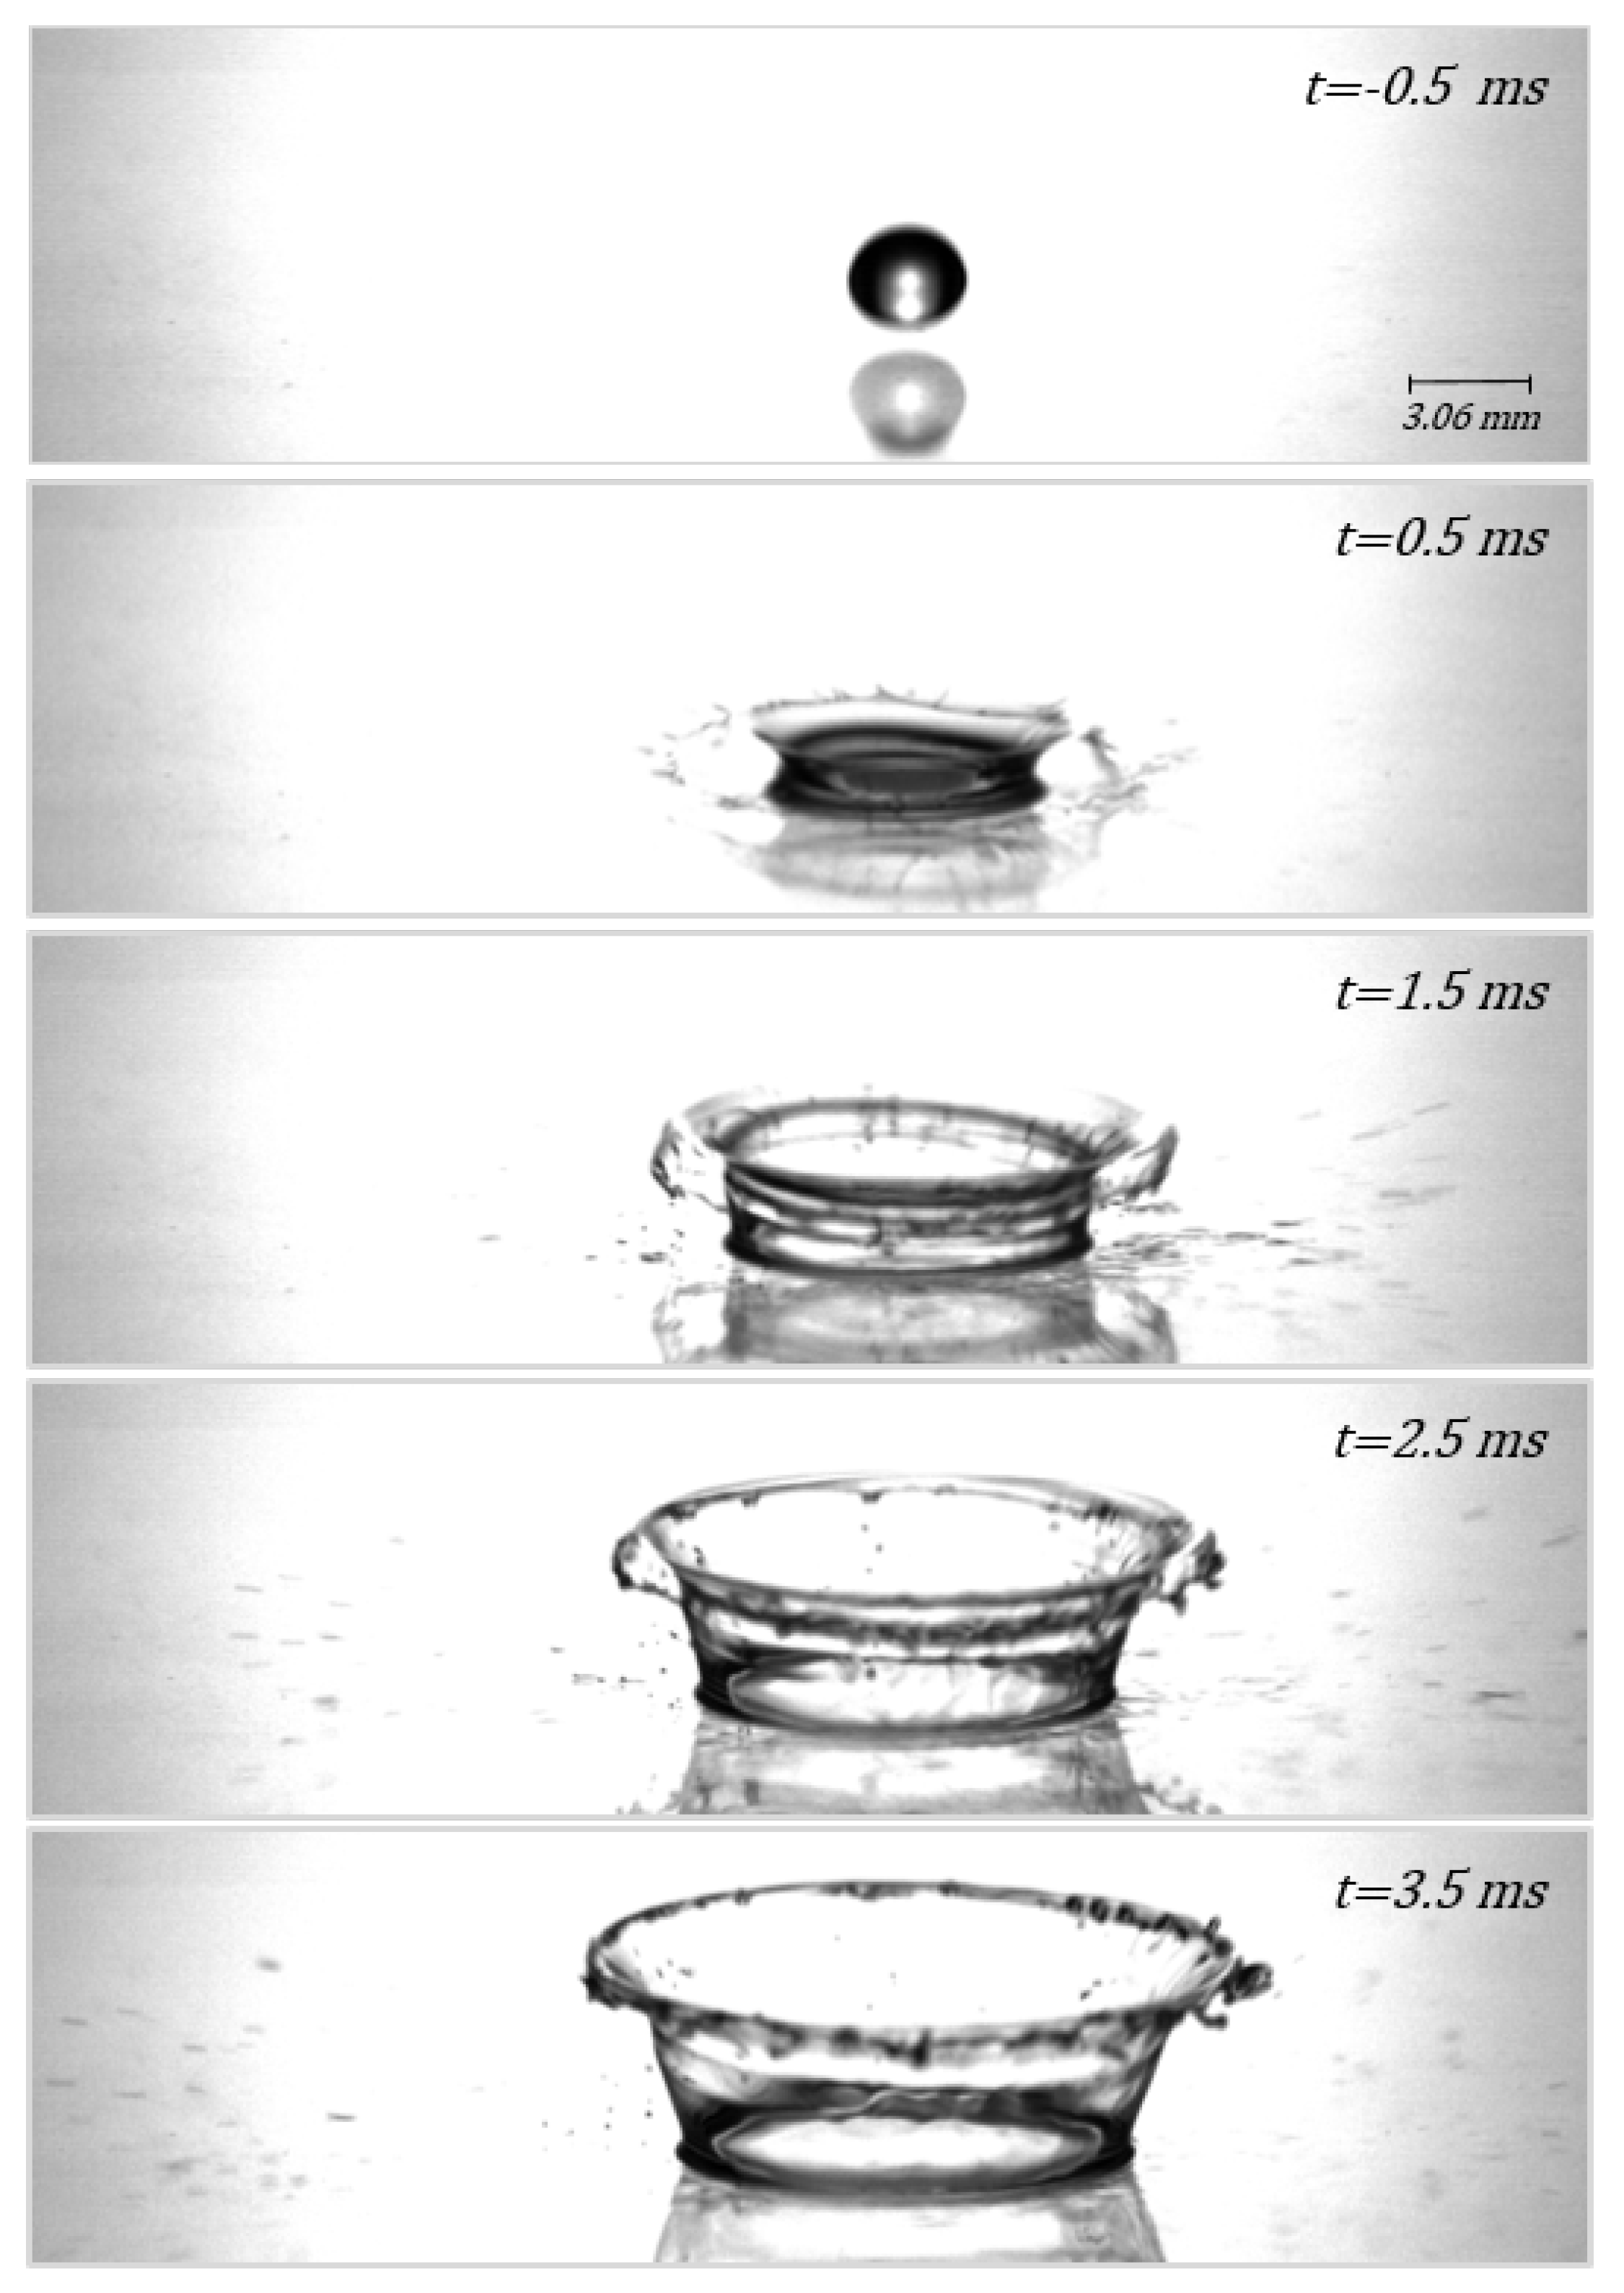
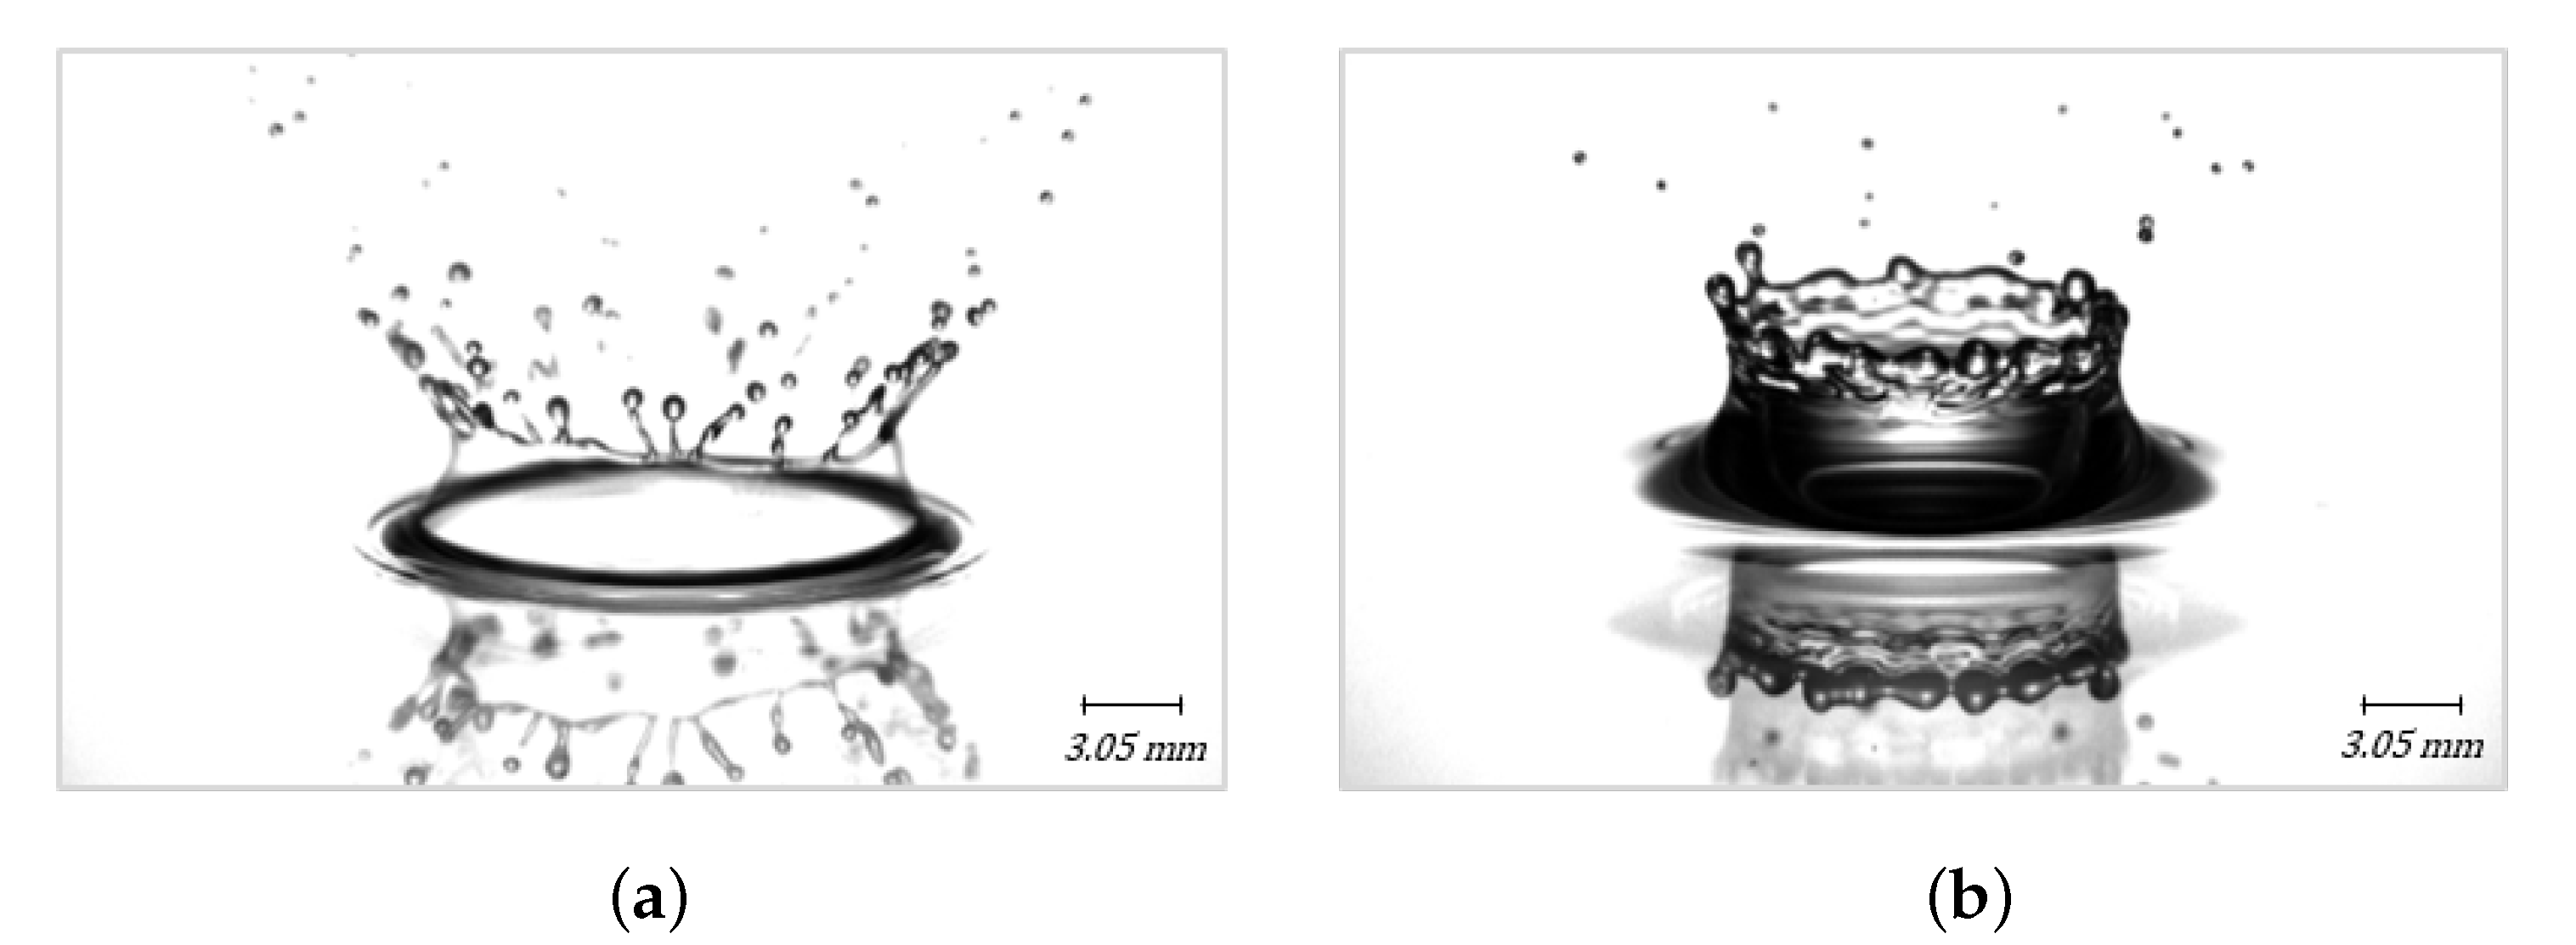
Figure 6 shows two high impact energy events: (a) the crown splash and (b) jetting or rebound. Crown splash occurs after the stage of maximum expansion and encompasses the breakup of the crown sheet and it is a frequent event during impacts of singles droplets with liquid films. In this phenomenon, the impact energy of the droplet impinging in the liquid film generates a momentum transfer to the cylindrical liquid sheet forming an uprising crown ( ms). Considering the timescale of impact measured from the droplet size and velocity, ms, it evidences how inertia dominates the evolution of this hydrodynamic structure. From instabilities in the bounding rim, tiny droplets eject from fingers formed ms after impact. During the crown collapse ( ms), the fingers stretch, and eventually break, generating secondary droplets. This phenomenon produces various sizes of secondary droplets, while prompt splash only produces tiny ones. Shortly after the crown collapse, a vertical extension of fluid (jet) rises from the center of the impact site—a phenomenon identified as jetting, or rebound in the cases where most of the impinging mass detaches from the surface after impact, which occurs more often in dry surfaces. The formation of this central jet was also spotted several times in these experiments, even without crown formation. As visualized on the right sequence in Figure 6, this jet often reaches its maximum height and breaks, ejecting one or more secondary droplets. The occurrence of deposition followed by jetting, as shown in the image sequence, only happened two times in the experiments performed. However, it was recurrently preceded by prompt and crown splash.
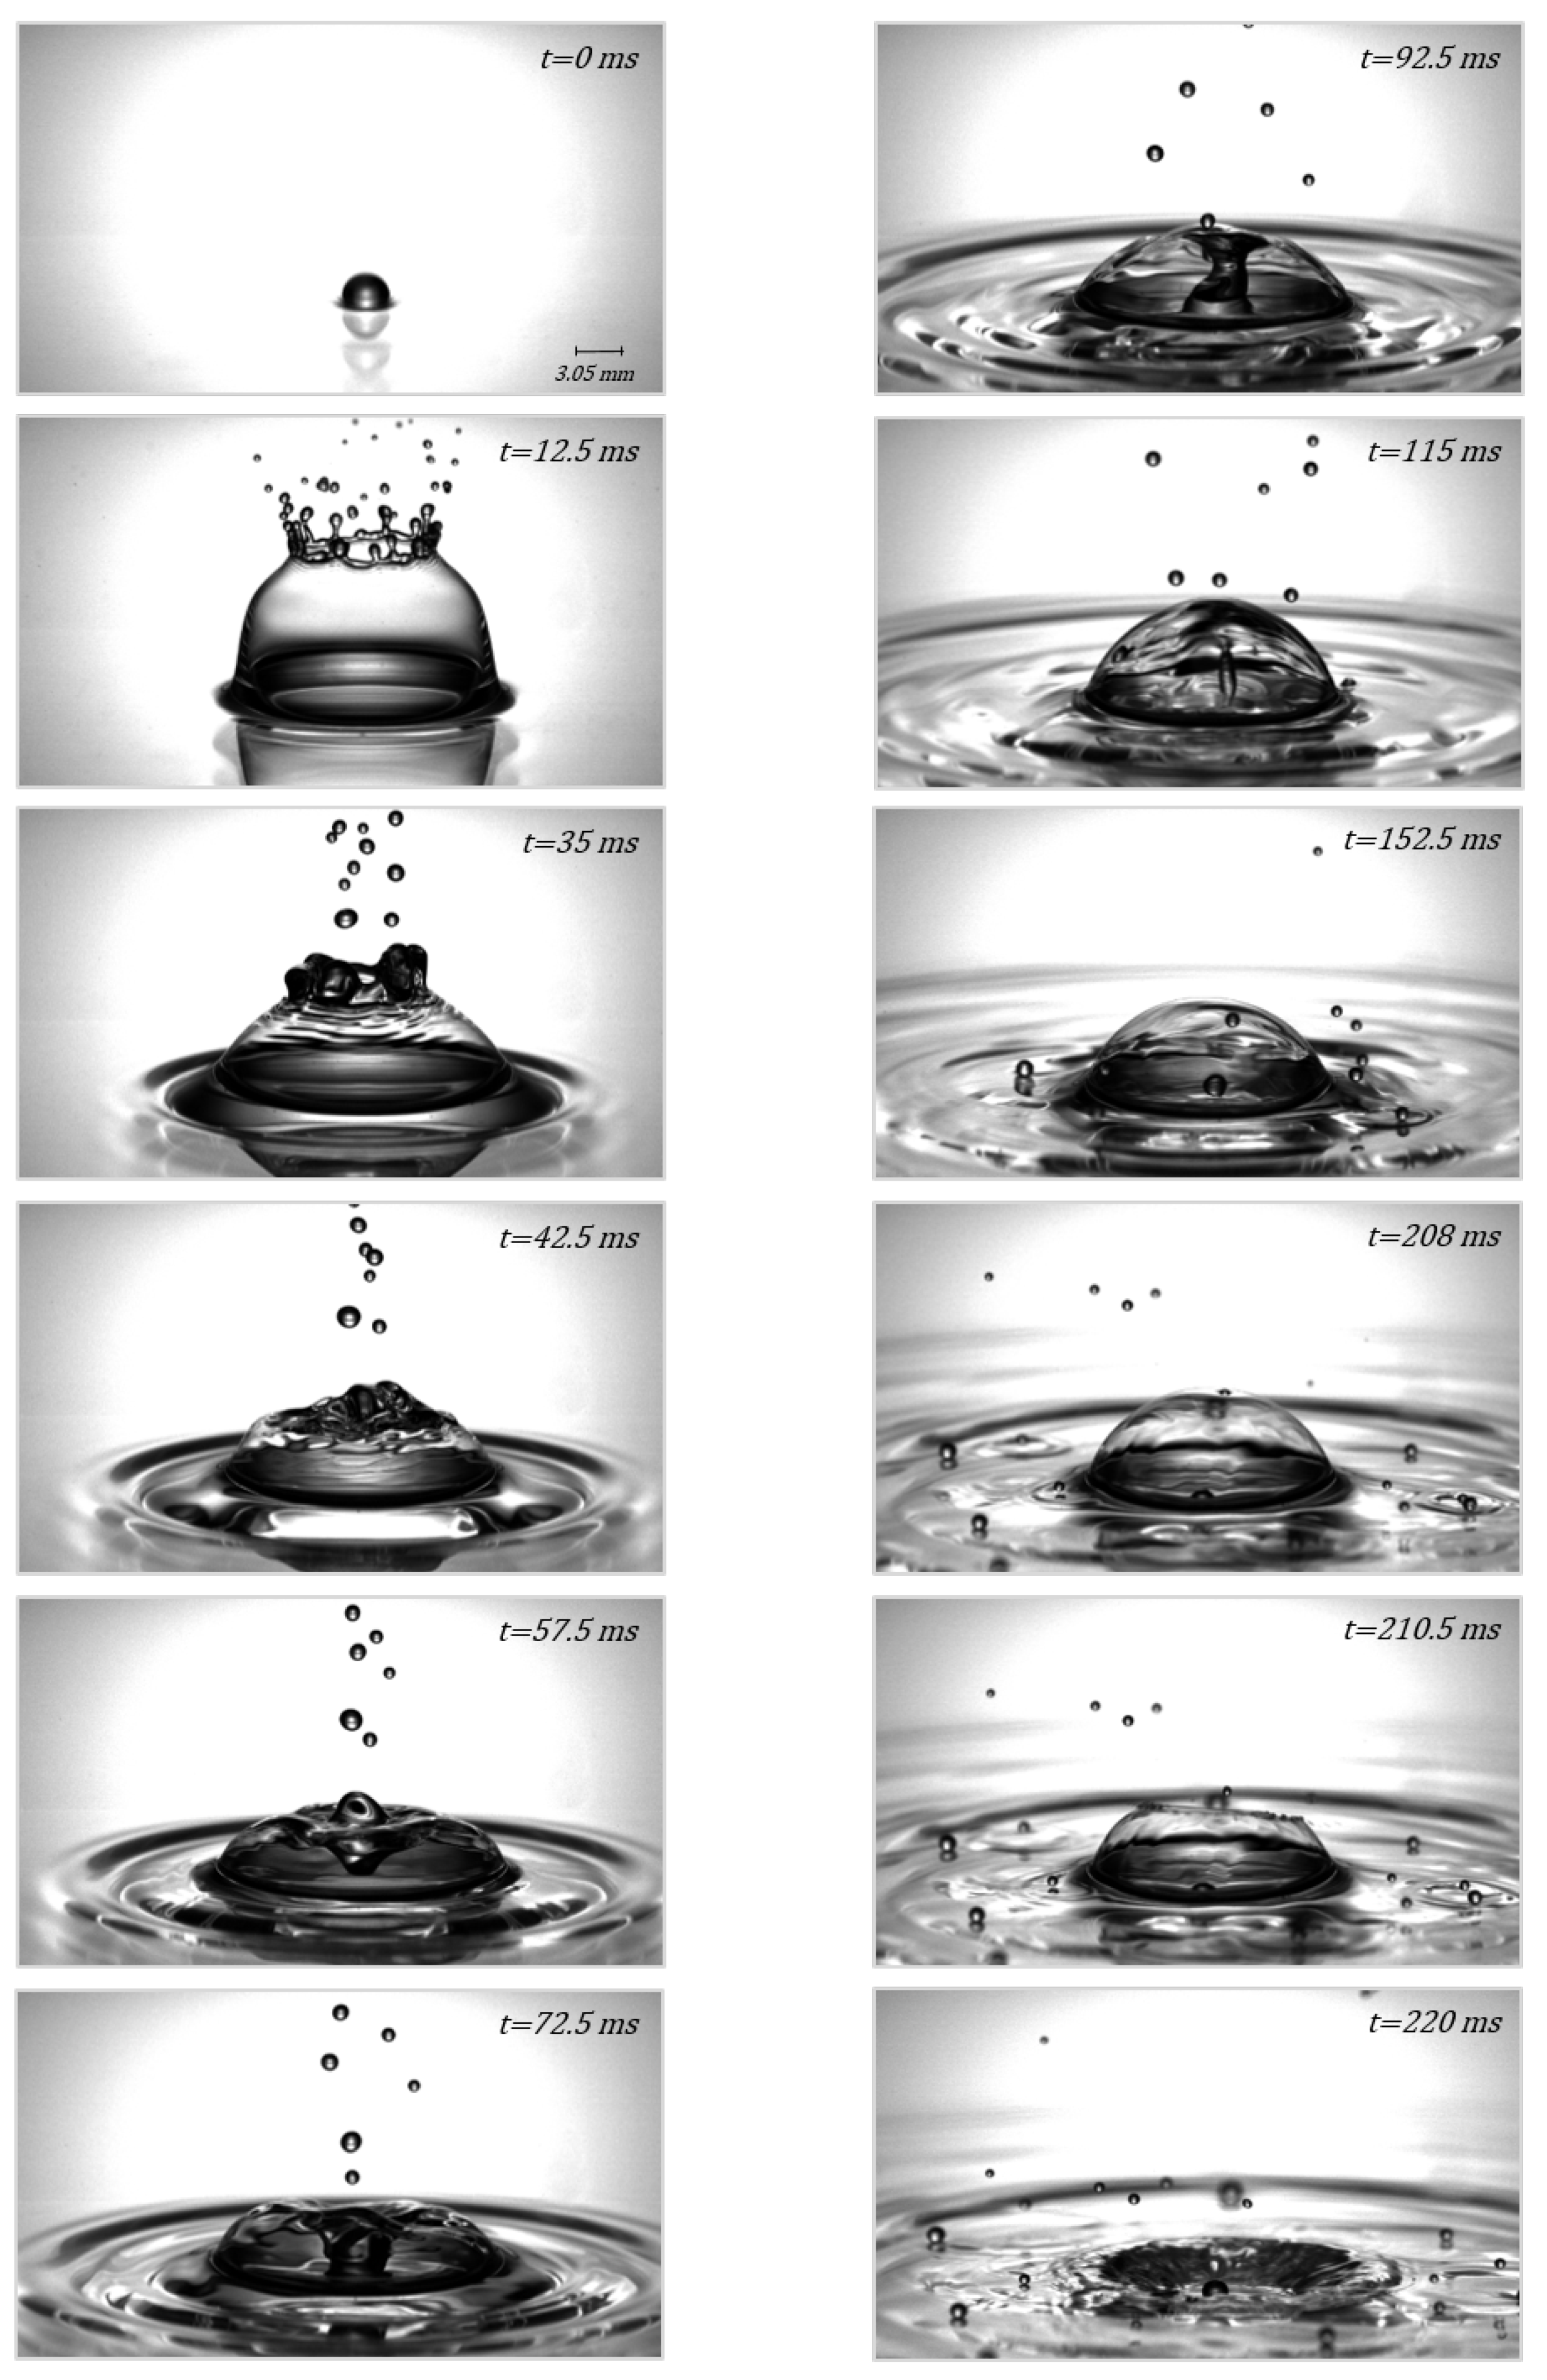
There was only one phenomenon left, the bubble encapsulation (see Figure 7). The occurrence of bubble encapsulation is seldom reported in the literature, and mostly for higher dimensionless thicknesses and impact energies [29,30]. It just occurred for one set of impact conditions. After drop impact, one spots prompt splash, followed by the formation of a very thin and high crown ascending in an almost perfect vertical direction. One observes the ejection of many secondary droplets, and after the crown reaches its maximum height, the base continues to expand, leading to the bending of the crown inwards, closing at the top at ms. Considering the drop impact timescale, this event is several orders of magnitude higher. Later, the closing of the crown forms a dome or a bubble-like structure ( ms). With the crown completely closed, and a downwards jet started forming at the top of the bubble ( ms). A vortex grew downwards and connected to the liquid film ( ms). With time, the vortex became thinner ( ms) and ended up detaching from the dome, forming an encapsulated bubble ( ms). Many secondary droplets impact the bubble until one of them breaks it ( ms). In the remaining frames, it is possible to see the collapse of the bubble.
3.2. Secondary Atomization Mechanisms
Regarding the obtained outcomes, firstly, they were divided into splashing and non-splashing. There were also two cases, corresponding to jetting without the previous production of secondary droplets by splashing, that did not fit this distribution. Some authors argue that jetting alone should be considered as splashing, but others allege that splashing involves the physical separation from the immediate impact site. Taking that into account, in this study, jetting alone was treated as a special outcome. For heights above m, splashing always occurred, but for the lower height ( m), the occurrence of splashing depended on the fluid physical properties, the droplet diameter, and the dimensionless thickness of the liquid film.
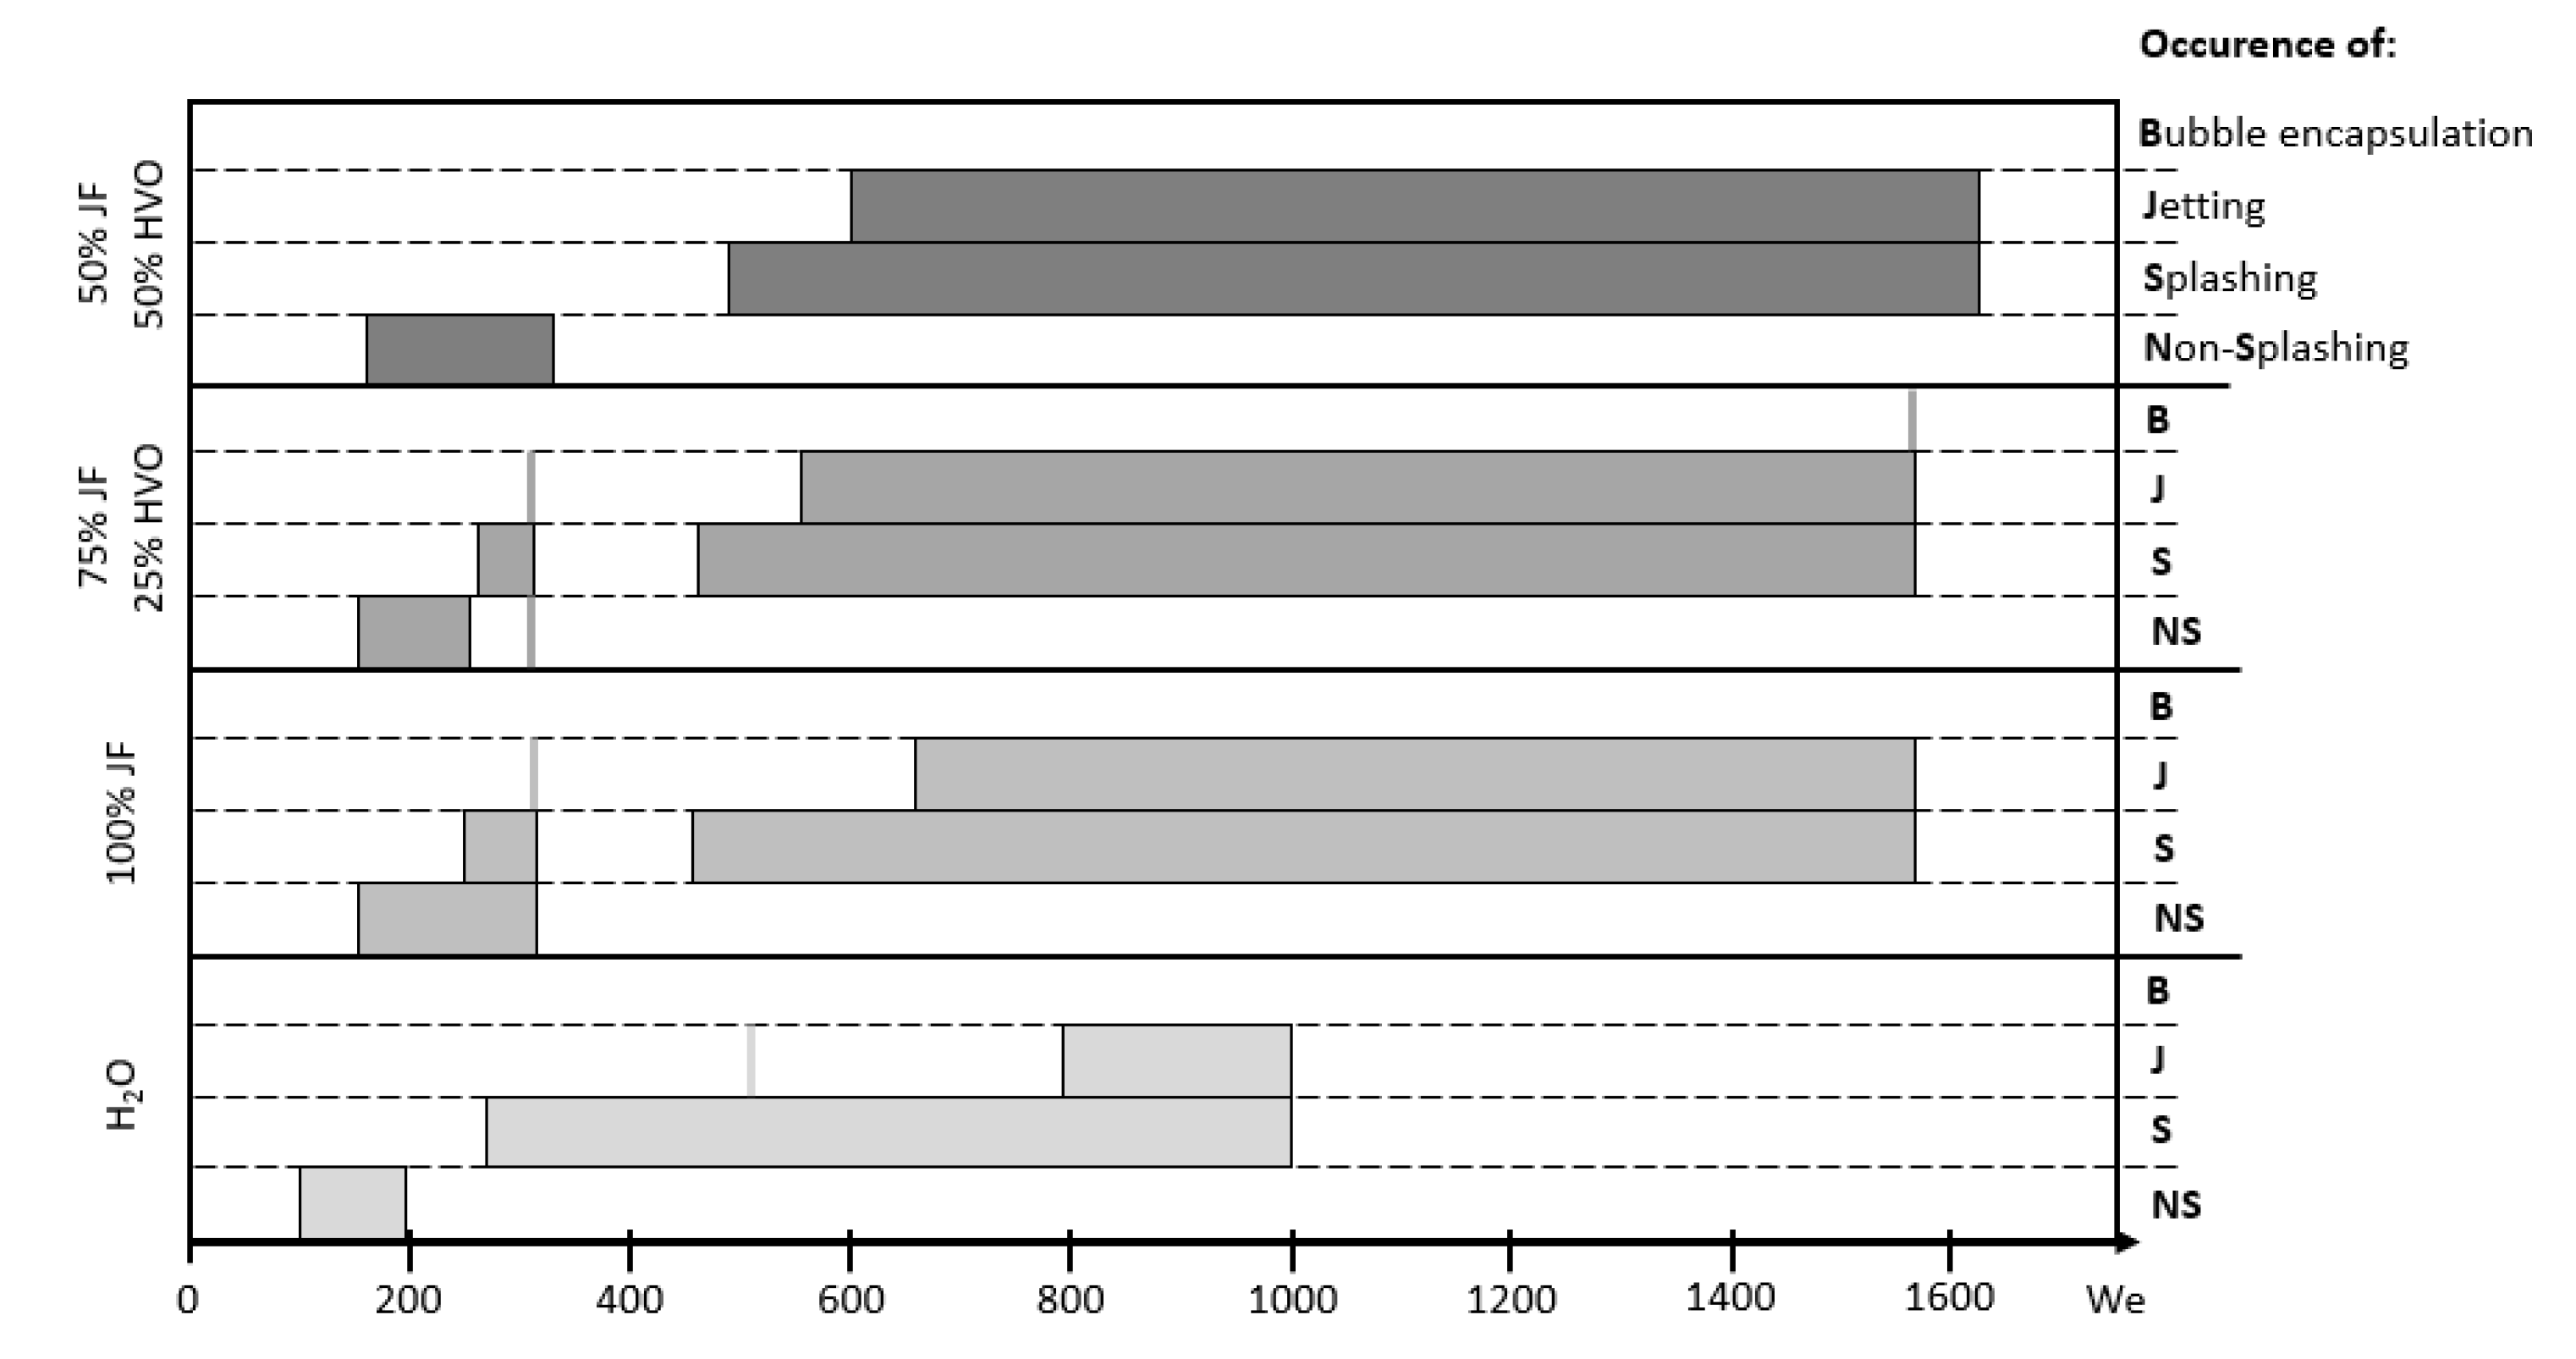
Despite the splashing and non-splashing division, it is relevant to catalog the phenomena observed for all sets of impact conditions, and identify the differences and similarities between them. Due to the wide variety of impact conditions, Figure 8 presents a scheme with the obtained phenomena depending on the fluid and Weber Number. The phenomena were identified by the initials: NS—non-splashing; S—splash; J—jetting; B—bubble encapsulation. It is important to emphasize the qualitative character of the analysis of the visualized impact mechanisms. Therefore, the descriptions focus on the differences between the several cases observed.
For the smaller impact heights (), the outcomes of both HO and 50%/50% mixture droplets did not show splashing for all the impact conditions tested. Therefore, the 50%/50% mixture had formation of fingers at the top of its rim. It was not possible to produce dimensionless liquid films of for HO due to the non-wettable behavior of the system water and perspex. In this way, the thinner liquid film for the HO impacts had higher values than . That fact should not be neglected since the occurrence of splashing is enhanced by thin liquid films [19]. It was also verified that the final spreading diameter is larger for HO, as shown in Figure 9. This supports the assumption that fluids with lower viscosities cause larger final spread diameters [19]. Spreading diameter is clearly influenced by viscosity and its effect increases with time.
For the drop impacts closer to the surface, the 100% JF and the 75%/25% mixture showed splashing, non-splashing, and jetting. The jetting episodes were isolated, as mentioned above, and happened for similar impact conditions, with the ejection of a single large droplet after the breakup of the central jet ( and ). The Jet A-1 exhibited splashing for the three dimensionless thicknesses, while 75% JF/ 25% HVO did not for . Considering the cases where splashing occurred, crown splashing was the only phenomenon spotted for the droplet impingement upon the thinner liquid films. The secondary droplets produced by prompt splashing are likely to be smaller than the image resolution for a proper characterization. For the impact upon liquid films with = 0.5, only prompt splash, or prompt and crown splashing combined were identified, and the secondary droplets were smaller than in the previous case. In the impact with the thicker liquid films (), only one set of conditions produced secondary atomization (100% JF and mm) through prompt and crown splash, with the ejection of few and tiny droplets.
For the middle impact height tested ( m), splashing was always an observed outcome. Crown splashing and jetting occurred for all the fluids and the two mixtures resulted in prompt splash. Moreover, the impact upon thin liquid films produced crown splashing for a set of impact conditions and for all fluids. It was possible to identify some behaviors such as the increase of crown thickness with the increase of dimensionless thickness of the liquid film (Figure 10) and with the decrease of viscosity (Figure 11). The crown thickness also increased when the droplet diameter decreased, widely noticeable for HO. It seemed that the impact of smaller droplets enhanced the number of splashed products. However, only quantitative measurement could confirm these assumptions. Furthermore, for all impact conditions considered in the experiments, splashing always occurred. This confirms that all Weber numbers obtained for this middle height were equal or superior to the critical Weber number setting the onset of splash. For the highest impact distance, the behavior was similar to the observed for the middle height, with crown splashing occurring for all impact conditions, and a few cases resulted in jetting for all the fluids. Bubble encapsulation was once spotted for the 75%/25% mixture. Similarly to , prompt splashing was only spotted for the mixtures. The assumptions made for the middle height () were also spotted for the highest impact (). One of the major differences in the outcomes observed with was the larger amount and size of ejected secondary droplets.
3.3. How Accurate Are Transition Criteria?
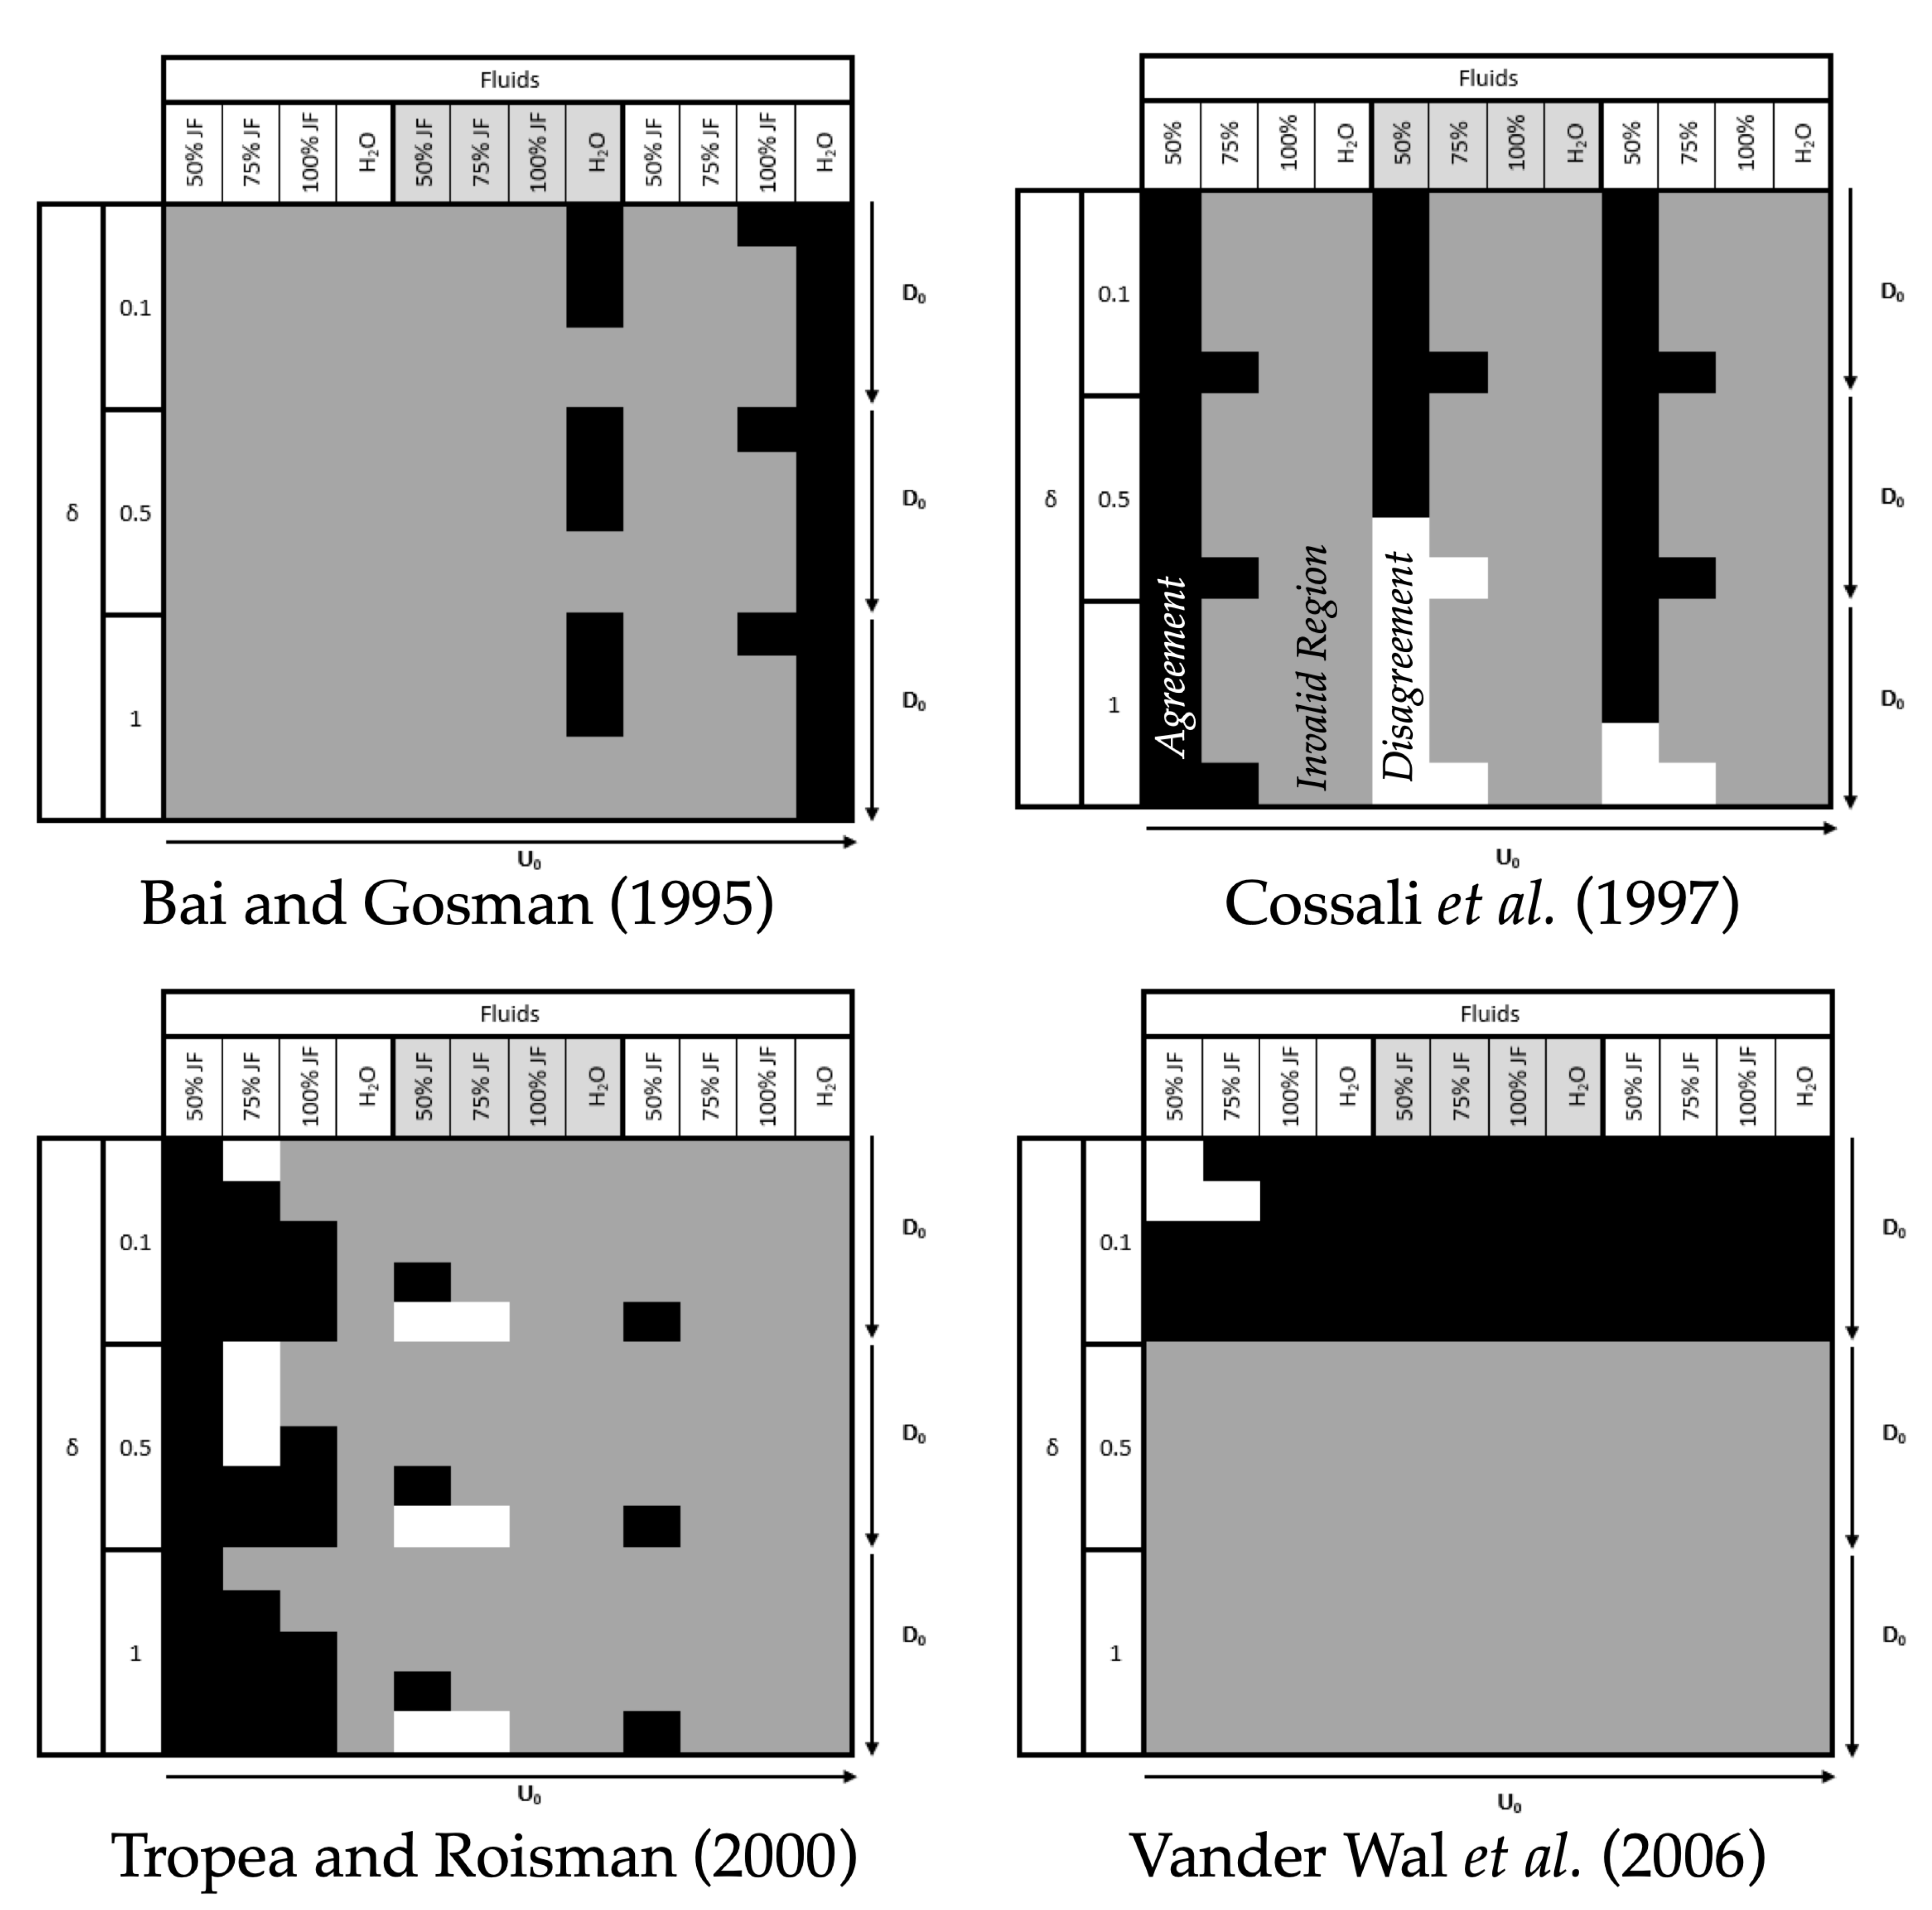
In an attempt to assure the universality of these empirical correlations establishing a boundary between the spreading and splashing regimes for a single droplet impact upon a wetted surface, the phenomena obtained in these experimental results were compared with the phenomena predicted by these transition criteria. The validation ranges were carefully applied to the results obtained and Figure 12 shows info-graphics identifying the accuracy of the different transition criteria in comparison to the experimental results. In these graphs, the impact conditions are identified, being the fuel mixtures described by its concentration of jet fuel. The increase of droplet initial diameter () and droplet impact velocity () are established by the arrows. The agreement of the experimental results and the criteria were described by a color scheme. Black represents the cases where the phenomena obtained experimentally agree with the criteria, white displays the cases where the phenomena obtained experimentally do not agree with the predicted outcome, and grey defines the cases outside the validation range of empirical correlations.
The validation range of the Bai and Gosman [4] empirical correlation for sorting the splash event, fits a small part of our data. Namely, it predicts the outcome of pure water and 100% jet fuel, agreeing 100% with the results obtained experimentally.
The transition criterion proposed by Cossali et al. [5] is the only one that considers the influence of the liquid film thickness. Additionally, the experimental data used to define this correlation include experiments with a wide range of liquid film thicknesses. Similar to the previous criterion, it only fits part of our data. The outcomes of both fuel mixtures can be predicted by this correlation. Considering all the cases within the validation range, 78% are correctly predicted by the criterion, failing mainly for the higher liquid film thicknesses.
The Tropea and Roisman [6] empirical correlation considered includes a random element in the determination of the mass ratio. This value was assumed as and compared to the experiments within its validation rate. The only fluid that can not be predicted by this correlation is HO. This criterion predicts correctly 80% of the cases. It failed only for the higher droplet diameters for 75% JF–25% HVO and the smaller impact velocities, and for the smaller diameters of both mixtures with the increase of the impact velocity. However, for the higher impact velocity, all cases within the validation range fit the same result as the criterion predicts.
The final transition criterion of Vander Wal et al. [7] is the most recent and it was defined using experiments of single droplets impinging only on thin liquid films. Therefore, it only fits our experiments for the thinner dimensionless liquid film thickness (). The criterion predicts 95% of the experiments correctly. It only failed on the larger diameters for the fuel mixtures for the lower impact velocities.
If we restrict the use of these correlations to their validation range, the criterion that better predicts the outcome of drop impact on wetted surfaces, with the fuels and alternative fuels used in the experiments, is the one formulated by Bai and Gosman [4] because it fitted 100% of the experimental results obtained. Both Cossali et al. [5] and Tropea and Roisman [6] have a similar prediction accuracy. The criterion defined by Cossali et al. [5] is the only one that considers the influence of the liquid film thickness, yet, its prediction capability decreases for higher Reynolds numbers and high dimensionless film thicknesses. Finally, Vander Wal et al. [7] focus its boundary on thin liquid films. Its accuracy is high, failing only for the larger droplet diameters for both mixtures. As follows, the assumption that a liquid film behaves as a very rough surface is, in fact, valid and Vander Wal et al. [7]’s correlation should include a range of dimensionless thicknesses in order to universalize the criterion.
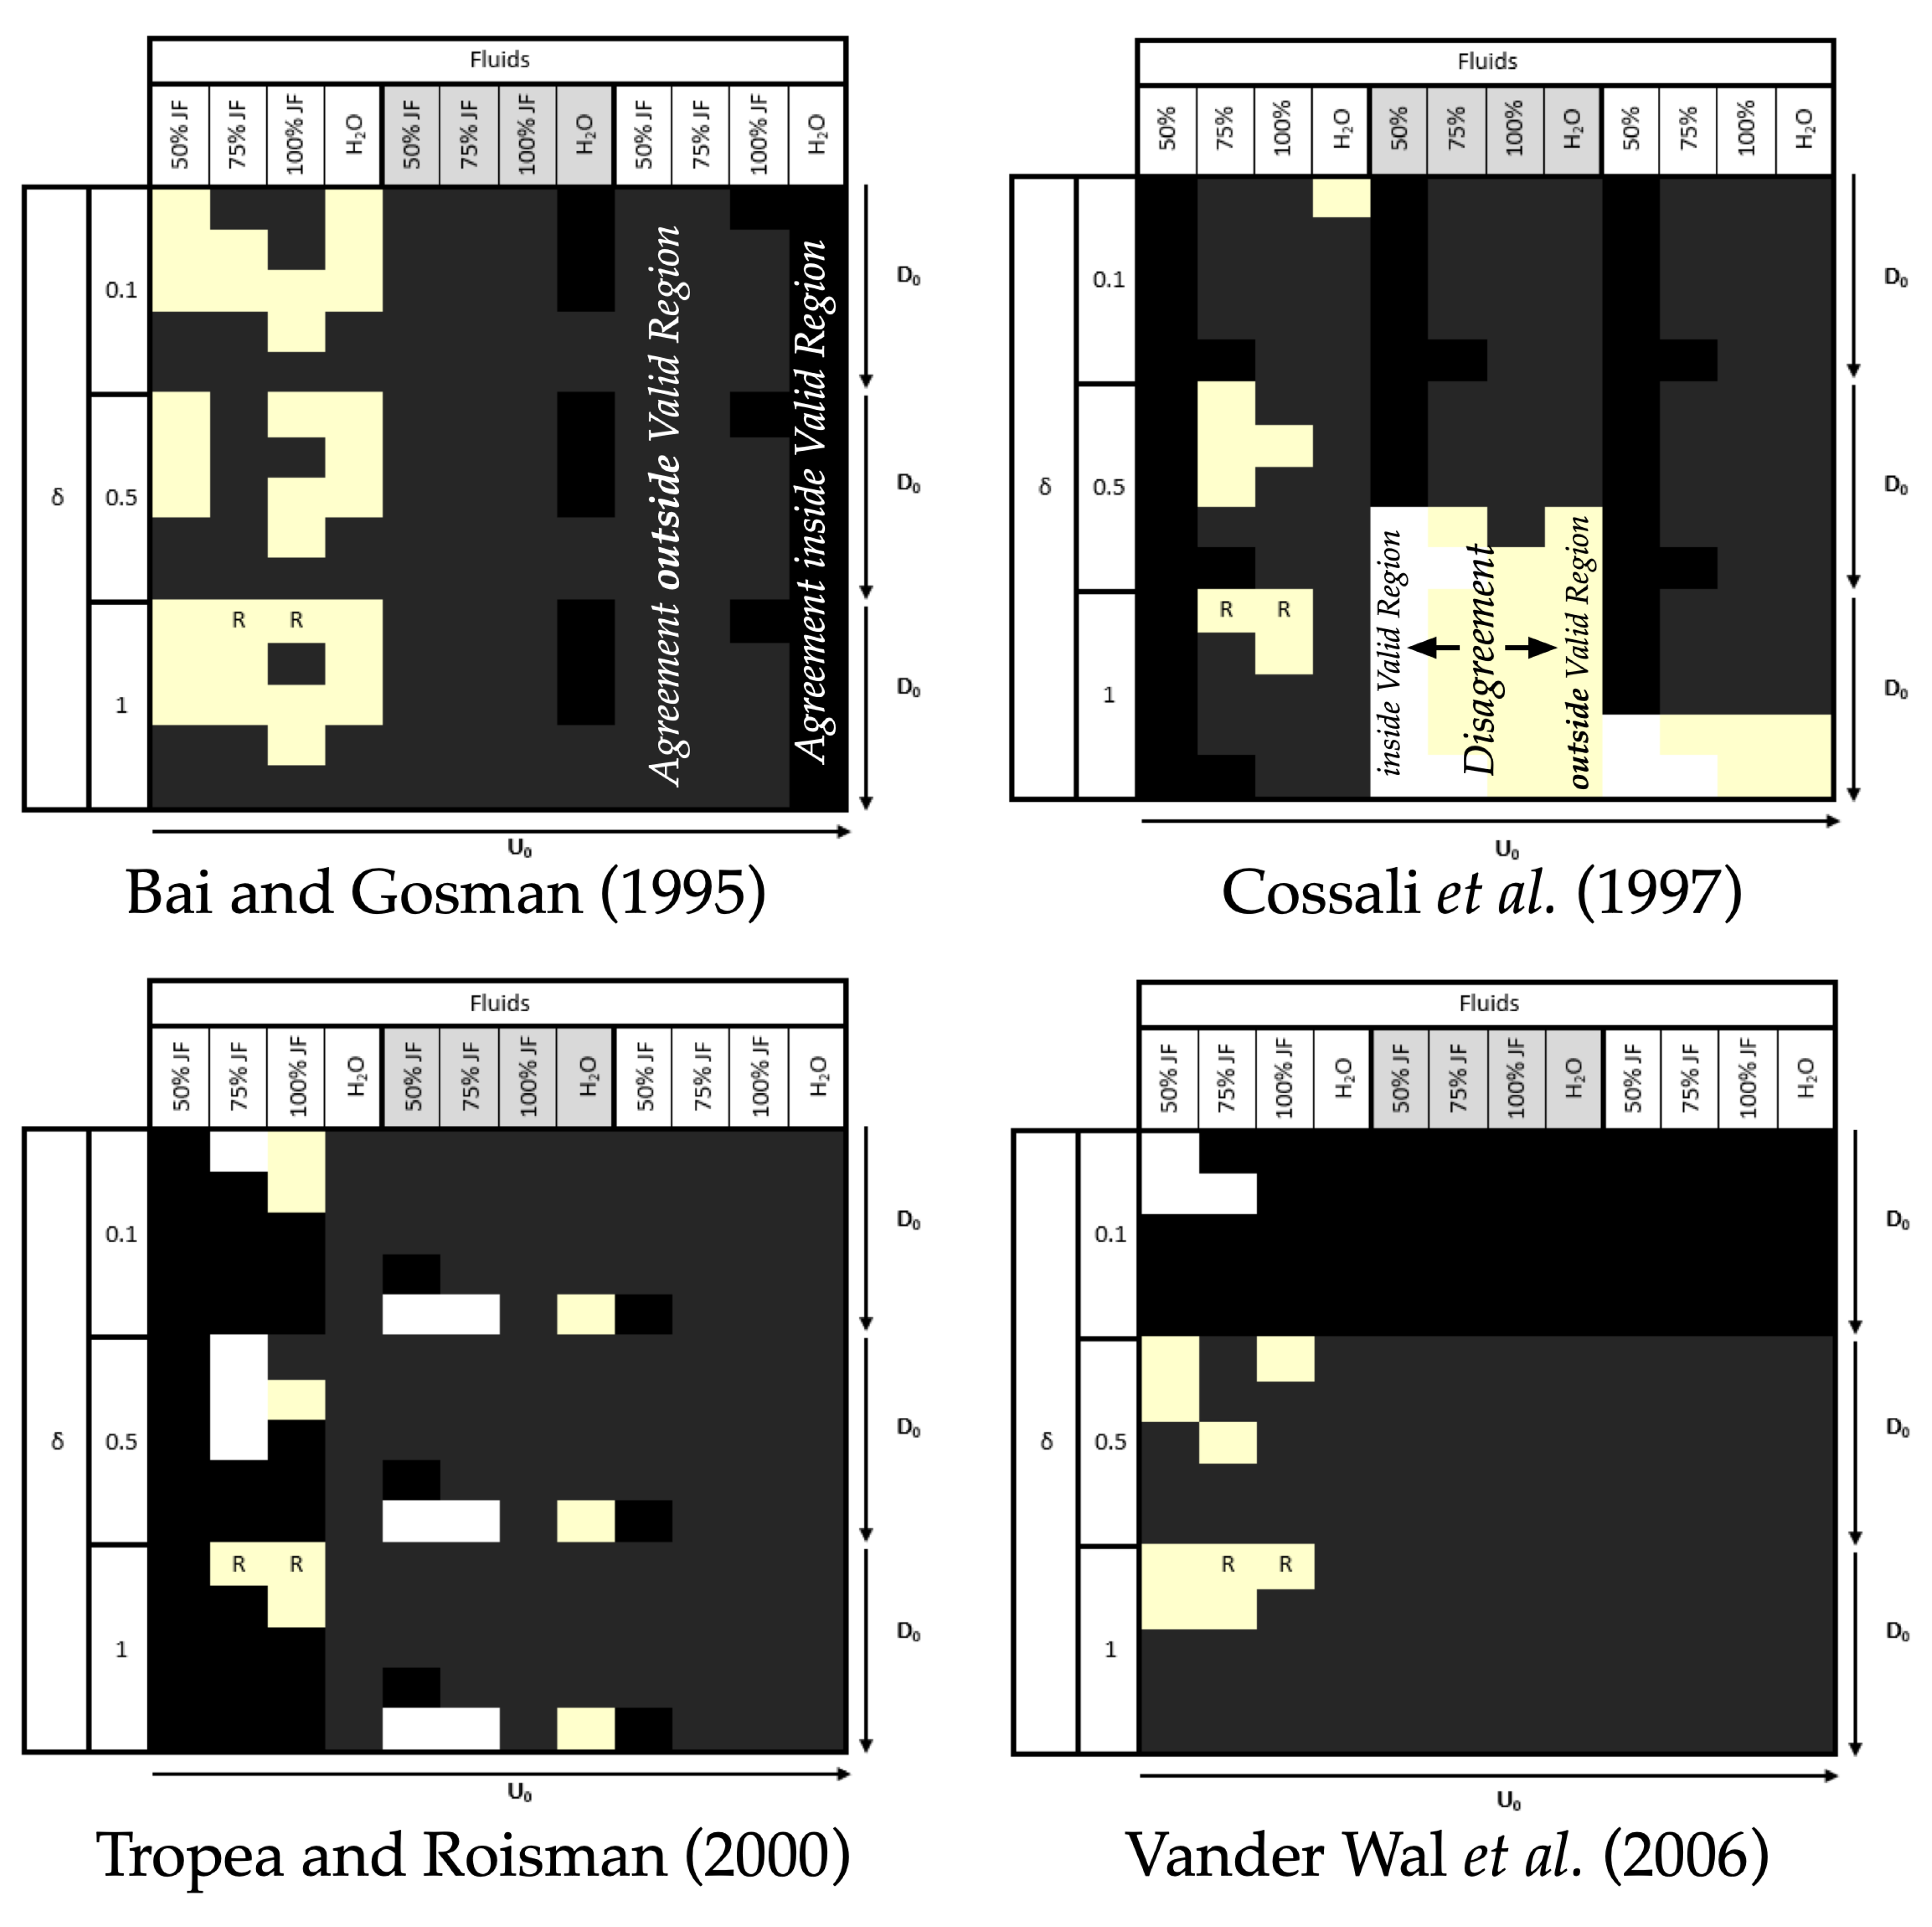
However, one may question how far can we extrapolate these transition criteria to assess their universally? The dimensionless numbers in the criteria allow the use of empirical correlations in completely different impact conditions. Considering this, Figure 13 shows an info-graphic identifying the results when extrapolating the different transition criteria to explore their outcome in regions outside their validation domain. Similarly to the last figure, the impact conditions are identified, and, the increase of droplet initial diameter () and droplet impact velocity (), established by the arrows.
The agreement of the experimental results and the criteria were described by a new color scheme. Black represents the cases where the phenomena obtained experimentally agree with the criteria within the validation range, white displays the cases where the phenomena obtained experimentally do not agree with the predicted outcome within the validation range, grey defines the cases where the phenomena obtained experimentally agree with the criteria outside the validation range, and beige represents the cases where the phenomena obtained experimentally do not agree with the predicted outcome outside the validation range. There were also two cases identified with an "R", which means rebound. Since the phenomena obtained were different from the ones predicted by the criteria the authors decided to identify it differently.
Now, considering all the experimental data, the fitting of the criteria changed significantly. The criterion proposed by Bai and Gosman [4] predicts correctly 83% of the data. This shows that the efficiency of the correlation decreases significantly for data out of the validation range. Cossali et al. [5] predict accurately 74% of the results. Its prediction decrease but not substantially. This criterion fits better droplet impacts with thinner liquid films. However, it should fit equally all thicknesses since it is the only one that considers the influence of the liquid film thickness.
Tropea and Roisman [6] show good agreement for higher Weber numbers and fits correctly 89% of the cases. In this case, the prediction capability increased for values outside the validation range. Finally, Vander Wal et al. [7] shows a great agreement for higher impact velocities. This is the criterion that better predicts the outcomes of our experiments, fitting 93% of the cases correctly.
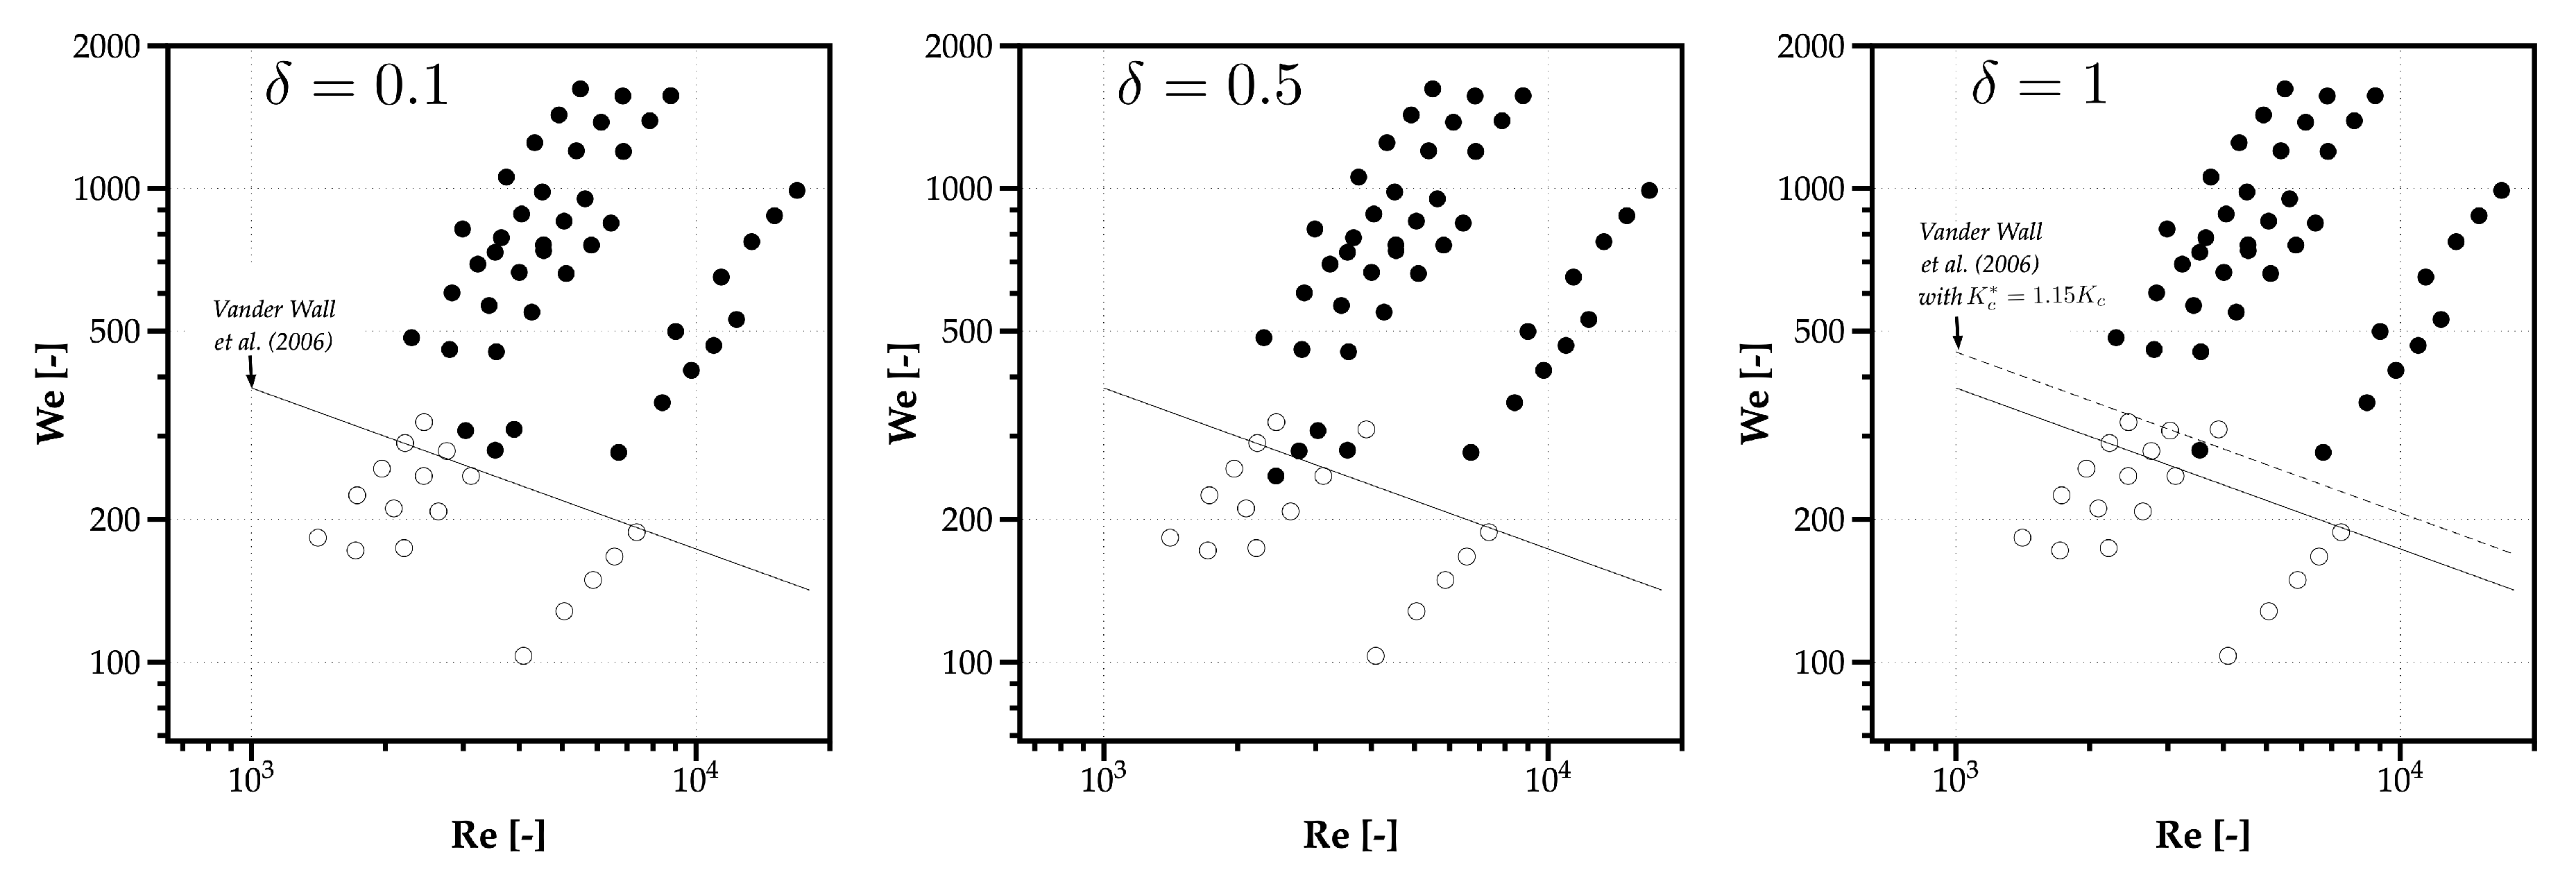
The final assessment from the new info-graphic is favorable to the Vander Wal et al. [7] correlation as the one with the greater universality, being able to predict correctly cases outside its validation range. What is so special about Vander Wal et al. [7] criterion? It proved to be a universal criterion, but it does not even account for the influence of the liquid film thickness. If we consider the insight of the Cossali et al. [5] correlation regarding the influence of the dimensionless liquid film, as plotted earlier in Figure 2, thicker films lead to a shift in the curve to higher Weber numbers, since the energy required for generating splashing events is higher. Assuming the same principal in the experiments performed by Vander Wal et al. [7], one can expect that more experiments with thicker films might lead to similar results. Figure 14 plots the experimental results obtained in the present work and the Vander Wal et al. [7] empirical correlation. If , and proportional to it, even if in a nonlinear way, an increase of while keeping constant the logarithmic slope, should improve the prediction of the splashing transition. Thus, with , a test on a 15% increase of validates this hypothesis. However, it also points to the need for more experimental research to refine the criterion.
4. Conclusions
One of the fields of research that affect the performance of the combustion process in aero-engines is the impact of a spray on solid surfaces. After impact, the spray can form a liquid film that alters the transition criteria between the outcomes of impact. Moreover, with the growing interest in using alternative fuels, which mix standard fuels with biofuels, one may question whether the existing criteria between drop impact mechanisms remain valid.
The goal of this experimental study is to review the empirical models for drop impact onto liquid films, identify the morphological structures for the drop impact on wetted surfaces of a standard Jet Fuel (JF), and mixing it with NExBTL, with water experiments as reference. Particular relevance is given to the transition to splashing with the production of droplets by secondary atomization. The morphological analysis focus on the influence of the parameters involved in the dynamic behavior of the droplet, such as the fluid physical properties, the droplet diameter and impact velocity, and the relative thickness of the liquid film. Finally, the image analysis of the outcome of drop impact is useful to evaluate the universality of empirical correlations for predicting the splashing transition, considering dimensionless film thicknesses of –1.
The experimental results evidenced the different outcomes, the clear influences of the fluid’s physical properties, and the effect of the liquid film thickness (normalized by the diameter of the impacting droplet) on the hydrodynamic mechanisms developing after impact. The high-speed images showed changes in the size and number of splashed products with the relative thickness of the liquid film and the impact energy. Images also captured the particular morphological event of bubble encapsulation for liquid films with small thicknesses. The effect of the liquid film on the crown thickness and height evolution was similar to the results reported by other authors. Overall, the behaviors induced in the hydrodynamic mechanisms after drop impact for the 100% JF and the 75%/25% mixture (JF+NExBTL) were very similar; the major differences were observed for the 50%/50% mixture, due to its viscosity. For this fluid none event of splashing was observed for the thinner liquid film ().
Finally, the phenomenon obtained for each set of impact conditions was compared with the prediction of four criteria establishing the spreading/splashing transition. Their universality was tested and Vander Wal et al. [7] proved to produce the greatest agreement considering all the experimental conditions within and outside its validation domain. The reason is likely the influence of the dimensionless film thickness, similar to the correlation of Cossali et al. [5], but with a different nonlinear effect on the transition criteria .
Author Contributions
Conceptualization, D.F.S.R., A.R.R.S., and M.R.O.P.; methodology, D.F.S.R. and A.R.R.S.; formal analysis, D.F.S.R., A.R.R.S., and M.R.O.P.; data curation, D.F.S.R. and M.R.O.P.; writing—original draft preparation, D.R. and M.R.O.P.; writing—review and editing, D.F.S.R., A.R.R.S., and M.R.O.P.; visualization, D.F.S.R.; supervision, A.R.R.S.; funding acquisition, A.R.R.S. All authors have read and agreed to the published version of the manuscript.
Funding
The present work was performed under the scope of Laboratório Associado em Energia Transportes e Aeronáutica (LAETA)—activities, and it was supported by Fundação para a Ciência e a Tecnologia (FCT) through the projects UID/EMS/50022/2019 and UIDB/50022/2020, and the grant sponsored by Fundação para a Ciência e a Tecnologia SFRH/BD/140009/2018.
Acknowledgments
The authors would like to acknowledge Mário Costa for all the support he gave to this work. His passing was unexpected and we would like to dedicate him this article as a homage to his memory.
Conflicts of Interest
The authors declare no conflict of interest.
Abbreviations
The following abbreviations are used in this manuscript:
| ASTM | American Society for Testing and Materials |
| fps | Frames per Second |
| HEFA | Hydroprocessed Esters and Fatty Acids |
| HVO | Hydroprocessed Vegetable Oil |
| JF | Jet Fuel |
| NExBTL | Neste Renewable Diesel |
Appendix A. Experimental Conditions

Table A1.
The relative thickness of the thinner liquid films for HO.
| [mm] | |
|---|---|
| 1.50 | 0.22 |
| 0.84 | 0.24 |
| 0.51 | 0.27 |
| 0.25 | 0.31 |
| 0.10 | 0.39 |
Table A2.
Droplet diameters.
| [mm] | [mm] | [mm] | [mm] | [mm] |
|---|---|---|---|---|
| 1.50 | 4.03 | 3.04 | 3.05 | 3.06 |
| 0.84 | 3.61 | 2.76 | 2.77 | 2.78 |
| 0.51 | 3.23 | 2.44 | 2.47 | 2.47 |
| 0.25 | 2.80 | 2.07 | 2.12 | 2.18 |
| 0.10 | 2.27 | 1.73 | 1.74 | 1.78 |
Table A3.
Impact velocities.
| [mm] | |||||
|---|---|---|---|---|---|
| 100% JF | 75% JF / 25% HVO | 50% JF / 50% HVO | |||
| 1.50 | 1.83 | 1.80 | 1.80 | 1.81 | |
| 0.84 | 1.83 | 1.80 | 1.80 | 1.80 | |
| 0.51 | 1.82 | 1.79 | 1.79 | 1.80 | |
| 0.25 | 1.81 | 1.79 | 1.79 | 1.79 | |
| 0.10 | 1.81 | 1.79 | 1.78 | 1.79 | |
| 1.50 | 3.07 | 2.97 | 2.99 | 3.00 | |
| 0.84 | 3.05 | 2.96 | 2.97 | 2.97 | |
| 0.51 | 3.04 | 2.93 | 2.94 | 2.95 | |
| 0.25 | 3.02 | 2.90 | 2.93 | 2.93 | |
| 0.10 | 2.96 | 2.88 | 2.90 | 2.91 | |
| 1.50 | 4.21 | 4.05 | 4.06 | 4.06 | |
| 0.84 | 4.18 | 4.00 | 4.00 | 4.00 | |
| 0.51 | 4.15 | 3.95 | 3.96 | 3.96 | |
| 0.25 | 4.09 | 3.83 | 3.86 | 3.89 | |
| 0.10 | 3.98 | 3.68 | 3.68 | 3.78 | |
References
- Rioboo, R.; Tropea, C.; Marengo, M. Outcomes from a drop impact on solid surfaces. At. Sprays 2001, 11, 155–166. [Google Scholar] [CrossRef]
- Chandra, S.; Avedisian, C. On the collision of a droplet with a solid surface. Proc. R. Soc. Lond. Ser. A Math. Phys. Sci. 1991, 432, 13–41. [Google Scholar] [CrossRef]
- Rioboo, R.; Marengo, M.; Cossali, G.; Tropea, C. Comparison of drop impact: Dry and wetted cases. In Proceedings of the 16th International Conference On Liquid Atomisation and Spray Systems (ILASS), Darmstadt, Germany, 11–13 September 2000. [Google Scholar]
- Bai, C.; Gosman, A. Development of methodology for spray impingement simulation. SAE Trans. 1995, 104, 550–568. [Google Scholar]
- Cossali, G.; Coghe, A.; Marengo, M. The impact of a single drop on a wetted solid surface. Exp. Fluids 1997, 22, 463–472. [Google Scholar] [CrossRef]
- Tropea, C.; Roisman, I.V. Modeling of spray impact on solid surfaces. At. Sprays 2000, 10, 387–408. [Google Scholar] [CrossRef]
- Vander Wal, R.L.; Berger, G.M.; Mozes, S.D. The splash/non-splash boundary upon a dry surface and thin fluid film. Exp. Fluids 2006, 40, 53–59. [Google Scholar]
- Stow, C.D.; Stainer, R.D. The physical products of a splashing water drop. J. Meteorol. Soc. Jpn. Ser. II 1977, 55, 518–532. [Google Scholar] [CrossRef] [Green Version]
- Roisman, I.; Tropea, C. Fluctuating flow in a liquid layer and secondary spray created by an impacting spray. Int. J. Multiph. Flow 2005, 31, 179–200. [Google Scholar] [CrossRef]
- ASTM D1655-19a, Standard Specification for Aviation Turbine Fuels; Technical Report; ASTM International: West Conshohocken, PA, USA, 2019.
- ASTM D7566-19b, Standard Specification for Aviation Turbine Fuel Containing Synthesized Hydrocarbons; Technical Report; ASTM International: West Conshohocken, PA, USA, 2019.
- Yilmaz, N.; Atmanli, A. Sustainable alternative fuels in aviation. Energy 2017, 140, 1378–1386. [Google Scholar] [CrossRef]
- Gawron, B.; Białecki, T. Impact of a Jet A-1/HEFA blend on the performance and emission characteristics of a miniature turbojet engine. Int. J. Environ. Sci. Technol. 2018, 15, 1501–1508. [Google Scholar] [CrossRef]
- Ferrão, I.; Vasconcelos, D.; Ribeiro, D.; Silva, A.; Barata, J. A study of droplet deformation: The effect of crossflow velocity on jet fuel and biofuel droplets impinging onto a dry smooth surface. Fuel 2020, 279, 118321. [Google Scholar] [CrossRef]
- Cossali, G.; Brunello, G.; Coghe, A.; Marengo, M. Impact of a Single Drop on a Liquid Film: Experimental Analysis and Comparison with Empirical Models; Italian Congress of Thermofluid Dynamics UIT: Ferrara, Italy, 1999; Volume 30. [Google Scholar]
- Cossali, G.; Marengo, M.; Coghe, A.; Zhdanov, S. The role of time in single drop splash on thin film. Exp. Fluids 2004, 36, 888–900. [Google Scholar] [CrossRef]
- Fedorchenko, A.I.; Wang, A.B. On some common features of drop impact on liquid surfaces. Phys. Fluids 2004, 16, 1349–1365. [Google Scholar] [CrossRef]
- Range, K.; Feuillebois, F. Influence of surface roughness on liquid drop impact. J. Colloid Interface Sci. 1998, 203, 16–30. [Google Scholar] [CrossRef]
- Vander Wal, R.L.; Berger, G.M.; Mozes, S.D. Droplets splashing upon films of the same fluid of various depths. Exp. Fluids 2006, 40, 33–52. [Google Scholar] [CrossRef]
- Wang, A.B.; Chen, C.C. Splashing impact of a single drop onto very thin liquid films. Phys. Fluids 2000, 12, 2155–2158. [Google Scholar] [CrossRef]
- Vander Wal, R.L.; Berger, G.M.; Mozes, S.D. The combined influence of a rough surface and thin fluid film upon the splashing threshold and splash dynamics of a droplet impacting onto them. Exp. Fluids 2006, 40, 23–32. [Google Scholar] [CrossRef]
- Moreira, A.; Moita, A.; Panao, M. Advances and challenges in explaining fuel spray impingement: How much of single droplet impact research is useful? Prog. Energy Combust. Sci. 2010, 36, 554–580. [Google Scholar] [CrossRef]
- Zhang, Y.; Liu, P.; Qu, Q.; Liu, F.; Agarwal, R.K. Numerical Simulation of a Droplet Impacting upon Films with Varied Liquid Properties. In Proceedings of the 55th AIAA Aerospace Sciences Meeting, Grapevine, TX, USA, 9–13 January 2017; p. 1468. [Google Scholar]
- Che, Z.; Matar, O.K. Impact of droplets on immiscible liquid films. Soft Matter 2018, 14, 1540–1551. [Google Scholar] [CrossRef] [Green Version]
- Burzynski, D.A.; Bansmer, S.E. Droplet splashing on thin moving films at high Weber numbers. Energy 2018, 101, 202–211. [Google Scholar] [CrossRef]
- Liang, G.; Mudawar, I. Review of drop impact on heated walls. Int. J. Heat Mass Transf. 2017, 106, 103–126. [Google Scholar] [CrossRef]
- Ribeiro, D.F.S. Experimental Study of a Single Droplet Impinging upon Liquid Films: Jet Fuel and Biofuel Mixtures. Master’s Thesis, University of Beira Interior, Covilhã, Portugal, 2018. [Google Scholar]
- Tropea, C.; Marengo, M. The impact of drops on walls and films. Multiph. Sci. Technol. 1999, 11. [Google Scholar] [CrossRef]
- Macklin, W.; Metaxas, G. Splashing of drops on liquid layers. J. Appl. Phys. 1976, 47, 3963–3970. [Google Scholar] [CrossRef]
- Engel, O.G. Crater depth in fluid impacts. J. Appl. Phys. 1966, 37, 1798–1808. [Google Scholar] [CrossRef]
Figure 1.
Drop impact mechanisms.

Figure 2.
Transition criteria between spread and splash after drop impact onto a liquid film.

Figure 3.
Scheme of the experimental facility.

Figure 4.
Image sequences: (a) the spreading of a single droplet in a liquid film for the 75% JF/25% HVO mixture ( mm, m, ); (b) the fingering of a single droplet in a liquid film for the 75% JF/25% HVO mixture ( mm, m, ).
Figure 4.
Image sequences: (a) the spreading of a single droplet in a liquid film for the 75% JF/25% HVO mixture ( mm, m, ); (b) the fingering of a single droplet in a liquid film for the 75% JF/25% HVO mixture ( mm, m, ).

Figure 5.
Prompt splash for the 50% JF/50% HVO mixture ( mm, m, ).

Figure 6.
Image sequences: (a) crown splash of a single droplet in a liquid film for HO ( mm, m, , m/s); (b) jetting of a single droplet in a liquid film for 100% JF ( mm, m, , m/s).
Figure 6.
Image sequences: (a) crown splash of a single droplet in a liquid film for HO ( mm, m, , m/s); (b) jetting of a single droplet in a liquid film for 100% JF ( mm, m, , m/s).

Figure 7.
Splashing followed by bubble encapsulation for the 75% JF/25% HVO mixture ( mm, m, ).

Figure 8.
Scheme of the phenomena obtained for the different fluids depending on the Weber number (NS—non-splashing; S—splash; J—jetting; B—bubble encapsulation).
Figure 8.
Scheme of the phenomena obtained for the different fluids depending on the Weber number (NS—non-splashing; S—splash; J—jetting; B—bubble encapsulation).

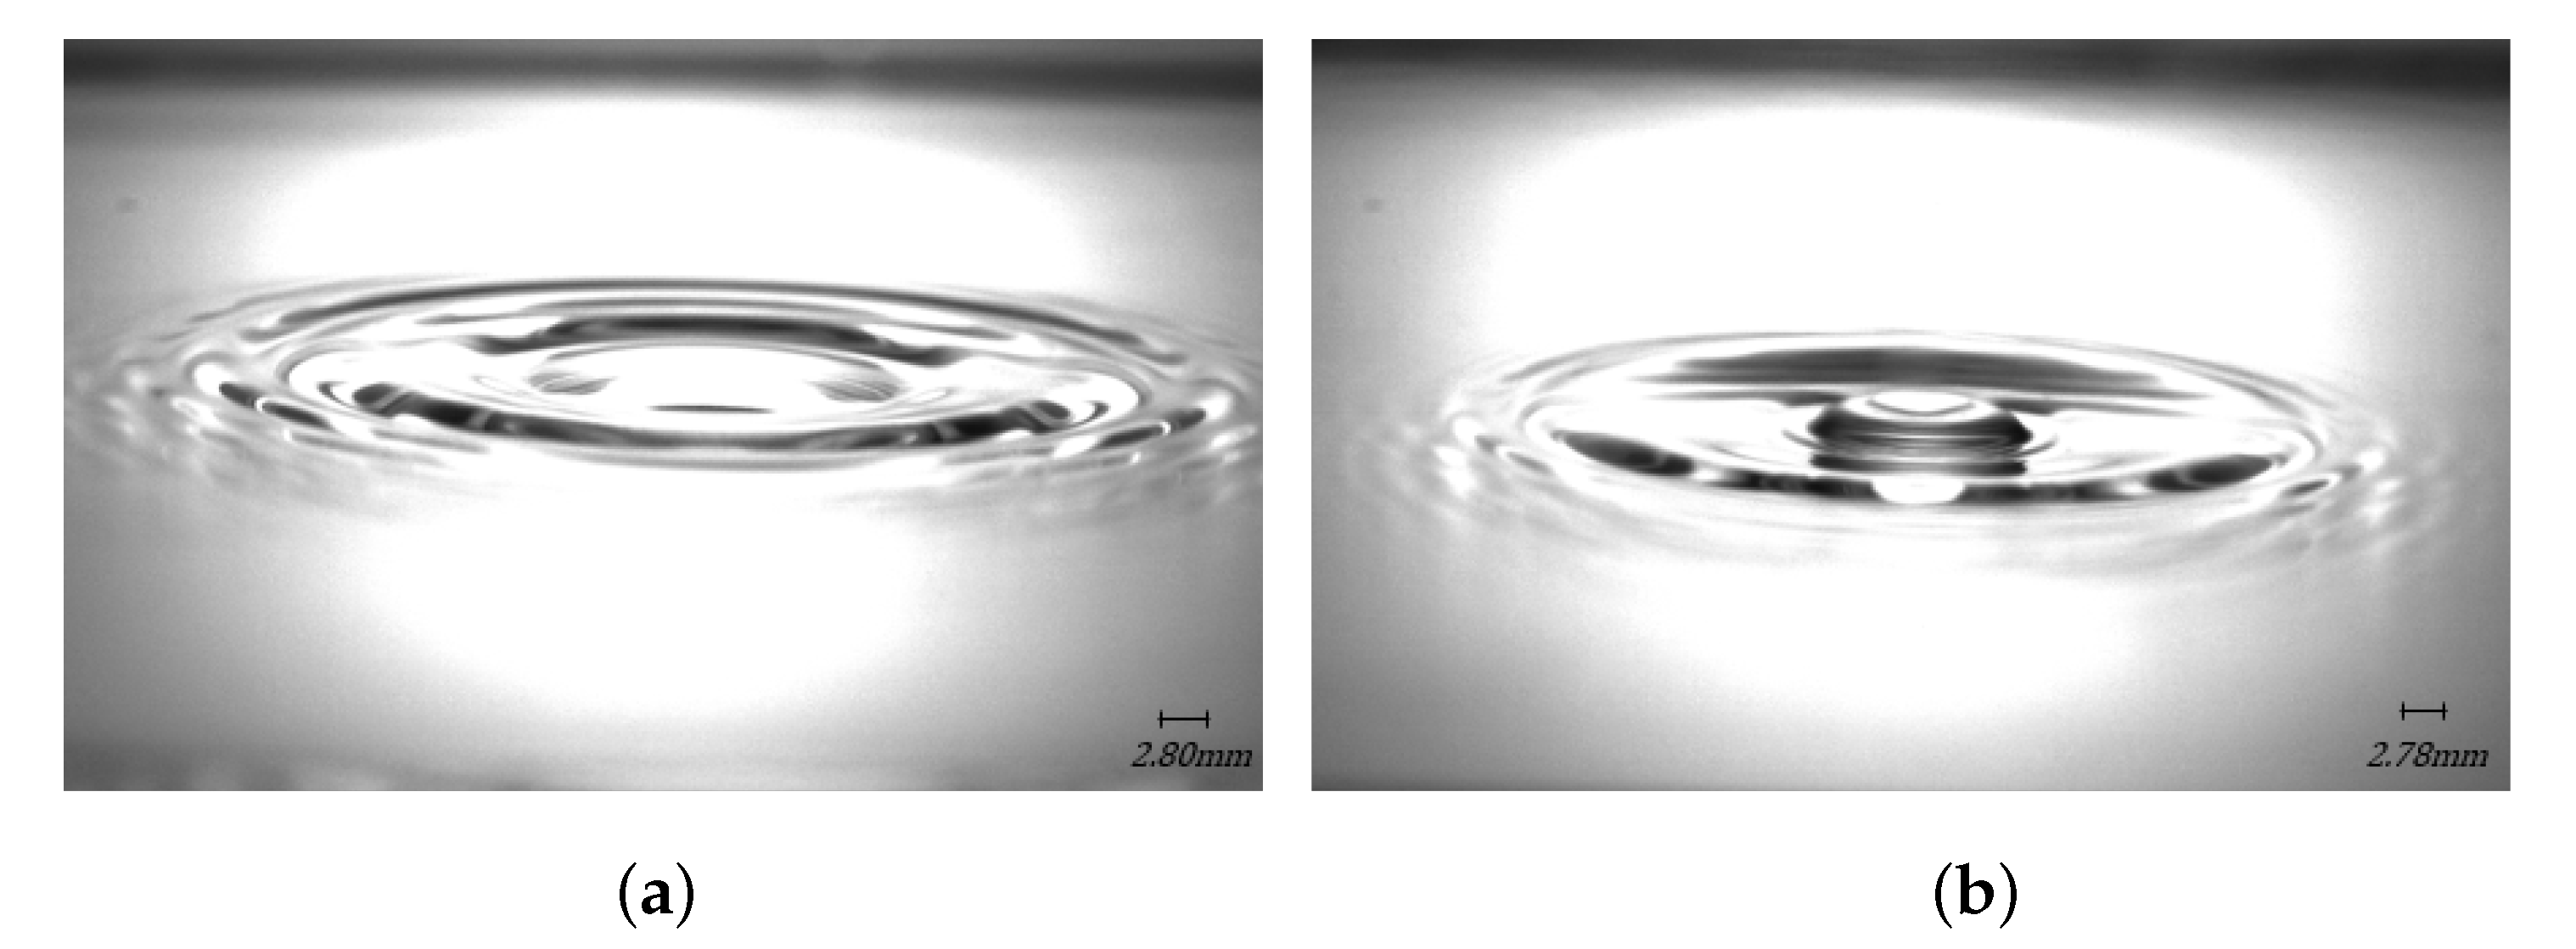
Figure 9.
Final spread at ms for m, , mm: (a) for HO; (b) for 50% JF/50% HVO.

Figure 10.
The noticeable increase of the crown thickness while the dimensionless film thickness increases for 75% JF/25%, mm, mm, ms: (a) ; (b) .
Figure 10.
The noticeable increase of the crown thickness while the dimensionless film thickness increases for 75% JF/25%, mm, mm, ms: (a) ; (b) .

Figure 11.
The noticeable increase of crown thickness while the dynamic viscosity decreases for m, , ms: (a) 100% JF, Pa · s, mm; (b) 50% JF/50% HVO; Pa · s, mm.
Figure 11.
The noticeable increase of crown thickness while the dynamic viscosity decreases for m, , ms: (a) 100% JF, Pa · s, mm; (b) 50% JF/50% HVO; Pa · s, mm.

Figure 12.
Comparison of the experimental results with the proposed transition criteria established by Bai and Gosman [4], Cossali et al. [5], Tropea and Roisman [6], and Vander Wal et al. [7] within their validation ranges. Color scheme: black—the phenomena obtained experimentally agree with the criteria; white—the phenomena obtained experimentally do not agree with the predicted outcome; gray—do not belong within the validation range of that criterion.

Figure 13.
Comparison of the experimental results with the proposed transition criteria established by Bai and Gosman [4], Cossali et al. [5], Tropea and Roisman [6], and Vander Wal et al. [7]. Color scheme: black—the phenomena obtained experimentally agree with the criteria within the validation range; white—the phenomena obtained experimentally do not agree with the predicted outcome within the validation range; gray—the phenomena obtained experimentally agree with the criteria out of the validation range; beige—the phenomena obtained experimentally do not agree with the predicted outcome out of the validation range.

Figure 14.
Experimental results in the present work and the Vander Wal et al. [7] empirical correlation. In the case of , we plotted a qualitative curve representing an increase of 15% in the splashing criterion value .
Figure 14.
Experimental results in the present work and the Vander Wal et al. [7] empirical correlation. In the case of , we plotted a qualitative curve representing an increase of 15% in the splashing criterion value .

Table 1.
Transition criteria for .
| Reference | Exponent | Criterion, | Validation | Validation |
|---|---|---|---|---|
| Range | Range | |||
| Bai and Gosman [4] | 0.3584 | 1136.7 | 8000–33,600 | † |
| Cossali et al. [5] | 0.4 | 428–1828 | 0.1–1 | |
| Tropea and Roisman [6] | 0.4 | 150–3184 | - | |
| Vander Wal et al. [7] | 0.272 | 756.7 | 988–13,900 | 0.1 |
Bai and Gosman [4] consider a wetted condition equivalent to the impact on a very rough surface; with is the mass ratio between the mass of secondary droplets produced by splash and the mass on the initial impinging droplet.
Table 2.
Physical properties of the fluids.
| Substances | [kg/m] | [N/m] | [Pa·s] |
|---|---|---|---|
| HO (literature) | 1000 | 72.0 | 1.00 |
| 100% Jet Fuel (JF) | 798.3 | 25.4 | 1.12 |
| 75% JF–25% HVO | 794.9 | 25.5 | 1.44 |
| 50% JF–50% HVO | 792.3 | 24.6 | 1.79 |
Table 3.
Experimental ranges of dimensionless numbers.
| Reynolds | Weber | Laplace | Ohnesorge |
|---|---|---|---|
| 1411–16,889 | 103–1623 | 27,987–28,8101 | 1.863–9.593 |
© 2020 by the authors. Licensee MDPI, Basel, Switzerland. This article is an open access article distributed under the terms and conditions of the Creative Commons Attribution (CC BY) license (http://creativecommons.org/licenses/by/4.0/).
Share and Cite
MDPI and ACS Style
Ribeiro, D.F.S.; Silva, A.R.R.; Panão, M.R.O. Insights into Single Droplet Impact Models upon Liquid Films Using Alternative Fuels for Aero-Engines. Appl. Sci. 2020, 10, 6698. https://0-doi-org.brum.beds.ac.uk/10.3390/app10196698
AMA Style
Ribeiro DFS, Silva ARR, Panão MRO. Insights into Single Droplet Impact Models upon Liquid Films Using Alternative Fuels for Aero-Engines. Applied Sciences. 2020; 10(19):6698. https://0-doi-org.brum.beds.ac.uk/10.3390/app10196698
Chicago/Turabian StyleRibeiro, Daniela F. S., André R. R. Silva, and Miguel R. O. Panão. 2020. "Insights into Single Droplet Impact Models upon Liquid Films Using Alternative Fuels for Aero-Engines" Applied Sciences 10, no. 19: 6698. https://0-doi-org.brum.beds.ac.uk/10.3390/app10196698
Note that from the first issue of 2016, this journal uses article numbers instead of page numbers. See further details here.