1. Introduction
The Italian structural heritage is mostly made up of non-recent buildings. In addition to a large number of monumental buildings, having an intrinsic cultural and artistic value, a high percentage of buildings and infrastructures have, indeed, exceeded the ordinary limits of design lifetime.
Therefore, it is important, especially after the recent seismic events that occurred in Italy [
1,
2,
3,
4], to carry out a seismic risk analysis on a ‘large’, i.e., territorial, scale. As known, the seismic vulnerability, i.e., the probability that a building will suffer damage following an earthquake of a given intensity, is one of the risk components for constructions. The other two components are the probability of occurrence—in a given site—of earthquakes of a certain intensity (hazard) and the value of the expected losses in case of a certain level of damage (exposure). Based on the previous definition, the assessment of the seismic vulnerability of a building can be specialized in several ways, mostly depending on the objectives of the analysis itself. In this perspective, the ‘scale’ (single building, aggregates, urban scale, and territorial scale), which the analysis refers to, is one of the aspects that play a fundamental role in choosing the most appropriate way of estimating the vulnerability.
The assessment of ‘large-scale’ vulnerability is very useful for planning interventions aimed to increase the seismic safety with a priority criterion and to spread a preventive, rather than protective, approach for the evaluation of the seismic risk. To this aim, simplified methods for assessing the seismic vulnerability of buildings are often adopted in the literature in order to provide vulnerability judgments with different levels of detail and reliability [
5,
6,
7,
8,
9,
10,
11,
12,
13,
14,
15,
16,
17,
18]. Most simplified analyses are generally carried out for classes of homogeneous buildings, especially in the case of a ‘large-scale’ vulnerability assessment: the seismic vulnerability is, indeed, evaluated starting from a limited number of geometric and physical–mechanical parameters, which are supposed to be a low variable within the buildings of the same class.
The quantification of the seismic vulnerability of buildings has been a topic of study for over thirty years, during which the problem was examined with different approaches and approximation levels.
The methodologies available in the literature for assessing the seismic vulnerability of buildings can be synthetically grouped into mechanical and macroseismic ones. The mechanical approaches are usually based on the capacity spectrum method, which provides a ‘capacity curve’ for the building through a nonlinear static pushover analysis aimed to represent the relationship between the lateral load resistance and the displacement of a control point of the examined building. The capacity curve is then converted in terms of spectral acceleration in order to compare it with the demand spectrum, obtain the performance point in terms of displacement, and carry out the verification according to the chosen design limit state. When such a procedure is applied to a single building, an accurate level of knowledge is needed so as to achieve reliable results from the nonlinear analyses. However, the mechanical methods have evolved also to be able to evaluate the vulnerability of whole classes of buildings, although by means of simplified approaches for obtaining the capacity curves [
10,
12,
19,
20].
HAZUS [
19] is a methodology developed specifically for U.S. buildings, which refer to 36 typological classes: for each class of buildings the parameters for defining the capacity curves in a simplified way are provided.
The LM2 approach proposed by the RiskUE methodology [
14,
20] is substantially based on the same capacity spectrum-based procedure adopted by the HAZUS method, since for each building class, the capacity curve of an equivalent single-degree-of-freedom (SDOF) system is defined in a simplified way by the means of four parameters corresponding to two typical control points of the capacity spectrum (i.e., yield and ultimate capacity in terms of spectral displacement and acceleration) or of the capacity curve expressed in terms of base shear and roof displacement [
12,
14,
20]. It is worth noting that the RiskUE method derives from the observation of characteristics of Italian and Mediterranean typologies [
21] and the classes are inspired by the building classes provided by EMS-98 [
22], while the US methods [
19] refer to typical US buildings. Analogously, the methodology provided by the Italian GNDT [
11] proposes a typology calibrated on typical Italian buildings. Moreover, the particularity of the European buildings compared to the USA or Japan ones is highlighted by the prominence of masonry typologies, which are not considered in the US methods.
Additionally, in New Zealand Society of Earthquake Engineering (2016), two levels of approach for evaluating the seismic vulnerabilty are proposed. The most simplified one (initial seismic assessment, ISA) requires the filling of spreadsheets for the single building aimed to collect information related to the critical structural weaknesses (CWS) and obtainable with an accurate survey of the building. The more detailed approach (DSA, Detailed Seismic Assessment) is based on simplified push-over analysis [
23].
Macroseismic methods, on the other hand, are based on the statistical analysis of damage caused by past earthquakes according to damage probability matrices (DPM) [
23,
24,
25,
26,
27]. Clearly, the level of accuracy in predicting damage depends on the amount and quality of the available observational data for homogeneous classes of buildings, generally being typological or functional indicators.
These methods can be applied also to datasets of buildings different from those used for their calibration if they fall in the same homogeneous classes. An example is represented by the empirical LM1 approach provided by RiskUe [
20] that is based on the classification of the buildings in different typological classes. The method adopts the vulnerability index method (VIM) for calculating the average damage according to the correlation suggested by [
12] where the hazard is described through the macroseismic intensity (EMS-98). Fragility curves for different damage levels for the individuated homogeneous classes of buildings can be obtained too.
In this frame, the detailed analysis of damages suffered by buildings after seismic events can be useful to assess their vulnerability too [
28].
Finally, it is worth noting that in the literature another two groups of simplified methods for assessing the seismic vulnerability can be identified. One category is characterized by methods based on very few data concerning the buildings [
9,
11,
15,
17,
18] as, for example, age of construction, number of floors, type of vertical and horizontal structures, and maintenance status. These methods, however based on the examination of damages observed in past earthquakes, usually provide a ‘vulnerability’ judgment, i.e., a ‘qualitative’ assessment of the vulnerability. A further category is represented by methods aimed to assess the strength capacity of the examined buildings by means of simplified calculations [
5,
13,
16] and, thus, they request that some geometrical data of the buildings and mechanical properties of the materials are known in order to estimate a strength capacity-to-demand ratio, i.e., a safety factor, although simplified.
In the first part of the paper, several simplified methods proposed in the literature for assessing the seismic vulnerability were analyzed. The simplified methods summarized in the paper were selected based on the possibility that they can be applied to the database presented in the second part of the paper and with a particular focus on the most suitable methods for the typical Italian buildings. It is worth noting, indeed, that masonry buildings represent a relevant part of the existing building stock in Italy and not all the methods available in the literature are applicable to such a typology. Moreover, the methods were selected also based on the possibility of comparing the provided vulnerability judgments.
Since the most simplified methods require a reduced number of parameters, i.e., they are applicable even in the presence of few information, and the most detailed methods need more information, they have been divided into two macrocategories based on the final judgment of seismic vulnerability: ‘qualitative’ or ‘quantitative’ methods. The methods are compared to each other, mainly according to type and number of input data, type of output, limitations of use for different structural typologies, and complexity of use. Such a comparison makes possible to quickly identify the most suitable methods for assessing the vulnerability of a given class of buildings, based on the available data, the computational effort, and the type of final judgment. With regard to the latter aspect, actually the different methods do not always lead to results expressed in a homogeneous way. Some of them lead, indeed, to the definition of a class of vulnerability, other quantitative indicators in some way represents, albeit in a simplified way, a capacity-to-demand ratio. When the method leads to the identification of a class of vulnerability (from low to high), in the following it will be referred to as a ‘linguistic’ judgment, i.e., expressed in verbal rather than quantitative terms.
It is worth noting that in no case, however, the outcome of an expeditious vulnerability assessment can assume the same meaning as a detailed structural and non-structural analysis it is possible to do (via static or time-history non-linear analysis) for a single building. In any case, the simplified procedures for vulnerability assessment are generally used for a first screening, to evaluate the most critical situations, and to identify the intervention priorities, so as to allocate available resources in a rational way. From this point of view, beyond the differences between the various methods, what matters is the internal consistency of the outputs of each single method. However, the following paragraphs explain how each method expresses the degree of vulnerability of the buildings, which represents also the basis for a further comparison between the different procedures.
In the second part of the paper, the selected methods were applied to a sample of school buildings located in the province of Naples (Italy). The area extends for about a thousand square meters and is, therefore, characterized by an almost uniform seismic hazard. Buildings are different mainly for structural typology, geometry, and age of construction. Depending on the information necessary for the application of each method, the reference sample is customized according to the level of knowledge available for each building. This means that the most simplified methods were applied to a larger sample (about 1000 buildings), while the more detailed methods could be applicable to a reduced number of buildings (only 14 masonry buildings).
The fundamental assumption of this study is that the available data about the examined school buildings and usable in the analyses come from a ‘closed’ database, which is part of a digital national platform aimed to draw up a catalogue of the school buildings and where very diversified information (functional, logistic, structural, etc.) are collected. Thus, the structural data necessary for applying vulnerability methods were not obtained by on-site surveys directly carried out by the authors or by technicians. Such a condition is in the frame of ‘large scale’ vulnerability assessment philosophy, since preliminary analyses can be often carried out only based on few data made available by administrative offices and not coming by technical analyses or inquires. This circumstance leads to several methods available in the literature being not applicable to the examined database due to lacking detailed information. The idea of the paper is, indeed, to verify the possibility of providing reliable ‘large scale’ vulnerability judgments based on a minimum set of information, already available on local or national platform without necessity of carrying out additional surveys, i.e., ‘at zero cost’ in terms of time and resources, and, if yes, try to extend the experience implemented on the case study of the Naples province to other realties. According to such an approach, the choice of suitable methods for assessing the seismic vulnerability on the large scale should be consistent with the available knowledge level of the buildings and, thus, not all the methods are reliable (i.e., the mechanical ones based on push-over analysis, even if simplified).
The comparison between the results obtained from the application of the different methods allows one to highlight advantages and weaknesses of each method, to identify the convenience in the use of them according to the specific available information and the objectives of the analysis, and finally to evaluate which method is more or less safe in the frame of a ‘large scale’ assessment of the seismic vulnerability.
2. Simplified Vulnerability Assessment Methods for Masonry and RC Building Structures
As described in detail in
Section 1, several methods are available in the literature for the assessment of seismic vulnerability. In this paper, the attention will be focused on suitable methods for the available database of buildings that will be introduced in the following.
Table 1 and
Table 2 list all the methods analyzed and the input data respectively for the following two macrocategories:
- -
Group A, which includes methods that require few input parameters and provide a qualitative output in terms of the final vulnerability judgment;
- -
Group B, which includes methods that require a relevant number of input parameters and generally provide a quantitative safety assessment, based on the definition of a safety index. Some of these methods also include a vulnerability judgment associated to the numerical safety index.
Each method was individuated by a label that will be used for brevity in the following sections. For the methods of Group B, which allow one to calculate a simplified shear capacity or a vulnerability index,
Table 3 summarizes also the input parameters necessary for calculating the resistant (capacity) and the requested (demand) shear.
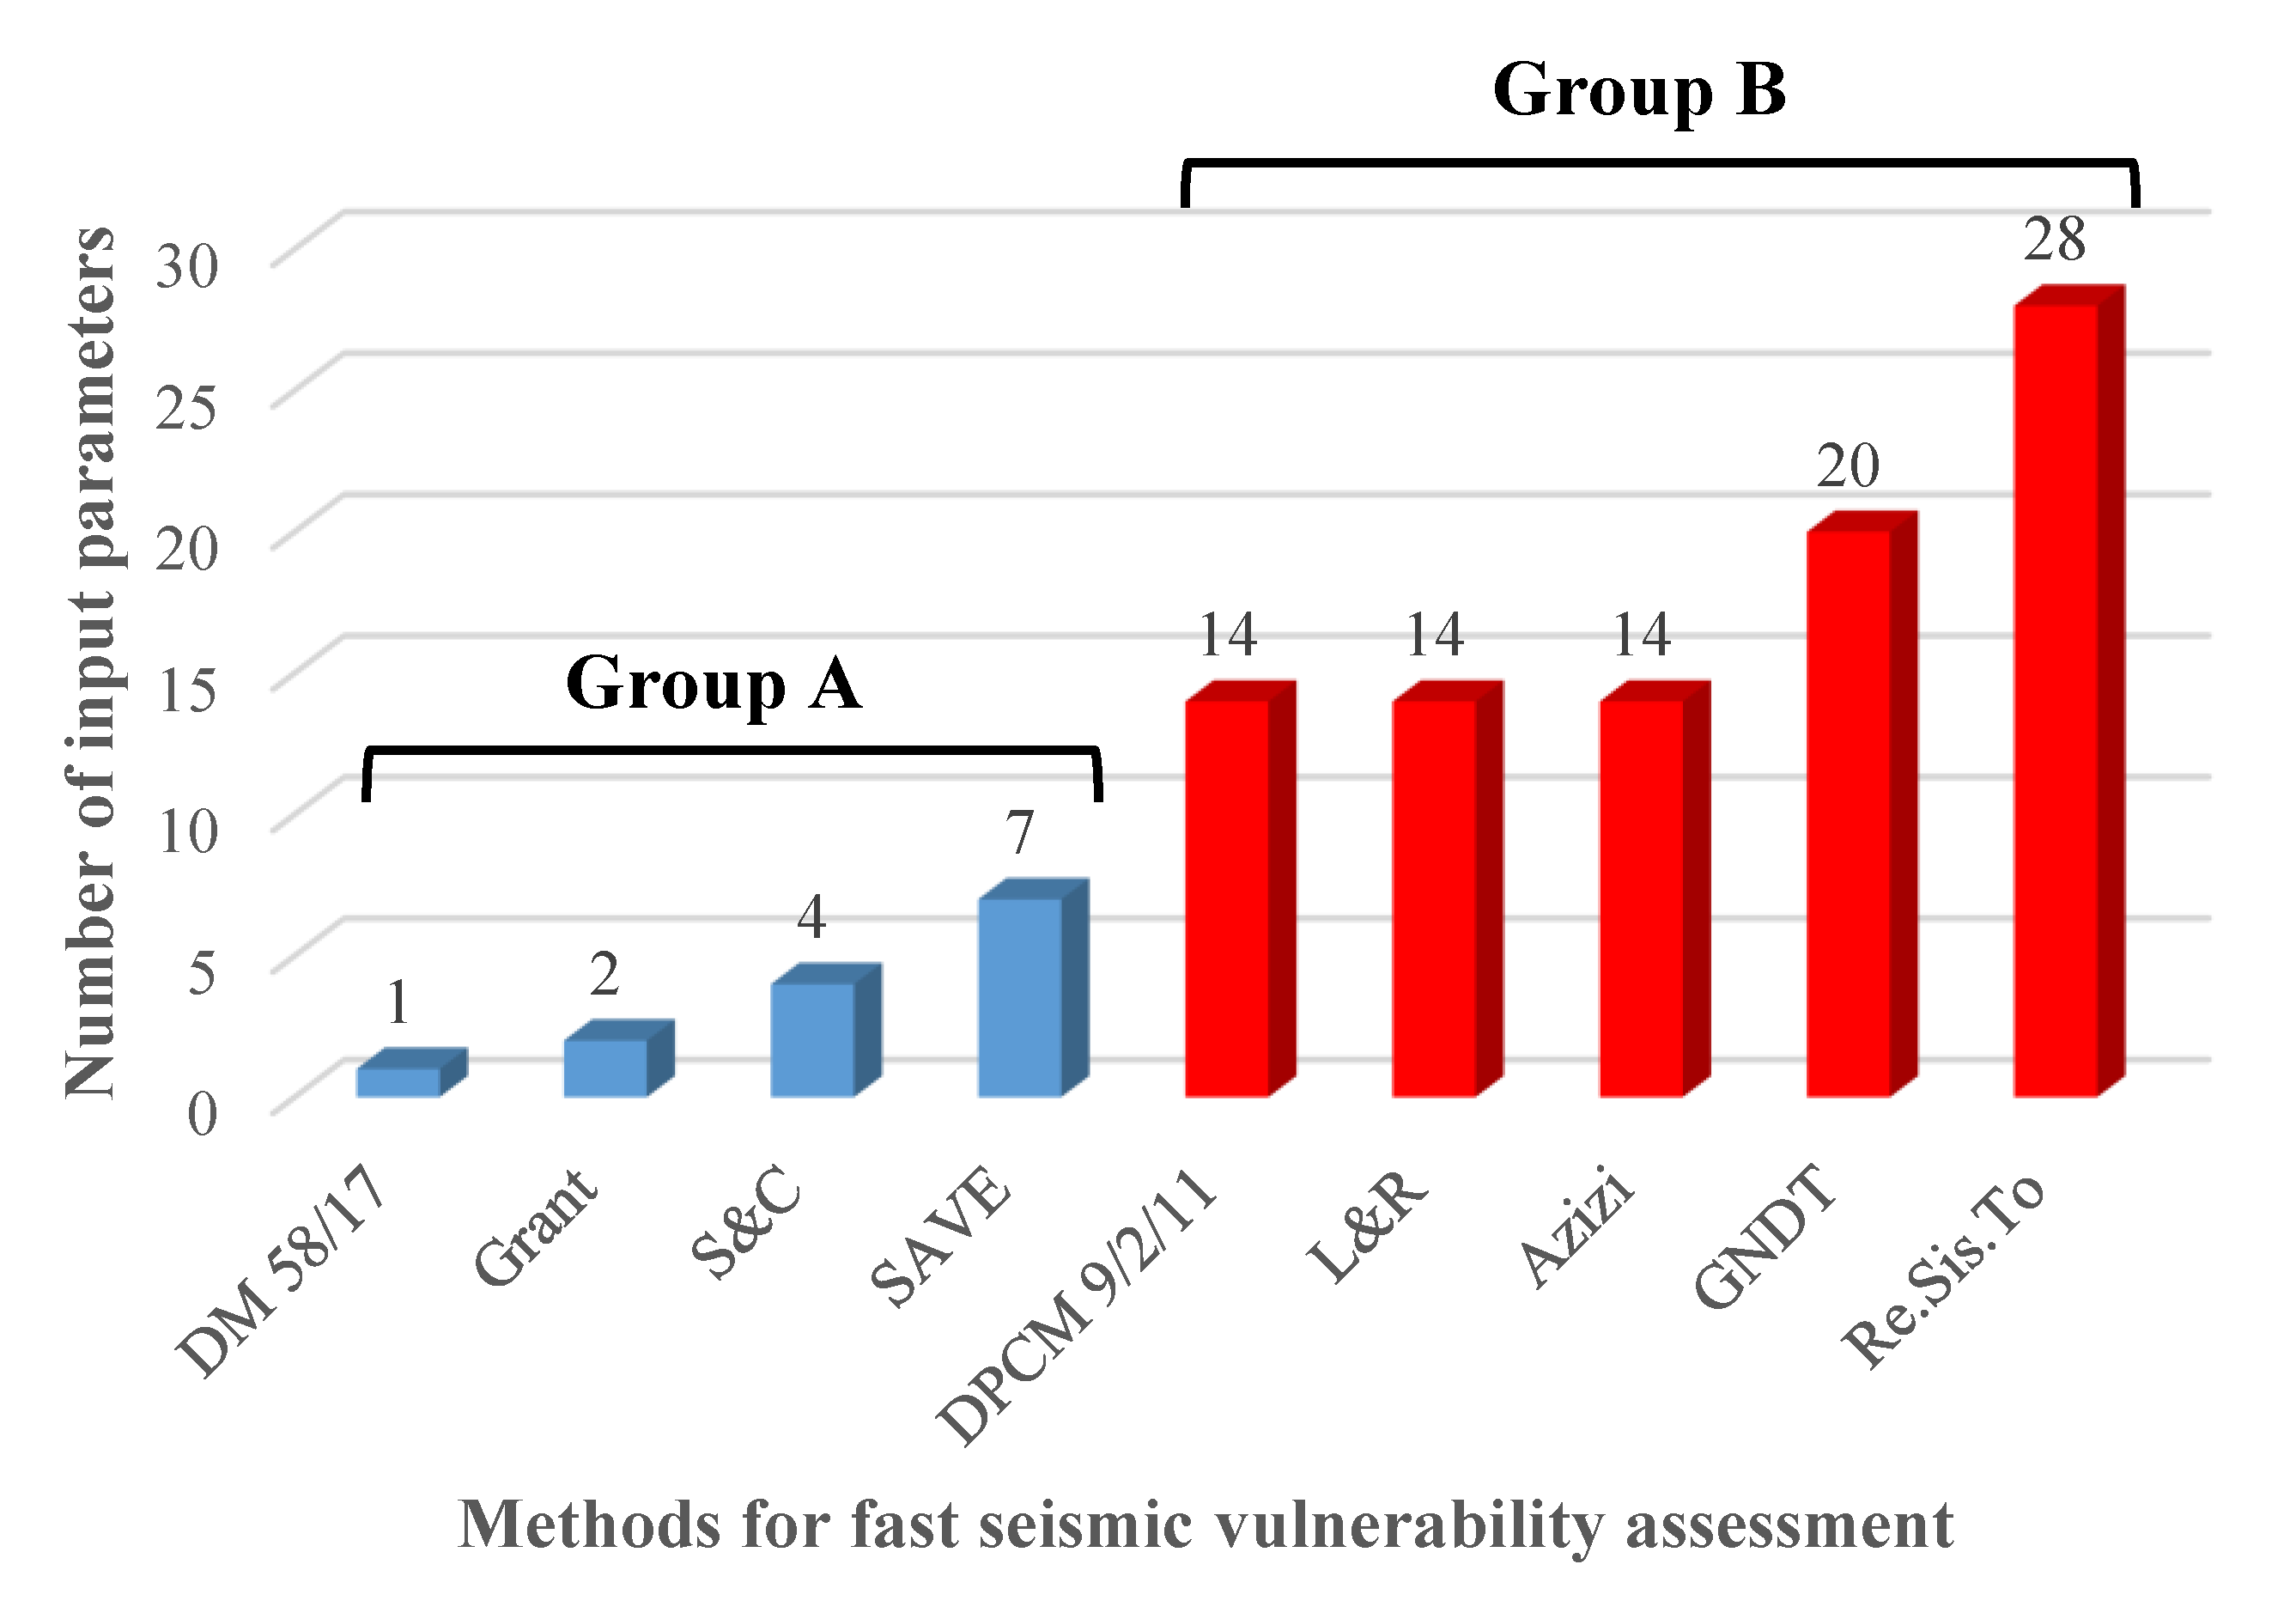
Figure 1 shows a direct comparison among the nine methods selected for this study. In particular, the number of input parameters required by the different methods was compared. It should be noted that the number of parameters counted for the procedures of Group B also includes the detailed parameters for the seismic shear resistance and demand of masonry buildings (
Table 3).
The vulnerability classification, which is based on a qualitative description found in some of the analyzed methods belonging to Group A, refers to the one provided by the European Macroseismic Scale (EMS-98) [
22] and is synthetically reported in
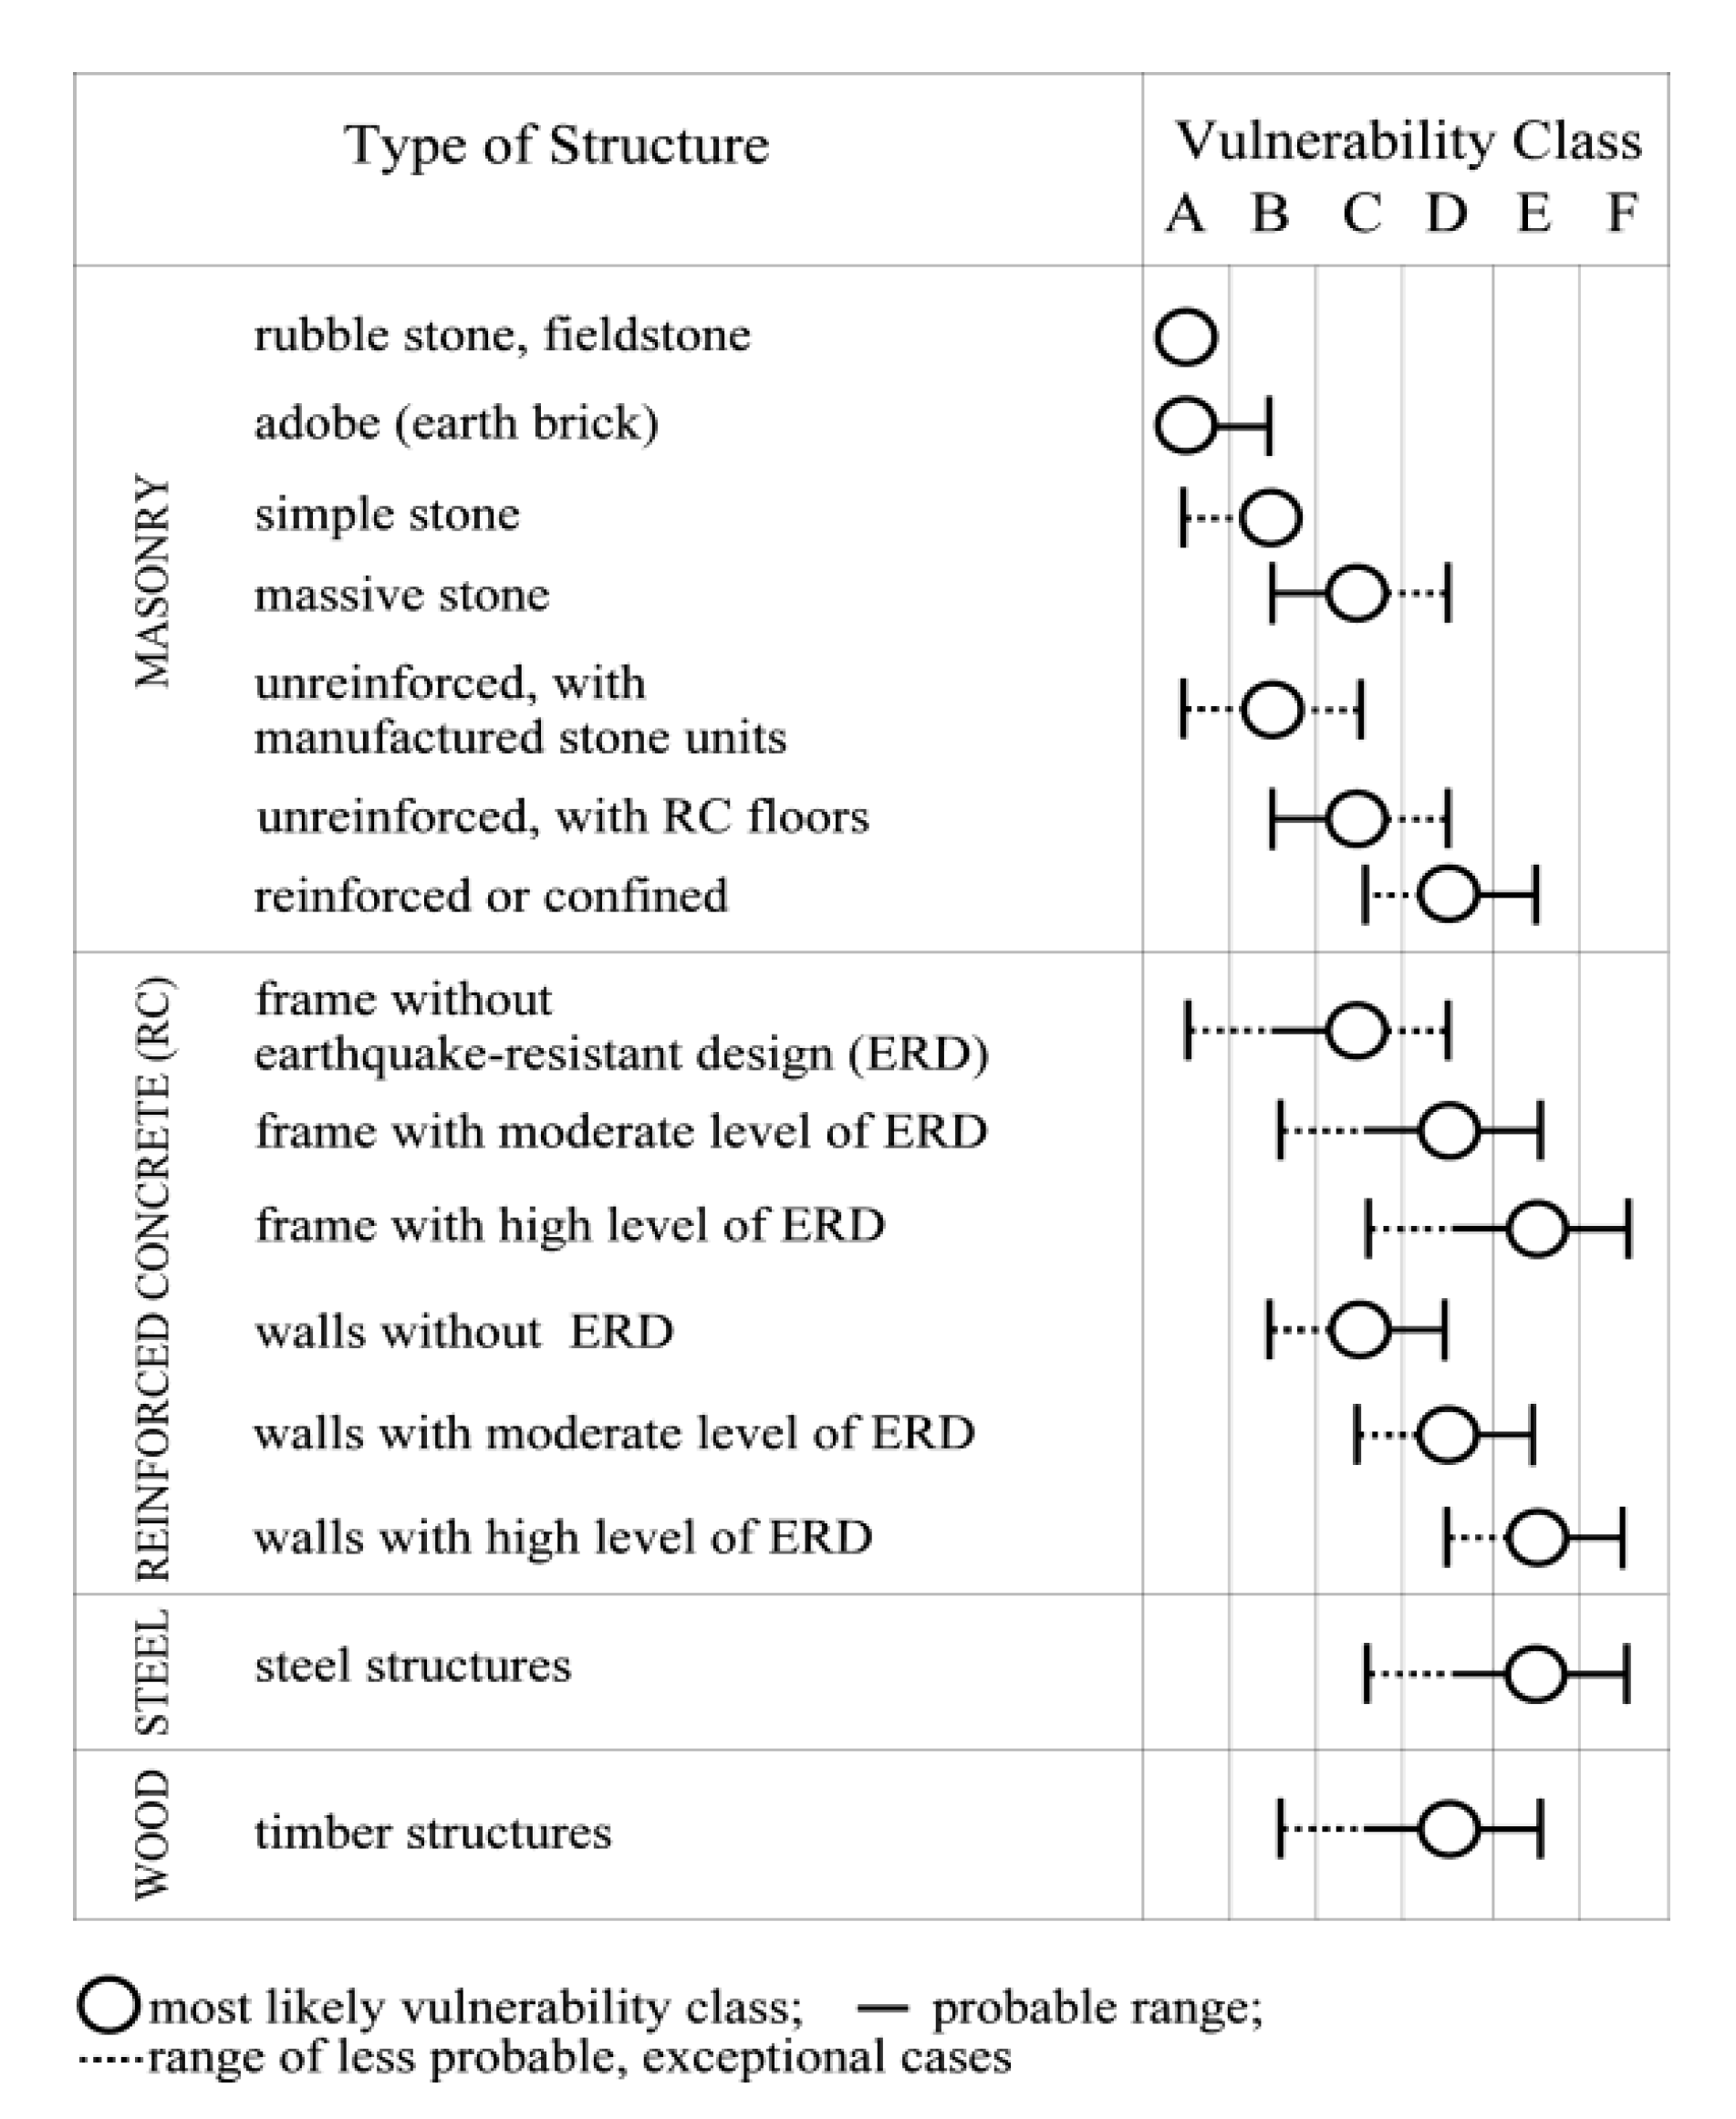
Figure 2. The EMS scale represents a first attempt to define vulnerability classes. Six vulnerability classes were, indeed, defined according to a qualitative description and five damage grades and a certain intensity range are associated to each class. The first three classes (A, B, and C) represent the strength of a typical adobe house, brick building and reinforced concrete (RC) structure. Classes D and E were characterized by an approximately linear decreasing vulnerability as a result of an improved level of the earthquake-resistant design (ERD), and also take into account well-built timber, reinforced or confined masonry, and steel structures. Class F represents the vulnerability of a structure designed according to a high level of earthquake-resistant philosophy adopted in design rules. The vulnerability scheme reported in
Figure 2 was based on the major European building types.
The input data requested for defining the six vulnerability classes provided by the EMS scale have not been listed in
Table 1, since such a classification has been recalled in the DM 58/17 method, as it will be explained in the next section.
It is worth noting that about the methods proposed in the New Zealand Society of Earthquake Engineering (2016), the simplified approach (ISA) is not applicable, as it requires the filling of spreadsheets for the single building with information obtainable by means of an accurate survey of the building, which was not carried out in this study. Consequently, also the second level approach, needing further detailed data, is not applicable since too many assumptions should be used, negatively affecting the result provided by the methodology.
Conversely, the empirical approach (LM1) of RiskUE should be applied to the database, but it would lead to a final output (damage levels and fragility curves) that is not easily comparable with the ones obtained with the other methods taken into account in this work (vulnerability linguistic judgments, vulnerability indexes, or capacity/demand ratios). Its application to the database, either extended or reduced, was, thus, discarded.
Finally, the mechanical methods provided by FEMA 2003 and Risk UE, both based on the construction of capacity curves by means of significant parameters provided for building classes, request a level of computational effort into compare capacity and demand for each building that is not in agreement with the knowledge level available for the selected database.
For the above reasons, input parameters required by methods suggested in FEMA 2003, Risk UE 2003, and the New Zealand Society of Earthquake Engineering (2016) are not listed in
Table 1 and
Table 2.
2.1. Methods Belonging to Group A
2.1.1. SAVE
The SAVE method [
18] is an improvement of the typological classification provided by EMS-98. Such a method was, indeed, calibrated on the damage observed in the buildings after eight relevant earthquakes occurred in Italy from 1980 (Irpinia) to 2002 (San Giuliano di Puglia). Except the Irpinia earthquake, the considered events are characterized by a macroseismic intensity, evaluated according to the MCS scale, variable from V to VIII. Since all the examined buildings were built before 2003, when the first innovative seismic code was introduced in Italy, the method was calibrated on buildings not designed according to the ‘modern’ rules reported in more recent national and international codes.
The method provides the estimation of an overall vulnerability of the building, which is indicated by an average synthetic damage index (synthetic parameter of damage, SPD) and depends only on the typology of vertical resistant elements. The following four vulnerability classes are defined, with a decreasing level of vulnerability from class Av to Dv:
Av = Stones, irregular masonry;
Bv = Stones, regular masonry, hollow bricks, mixed (reinforced concrete and masonry on different floors);
Cv = Solid bricks, mixed (reinforced concrete and masonry, both on all floors);
Dv = RC or steel frames.
These vulnerability classes can be correlated to the EMS classes as follows:
Av = AEMS: high vulnerability;
Bv = BEMS − CEMS: high-medium vulnerability;
Cv = CEMS − DEMS: medium-low vulnerability;
Dv = DEMS − EEMS: low vulnerability.
Each vulnerability class corresponds to an average value of the SPD index that was calculated for each class of vertical typology for macroseismic intensities variable in the range V-VIII, since this was the range where more numerous and suitable empirical data (damages observed in past earthquakes) were available, as previously discussed. Thus, the following average values of the SPD index for the four macroseismic intensities were provided: 2.3 for Av, 2.1 for Bv, 1.7 for Cv, and 1.5 for Dv.
Successively, depending on the further 11 parameters affecting the seismic behavior of the building, the value of SPD and, thus, the vulnerability class can be modified with an increase or a reduction of the initial value. For whatever building typology, the additional parameters are: vertical structures, horizontal structures, number of floors, regularity in plant and/or in elevation, position of the building in case of aggregates, and building age.
For masonry buildings, the following further parameters are considered: roof typology (inclined or plan), roof lightness, the presence of isolated columns, and the presence of ties. For RC buildings, also the regularity of infill walls is taken into account. For ‘mixed’ buildings, the type of mixed structure and the roof typology are considered as additional parameters.
Some of these parameters are dependent on others (horizontal structure, roof lightness, number of floors, and building age), while others are independent. Even if the values for each parameter were calculated independently, the analysis of the database evidenced that some of them are dependent on each other. For example, 25% of buildings of class “Av” have both “deformable floor” and were built “before 1919”. This means that the two features are not independent and the use of coefficients related to both parameters in the scoring of vulnerability would lead to an overestimation of the vulnerability. Thus, the weight of the parameters was reduced proportionally to the statistical dependence between them. The SPD index can be corrected by means of not-correlation coefficients that combine the influence of the independent and dependent parameters. The new four ‘corrected’ vulnerability classes are, thus, characterized by the following ranges of the SPD index:
Class A: SPD ≥ 2.0;
Class B: 1.7 ≤ SPD < 2.0;
Class C: 1.4 ≤ SPD < 1.7;
Class D: 1.0 ≤ SPD < 1.4.
2.1.2. S&C Method
Sandoli and Calderoni [
9] assign a vulnerability class to existing buildings based on structural typology, building age, and typology of horizontal structures (floors). Despite the few qualitative parameters necessary to assign the class, a range of peak ground acceleration (PGA) corresponding to the building collapse, i.e., a capacity in term of PGA (referred to as PGA
c) is provided too.
For masonry buildings, the following three classes and the corresponding values of PGAc are provided:
Class A: high vulnerability class, with PGAc ≤ 0.05 g;
Class B: medium vulnerability class, with 0.05 g < PGAc ≤ 0.10 g;
Class C: low vulnerability class, with 0.10 g < PGAc ≤ 0.15 g.
Class A is divided into a further two subclasses:
MUR 1—‘old buildings’ made of masonry walls, with vaulted floors or wooden/iron plan floors without effective connections to the walls and without diffuse systems of ties;
MUR 5—‘modern buildings not realized in according to the codes’ made of masonry walls, with plan floors without effective connections to the walls and without curbs.
Class B is divided into further two subclasses:
MUR 2—‘old buildings with interventions’, made of masonry walls, vaulted floors, or wooden/iron plan floors without effective connections to walls, but with diffuse systems of ties at all levels;
MUR 4—‘semi-modern buildings’ made of masonry walls, with plan floors connected to the walls through reinforced concrete curbs, but without diffuse systems of chains/ties.
Finally, class C refers to:
For RC buildings, two ranges of maximum PGA capacity and four vulnerability classes are provided, mainly based on the building age and on the technical code evolution:
0.10 g < PGAc ≤ 0.15 g:
- ○
CA1—buildings realized before 1939: structures designed for only gravity loads, the presence of frames in only one direction with deep beams, and heavy infill walls;
- ○
CA2—buildings realized between 1939 and 1970: structures designed for only gravity loads, the presence of frames in only one direction with deep beams in perimeter frames, deep and flat beams in internal frames, and heavy or light infill walls;
- ○
CA3—buildings realized between 1970 and enactment of seismic codes: structures designed for only gravity loads and built with higher quality and certified materials, the presence of frames in only one direction with deep or flat beams, and mainly light infill walls.
0.15 g < PGAc ≤ 0.35 g:
- ○
CA4—buildings realized after enactment of seismic codes: structures designed according to seismic codes, the presence of frames in both directions with deep or flat beams, and mainly light infill walls.
2.1.3. Grant Method
The method proposed by Grant et al. [
15] is based on the assumption that the buildings were realized in agreement with the current codes at the age of construction. Thus, the capacity in terms of maximum PGA is equal to the demand requested by the code at the time of construction. This means that the seismic vulnerability can be simply measured as a function of the age of construction and of the hazard expected at the site. A PGA deficit is, thus, calculated as the ratio of the design value of PGA (PGA
d) expected in the site and evaluated according to current code, to the PGA representing the design seismic demand provided by the code in force at the time, t
0, of construction, PGA
d,t0.
2.1.4. DM 58/17 Method
The guidelines DM 58/17 [
17] for the classification of seismic risk have been introduced in Italy following the Centro-Italia 2016–2017 seismic events in order to provide operational tools aimed to spread a more organic preventive culture and identify a simplified method for assessing the seismic vulnerability of masonry buildings. The method can be used for a quick evaluation of the seismic vulnerability of masonry buildings and is based on the same typological classification provided by EMS-98 [
22], which, as said above, identifies seven and six types of masonry and RC buildings (see
Figure 2), respectively. Each type is associated to one of the six vulnerability classes variable from A to F according to the EMS-98. Such classes are indicated as V
i in the Italian guidelines, where
i = 1, 2, …, 6 corresponds to classes F, E, …, A, according to a decreasing vulnerability level.
Furthermore, fluctuations are expected around the identified vulnerability class. As reported in
Figure 2, the EMS-98 identifies, for each type and each vulnerability class, the most credible value (circle) and the dispersion around this value, expressed with the most probable values (solid lines) and less probable or even exceptional (dashed lines). The Italian guidelines adopts the same approach for assessing any class variance, but provides a change of class only in the case of a vulnerability increase.
Table 4 reports the parameters analyzed in order to assess the minimum vulnerability class.
2.2. Methods Belonging to Group B
2.2.1. GNDT Method
Forms to assess the seismic vulnerability of masonry buildings are provided by the Italian National Group for Earthquake Defense [
11] and are aimed to give a vulnerability index that depends on several parameters (namely 11) affecting the overall seismic behavior of the examined building.
A class from A to D, with increasing vulnerability, and a weight factor are attributed to each parameter. The class corresponds to a coefficient c
vi variable from 0 to 45 (i.e., c
vi is 0 for class A, 45 for class D and has intermediate values for class B and C depending on the significance of each parameter) and a weight factor
ki variable from 0 to 1.5 is assigned to calculate the vulnerability index,
IV, as follows:
The index
IV varies from 0 to 382.5, with the higher values corresponding to higher vulnerability. The vulnerability is, then, usually expressed as a percentage ratio,
V, of the index to the maximum value, i.e., 382.5, and the corresponding vulnerability judgments are reported in
Table 5.
Parameter 1 is related to the global structural asset of the building and to the presence and effectiveness of connecting systems (ties, chains, and curbs) able to guarantee a ‘box-like behavior’. Parameter 2 depends on the quality of strengthening system. Parameter 3 is related to the amount of the static equivalent horizontal seismic force that the building is able to sustain and depends on the coefficient C, defined as follows:
being
a0 a parameter depending on the plan dimensions of the building,
τ0k the characteristic value of the shear strength of masonry in the absence of normal stress,
γ the unit weight of masonry,
n the number of floors, and
q the total weight of the building (taking into account the weight of masonry walls and of floors).
Parameter 4 depends on the building position and foundations. Parameter 5 considers the quality of floors in terms of the effectiveness of connections with vertical elements and the capacity to warrant a global behavior. Parameter 6 is related to the planimetric assess of the building through the ratio between sides. Parameter 7 is related to regularity along the height. Parameter 8 is related to the spacing between vertical walls. Parameter 9 regards the roof typology. Parameter 10 is related to the presence of not structural elements that can cause damage. Finally, parameter 11 evaluates the current global condition of the building.
The weight factor ki assigned to the parameters is 0.25 for parameters 2, 8, and 10; 0.50 for 6; 0.75 for 4; 1.50 for 3; and 1.00 for all the others.
In addition to the vulnerability judgment, the normalized vulnerability index,
V, can be also used for calculating the collapse acceleration,
yc (PGA
c), according to the following correlation provided by Petrini and Zonno [
29]:
being
,
,
, and
.
2.2.2. Azizi Method
In Azizi-Bondarabadi et al. [
8] a method for assessing the seismic vulnerability of masonry structures, i.e., in particular schools, through the definition of a vulnerability index
R, is presented. The following three intervals of variation of the index are defined:
R ≤ 25 Low seismic vulnerability: it is not necessary to carry out further assessments or retrofitting the building;
25 < R < 75 Moderate seismic vulnerability: the building needs to be assessed with a more refined method;
R ≥ 75 High seismic vulnerability: it is necessary to demolishnd rebuild the structure.
The index
R is calculated as:
being
a the expected ground acceleration in the site, i.e., PGA
d, and
The values of the parameters in Equation (6) are directly given in
Table 6 and
Table 7, while the parameter
k1 was evaluated as the sum divided by 100 of the four parameters
k11,
k12,
k13,
k14 whose values depend on the topics listed in
Table 8.
Once the
R index is known, the following correlations provide the values of the vulnerability index according to the different masonry typologies reported in
Table 9.
for M1 class;
for M2 class;
for M3 class.
2.2.3. RE.SIS.TO® Method
The method RE.SIS.TO
® [
5] is based on the assessment of the collapse acceleration of the building, PGA
c, evaluated through a simplified evaluation of the shear strength at each floor of the building. The spectral acceleration
, corresponding to the collapse of the building, is converted in a capacity in terms of PGA, i.e.,
, through the following relationship [
30]:
being
a modal participation factor, equal to 1.0 for one-floor buildings and 0.8 for multi-story buildings,
a spectral amplification factor equal to 2.50,
a factor taking into account dissipative phenomena and equal to 0.8 if the contribution of the infill walls is neglected or to 1.0 if it is significant, and
is the structure factor, which can be assumed equal to 2.0 for masonry buildings.
The building capacity in terms of spectral acceleration,
Sa,c, is defined as the minimum ratio between the resistant shear,
Vr,i,rid, at the i-th floor and the corresponding acting shear,
Vs,i:
The ratio of the resistant shear,
Vr,i,, to the acting shear,
Vs,i, at each floor represents, indeed, the structural performance of each floor in terms of acceleration. For masonry buildings, the resistant shear at the
i-th floor is calculated with the Turnšek and Cacovic [
31] formulation:
Being Amin,i the minimum area of resistant walls along with the main directions of the building at the i-th floor, the shear strength of masonry in the absence of normal stress, and the average normal stress at the i-th floor.
The resistant shear is further reduced by a factor,
Crid, aimed to take into account the current conditions of the building by means of the GNDT form [
11]:
where
Vi is the value assigned to each parameter provided in the GNDT form [
11] without considering the third parameter related to the conventional strength, α is a coefficient estimated by the method calibration (here considered equal to 1), and
Vpegg is the sum of the values of all the parameters
Vi evaluated in class D.
Based on the values of the ratio PGA
c/PGA
d, being PGA
d the design acceleration expected at the site, five classes of strength and vulnerability are defined (
Table 10).
2.2.4. DPCM 9/2/11 Method
The Italian guidelines (DPCM 9/2/11, [
16]) define the following expeditious safety index,
Is, aimed to assess the seismic vulnerability according to a territorial scale:
being
ag,SLV the expected acceleration on rigid soil at the life safety limit state and
aSLV the collapse acceleration of the building, i.e., the previously defined PGA
c, with reference to the lower strength direction and defined as follows:
with
where
Se,SLV is the value of the elastic spectrum at the life safety limit state,
q is the structure factor,
M is the total seismic mass of the building,
e* is the ratio of participating mass in the considered failure mode,
T1 is the main vibration period of the structure, i.e.,
C1 = 0.05 for masonry buildings,
H is the building height,
TB,
TC, and
TD are the characteristic periods of the response spectrum,
S = SS∙ST is the factor taking into account the subsoil typology and the topographic conditions (EC8 [
32]), and
F0 is the maximum value of the amplification factor.
The shear strength of the building,
, is calculated as the minimum value between those related to two main directions and for each floor of the building. As an example, for the
i-th floor along the X direction, the shear strength is:
where
is the design shear strength of masonry of the
i-th floor, defined according to the Turnšek and Cacovic [
31] formulation as follows:
being
the design shear strength of masonry in the absence of normal stresses and
the average normal stress at the
i-th floor due to the dead and variable loads under the seismic load combination.
Moreover, is the area of resistant walls along the X direction of the building at the i-th floor, is a coefficient related to the strength of masonry spandrels (equal to 1.0 in the case of strong spandrels or to lower values, minimum 0.8, for weak spandrels), depends on the plan regularity of the i-th floor and varies from 1.00 to 1.25 (for safety 1.25 can be assumed), is a coefficient equal to 1.0 for shear or 0.8 for flexural failure of the masonry walls, is a coefficient related to strength and stiffness homogeneity of the masonry piers at the i-th floor and can be assumed to be equal to 0.8 for safety.
2.2.5. L&R Method
In Lourenço and Roque [
13] three simplified indices are proposed for assessing the vulnerability of masonry churches based on simple geometrical parameters and mechanical properties of masonry. In this paper, the only base-shear ratio, given by the ratio of the shear strength of the structure,
Vrd,i, to the total base shear under seismic loads,
VSd, is considered according to the following expression:
where
Awi is the in-plan area of the earthquake resistant walls in the
i-th direction,
Aw is the total in plan area of the earthquake resistant walls, φ and
fvk0 are the friction angle and the cohesion of the masonry, respectively,
γ is the unit weight of masonry,
H is the total height of the building, and
β is an equivalent seismic static coefficient (
VSd =
FE =
β∙G,
G =
Aw∙γ∙H), which has been assumed with reference to the expected design acceleration on rigid soil. The coefficient
λ corresponds, thus, to
λ = PGA
d/
g.Clearly, according to this simplified approach, the safety condition for the examined buildings corresponds to γ3 ≥ 1.
3. Comparative Evaluation of the Simplified Methods through Case Study Applications: A School Building Stock in the Campania Region
The above methods have been applied to a sample of school buildings located in the province of Naples (Italy). Buildings of the stock are different mainly for structural typology, geometry, and age of construction. For some of them, a lot of information is available, while for others the starting data are limited. Depending on the information necessary for the application of each method, the reference sample is customized according to the level of knowledge available for each building of the whole set. The comparison among the results obtained from the application of the different methods allows one to highlight advantages and weaknesses of each method, to identify the convenience in the use of them according to the specific available information and the objectives of the analysis, and, finally, to evaluate which method is more or less safe.
3.1. The Building Dataset
The sample used as a case study refers to the school buildings of the Province of Naples. A number of 1185 cases were firstly individuated as those for which at least basic data were available (i.e., type of vertical and horizontal structural system, construction period).
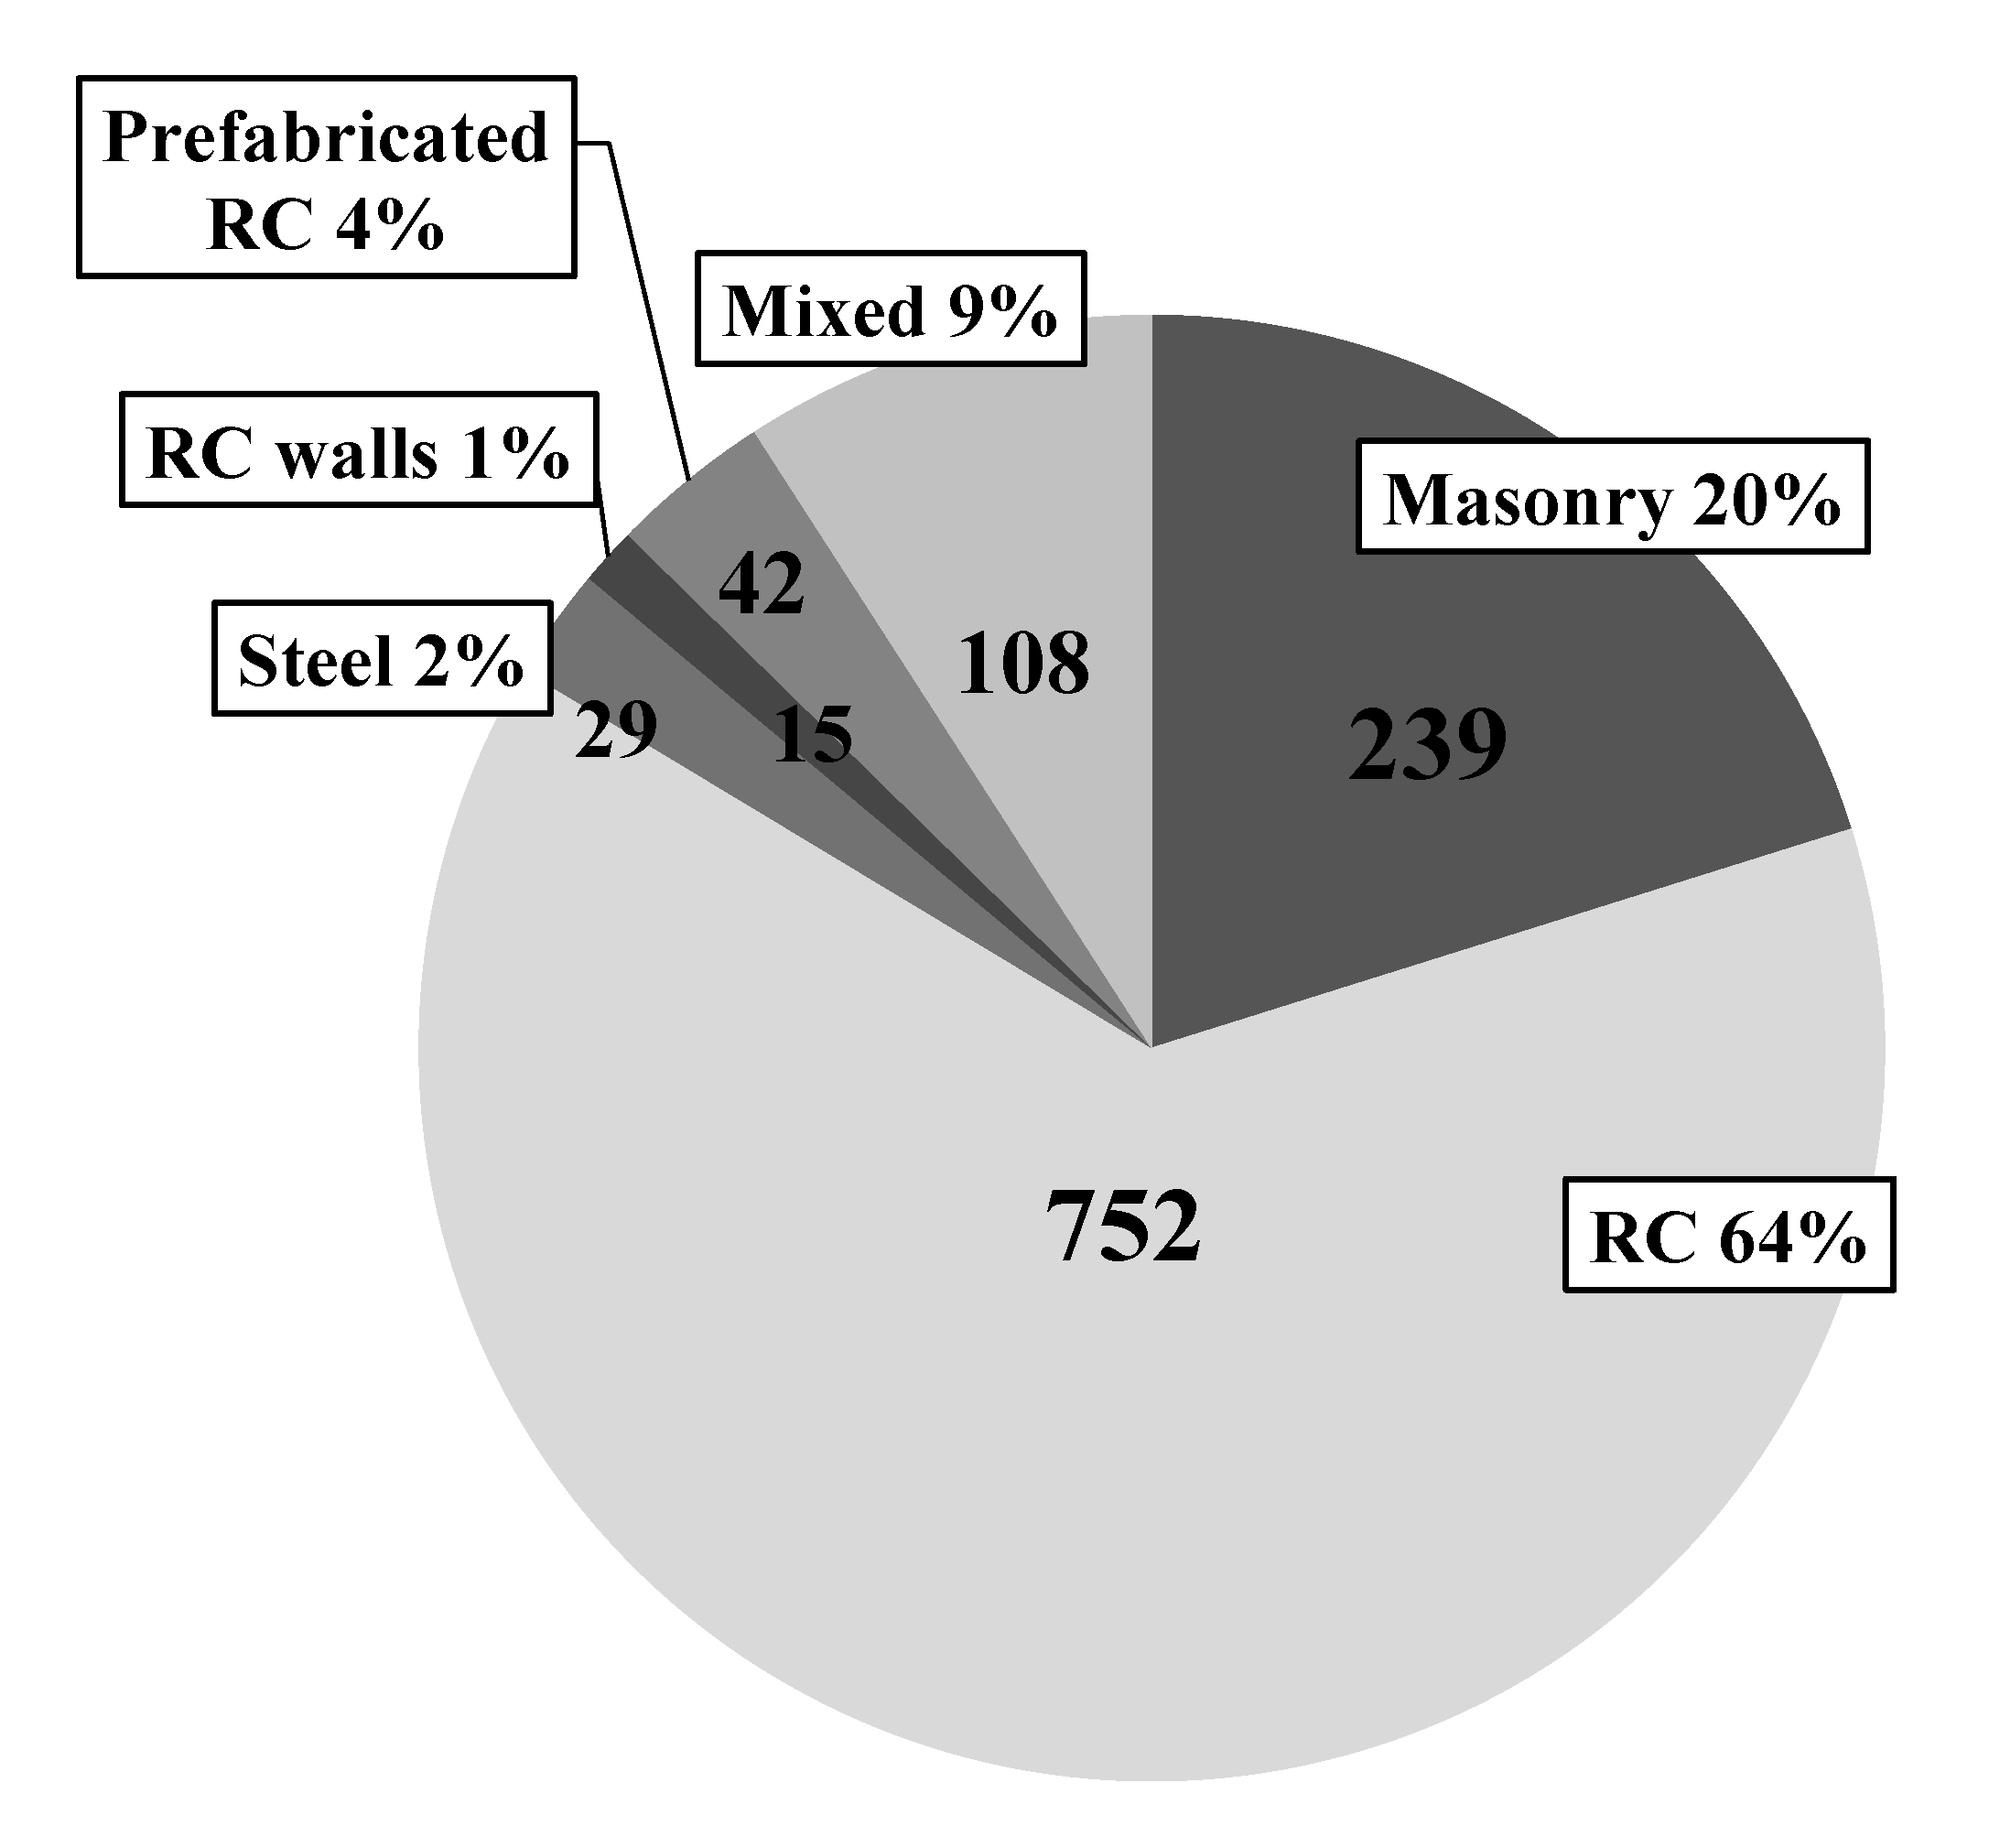
Most of the schools (64%) were RC structures, 20% were masonry buildings, while the remaining ones were made of steel or other materials (
Figure 3). Most of the schools with a mixed structure (76 out of 108) were mixed concrete-masonry buildings. Focusing attention on the above cited three main categories (RC, masonry, and mixed RC-masonry), the sample reduced to 1067 units.
With reference to the stock of 1067 buildings,
Figure 4 reports the type and occurrence of the horizontal structural systems. Most of the buildings, i.e., 90%, regardless of the type of vertical structure, had horizontal structures made of RC floor. Floors made of steel elements and bricks were the second most frequent typology, mainly in the masonry buildings (23%), while few cases of vaulted ceilings were present, i.e., for masonry buildings only.
Figure 5 reports the distribution of the construction age of the buildings, available for all the selected 1067 cases. Most of the masonry buildings (38%) date back before 1945 and a relevant part (31%) were built between 1946 and 1960. Only 11% of masonry buildings were built after 1975, without any more precise information about the year of construction. This highlights that almost all masonry buildings in the dataset were designed without any seismic regulations since the Campania Region was not considered a seismic zone up to the 1984.
Conversely, most of RC buildings were built after 1975 (65%) and a relevant part (25%) between 1961 and 1975. About the mixed concrete-masonry buildings, most of them (64%) were built between 1921 and 1975 and about 20% after 1975. Again, for the buildings built after 1975, there is no specific information about the year and, thus, it is not possible to know exactly if they were built according or not to a seismic code.
Information about the number of stories was available for 97% of the database (i.e., for 1028 out of the 1067 buildings).
Figure 6 shows that most of buildings (45%) had two stories, followed by 26% of 1-story buildings, and by 20% of 3-story buildings. Only 6% of buildings had 4 stories. The percentages were similar also when calculated referring to the single building typologies (masonry, RC, and mixed RC-masonry).
Finally, most of buildings (96%) of the dataset made of 1067 cases were located in a seismic zone belonging to the 2nd category since they were in the same district of Naples. The remaining 4% belonged to the 3rd category (classification of seismic zones according to OPCM 3274, [
33]).
3.2. Historical Seismicity of the Area
In Italy the classification of the seismic hazard, which is fundamental for the seismic design of buildings, has changed profoundly over the decades. This obviously plays a significant role for seismic risk of existing constructions.
With reference to the case study, it is worth remembering that the first seismic classification in Italy was introduced in 1927, when a royal decree (R.D. 431/1927 [
34]) defined generically two seismic categories. Afterwards, a royal decree in 1935 (R.D. 640/1935 [
35]) associated values of expected ground acceleration to those categories: 0.10 g for category I and 0.05 g for category II. In 1975, a more refined seismic hazard map was introduced (D.M. 40/1975 [
36]) and extended the hazard to a wider area of the Italian territory than in the past. In 1984, a ministerial decree (D.M. 19.6.1984 [
37]) introduced the differentiation of the seismic protection level through a seismic protection coefficient depending on building categories (equal to 1.0 for ordinary structures, 1.4 for strategic constructions, and intermediate values in other cases) in order to define the seismic forces.
The seismic classification of the national territory was further updated, according to the knowledge and experience of the seismic events recorded during the time. Later, in 2003, a seismic zonation based on the probabilistic values of the expected ground acceleration was introduced (OPCM 3274/2003 [
33]). For the first time, the whole national territory was classified as seismic and was divided into four categories. Each category is identified by the value of peak ground acceleration on stiff soil (rock) with an exceeding probability of 10% in 50 years and a corresponding return period of 475 years (i.e., −50 yrs/(ln(1–10%))). For each of the four zones, the seismic design of new buildings was imposed with different levels of severity, with the exception of zone 4, for which the regions were empowered to adopt specific obligation. The new Italian code for buildings in 2008 (NTC 2008 [
38]) and its next update (NTC 2018 [
39]) definitively abolished the so-called ‘seismic zonation’. The new code, indeed, introduced a point-by-point mapping of the seismic hazard in terms of peak ground acceleration, defined according to the geographical coordinates of whatever site in Italy and for several return periods.
In
Figure 7, the evolution of the seismic hazard map in Italy from 1935 to 2008 was reported with reference to the above conventional return period of 475 years. The current seismic hazard map for the Campania region reported values of PGA—with 475 years of return period—between 0.07 (southern coast) and 0.26 g (near the Apennines, in the province of Benevento). The schools that belonged to the reference database for this research are located in the province of Naples (therefore medium seismicity), with a PGA value on rock between 0.09 and 0.19 g. It is worth noting that for many areas seismicity was significantly re-evaluated over the time, because the earthquakes occurred in the last decades on the national territory. This means that many buildings designed and built in the past now may have strength incompatible with the current seismicity of the site and a significantly lower safety in comparison with recent constructions.
3.3. Application of Methods of Group A
Finally, for the application of the methods belonging to Group A, 1010 buildings (of the 1067 of the whole sample) were considered, since for these buildings all the information necessary for applying the methods were available. The sample was, thus, composed as follows: 707 RC buildings, 228 masonry buildings, and 75 mixed RC-masonry buildings. It is worth noting that the data about the buildings were extracted from a regional digital platform and did not come from direct in situ surveys of the authors. Such a platform includes several information (administrative, functional, structural, plant engineering, and logistic) that the owners should insert in different forms, but not all the required fields are fully filled. Moreover, some data, including structural details, are not mandatory. This leads some heterogeneity about the information contents of the buildings present in the database. Since the aim of the paper was to investigate the possibility of providing a ‘large scale’ seismic vulnerability judgment for a selected group of buildings using the only data extracted from the available database, the authors did not carry out any survey or request of additional information, in order to have no supplementary cost in term of time and resource. Clearly, such a choice led to applying only some of the methods existing in the literature.
The design seismic action PGA
d assumed as a reference corresponds for all methods to a return period of 475 years, usually adopted to check the life safety (LS) limit state for existing buildings according to Eurocode 8 (EC8 1998 [
32]) and corresponding to a probability of exceedance of 10% in 50 years. Since no specific information are available about the subsoil typology and the stratigraphic conditions of each site, average values for the coefficients related to these parameters were assumed for all buildings, i.e., S
s = 1.20 for subsoil type B and S
t = 1.00 for topography typology T1 (NTC 2018 [
39]; EC8 1998 [
32]).
3.3.1. Results of the SAVE Method
As explained in
Section 2.1.1, the SAVE method [
18] assigns an index, SPD, and a vulnerability class from A (high vulnerability) to D (low vulnerability) based on the information about the typology of vertical structures. In
Table 11, the indexes and the classes provided by the SAVE method were calculated for 935 buildings (the 75 buildings with ‘mixed’ typology were, indeed, not considered by the method): 228 masonry buildings and 707 RC buildings distinguishing the masonry buildings in regular (226) and irregular (2). It is worth noting that all the RC buildings fell in class
Dv, all the masonry buildings fell in class
Bv, with exception of the 2 irregular masonry buildings that fell in class
Av.
For masonry buildings, the corrected vulnerability index was calculated considering four independent parameters: the presence of isolated columns, position of the building (isolated or aggregated), the presence of ties, and regularity in plan or along the height. This assumption leads to having 16 combinations of parameters able to modify the original values of SPD. In
Table 11, since specific information were not available for the whole dataset, the worse (case 1) and the best (case 2) modified values of SPD within the 16 combinations are listed. The worse combination, leading to an increase of the index, was obtained by considering the presence of isolated pillars, aggregated position, absence of ties, and irregularity in plan or along the height. Due to these assumptions, all masonry buildings fell in class A, with an increase of the SPD of about 20%, which determined an increase of the vulnerability class only for the regular masonry buildings. Conversely, under the best combination of parameters, the index reduced by about 18% leading to all masonry buildings being in class B and, thus, to an improvement of vulnerability only for the irregular buildings. The analyses allowed evidence also that the position of the building was the most influencing parameter in terms of SPD variation.
For RC buildings, the corrected vulnerability index was calculated considering three independent parameters: the position of the building in the aggregate (isolated, internal, and angle), regularity in plan or along the height, and regularity of infill walls. Thus, seven combinations of parameters were considered and in
Table 11 the values of SPD and the classes corresponding to the worse and best combinations are listed. The analyses evidenced that the most significant parameter was the regularity of infill walls. Under the best combination (case 2), the index reduced by 18% and all buildings remained in class D, while, under the worse one (case 1), the index increased by 18% and all the buildings fell in class B.
3.3.2. S&C Method
The method proposed by Sandoli and Calderoni [
9] was applied to the 707 RC and the 228 masonry structures, i.e., 935 buildings in total excluding, thus, the buildings with ‘mixed’ structure. The method provides ranges for the maximum PGA sustainable for the buildings, i.e., the values of PGA
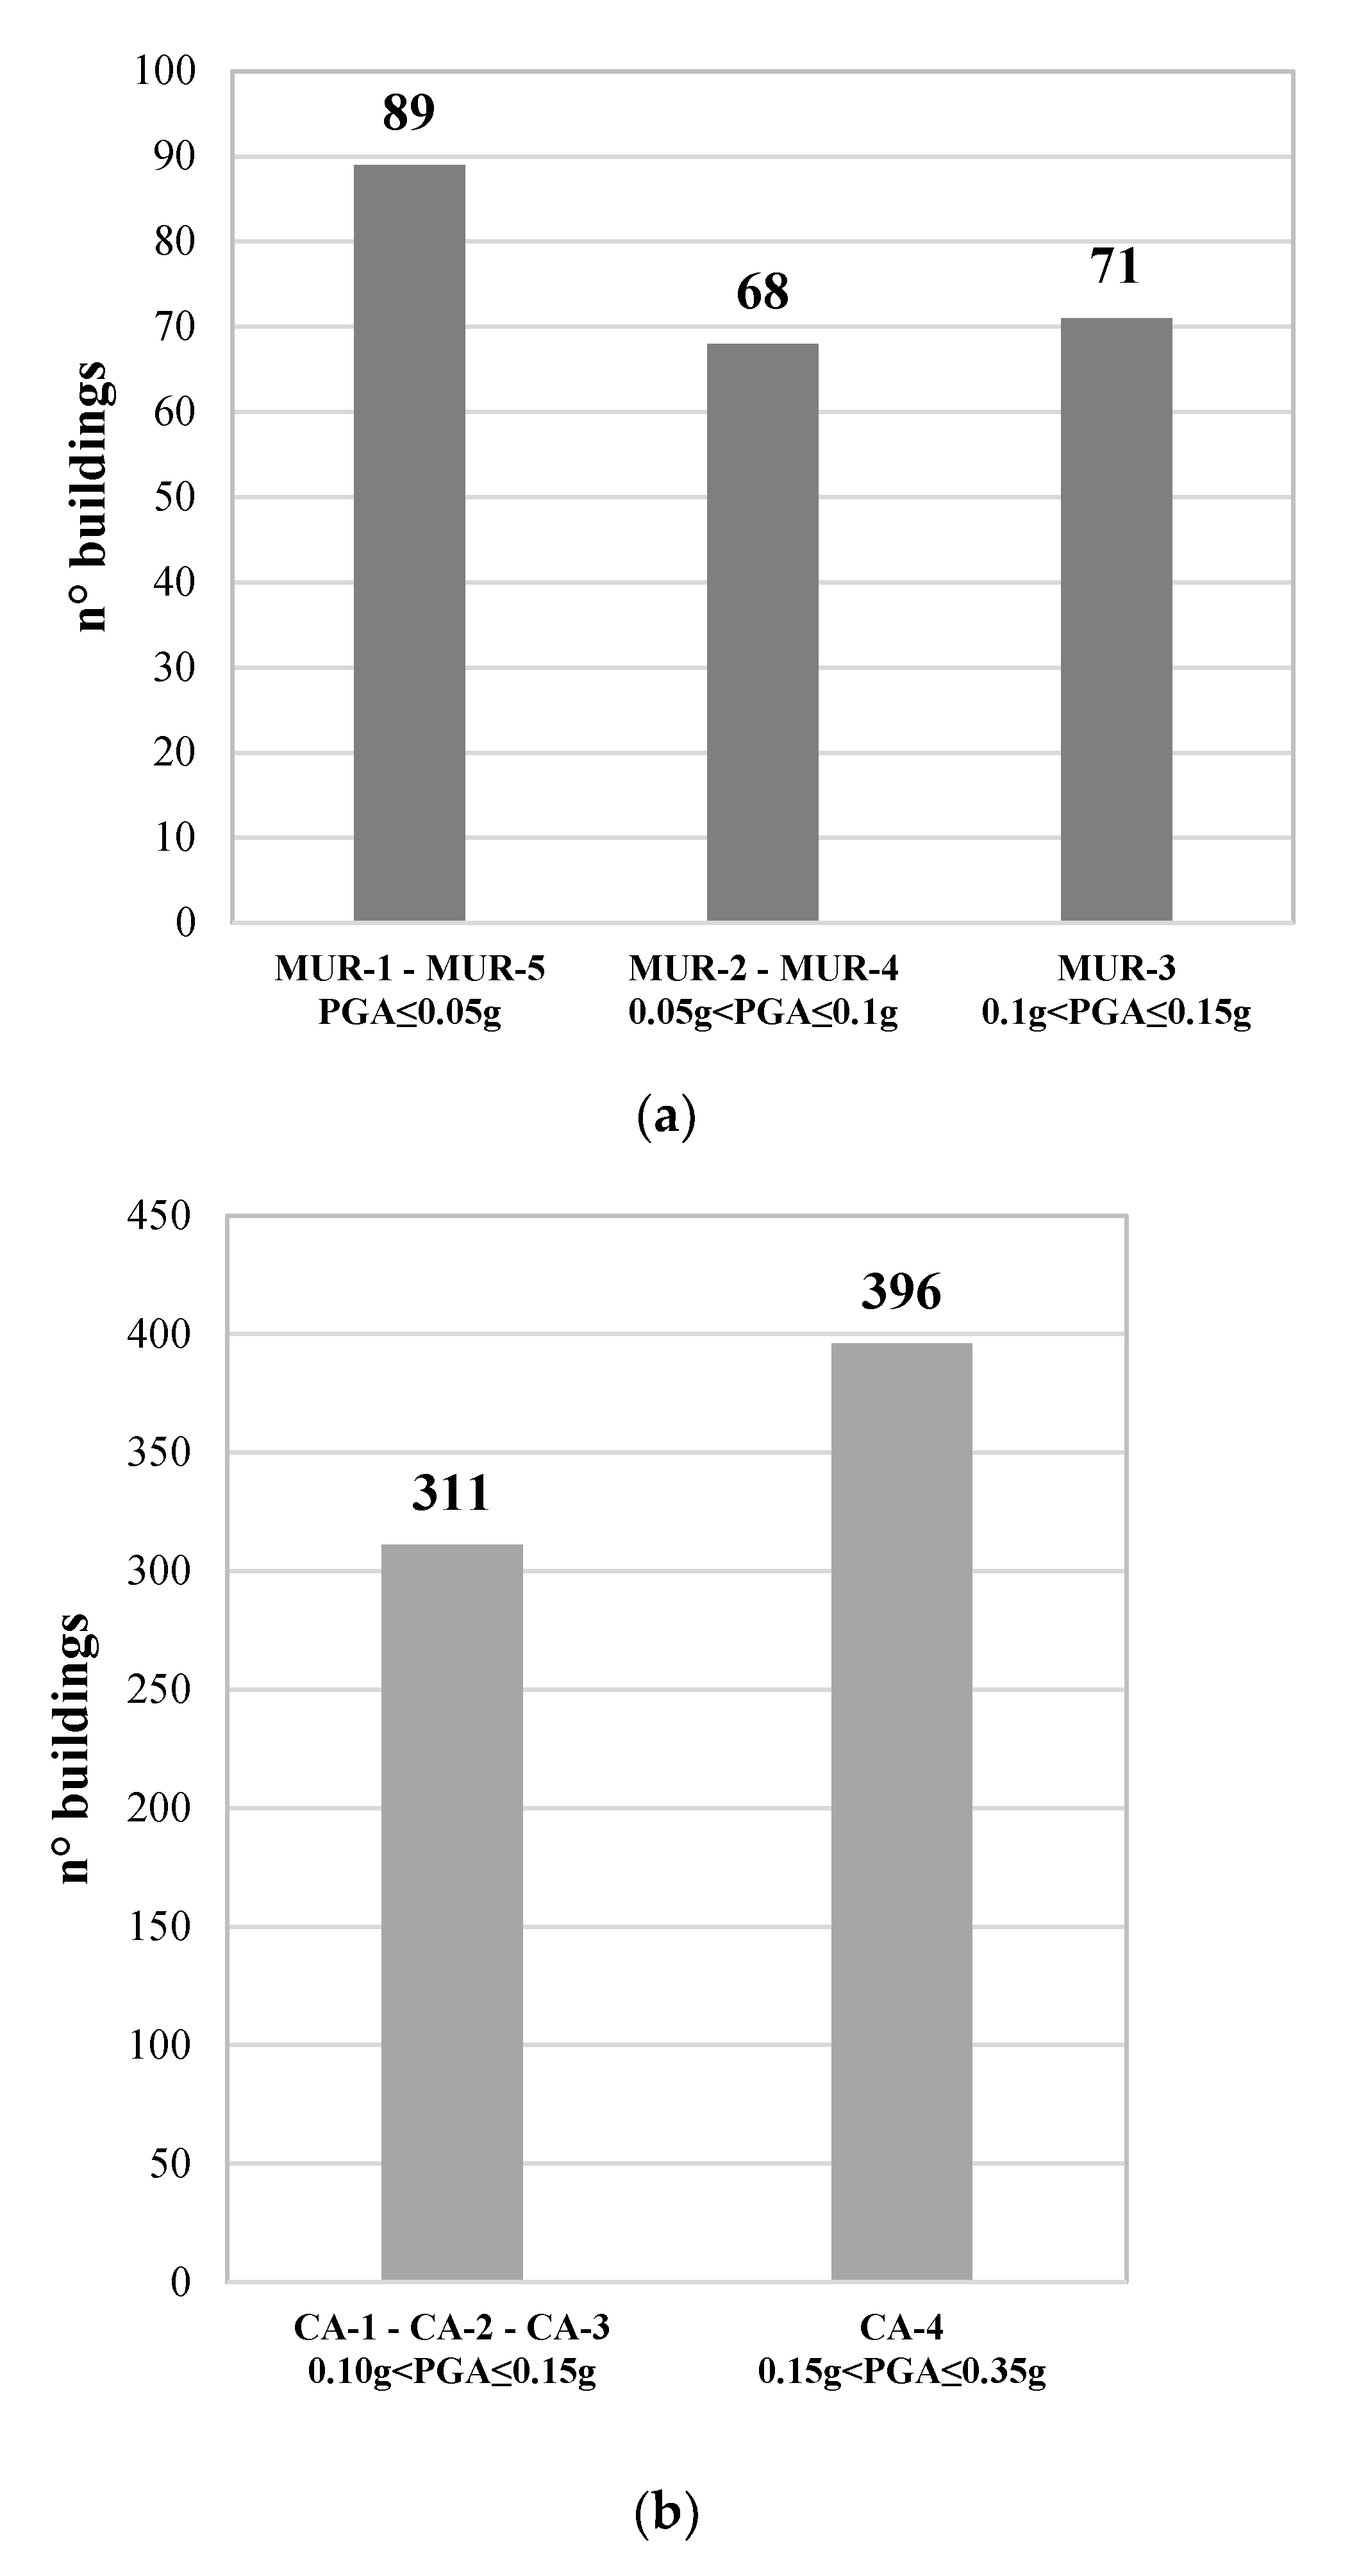
c, in the function of the building typology.
Figure 8 reports the occurrence of the masonry and RC buildings within the PGA
c classes defined by the S&C method.
In
Figure 9, for each building category, the average value of the PGA range, PGA
c, was divided by the design PGA, i.e., PGA
d, at the LS limit state. For masonry buildings,
Figure 9a shows that the capacity was lower than the demand (i.e., PGA
c/PGA
d < 1) in most cases (225, i.e., 98.6%). In particular, 62% of buildings had values of PGA
c/PGA
d < 0.45 and, thus, were characterized by a high seismic vulnerability, while 27% of buildings had PGA
c/PGA
d in the range 0.60–1.00, i.e., were characterized by medium vulnerability.
For RC buildings,
Figure 9b shows that 40% of buildings had PGA
c/PGA
d < 1, mostly within the range 0.6–0.8. Note that in
Figure 9b, buildings of class CA-4, which corresponded to buildings realized after some seismic codes became mandatory (i.e., 1984 in the Campania region), were not reported since the range of PGA
c was too wide (0.15 g < PGA
c < 0.35 g) and the use of the average value of the range was not reliable.
Thus, for RC buildings of class CA-4, the values of PGAd provided by the current code have been compared with the lower and upper limits of the PGAc range proposed by the S&C method, resulting in the following judgment:
‘Safe’ if PGAd < PGAc,MIN;
‘Not safe’ if PGAd > PGAc,MAX;
‘To investigate’ if PGAc,MIN < PGAd < PGAc,MAX.
Among the 374 RC buildings of class CA-4, only 22 could be defined surely ‘safe’, while in most cases it resulted in PGAc,MIN < PGAd < PGAc,MAX and, thus, more detailed analyses should be carried out.
3.3.3. Grant Method
The method proposed by Grant et al. [
15] was applied to 122 RC buildings only, which were those realized after 1984. In fact, for buildings realized before, lacking a mandatory seismic code, the definition of “PGA deficit” did not make sense.
Figure 10 shows the distribution of the ratio PGA
d,to/PGA
d and highlighted that 50% of cases were in the range 0.15–0.30, 30% in the range 0.30–0.45, and only 15% had PGA
d,to/PGA
d > 1. Note that, according to such a method, the design PGA at the construction time, PGA
d,to, was assumed ‘equivalent’ to the PGA capacity of the building. These results further highlight how the seismic hazard in Campania had changed over time since 1984 (see
Section 3.1).
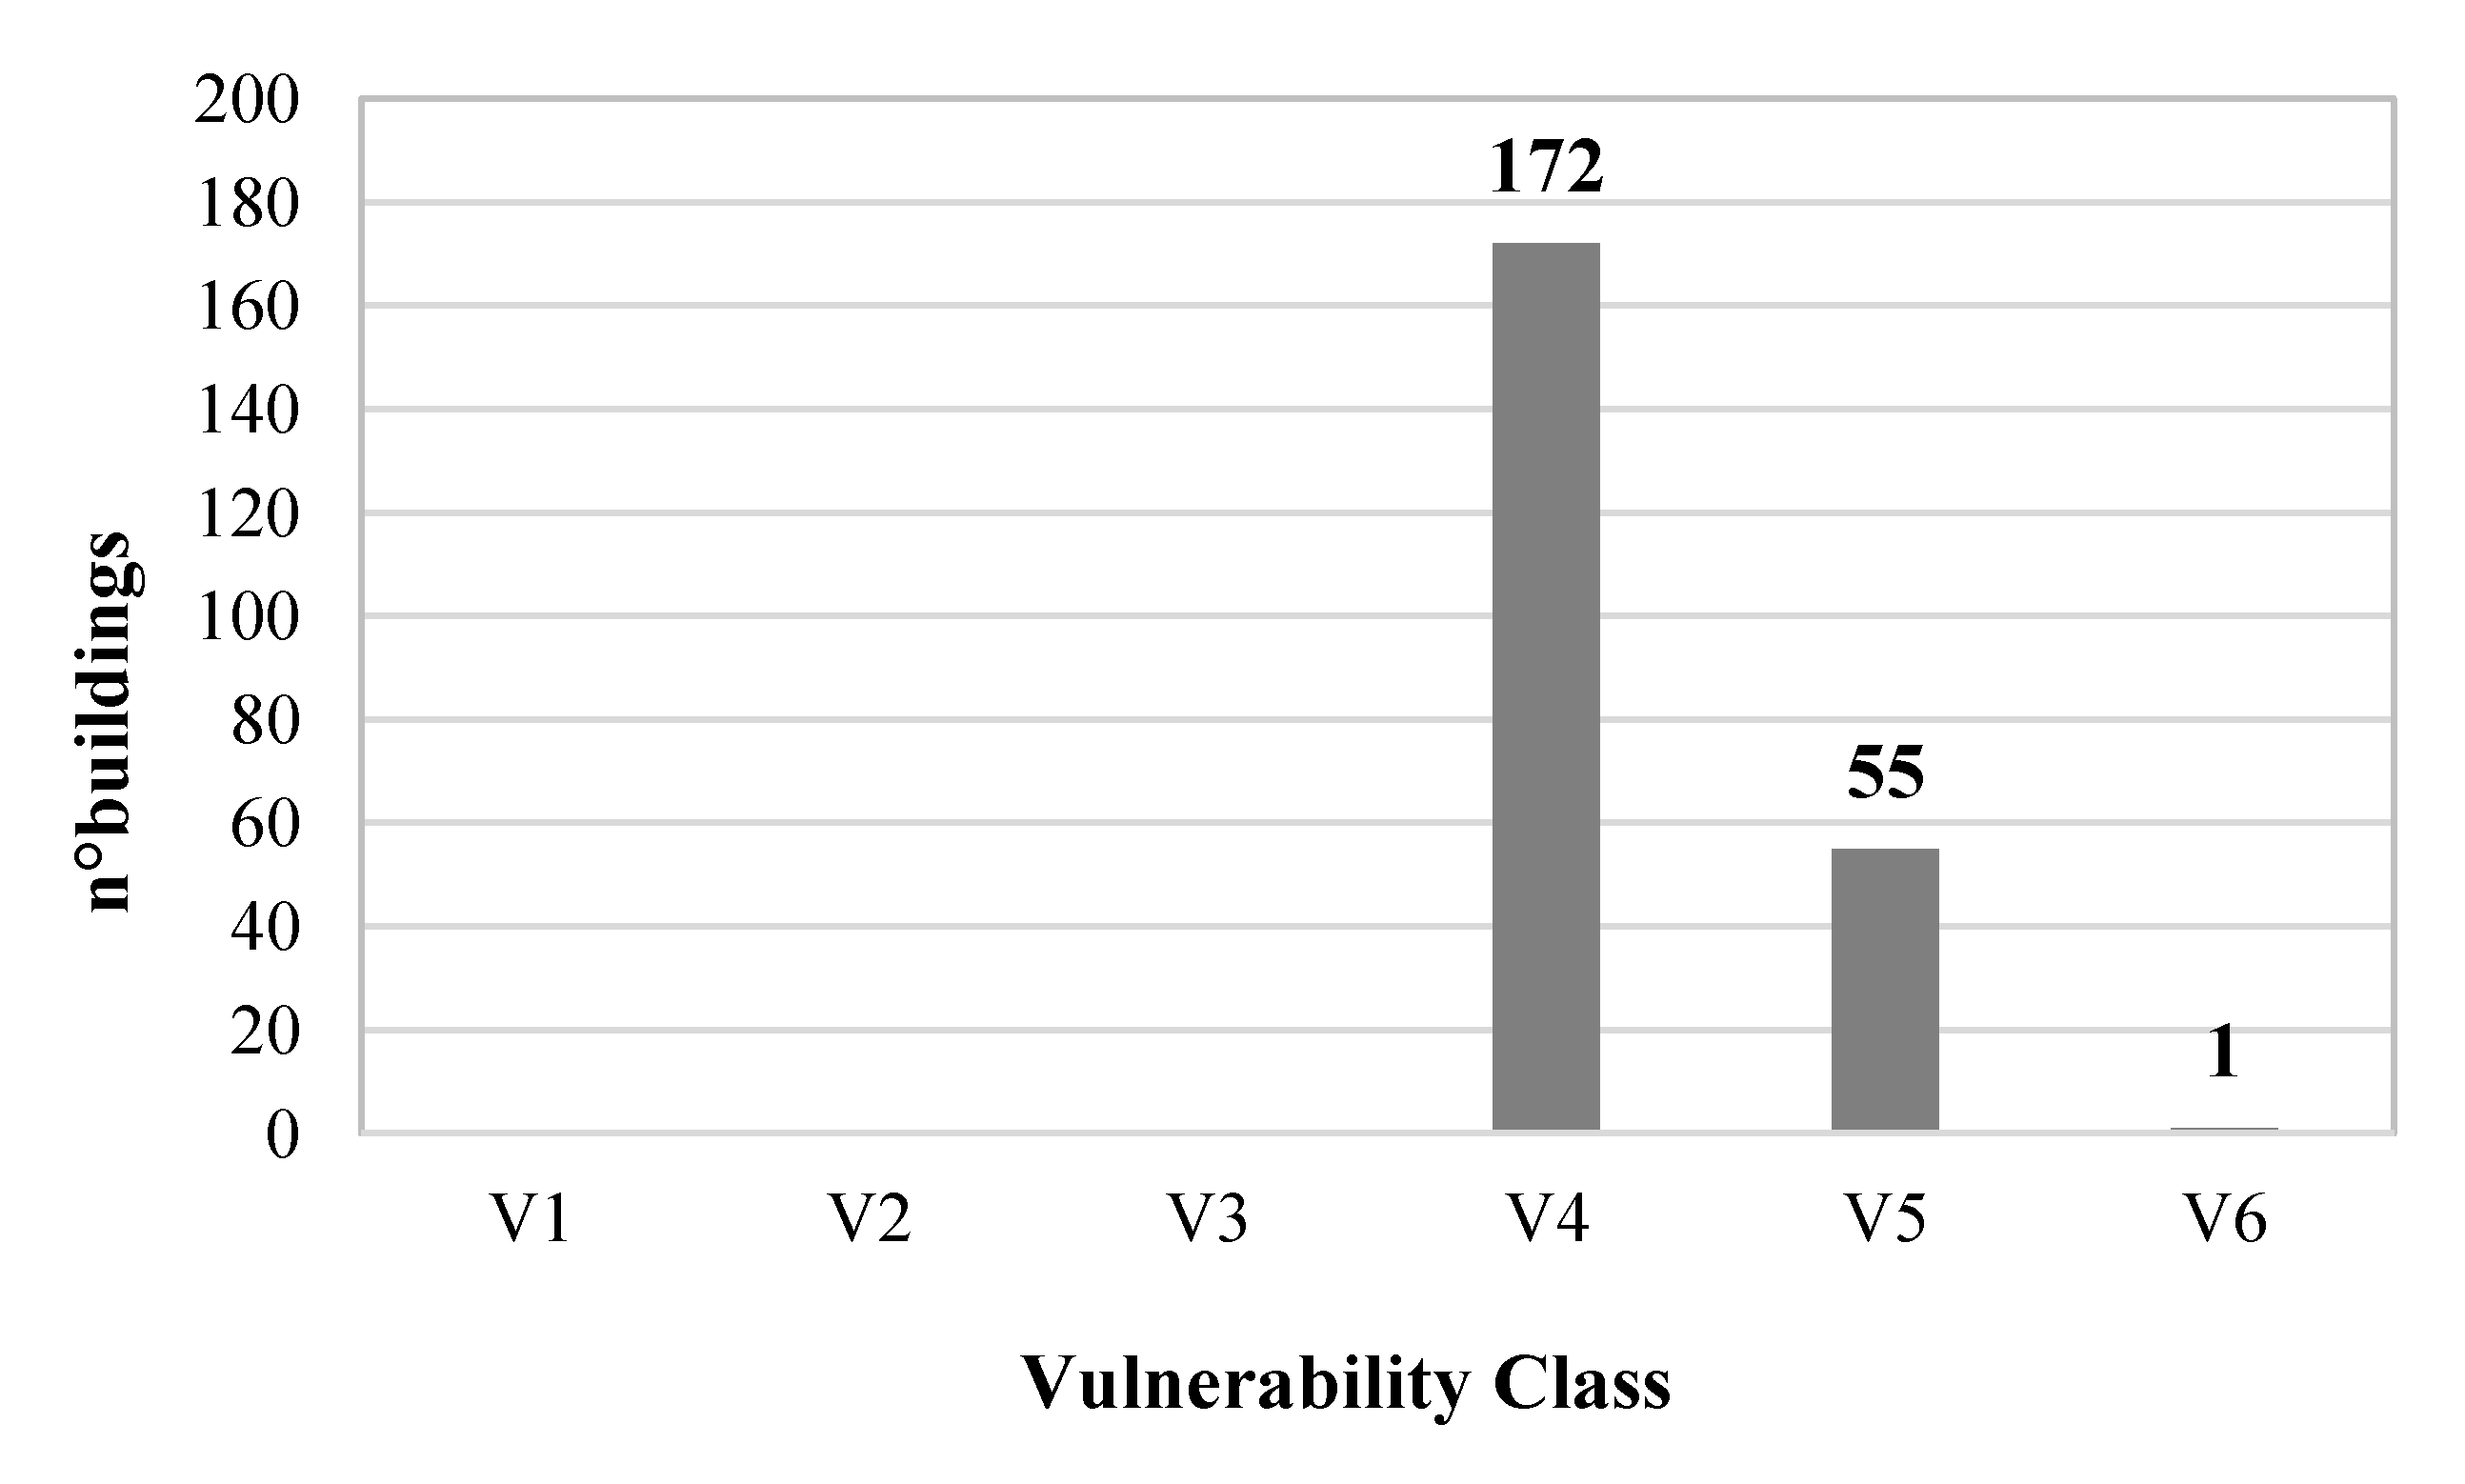
3.3.4. DM 58/17 Method
The simplified method provided in the annex of the DM 58/17 [
17] is suitable for masonry buildings only. For this reason, it was applied on the subset of 228 masonry buildings out of the overall building stock. According to the information available about the constructive typology, i.e., the type of masonry, a vulnerability class was assigned (see
Figure 2) and the distribution of the examined buildings in the six classes was plotted in
Figure 11.
Most of the buildings (75%) were assigned to the class V4, since they had RC floors. The buildings made of regular bricks and different types of slab (25%) were assigned to the class V5. The two buildings made of irregular masonry were assigned one to class V5 and the other to class V6, due to the different constructive techniques.
3.3.5. Discussion of Results and Comparison among Methods of Group A
Table 12 and
Table 13 report the comparison of the results provided by the simplified methods of Group A for masonry and RC buildings, respectively. It is worth noting that the methods SAVE, S&C, and DM58/17 provide the definition of vulnerability classes for buildings based on structural typology and retrieved on the classification proposed by the European macroseismic scale (EMS98 [
22]). For SAVE and S&C methods, the vulnerability class starts from ‘A’, meaning the highest vulnerability, and decreases to the ‘D’. DM58/17 suggests six vulnerability classes from 1 (lowest vulnerability) to 6 (highest vulnerability). Conversely, the S&C method gives three ranges of PGA capacity that can be associated to a high, medium, and low vulnerability. Note that for the SAVE method the not corrected vulnerability judgments were reported, i.e., the vulnerability classes were based on the only vertical structure typologies.
According to the SAVE method, almost all the masonry buildings (226 out 228,
Table 12) fell in the ‘high-medium’ vulnerability class (i.e., B
V that corresponds to class B
EMS/C
EMS of EMS98) while, according to DM58/17, 24% fell in the ‘high-medium’ class and 75% in the ‘medium’ classes (i.e., classes V
5 and V
4, which corresponded to class B
EMS and C
EMS of ESM98, respectively). The vulnerability judgments provided by these two methods were, thus, comparable. For the S&C method, the masonry buildings were almost equally distributed in the three classes, evidencing, thus, more distributed vulnerability judgment within the classes in comparison with the other two methods.
For all the RC buildings (
Table 13), the SAVE method provides a ‘low’ vulnerability class, while the S&C method predicted for 44% buildings of the sample a ‘high’ vulnerability class and for the remaining 56% a ‘low’ vulnerability class. Again, the S&C method provides more distributed vulnerability judgment within the proposed classes. It is worth noting that the DM58/17 did not provide a simplified method for RC buildings.
Finally,
Table 12 and
Table 13 show also that, according to the analyzed methods of Group A, the masonry buildings were characterized by more severe vulnerability judgments in comparison with the RC buildings. This result is expected due to the intrinsic vulnerability of masonry buildings with reference to horizontal actions when designed for gravity loads only.
3.4. Application of the Method of Group A and B to a Reduced Sample of Buildings
Methods of Group B were applied to 14 masonry buildings, since only for these buildings all geometrical and mechanical data necessary for applying the methods were available. For the same dataset of buildings also methods of Group A were applied.
For all methods, the design seismic action, PGAd, was again expressed by the design PGA for the return period of 475 years and subsoil type B. In particular, for the 14 examined buildings, the PGAd varied in the range 0.18–0.21 g (i.e., corresponding to 0.15–0.18 g on rock).
Based on the information gathered by the forms available in the digital platform, it was evidenced that all the examined masonry buildings were made of tuff stones with regular texture and floors were mainly made of RC elements and light bricks, while in a few cases were made of steel profiles and light bricks. The height of buildings was variable from 4.0 to 9.0 m; in particular, nine buildings had 1 or 2 floors, three buildings had 3 floors, and two buildings had 4 floors. The wall geometry was gathered by the digital platform too, in particular the areas of the resistant walls in the two directions were detected due to technical drawing of each floor available for these buildings. About the construction period, seven buildings were realized before 1960, four buildings between 1960 and 1975, and three buildings were built before 1945.
Within the categories suggested by the annex document (Annex n. 7, 2019 [
40]) to the Italian building code (NTC 2018), the typology ‘regular tuff masonry’ was assigned to all 14 buildings. Physical and mechanical parameters of masonry were, thus, defined according to the ranges of values provided for existing masonry buildings in (Annex n. 7, 2019 [
40]) and assuming a basic level of knowledge, i.e., LC1, for structural geometry, details, and materials. Such an assumption leads to assessing the design values of mechanical properties as equal to the lowest values of the provided ranges divided to the so called “knowledge factor”, FC, which was 1.35 for the level of knowledge LC1.
For ‘regular tuff masonry’, the unit weight was assumed to be
γ = 16 kN/m
3, while the lower bounds for the average shear strength without normal stresses were
τ0 = 0.04 MPa and
fv0 = 0.10 MPa. Note that
τ0 was the shear strength for tensile failure in the masonry and was used in the Turnšek and Cacovic [
31] formulation, while
fv0 refers to a sliding failure along the joints and was used in the Mohr–Coulomb criterion. Thus, considering the level of knowledge LC1, the design values of the shear strength were:
- -
τ0d = τ0/FC = 0.04/1.35 = 0.03 MPa,
- -
fv0d = fv0/FC = 0.10/1.35 = 0.07 MPa.
In order to uniform the values of the shear strength adopted by the examined methods and provide comparable judgments, the following assumptions have been done:
- -
GNDT: τ0k = 0.03 MPa;
- -
RE.SIS.TO: τ0 = 0.03 MPa;
- -
DPCM: τ0d = 0.03 MPa;
- -
L&R: fv0k = 0.07 MPa.
When the Mohr–Coulomb criterion was used, i.e., in the only L&R method, for the friction angle of masonry, lacking specific information, the common value tan φ = 0.4 was assumed.
For the floors, the unit weight of 4 kN/m2 was assumed in all cases. Such a value, together with the unit weight of masonry, was used for evaluating the average normal stress acting in the masonry walls at each floor.
Note that the methods Azizi, RE.SIS.TO, and GNDT of Group B allow one to express both a quantitative and a qualitative, i.e., linguistic, judgment (from ‘low’ to ‘high’) about the level of vulnerability of the buildings. Thus, in
Section 3.4.1, the quantitative judgments in terms of capacity-to-demand ratio provided by methods RE.SIS.TO, GNDT, DPCM 9/2/2011, and L&R were presented and compared with each other.
Successively, in
Section 3.4.1, the linguistic vulnerability judgments given by methods of Azizi, RE.SIS.TO, and GNDT were compared with each other and with those obtained using the methods of Group A (S&C, SAVE, and DM58/17).
3.4.1. Simplified Vulnerability Assessment via Quantitative Safety Factors
Methods of Group B give a quantitative estimation of the seismic vulnerability, based in most cases on a simplified assessment of the seismic capacity-to-demand ratio (expressed in terms of ground acceleration or base shear).
In
Table 14, the values of such “safety factor” are listed for the 14 selected masonry buildings and in
Figure 12 the comparisons among the examined are graphically shown. Note that, in the assessment of the capacity-to-demand ratios, for the DPCM method both shear and flexural failure modes were considered, since more detailed information about the buildings were not available and the lowest safety factor was finally considered (it resulted in being the one associated to flexural failure, in all the cases). For the L&R method, the lowest value between those related to x and y directions is reported for each building. In
Table 14, the ‘envelope’ column summarizes the most severe results obtained by applying the quantitative methods of Group B and corresponding to the lowest seismic capacity-to-demand ratio.
Table 14 and
Figure 12 show that the GNDT method was the less safe approach since for all examined buildings the safety factor was largely > 1. This is probably due to an overestimation of the PGA capacity that depends both on the correlation given by Equation (3) and on the judgments assigned in the relief form, which were strongly affected by the subjectivity of the compiler or by a lack of information.
Conversely, the DPCM method was the safest one, since it provided safety factors lower than 1 for more than the 85% of the buildings, with 43% of buildings (7) with safety factors lower than 0.5.
The RE.SIS.TO method provided values of safety factors similar to those provided by the DPCM method, with the exception of buildings 3, 8, and 10 characterized by quite different predictions.
Index γ3 given by the L&R method seemed to be the most balanced one, since no building had a factor γ3 lower than 0.5, but it is worth noting that for buildings 2, 4, 7, and 11 the index was significantly higher than the values provided by the DPCM and RE.SIS.TO methods.
Finally, the values of the capacity-to-demand ratio given by the S&C method of Group A are listed in
Table 14 too; they were always lower than 1 and in most cases lower than the values provided by the DPCM method, resulting, thus, in the safest approach. However, as previously underlined, it is worth noting that the S&C method gave a very approximate prediction of PGA
c. Note that the only parameter variable within the 14 buildings and influencing the judgment was the construction age, and thus it had sense that the method was very safe.
3.4.2. Simplified Vulnerability Assessment via Linguistic Judgments
For the selected 14 masonry buildings, the vulnerability was investigated by means of some qualitative methods of Group A too. In
Table 15, the qualitative judgments given by methods S&C, DM 58/17, and SAVE are listed together with the ‘envelope’ column corresponding to the safest results within these methods. It can be noted that the SAVE method was the safest one, since it provided for all 14 buildings a ‘high’ vulnerability. Conversely, lower differences could be observed between the S&C and DM 58/17 methods, even if the latter one seemed to be safer (in most cases, indeed, the judgments were comparable or slightly more severe).
In
Table 15, the qualitative results provided by some methods Group B are listed too. In particular, for the Azizi and the GNDT methods, both the numerical results, i.e., the indexes
R and
Iv respectively, and the corresponding qualitative judgments were reported in order to be compared to each other. Note that the qualitative judgments given by the RE.SI.STO method were related to the values of the safety index already listed in
Table 14 on the basis of the correspondence proposed in
Table 10 [
5]. Additionally, the qualitative judgments of DPCM and L&R methods listed in
Table 15 were obtained by a conversion of the quantitative results, already listed in
Table 14, in accordance with
Table 10. It could be observed that the results of these methods, compared with the linguistic outcomes of the others of Group B, were consistent on average, although those from L&R method estimated a lower vulnerability.
Additionally, for the methods of Group B, the ‘envelope’ column summarized the most severe results. Among these methods, there was a substantial agreement of the results obtained by RE.SIS.TO and GNDT. On the contrary, the Azizi method led to unconvincing results because all 14 buildings of the set were assigned to a ‘low’ vulnerability class. It is worth noting that these conclusions could not be generalized because they depended on the characteristics of the sample examined, but they represent a solid basis for further study in this direction.
Comparing the qualitative judgments of the two groups of methods, as expected, the more simplified methods of Group A that led to more conservative results than those provided by methods of Group B, which, nevertheless in
Table 15 refer to linguistic judgments, were based on a larger number of structural information.
Finally, it is interesting to highlight that the results obtained with the expeditious method of DM 58/17 were consistent with the ‘envelope’ related to the most sophisticated methods of Group B. This suggests that the DM 58/17 method and thus the EMS scale should be used, at least for masonry structures, whenever the available data are very limited.
Figure 13 graphically summarizes the data reported in
Table 15, in order to make the comparison among the examined methods easier, also distinguishing those of Group A, basically safer, and those of Group B, more ‘realistic’ because it is based on more information. The graph of
Figure 13 was useful to show that, for the same building, the vulnerability judgment provided by the methods of Group B could be better or worse than that assessed by the means of the method of Group A, but in most cases they were less safe. For the 14 examined masonry buildings, based on the results of Group B (excluding the Azizi method), about 50% of the structures had, indeed, a ‘low’ or ‘medium-low’ vulnerability, while, based on the results of Group A (excluding the S&C method), all the buildings had a ‘medium’ or ‘medium-high’ vulnerability. Moreover,
Figure 13 shows also that two methods of Group A (DM 58/17 and SAVE) gave similar vulnerability judgments for the 14 buildings, while most methods of Group B (with the exception of the Azizi method) provided different judgments for the 14 buildings. These results evidence that the methods of Group B allow one to highlight the singularity of each building, since more detailed information (geometry and material properties) are required for their application, while the more general methods provide judgments for ‘classes of buildings’, where specific data concerning the single building are not taken into account.
4. Conclusions
The need of defining a reliable method for assessing the seismic vulnerability of existing buildings is crucial in order to prevent damages and subsequent economic loss, both in ordinary conditions, through the adoption of an adequate maintenance program, and extraordinary conditions, such as the emergency phases following an earthquake. Since an important aim is the estimation of the consequences of a seismic event on a territory, several methodologies are available in the literature aimed to provide an assessment of the seismic vulnerability on a ‘large scale’ by means of simplified analyses.
This paper was firstly focused on the analysis of some simplified methods proposed in the literature for assessing the ‘large scale’ seismic vulnerability, with a particular focus on those most suitable for the typical Italian buildings heritage. The selected methods are different in type and number of input data, type of output, limitations of use for different structural typologies, complexity of use, computational effort, and type of final judgment.
The main idea of the paper was to verify the possibility of providing reliable large scale vulnerability judgments based on a minimum set of information, already available in the local or national platform and without the necessity of carrying out additional surveys, i.e., ‘at zero cost’ in terms of time and resources. This means that the preliminary large scale vulnerability assessment could be carried out only based on few data made available by administrative offices and not coming by additional technical surveys. According to such an approach, the choice of a suitable method for assessing the seismic vulnerability on a large scale should be also consistent with the available knowledge level of the buildings and, thus, not all the methods are reliable or applicable in the case of a lack of necessary information.
The methods selected according to the above criteria were then applied to a sample of school buildings located in the province of Naples (Italy), characterized by an almost uniform seismic hazard. Buildings were different mainly in structural typology, geometry, and age of construction. The structural data necessary for applying vulnerability methods were not obtained by onsite surveys directly carried out by the authors, but came from a regional digital platform. Depending on the information necessary for the application of each method, the reference sample of buildings was customized according to the level of knowledge available.
The methods were divided into two macrocategories: Group A with the most simplified methods, which require a reduced number of parameters, and Group B with more detailed methods, which need more data. Methods of Group A provide a vulnerability judgment related to the assignment of a ‘vulnerability class’, while methods of Group B generally provide a quantitative evaluation based on safety indexes. Some methods of Group B associate a vulnerability judgment to the safety index too. It is worth noting that most methods of Group B are applicable to masonry structures only.
The comparison between the results obtained from the application of the different methods allows one to highlight the following items:
- (1)
Full database (935 buildings, application of method of Group A):
- -
For masonry buildings (228), SAVE and DM58/17 methods gave comparable vulnerability classes (high-medium), with the results of SAVE being slightly more conservative. The S&C approach judged the buildings almost equally distributed in three classes (low, medium, and high vulnerability);
- -
For RC buildings (707)—unlike masonry buildings—the SAVE method resulted in being unsafe, since it provided a low vulnerability class for all the buildings of the set. This result was not likely given the heterogeneity of the construction age of the different buildings in the set, which included both old buildings and recently designed buildings. Again, as for masonry structures, the S&C method provided more distributed vulnerability judgment within the classes. The Grant method was much safer than the S&C one, but it was applicable to a very small subset of buildings, i.e., not to those realized before 1984 in Campania Region (when the parameter PGAc could not be defined);
- -
As expected due to their intrinsic vulnerability to seismic actions, the masonry buildings designed for gravity loads only had more severe vulnerability judgments (high or medium-high) in comparison with the RC buildings.
- (2)
Reduced database (14 masonry buildings, application of method of Group A and B)
- a)
Methods of Group A
- -
The vulnerability judgments provided by the SAVE method were the safest ones, since it provided for all 14 buildings a ‘high’ vulnerability. This result was consistent with that previously found by analyzing the larger set of 228 masonry buildings. Diversified judgments for the 14 buildings were provided by the S&C and DM 58/17 methods, with the latter one safer.
- b)
Methods of Group B
- -
The GNDT method was the less safe approach since for all examined buildings the safety factor was largely > 1, probably because of an overestimation of the PGA capacity due to uncertainness about the assessment of some parameters present in the GNDT form;
- -
The DPCM and RE.SI.STO methods led to similar results, in a safe direction since the safety factors were less than 1 in most cases;
- -
The safety factors given by L&R method came to be in between the two above extreme results;
- -
With the exception of the Azizi method, only about 50% of the examined buildings had a ‘low’ or a ‘medium-low’ vulnerability, confirming the intrinsic vulnerability to seismic actions of masonry buildings designed for gravity loads only, which was also evidenced by application of methods A to the whole database.
- c)
Comparison between methods of Group A and B
- -
As expected, the more simplified methods of Group A led to safer results than those provided by methods of Group B;
- -
The expeditious method DM 58/17, based on the EMS classification, was consistent with the ‘envelope’ related to the most sophisticated methods of Group B. This made the DM 58/17 method reliable, at least for masonry structures, whenever the available data was limited;
- -
For the same building, the vulnerability judgment provided by the methods of Group B could be better or worse than that assessed by means of the method of Group A, but in most cases they were less safe. Moreover, the methods of Group B allowed to highlight the singularity of each building with diversified judgments within the examined buildings, since more detailed information (geometry and material properties) were required for their application, while the methods of Group A provided more uniform judgments suitable for ‘classes of buildings’, where specific data concerning the single building were not taken into account.
Given the results above, for RC buildings, the authors suggest the application of the S&C method from Group A for assessing the large-scale seismic vulnerability, when an accurate level of knowledge is not available for the buildings in the set. Analogously, for masonry structures, when few data are available, a rational choice could be that of applying the DM 58/17 method from Group A.
For masonry buildings, when it is possible to reach a better level of knowledge of the structures and, therefore, to apply one of the methods of Group B, the RE.SIS.TO (with more diversified judgments within the set of 14 buildings) or the DPCM 9/2/11 (more homogeneous judgments, on average safer than the L&R method) approach is preferable. The two methods require very different input parameters, in number and quality, and, thus, the designer can move towards one or the other depending on the data that he is able to collect and usable for the specific method. In particular, if the number of available parameters is small, it is advisable to adopt the method of DPCM 9/2/11, which is agreement with the judgments provided by DM 58/17 of Group A.
Based on these results, it could be concluded that the most significant parameters for reliably assessing the seismic vulnerability on the large scale are: the type of vertical and horizontal structures, number of stories, and age of construction. For masonry buildings, the following data have to be considered too in order to apply more detailed methods: the type of masonry, shear strength of masonry, total weight of the building, and normal stresses acting in the masonry walls (the latter two parameters require the knowledge of the unit weight of masonry and of the area of the resistant walls).
In conclusion, the studies presented in this paper highlighted that the assessment of reliable simplified methodologies for evaluating the seismic vulnerability was not simple since the results could be different according to the considered approach. The choice of the most suitable approach depends on the data available for the set of buildings under examination and has to take into account that the data might be not always the same for all the buildings.
Future developments of this research will be focused on: (a) the applications of the investigated methodologies to wider databases in order to confirm the indications provided in this paper and (b) performing refined non-linear structural analyses or simplified procedure suggested by mechanical approaches to calculate the ‘probable’ seismic vulnerability for a limited number of buildings present in the database after more detailed information about them have been collected.


