Mainshock-Integrated Aftershock Vulnerability Assessment of Bridge Structures


1
College of Civil Science and Engineering, Yangzhou University, Yangzhou 225127, China
2
Department of Civil and Mechanical Engineering, University of Missouri-Kansas City, 5110 Rockhill Rd., Kansas City, MO 64110-2499, USA
*
Author to whom correspondence should be addressed.
Appl. Sci. 2020, 10(19), 6843; https://0-doi-org.brum.beds.ac.uk/10.3390/app10196843
Submission received: 30 August 2020
/
Revised: 23 September 2020
/
Accepted: 24 September 2020
/
Published: 29 September 2020
(This article belongs to the Special Issue Bridge Dynamics: Volume II)
Abstract
:Featured Application
The proposed mainshock integrated aftershock fragility function model can be used to more effectively evaluate the seismic vulnerability of bridges in seismically active regions where mainshock-aftershock sequences pose a high threat.
Abstract
Seismic fragility analysis is often conducted to quantify the vulnerability of civil structures under earthquake excitation. In recent years, besides mainshocks, strong aftershocks have been often witnessed to induce structural damage to engineered structures, including bridges. How to accurately and straightforwardly quantify the vulnerability of bridges due to sequential mainshocks and aftershocks is essential for an efficient assessment of bridge performance. While recognizing the limitation of existing methods, this paper proposes a mainshock integrated aftershock fragility function model, which empirically encodes the effects of mainshocks and retains the simple form of traditional fragility curves. A pile foundation-supported bridge system is modeled considering seismic soil-structure interaction to demonstrate the proposed fragility model. Numerical examples show that the resulting fragility curves incorporate the initial value for the probability of collapse of the bridge system due to a mainshock and the effects of the variable aftershocks conditional on the mainshock. Statistical analysis confirms that the proposed model fits the simulated vulnerability data (e.g., seismic intensities of aftershocks and the response demands conditional a select mainshock ground motion) both accurately and robustly.
1. Introduction
Past earthquake events have evidenced that strong aftershocks may follow the mainshocks. On 12 May 2008, an M-7.9 earthquake struck Wenchuan, China, then strong aftershocks followed the mainshock, eight of which range from M 6.0 to 6.5 [1,2]. An M-7.8 earthquake occurred in Nepal on 25 April 2015, and hundreds of aftershocks were recorded, including an M 7.3 aftershock [3] within a month after the mainshock. Strong aftershocks may also follow a mainshock within a very shorter period. On 26 October 2015, an M-7.5 earthquake occurred in Afghanistan, and an M-4.8 aftershock was recorded only 40 min after the mainshock [4]. These aftershocks have a high potential to lead to more severe damage to civil structures, especially if the structures are damaged or sustain residual deformation during the mainshock. It is indeed meaningful to investigate the effects of mainshock-aftershock (M-A) events on the probability of failure of engineering structures, including buildings, bridges, offshore platforms, or other types of structures.
Abundant research records are found that focus on the behavior of building, bridge, or offshore platforms structures under M-A sequences [5,6,7,8,9,10]. Alessandri et al. evaluated the seismic risk of mainshock-damaged bridges further subjected to aftershocks, in which the seismic risk of aftershock to bridges was estimated based on fragility modeling using the Omori-law-based hazard model for the aftershocks [5]. In reference [6], seismic fragility analysis was conducted by scaling the mainshocks to reach a designated damage state; with introducing five seconds of rest time, the aftershock was applied on the damaged columns. Konstandakopoulou et al. studied the behavior of offshore platforms under seismic sequences and pointed out that M-A sequences cause noteworthy cumulative damage to platforms [10]. In reference [11], the inelastic seismic demands of wood-frame houses were estimated under seismic sequences. Their findings indicated that aftershocks resulted in the median of the inelastic seismic demands increasing about 5–20% if a moderate degree of structural response is induced. Li et al. studied the probability of collapse of steel structures under seismic sequences. They pointed out that the collapse capacity of a structure may decrease significantly when the structure is subject to a very strong mainshock, and thus that a small aftershock may induce the collapse of the damaged structure [12]. In their work, the collapse probability of differently damaged structures under aftershocks was investigated; however, their findings cannot reflect the effects of mainshock intensity on the probability of collapse. In reference [13], the seismic performance of a reinforced concrete containment (RCC) building under M-A sequences was investigated, and the results implied that aftershocks have great effects on the maximum peak accelerations, maximum peak displacements, and accumulated damage of RCC. Han et al. studied the seismic risk of old non-ductile reinforced-concrete (RC) framed buildings before and after retrofitting with isolation devices under M-A sequences. Their findings revealed that the seismic risk at higher damage levels can be reduced significantly by using isolation devices [14]. By neglecting aftershocks, it can cause considerable underestimation of the combined seismic risk. Yin and Li pointed out that aftershock is one of the important contributors to the total seismic losses of light-frame wood buildings under earthquake sequences [15]. Li and Ellingwood found that the amplitude and frequency contents of M-A sequences have a significant influence on the structural damage pattern of steel moment-resisting building frames with welded moment-resistant connections [16]. Ruiz-García and Negrete-Manriquez demonstrated that the frequency contents between mainshock and aftershock are weakly correlated [17]. Furthermore, they pointed out that the aftershocks do not significantly increase the peak or the residual drift demands since the predominant period of the aftershocks is very different from the period of the frame models. Song et al. investigated the effects of duration and frequency contents of earthquakes on the collapse of buildings subjected to mainshocks. Their findings implied that both duration and frequency have a great impact on the structural collapse capacity [18]. The presence of aftershocks may increase the seismic demands of civil structures. The influence of aftershocks on the peak ductility demands caused by strong seismic sequences was investigated by Goda and Taylor. They pointed out that using the real seismic sequences might underestimate the aftershock impact due to the limited number of the recorded dataset [19]. In reference [20], the findings showed that considering the damage from previous seismic events, the probability failure is affected significantly by the number of stories and the earthquake region. Ghosh et al. studied the accumulative seismic damage of highway bridges under multiple earthquakes. They pointed out a significant increase in the exceedance probabilities of damage indices due to the aftershocks. Some researchers evaluated the effects of aftershocks on the maintenance cost [21]. In reference [22], the effects of aftershocks on the seismic loss of steel buildings are investigated. They found that aftershocks have a significant impact on seismic loss. Dong and Frangopol investigated the effects of aftershocks on the risk and resilience of bridges; the findings indicate that aftershocks have great effects on repair loss and residual functionality [23]. Fakharifar et al. investigated the performance of jackets for repairing the mainshock-induced damage on reinforced concrete columns of a bridge subjected to potential aftershock loads. Their findings showed that the jacket can improve the bridge collapse capacity due to aftershocks [24], and the basic characteristic of a structure may be changed when they are suffered from earthquake sequences or other hazards in their lifetime. Pnevmatikos and Thomos proposed a stochastic structural control method for structures under sequential excitations [25].
It is summarized with this literature review that traditional fragility modeling has been mostly adopted for estimating the vulnerability of structures due to either mainshocks or aftershocks. When using such traditional fragility modeling in these efforts, the cumulative distribution function of a normal or lognormal distribution is commonly used with two distribution parameters [26]; then the parameters of the likelihood functions are estimated using the method of moments or, more generally, the maximum likelihood estimation (MLE) method [27]. This traditional fragility modeling approach is reviewed for the sake of completeness and for understanding the effort in this paper (Section 2.1). In recent years, a few fragility-based efforts (Section 2.2) were proposed to assess the conjunct effects of main- and after-shock sequences. However, there are no or little efforts that provide a simplified and validated fragility modeling approach that can specifically fit the assessment of bridge structures subject to both mainshock and aftershock sequences.
This paper aims to propose a new fragility model that generates fragility curves reflecting the contribution from both the mainshock and the aftershock events. This empirical model retains the basic form of a traditional fragility model while considering the effects of the mainshocks by introducing polynomials-based parameters (Section 3). To test the effectiveness, a bridge system is adopted to demonstrate the proposed fragility model, and real main- and after-shock sequences are selected (Section 4). Statistical analysis is conducted that confirms the accuracy and robustness of the model (Section 5). Remarks and conclusions are provided in Section 6.
2. Traditional Fragility Analysis and Adaption
2.1. Traditional Fragility Analysis
A seismic fragility model estimates the probability of exceeding a damage state of a structure under a variable intensity of seismic loads. It has been widely used to estimate the probability of failure for different types of structures. The equation for fragility function can be expressed as following [26,28]:
where is the probability of a damage or collapse; is the structural capacity; is seismic demand under a seismic intensity (e.g., a peak ground acceleration, PGA); is the cumulative normal distribution function (CDF); and are the mean and standard deviation of the seismic intensities that cause to the defined damage states (C < D). The maximum likelihood estimation (MLE) method can be adopted to estimate the model parameters and σ in Equation (1) [27]. Without considering aftershocks, this generic fragility model can be applied to either mainshocks or aftershock, resulting in mainshocks-only (MO) or aftershock-only (AO) fragility modeling.
2.2. Simply Adapted Fragility Analysis for M-A Effects
One direct adaption to Equation (1) for assessing the effects of M-A sequences can be obtained by treating a pair of main- and after-shock ground motions as one record to simulate the demands and define the damage state (C < D). With such treatment in constructing fragility curves, a uniform scale is used to scale up or down any input sequence when performing the seismic simulation. With this, considering that nearly in all events, the PGA of the total M-A sequence is the mainshock PGA, PGAm is used as the independent variable of the fragility model as shown in Equation (2):
where μm and σm are model parameters by fitting the data as a result of uniformly scaled main- and after-shock sequences, and the function variable x is for the mainshock intensity PGAm. It is obvious that by adopting Equation (2) with the mainshock’s PGA, the effects of aftershocks are implicitly hidden or mixed into the mainshock effects in the resulting fragility curve, and an end-user cannot discern the effects of aftershocks on the probable damage. In this paper, this fragility approach, as expressed in Equation (2), is termed mainshock-aftershock uniform-scale (MA-US) fragility modeling.
Wen et al. [7] representatively proposed a methodology for quantifying the M-A effects by fragility analysis (mainshock-aftershock specific-ratio fragility model). In this work, the formulation starts with a bivariate formulation with IMms and IMas denoting the intensity measures (IMs) of the mainshock and the aftershock, respectively. This leaves potentially a research gap that expects a relationship between the IMs of the mainshocks and the aftershocks. However, very limited knowledge exists that can bridge such a gap. The widely used relation that weakly connects a mainshock and its aftershock was proposed in [28]. This relation describes the rate of occurrence of an aftershock with a magnitude greater than or equal to Ma at a time immediately after a mainshock of magnitude Mm. Essentially, this empirical relation can be used to calculate how many aftershocks greater than a designated magnitude given a mainshock in a prescribed duration. On the other hand, there is no acceptable relation that describes the mainshock intensity (IMms) and the intensity (IMas) of an arbitrary aftershock of the mainshock.
To explicitly evaluate the seismic vulnerability of structures due to the main-/after-shock sequences, Wen et al. [7] introduced a relative intensity measure, termed as a ratio between the mainshock and aftershock intensity, in the modeling. This parameter is treated as a user-defined parameter, which specifies a constant ratio between the mainshocks and the aftershocks for one scenario of vulnerability assessment by selecting the main-/after-shock motions. With a given , the M-A sequences fragility model is:
It is noted that in this fragility model, the mainshock’s PGA is treated as the primary variable as in the traditional fragility model in Equation (1). The difference is that one may flexibly select a different . In reference [7], by setting as 0.1, 0.5, and a few other values smaller than 1.0, the intensity of aftershocks is determined by ∇IM × IMms before scaling and being applied to the simulation, further providing data for the fragility formulation. With different ∇IM, the fragility curves as a function of the mainshock PGA can be created for different specific levels of ∇IM. In this study, the fragility model in reference [7] is called the mainshock-aftershock ratio-specific (MA-RS) fragility model.
Another adaption is to consider the variability of aftershocks after selecting a certain level of mainshock intensity. With this scheme, suppose that a mainshock intensity is set as , the aftershock’s intensity PGAa potentially changes from zero to the maximally possible intensity . By taking the traditional form of fragility in Equation (1), one obtains a mainshock-dependent aftershock (MD-A) fragility model:
where μa and σa are the model parameters accounting for the uncertainties related to the variable aftershock records. In this equation, it is noted that the function variable x is for the aftershock intensity.
For the above models, the authors argue that with the lack of models and knowledge in expressing the aftershock intensity given any mainshock record, it is considerably uncertain or arbitrary to determine the mainshock/aftershock intensity ratio ∇IM. This burden will be left to end-users: although many ratios can be selected, it becomes less comprehensible when one attempts to assess the effects of aftershocks on the vulnerability of the target structure. On the other hand, the reviewers argue that for assessing the vulnerability of structures under strong shocks, Equation (3) suffices for considering strong mainshocks without considering the aftershocks. Thus, it is necessary to develop an improved fragility analysis framework to assess the safety of structure under the M-A sequences with an emphasis on the variability of aftershocks.
3. Mainshock-Integrated Aftershock Fragility
3.1. Rationale and Formulation
The fragility expression in Equation (3) defines the probability of exceedance conditional on two hazard variables, which, if defined generically, can be written as P(C < D|H1, H2), where H1 and H2 are the representative hazard-intensity variables. If this expression is treated as a fragility model in terms of two hazard variables, it leads to a fragility surface model that lacks straightforwardness towards readily interpreting the vulnerability of a structure as a fragility curve does so. There are a number of efforts that extended the traditional single-hazard fragility-modeling to a multi-hazard case. In reference [29], the authors considered the effects of seismic hazards and aging. To integrate the two hazards, they proposed a time-dependent fragility model for bridge structures under aging and seismic loads, in which the time variable t for aging is incorporated into the model parameters as: , .
The proposed fragility model in this paper is inspired by the mathematical treatment of time-dependency in reference [29]. To integrate the mainshock effects and emphasize the aftershocks, and more importantly, to retain a one-dimensional fragility-curve model, the authors treat the intensity of aftershocks as the independent function variable, then correlate the model parameters with the mainshock variations. Two differences are highlighted. First, it is noted that the physical relations between main- and aftershocks are much different from the time-dependent aging and earthquakes. Second, to account for the mainshock effects when treating the weak aftershock intensity, an intercept term is introduced into the formulation. Equation (5) defines the proposed probabilistic fragility model:
where is the probability of collapse under an aftershock intensity () and a mainshock intensity (); is the capacity of a structure; is seismic demand under the given seismic intensity; is the cumulative normal distribution function; μm and σm are the mean and standard deviation of seismic intensity of the mainshock; is a non-negative parameter that is the function of mainshock intensity. This parametric structure in Equation (5) ensures that first, the function is bounded by zero and unit; and second, when Φ(⋅) approaches to zero (namely, when the aftershock intensity x is small), the fragility approaches to an intercept value of γm/(1 + γm). This implies that when the aftershock intensity is weak, this intercept accounts for the non-zero probability of failure that the mainshock triggers.
Given the fragility formulation in Equation (5), the model parameters μm, σm, and γm, depend on the mainshock intensities. When a strong mainshock intensity is selected, it leads to a certain degree of damage with uncertainties due to their intra-record uncertainties. In the meantime, with the aftershock variations and uncertainties, the model parameters vary dependent on the mainshock intensity. To consider the potential nonlinearity of this dependency, quadratic polynomials, which feature the least degree of nonlinearity in terms of the mainshock intensity, are empirically prescribed to model the relation between the model parameters and the mainshock intensity:
where p1, p2, …, and p9 are the polynomial constants estimated by the least-squares method for the computation of μm, σm, and γm at different mainshock intensities.
3.2. Characteristics
With the new fragility model proposed in Equation (5), it is different from the traditional simply adapted fragility model for M-A sequences as shown Equations (2) and (3) with two comparative aspects:
- (1)
- In Equation (2) or (3) in reference [7], the probability of failure is expressed as a function of mainshock intensity; and the aftershock effects are revealed through a uniform scaling or selecting different mainshock/aftershock intensity-ratio parameters. The uncertainty of this ratio parameter is not modeled.
- (2)
- In the model developed in this study, the probability of failure is expressed as a function of aftershock intensity. The intensity of the mainshock is selected by an end-user following a design consideration (e.g., the design-level or the maximum-considered level ground motion), and its intra-record uncertainties are modeled through ground-motion selection.
Considering these characteristics, the proposed fragility modeling in Equation (5) is termed mainshock-integrated aftershock fragility model in this paper.
4. Implementation and Case Study
4.1. Workflow
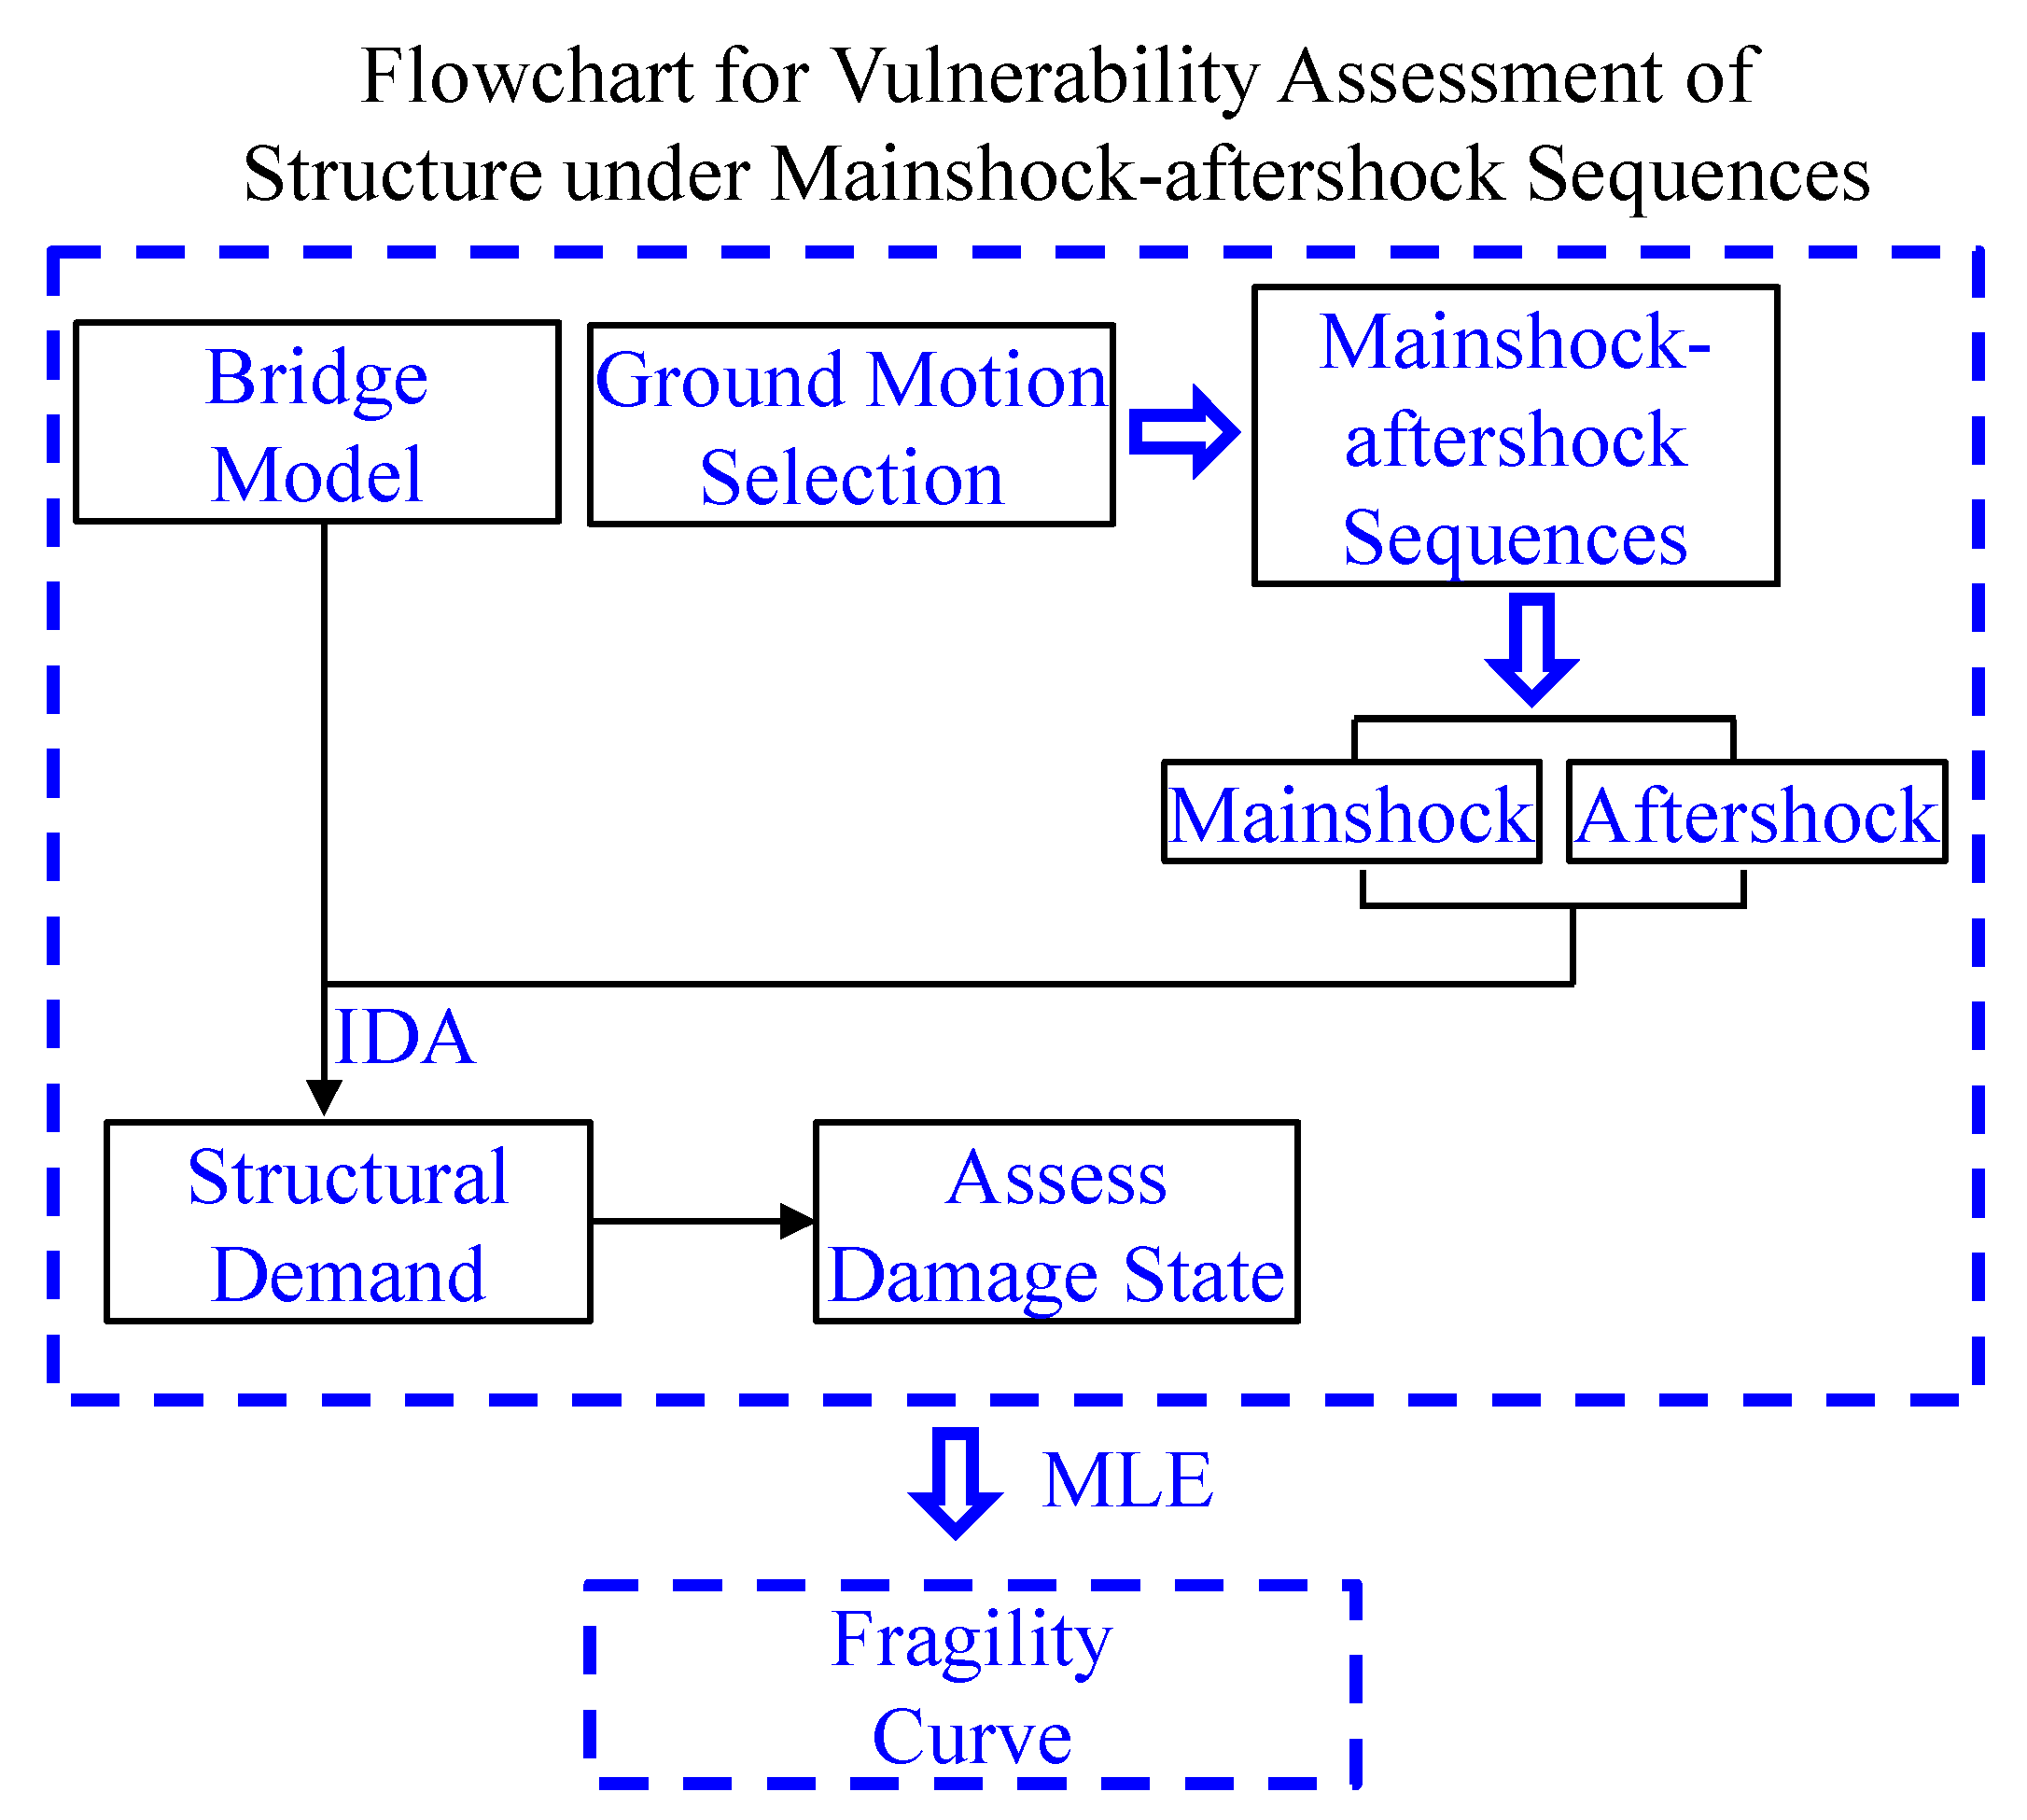
In this work, the mainshock-integrated aftershock fragility model is proposed to assess the vulnerability of a bridge structure under M-A sequences. Figure 1 shows the flowchart for the assessment process. The basic steps include:
4.2. Bridge Modeling
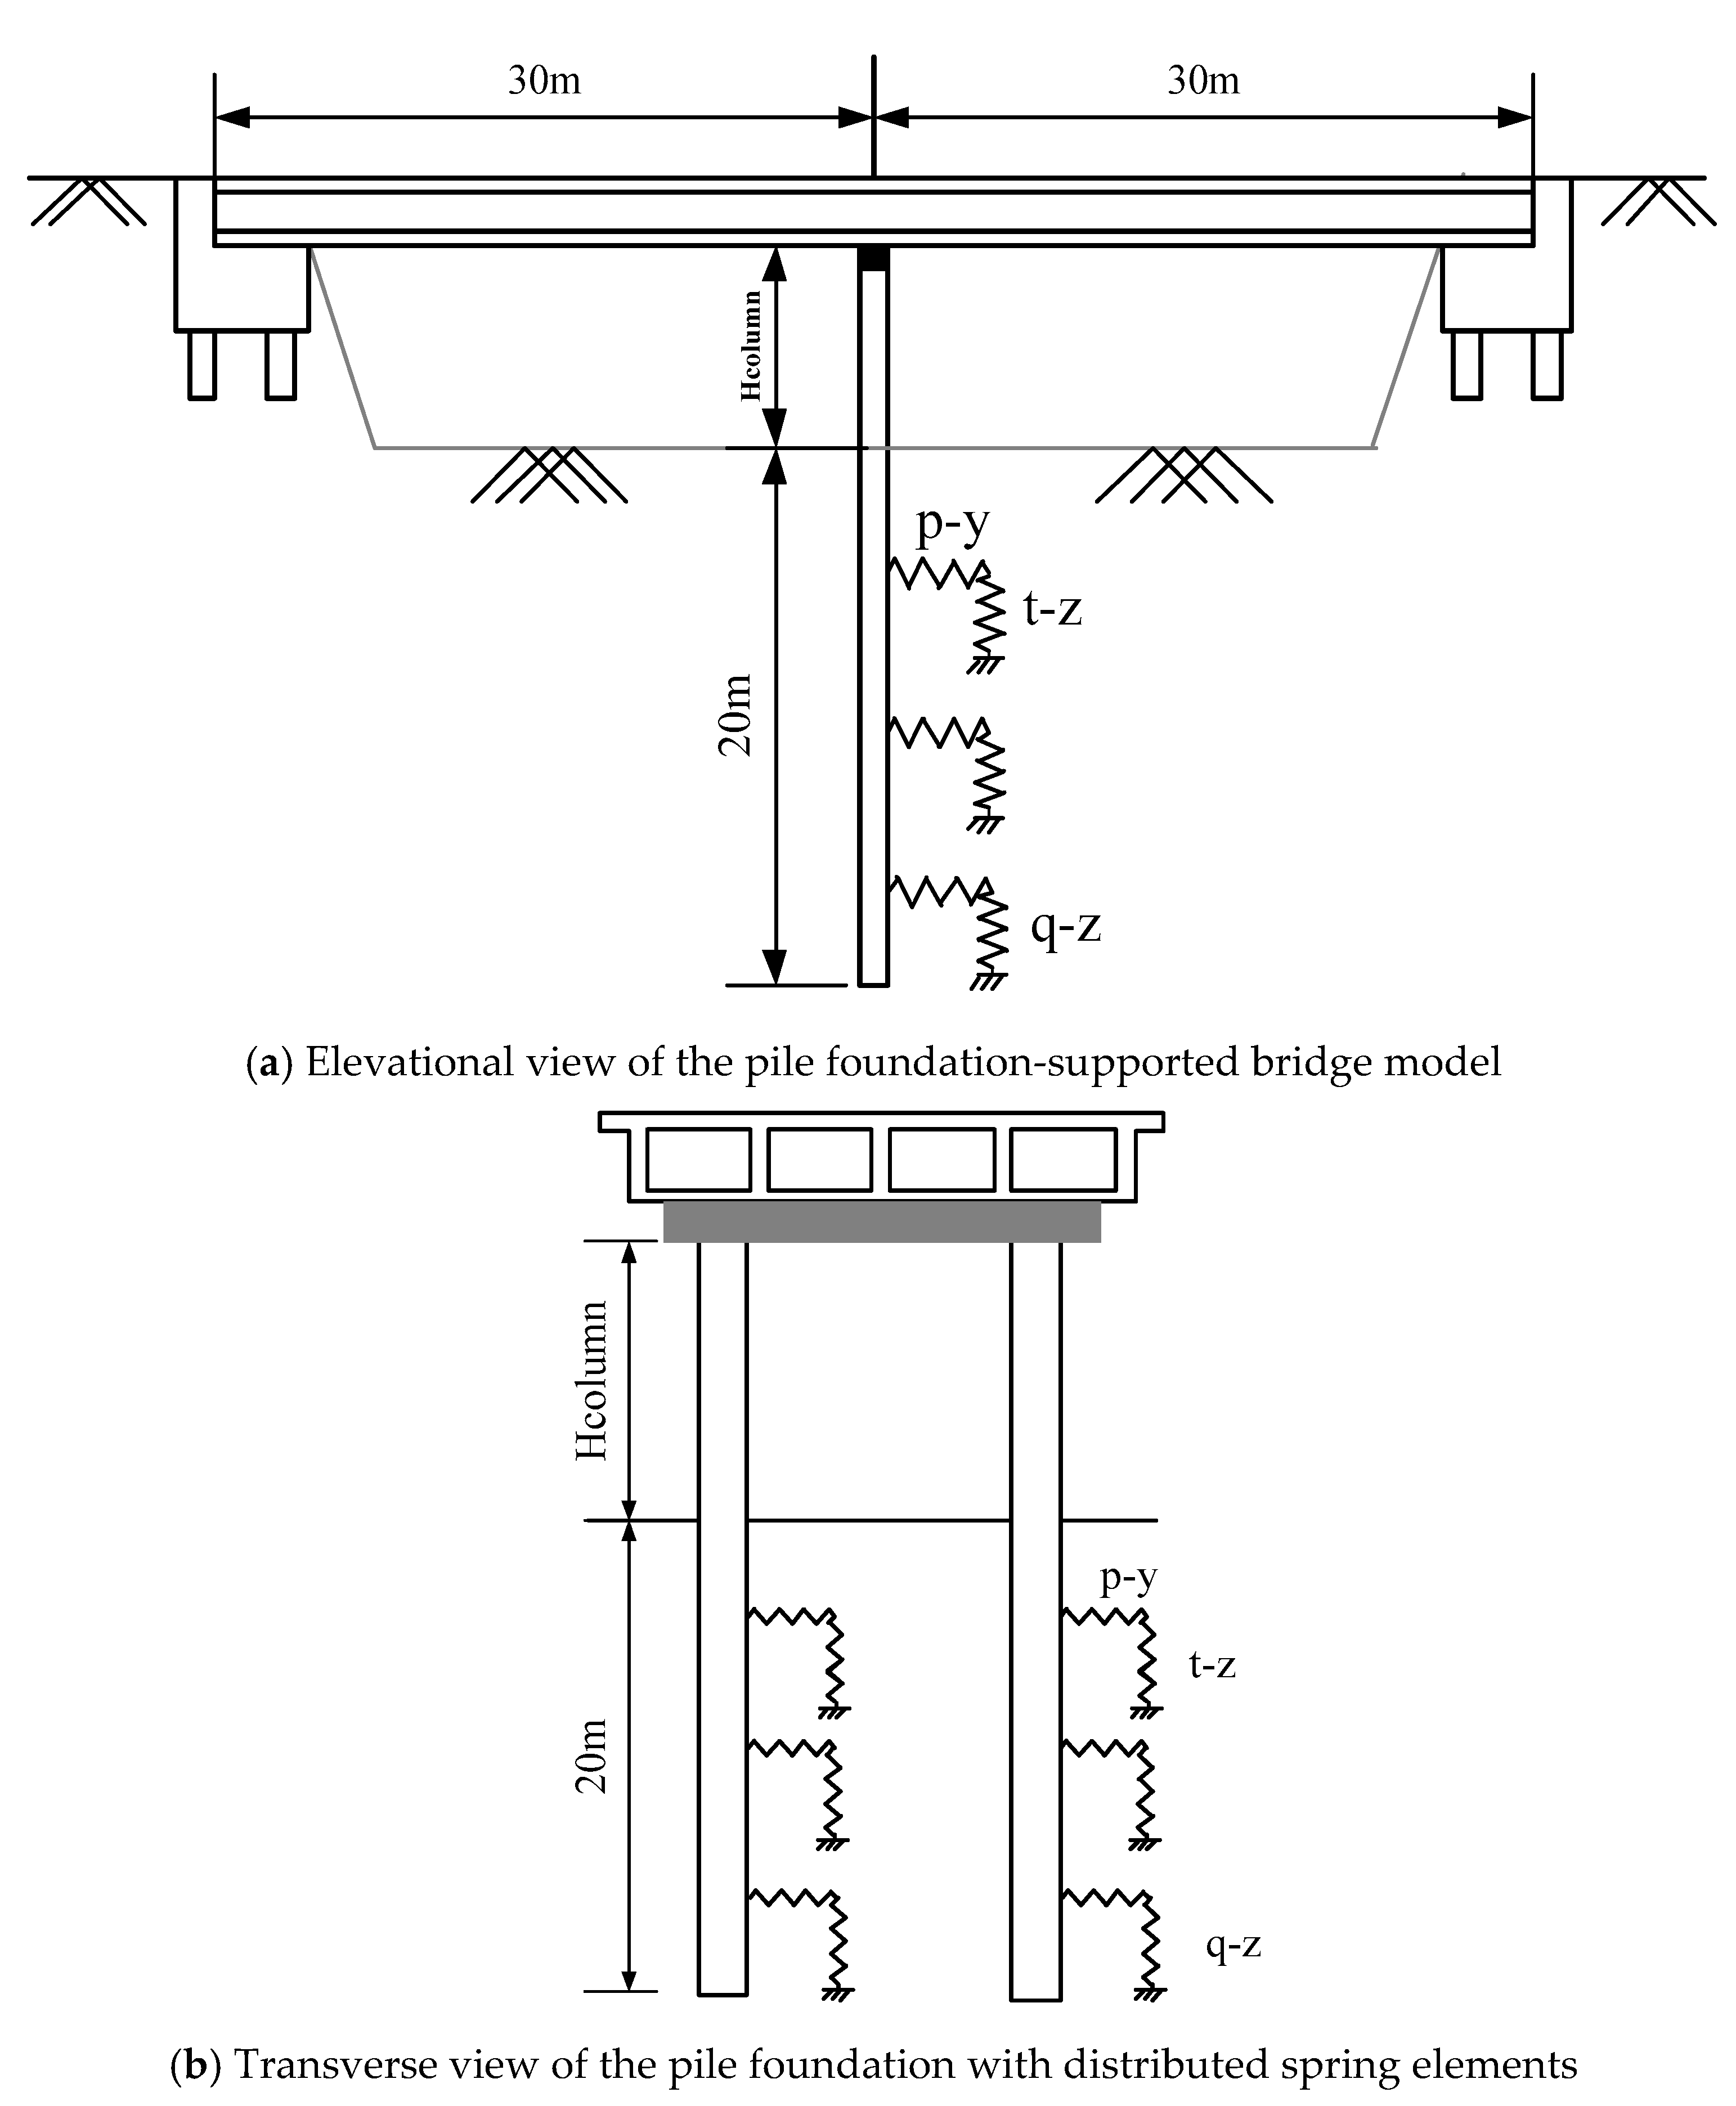
A reinforced-concrete two-span bridge model is considered in this work. The total length of the pile-foundation supported bridge is 60.0 m, with the same length for each span. The height of the column is 9.5 m, and its diameter is 1.6 m. The length of the pile foundation is 20.0 m, and its diameter is 1.6 m. The soil around the pile foundations is sand of Class D. The geometric model of the bridge is presented in Figure 2a,b. The finite-element (FE) model of the soil-pile-bridge system is created by OpenSees (version 2.4.5, Pacific Earthquake Engineering (PEER) Center, Berkeley, CA, USA) [30]. In the FE model, the columns are simulated by using a nonlinear beam-column element. Elastic beam elements are assigned to the bridge deck. The concrete material model developed by Mander is utilized to describe the stress-strain relationship of confined concrete [31]. In the OpenSees program, steel02 material is used for longitudinal steel, and concrete02 material is applied for the cover and confining layer of concrete [32]. Idealized roller-like abutments are applied to simulate the abutments.
To consider the soil-structure interaction (SSI), the pile foundation is simulated as a Nonlinear Winkler Foundation that is available in OpenSees [32]. With this Winkler approach, two vertical friction-resistant springs along with the pile (t-z), one vertical-bearing spring at the bottom of the pile (q-z), and three lateral-resistance (p-y) springs are used to simulate the integrated nonlinear soil-pile interaction effects. The stiffness of those springs around the pile foundation is calculated according to the empirical equations reported in [33]. Figure 2b provides a schematic illustration of these springs.
After the FE model for the bridge is created, incremental dynamic analysis (IDA) is conducted, and the maximum displacement at the top of the column is captured and denoted as the ductility demand () as a damage index to determine whether the bridge systems is collapse or not. For the collapse state, is calculated in this work. In the IDA, the mainshock is scaled into different intensity levels. For each mainshock intensity, the aftershock intensity is increased from a smaller value to the intensity of mainshock for nonlinear dynamic analysis (by doing this, the intensity of aftershock is smaller than that of mainshock in the numerical simulation, which is more realistic), in which P-Δ effect is considered. In this work, the uncertainty of materials such as concrete, steel, and soil are considered by using the Latin hypercube sampling method. It is worth to mention that in the IDA, the intensity of aftershock is scaled to different target levels. It is noted that some values may be as high as nearly equals to that of the mainshocks. However, in a real earthquake event, the recorded intensity of aftershock may be higher than that of the mainshock, even though this is not a common phenomenon. Since probabilistic hazard analysis for the mainshocks and aftershocks are not of concern in this study, and this paper aims to propose a fragility function model, the intensity relation between the mainshocks and aftershocks do not affect the results in this study.
4.3. Selection of M-A Sequences
M-A sequences recorded from past earthquake events imply that the intensity of aftershocks may be as high as that of the mainshock, even though the magnitude of mainshock is larger than that of aftershocks. The duration of ground-motion accelerations of the aftershocks often is sometimes longer than that of a mainshock [34]. Yeo and Cornell [35] pointed out that the magnitude of aftershocks is independent of elapsed time after the mainshock, and large aftershocks may happen immediately or several months later. After a mainshock, some damaged building or bridge structures have the potential to be subjected to aftershocks again before any retrofit. Therefore, it is likely that the damaged civil structures may be more prone to collapse under the aftershock loads.
The uncertainty of seismic loading has a great influence on the performance of civil structures during an earthquake event. Synthesized M-A sequences and as-recorded M-A sequences are adopted in the aforementioned literature. In this work, the recorded earthquake sequences are used for the seismic fragility analysis, in which the probability of failure is a function of mainshock intensity. The recorded earthquake sequences are listed in Table 1, which are downloaded from the Pacific Earthquake Engineering Research Ground Motion Database [36]. In reality, many aftershocks may follow a mainshock. As similarly done in reference [12], an M-A sequence consisting of a mainshock and an aftershock is used in this work for the sake of simplification. More aftershock events after a mainshock can be computed by using the proposed framework in this work.
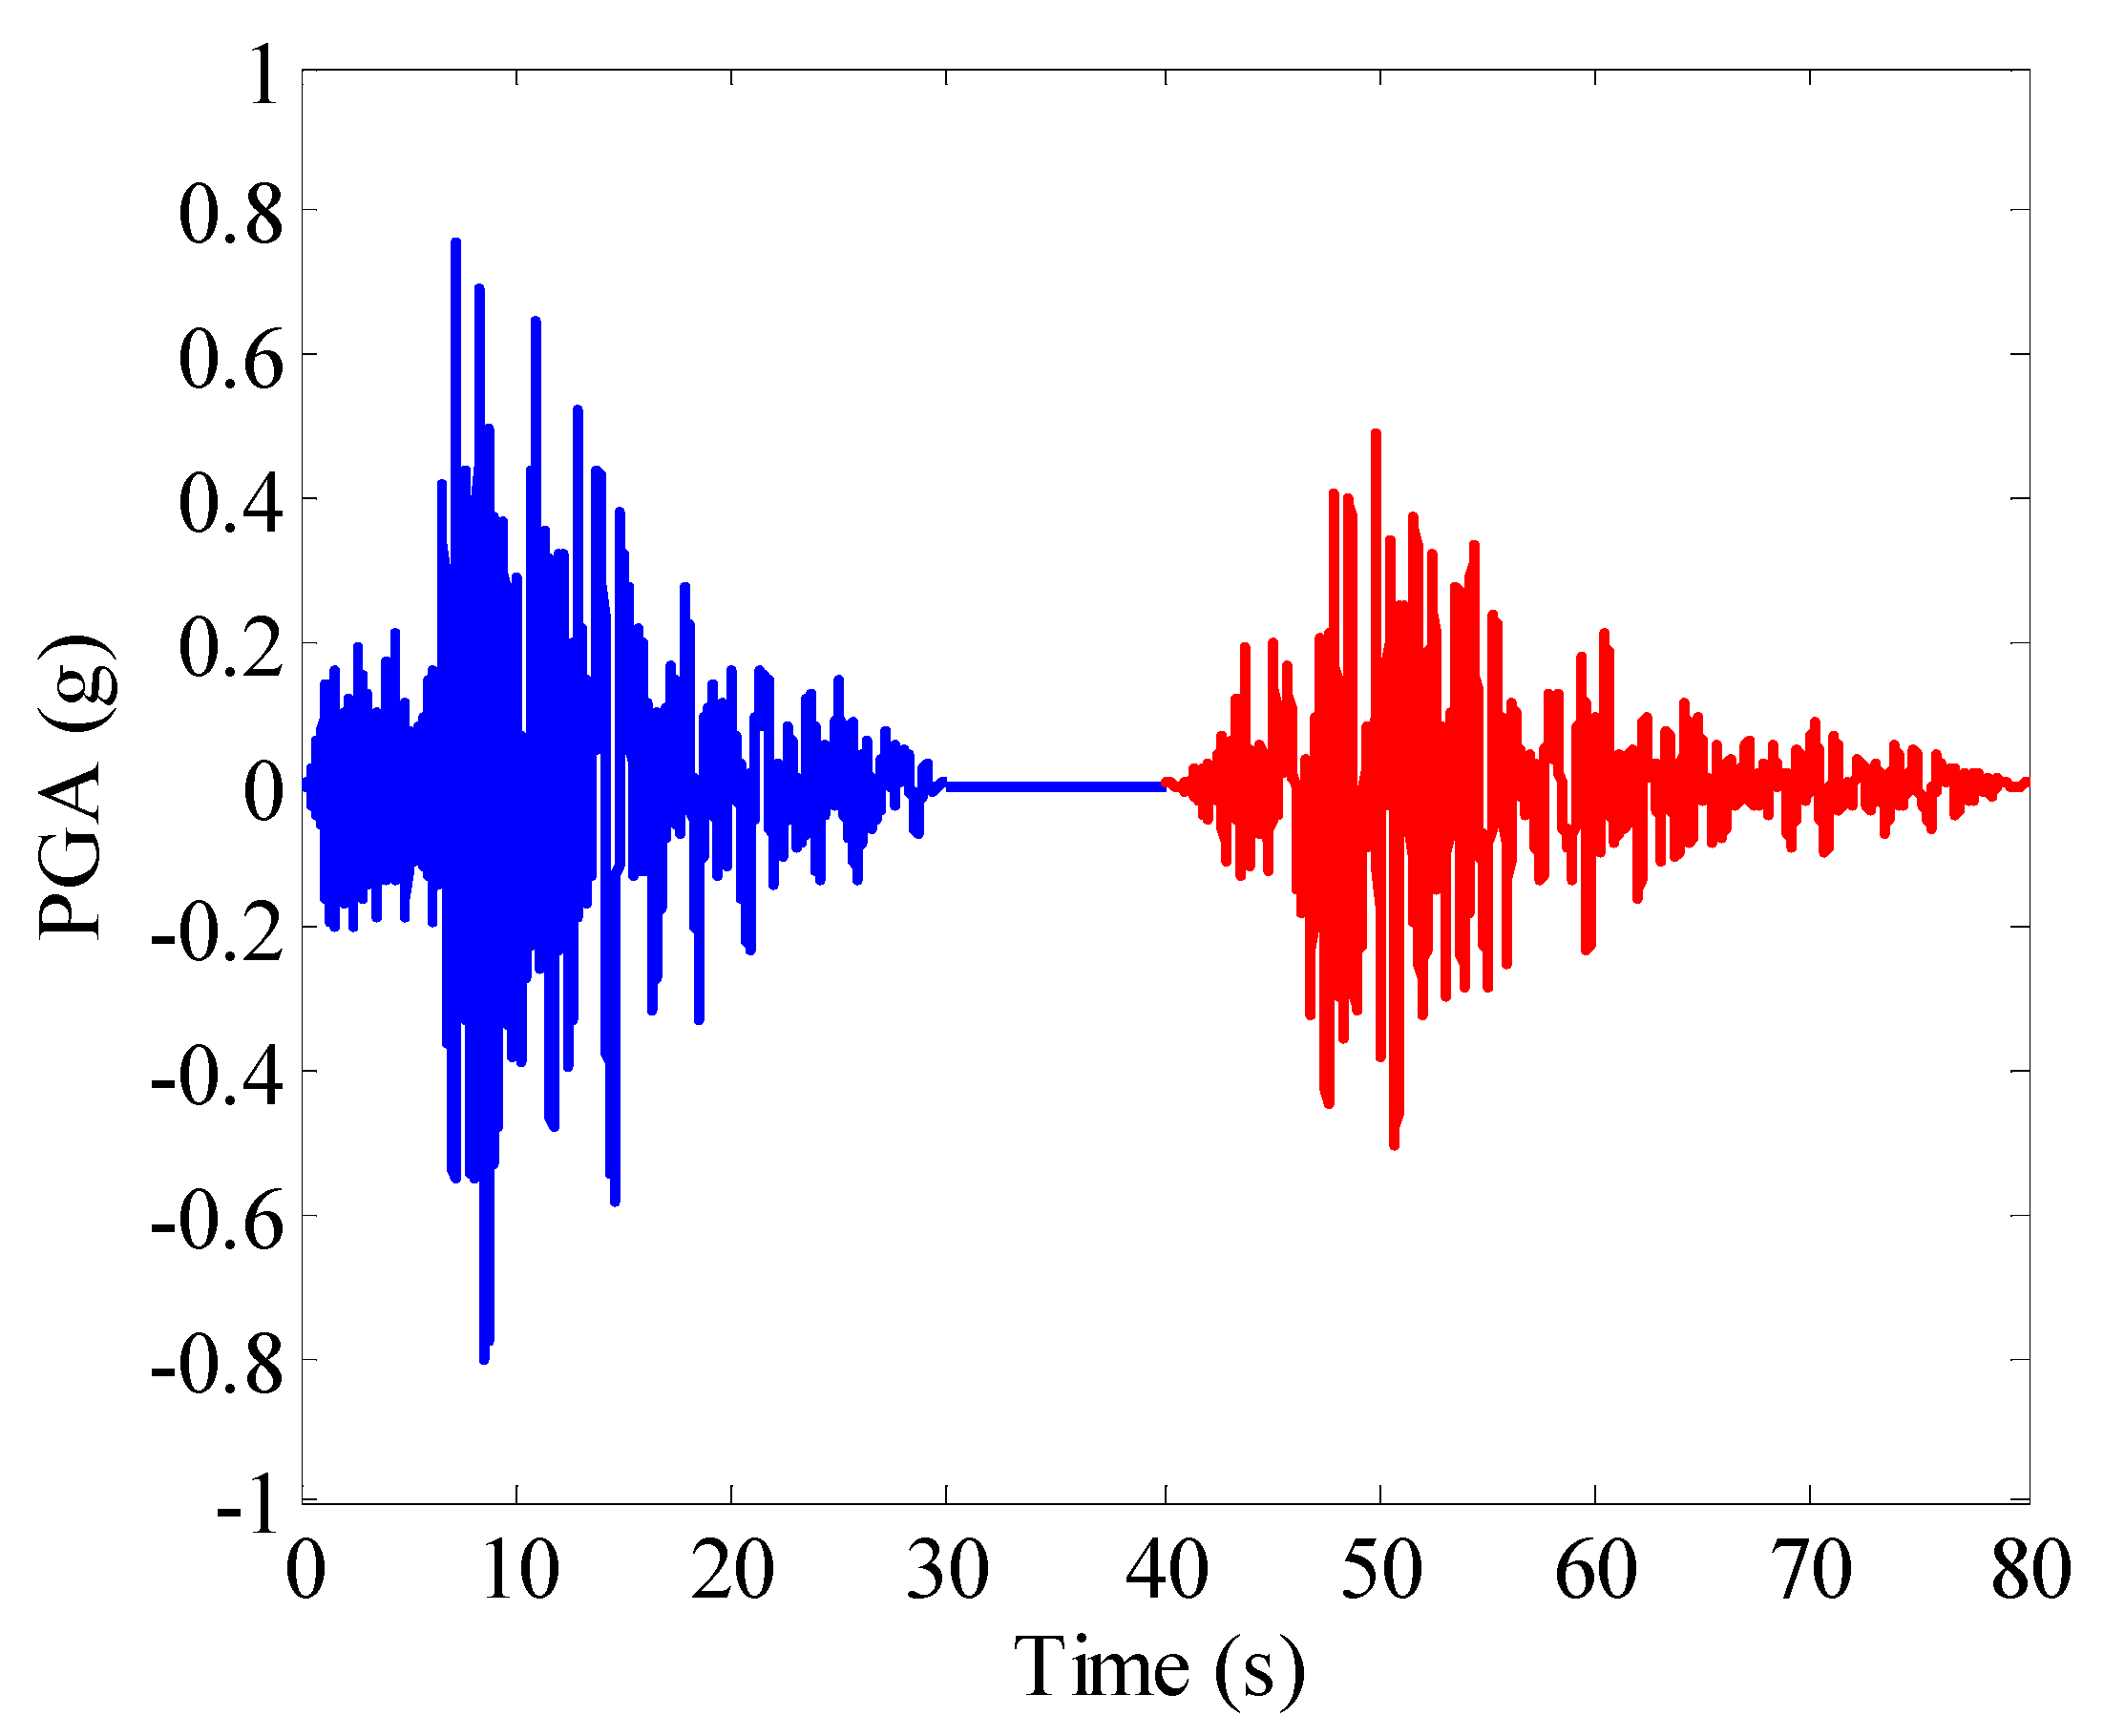
In this work, the intensity of aftershock is scaled in two manners. First, the same scaling value is used for the aftershock as the mainshock, which keeps the intensity relationship between the mainshock and aftershock. The second is that the aftershock is scaled to an aimed value without considering its intensity relationship with mainshock. Figure 3 shows one of the M-A sequences with the mainshock intensity (peak ground acceleration, PGA) scaled to 0.8 g, and the corresponding PGA accordingly scaled to 0.5 g by using the second method. It is noted that, for the purpose of demonstrating the proposed fragility modeling, the PGAs of the mainshock and aftershock are scaled to different intensity levels to generate the seismic loads to perform incremental dynamic analysis. Both the intensity of the mainshock and the aftershock can affect the performance of a structure; however, for a future earthquake event, the intensity of mainshock and aftershock is difficult to predict. Therefore, it is necessary to study different intensity combinations of mainshock and aftershock on the failure probability of a structure.
5. Numerical Experimental Evaluation
5.1. Traditional Mainshock-Only and M-A Fragility Assessment
The probabilities of the collapse of the pile foundation-supported bridge under mainshocks-only and mainshock-aftershock sequences are calculated, as shown in Figure 4 by using Equations (1)–(3). In this work, we mainly focused on the development of the mainshock-integrated aftershock fragility model, so only the collapse state is presented for simplification, for other damage states such as slight damage, moderate damage, and major damage can also be calculated. The probability of collapse induced by mainshock is calculated using Equation (1). As the results obtained by other researchers, the probability of collapse increases with the mainshock intensity. It is stated that in most cases, towards evaluating the vulnerability of a structure under a select intensity level or range of earthquakes, this traditional fragility analysis suffices the needs. Indeed, this practice does not provide empirical knowledge regarding the effects of aftershocks on the target structure.
The collapse probability of the bridge under M-A sequences calculated using Equation (2) is also provided in Figure 4, in which the mainshock aftershock intensity is scaled with the uniform method. By comparing the fragility curve for mainshock only and mainshock-aftershock uniform scaling method, it can be known that the effect of aftershock is very small, which may attribute to that the intensity of scaled aftershock is still weak, but the advantage of this method is that the intensity relationship between mainshock and aftershock is not changed. The intensity of aftershock is scaled using the same scaling coefficient as mainshock. It is worth mentioning that by using the mainshock-aftershock uniform-scale, the horizontal coordinate PGA denotes mainshock intensity as in reference [7].
The probability of collapse of the bridge system under mainshock aftershock sequences is also calculated using the method proposed by Wen et al. [7]. Two specific ratios between aftershock and mainshock intensity are considered as presented in Figure 4, and the ratio is set as 0.5 and 0.9, respectively. For other ratios, it can also be easily calculated. In reference [7], the Park-Ang model is adopted to judge the failure of a structure under M-A sequences. In this work, the ductility demands are used, which does not affect the aim of this work for the development of the new fragility function model. From Figure 4, it can be known that by using the method proposed by Wen et al. [7], the effect of aftershock can be known by comparing to the fragility curve of the bridge under mainshock only. Therefore, for this method, the probability of exceeding a damage state under mainshock only should be calculated first, or it is difficult to quantify the effect of aftershock. In addition, without calculating the failure probability of a structure under only mainshocks, the effect of mainshocks in the probability of failure of the structure under mainshock-aftershock sequences is also unknown.
5.2. Mainshock-Integrated Fragility Function Model
In the nonlinear dynamic analysis, the intensity of the mainshock is scaled from 0.4 g to 1.6 g with incremental 0.2 g. To account for the aftershock effects, the intensity of the aftershock is scaled from a smaller value to the mainshock intensity. In this work, we assume that the maximum aftershock intensity is up to the mainshock intensity. For example, the aftershock intensity is scaled from 0.1 g to 0.4 g when the mainshock intensity is 0.4 g. Furthermore, when the mainshock intensity is 1.6 g, aftershock intensity is scaled from 0.2 g to 1.6 g. In this section, we focus on the conditional probability of collapse of bridge systems under M-A sequences, and hence, the probability of collapse is both the function of mainshock and aftershock intensity. Through numerical simulation, the fragility curves for the investigated bridge system are obtained by using mainshock-dependent aftershock fragility and mainshock integrated aftershock fragility function model, respectively. In this section, the mainshock-dependent aftershock fragility model (Equation (4)) was used first for fitting the fragility data, as shown in Figure 5. Further, the probability of failure using the proposed new model is shown in Figure 6.
Figure 5 shows the fragility curves for mainshock intensity at 0.6 g, 0.8 g, 1.0 g, and 1.2 g, respectively. From Figure 5, it can be known that the numerical simulation data has an initial value; for example, the initial value is about 1.7% when the mainshock intensity is 0.6 g and aftershock intensity is smaller than 0.5 g. However, the fitting curve shows that the initial value is 0 and then increases sharply with aftershock intensity. From Figure 5a to Figure 5d, it is concluded that the cumulative normal distribution function cannot fit the numerical simulation data well. Figure 5 also implies that with increased mainshock intensity, the probability of collapse of the bridge system increases as well. The numerical simulation data also indicates that aftershock increases the probability of the structure if its intensity is higher than a threshold value. The probability of collapse is 0 when the mainshock intensity is 0.4 g and aftershock intensity from 0.1 g to 0.4 g, so the result is not presented in this section. Therefore, for small mainshock and aftershock intensity, they have fewer effects on the probability of collapse, but it may affect other damage states. When the mainshock intensity is 1.4 g and 1.6 g, the cumulative distribution function cannot fit the numerical simulation data for numerical errors. The error analysis between numerical simulation data and the traditional fragility function model is conducted; the results show that the error is very large between the numerical simulation data and the fragility function model.
Based on Equation (5) and numerical simulation data, the fragility curves are generated and presented in Figure 6. From Figure 6, it is concluded that the proposed new fragility function model fits the numerical simulation data well for all the example cases regardless of the magnitude of the intensity of the mainshock being small or large. Figure 6a–f shows that there is an initial value that is larger than 0, and the value increases with the mainshock intensity. This initial value is a function of the mainshock intensity. From Figure 6a–f, it is concluded that the developed mainshock-dependent fragility function model almost exactly matches the numerical simulation data. It is worth to mention that for a mainshock intensity, to reduce the calculation cost, the aftershock just scaled to several intensities. To improve the accuracy of the numerical simulation results, more aftershocks are suggested to be used. In addition, more mainshock intensities are utilized in the nonlinear dynamic analysis.
The fragility curves show that the probability of collapse of the bridge structures at different given values of the mainshock intensity, for example, the mainshock intensity in this work, is from 0.4 g to 1.6 g with incremental 0.2 g. The probability of failure at other mainshock intensities is unknown; for example, when mainshock intensity is 1.1 g and 1.5 g, this is because that in the nonlinear dynamic analysis, the probability of failure at this these intensities is not calculated. Therefore, it would reduce the calculation cost if the probability of failure at other mainshock intensities by using the results at targeted mainshock intensity. Hence, a fragility surface model is suggested to be created based on the known M-A intensities by fitting the values of , and at different mainshock intensity. In this work, we aim to propose a mainshock-integrated aftershock fragility function model for future research, and a fragility surface model may be generated based on this work.
The accuracy of the developed mainshock-integrated aftershock fragility function model is analyzed by comparing the fragility curves with the numerical simulation data. The results, wherein in the mainshock intensities range from 0.6 g to 1.6 g, and the aftershocks are scaled to the corresponding mainshock intensity, show that the error is generally smaller than 5%. Only when the mainshock intensity is at 0.8 g, and the aftershock intensity is 0.5 g, the error is 5.33%. Therefore, the developed mainshock-dependent fragility function model is accurate to assess the vulnerability of a structure under M-A sequences.
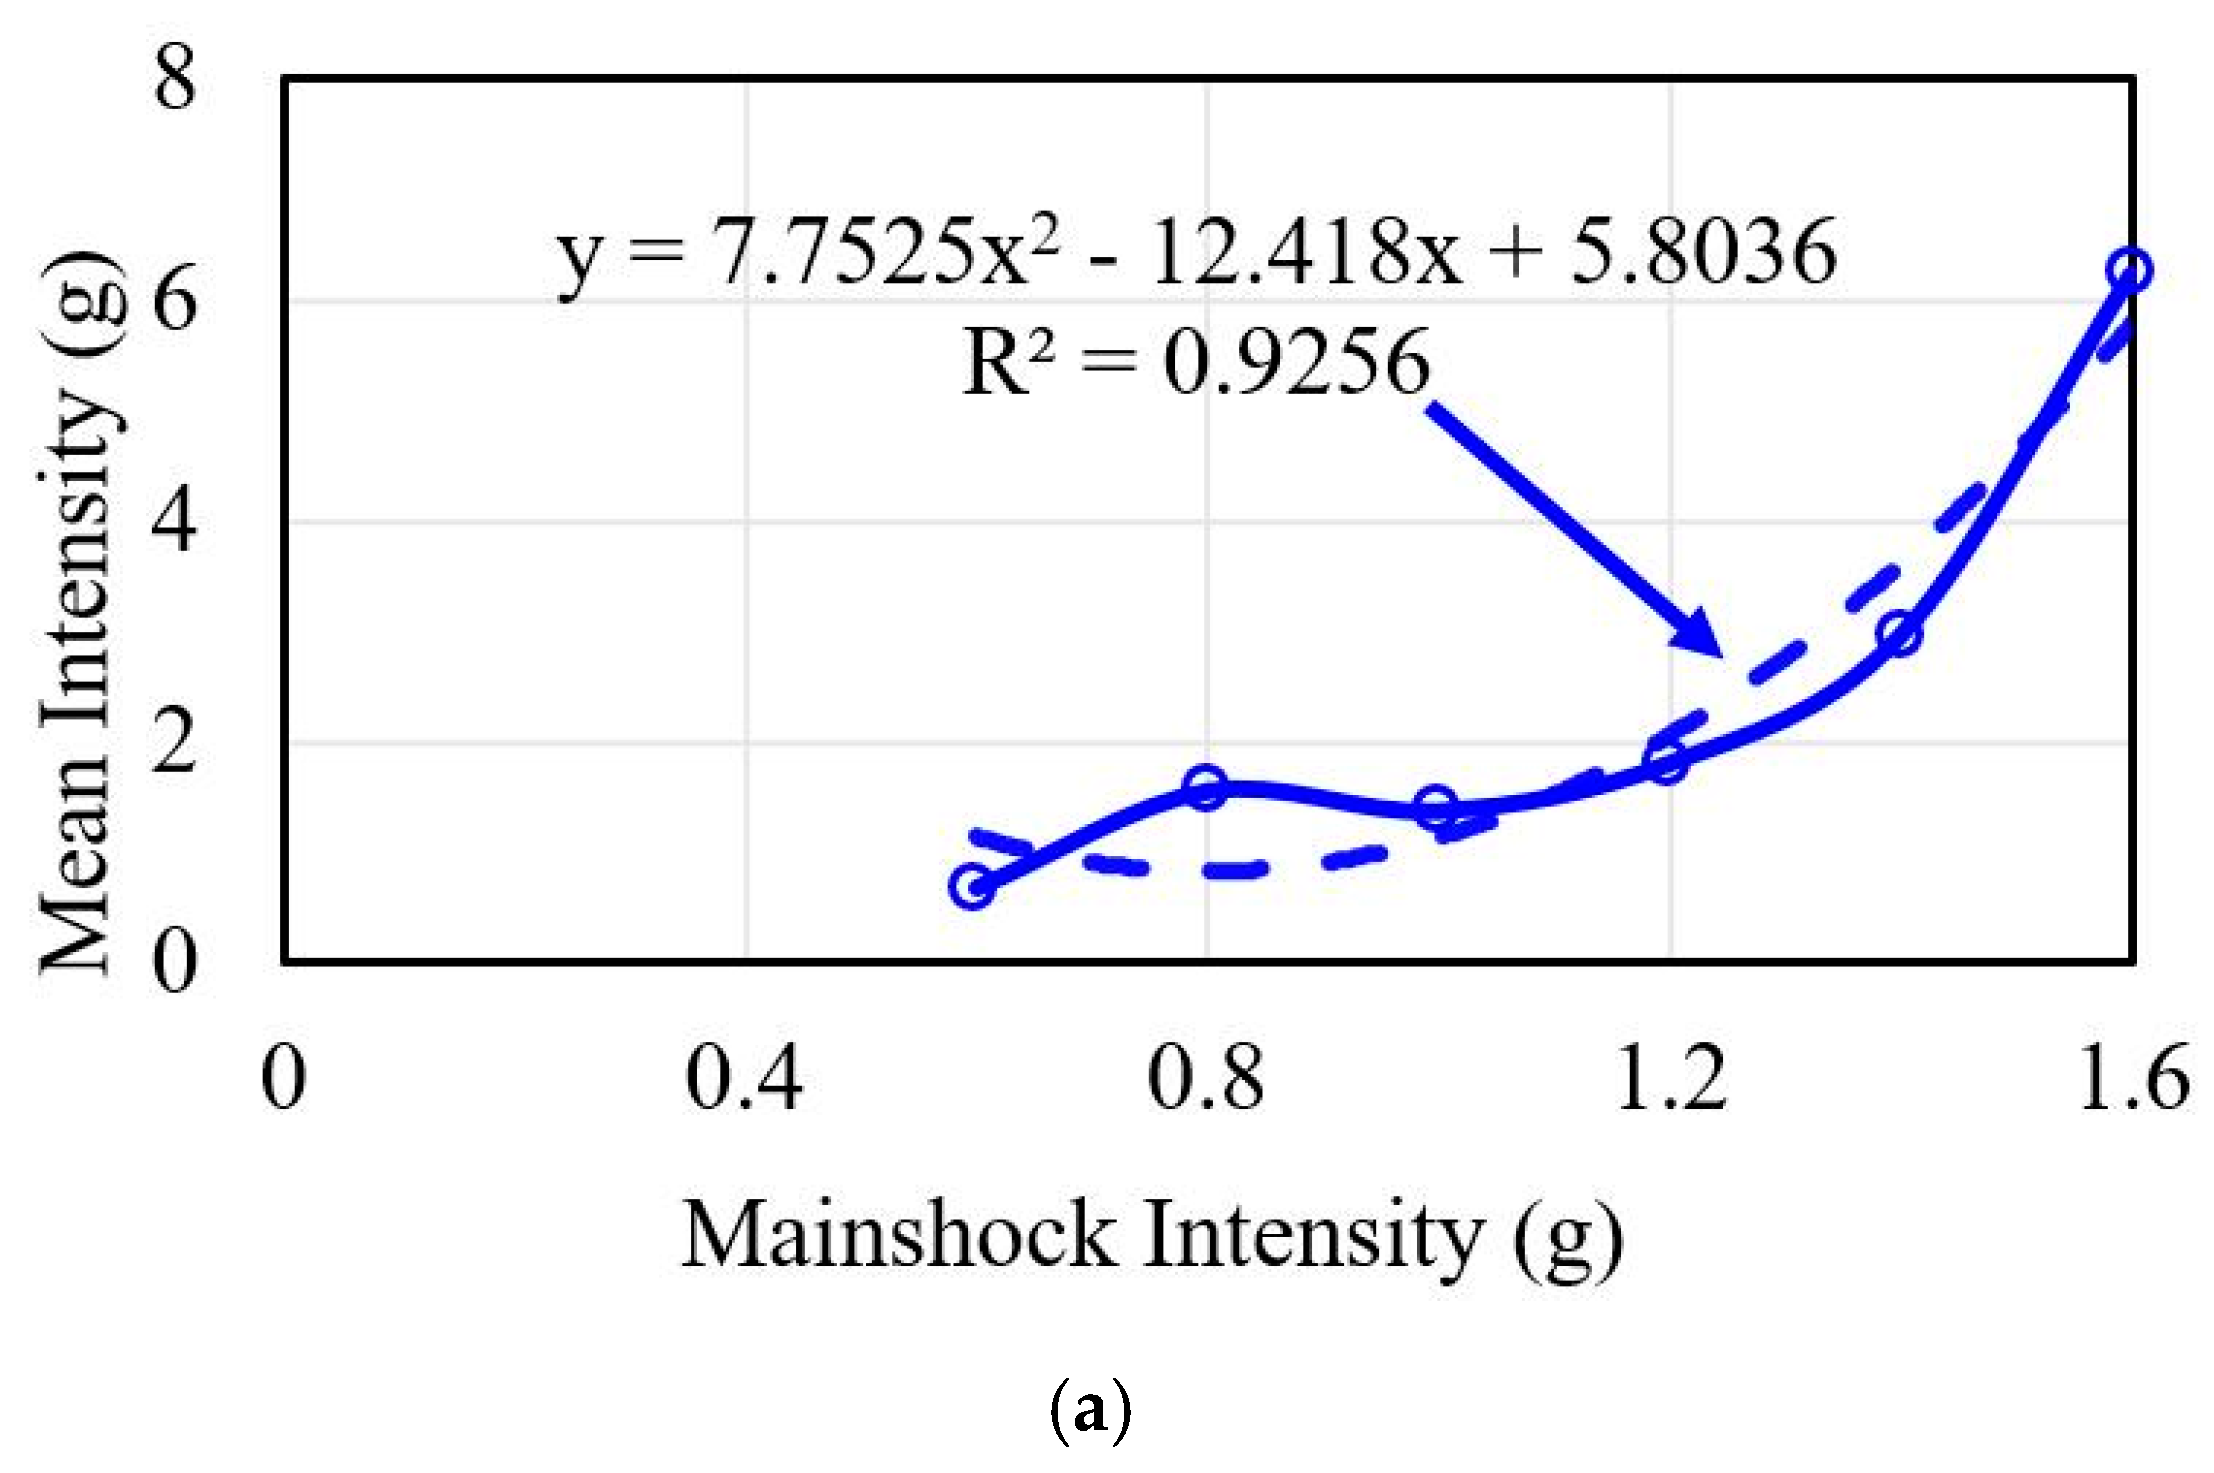
By using Equation (5), for each intensity of mainshock, three parameters (, and ) are estimated through the maximum likelihood estimating method. Furthermore, the three parameters corresponding to each intensity of mainshock are presented in Figure 7. The quadratic polynomial equation (Equations (6)–(8)) is used to fit the three parameters, respectively. From Figure 7, it is concluded that the quadratic polynomial equation fits the numerical data well; for the three parameters, the R-square is 0.9256, 0.9314, and 0.9938, respectively. For the , the quadratic polynomial equation almost exactly matches the numerical simulation data. To improve the accuracy of fitting numerical simulation data ( and ), it is suggested that more mainshock and aftershock intensities are utilized in future work. By using Equations (5)–(8), the mainshock-aftershock fragility surface can be obtained numerically.
6. Discussion and Conclusions
6.1. Discussion
A mainshock-integrated aftershock seismic fragility function model is developed in this study to estimate the probability of exceeding a damage state of a structure (bridge, building, or other civil structures) under mainshock and aftershock loads that are recorded in the past earthquake events, in which, the probability of collapse is conditional upon mainshock and aftershock intensity. The innovation of this work is that the developed fragility model is different from the traditional fragility function model, in which three parameters are included in the proposed model. The generated fragility curves can reflect the effect of the mainshocks on the probability of failure at a specific intensity level, which means that for a specific mainshock and aftershock intensity, the probability of exceeding a damage state is clearly presented in the fragility curves. In addition, different from the model proposed by Wen et al. [7], in creating the fragility curve, the horizontal coordinate is aftershock intensity in the mainshock-integrated aftershock seismic fragility model. In reference [7], the failure probability is expressed using mainshock intensity as the horizontal coordinate (traditional fragility model function is used). In the model proposed in this work, the failure probability has an initial value, which is determined by mainshock and is included in the model proposed by Wen et al. [7]. The results in this work show that when the mainshock intensity level is lower (smaller than 0.4 g) if aftershock intensity is also less than 0.4 g, the earthquake sequences have a smaller effect on the probability of collapse. However, it may affect other damage states such as moderate or major damage, which is not presented in this study. In this work, due to limited recorded ground motion sequences, the sample size of the recorded ground motion sequences is only 60. Therefore, for future research, it is suggested that more numbers of recorded or synthesized earthquake sequences are utilized in conducting fragility analysis to reduce the difference induced by sample size. In addition, the M-A recorded in more earthquake events at the same station is suggested to be used.
In this study, the probability of collapse of the bridge structures under M-A sequences is emphasized. Researchers can use this model for other damage states. It is noted that the proposed modeling framework embraces sufficient flexibility, which adaptably incorporates any mainshock by parametric quadratic polynomials. Nonetheless, for future research, it is suggested that the proposed fragility model be applied for different types of real bridges or civil structures to check the applicability and validity of the model. If possible, shake-table testing may be conducted in which mainshock-aftershock sequences with variable intensities are included, and different degrees of damage can be recorded. With these data, the proposed method can be further adjusted and validated. The probability of collapse in this work has an initial value, which increases with the mainshock intensity. The initial value should also have a great correlation with the properties of the structure; therefore, it is worthy of studying the relationship between the initial value of the probability of collapse conditional on the M-A sequence with the characteristic of structures. In this work, the displacement ductility is used to judge the damage states; for future research, other damage states are suggested to be used, such as the Park-Ang model. In this study, we focus on developing a fragility function model for assessing a civil structure under earthquake sequences, and the methods for judging damage states would not affect the accuracy of the model proposed. It is worth mentioning that many aftershocks may follow a mainshock in reality. It is possible that more than one aftershocks are considered; however, this would further complicate the potential scaling relation between the mainshock and its aftershocks. For simplicity, the primary aftershock (that is the largest in its magnitude) was used with the mainshock to form the seismic sequences.
6.2. Conclusions
In this work, a mainshock-integrated aftershock fragility function model is proposed to calculate the probability of exceeding a damage state of a structure subjected to M-A sequences. A pile foundation-supported bridge system is used to test the proposed fragility model numerically. The findings show that the traditional mainshock fragility model is no longer suitable to fit the fragility curves of a structure under M-A sequences if the fragility curve is conditional upon a specific mainshock intensity and varying aftershock intensities. The developed mainshock-integrated aftershock fragility function model fits the fragility curves well in this circumstance by adding a parameter γm, which is a function of the mainshock of concern. With the developed fragility function model, the probability of exceeding a damage state of the bridge structures under the earthquake sequences can be calculated accurately. The findings also indicate that the M-A sequences have a great influence on the probability of collapse of the bridges modeled in this study. The probability of collapse has an initial value, which is a function of the mainshock intensity. It is observed that the initial values of the probability of collapse increase with the mainshock intensity. The proposed model can also be adapted to compute the reliability of other engineering structures under M-A sequences if the seismic hazards of both mainshocks and aftershocks at a given site are known.
Author Contributions
Conceptualization, X.G.; methodology, X.G., and Z.C.; investigation, X.G., and Z.Z.; resources, X.G.; data curation, X.G.; writing—original draft preparation, Z.Z., and X.G.; writing—review and editing, Z.C.; supervision, X.G.; project administration, X.G.; funding acquisition, X.G., and Z.C. All authors have read and agreed to the published version of the manuscript.
Funding
The first author acknowledges the supports from NSFC with Grant Number 51708484, NSFJP with Grant Number BK20170511, and NSFJHEIC with Grant Number 17KJB580010. Furthermore, the third author acknowledges the support of a University of Missouri Research Board Grant (“Design-oriented Scoured Foundation Modelling for Bridge Performance Analysis”).
Conflicts of Interest
The authors declare no conflict of interest.
References
- Risk Management Solutions. Reconnaissance Report: The 2008 Wenchuan Earthquake: Risk Management Lessons and Implications; Risk Management Solutions: Newark, CA, USA, 2008. [Google Scholar]
- Wen, R.; Zhou, Z.; Li, X.; Yang, C.; Wang, Y.; Liu, Q.; Cui, J. The strong ground motion observation for the Wenchuan aftershock. Earthq. Sci. 2009, 22, 181–187. [Google Scholar] [CrossRef] [Green Version]
- U.S. Geological Survey. Available online: https://www.usgs.gov/news/magnitude-78-earthquake-nepal-aftershocks (accessed on 1 September 2020).
- U.S. Geological Survey. Available online: http://earthquake.usgs.gov/earthquakes/eventpage/us10003rfk#general_summary (accessed on 1 September 2020).
- Alessandri, S.; Giannini, R.; Paolacci, F. Aftershock risk assessment and the decision to open traffic on bridges. Earthq. Eng. Struct. Dyn. 2013, 42, 2255–2275. [Google Scholar] [CrossRef]
- Moshref, A.; Khanmohammadi, M.; Tehranizadeh, M. Assessment of the seismic capacity of mainshock-damaged reinforced concrete columns. Bull. Earthq. Eng. 2017, 15, 291–311. [Google Scholar] [CrossRef]
- Wen, W.; Zhai, C.; Ji, D.; Li, S.; Xie, L. Framework for the vulnerability assessment of structure under M-A sequences. Soil Dyn. Earthq. Eng. 2017, 101, 41–52. [Google Scholar] [CrossRef]
- Gidaris, I.; Padgett, J.E.; Barbosa, A.R.; Chen, S. Multiple-hazard fragility and restoration models of highway bridges for regional risk and resilience assessment in the united states: State-of-the-art review. J. Struct. Eng. 2016, 143, 04016188. [Google Scholar] [CrossRef]
- Omranian, E.; Abdelnaby, A.; Abdollahzadeh, G.; Rostamian, M.; Hosseinpour, F. Fragility curve development for the seismic vulnerability assessment of retrofitted RC bridges under mainshock-aftershock seismic sequences. In Structures Congress 2018: Bridges, Transportation Structures, and Nonbuilding Structures; American Society of Civil Engineers: Reston, VA, USA, 2018; pp. 308–316. [Google Scholar] [CrossRef]
- Konstandakopoulou, F.; Konstantinidou, M.; Pnevmatikos, N.; Hatzigeorgiou, G.D. Safety and Performance of Offshore Platforms Subjected to Repeated Earthquakes. Infrastructures 2020, 5, 38. [Google Scholar] [CrossRef] [Green Version]
- Goda, K.; Salami, M.R. Inelastic seismic demand estimation of wood-frame houses subjected to sequences. Bull. Earthq. Eng. 2014, 12, 855–874. [Google Scholar] [CrossRef]
- Li, Y.; Song, R.; Van De Lindt, J.W. Collapse fragility of steel structures subjected to earthquake M-A sequences. J. Struct. Eng. 2014, 140, 04014095. [Google Scholar] [CrossRef]
- Zhai, C.-H.; Zheng, Z.; Li, S.; Xie, L.-L. Seismic analyses of a RCC building under mainshock–aftershock seismic sequences. Soil Dyn. Earthq. Eng. 2015, 74, 46–55. [Google Scholar] [CrossRef]
- Han, R.; Li, Y.; Van De Lindt, J. Seismic risk of base isolated non-ductile reinforced concrete buildings considering uncertainties and mainshock–aftershock sequences. Struct. Saf. 2014, 50, 39–56. [Google Scholar] [CrossRef]
- Yin, Y.J.; Li, Y. Loss estimation of light-frame wood construction subjected to M-A sequences. J. Perform. Constr. Facil. 2010, 25, 504–513. [Google Scholar] [CrossRef]
- Li, Q.; Ellingwood, B.R. Performance evaluation and damage assessment of steel frame buildings under main shock-aftershock earthquake sequences. Earthq. Eng. Struct. Dyn. 2007, 36, 405–427. [Google Scholar] [CrossRef]
- Ruiz-García, J.; Negrete-Manriquez, J.C. Evaluation of drift demands in existing steel frames under as-recorded far-field and near-fault mainshock–aftershock seismic sequences. Eng. Struct. 2011, 33, 621–634. [Google Scholar] [CrossRef]
- Song, R.; Li, Y.; Lindt, J.W.V.D. Impact of earthquake ground motion characteristics on collapse risk of post-mainshock buildings considering aftershocks. Eng. Struct. 2014, 81, 349–361. [Google Scholar] [CrossRef]
- Goda, K.; Taylor, C.A. Effects of aftershocks on peak ductility demand due to strong ground motion records from shallow crustal earthquakes. Earthq. Eng. Struct. Dyn. 2012, 41, 2311–2330. [Google Scholar] [CrossRef]
- Hosseinpour, F.; Abdelnaby, A.E. Fragility curves for RC frames under multiple earthquakes. Soil Dyn. Earthq. Eng. 2017, 98, 222–234. [Google Scholar] [CrossRef]
- Ghosh, J.; Padgett, J.E.; Sánchez-Silva, M. Seismic damage accumulation of highway bridges in earthquake prone regions. Earthq. Spectra 2015, 31, 115–135. [Google Scholar] [CrossRef] [Green Version]
- Song, R.; Li, Y.; Lindt, J.W.V.D. Loss estimation of steel buildings to earthquake M-A sequences. Struct. Saf. 2016, 61, 1–11. [Google Scholar] [CrossRef] [Green Version]
- Dong, Y.; Frangopol, D.M. Risk and resilience assessment of bridges under mainshock and aftershocks incorporating uncertainties. Eng. Struct. 2015, 83, 198–208. [Google Scholar] [CrossRef]
- Fakharifar, M.; Chen, G.; Sneed, L.; Dalvand, A. Seismic performance of post-mainshock FRP/steel repaired RC bridge columns subjected to aftershocks. Compos. Part B 2015, 72, 183–198. [Google Scholar] [CrossRef]
- Pnevmatikos, N.; Thomos, G. Stochastic structural control under earthquake excitations. Struct. Control Health Monit. 2014, 21, 620–633. [Google Scholar] [CrossRef]
- Shinozuka, M.; Feng, M.Q.; Lee, J.; Naganuma, T. Statistical analysis of fragility curves. J. Eng. Mech. 2000, 126, 1224–1231. [Google Scholar] [CrossRef] [Green Version]
- Baker, J.W. Efficient analytical fragility function fitting using dynamic structural analysis. Earthq. Spectra 2015, 31, 579–599. [Google Scholar] [CrossRef]
- Reasenberg, P.A.; Jones, L.M. Earthquake hazard after a mainshock in California. Science 1989, 243, 1173–1176. [Google Scholar] [CrossRef]
- Ghosh, J.; Padgett, J.E. Aging considerations in the development of time-dependent seismic fragility curves. J. Struct. Eng. 2010, 136, 1497–1511. [Google Scholar] [CrossRef]
- OpenSees. The Open System for Earthquake Engineering Simulation. Available online: http://opensees.berkeley.edu/ (accessed on 1 September 2020).
- Mander, J.B.; Priestley, M.J.; Park, R. Theoretical stress-strain model for confined concrete. J. Struct. Eng. 1988, 114, 1804–1826. [Google Scholar] [CrossRef] [Green Version]
- Mazzoni, S.; McKenna, F.; Scott, M.H.; Fenves, G.L. OpenSees Command Language Manual; Pacific Earthquake Engineering Research (PEER) Center, University of California: Berkeley, CA, USA, 2006. [Google Scholar]
- American Petroleum Institute. Recommended Practice for Planning, Designing, and Constructing Fixed Offshore Platforms; American Petroleum Institute: Washington, DC, USA, 1989; Volume 2. [Google Scholar]
- Alliard, P.M.; Léger, P. Earthquake safety evaluation of gravity dams considering aftershocks and reduced drainage efficiency. J. Eng. Mech. 2008, 134, 12–22. [Google Scholar] [CrossRef]
- Yeo, G.L.; Cornell, C.A. Stochastic Characterization and Decision Bases under Time-Dependent Aftershock Risk in Performance-Based Earthquake Engineering; Pacific Earthquake Engineering Research Center: Berkeley, CA, USA, 2005. [Google Scholar]
- PEER. PEER Ground Motion Database. Available online: http://peer.berkely.edu (accessed on 1 January 2018).
Figure 1.
Flowchart for assessing the vulnerability of a structure under earthquake sequences.

Figure 2.
Pile-supported bridge model and the finite-element distributed springs for modeling the piles.
Figure 2.
Pile-supported bridge model and the finite-element distributed springs for modeling the piles.

Figure 3.
Mainshock-aftershock (M-A) sequence with mainshock intensity scaled to 0.8 g and aftershock intensity scaled to 0.5 g.
Figure 3.
Mainshock-aftershock (M-A) sequence with mainshock intensity scaled to 0.8 g and aftershock intensity scaled to 0.5 g.

Figure 4.
Collapse probability of the bridge under M-A sequences using different fragility models.

Figure 5.
Seismic fragility curves of bridge system under M-A sequences traditional fragility function model for different mainshock intensities.
Figure 5.
Seismic fragility curves of bridge system under M-A sequences traditional fragility function model for different mainshock intensities.

Figure 6.
Seismic fragility curves for bridge systems under M-A sequences using the proposed new fragility function model with different mainshock intensity.
Figure 6.
Seismic fragility curves for bridge systems under M-A sequences using the proposed new fragility function model with different mainshock intensity.

Figure 7.
Quadratic polynomial parameters (pi’s) for expressing mainshock intensity: (a) p1, p2, and p3 for ; (b) p4, p5, and p6 for ; and (c) p7, p8, and p9 for .
Figure 7.
Quadratic polynomial parameters (pi’s) for expressing mainshock intensity: (a) p1, p2, and p3 for ; (b) p4, p5, and p6 for ; and (c) p7, p8, and p9 for .


Table 1.
Recorded ground motion sequences.
| Num. | Mainshock | Aftershock | Earthquake Event | ||||
|---|---|---|---|---|---|---|---|
| Sequence | M | Rrup (km) | Sequence | M | Rrup (km) | ||
| 1 | 1180 | 7.62 | 24.96 | 3863 | 6.3 | 50.27 | CHI-CHI |
| 2 | 1181 | 7.62 | 47.32 | 3851 | 6.2 | 61.84 | CHI-CHI |
| 3 | 1182 | 7.62 | 9.76 | 3865 | 6.3 | 40.64 | CHI-CHI |
| 4 | 1183 | 7.62 | 40.43 | 3866 | 6.3 | 70.74 | CHI-CHI |
| 5 | 1184 | 7.62 | 19.96 | 3867 | 6.3 | 48.43 | CHI-CHI |
| 6 | 1185 | 7.62 | 59.04 | 3868 | 6.3 | 89.11 | CHI-CHI |
| 7 | 1186 | 7.62 | 34.18 | 3258 | 6.3 | 59.98 | CHI-CHI |
| 8 | 1187 | 7.62 | 38.13 | 3259 | 6.3 | 66.88 | CHI-CHI |
| 9 | 1188 | 7.62 | 66.64 | 3260 | 6.3 | 96.03 | CHI-CHI |
| 10 | 1189 | 7.62 | 59.09 | 3261 | 6.3 | 87.57 | CHI-CHI |
| 11 | 1190 | 7.62 | 50.53 | 3262 | 6.3 | 76.56 | CHI-CHI |
| 12 | 1191 | 7.62 | 63.21 | 3263 | 6.3 | 89.44 | CHI-CHI |
| 13 | 1193 | 7.62 | 9.62 | 3264 | 6.3 | 31.14 | CHI-CHI |
| 14 | 1194 | 7.62 | 19.07 | 3265 | 6.3 | 40.33 | CHI-CHI |
| 15 | 1195 | 7.62 | 29.52 | 3266 | 6.3 | 50.64 | CHI-CHI |
| 16 | 1196 | 7.62 | 41.99 | 3267 | 6.3 | 66.82 | CHI-CHI |
| 17 | 1197 | 7.62 | 3.12 | 3268 | 6.3 | 33.61 | CHI-CHI |
| 18 | 1198 | 7.62 | 10.96 | 3269 | 6.3 | 41.36 | CHI-CHI |
| 19 | 1199 | 7.62 | 35.43 | 3271 | 6.3 | 65.02 | CHI-CHI |
| 20 | 1200 | 7.62 | 43.82 | 3272 | 6.3 | 73.61 | CHI-CHI |
| 21 | 1201 | 7.62 | 14.82 | 3273 | 6.3 | 44.67 | CHI-CHI |
| 22 | 1202 | 7.62 | 12.65 | 3274 | 6.3 | 41.58 | CHI-CHI |
| 23 | 1203 | 7.62 | 16.04 | 3275 | 6.3 | 46.19 | CHI-CHI |
| 24 | 1204 | 7.62 | 31.87 | 3277 | 6.3 | 62.26 | CHI-CHI |
| 25 | 1205 | 7.62 | 19.83 | 3278 | 6.3 | 46.76 | CHI-CHI |
| 26 | 1206 | 7.62 | 28.17 | 3279 | 6.3 | 54.36 | CHI-CHI |
| 27 | 1207 | 7.62 | 55.13 | 3280 | 6.3 | 85.35 | CHI-CHI |
| 28 | 1208 | 7.62 | 24.1 | 3281 | 6.3 | 54.11 | CHI-CHI |
| 29 | 1209 | 7.62 | 24.13 | 3282 | 6.3 | 54.47 | CHI-CHI |
| 30 | 1210 | 7.62 | 44.76 | 3283 | 6.3 | 72.33 | CHI-CHI |
| 31 | 1211 | 7.62 | 39.02 | 3284 | 6.3 | 65.54 | CHI-CHI |
| 32 | 1212 | 7.62 | 48.49 | 3285 | 6.3 | 77.63 | CHI-CHI |
| 33 | 1213 | 7.62 | 54.3 | 3286 | 6.3 | 83.36 | CHI-CHI |
| 34 | 1214 | 7.62 | 56.93 | 3287 | 6.3 | 83.26 | CHI-CHI |
| 35 | 1216 | 7.62 | 73.26 | 3289 | 6.3 | 102.63 | CHI-CHI |
| 36 | 1256 | 7.62 | 56.93 | 3324 | 6.3 | 51.83 | CHI-CHI |
| 37 | 1257 | 7.62 | 56.14 | 3325 | 6.3 | 56.02 | CHI-CHI |
| 38 | 1258 | 7.62 | 47.58 | 2997 | 6.2 | 33.61 | CHI-CHI |
| 39 | 1259 | 7.62 | 47.86 | 2761 | 6.2 | 57.84 | CHI-CHI |
| 40 | 1260 | 7.62 | 56.3 | 3326 | 6.3 | 57.24 | CHI-CHI |
| 41 | 130 | 5.91 | 11.03 | 4276 | 5.5 | 12.39 | Friuli-02 |
| 42 | 122 | 6.5 | 33.4 | 131 | 5.91 | 41.39 | Friuli-01 |
| 43 | 132 | 5.91 | 14.75 | 4277 | 5.5 | 16.52 | Friuli-02 |
| 44 | 133 | 5.91 | 14.37 | 4278 | 5.5 | 16.31 | Friuli-02 |
| 45 | 125 | 6.5 | 15.82 | 4267 | 5.2 | 25.09 | Friuli-01 |
| 46 | 949 | 6.69 | 8.66 | 1651 | 6.05 | 12.06 | Northridge-01 |
| 47 | 954 | 6.69 | 19.74 | 1695 | 5.28 | 25.83 | Northridge |
| 48 | 963 | 6.69 | 20.72 | 1652 | 6.05 | 29.54 | Northridge |
| 49 | 974 | 6.69 | 22.21 | 3779 | 5.28 | 24.74 | Northridge |
| 50 | 978 | 6.69 | 23.07 | 1701 | 5.28 | 19.62 | Northridge |
| 51 | 981 | 6.69 | 42.2 | 1655 | 6.05 | 39.16 | Northridge |
| 52 | 982 | 6.69 | 5.43 | 1703 | 5.28 | 14.69 | Northridge |
| 53 | 984 | 6.69 | 41.17 | 1656 | 6.05 | 38.69 | Northridge |
| 54 | 985 | 6.69 | 29.88 | 1657 | 6.05 | 27.19 | Northridge |
| 55 | 988 | 6.69 | 15.53 | 1658 | 6.05 | 20.47 | Northridge |
| 56 | 990 | 6.69 | 36.62 | 1659 | 6.05 | 33.8 | Northridge |
| 57 | 995 | 6.69 | 24.03 | 1660 | 6.05 | 20.68 | Northridge |
| 58 | 996 | 6.69 | 20.81 | 1711 | 5.28 | 17.14 | Northridge |
| 59 | 999 | 6.69 | 37.36 | 1661 | 6.05 | 34.36 | Northridge |
| 60 | 1004 | 6.69 | 8.44 | 3771 | 5.28 | 11.66 | Northridge |
© 2020 by the authors. Licensee MDPI, Basel, Switzerland. This article is an open access article distributed under the terms and conditions of the Creative Commons Attribution (CC BY) license (http://creativecommons.org/licenses/by/4.0/).
Share and Cite
MDPI and ACS Style
Guo, X.; Zhang, Z.; Chen, Z. Mainshock-Integrated Aftershock Vulnerability Assessment of Bridge Structures. Appl. Sci. 2020, 10, 6843. https://0-doi-org.brum.beds.ac.uk/10.3390/app10196843
AMA Style
Guo X, Zhang Z, Chen Z. Mainshock-Integrated Aftershock Vulnerability Assessment of Bridge Structures. Applied Sciences. 2020; 10(19):6843. https://0-doi-org.brum.beds.ac.uk/10.3390/app10196843
Chicago/Turabian StyleGuo, Xuan, Zheyu Zhang, and ZhiQiang Chen. 2020. "Mainshock-Integrated Aftershock Vulnerability Assessment of Bridge Structures" Applied Sciences 10, no. 19: 6843. https://0-doi-org.brum.beds.ac.uk/10.3390/app10196843
Note that from the first issue of 2016, this journal uses article numbers instead of page numbers. See further details here.