Reliability-Based Preventive Maintenance Strategy of Truck Unloading Systems


Construction Engineering and Management Department, College of Environmental Design, King Fahd University of Petroleum and Minerals, Dhahran 31261, Saudi Arabia
*
Author to whom correspondence should be addressed.
Appl. Sci. 2020, 10(19), 6957; https://0-doi-org.brum.beds.ac.uk/10.3390/app10196957
Submission received: 11 September 2020
/
Revised: 30 September 2020
/
Accepted: 30 September 2020
/
Published: 5 October 2020
(This article belongs to the Special Issue Systems Engineering: Availability and Reliability)
Abstract
:The unloading of petroleum products is a complex and potentially dangerous operation since the unloading system contains complex interdependency components. Any failures in one of its components lead to a cut in the petroleum supply chain. Therefore, it is important to assess and evaluate the reliability of the unloading system in order to improve its availability. In this context, this paper presents the operation philosophy of the truck unloading system, failure modes of the components within the system, and a bottom-up approach to analyze the reliability of the system. In addition, it provides reliability data, such as failure rates, and mean time between failures of the system components. Furthermore, the reliability of the whole system was calculated and is presented for different time periods. The critical components, which are major contributors towards the system reliability, were identified. To enhance the system reliability, a reliability-based preventive maintenance strategy for the critical components was implemented. In addition, the preventive maintenance scheduling was identified based on the reliability plots of the unloading system. The best schedule for preventive maintenance of the system was determined based on the reliability function to be every 45 days for maintaining the system reliability above 0.9. Findings reveal that the reliability of the unloading system was significantly improved. For instance, the system reliability at one year improved by 80%, and this ratio increased dramatically as the time period increased.
1. Introduction
The supply chain of petroleum products faces major challenges, i.e., demand growth and the complexity of fluid transportation. The petroleum supply chain contains multiple stations extending from oil wells in exploration and production areas to the final destination. Each station has its own difficulties and challenges in the contribution towards the success of the safe and continuous supply. Undoubtedly, meeting a regional demand of petroleum products requires an uninterrupted safe operation. In the last station, the petroleum products pass through a process called Custody Transfer in which the ownership of the products transfers from one party to another. These massive quantities need to be measured accurately when their possession is being transferred to reserve the rights of each party. Nevertheless, fluid measurements are complex due to multiple factors which, when they deviate, may have a significance impact of the genuineness of the measurements. For instance, if the fluid volume is measured directly in a Custody Transfer process, then fluid pressure and temperature have to be maintained at certain levels to have an accurate volume measurement.
In bulk plants and distribution points, the petroleum products are transferred from truck tanks to storage tanks through the truck unloading system, in which the fluid passes through multiple mechanical components and instruments, among which is the flow meter where the quantity of the fluid is being measured in a process called truck unloading. The truck unloading system is a vital part of any supply chain and can be available in many applications such as airports, petroleum distribution plants and some other stations, where the high traffic requires large quantities of fuel. Apparently, any failure in these systems leads to a cut in the petroleum supply chain. Therefore, it is important to enhance the reliability of unloading systems by performing a deeper study of the reliability of their components to find out how each component contributes to the system reliability.
The truck unloading system is an integration of a large number of different mechanisms working as one unit to simultaneously unload the petroleum products and genuinely measure its quantity with high measurement accuracy and high reliability to have an uninterrupted operation. It contains a variety of interacting mechanical, piping, electrical, and instrumentation components. The sequence of operation starts when trucks arrive to unload the petroleum product to storage tanks. The unloading arms are then connected to the bottom of the truck and the vapor arm is connected to the top of the truck to prevent a vacuum, which might cause the truck to collapse. Through the effect of the gravitational force and the difference in elevation, the fluid will start flowing slowly from the truck tank into the unloading arms until it reaches the pump, and then fluid will be pumped in the desired predefined rate in the pre-set controller, which is considered the brain of the system. Passing through the system piping, the fluid eventually reaches the outlet with the same quantity measured by the flow meter.
Because petroleum products are dangerous and flammable, they require special attention from their extraction until they reach the final customer. The unloading system is an important part of the long petroleum supply chain, which plays a connecting role between different modes of transportation. The unloading system contains many linked, sophisticated and complex components. Any failures in one of its components may lead to a cut in the whole petroleum supply chain. Therefore, it is important to evaluate the reliability of the unloading system by performing a deep study of the reliability of its components to find out how each component contributes to the system reliability. In this context, this paper presents the operation philosophy of the truck unloading system, failure modes of the components within the system, and a bottom-up approach to analyze the reliability of the system.
Despite the importance of the truck unloading systems, and to the best of our knowledge, the reliability-based preventive maintenance analysis has not been carried out on the unloading systems. As will be discussed in the literature review section, most of the studies have generally considered the failure rates and reliability of pipeline transportation applications. In fact, most of these studies have been carried out for reliability analysis of the component levels, regardless of the system effect of the behavior of these components.
In this context, this paper assesses the current level of the overall truck unloading system reliability and the failure modes of the components of the unloading system. It assesses the truck unloading system reliability during the lifetime of the unloading system, investigates the effect of the preventive maintenance on the truck unloading system reliability. Then, it establishes a reliability-based preventive maintenance strategy for the truck unloading systems and identifies the major contributors to the system reliability for design improvement purposes.
The rest of this paper is organized as follows; the relevant studies are reviewed in Section 2, followed by a description of the materials and methods in Section 3. Section 4 presents the results and discussion. Finally, the paper is concluded and directions for further research are highlighted in Section 5.
2. Literature Review
In this paper, the main concern is the reliability of unloading systems, which includes a variety of pipeline components. Reliability of oil and gas pipelines and equipment has always been identified as a major problem in the industry. These systems work continuously for a long period of time. Thus, a minor failure of operation in any of their parts can have a major impact on the overall system performance. Safety and availability of pipeline components are the most important factors contributing to the overall system quality. Consequently, reliability is crucial for achieving the objectives of any industrial system. This section focuses on the reliability of pipeline sources and the reliability of applications similar to truck loading/unloading systems. In addition, it reviews the state-of-the-art papers related to reliability-based maintenance of similar applications.
During the design process of any systems, reliability is usually evaluated and assessed [1]. Several published papers have focused on the reliability of system components and units and their improvement [2,3,4]. The reliability of many systems has been evaluated [5,6,7]. It is mentioned that systems reliability is diminishable. Therefore, a minimum reliability threshold must be set to maintain (restore) a system and enhance its reliability. The repair process can be broken down into further unique subtasks and delays, and various maintenance measures, which include mean repair time (MTTR), the median repair time, mode, most likely repair time, and maintenance durations.
Nataša at al. [8] addressed the spare parts inventory in aircraft maintenance. The authors proposed a decision-making process for planning and controlling the non-repairable aircraft spare parts inventory by evaluating the reliability of non-repairable aircraft components. In addition, a reliability model was proposed to assess the subcomponents reliability. They also presented a new approach to determine the required amount of aircraft spare parts available in the inventory over a given period of time. Hou et al. [9] described the reliability relationship between components in complex systems. They developed a preventive maintenance action model for series and parallel systems to determine the optimal cost and timing. A case study is presented to prove the practicality of the developed model.
Vishnu and Regikumar [10] proposed a generalized method for reliability centered maintenance (RCM) where the maintenance is scheduled based on reliability of equipment in process plants. The maintenance strategy was developed based on two factors: criticality score and reliability parameters of the equipment. These factors derived from historical data of equipment failure and previous maintenance schedules. Consequently, a new maintenance strategy for each component was constructed using the analytical hierarchy process (AHP) method with the help of maintenance experts and practitioner opinions. Tee and Ekpiwhre [11] presented a reliability-centered maintenance analysis, carried out on key assets of a newly built Nigerian road junction infrastructure. The adaptation of the classical RCM succeeded in enforcing the different assets allocated to preventive maintenance (PM) strategies and showed that its implementation in the road industry can minimize unnecessary maintenance and regular reactive maintenance by optimizing its preventive maintenance interval in an effective way. In addition, Yssaad et al. [12] proposed a reliability-based centered maintenance for the distribution of a power system. The authors discussed the two major goals of RCM; ensuring protection through preventative maintenance measures; and preserving functionality in the most cost-effective way when protection is not important.
Li et al. [13] expressed the importance of reducing machine failures to have an uninterrupted operation and emphasized the poor efficiency of the conventional preventive maintenance method, which sometimes causes unnecessary costs because it does not consider the current state of the equipment. In this study, the researchers developed a dynamic preventive maintenance model based on the reliability of the current of the equipment rather than the conventional fixed maintenance. In addition, they proved in a case study that the proposed model can reduce the unavailability of the equipment and increase the efficiency of its operation throughout its useful life.
Rafael and Shamsi [14] considered the decision-making process in maintenance strategy for water distribution systems. The probability of having a functional network system upon demand was calculated based on the current level of components reliability based on which maintenance need could be prioritized in low reliability areas. They also took into account the severity of impact on the entire system from the failure of every component.
In addition, a report was published by Stiftelsen for industriell og teknisk forskning (SINTEF) along with the cooperation of multiple global organizations in the oil and gas industry [15]. It mainly provides an estimation with regards to the reliability data for selected equipment normally used in control systems within the oil and gas industry. The reliability data can support organizations to analyze reliability levels in line with the international standards IEC 61508 and IEC 61511. Generally, the study took the reliability approach to investigate the root causes of failures in equipment and to analyze the effect level in terms of failure on demand and critical safety failures.
The biggest documented and published project by oil and gas exploration and production organization evaluated, assessed, recorded, and analyzed failures of a huge number of piping components and mechanical machines used in these industries over a defined period of time. The project considered both the operational and calendar time in the assessment of the failure rates that took place in the normal operating lifecycle rather than the infant mortality or burn-in phase. The main purpose of this project is to provide the stated industry with a comprehensive reliable data to ensure cost-effective and safe process improvement. To minimize the effect of variation in the collected failure data, we considered a 90% uncertainty interval for the lower and upper limits. Additionally, the failure modes of each component are categorized based on their severity; allowing the readers to understand the likelihood of a critical failure in each of these components [16].
The previous two studies, SINTEF and Offshore Reliability Data (OREDA), are the best documented sources of oil and gas equipment reliability data due to their practical nature, which came from the collaboration of a number of large operation organizations in that field. The data are also reliable because of the wide range of involvement within the operation organizations and outside of these organizations. Some of the components in the oil and gas transportation systems are highly reliable, which makes it extremely hard to estimate a failure rate for them. These two studies fill this gap by applying long periods of tests to these particular components. Furthermore, a study has been conducted by Sun et al. [17] to improve the long-term preventive maintenance decisions using a reliability prediction approach. A case study of water pipelines was developed to collect real failure data of two main segments: exposed pipelines and buried pipelines. The case study was developed on the basis that each one of the two pipeline segments had its own failure distribution, which helps one come up with an overall system reliability. In addition, the study investigates the improvement of the preventive maintenance on the system reliability to develop a cost-effective system maintenance strategy. Subsequently, a mathematical reliability formula was derived from the exponential distribution to optimize the need for preventive maintenance.
The above study, unlike this research, focuses on water pipelines rather than oil and gas pipelines. However, its analytical approach of the preventive maintenance can be used in this research to recommend a planning framework for the preventive maintenance of the unloading system. Rimkevicius et al. [18] developed a comprehensive method for assessing reliability in energy pipeline systems scientifically, which can be applied to oil and gas systems. Basically, the failure in different mechanisms and the pipes structural integrity are considered as the base to assess system reliability. The study is centered around three types of analyses: mathematical, thermal-hydraulic, and pipeline structure analyses. The authors used homogeneous and non-homogeneous Poisson distributions with a constant failure rate assumption to give a better insight into the likelihood of future failures in the pipeline network system. Interestingly, they are confident that the developed method can be applied under any environmental condition. It was found that pipe corrosion constitutes around 30–40% of the total pipeline failures. Moreover, the frequency of failures in pipelines increases when they exceed 30 years in service. The assumption of a constant failure rate throughout the pipeline is the main assumption of this research. The approaches taken in this study assumed a constant failure rate and consideration of different mechanisms, like what we have done in the unloading application, that has enlightened the context of this research.
Shalay et al. [19] discussed the reliability distributions, such as exponential, normal, Rayleigh, logarithmic, and Weibull. The authors highlighted that despite the fact that the usage of exponential distribution under the assumption of constant failure rate of equipment is beneficial during the normal operation life, it is important to apply other distributions to further study the failure behavior of wearing and change of properties of the equipment by applying normal and Weibull distributions. Moreover, this gives a better understanding of the failure prediction under varying working conditions and changing loads on the equipment. An algorithm has been developed that analyzes the technological parameters, which helps in the selection of the appropriate distribution function. The main purpose of this study is to provide operating entities in the pipeline transportation industry with mathematical model to better predict the likelihood of failure of their equipment under dynamic operating conditions. Kong et al. [20] proposed a reliability-based maintenance approach for the deterioration of civil infrastructure systems addressing different uncertainties. These uncertainties include resistances and time loads changes, and interventions of the maintenance series that are used to save the systems. The authors used computer software for this analysis.
Wu et al. [21] introduced a new model of cost effective maintenance strategies to identify an acceptable period of the monitoring conditions and level of deterioration after incomplete preventive repairs. The models on maintenance optimization for the production system were developed by Barata and Tong respectively using the various methods [22,23].
Rao et al. [24] proposed an opportunity maintenance model for the production line to carry out preventive maintenance on several machines simultaneously, when one machine in the production line fails. Nonetheless, the maintenance technique is difficult to use for a complicated line consisting of a large number of machines. Zhang et al. [25] developed an opportunistic maintenance strategy for wind turbines addressing an inconsistent maintenance plan dependent on reliability. The authors characterized this maintenance and illustrated the consequences of corrective maintenance action using a hybrid model based on the hazard rate. The findings show the effect that different maintenance costs have on the economic benefits of an opportunistic maintenance strategy. Xie et al. [26] established an efficient strategy in view of accessibility for offshore wind turbines to decrease maintenance costs. A failure rate based on minimal data has been estimated using the Weibull distribution with a three-parameter process approach. The opportunistic maintenance plan was implemented to minimize maintenance costs by optimizing the preventive maintenance age and an acceptable maintenance age.
Arunraj et al. [27] used the analytical hierarchy method and the other planning approaches for implementing maintenance plans based on analysis of the failure rate of the system and maintenance costs, respectively. Zhao et al. [28] also suggested a delay-time model to prevent system failure during the preventive maintenance cycle when the machines were damaged. Li et al. [29] proposed a strategy based on preventive maintenance for the manufacturing plant. The authors measured the criticality of the machines in the line and then categorized the machines. Hadidi and Alkhaldi [30] presented several practical solutions for enhancing reliability in the systems of arm loading. The purpose of this study is to prevent oil shipment delay.
The previous study gives an insight about the normal behavior of similar equipment under the effect of aging. In other words, it shows the effect of wear out of such equipment. Additionally, it gives the impact of the changing operating conditions that might be experienced throughout the lifecycle of the unloading system. Reis et al. [31] simulated the tank truck loading operations in a fuel distribution terminal to generate a theoretical simulation of the tank truck loading operation, which helps in improving the efficiency and effectiveness of the tank truck loading systems. Probability theories have been used to simulate tanks queuing for different fuel types aiming to improve the queuing policy. A simulation of varying fuel flow rates and number of fuel loading arms has been tested to come up with the new queuing policy. The results show that the simulation of the new optimum queuing policy has a more efficient use of resources than the previous policy, which was based on first-come-first-served.
Jamshidi and Esfahani [32] dealt with a maintenance-based reliability approach for a machine-scheduling problem. The authors proposed a nonlinear mixed-integer model to simultaneously increase efficiency, and reduce maintenance, delay, and interrupting costs. Navarro et al. [33] introduced an optimization model based on a reliability-based maintenance approach for the preventive design of corrosion, addressing the environmental effects and costs of the life cycle. The findings of their study showed a reduction in environmental impacts and life cycle costs using the proposed model.
Based on the above literature review, it is clear that no study has assessed and evaluated the reliability of truck unloading systems. Even though international standards cover the minimum requirements for these systems, the design improvement and the maintenance scheduling to maintain uninterrupted operation needs to have a clear assessment of the effect of each component to the overall system reliability. Consequently, the aim of this study is to fill the gap of the previous works. In addition, this paper presents an operation strategy of the truck unloading system, the failure modes of the components within the system, and a bottom-up approach to the reliability of the system. It assesses the truck unloading system reliability during the operating lifecycle to the end of its useful life, investigates the effect of the preventive maintenance on the truck unloading system reliability, and identifies the major contributors to the system reliability for design improvement purposes.
3. Materials and Methods
In this section, the operation philosophy of the unloading system is explained and the followed approaches are summarized. In general, the truck unloading system is a piping system that absorbs liquid fuel from trucks and measures the quantity as accurately as possible before transferring it to the storage tanks. The characteristics of the devices are listed in Table 1.
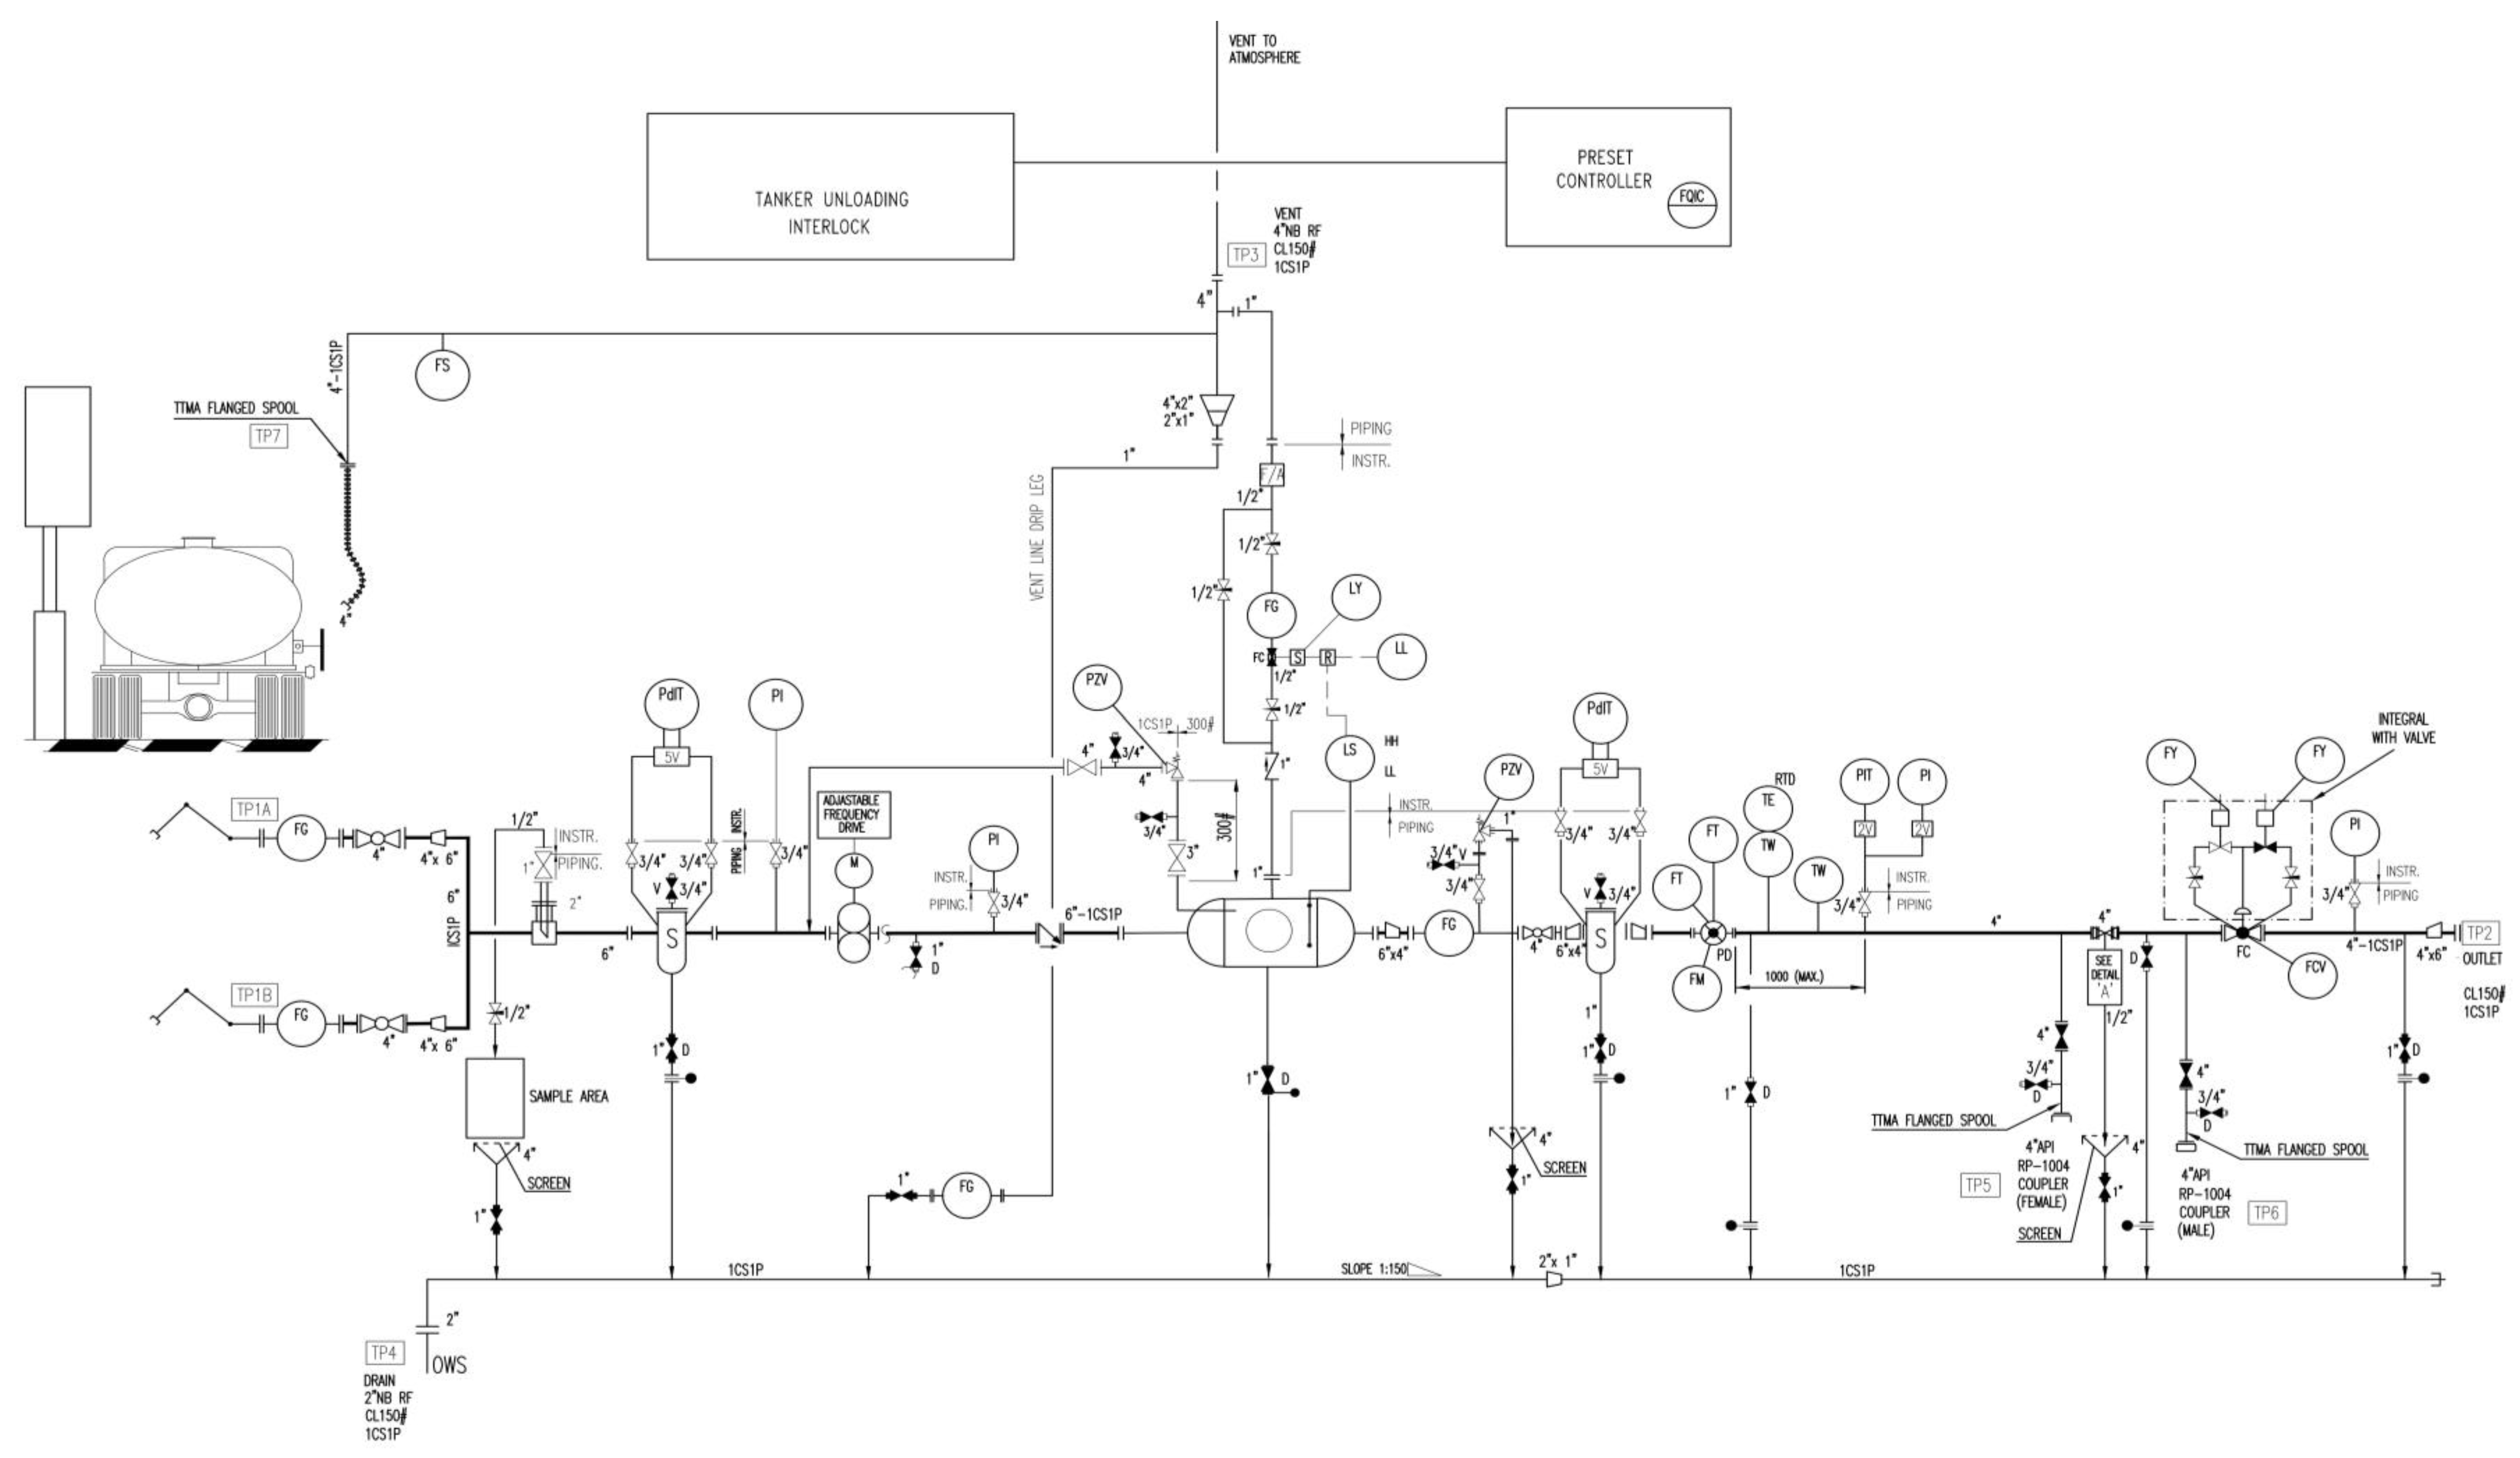
In the following section, a process sequential overview is discussed to understand the role of main components in the system. Table 2 shows the list of components of the truck unloading system and their associated symbols. Figure 1 shows the truck unloading system showing the symbols.
The unloading arms are connected to the bottom of a truck and the vapor arm is connected to the top of a truck to prevent a vacuum, which might cause the truck to collapse. The fluid starts flowing slowly from the truck to the unloading arms due to the gravitational force and difference in the elevation, which can be noticed through the visual flow glass in each of the two arms. The ball valves in each arm will be normally open so that fluid can pass through the two inlet streams. After that, the fluid will merge into the main streamline via a tee joint. The fluid then flows through a strainer that includes a differential pressure transmitter to monitor the difference in pressure between the inlet and outlet. This is mainly designed to filter the liquid in order to protect the rotating parts of the unloading pump against solid particles. Once the unloading pump starts working, the fluid will flow in the desired predefined rate in the pre-set controller, which is considered as the brain of the system. Downstream of the pump there is a check valve to prevent fluid from flowing in the opposite direction. Up to this point of the process, the fluid contains air, which needs to be removed to have an accurate measurement of the liquid quantity. Therefore, the fluid will pass through an air eliminator vessel where the air and liquid are separated. The air will flow back to the top of the truck through the vapor arm, while the liquid will continue its flow in the mainstream. There are two pressure relief valves; one valve is located in the vent line of the air eliminator and the other valve is available downstream of the air eliminator. The function of these valves is to protect the system from excess pressure with a predesigned pressure set point. Subsequently, the fluid will pass through another strainer equipped with a differential pressure transmitter for filtration purposes before entering the positive displacement meter to protect its rotating parts from solid particles, giving a more authentic measurement reading. The positive displacement meter then will measure the volumetric flow rate by displacement of the flowing fluid. The volume flow rate depends on the pressure of the fluid so that it passes into a pressure transmitter to ensure that the fluid being measured is within the desired pressure range. Otherwise, a signal will be sent to the system controller to notify any observed unwanted changes. Just before the outlet, there is a flow control valve through which the entire system flow is being controlled. The outlet point is directly connected to the storage tank.
The following are the assumptions and parameters of the system analysis:
- Piping spools failure rates are not considered as part of the system due to their short length and ease of replacement.
- Electrical boxes and terminations are not considered as part of the system due to the ease of replacement.
- System study is under the normal operating phase of the system lifecycle; burn-in and wear-out phases are not considered.
- System useful life is 20 years, which is common for such systems in the same field and under similar operating conditions.
- There is a constant failure rate (random failures) for each piece of equipment; proven to be very close to the actual failure rate during normal operating lifecycle.
- Difference in sample size in the determination of the failure rate is negligible.
3.1. System Reliability
The system reliability is the probability that the entire system will function successfully at any time. The system performance is dependent on the performance of its sub-systems (or its components). In other words, each component contributes in one way or another to the overall system performance. Consequently, the failure of any part of the system will either partially affect the overall system performance or it will cause a failure to the system. In this study, the focus is on the components of the system that have a major contribution to the system performance, and it is either impossible or not safe to operate without them. During the design stage of any system, it is necessary to decide which components are in series and which should be in parallel. A series system means that the whole system will fail if any components fail. A parallel system fails if all of its components fail. In the truck unloading system, there are two inlet streams, each one consists of an unloading arm and a ball valve connected in series, each one of these two streams are connected in parallel. In other words, if one stream fails, the other one can still be functional. The remaining components are connected in series. For instance, if the positive displacement pump fails to absorb the fluid, then the entire system will fail. A reliability block diagram of an unloading system is shown in Figure 2.
3.2. Data Collection
Reliability assessment studies are mainly dependent on failure rates data. The more reliable and valid the data, the better the reliability can be assessed. Specifically, in this case, it is necessary to have a large sample size to investigate random failures of a particular component, unlike other components where failures are not random. To satisfy this point, the components failure rates are extracted from the offshore and onshore reliability data (OREDA) [16] project, which is a large scale project under similar conditions in the same industry. For the remaining components, more valid samples were taken from one of the largest oil and gas operation companies in the Middle East. Some of the components have high reliability and failure rarely happens. For these components, using historical data from a truck unloading system was not feasible, instead, the data were taken from OREDA. These data include the number of tested units, number of failures and duration for a number of items such as ball valve, gate valve, pressure relief valve, flow control valve, differential pressure transmitter, pressure transmitter, level switch, and air eliminator. Table 3 shows the number of units tested, number of failures of tested units, test duration, and the mean time to failure (MTTF) for each component. Unloading arms, positive displacement pump, check valve, flow meter (positive displacement meter), plug valve, and strainer, where investigated under identical truck unloading system, were included, while the remaining were taken from the OREDA project. On the other hand, lambda (λ) and mean time to failure (MTTF) were calculated using Equations (1) and (2), respectively. Mean time between failures yielded clear figures on the random failure behavior of a particular component and ultimately it was essential for reliability calculations.
4. Data Analysis and Results
The aim of this study was to assess the truck unloading system reliability, which will allow the system users to know which part of the system is essential for preventive maintenance and the availability of spare parts to ensure continuous operation. Furthermore, the study will provide valuable insights to the system manufacturers, such as in which part of the system they should concentrate during the design improvement process, which will help produce a more reliable system that can be available and durable for a long period of time. In this section, mean time between failures, failure modes, and reliability of the system will be analyzed and discussed.
4.1. Mean Time between Failures
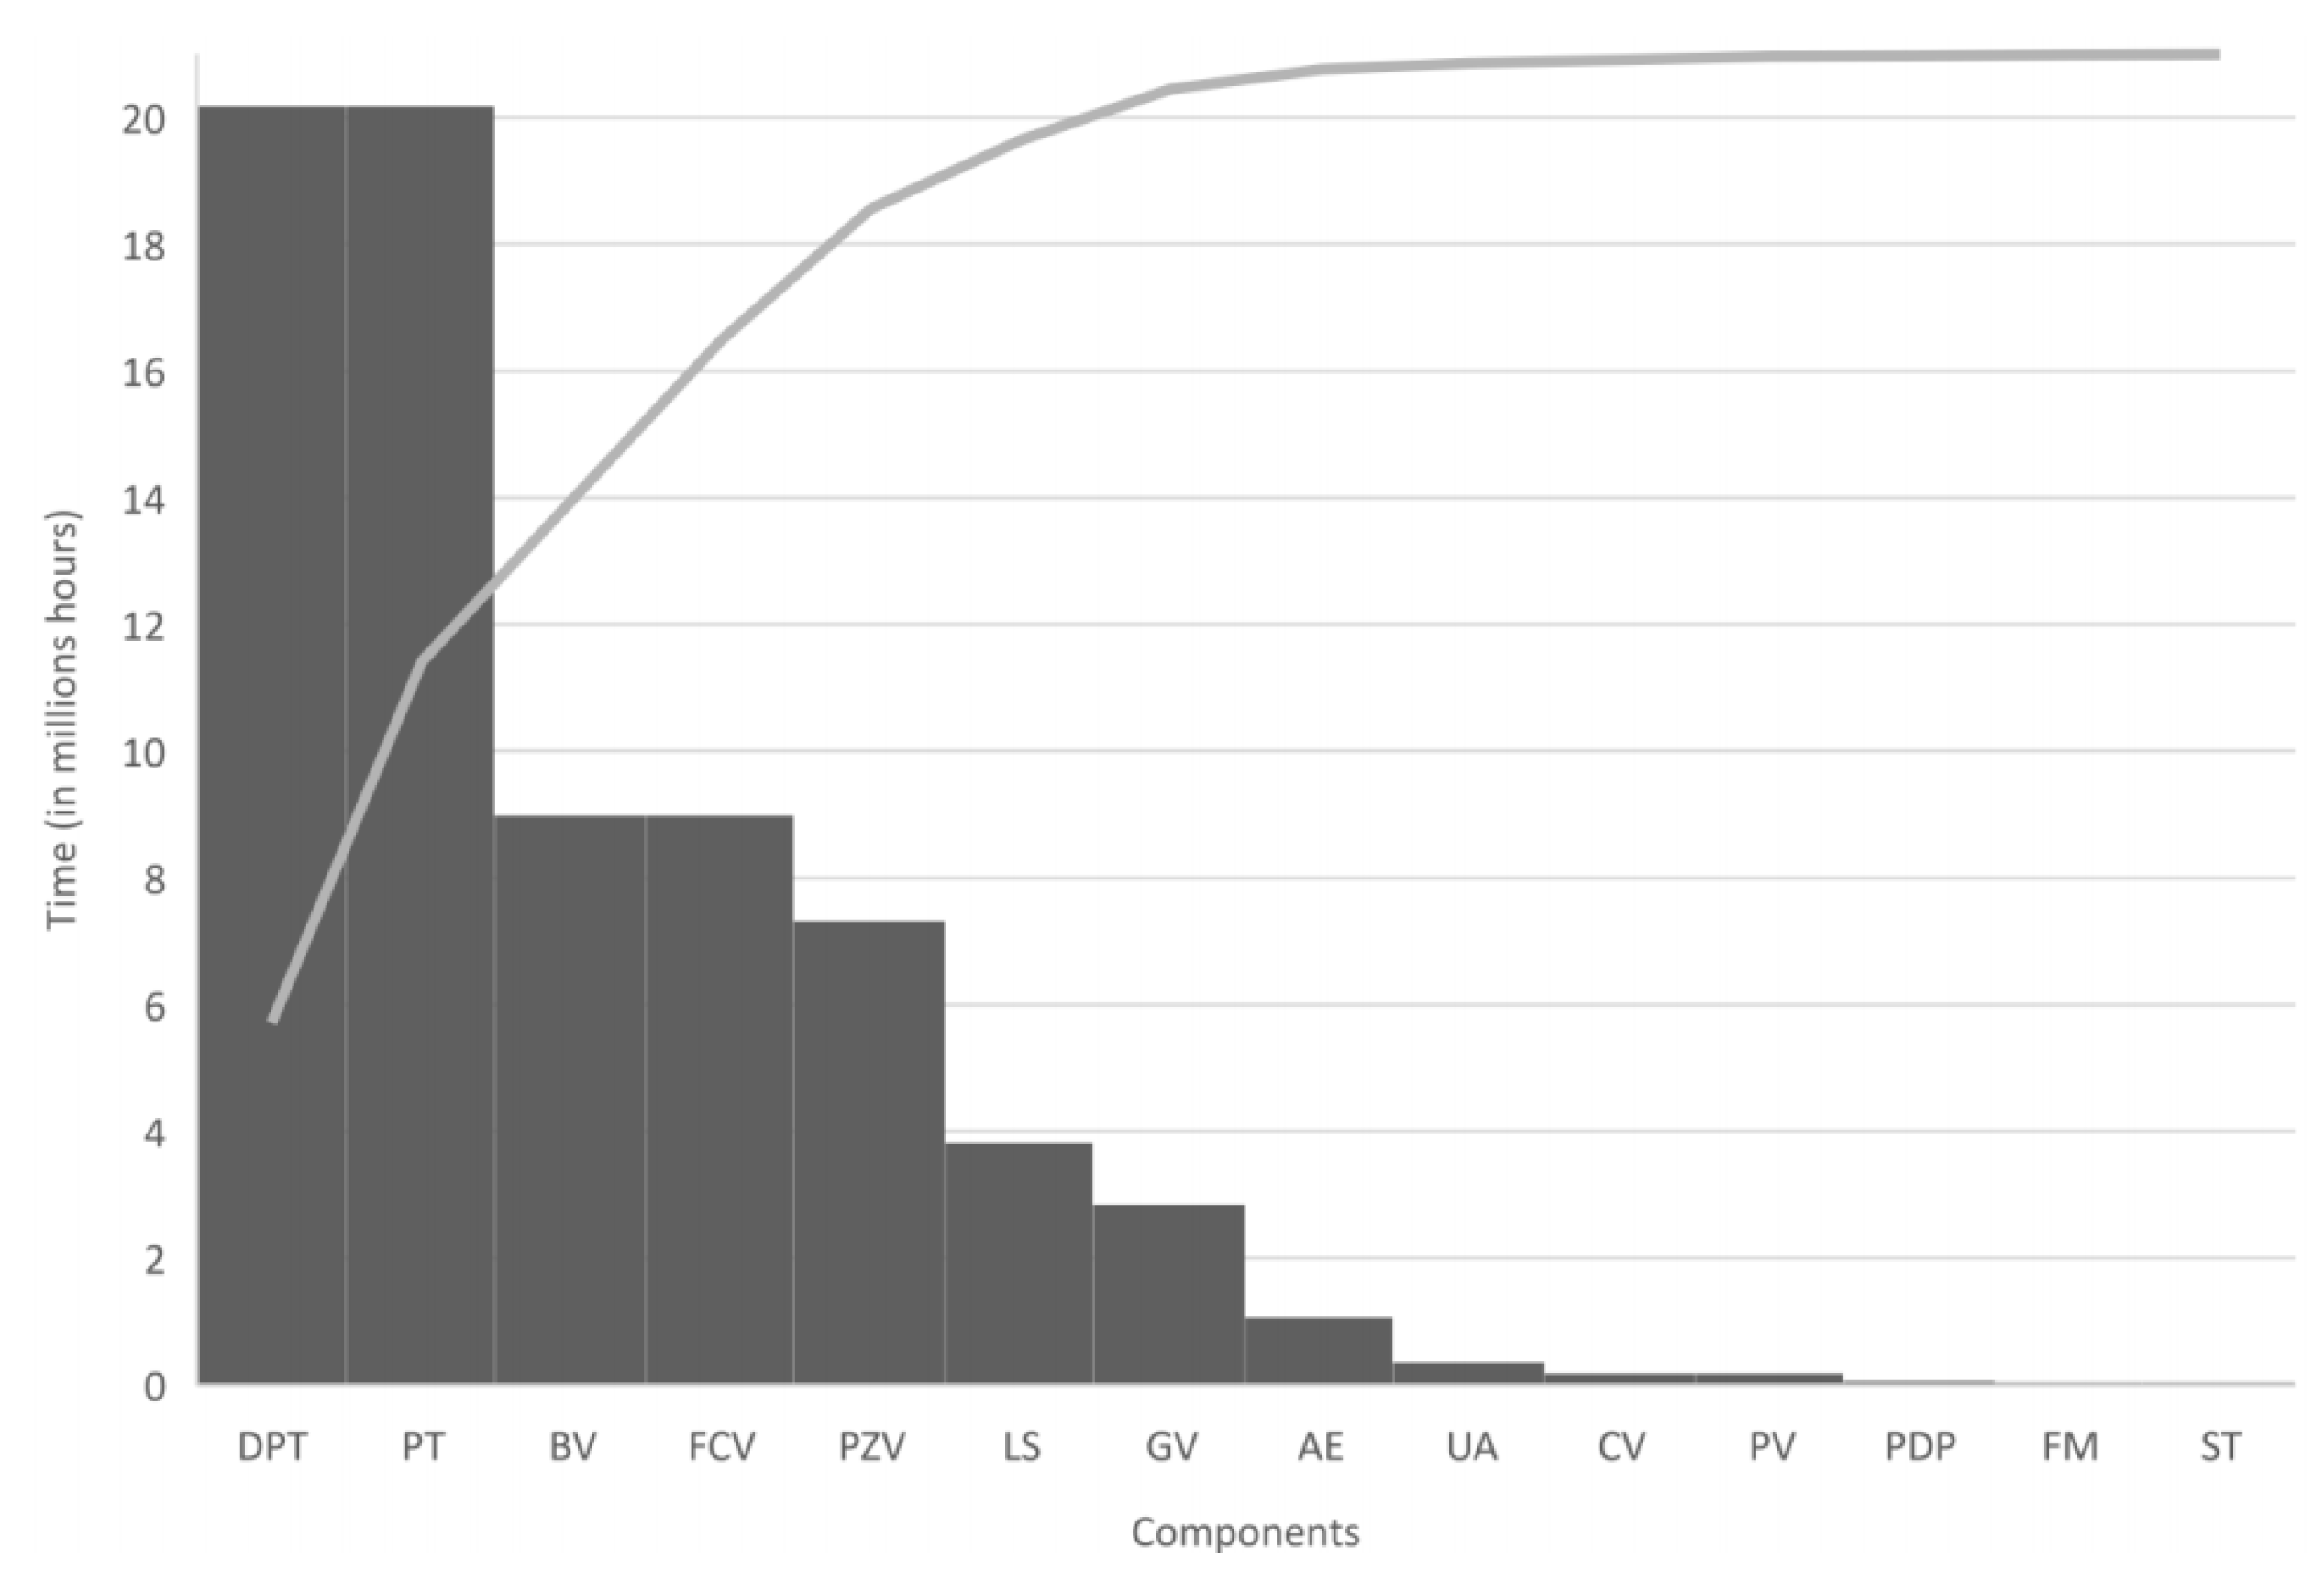
The mean time between failures plays a major role in the reliability investigations. It has a significant contribution to the maintenance scheduling and cost prediction. Figure 3 shows the mean time between failures of each component in the unloading system. Clearly, the differential pressure transmitter and the pressure transmitter have the longest time intervals without failures. This is of no surprise to the industry practitioners due to the nature of the instrumentation operation and material of construction. On the other hand, the positive displacement pump and the positive displacement flow meter have the shortest time intervals between consecutive failures due to the design complexity of the rotating mechanisms within the two components. Most importantly, any failure of the flow meter needs to be detected as early as possible to avoid uncertainty variation in fluid measurements. In addition, the strainer has a short period between consecutive failures because usually, such filtration systems need a continuous cleaning of its internal parts and the failures of these components can be observed without a regular frequent cleaning. Therefore, the frequent cleaning of the strainer will lead to an increase in the mean time between the failures. It is noted that all the valves have a medium time between failures, while piping spools have long time intervals between failures. According to some studies discussed earlier in the literature review section, the air eliminator has a relatively low mean time between failures due to the complex design in the separation process that takes place in this portion of the system. In addition, the unloading arms also have a relatively low mean time between failures compared to the piping spools due to the dynamic nature of the swivel joints that connects the arm parts together and the excessive movement they experience externally.
4.2. Failure Modes
Table 4 shows the failure modes of each individual component that was observed in accordance with the same study of the failure rate of respective components. For instance, the three failures that usually happen in the positive displacement pump are vibration, parameter deviation, and failure to start on demand. Looking profoundly into the failure modes of the critical components, the positive displacement pump and positive displacement meter, it is noticed that these failures particularly, unlike other component failures, could be caused by deficiency of more than one part of the component construction, therefore the root cause of the failures could be very difficult to detect. On the other hand, unloading arm failures can easily be detected. Practically, valves are extremely important components in the system to either isolate or control the fluid flow. It has been found that almost all of the valve failures are a result of their construction integrity or excessive operation conditions; both of these failures cause an internal or an external leakage. Failure detection is out of the scope of this study; however, knowing the failure moods and their root causes are essential to reliability improvement.
4.3. Unloading System Reliability
Since the components and the whole system are assumed to have constant failure rates (random failures), the reliability figures must be investigated in multiple time intervals. For each component, the reliability of the system is calculated at the end of the first year, the fifth year, the tenth year, and the twentieth year using Equation (3). Table 5 shows the reliability of each component in the system.
where is the component i reliability, is the reliability of components connected in parallel, F(t) is the cumulative probability distribution, and is the number of components connected in parallel.
For the other components connected in series, individual reliability was calculated using Equation (3). Considering each sub-system with its redundant as a single component that has a single reliability value as illustrated in the streams 1 and 2 combined row as given in Table 3 will validate the concept of a complete series system. Streams 1 and 2 combined reliability was calculated using Equation (4), considering stream 1 and stream 2 in parallel connection. As a result, the system’s components shown in Figure 2 become one line of series components from start to end. Consequently, the total system reliability can be calculated using Equation (5). It is important to note that neither the unloading arms nor the ball valves were directly considered in the system reliability calculations, instead, their subsystem (stream 1 and 2 combined) was directly considered in the system reliability calculations and this will account for both unloading arms and the ball valves connected to them.
where is the reliability of component i and n is the number of components connected in series.
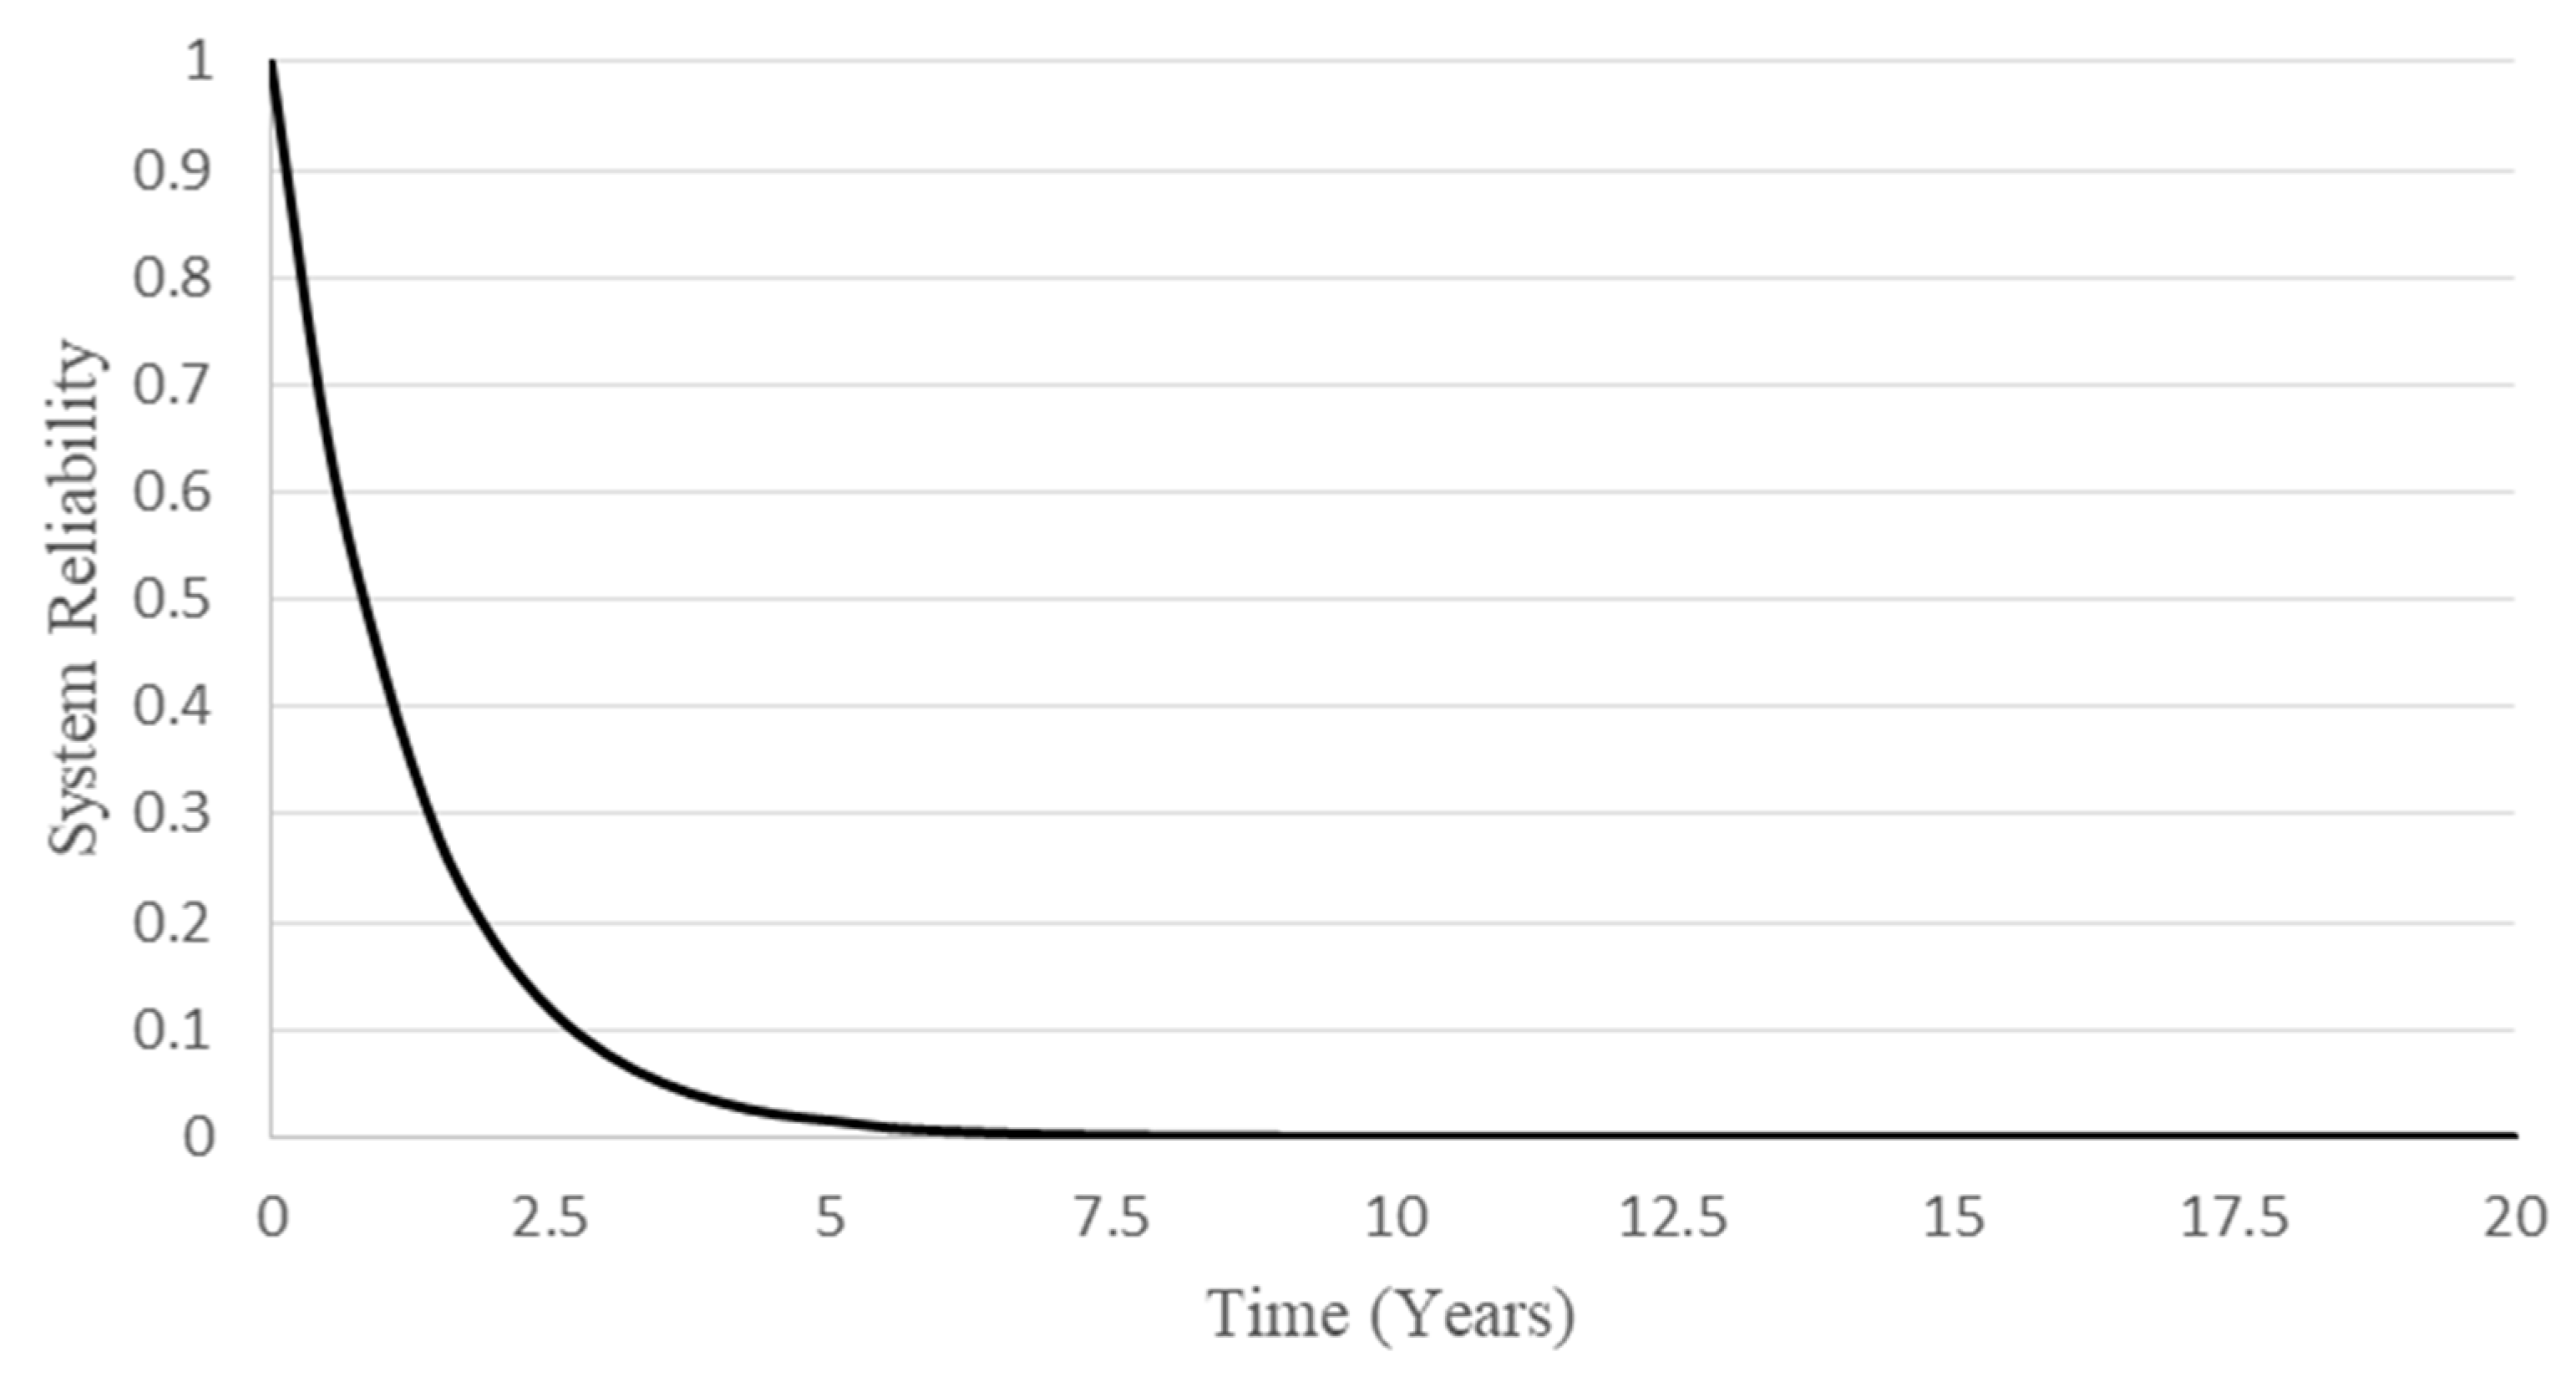
Figure 4 shows the total system reliability at different time periods (e.g., t = 0, 1, 5, 10, and 20 years) during the normal operating phase. During this phase, it is certain that the system is currently fully functional; therefore, the reliability equals 1 at time 0. Based on the system reliability plot, it is noticed that the reliability decreases dramatically with the highest slope between 0 and 2 years. Then, the slope (2–5 years) tends to be much smaller. After 5 years, as time increases, the system probability is very low and almost constant, which means that the probability that the system is functional after five years is close to the probability that the system is functional after ten and twenty years.
The reliability plot helps to determine the best schedule for preventive maintenance of the system, which will improve the system reliability. In this study, the unloading system reliability needs to be maintained above 90%, which means that the system components should be maintained every 45 days as shown in Figure 4. In the next section, the impact of critical component preventive maintenance on the whole system reliability will be investigated.
4.4. Reliability Enhancement
From the system reliability plot, the preventive maintenance schedule for the unloading system is specified in order to maintain the reliability of the system above a certain level. In the previous sections, the critical components of the systems were identified. Therefore, preventive maintenance of these critical items will have a huge impact on the total system reliability. In this study, preventive maintenance of the strainer, positive displacement pump, and positive displacement meter will be considered due to their design nature. Practically, rotating part failures are relatively easier to detect before they occur, compared to static part failures. For example, if there is a slight alignment deviation in the pump coupling it will remain functional for a small period of time before the breakdown. While, for static components like valves, the failures happen within seconds without prior signals. In addition, the strainer is considered as a critical component because of the cleaning process that should take place during the maintenance, which will improve the system reliability.
Figure 5 shows the system reliability when preventive maintenance for the critical components is conducted every 45 days. It is noted that preventive maintenance of the three critical components significantly enhances the reliability of the unloading system. In other words, the probability that any of these components are functional for the next one and a half months is constant throughout the lifecycle of these components.
Figure 5 shows the improvements reflected on the system reliability due to conducting preventive maintenance. It is clear that the preventive maintenance has a large impact on the total system reliability improvement.
The analysis shows that the reliability of the unloading system reached approximately zero after 5 years of continuous operation, while after conducting the preventive maintenance, system reliability significantly improved. In addition, the results indicated that implementing preventive maintenance improves the system reliability by 80% in the first year, and this ratio increases dramatically as the period increases.
5. Conclusions and Future Work
The truck unloading system is a complicated integration of components with different levels of reliability. This study assessed and evaluated the reliability of the truck unloading system, explored and identified the components that have the lowest reliability within the system. The mean time between failures, failure modes of each component, and reliability of the system are analyzed. In addition, this study established a preventive maintenance strategy for improving the reliability of the truck unloading systems. Since the current level of the reliability of the truck unloading system is not satisfactory, it can be greatly enhanced through focusing on a few critical components.
According to reliability analysis, the best schedule for preventive maintenance to maintain system reliability above 90% is 45 days. Moreover, the positive displacement pump and the positive displacement meter are the most critical items. Therefore, it is recommended to avail spare parts for these two components and conduct preventive maintenance on regular basis; preferably every one and a half months as found from the reliability analysis. In addition, it is highly recommended that the operators should report any unusual observations at the earliest to avoid any further damage or poor function. Furthermore, the results indicated that implementing preventive maintenance improves the system reliability by almost 80% in the first year, and this ratio increases radically as the period increases.
Furthermore, the replacement of the positive displacement meter with a more advanced Coriolis meter should be considered. Comparatively, it has a lower failure rate due to the lower number of internal components and the simpler mechanism of its operation. Second, filtration components such as a strainer should be periodically inspected and cleaned to avoid plugging. Third, although valves have medium failure rates, it is important to keep spare parts for the frequently failing parts such as seals. Finally, further studies are highly recommended for design improvement of the truck unloading system to enhance the system reliability and having a longer uninterrupted safe operation.
Author Contributions
Conceptualization, A.M. and M.A.-S.; methodology, A.M. and M.A.-S.; software, A.G.; validation, A.G. and K.A.-O.; formal analysis, A.M., M.A.-S. and A.G.; investigation, A.M.; resources, A.G.; data curation, M.A.-S.; writing—original draft preparation, M.A.-S.; writing—review and editing, A.G. and A.M.; supervision, K.A.-O.; project administration, K.A.-O. All authors have read and agreed to the published version of the manuscript.
Funding
This research received no external funding.
Acknowledgments
The authors would like to thank King Fahd University of Petroleum and Minerals for the support that contributed to carrying out this research. They also thank the anonymous reviewers for their insightful comments.
Conflicts of Interest
The authors declare no conflict of interest.
References
- Lee, D.; Pan, R. A nonparametric Bayesian network approach to assessing system reliability at early design stages. Reliab. Eng. Syst. Saf. 2018, 171, 57–66. [Google Scholar] [CrossRef]
- Yoon, J.-H.; Yang, I.-H.; Jeong, J.-E.; Park, S.-G.; Oh, J.-E. Reliability improvement of a sound quality index for a vehicle HVAC system using a regression and neural network model. Appl. Acoust. 2012, 73, 1099–1103. [Google Scholar] [CrossRef]
- Dalkilic, S. Improving aircraft safety and reliability by aircraft maintenance technician training. Eng. Fail. Anal. 2017, 82, 687–694. [Google Scholar] [CrossRef]
- Corvaro, F.; Giacchetta, G.; Marchetti, B.; Recanati, M. Reliability, Availability, Maintainability (RAM) study, on reciprocating compressors API 618. Petroleum 2017, 3, 266–272. [Google Scholar] [CrossRef]
- Catelani, M.; Ciani, L.; Venzi, M. Component Reliability Importance assessment on complex systems using Credible Improvement Potential. Microelectron. Reliab. 2016, 64, 113–119. [Google Scholar] [CrossRef]
- Wu, J.; Yan, S.; Li, J.; Gu, Y. Mechanism reliability of bistable compliant mechanisms considering degradation and uncertainties: Modeling and evaluation method. Appl. Math. Model. 2016, 40, 10377–10388. [Google Scholar] [CrossRef] [Green Version]
- Mi, J.; Li, Y.-F.; Yang, Y.-J.; Peng, W.; Huang, H.-Z. Reliability assessment of complex electromechanical systems under epistemic uncertainty. Reliab. Eng. Syst. Saf. 2016, 152, 1–15. [Google Scholar] [CrossRef]
- Kontrec, N.; Milovanović, G.V.; Panic, S.R.; Milošević, H. A Reliability-Based Approach to Nonrepairable Spare Part Forecasting in Aircraft Maintenance System. Math. Probl. Eng. 2015, 2015, 1–7. [Google Scholar] [CrossRef]
- Hou, W.; Jiang, Z.; Jin, Y. Reliability-Based Opportunistic Preventive Maintenance Model of Multi-units Serial-Parallel System. J. Shanghai Jiaotong Univ. 2009, 4, 658–662. [Google Scholar]
- Vishnu, C.; Regikumar, V. Reliability Based Maintenance Strategy Selection in Process Plants: A Case Study. Procedia Technol. 2016, 25, 1080–1087. [Google Scholar] [CrossRef] [Green Version]
- Tee, K.F.; Ekpiwhre, E. Reliability-based preventive maintenance strategies of road junction systems. Int. J. Qual. Reliab. Manag. 2019, 36, 752–781. [Google Scholar] [CrossRef]
- Yssaad, B.; Khiat, M.; Chaker, A. Reliability centered maintenance optimization for power distribution systems. Int. J. Electr. Power Energy Syst. 2014, 55, 108–115. [Google Scholar] [CrossRef]
- Li, L.; You, M.; Ni, J. Reliability-Based Dynamic Maintenance Threshold for Failure Prevention of Continuously Monitored Degrading Systems. J. Manuf. Sci. Eng. 2009, 131, 031010. [Google Scholar] [CrossRef]
- Quimpo, R.G.; Shamsi, U.M. Reliability-Based Distribution System Maintenance. J. Water Resour. Plan. Manag. 1991, 117, 321–339. [Google Scholar] [CrossRef]
- Stein, H. PDS Data Handbook, 2010th ed.; SINTEF: Trondheim, Norway, 2010; Available online: https://www.sintef.no/globalassets/project/pds/presentations/pds_data_handbook_2010_edition-selected_pages.pdf (accessed on 1 September 2020).
- OREDA Participants. Offshore Reliability Data Handbook; DNV: Trondheim, Norway, 2002. [Google Scholar]
- Sun, Y.; Ma, L.; Morris, J. A practical approach for reliability prediction of pipeline systems. Eur. J. Oper. Res. 2009, 198, 210–214. [Google Scholar] [CrossRef]
- Rimkevičius, S.; Kaliatka, A.; Valinčius, M.; Dundulis, G.; Janulionis, R.; Grybenas, A.; Zutautaite, I. Development of approach for reliability assessment of pipeline network systems. Appl. Energy 2012, 94, 22–33. [Google Scholar] [CrossRef]
- Shalay, V.; Zemenkova, M.; Zemenkov, Y.; Toropov, S. Modeling Parameters of Reliability of Technological Processes of Hydrocarbon Pipeline Transportation. In MATEC Web of Conferences; EDP Science: Les Ulis, France, 2016; Volume 73, p. 01029. [Google Scholar]
- Kong, J.S.; Frangopol, D.M. Life-Cycle Reliability-Based Maintenance Cost Optimization of Deteriorating Structures with Emphasis on Bridges. J. Struct. Eng. 2003, 129, 818–828. [Google Scholar] [CrossRef]
- Wu, F.; Niknam, S.A.; Kobza, J.E. A cost effective degradation-based maintenance strategy under imperfect repair. Reliab. Eng. Syst. Saf. 2015, 144, 234–243. [Google Scholar] [CrossRef]
- Barata, J.M.; Soares, C.G.; Marseguerra, M.; Zio, E. Simulation modelling of repairable multi-component deteriorating systems for ‘on condition’ maintenance optimisation. Reliab. Eng. Syst. Saf. 2002, 76, 255–264. [Google Scholar] [CrossRef]
- Tong, J.; Mao, D.; Xue, D.A. genetic algorithm solution for a nuclear power plant risk-cost maintenance model. Nucl. Eng. Des. 2004, 229, 81–89. [Google Scholar]
- Rao, A.N.; Bhadury, B. Opportunistic maintenance of multi-equipment system: A case study. Qual. Reliab. Eng. Int. 2000, 16, 487–500. [Google Scholar] [CrossRef]
- Zhang, C.; Gao, W.; Guo, S.; Li, Y.; Yang, T. Opportunistic maintenance for wind turbines considering imperfect, reliability-based maintenance. Renew. Energy 2017, 103, 606–612. [Google Scholar] [CrossRef]
- Xie, L.; Rui, X.; Li, S.; Hu, X. Maintenance Optimization of Offshore Wind Turbines Based on an Opportunistic Maintenance Strategy. Energies 2019, 12, 2650. [Google Scholar] [CrossRef] [Green Version]
- Arunraj, N.; Maiti, J. Risk-based maintenance policy selection using AHP and goal programming. Saf. Sci. 2010, 48, 238–247. [Google Scholar] [CrossRef]
- Zhao, F.; Wang, W.; Peng, R. Delay-time-based preventive maintenance modelling for a production plant: A case study in a steel mill. J. Oper. Res. Soc. 2015, 66, 2015–2024. [Google Scholar] [CrossRef]
- Li, G.; Li, Y.; Zhang, X.; Hou, C.; He, J.; Xu, B.; Chen, J. Development of a Preventive Maintenance Strategy for an Automatic Production Line Based on Group Maintenance Method. Appl. Sci. 2018, 8, 1781. [Google Scholar] [CrossRef] [Green Version]
- Hadidi, L.A.; Alkhaldi, A.F. Reliability improvement for electrical pneumatic arm loading system. In Proceedings of the 2016 IEEE International Conference on Industrial Engineering and Engineering Management (IEEM), Bali, Indonesia, 4–7 December 2016; IEEE: Piscataway, NJ, USA, 2016. [Google Scholar]
- Reis, A.N.; Neto, A.R.P.; Rolim, G.A. Simulation of Tank Truck Loading Operations in a Fuel Distribution Terminal. Int. J. Simul. Model. 2017, 16, 435–447. [Google Scholar] [CrossRef]
- Jamshidi, R.; Esfahani, M.M.S. Reliability-based maintenance and job scheduling for identical parallel machines. Int. J. Prod. Res. 2014, 53, 1216–1227. [Google Scholar] [CrossRef]
- Navarro, I.J.; Martí, J.V.; Yepes, V. Reliability-based maintenance optimization of corrosion preventive designs under a life cycle perspective. Environ. Impact Assess. Rev. 2019, 74, 23–34. [Google Scholar] [CrossRef]
Figure 1.
Unloading system piping and instrumentation diagram.

Figure 2.
Unloading system reliability block diagram.

Figure 3.
Mean time between failures of unloading system components.

Figure 4.
Unloading system reliability.

Figure 5.
Unloading system reliability before and after preventive maintenance.


Table 1.
Device characteristics.
| Features | Low pressure drop—less than 3.2 psi at extended maximum flow | |
| Relatively low initial cost and minimum maintenance | ||
| High accuracy | ||
| Accuracy | Repeatability | Less than or equal to ±0.02%. |
| Linearity | ±0.15% over the normal flow range | |
| ±0.25% over the extended flow range | ||
| Stability | Better than ±0.05% per 10 million gallons (38 million liters). | |
| Range | Normal Range | 17 m3/h–170 m3/h |
| Extended Range | 10 m3/h–204 m3/h | |
Table 2.
Unloading system components list.
| Component | Symbol |
|---|---|
| Unloading Arms | UA |
| Ball Valves | BV |
| Strainers | ST |
| Differential Pressure Transmitter | DPT |
| Positive Displacement Pump | PDP |
| Check Valve | CV |
| Air Eliminator | AE |
| Level Switch | LS |
| Gate Valves | GV |
| Pressure Relief Valve | PRV |
| Positive Displacement Flow Meter | FM |
| Pressure Transmitter | PT |
| Plug Valve | PV |
| Flow Control Valve | FCV |
Table 3.
Unloading system component test details and results.
| Component | Units Tested | Number of Failures | Duration (hours) | λ (1/hours) | MTTF (hours) |
|---|---|---|---|---|---|
| UA | 14 | 1 | 25,920 | 2.75573 × 10⁻⁶ | 362,880 |
| BV | 316 | 328 | 9,324,700 | 1.11315 × 10⁻⁷ | 8,983,552 |
| PDP | 7 | 3 | 25,920 | 1.65344 × 10⁻⁵ | 60,480 |
| CV | 14 | 2 | 25,920 | 5.51146 × 10⁻⁶ | 181,440 |
| GV | 177 | 240 | 3,852,300 | 3.5198 × 10⁻⁷ | 2,841,071 |
| PZV | 278 | 272 | 7,169,800 | 1.36464 × 10⁻⁷ | 7,327,957 |
| FM | 7 | 4 | 25,920 | 2.20459 × 10⁻⁵ | 45,360 |
| PV | 7 | 1 | 25,920 | 5.51146 × 10⁻⁶ | 181,440 |
| FCV | 316 | 328 | 9,324,700 | 1.11315 × 10⁻⁷ | 8,983,552 |
| DPT | 55 | 4 | 1,467,500 | 4.95586 × 10⁻⁸ | 20,178,125 |
| LS | 76 | 37 | 1,862,400 | 2.61406 × 10⁻⁷ | 3,825,470 |
| PT | 55 | 4 | 1,467,500 | 4.95586 × 10⁻⁸ | 20,178,125 |
| AE | 50 | 174 | 3,725,900 | 9.34003 × 10⁻⁷ | 1,070,661 |
| ST | 14 | 8 | 25,920 | 2.20459 × 10⁻⁵ | 45,360 |
Table 4.
Unloading system component failure modes.
| Component | Failure Mode |
|---|---|
| Unloading Arms | Rupture & Leak |
| Ball Valve | Leakage in closed position |
| Internal leakage | |
| External leakage | |
| Low output | |
| Structural deficiency | |
| Positive Displacement Pump | Vibration |
| Parameter deviation | |
| Fail to start on demand | |
| Check Valve | External leakage |
| Opposite direction flow | |
| Gate Valve | Internal leakage |
| External leakage | |
| Pressure Relief Valve | External leakage |
| Fail to close on demand | |
| Fail to open on demand | |
| Spurious operation | |
| Valve leakage in closed position | |
| Delayed operation | |
| Positive Displacement Flow Meter | Parameter deviation |
| Low output | |
| Vibration | |
| Plug Valve | External & Internal leakage |
| Flow Control Valve | Leakage in closed position |
| Internal leakage | |
| External leakage | |
| Low output | |
| Structural deficiency | |
| Differential Pressure Transmitter | Leakage |
| Level Switch | High output |
| Low output | |
| Erratic output | |
| Fail to function on demand | |
| Spurious operation | |
| Pressure Transmitter | Leakage |
| Air Eliminator—Separator | Parameter deviation |
| Plugged/Choked | |
| Structural deficiency | |
| Strainer | External leakage |
| Plugging |
Table 5.
Unloading system component reliability for different durations.
| Component | Relation | Reliability (1 Year) | Reliability (5 Years) | Reliability (10 Years) | Reliability (20 Years) |
|---|---|---|---|---|---|
| Unloading Arm—1 | Parallel | 0.976471687 | 0.887765525 | 0.788127628 | 0.621145158 |
| Unloading Arm—2 | Parallel | 0.976471687 | 0.887765525 | 0.788127628 | 0.621145158 |
| Ball Valve—1 | Parallel | 0.999038705 | 0.995202756 | 0.990428525 | 0.980948663 |
| Ball Valve—2 | Parallel | 0.999038705 | 0.995202756 | 0.990428525 | 0.980948663 |
| Stream—1 | Parallel | 0.975533009 | 0.883506697 | 0.780584084 | 0.609311512 |
| Stream—2 | Parallel | 0.975533009 | 0.883506697 | 0.780584084 | 0.609311512 |
| Streams 1 & 2 Combined | Series | 0.999401366 | 0.98642931 | 0.951856656 | 0.847362505 |
| Ball Valve—3 | Series | 0.999038705 | 0.995202756 | 0.990428525 | 0.980948663 |
| Positive Displacement Pump | Series | 0.8668779 | 0.48954166 | 0.239651036 | 0.057432619 |
| Check Valve—1 | Series | 0.953496955 | 0.788127628 | 0.621145158 | 0.385821307 |
| Gate Valve—1 | Series | 0.996963513 | 0.984909488 | 0.9700467 | 0.940990601 |
| Gate Valve—2 | Series | 0.996963513 | 0.984909488 | 0.9700467 | 0.940990601 |
| Pressure Relief Valve—1 | Series | 0.998821649 | 0.994122112 | 0.988278773 | 0.976694934 |
| Pressure Relief Valve—2 | Series | 0.998821649 | 0.994122112 | 0.988278773 | 0.976694934 |
| Positive Displacement Flow Meter | Series | 0.826565438 | 0.385821307 | 0.148858081 | 0.022158728 |
| Plug Valve | Series | 0.953496955 | 0.788127628 | 0.621145158 | 0.385821307 |
| Flow Control Valve | Series | 0.999038705 | 0.995202756 | 0.990428525 | 0.980948663 |
| Differential Pressure Transmitter—1 | Series | 0.999571905 | 0.997861358 | 0.995727289 | 0.991472835 |
| Differential Pressure Transmitter—2 | Series | 0.999571905 | 0.997861358 | 0.995727289 | 0.991472835 |
| Level Switch | Series | 0.997744003 | 0.988770794 | 0.977667684 | 0.95583410 |
| Pressure Transmitter | Series | 0.999571905 | 0.997861358 | 0.995727289 | 0.991472835 |
| Air Eliminator—Separator | Series | 0.991962691 | 0.96045427 | 0.922472404 | 0.850955336 |
| Strainer—1 | Series | 0.826565438 | 0.385821307 | 0.148858081 | 0.022158728 |
| Strainer—2 | Series | 0.826565438 | 0.385821307 | 0.148858081 | 0.022158728 |
© 2020 by the authors. Licensee MDPI, Basel, Switzerland. This article is an open access article distributed under the terms and conditions of the Creative Commons Attribution (CC BY) license (http://creativecommons.org/licenses/by/4.0/).
Share and Cite
MDPI and ACS Style
Mohammed, A.; Ghaithan, A.; Al-Saleh, M.; Al-Ofi, K. Reliability-Based Preventive Maintenance Strategy of Truck Unloading Systems. Appl. Sci. 2020, 10, 6957. https://0-doi-org.brum.beds.ac.uk/10.3390/app10196957
AMA Style
Mohammed A, Ghaithan A, Al-Saleh M, Al-Ofi K. Reliability-Based Preventive Maintenance Strategy of Truck Unloading Systems. Applied Sciences. 2020; 10(19):6957. https://0-doi-org.brum.beds.ac.uk/10.3390/app10196957
Chicago/Turabian StyleMohammed, Awsan, Ahmed Ghaithan, Mashel Al-Saleh, and Khalaf Al-Ofi. 2020. "Reliability-Based Preventive Maintenance Strategy of Truck Unloading Systems" Applied Sciences 10, no. 19: 6957. https://0-doi-org.brum.beds.ac.uk/10.3390/app10196957
Note that from the first issue of 2016, this journal uses article numbers instead of page numbers. See further details here.