1. Introduction
In recent years, the Internet of Things (IoT) has evolved as one of the leading technologies which generate a massive amount of data stored in distributed data sources. IoT devices transfer the generated data to big data systems located in distributed data centers for further analysis. Organizations and users can perform all kinds of processing and analysis on the basis of massive IoT data, thus adding to their value [
1].
Big data processing and big data applications are shifting the computing paradigms, computing concepts, and treatment of data [
2]. Big data analytics (BDA) refers to the strategy of analyzing large volumes of data, or big data. These big data are gathered from a wide variety of sources, including social networks, videos, digital images, sales transaction records, end-user activities, environmental monitoring, sensors (IoT devices), among others. IoT data exhibit four main characteristics, such as large-scale streaming data, heterogeneity, time and space correlation, and high noise data [
3]. With the use of BDA, a variety of these IoT data are examined to reveal trends, unseen patterns, hidden correlations, and new information. BDA in IoT is helping business associations, and other organizations, to achieve a better understanding of data and efficient decision-making [
4].
The big data concept is represented by describing its categorization through the three-V model extended to five Vs. (volume, velocity, variety, veracity, and value), with an emphasis on different data generation sources such as IoT devices [
5].
The IoT decision-making process uses the BDA results, and the time to get those results becomes a crucial factor in making quick decisions. Therefore, scientists designed and developed BDA to process and analyze large datasets from data centers in the shortest possible time.
BDA running jobs in data centers require computing capabilities such as CPU time, storage capacity, RAM, among others, to be able to fulfill their data processing and analysis objective. When working with a large amount of data and running out of resources, they can scale horizontally by adding more computational power from distributed data centers.
The MapReduce [
6] programming paradigm is one of the most representative BDA. MapReduce provides horizontal scaling to petabytes of data on thousands of compute nodes, a simplified programming model, and a high degree of reliability when failed nodes occur [
7]. In MapReduce, the input data are divided into many parts. Each part is then sent to compute nodes that can be located in distributed data centers and finally aggregated according to a specified function. When MapReduce jobs require transferring data between compute nodes located in distributed data centers, the communication network is a factor that can affect the application completion time. Representative BDA running across distributed data centers are:
Intensive computation. Concentrate on data processing and minor communication or fewer data transfers between compute nodes. We consider them a best-effort application.
Intensive communication. Need to be in constant communication with compute nodes or at some point will require transferring large volumes of data to compute nodes located in geographically distributed data centers. In this case, the data transfer process is crucial for completion time. We consider them a time-sensitive application.
BDA classified as intensive communication are required to have an efficient communication system to be able to complete jobs in the shortest amount of time. Under this scheme, the network architecture used to interconnect data centers becomes critical, and it can impact application performance. In a BDA system, the application scheduler submits jobs to compute nodes that meet their computational requirements without considering adverse network conditions in end-to-end paths unless the network administrator manually configures a QoS policy or specifies a network path per application. In the host-to-host communication among distributed data centers, to provide QoS, it is essential to consider four network parameters such as available bandwidth, end-to-end delay, packet loss rate, and jitter according to application requirements.
Software-defined networks (SDN) provide a mechanism to allow scientific applications dynamically request network services or parameters such as available bandwidth, QoS policies, security, among others [
8]. These scientific applications can be classified as intensive communication. SDN can address the programmability problem allowing for scientific applications to program local or inter-domain networks at run-time to meet their requirements [
9]. This process is considered an SDN advantage compared to traditional network services. SDNs are gradually spreading to large-scale (such as data centers) and complex networks (multi-agency collaborative networks) [
10].
The millions of data generated from IoT devices will suppose, in the short term, the most massive flow of information and will be the largest provider for BDA. Given the amount of information that needs to be processed to make quick decisions, BDA needs to use computing and storage resources available in distributed data centers connected with state-of-the-art communication networks. As a result, IoT demands more advanced computing, storage, and communication network solutions to handle BDA distributed workloads.
We designed QoSComm, and it is defined as an SDN strategy to allocate QoS-based data flows for BDA running jobs across distributed data centers to minimize their completion time. QoSComm implements a QoS-based data flow allocation algorithm for data flow forwarding using a multi-objective optimization method, considering the four most essential networks parameters: available bandwidth, delay, jitter, and packet loss. In addition, QoSComm includes a communication process to dynamically configure feasible paths through the SDN controller for each data center. BDA classified as intensive communication is the target domain of QoSComm.
Figure 1 shows the BDA and QoSComm general view.
The rest of the article is organized as follows: related work is presented in
Section 2.
Section 3 introduces our strategy called QoSComm, its design, and implementation.
Section 4 describes the simulation model and the experimental setup.
Section 5 presents the performance tests and the discussion of the results.
Section 6 presents the conclusions and future directions.
2. Related Work
In this section, we explore the use of SDN for Big Data Analytics and describe the research works that have ventured to improve the application performance considering SDN parameters. These research works use the SDN parameters in the application job scheduling process between SDN-based distributed data centers.
For the aim of this research, we identified BDA with MPI (Message Passing Interface) and MapReduce. MPI is a library of routines for inter-process communication and is widely used in distributed systems [
11]. Apache Hadoop MapReduce is a programming model for processing large data sets based on the division and conquest method. It has a distributed file system on each node of the cluster (HDFS). MapReduce consists of two main phases: Map and Reduce, and are linked by an internal phase
Shuffle and Sort [
12]. We consider such applications as time-sensitive.
Greedy Shortest Binomial Tree (GSBT) [
13] is an algorithm that aims to minimize the number of hops for the longest path in the reduction tree. When MPI applications initiate their execution, GSBT sends the IP and MAC address of each process to the SDN controller. The SDN controller is responsible for finding the shortest path between a pair of hosts and installs the input flow rules in all the OpenFlow switches. Their results showed that, for MPI messages size larger than 22 KB, GSBT affected the application performance. For messages smaller than 22 KB, this algorithm improved application performance.
In Bandwidth and Latency Aware Routing (BLAR) [
14], authors performed an SDN routing scheme according to the application requirements, using two network parameters: bandwidth and latency. If the application requests specific bandwidth or latency, the SDN controller set data flow rules in OpenFlow switches to forwarding data to routes that meet application bandwidth or latency requirements. For some cases, authors demonstrated that the paths that meet some of these parameters improved the application completion time instead of only using the shortest route default routing method. Results showed some cases where application performance was affected in its completion time.
In BASS (Bandwidth-Aware Scheduling with SDN) [
15], the authors performed a task scheduler that uses the SDN to get information about bandwidth parameter for MapReduce jobs running in Hadoop clusters. Its objective is to use the SDN to manage the bandwidth and then BASS assigns the tasks locally or remotely in geographically distributed Hadoop clusters. BASS verifies the network bandwidth of the SDN controller and classifies it as a parameter to use in a Hadoop scheduling process. Results showed that BASS can improve the completion time of a MapReduce job running among distributed clusters if bandwidth conditions are met according to application requirements.
In ASETS (A SDN Empowered Task Scheduling System) [
16], the authors use an algorithm called SETSA (SDN-Empowered Task Scheduler Algorithm) that is based on the SDN capabilities to schedule tasks on the virtual machine that is available to maximize the use of the bandwidth. This algorithm focuses on HPC as a Service architecture (HPCaaS). The SETSA algorithm, which is used by ASETS, uses the bandwidth of the computational cloud to more efficiently increase the performance of the HPCaaS architecture related to the response time of the jobs submitted to the cloud.
In CLS (Cross-Layer scheduling) [
17], this proposal includes the application-level job scheduler interacting with the SDN scheduler which is responsible for assigning network links. The objective of this work is to allocate the tasks and a selection of links that can achieve high performance for the application. The application-level scheduler uses bandwidth information from the SDN controller scheduler and distributes the tasks on the servers. The results indicated an improvement in the performance of Hadoop and Storm applications.
BWARE (Bandwidth-Aware) [
18] authors improve the backup task scheduling policy for Hadoop clusters running in an SDN network. It uses SDN bandwidth parameter to get real network bandwidth from the input data source node and the execution destination node. This network parameter is used for data transfer in the backup tasks process from the source node to the implementation node. Results showed that BWARE can improve the time elapsed for the backup tasks process when considering the SDN bandwidth parameter.
As a summary of the reviewed proposals, GSBT [
13] gets available routes in the SDN and calculates the shortest path for use in the reduction tree for MPI communications process without considering traffic congestion, delay, and packet loss that can exist in some routes. BASS [
15], ASETS [
16], CLS [
17], and BWARE [
18] consider the network bandwidth parameter in their application job scheduling process. In BLAR [
14], the bandwidth and latency parameters were considered in their MPI job scheduling process for path selection to compute nodes, and achieved an improvement in application performance. The results of some of the research works showed that there were cases where the performance was affected [
13,
14], and this could be due to several network conditions that were not considered in data flow allocation process, such as available bandwidth, point to point delay, packet loss, and jitter. Therefore, the opportunity in these research works would be to consider these network parameters to provide QoS in the flow allocation process to improve application performance.
Regarding QoS in SDN, we identified proposals considering three main aspects: architecture, path selection algorithm, and if the proposal works within a single domain or among several domains. Examples of these proposals are OpenQoS [
19] and VSDN [
20], where, in addition to consulting the distance of the nodes, in some cases, they also consider the delay among them. The focus of the most QoS proposals is forwarding data flows to control bandwidth allocation and improve multimedia transmissions (video streaming) and even VoIP [
21,
22,
23], but none of them consider other applications such as Big Data, so it is not clear under which circumstances these proposals can benefit BDA performance. In CECT, Ref. [
24] proposed a scheme to minimize network congestion and reallocate network resources according to applications’ requirements. Their algorithm was designed for a software-defined cloud data center, where the dynamic data flow reallocation of some services such as virtual machine motion needs special QoS guarantees that can generate overhead in the reallocation process. CECT uses a genetic algorithm to calculate the routes, also considering only available bandwidth as a constraint, in addition to using a single controller within the software-defined data center. In AmoebaNet [
9], authors proposed a service to apply SDN providing QoS-guaranteed network services in LAN (Local Area Network) or campus networks for Big Data science, using WAN (Wide Area Network) path reservation systems such as ESNet (Energy Science Network) OSCARS (On-Demand Secure Circuits and Advance Reservation System) and I2 (Internet 2) specialized networks. In addition, it uses a Dijkstra shortest path variant algorithm to compute an end-to-end network path, using only a bandwidth parameter as a constraint and considering a single SDN controller for communication between the different domains.
Proposals analyzed describe experiments considering QoS within a single domain and one controller for the SDN, except in AmoebaNet [
9], but it is only used in specialized networks. None of the works considered a QoS proposal under an architecture where BDA jobs are running between two or more distributed data centers, or considering the four most essential networks parameters to provide QoS, as QoSComm does.
Considering the research works described above, our proposal QoSComm differs from them, mainly in its architecture. It does not consider any modification to the SDN controller, and it is not necessary to add a module to the SDN controller. To resolve the problem of path selection, QoSComm uses a multi-objective algorithm, which was designed considering four fundamental parameters in communication networks mentioned in the previous section. In addition, QoSComm can establish communication with one or more SDN controllers and process path selection within a single domain or between two or more domains (distributed data centers), which is the primary goal of our strategy.
Table 1 shows the main features of the revised QoS proposals and QoSComm.
The BDA scheduler sends a request to QoSComm to get and set the optimal paths according to application network requirements. Once QoSComm gets and configures these paths in both data centers, the application scheduler submits the job to compute nodes in the distributed data centers and meet network requirements, as it is illustrated in
Figure 1.
Our main objective is to minimize application job completion time, considering the four parameters required by the application to provide network QoS in the data flow allocation process to transfer data flows among geographically distributed data centers. With this in mind, QoSComm considers BDA network requirements and meets QoS parameters, then selects and configures the path with the minimum end-to-end delay between two distributed compute nodes for time-sensitive applications.
3. QoS Comm: Design and Implementation
In this section, we present QoSComm, a strategy to allocate QoS-based data flows for BDA running among SDN-based distributed data centers. QoSComm’s main objective is to compute, configure, and allocate data flow rules in OF (OpenFlow) switches for QoS network paths across distributed data centers to improve applications’ job completion time.
The QoSComm design consists of two main processes, as illustrated in
Figure 2:
Compute QoS network paths according to a constraint-based multi-objective decision algorithm. Gets the optimal paths with the minimal point-to-point delay, which complies with applications requirements considering four network parameters: available bandwidth, delay, packet loss rate, and jitter.
Configure QoS optimal paths via SDN controller to OFS (OpenFlow Switch). Communicate to SDN controller to set a data flow rule on each OFS on the network (at the input and output port level). The SDN controller installs the data flow rule on each of the OFS, specified in the communication with the REST API (Representational State Transfer Application Program Interface). The REST API allows the dynamic configuration of data flow rules in the OFS using HTTP requests to a RestFul Web Service provided by the SDN Controller to get, post, put, and delete data.
We use QoSComm to get and configure the optimal network paths to compute nodes among the SDN-enabled data centers. This process is performed just before the BDA scheduler submits jobs to compute nodes.
3.1. Path Selection
Problem Formalization
In a typical communication network topology, there is
n number of paths for a transmission from the same source and destination (end-to-end path) [
25]; this is represented in Equation (
1):
where:
s = Source node,
d = Destination node,
P = Set of paths from source node s to destination node d,
p = End-to-end path, ,
l = Network links for each node in the end-to-end path
Each path has different network parameters’ values. These network parameters serve as metrics to get path network conditions. The metrics that are considered for applications that require intensive use of the communications network are delay
, jitter
, packet loss
, and transmission speed
; with these parameters, we can provide network QoS. In addition, the cost or distance metric of the link
is considered; these network conditions for each path are represented in Equation (
2):
The default routing algorithm selects network paths taking into account the cost or distance between network nodes, which are the metrics used by the SDN controller to select the shortest route (
). It is represented in Equation (
3) as the minimum cost value among the
n possible paths:
The traditional routing algorithm does not consider the additional parameters that provide network conditions. For some applications, the set of these parameters should be considered in the path selection process to improve network performance instead of just considering the shortest path (default method). The path with better network conditions (
) is the path with best metric values among all paths as represented in Equation (
4):
The shortest path in Equation (
3) is not always the path with the best metrics in one or more network parameters. We identified a path with better metrics conditions with a
symbol. It must have the minimum value of each of the corresponding end-to-end parameters such as delay, jitter, and packet loss among the
n paths, represented in Equations (
5)–(
7), except the bandwidth, which we defined as the maximum available bandwidth among the
n paths, and is represented in Equation (
8).
The QoS parameters such as delay and jitter have an additive metric composition rule for the end-to-end path. For the bandwidth parameter, it has a concave metric composition where the end-to-end paths
were selected considering the minimum capacity bandwidth of the network links
that rules the maximum bandwidth for the corresponding
. For the scope of our research, we used these criteria for end-to-end path calculation based on QoS constraints:
where:
The network provides the connection service to the set of applications clients, where each application has its network requirements to ensure optimal performance. This set of applications is represented in Equation (
9), and their requirements in Equation (
10):
where:
In Equations (
11)–(
13), each metric has a maximum tolerable limit required by the application. In Equation (
14), the application requires a minimum bandwidth limit rate. Each network parameter must comply with applications requirements:
Considering the set of network parameters for each application requirement, as described in Equations (
11)–(
14), in order to resolve the multi-objective problem, we used the epsilon-constraint (
-constraint) method [
26] for path selection and data flow forwarding. We define the following objective function, represented in Equations (
15)–(
17):
The goal of the exact epsilon-constraint method is to minimize one objective and to restrict the rest of the objectives to a value of
. Equations (
18) and (
19), represents the general function:
In our scenario, as it considers an inter-domain data flow forwarding approach that will be used only by the applications that require QoS, the epsilon-restricted multi-objective method was used to get the set of feasible paths, considering application requirements as objectives’ restrictions [
27,
28]. We propose to use the delay parameter as the most important objective subjecting it to the restrictions of the other objectives (end-to-end jitter, packet loss and available bandwidth). From the set of feasible paths, we minimize the delay to get the optimal path when packet loss, jitter, and available bandwidth are less than or equal to require by the application, as is represented in Equations (
20) and (
21):
In our model, before submitting a job to compute nodes, in that instant time, QoSComm gets network parameters querying to the SDN controller of each data center and the mathematical process calculates the feasible paths, according to application requirements. In the case of not finding a feasible path, QoSComm requires the SDN controller to forward the data flow using its default method. This process is shown in
Figure 2.
Once QoSComm calculated the feasible paths and obtained the optimal path, its communication process configures and allocates data flow rules in the network switches for the QoS-based optimal path before BDA scheduler dispatch job to compute nodes in distributed data centers. Both operations, practically, do not delay application job submission process to compute nodes.
3.2. Communication Process for QoS-Based Feasible Paths
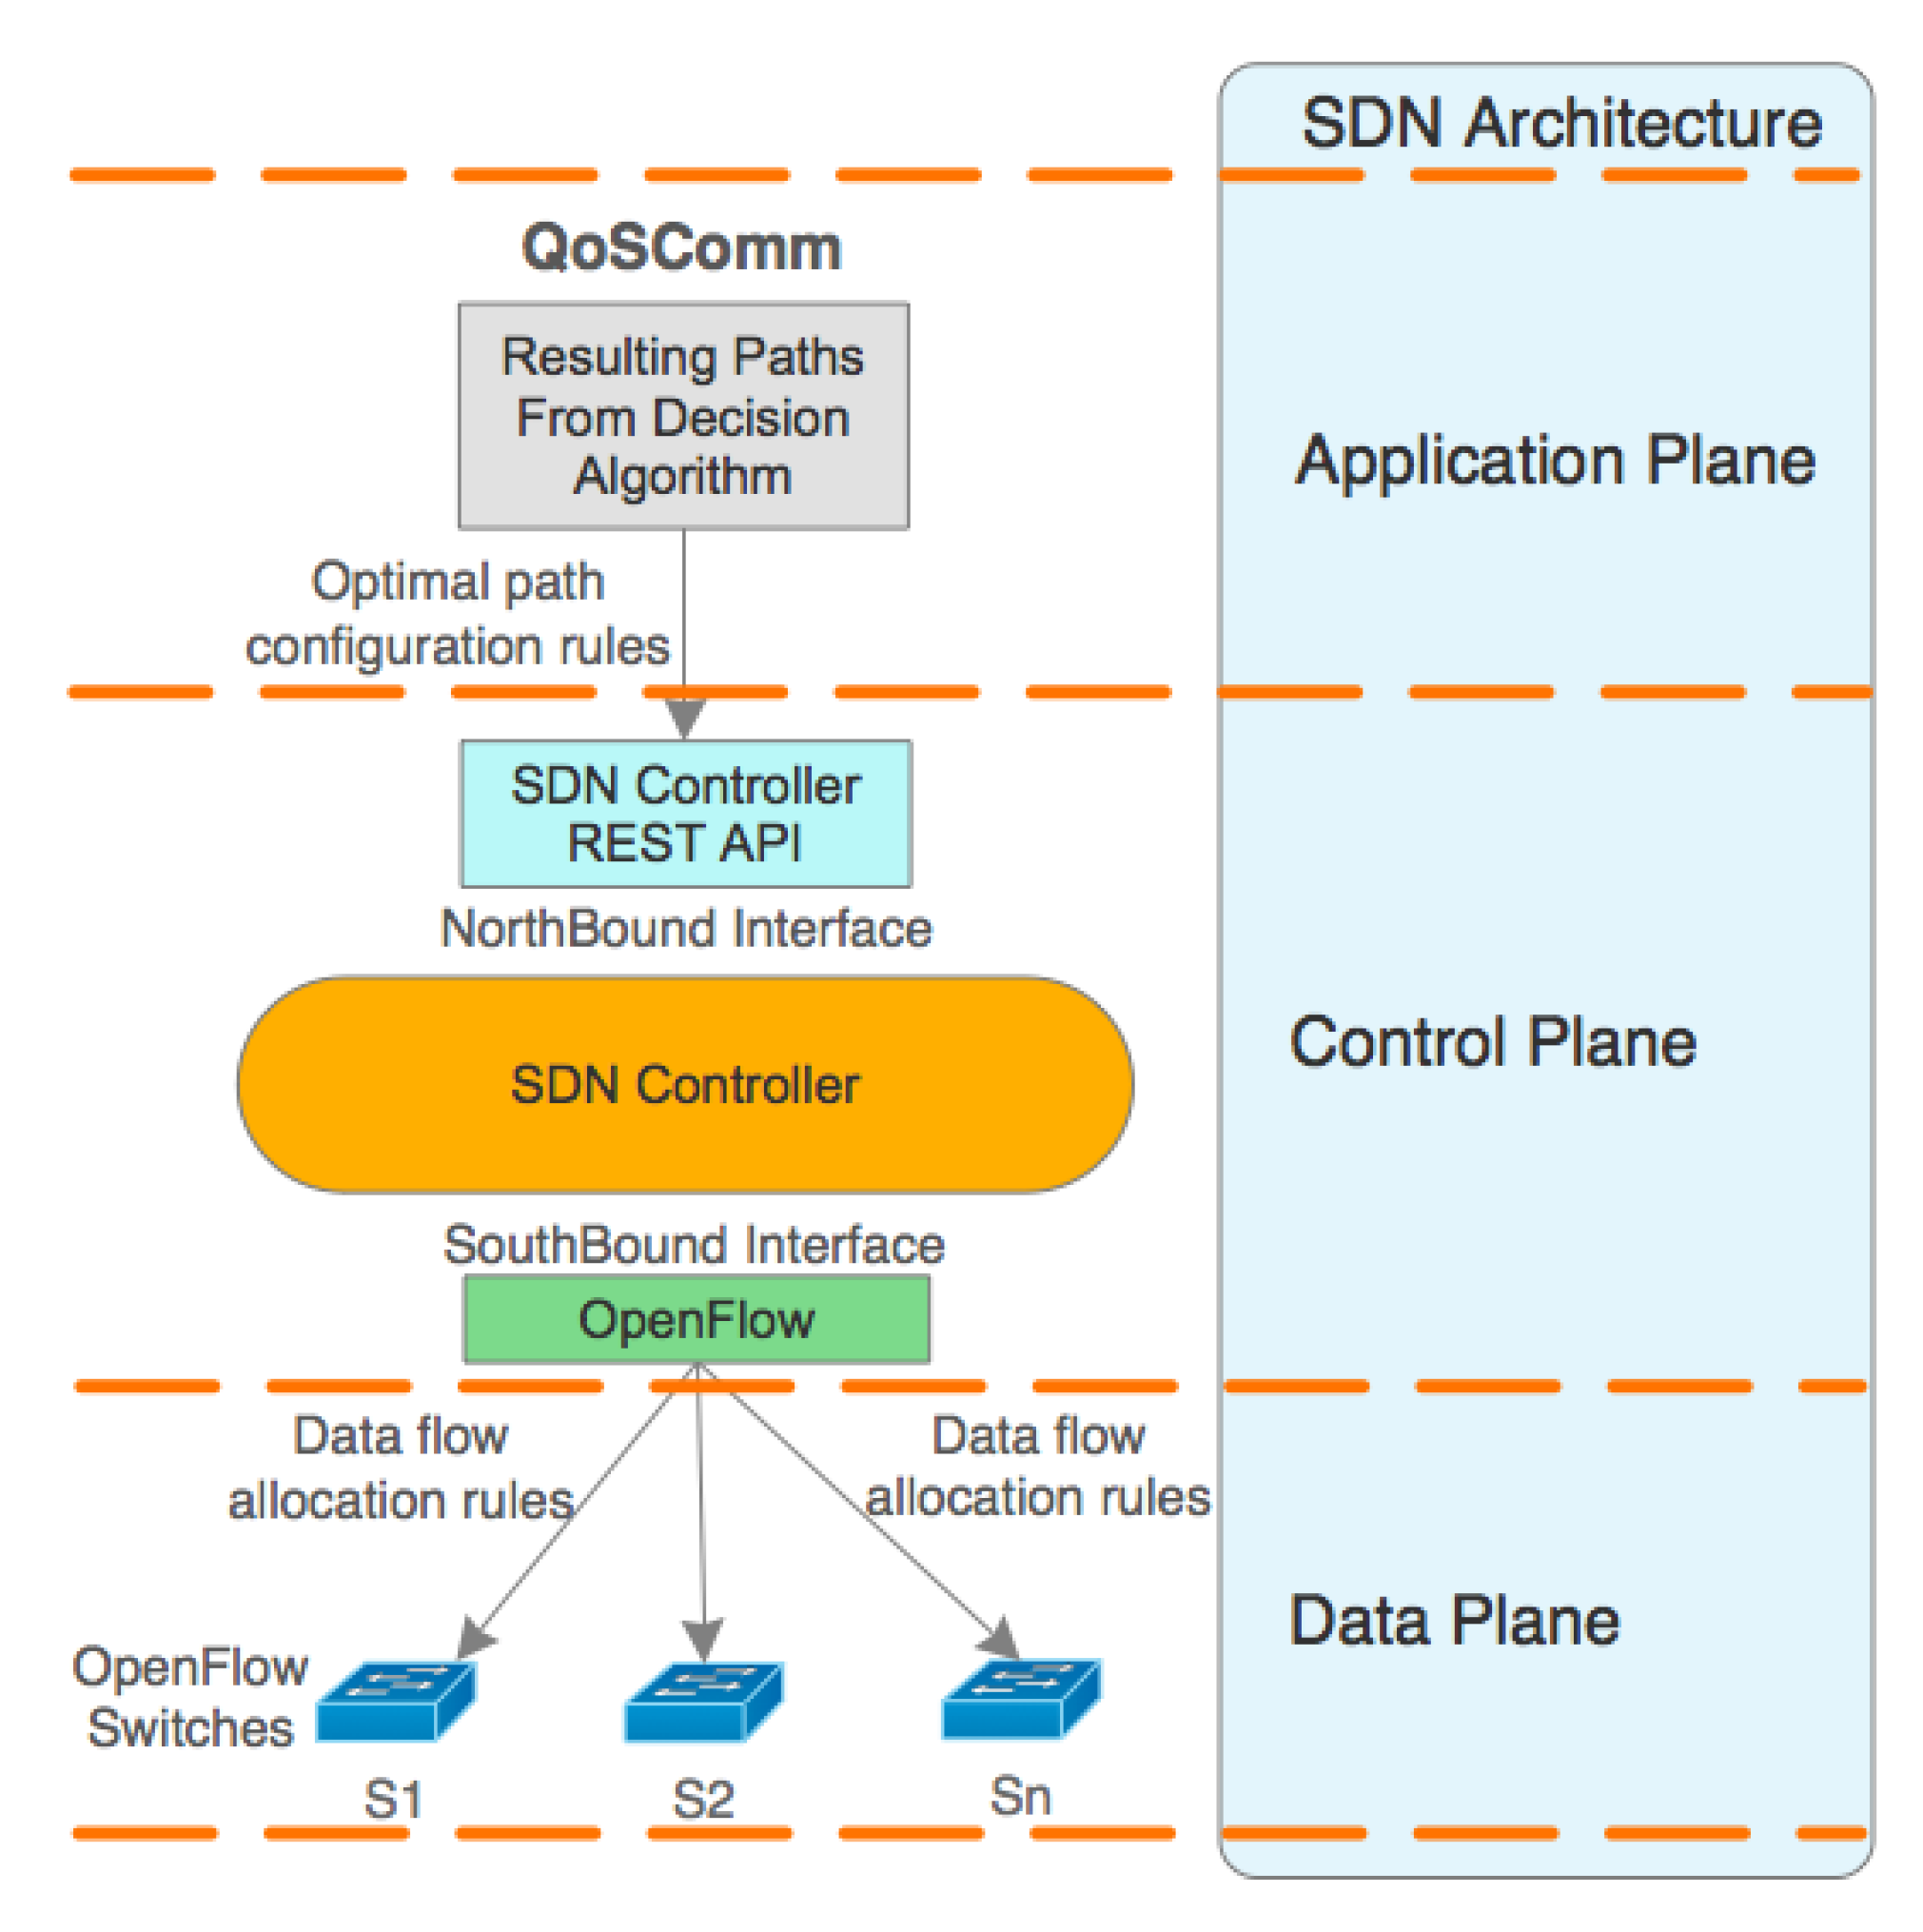
In SDN general architecture [
29], the SDN controller resides in a control plane. To obtain centralized and optimal network flow management and configuration, SDN controllers have to maintain a global view of the network topology graph [
30]. The SDN controller has two interfaces: The NorthBound Interface (NBI) that is used to communicate with the application plane, and the SouthBound Interface (SBI) which is used to communicate with the data plane, in our case, using the OpenFlow (OF) protocol [
31].
QoSComm resides in the application plane, and according to the SDN architecture, it communicates to the SDN controller through the NBI. We developed a process to communicate to the NBI using the REST API provided by the SDN network controller.
The communication process primary function is to configure the optimal path from the decision algorithm described in the previous section, through the REST API provided by the SDN controller as is represented in
Figure 3.
Once QoSComm gets the optimal path, then it configures the data flow rules containing the path required for data transfer with higher priority than controller forwarding method. Each data flow rule is allocated and configured in the OF switches through the SDN controller. Once the data flow rule is configured in each of the OF switches, these types of dynamic rules take priority in the data flow forwarding process, and in case of not finding a matching rule, the controller is responsible for setting the path for each data flow. Once the application data transfer process is complete, QoSComm removes the data flow rule on each of the OF switches.
To configure data flow rules in OF switches, we allocated a matching rule specifying the Internet Protocol (IP) address for source and destination hosts and the IP protocol number (6 for TCP and 17 for UDP data flows). We also specified an action to be executed by the OFS, indicating the switch port number to be used to output data flow, and set a higher priority for this rule, as is shown in
Table 2.
QoSComm communication process can establish a connection with one or more domain network controllers and perform the data flow rules allocation and configuration on each domain switches according to particular application requirements. Furthermore, QoSComm can perform a new calculation for path selection, maintaining QoS parameters required by the applications. In the case of obtaining a new optimal path, QoSComm dynamically changes the data flow allocation, configuring new rules in OF switches with a higher priority than the previous rule. When the OF switches detect flow rules with match information, they use the one with a higher priority for data flow output.
Our proposal QoSComm provides the dynamic configuration of data flow rules in the SDN-based distributed data centers according to each BDA’s network QoS requirements.
The following section describes the simulation model and experimental setup considering application data transfer among compute nodes located in distributed data centers.
5. Performance Evaluation
We evaluated the data flow transfer performance among two hosts. In the first phase, we used two applications to test network performance. IPERF and D-ITG were used to generate TCP and UDP traffic between two hosts since its behavior would be similar to a BDA transferring data between hosts. D-ITG was used to generate simultaneous data flow transfers between two hosts, as well as packet size variation for each transfer, simulating applications behavior transferring data flows over the Internet. In the second phase, we configured an MPI cluster in a Mininet simulator to test MPI application performance. We used an MPI application to transfer messages between two nodes and measured the job completion time. In both test phases, we compared controller default and QoSComm data flow forwarding methods. For both phases, application network QoS requirements for end-to-end paths were: bandwidth ≥ 85 mbps, delay ≤ 30 ms, PLR ≤ 0.008 and jitter ≤ 10 ms.
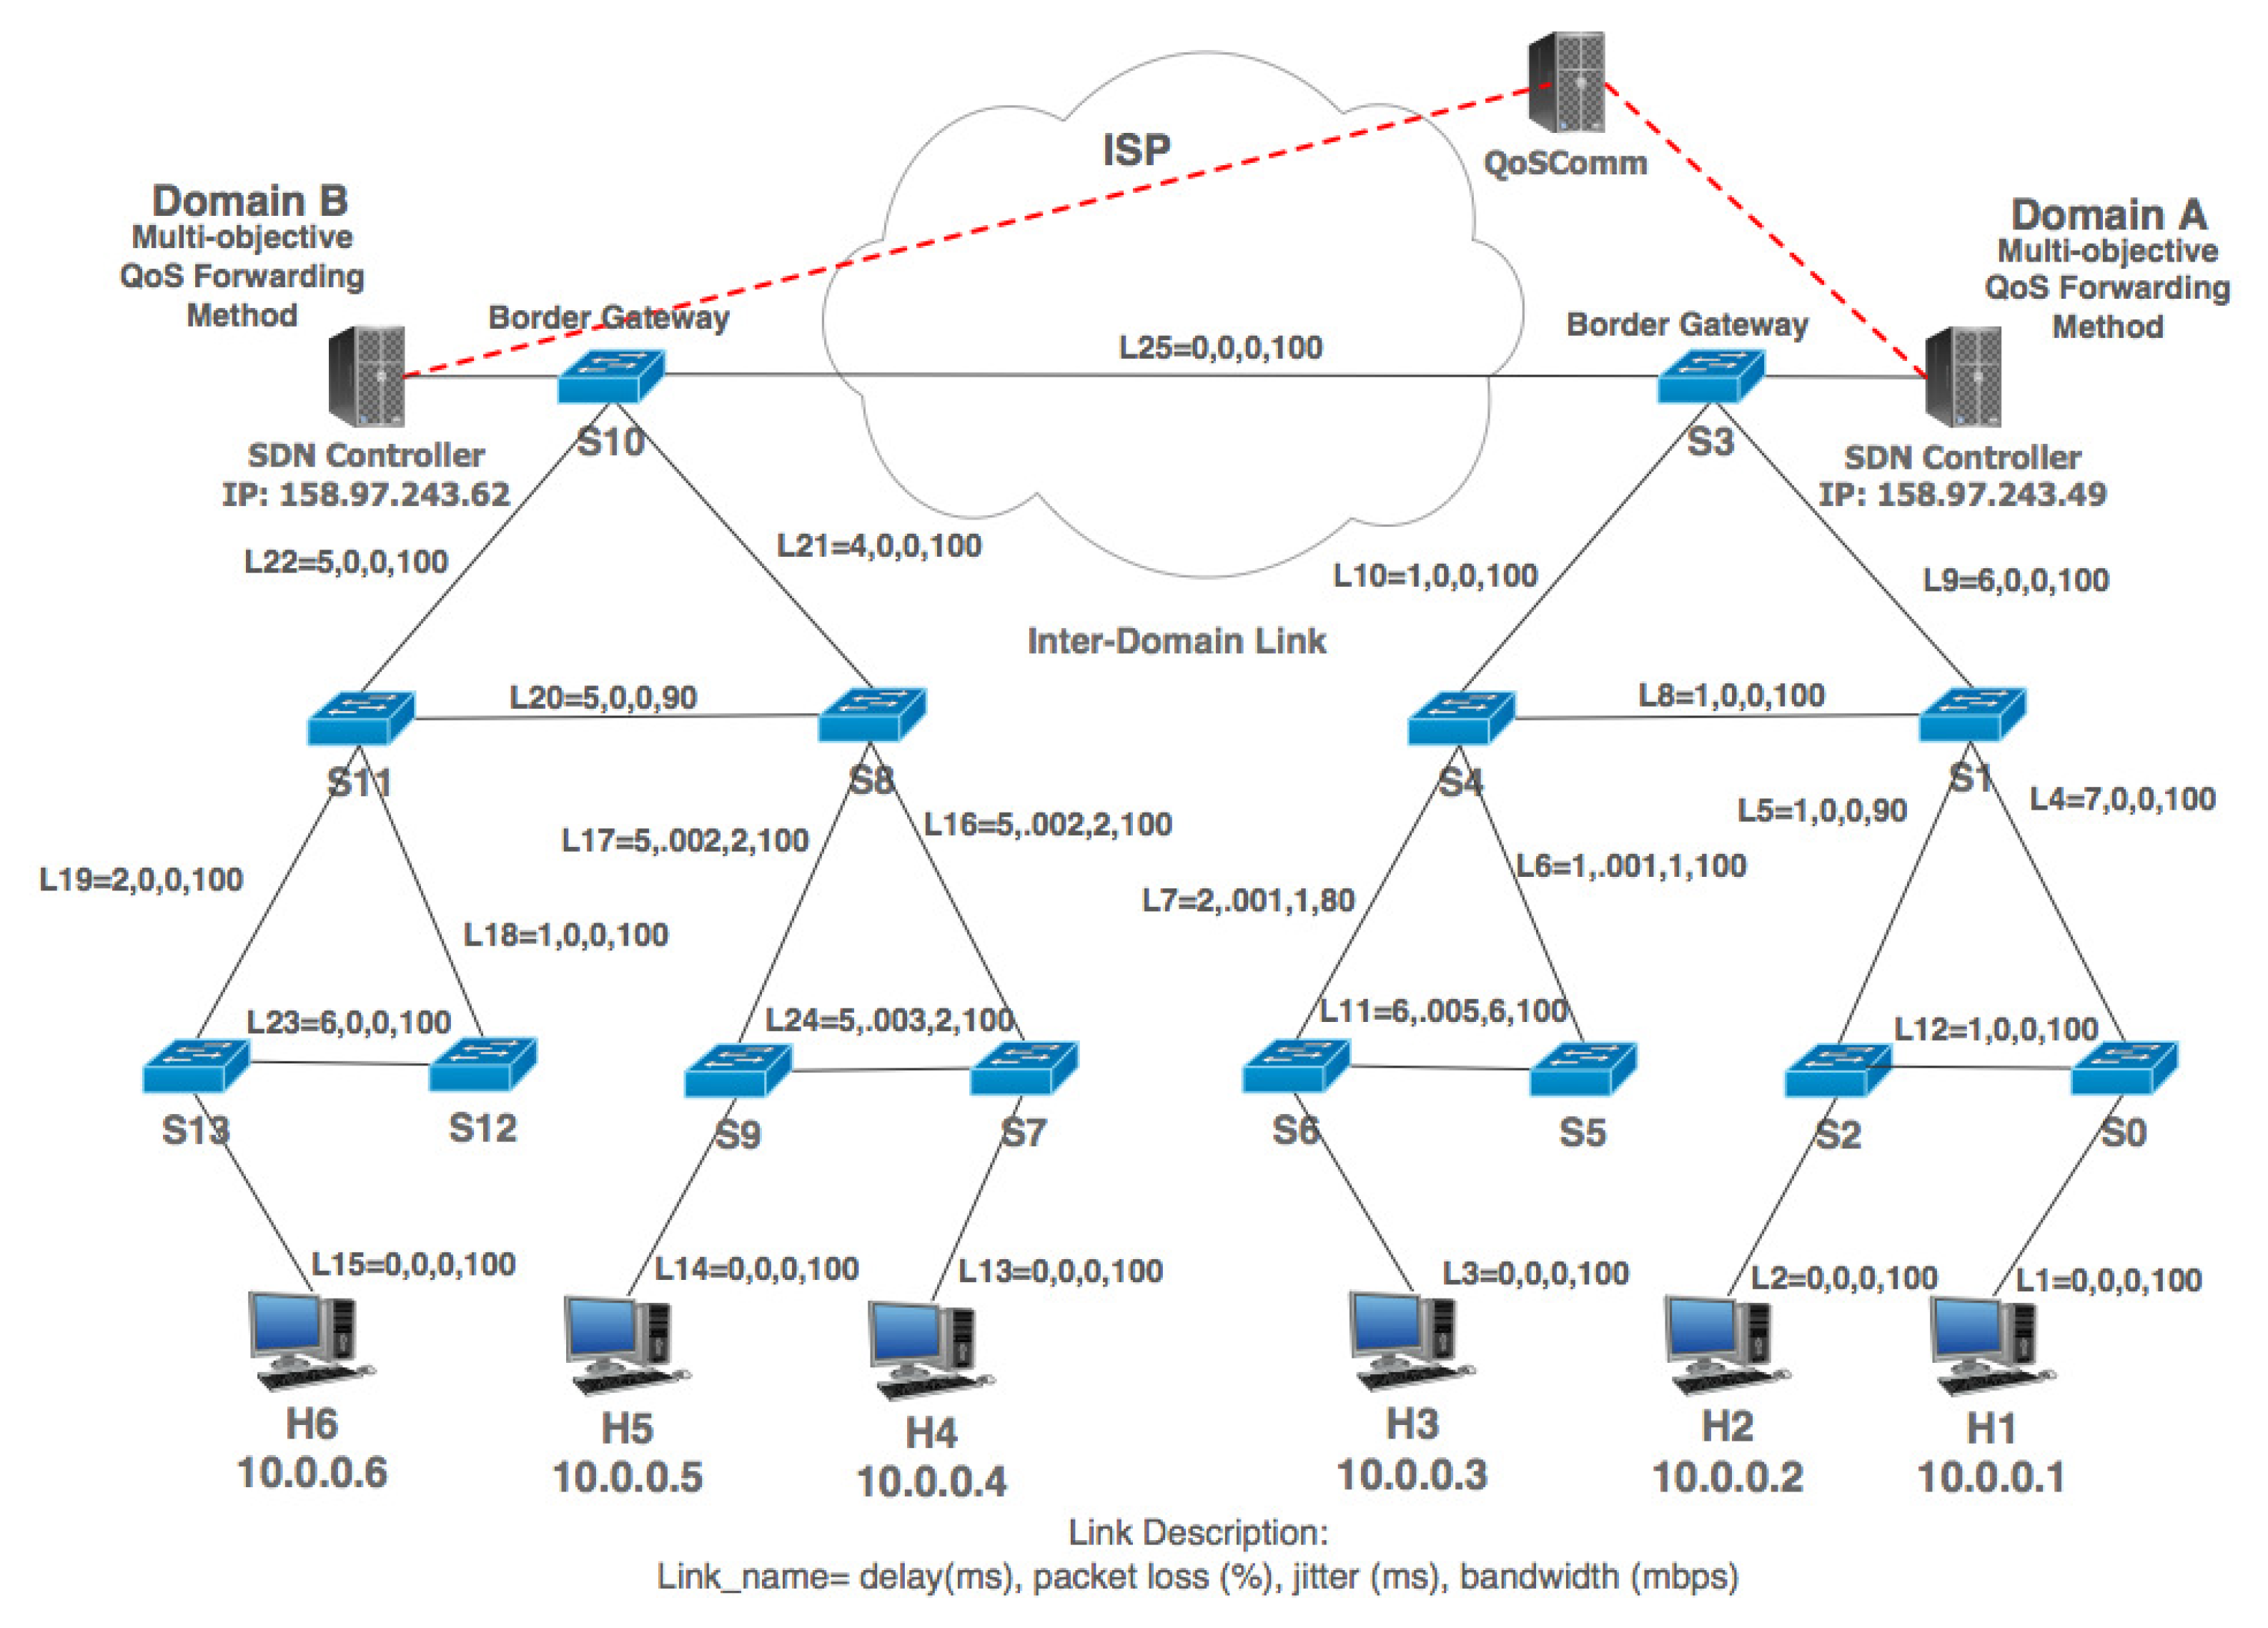
In H1 to H6 tests, the controller used Path 2 (S0, S1, S3, S10, S11, S13) and QoSComm selected Path 14 (S0, S2, S1, S3, S10, S11, S13) referred in
Table 3. For H2 to H5 tests, Controller used Path 9 (S2, S1, S3, S10, S8, S9) and QoSComm selected Path 13 (S2, S1, S4, S3, S10, S8, S9) referred in
Table 4. For H3 to H4 tests, Controller used Path 16 (S6, S4, S3, S10, S8, S7) and QoSComm selected Path 8 (S6, S5, S4, S3, S10, S8, S7) referred to in
Table 5. Controller and QoSComm host-to-host selected paths have different network metrics. QoSComm calculated and configured selected paths considering application network QoS requirements.
5.1. Phase One: Network Performance
5.1.1. IPERF
We used IPERF to test network performance between hosts H1 to H6, H2 to H5, and H3 to H4, applying Controller default and QoSComm data flow forwarding methods in the simulation model. IPERF was configured with default values and set time interval to 30 s for each data transfer. The IPERF server was running in H6, H5, and H4 hosts and the client in H1, H2, and H3 hosts. We repeated the experiment 20 times for UDP and TCP data flows.
Figure 5 and
Figure 6 show IPERF UDP and TCP average results in two sets: individually (i) and simultaneously (s) tests. As it is observed in
Figure 5, only in H1 to H6 individual tests was Controller data transfer rate higher than QoSComm, and this is because Controller had a higher bandwidth capacity path (100 mbps) compared to QoSComm selected path (90 mbps). For network stress testing running host-to-host simultaneously transfers, QoSComm obtained a higher data transfer rate compared to Controller improving application data transfer performance.
5.1.2. D-ITG
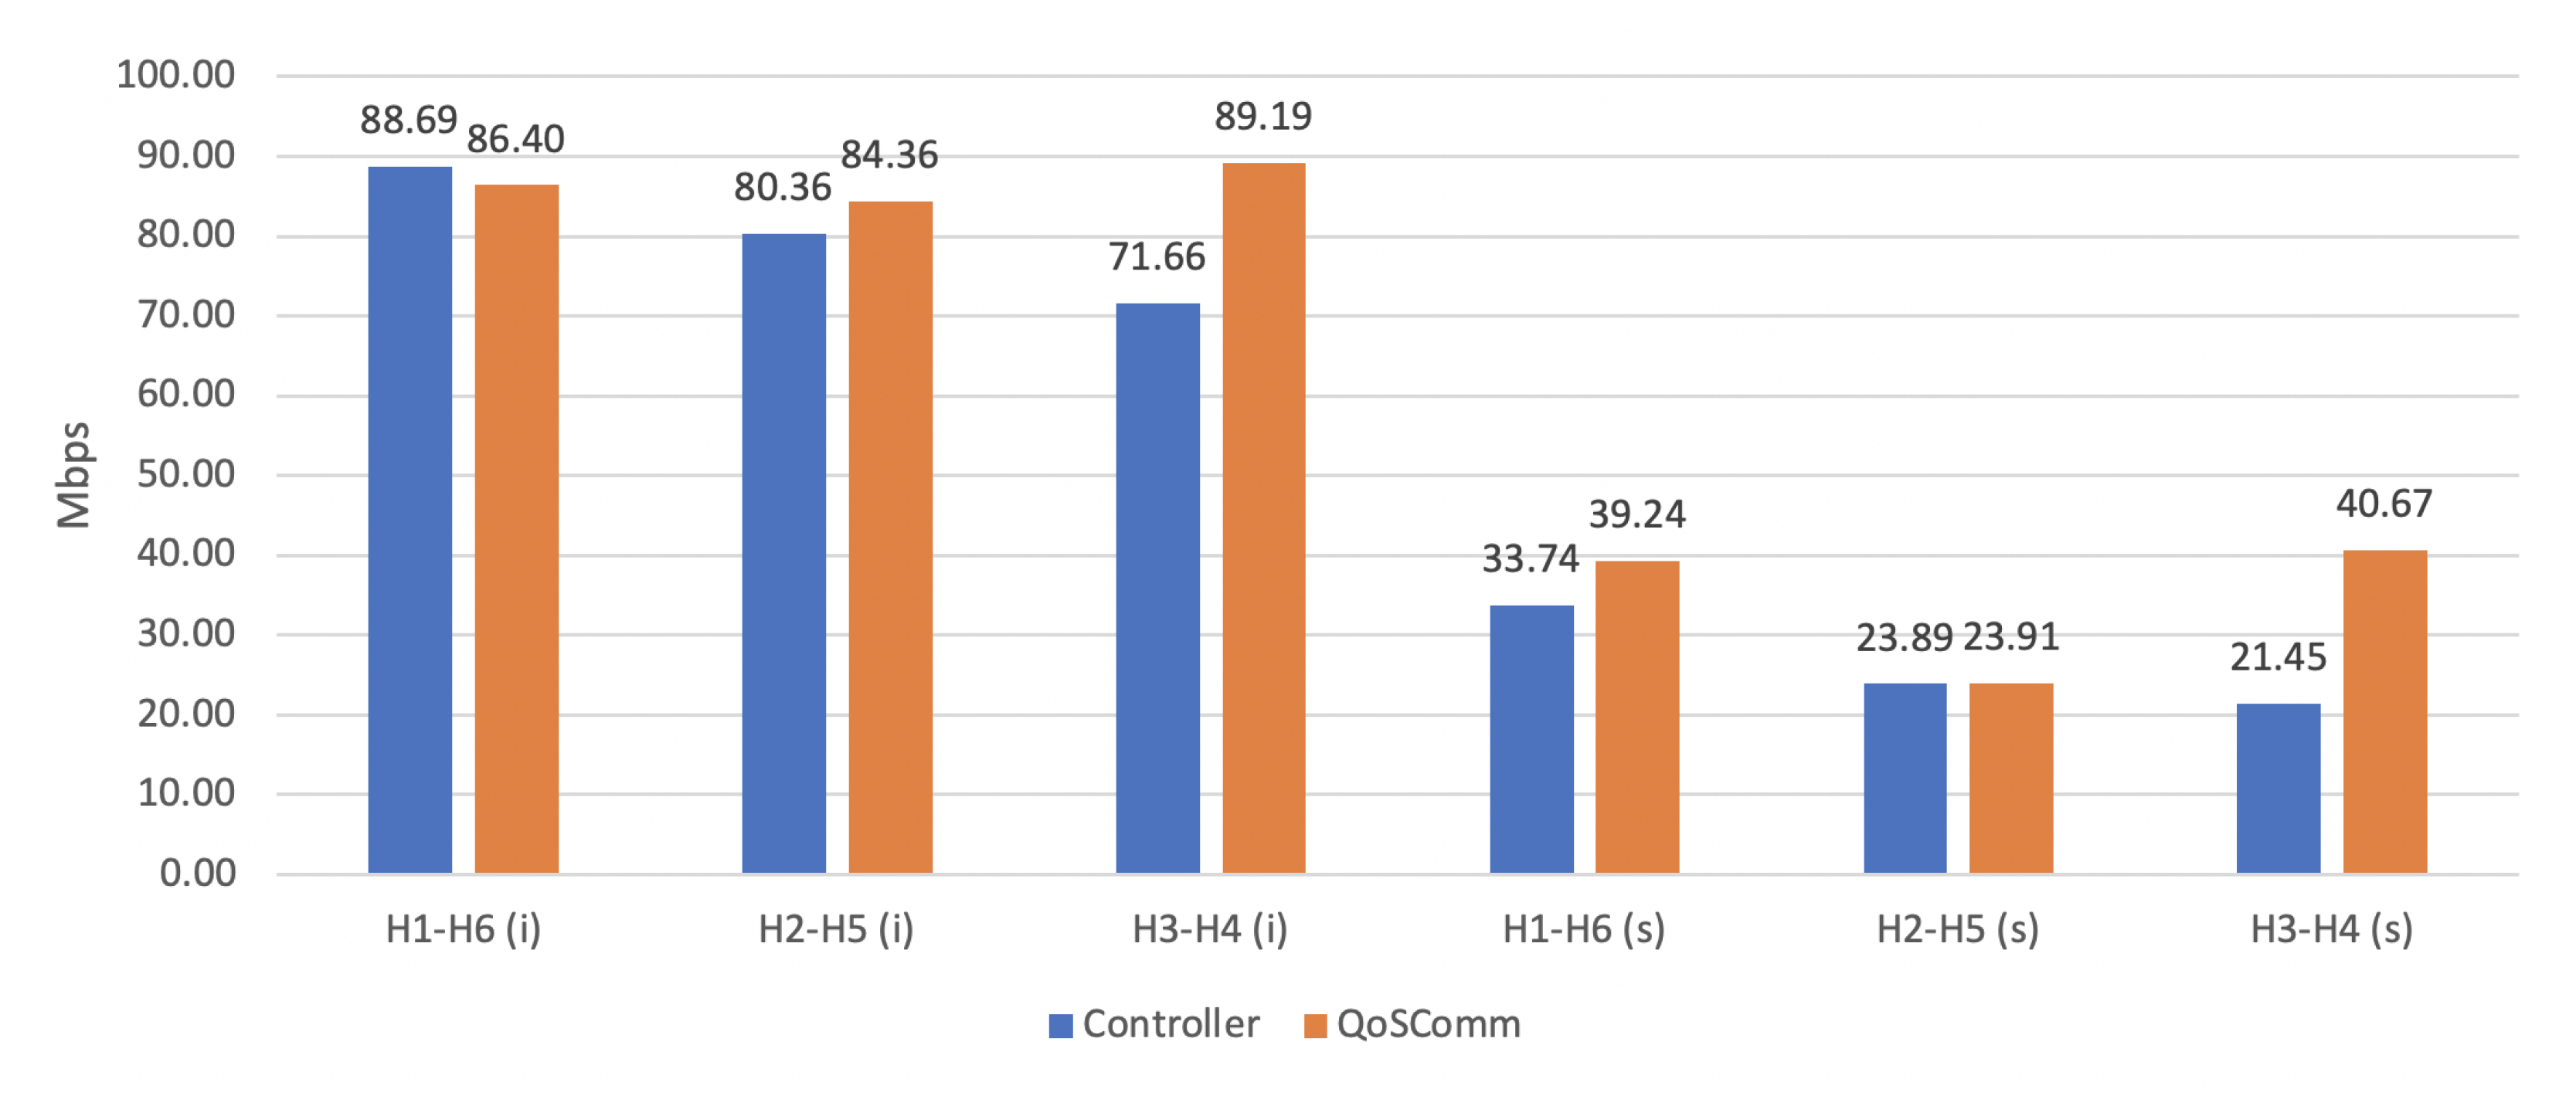
D-ITG was used to send three simultaneous data flows between hosts H1 to H6, H2 to H5 and H3 to H4 applying Controller default and QoSComm data flow forwarding methods in the simulation model. We created a script to generate three processes to transfer simultaneous data flows with different constant packet rate (pps-C) and with 512 as constant payload size-c. In H6, H5, and H4 hosts, we launched a D-ITG Receive server. H1, H2, and H3 hosts were used to send data flows to corresponding receive server. We transferred the UDP data flows from H1 to H6, H2 to H5, and H3 to H4 hosts for 30 s.
Figure 7 shows D-ITG transfer average results which are the sum of mbps transferred by the three processes for each test case. We performed two sets: individually (i) and simultaneously (s) tests.
In most of the cases, it is observed that QoSComm network path selection obtained around 2–4% of a higher data transfer rate than Controller default path selection. Only in H1 to H6 individual tests did results shows less than 1% of difference between Controller and QoSComm. For network stress testing running host-to-host simultaneously transfers, QoSComm also obtained a higher data transfer rate compared to Controller default path selection. Using QoSComm, we improved the application data transfer performance.
5.2. Phase Two: Application Performance
MPI Application Tests
We configured an MPI Cluster with MPICH [
37] in a Mininet virtual machine. We use an MPI application for bandwidth tests transferring messages between compute nodes. The MPI application provides point-to-point communication for a given number of MPI tasks and uses TCP as a transport protocol. The test goal is to measure completion time running tasks between H1 and H6 nodes using Controller default and QoSComm data flow forwarding methods.
The MPI application works as follows: We execute the MPI application creating two tasks, one for each host. Each task sends and receives 1,000,000 bytes between H1 and H6 hosts 40 times and then finishes the data transfer process. We executed the MPI application 20 times for each forwarding method and measured job completion time.
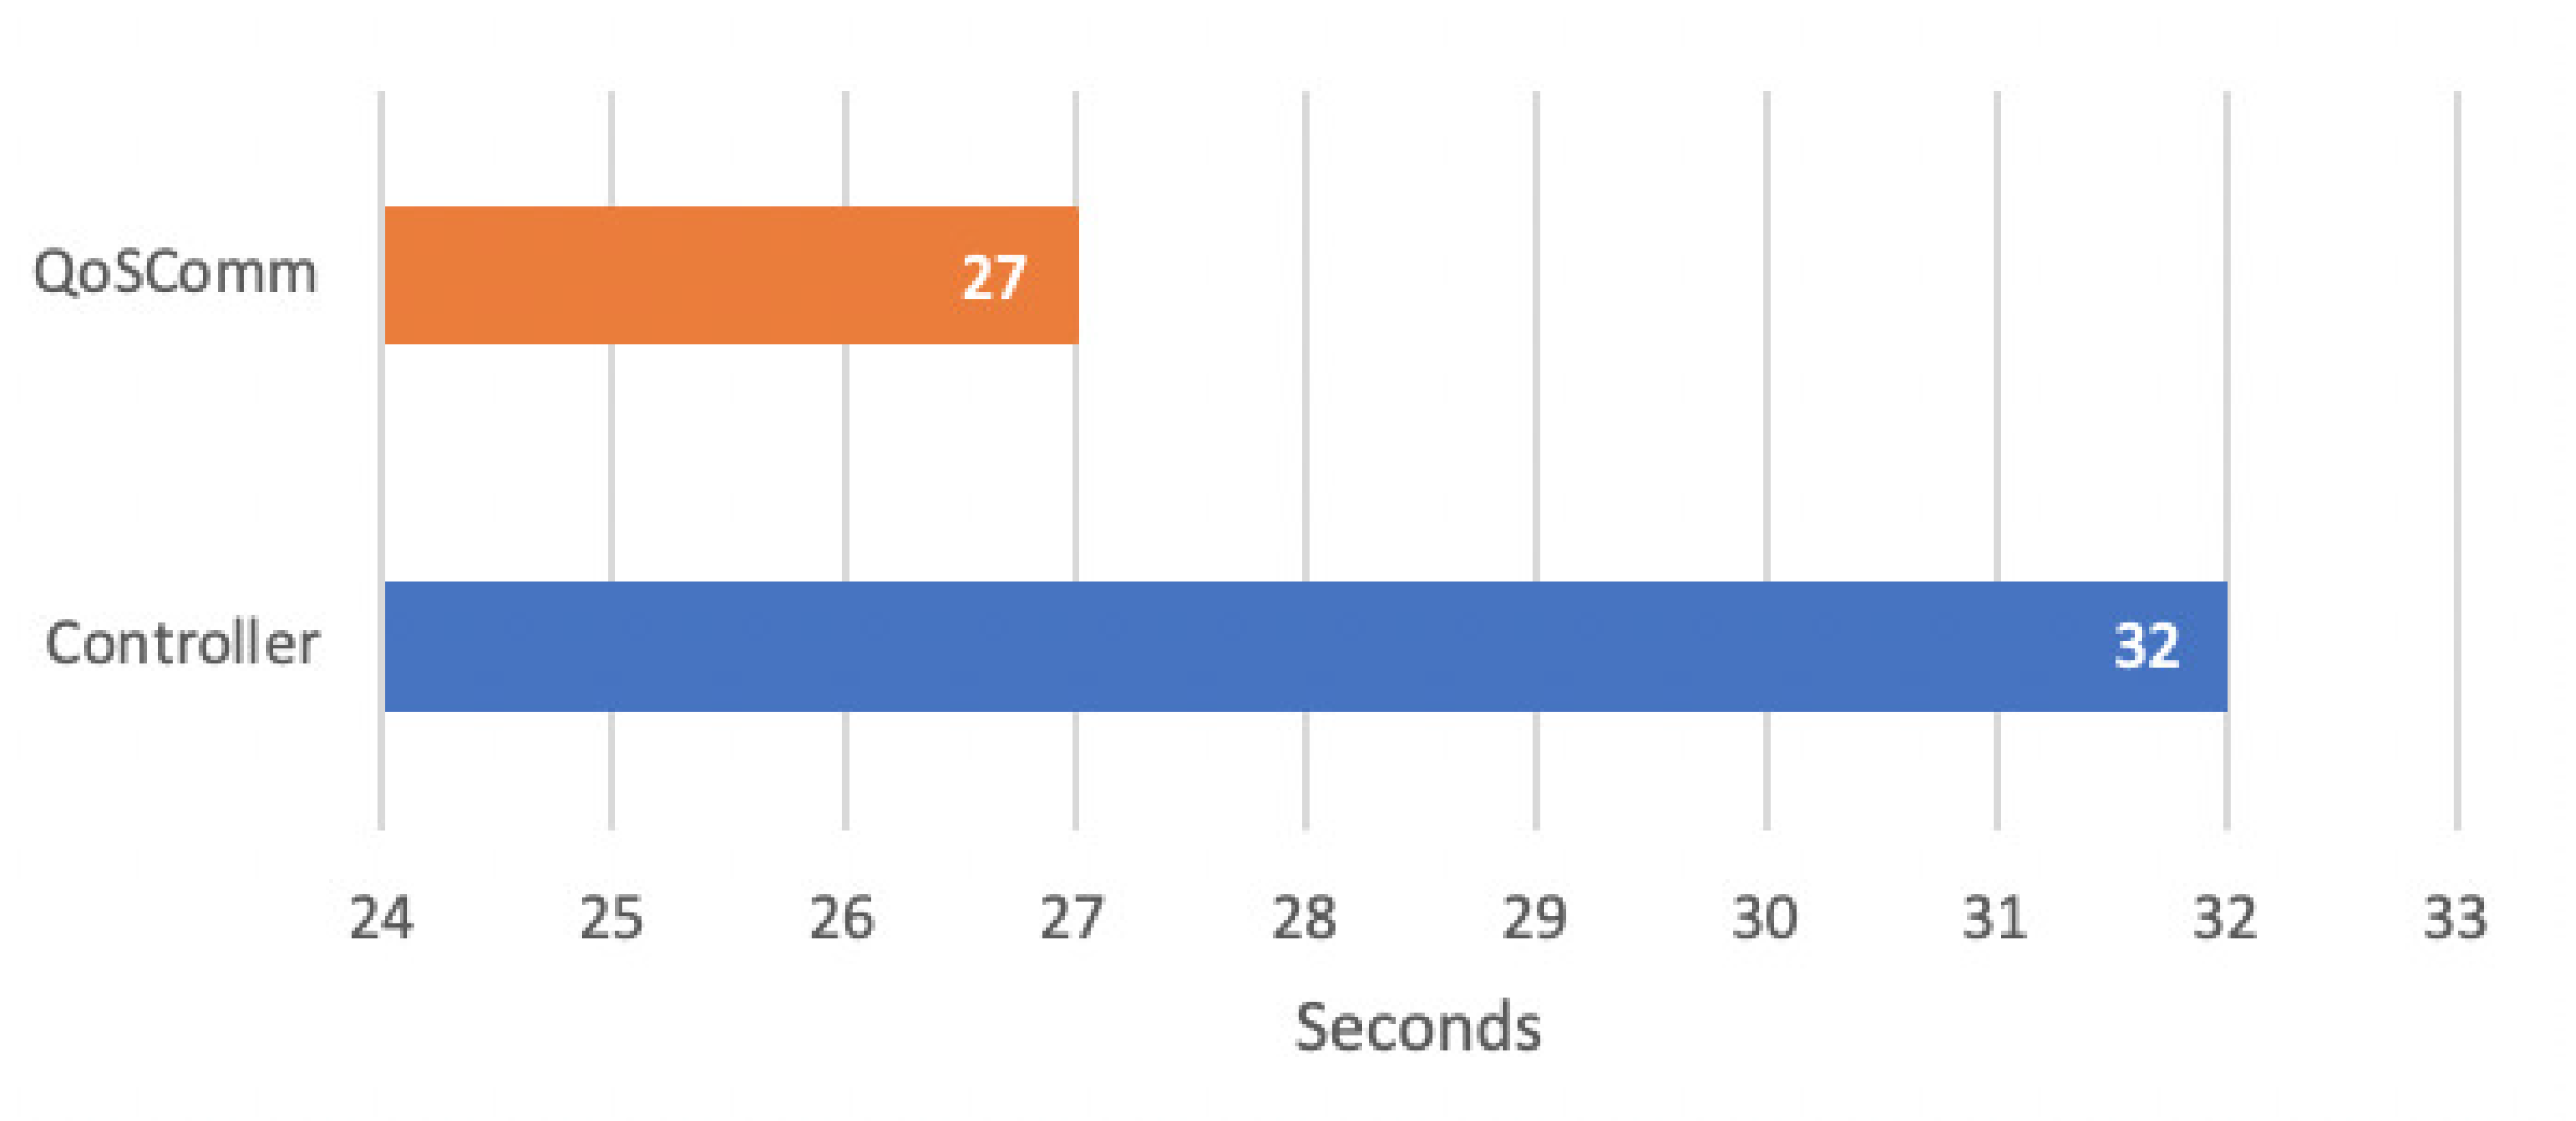
The results showed that the MPI application completion time got benefits using QoSComm data flow forwarding strategy rather than Controller default, as is observed in
Figure 8. As mentioned above, QoSComm used Path (S0, S2, S1, S3, S10, S11, S13) and has 11 ms end-to-end delay and 90 mbps of max bandwidth capacity; it took an average of 27 s to complete application jobs. Controller default used Path (S0, S1, S3, S10, S11, S13), which has a 20 ms delay and 100 mbps of maximum bandwidth capacity, and took an average of 32 s to complete. We can see a difference of 5 s using QoSComm instead of Controller default data flow forwarding method.
For this MPI application test, the results showed that our proposal QoSComm improved the completion time by an average of 18%. We classified the Big Data Analytics as a time-sensitive application that needs to be in constant communication with compute nodes or, at some time, will need to transfer large data sets among compute nodes. For these types of applications, the end-to-end delay becomes a critical parameter instead of just considering the network bandwidth parameter, as is observed in the test results.
The MPI application is often performed in a single domain; however, we executed an MPI application transferring messages in an inter-domain approach to test its performance when using different data flow forwarding methods versus QoSComm. In addition, there is an implementation such as MPICH-G targeting multi-domains [
38], allowing for BDA to run jobs among distributed compute hosts.
Considering the application test results, QoSComm can contribute to improving connectivity aspects in IoT architecture for big data analytics [
39], where authors describe BDA to process a large amount of data that may be stored in a distributed cloud environment.
6. Conclusions and Future Work
The IoT decision-making approach gets benefits when using Big Data Analytics through the intelligent processing of massive data collected from IoT devices and an analysis of the actionable data in the shortest possible time in order to make quick decisions.
Our proposal, QoSComm, provides network QoS for IoT Big Data Analytics, specifically in their job submission process without the need to modify the application and network controller schedulers. QoSComm improves BDA completion time when transferring data flows among SDN-based distributed data centers, as was shown in experiment results described in the previous section.
Evaluations results showed that, for time-sensitive applications, it is necessary to consider other network parameters to provide QoS such as delay, jitter, and packet loss rather than just considering higher bandwidth to minimize their completion time. QoSComm allows BDA to program software-defined networks dynamically according to their needs and can also communicate with multiple SDN controllers, providing an inter-domain communication approach.
As future work, the design of a REST API is proposed for a data flow distribution model enabling the BDA application scheduler to communicate its additional requirements for job execution (security, computing resources, among others). In addition, we will work on a combination of QoS based network paths and secure a forwarding scheme for sensitive-data IoT Big Data Analytics.

 ,
, 


