Experimental Investigations on Nonlinear Flutter Behaviors of a Bridge Deck with Different Leading and Trailing Edges

1
Key Lab of Smart Prevention and Mitigation for Civil Engineering Disasters of the Ministry of Industry and Information, Harbin Institute of Technology, Harbin 150090, China
2
Key Lab of Structures Dynamic Behavior and Control of the Ministry of Education, Harbin Institute of Technology, Harbin 150090, China
3
School of Civil Engineering, Harbin Institute of Technology, Harbin 150090, China
*
Author to whom correspondence should be addressed.
Appl. Sci. 2020, 10(21), 7781; https://0-doi-org.brum.beds.ac.uk/10.3390/app10217781
Submission received: 5 October 2020
/
Revised: 28 October 2020
/
Accepted: 31 October 2020
/
Published: 3 November 2020
(This article belongs to the Special Issue Advances on Structural Engineering, Volume II)
Abstract
:Recently, the nonlinear flutter behavior of long-span suspension bridges has attracted attention. Unlike the classical theory of bridge flutter, the stable limit cycle oscillations (LCO) have occurred for some bluff aerodynamic configurations when the inflow velocity exceeded a specific critical value. To explore the influence of aerodynamic configurations on flutter behaviors a series of flutter tests for spring-suspended sectional models were conducted. When the leading edges and trailing edges with various shapes were installed at the sectional models, different flutter types occurred. In the test, the self-excited forces and flutter responses were measured. Then, the characteristics of coupling vibration and aerodynamic hysteresis of the two kinds of flutter were analyzed and compared. Finally, the role of the phase difference between self-excited forces and displacements was discussed in the mechanism difference of the classical flutter and the postflutter LCO. As the leading edge became the bluffer, the results showed that the type of flutter gradually transformed from classical divergent flutter to postcritical LCO and the torsional mode played a more important role in the flutter than in the vertical mode. For the postflutter LCO, there was a negative feedback pattern, i.e., as the vibration amplitude increased, the phase difference gradually decreased, and the energy input to the dynamic system did not grow rapidly, which limited the further vibration divergence and resulted in a stable LCO.
1. Introduction
In recent years, long-span suspension bridges have gradually developed towards more than 2000 m, and the structure of the suspension bridge has become more slender and flexible [1]. As a typical aerodynamic instability phenomenon, the flutter of a long-span suspension bridge has been paid more attention and has even been a key factor in the design of a “super” long-span suspension bridge. The initial research on bridge flutter originated after the shocking collapse of the Tacoma Narrows Bridge in 1940. As a result of this tragedy, wind load effects emerged as an important potential topic for researchers to investigate.
As a significant breakthrough, the theory of bridge flutter derivatives was proposed by Scanlan in 1971 to describe the relationship between the unsteady aerodynamic self-excited forces and the motion states when the flutter occurred [2]. The self-excited forces were regarded as a linear function of the motion states in the theory of flutter derivatives. The flutter derivatives were corresponding linear coefficients, which needed to be identified by experiments or numerical simulations [3,4,5,6]. The linearized self-excited force model was further improved to be available for higher degrees of freedom, and lots of identification methods were developed to obtain the flutter derivatives, which have been successfully applied to evaluate the flutter critical wind speed [7,8]. To suppress the flutter instability and improve the flutter critical wind speed, a series of passive and active aerodynamic countermeasures, including central slot [9,10], leading edge [11], central vertical stabilizer [12,13] and controllable winglets [14,15,16] et al., were employed to make some fixed or adjustable modifications on the aerodynamic configuration of the bridge deck.
Over the past few decades, nonlinear flutter behavior in the postflutter limit cycle oscillations (LCOs) has gradually drawn the researchers’ attention [17,18,19,20,21,22,23,24,25]. Different from the classical flutter, the vibration did not tend to diverge but maintain a LCO with a stable amplitude when the inflow velocity exceeded a specific critical value under a big angle of attack or for a bluff aerodynamic configuration [26,27,28]. The typical theory of bridge flutter derivatives is not suitable to describe the nonlinear flutter phenomenon. In fact, Scanlan’s self-excited force model is a linearized simplification of a dynamic system at the critical flutter state with a small amplitude. Nevertheless, the aerodynamic nonlinear effect of self-excited force under large vibration amplitude cannot be ignored. Scanlan et al. [29] and Noda et al. [30] pointed out that there existed nonlinear components dependent on vibration amplitude in the self-excited force during the flutter process. Náprstek et al. [17] made a detailed nonlinear analysis of postcritical states of prismatic bodies. A combination of Rayleigh or Van Por and Duffing types of differential equations were introduced to describe the nonlinear postflutter LCO. Amandolese et al. [19] investigated the nonlinear flutter instability of a two-degree-of-freedom flat plate with wind tunnel tests. A coupled-mode LCO occurred when the wind speed exceeded the critical velocity. Interestingly, a nonlinear hysteresis phenomenon was observed, i.e., a stable LCO was maintained even though the wind speed was from a higher value to a lower value than the critical velocity. A torsional postcritical LCO with a slight heave−torsion coupling effect was observed for an open twin-side-girder bridge deck in spring-suspended sectional model tests [28]. Based on the measured self-excited forces, a nonlinear polynomial flutter model was proposed and the third-order angular velocity term was regarded as a stabilizing factor to limit the divergent vibration and make the dynamic system come into an LCO. Tang et al. [25] experimentally investigated the nonlinear postflutter LCO of the shallow section under different angles of attack and damping conditions, which significantly influenced the critical flutter velocity and the steady-state amplitude of flutter. Wang et al. [31] presented a 3D nonlinear flutter analysis of full-scale long-span bridges, the effects of partial correlation of the self-excited forces at different spanwise locations were considered and the predicted postflutter LCO responses were compared with 2D analysis results. It can be seen that the mode coupling effects of the postcritical LCO are very complicated and the nonlinear features induced by the aerodynamic configuration are necessary to be explored further.
In the present paper, a series of spring-suspended sectional model tests with different leading edges and trailing edges were conducted to study the influence of aerodynamic configurations on flutter behaviors. An intrusive investigation was made to explore the differences between a classical flutter and postflutter LCO. Based on the results of the measured flutter responses and aerodynamic self-excited force, the characteristics of coupling vibration and aerodynamic hysteresis phenomenon were compared, and the work done by the self-excited force was analyzed. Finally, the phase difference between self-excited forces and displacements was compared for the classical flutter and postflutter LCO.
2. Experiment Setup
The flutter tests were conducted in the SMCCWT-1 wind tunnel in Harbin Institute of Technology, China. The wind tunnel was a closed-circuit wind tunnel with a section size of mm2. The wind speed can be adjusted from 0 to 25 m/s with a low turbulence intensity of less than 0.4%.
2.1. Test Device and Model Aerodynamic Configuration
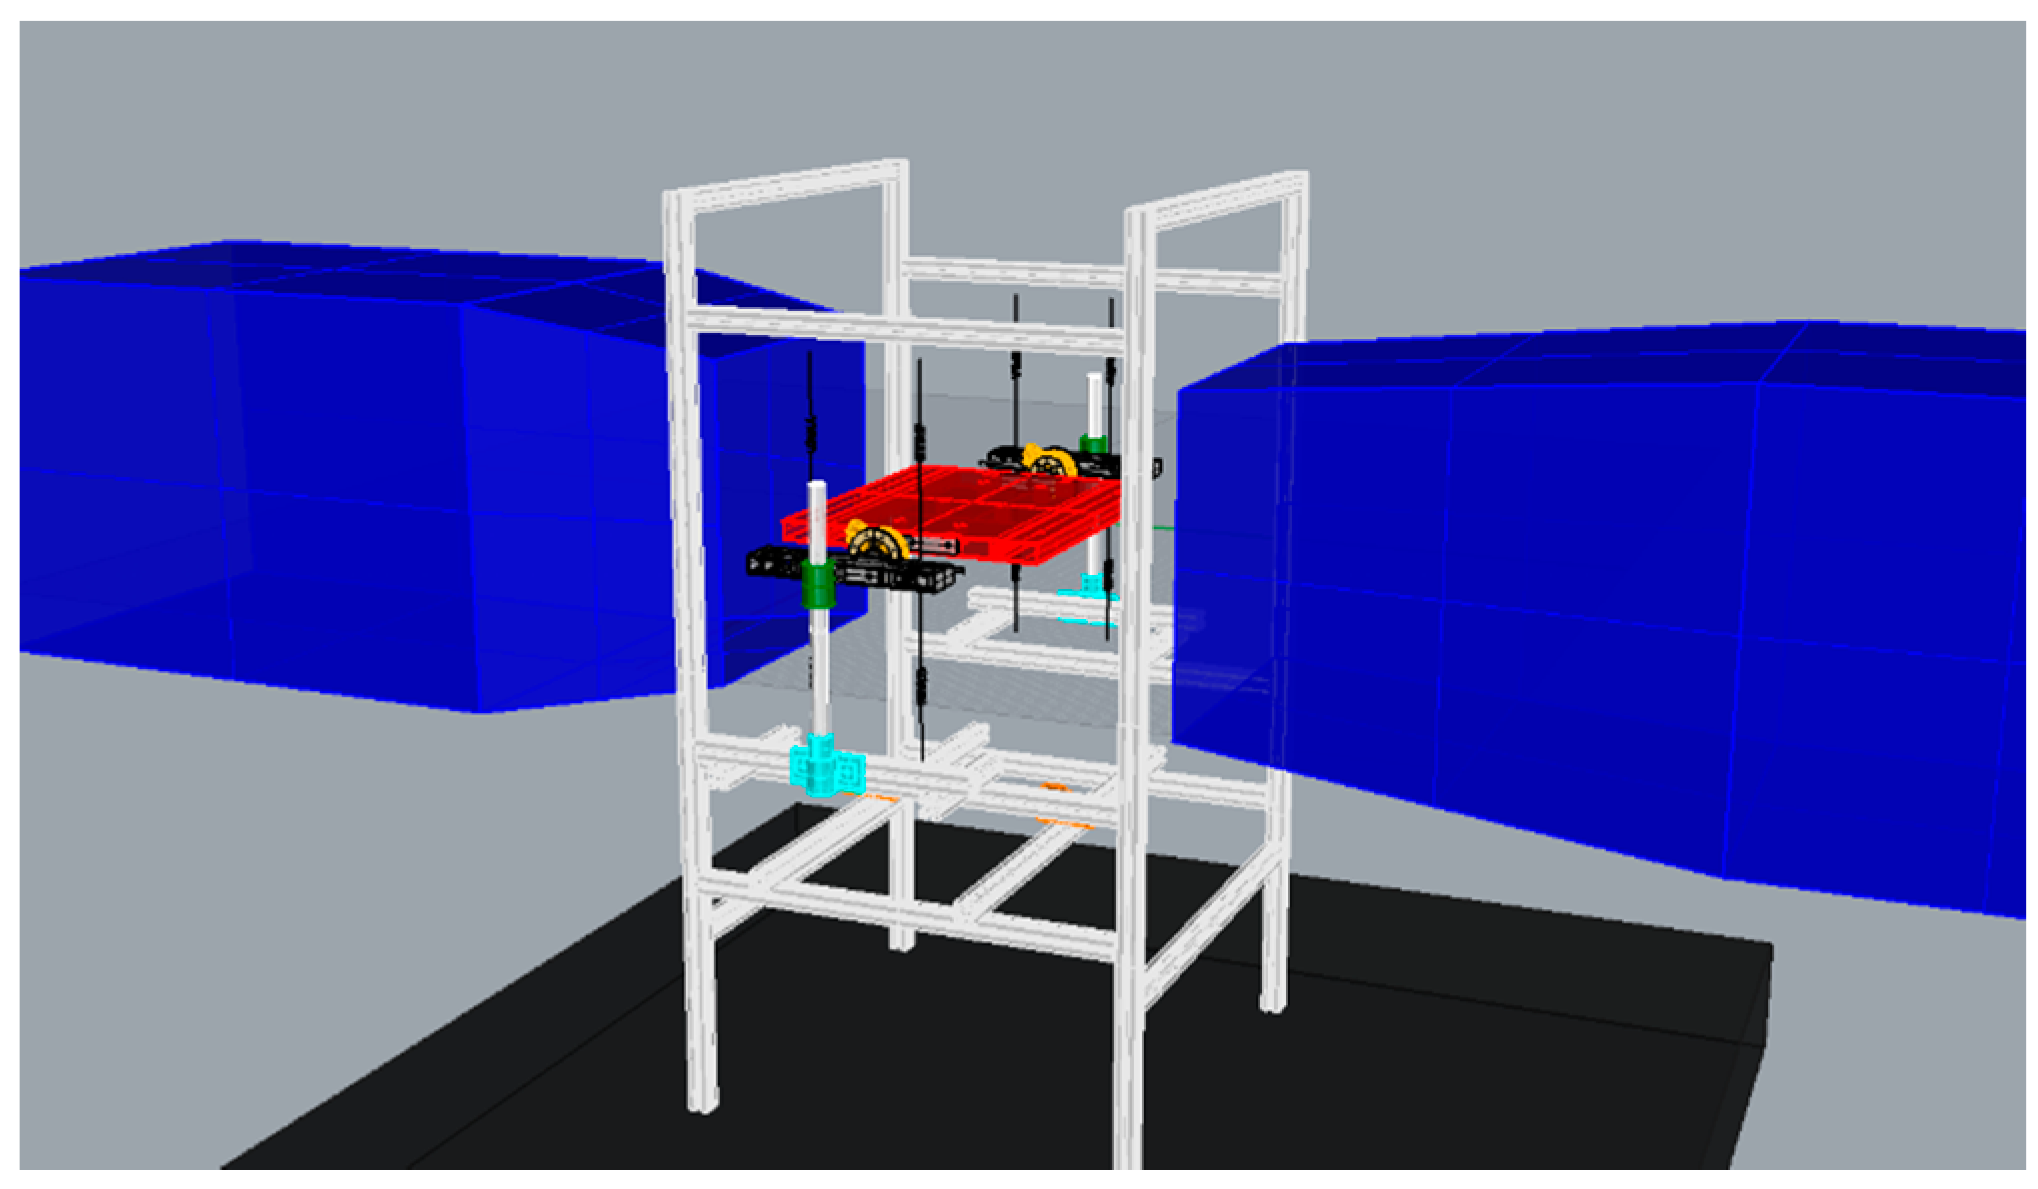
A 2-degree-of-freedom spring-suspended sectional model was designed to implement the flutter tests shown in Figure 1. In previous works, long steel wires were adopted to restrict the downwind vibration of the spring-suspended model. However, there was a marked drawback that the vertical vibration was also limited under a large amplitude when flutter occurred, which possibly changed the vertical stiffness of the dynamic system. To solve the problem, the air bearing devices with a low damping were used to realize the constraint of downwind vibration.
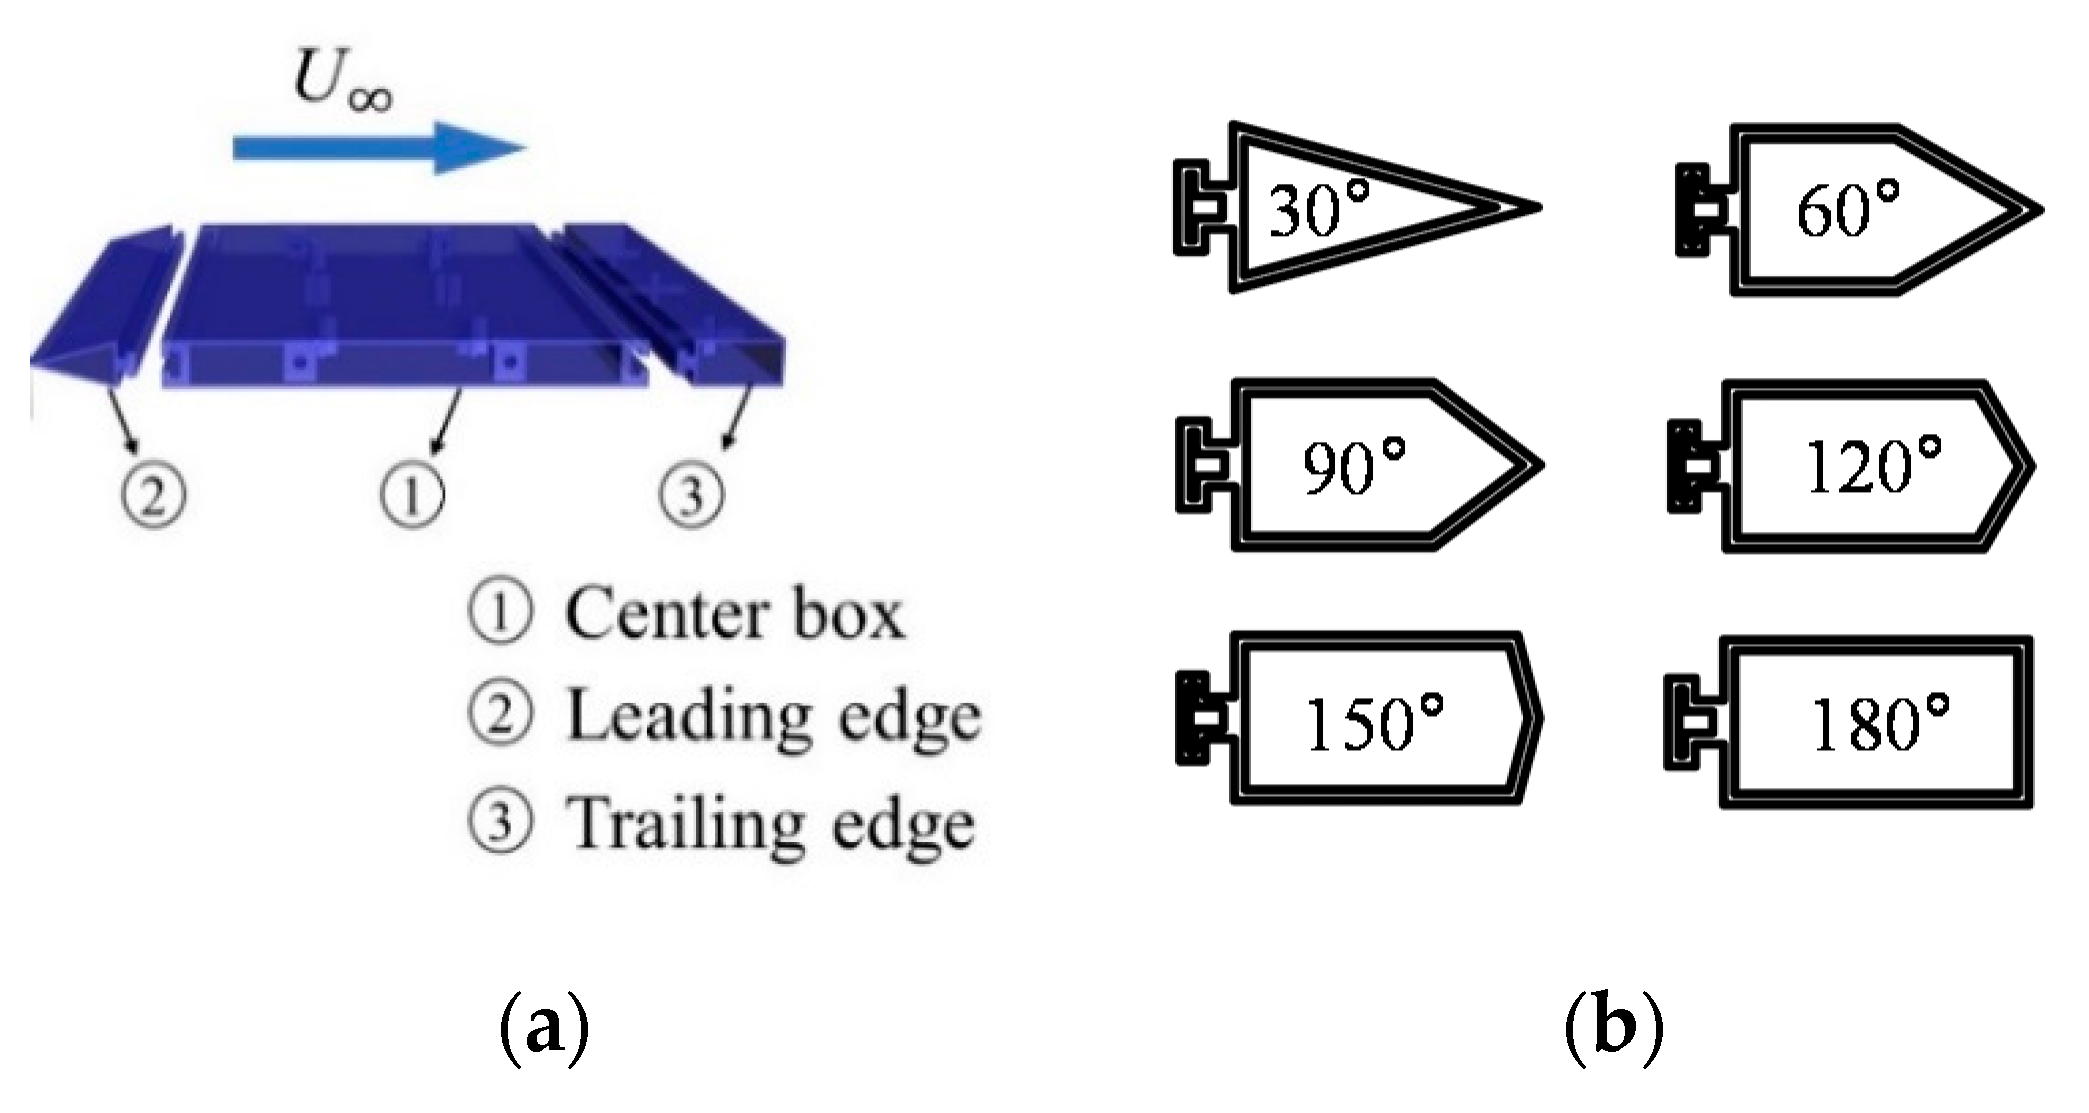
The aerodynamic configuration of cross section plays an important role in flutter responses. To explore the influence of aerodynamic configuration, a series of different leading edges and trailing edges were fabricated at the rectangular center box with an aspect ratio of 1:10. The shapes of leading edges and trailing edges were designed as an isosceles triangle. The vertex angles varied from 30 to 180°, including 30, 60, 90, 120, 150, and 180° (180° means a rectangular leading edge or trailing edge), as shown in Figure 2. All the test cases are listed in Table 1. To ensure adequate structural stiffness, 3D printing technology was employed to manufacture all models using high-strength photosensitive resin. Balance weights were used to make the mass and moment of inertia of all models as similar as possible even though the aerodynamic configuration was different.
2.2. Displacement and Aerodynamic Force Measurement
Two CCD laser displacement sensors (LK-G400, KEYENCE Company, Itasca, IL, USA) were fixed under both sides of the torsion axis of the model bilaterally, which were employed to measure the vertical and torsional displacement. The reference distance of sensors was 400 mm, and the measuring range was ±100 mm with a measurement accuracy of 2 μm. In the test, the sampling frequency of sensors was set as 1000 Hz.
Two high-accuracy six-component force/torque balances (Gamma, ATI Company, Apex, NC, USA) were used to measure aerodynamic self-excited forces. The loading ranges of vertical force and torque were ±65 N and ±5 N·m with high resolutions of 1/80 N and 1/1333 N·m, respectively. A sampling frequency of 1000 Hz was used to obtain the time-varied force/torque balances measured values.
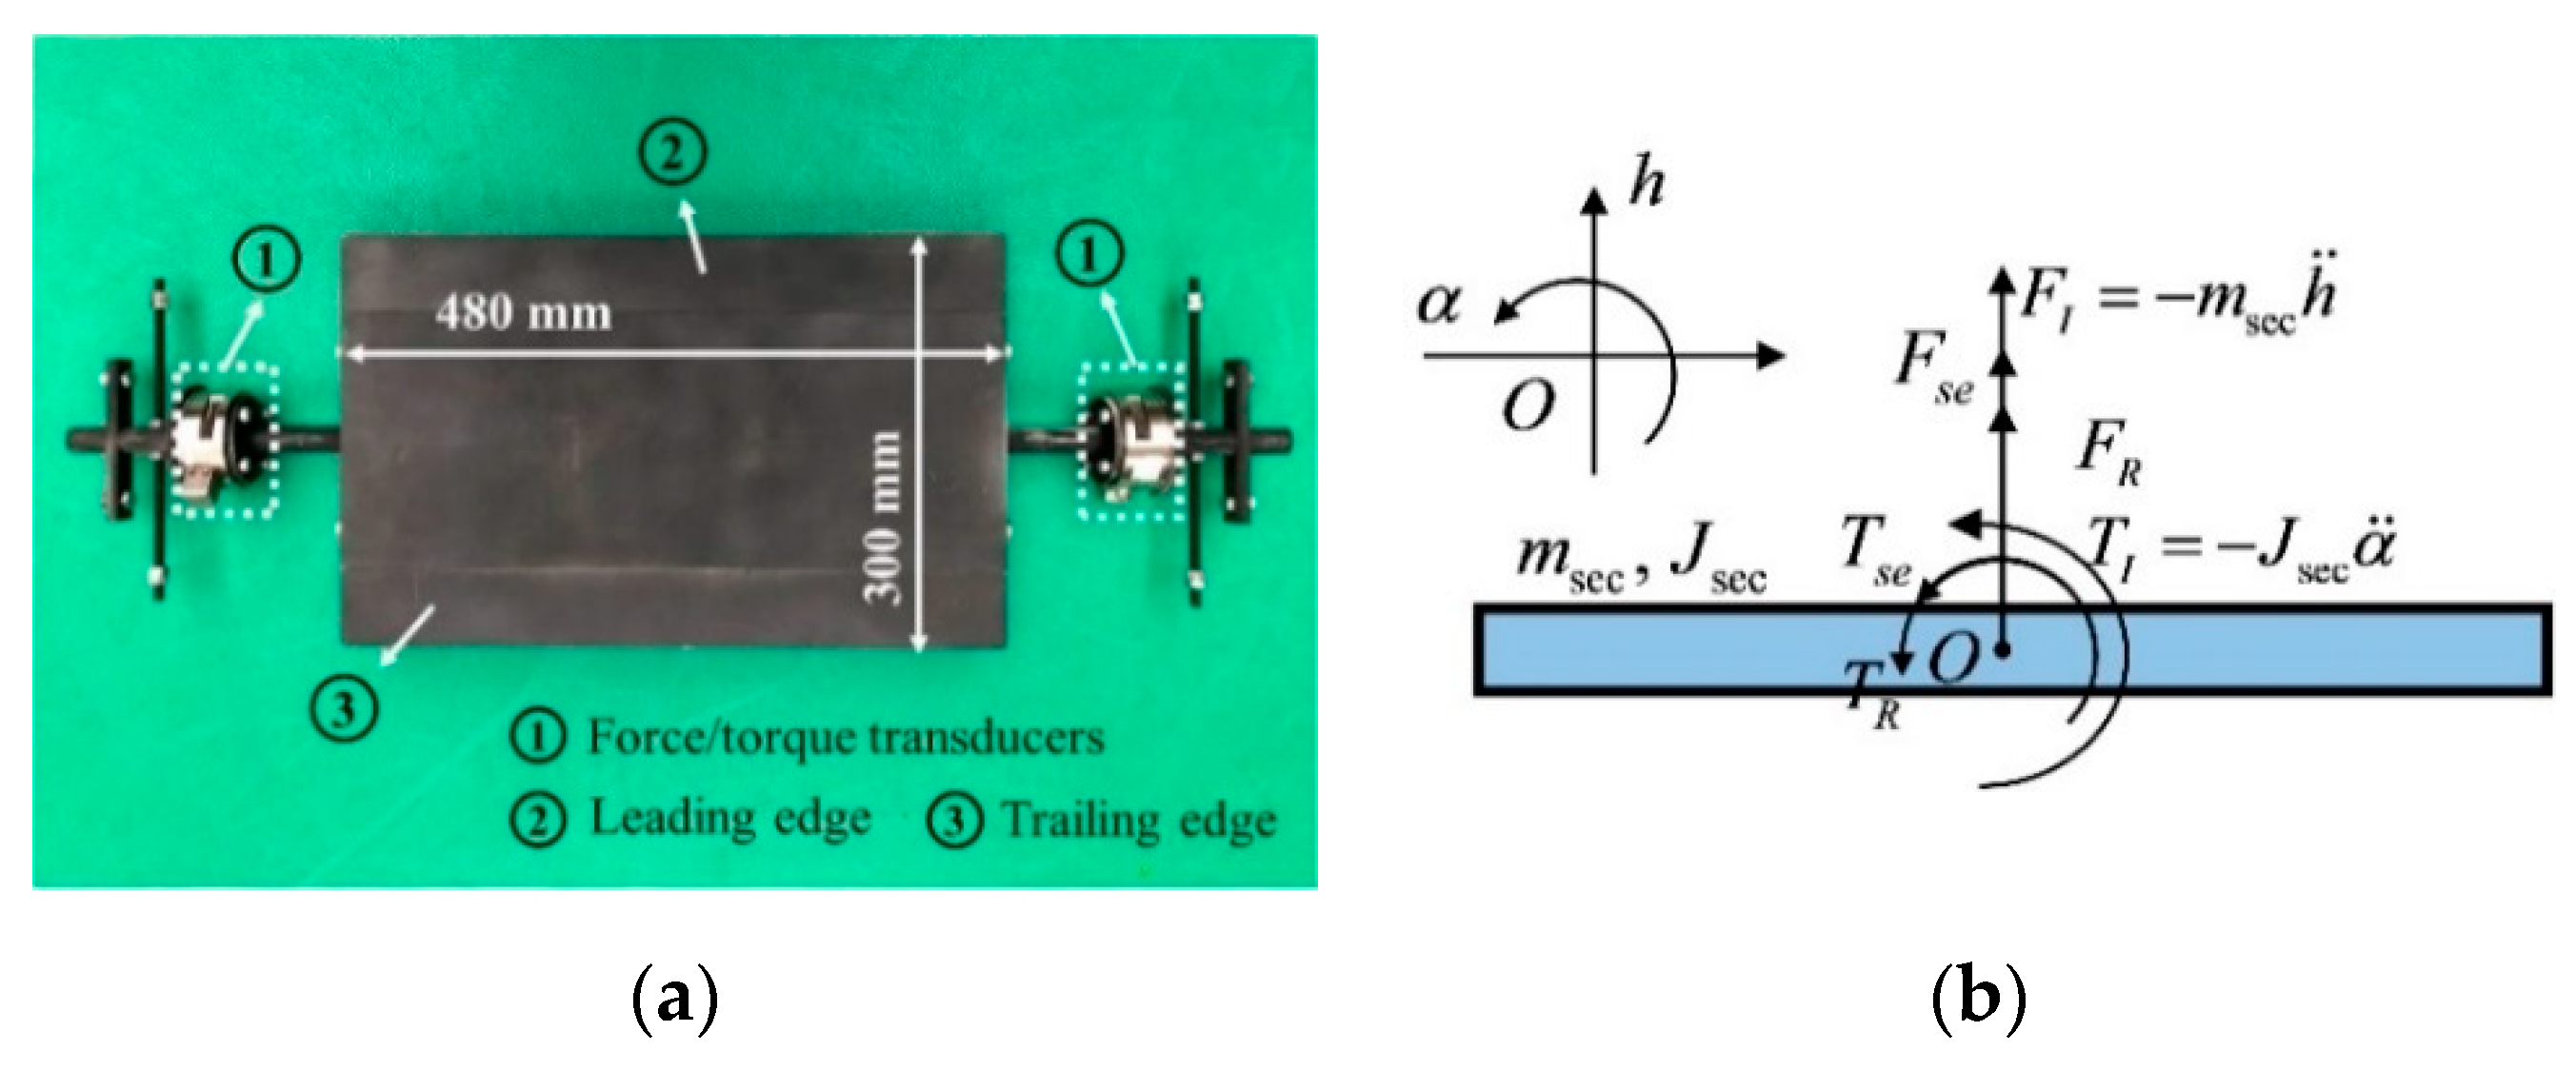
The two force/torque balances were installed between the sectional model and the springs on both sides of the model shown in Figure 3. The installation method was sturdy enough so that the mechanical damping of springs played a dominant role in the total damping of the whole dynamic system. Therefore, it should be reasonable to ignore the damping of the connection between the balances and the sectional model. The external forces acting on the sectional model included its own gravity, the supporting force from the force/torque balances, and aerodynamic self-excited force. For the sectional model during flutter, the dynamic equilibrium equation can be written as
where and are the vertical and torsional aerodynamic self-excited forces, respectively; and are the vertical and torsional supporting forces from the force/torque balances, respectively, equating to the opposite measured values of two force/torque balances; and are the vertical and torsional inertial forces of the sectional model, respectively, and can be calculated by
where and are the inertial mass and moment of the sectional model, respectively, and and are the vertical and torsional displacements of the sectional model, respectively. Therefore, the aerodynamic self-excited forces can be calculated as follows:
2.3. Structural Dynamic Parameters
The main purpose in the present study was to explore the potential mechanism of classical flutter and postflutter LCO, which was induced by the different aerodynamic configurations of leading and trailing edges. Considering the convenience of controlling variables and reduction of experiment complexity, a basic rectangular section with different bluff or sharped leading edges, not a real bridge section shape, was chosen as a sectional model. Therefore, the scaling conditions of the 2D sectional model were not followed strictly with the real bridge structure. As a substitute, the main dynamic parameters, including damping ratio and vertical-torsional frequency ratio were designed to be similar with the real bridge structures and make sure that the classical flutter and nonlinear flutter in the tests had similar characteristics with the real bridge structures.
For each case, vertical and torsional free vibration tests were carried out to identify structural dynamic parameters. The natural frequency was obtained by analyzing the frequency spectrum of the free vibration displacement based on the Fast Fourier Transform method. The damping ratio of the dynamic system was calculated via the logarithmic attenuation of the free vibration amplitude. The results of the structural dynamic parameters are listed in Table 2.
In Table 2, for all the cases, it can be seen that the vertical and torsional natural frequencies of the dynamic system were about 3.77–3.80 Hz and about 4.40–4.50 Hz, respectively, which indicated the balance weights worked well enough to make the inertial mass and moment to be basically consistent for all cases with different aerodynamic configurations. The vertical and torsional damping ratios of the dynamic system were 0.25–0.43% and 0.25–0.34%.
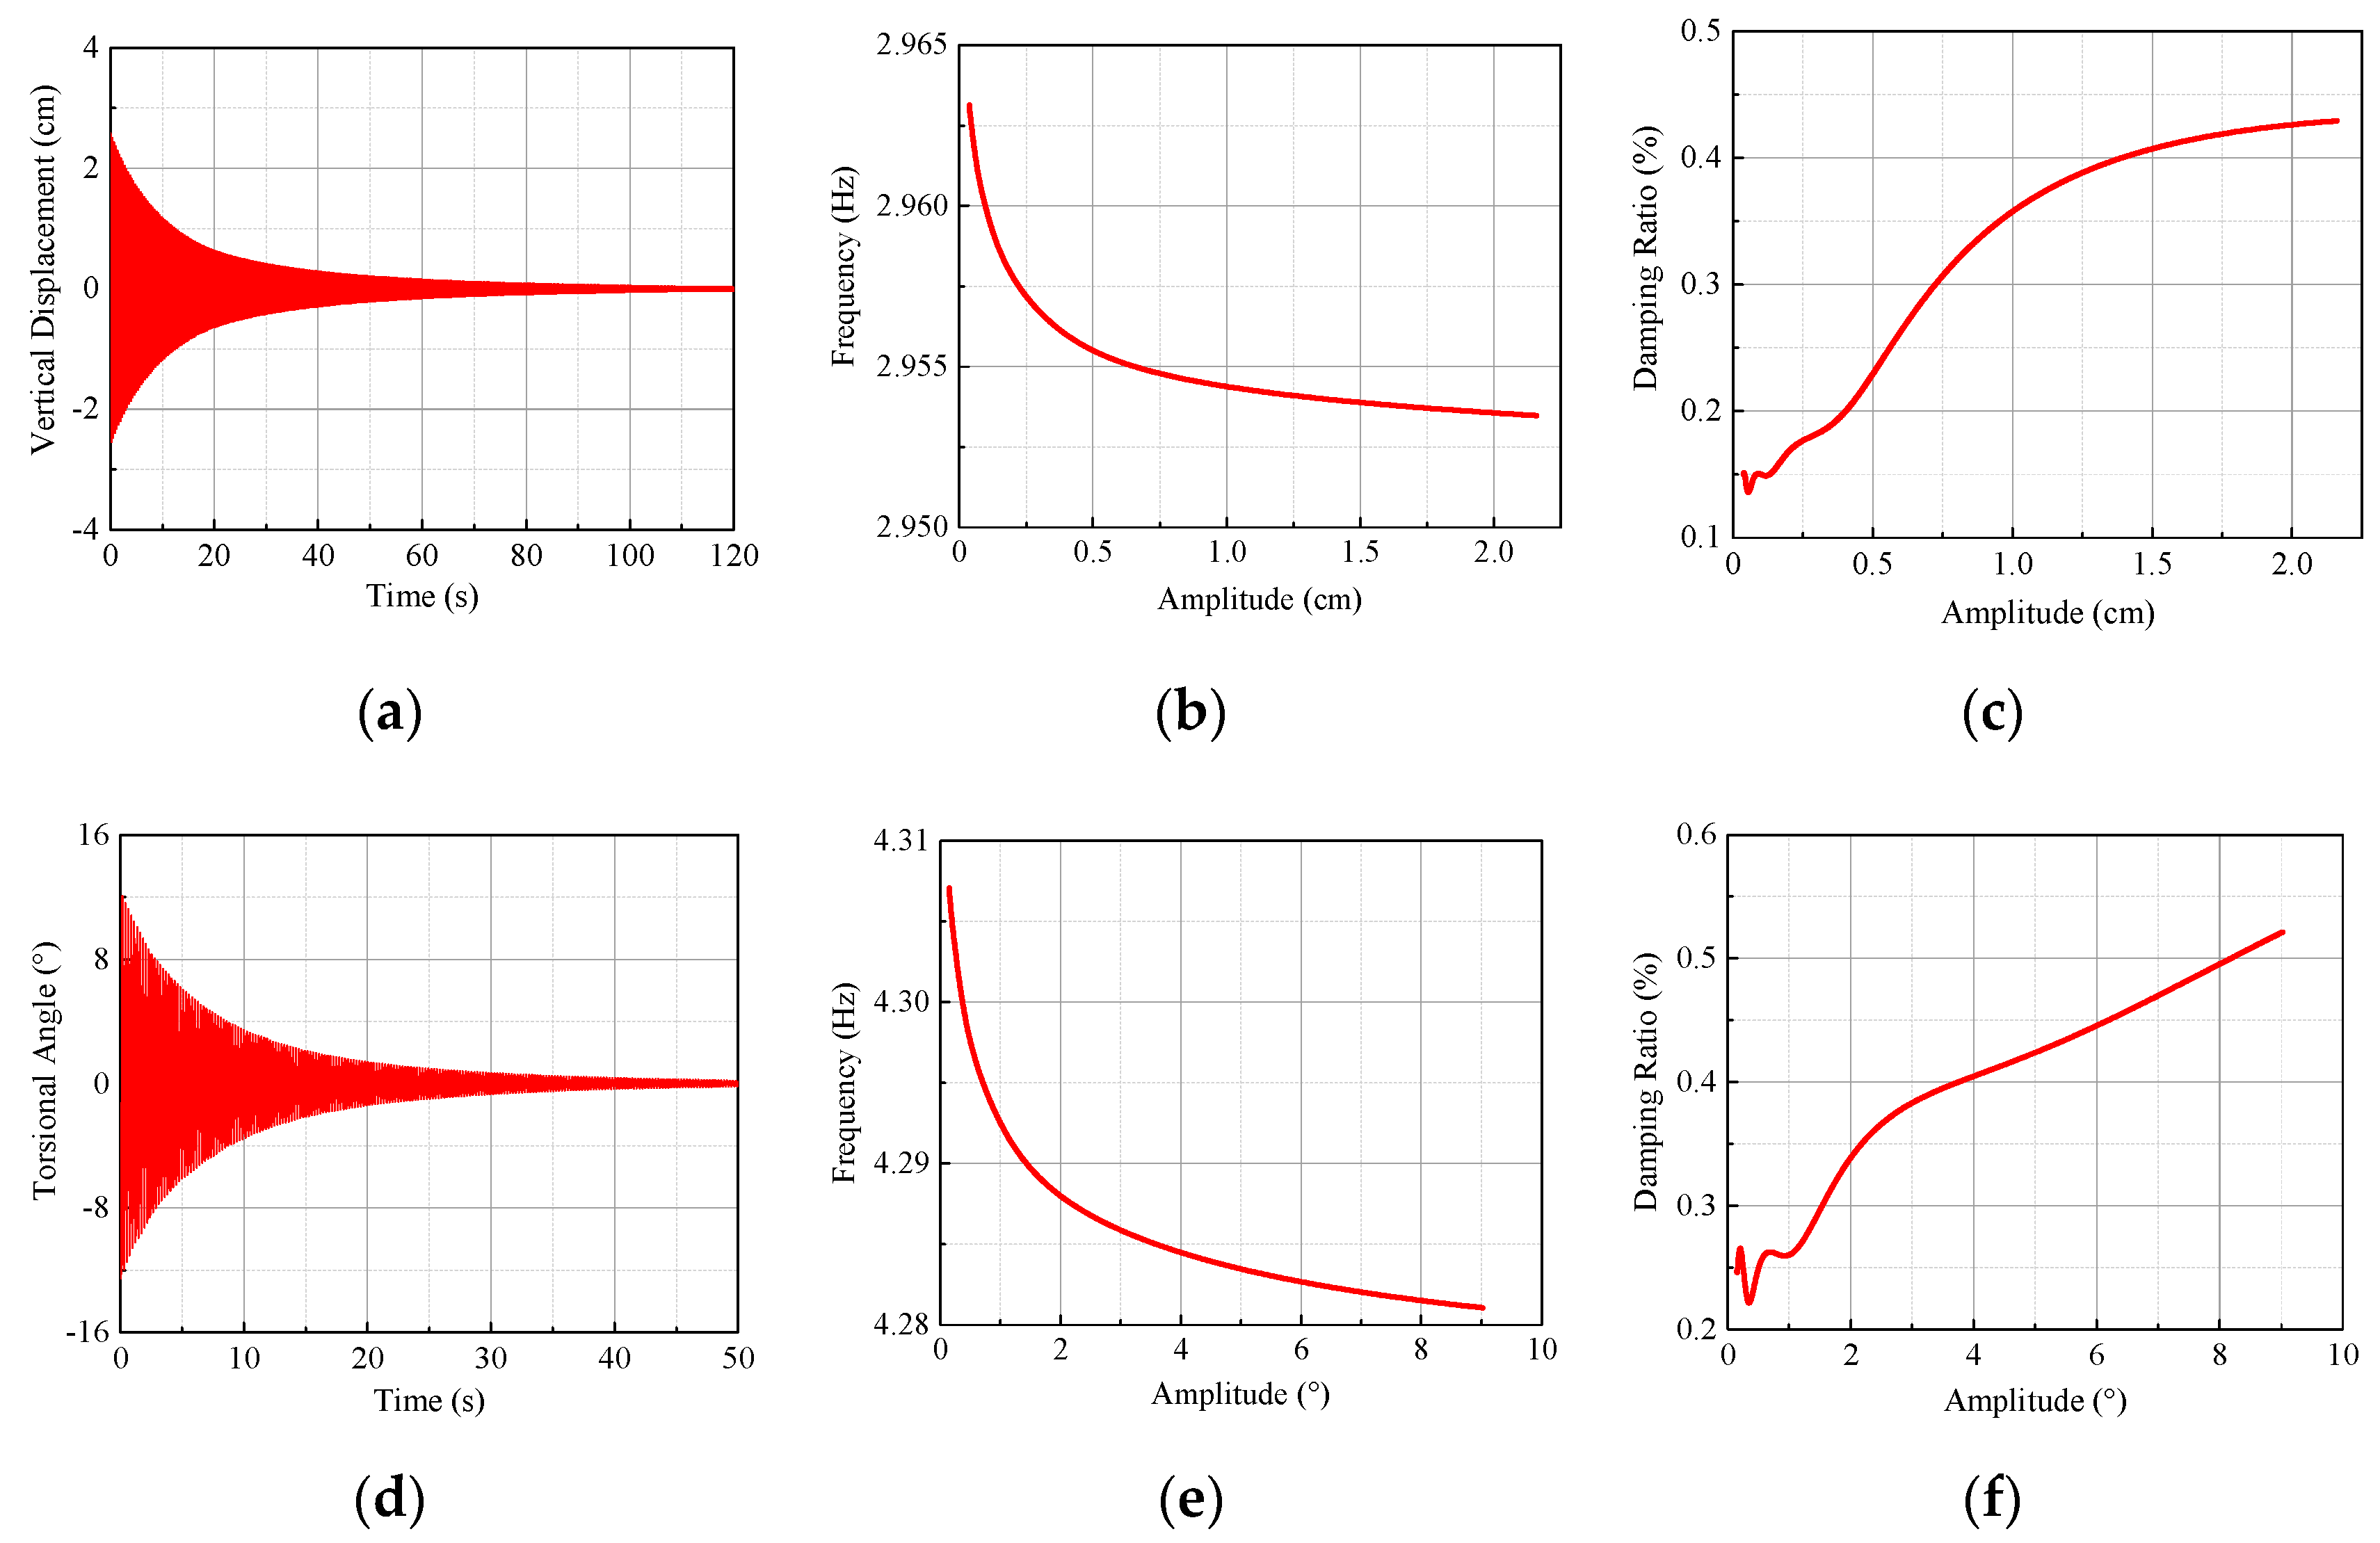
It is remarkable that the postflutter LCO is also sensitive to the nonlinearities of the mechanical system. In previous research, the structural nonlinearity of a spring-suspended dynamic system has been paid a lot of attention. For the spring-suspended sectional model, the structural stiffness and damping of the spring-suspended system were expressed as a nonlinear function of the vibration amplitude based on the equivalent linearization approximation method, which were identified by the free vibration tests [28,32]. In the present paper, the same method was used to obtain the nonlinear structural damping ratio and frequency and an example of the identified results (case: L30) was displayed in Figure 4. It can be seen the variation of the natural frequency via the vibration amplitude was very small, which means the stiffness nonlinearity was weak enough to be ignored. Nevertheless, the nonlinearity of the damping ratio has to be taken into consideration in the nonlinear flutter analysis.
3. Results and Discussion
3.1. Characteristics of Flutter Responses under Different Leading and Trailing Edges
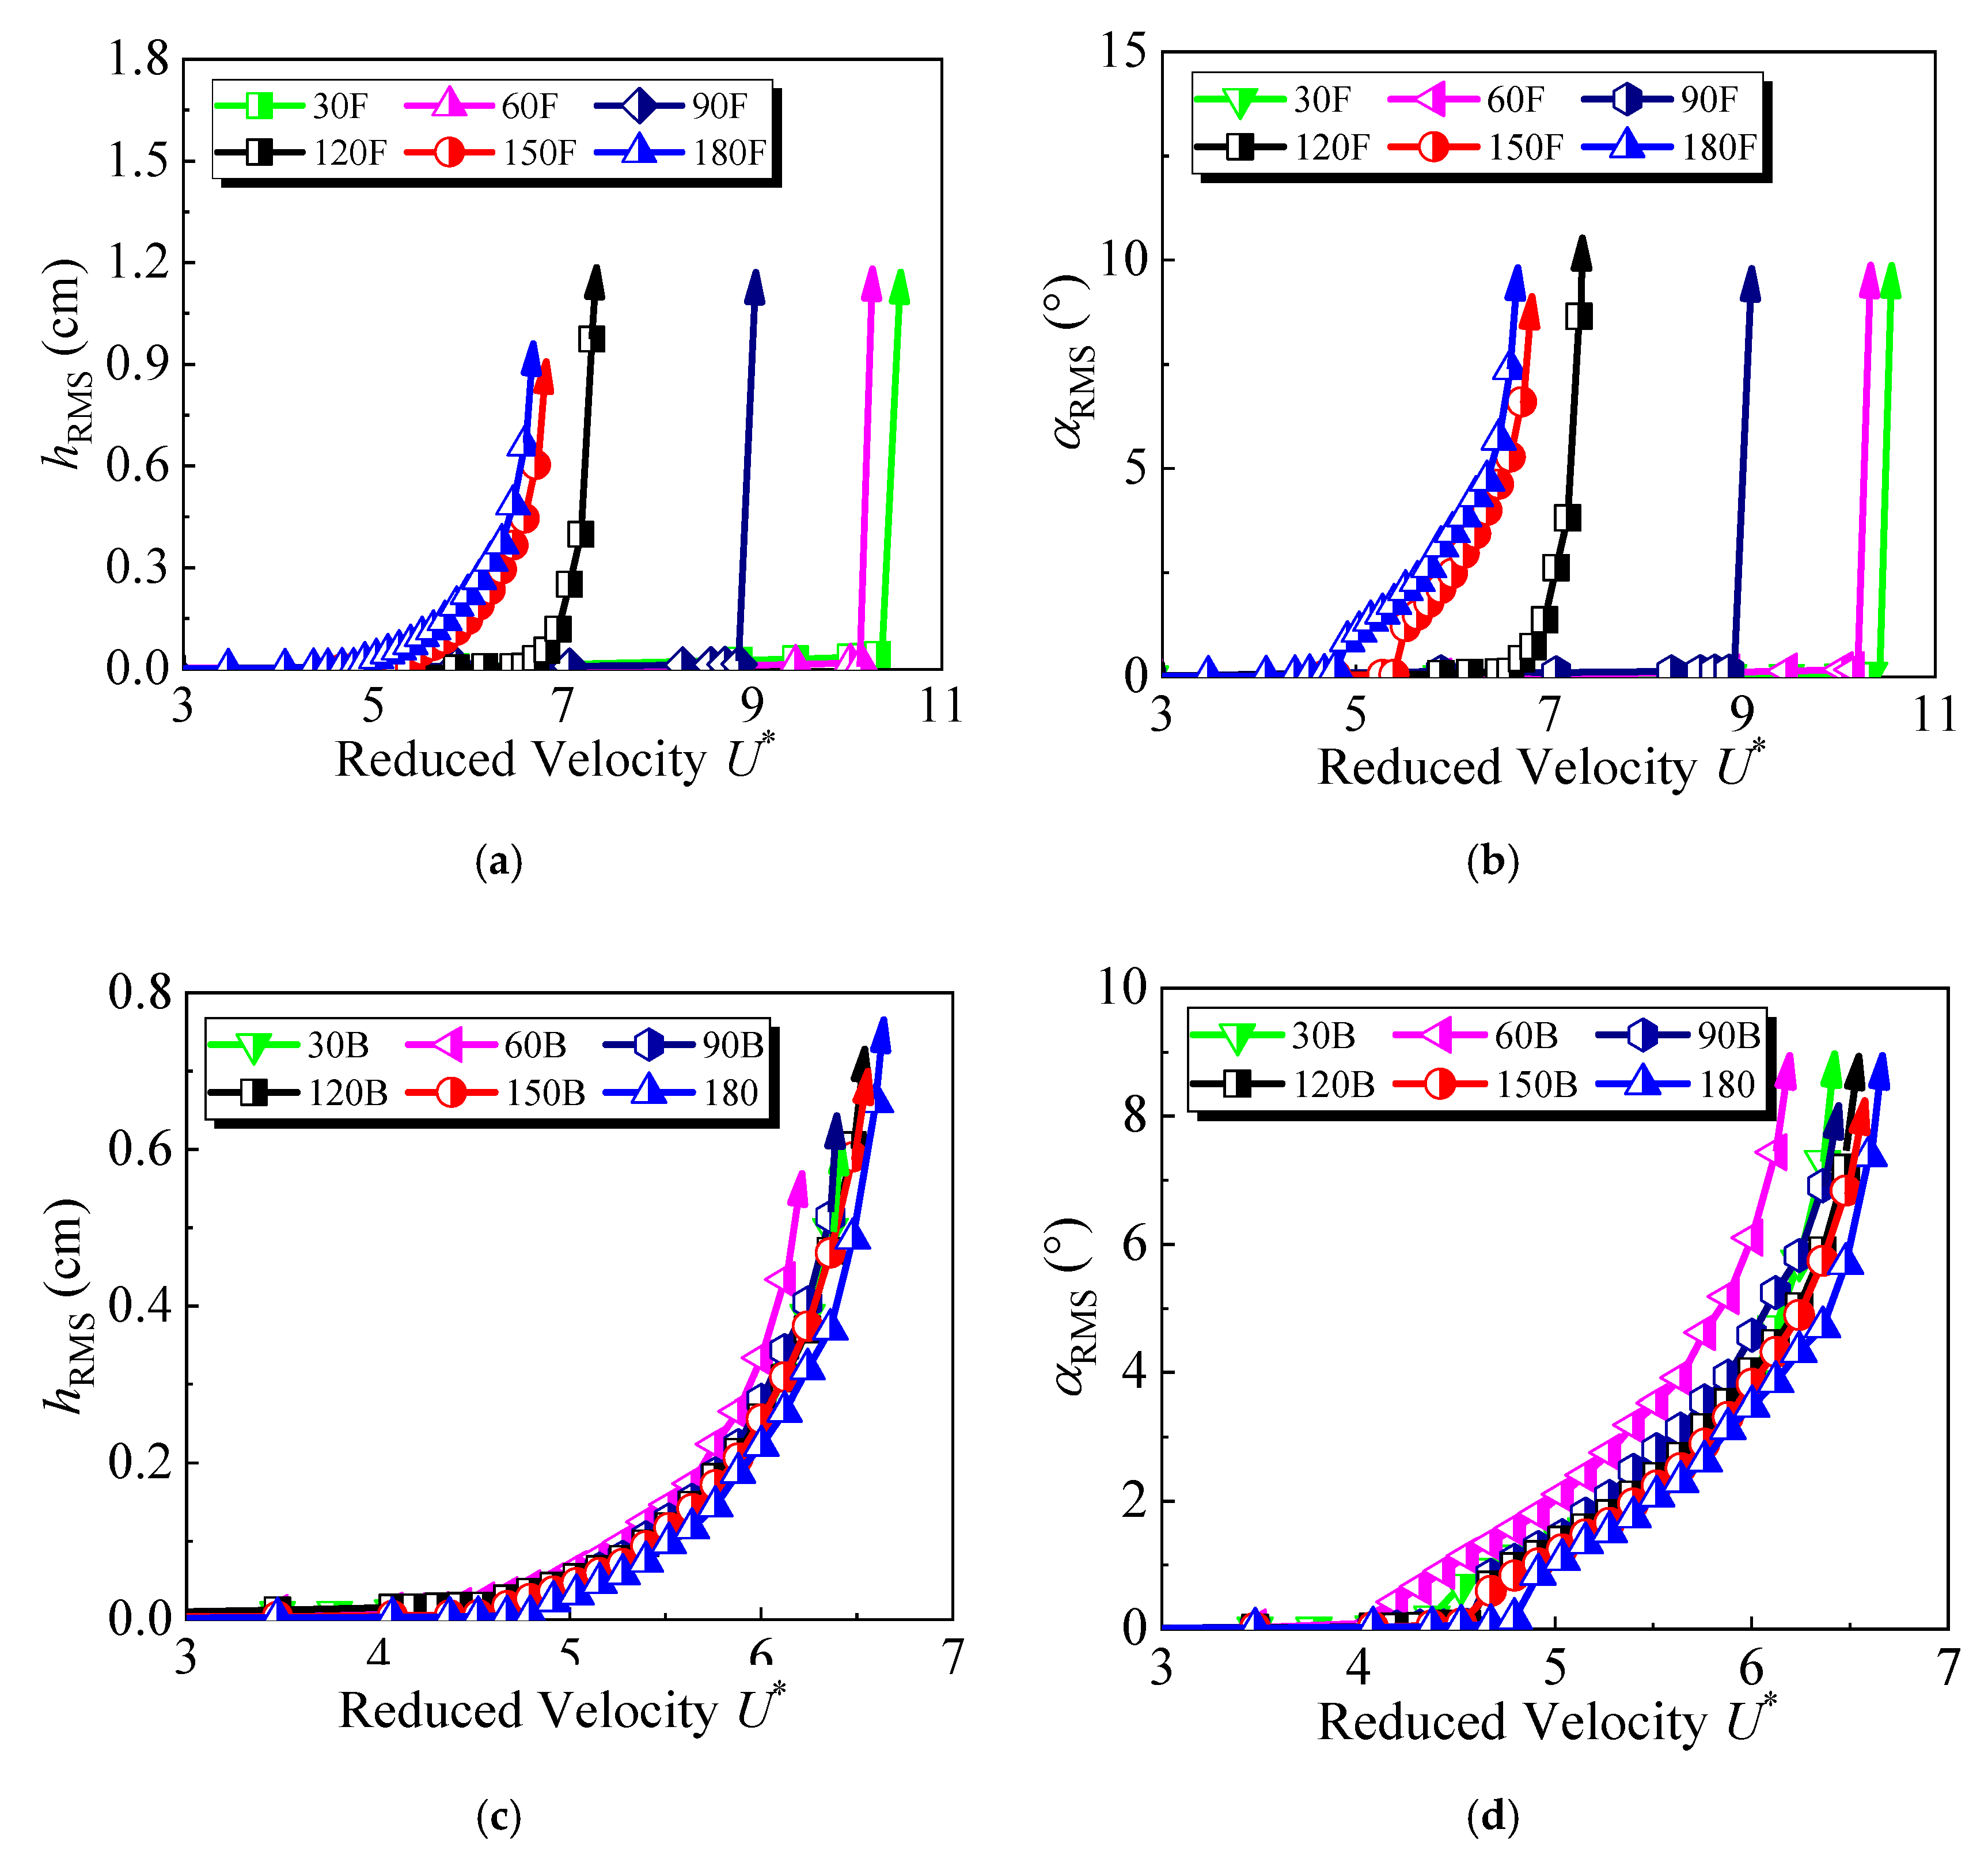
To explore the differences between the classical flutter and postflutter limit cycle vibrations, all cases with different aerodynamic configurations were conducted at an attack angle of 0°. The relationship between the mean square root of flutter responses and reduced wind speeds were given in Figure 5. The reduced wind speeds can be calculated as
where is real wind speed, is the torsional natural frequency, and is the width of the sectional model.
It should be noted that the relationship was obtained by changing the inflow wind speed continuously from 0 m/s, and the sectional model was not disturbed by any initial perturbation.
In Figure 5, it can be seen that the shape of the leading edge had an obvious influence on flutter behavior. For the case of L30 with a streamlined leading edge, when the reduced wind speed exceeded a critical value , the vibration amplitude of the sectional model grew rapidly and even diverged. By contrast, for the case of L180 with a bluff leading edge, the flutter critical reduced wind speed decreased significantly to , compared with the L30 case. When the inflow velocity exceeded the critical wind speed, the vibration did not diverge rapidly. Instead, it kept its stable status, i.e., postflutter limit cycle oscillation. The stable LCO amplitude increased as the wind speed increased.
Moreover, the shape of the trailing edge had a much smaller effect on flutter behavior. When the leading-edge section was a bluff rectangle, the flutter behaviors were all characterized by the postflutter LCO, and the shape of the trailing edge slightly changed the critical wind speed and the wind speed range in which LCO occurred. The flutter critical reduced wind speed increased from for the case of T30 to for the case of L180.
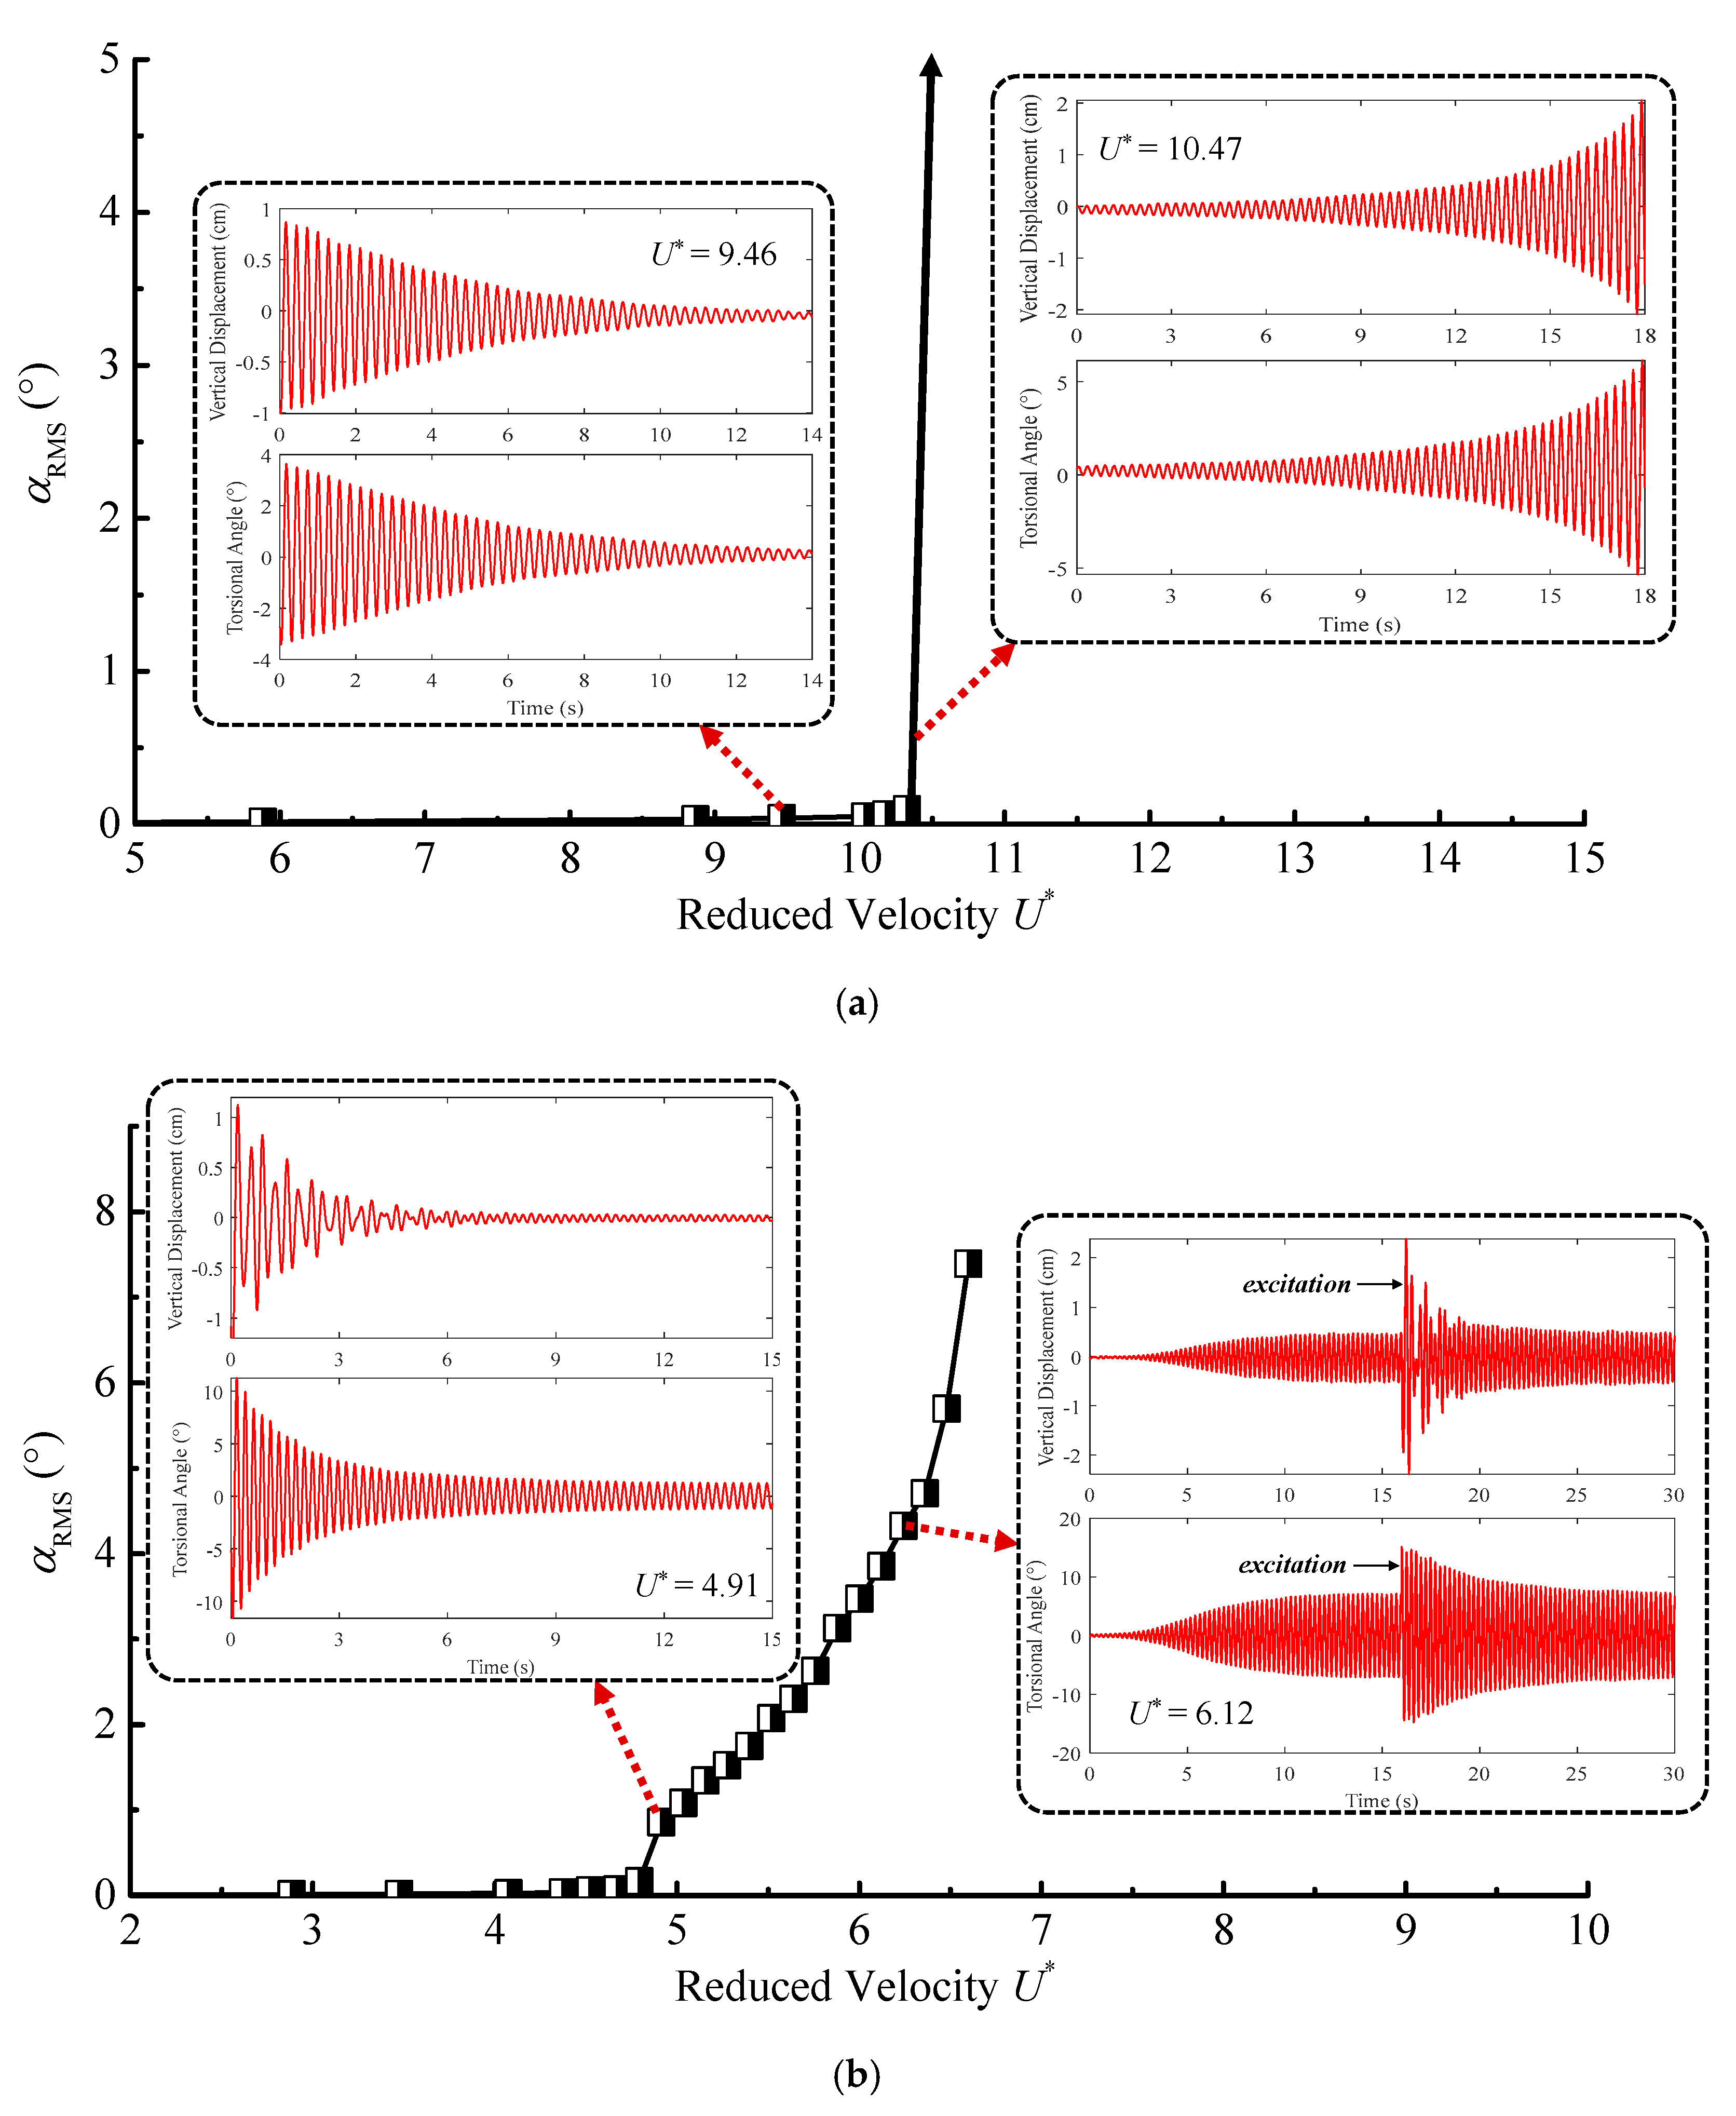
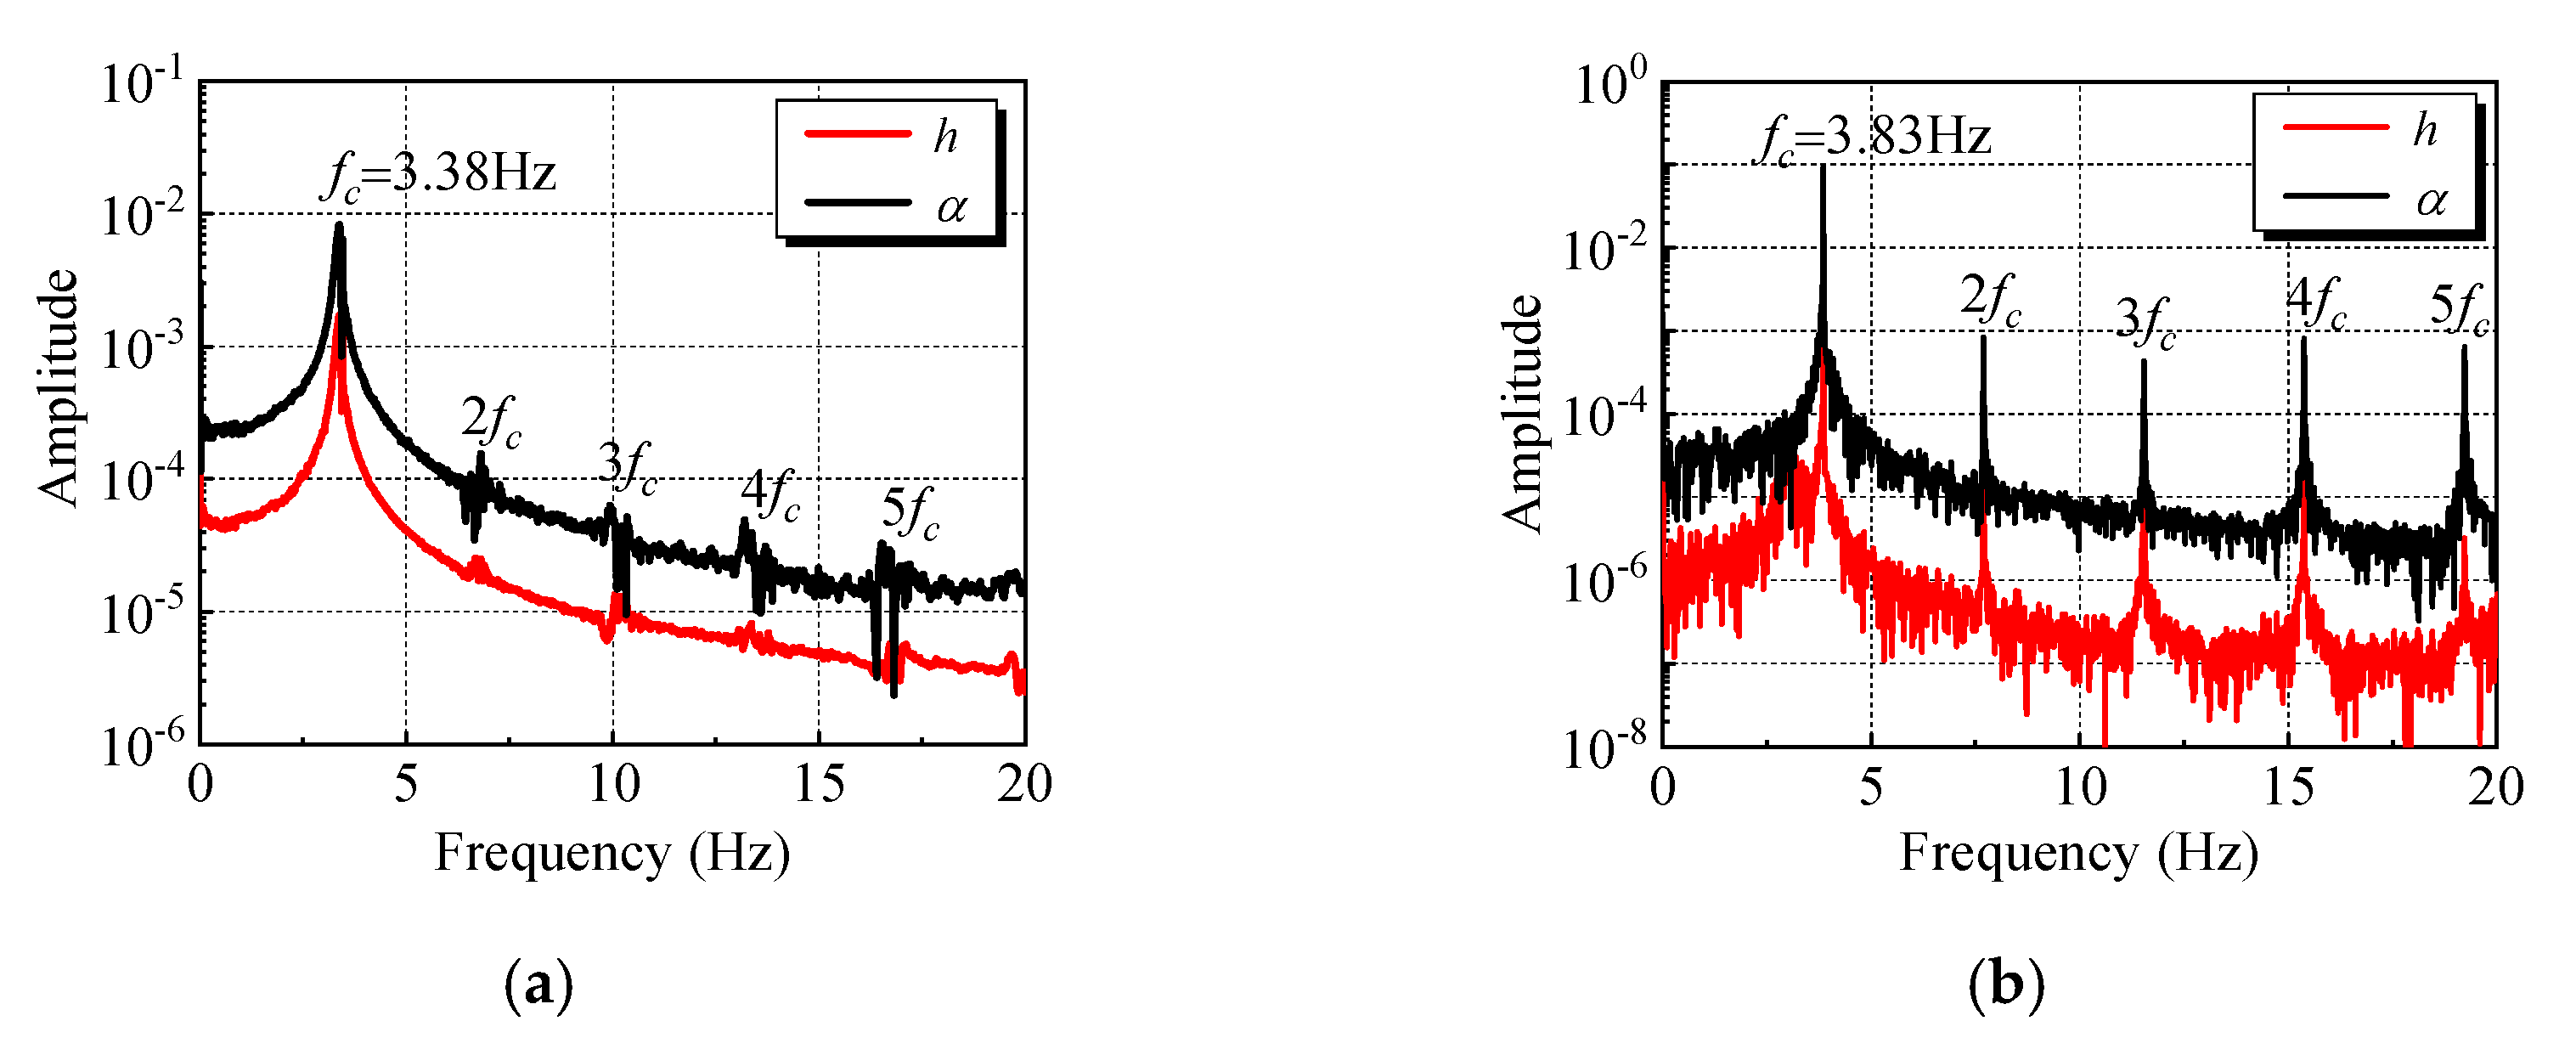
The displacement histories at different development stages of the two kinds of flutter and corresponding frequency spectrums are displayed in Figure 6 and Figure 7. The frequency spectrums were obtained based on the Fast Fourier Transform method.
For the classical flutter, the amplitude of flutter increased rapidly and the vibration tended to be unsteady as the development of flutter when the inflow velocity exceeded the flutter critical wind speed. However, for the postflutter LCO, a steady vibration with a stable amplitude occurred, regardless of how large the initial disturbance was when the wind speed was larger than the critical wind speed.
For the two kinds of flutter, the dominant vibration frequencies were both coupled in vertical and torsional degrees of freedom. The coupling frequency for the case L30 was closer to the vertical natural frequency than for L180. It can be inferred that the torsional degree of freedom made more contributions for the postflutter LCO than for the classical flutter. Moreover, a definite frequency multiplication phenomenon was observed in the frequency spectrums of both kinds of flutter, which was a typical feature of nonlinear oscillations. The frequency multiplication of the postflutter LCO was much more remarkable than the classical flutter, which indicated that the nonlinear extent of postflutter LCO was higher than the classical flutter.
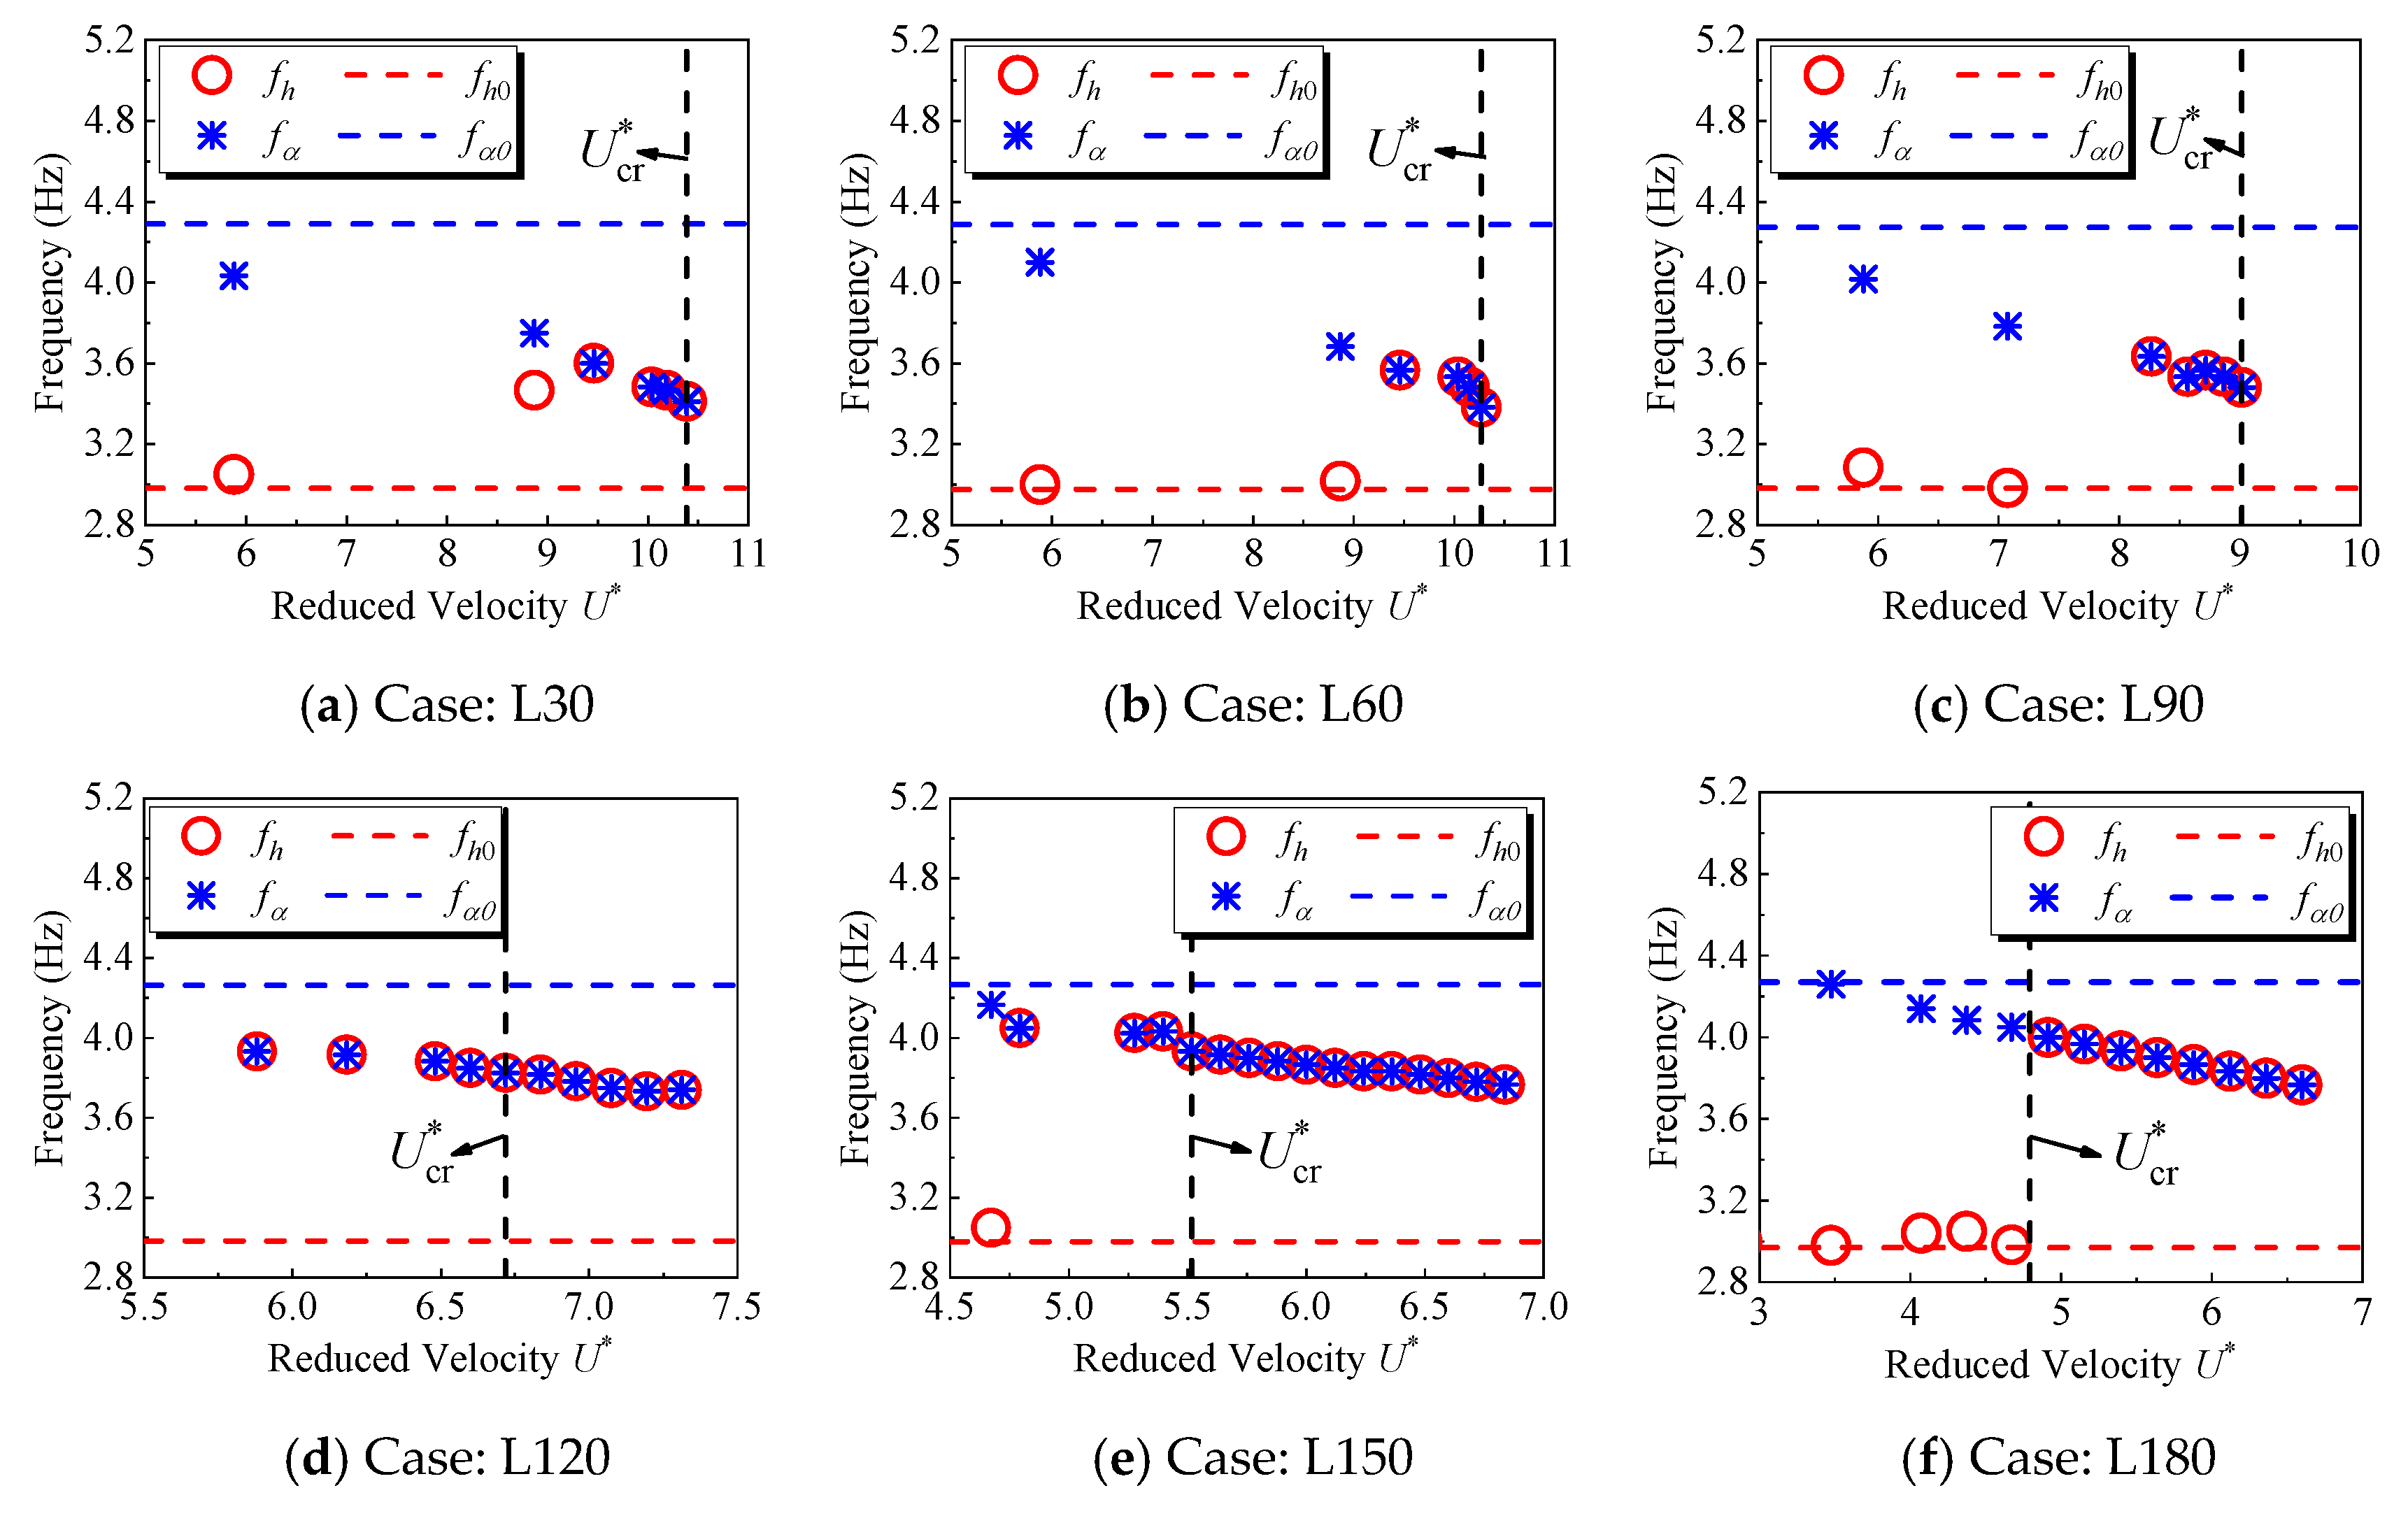
The extent of vertical–torsional coupling is an important characteristic of different flutter types. The differences in vertical–torsional coupling characteristics between two kinds of flutters were explored further by comparing the frequency domain characteristics and ratio of the vertical–torsional amplitude. The vertical and torsional dominant frequencies of flutter vibration are displayed and compared with the natural frequencies of the dynamic system in Figure 8. For the two kinds of flutter, the vertical and torsional dominant frequencies were both separated and closed to the corresponding natural frequencies when the inflow velocity was low at the flutter critical wind speed. When the flutter occurred, the dominant frequencies of the vertical and torsional degree of freedom were both coupled between vertical and torsional natural frequencies and decreased to the vertical natural frequency as the inflow velocity increased. However, compared with the classical flutter, the coupled dominant frequency of postflutter LCO was close to the torsional natural frequency, which indicated that the participation level of the torsional degree of freedom was higher in the postflutter LCO than in the classical flutter. The vertical degree of freedom played an important role in both kinds of flutter as the inflow velocity increased.
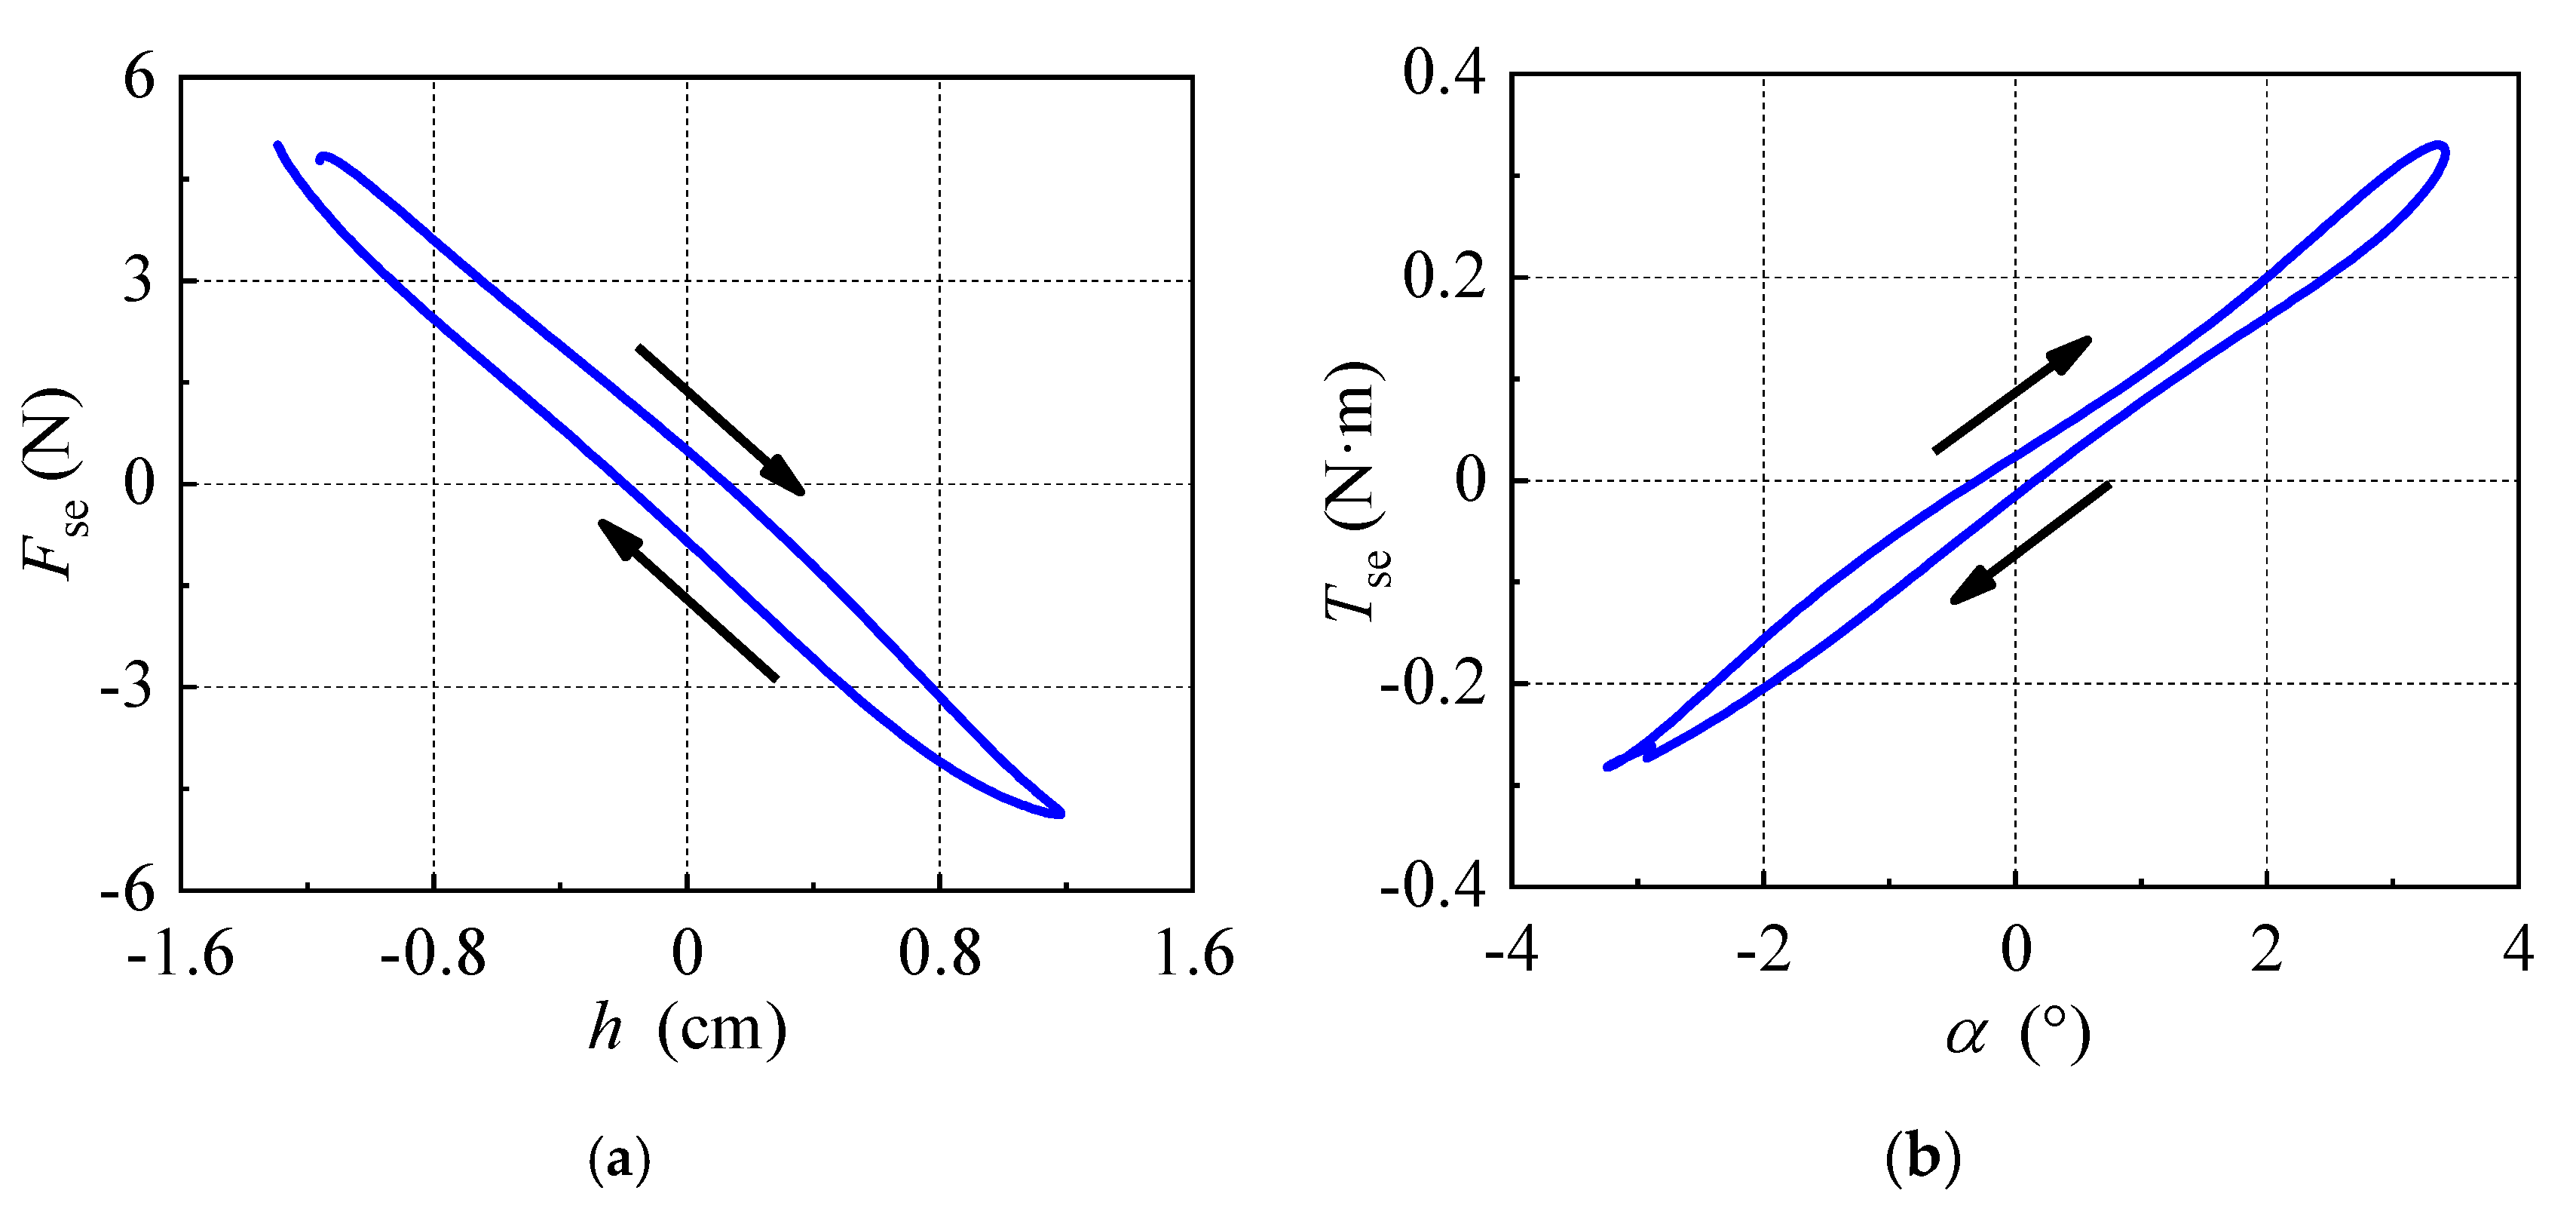
3.2. Hysteresis of Unsteady Aerodynamic Forces
The aerodynamic force versus displacement curve, named the “aerodynamic hysteresis curve”, can be obtained when displacements are regarded as horizontal ordinates, and the self-excited forces are regarded as longitudinal coordinates. The aerodynamic hysteresis curve describes the relationship between aerodynamic self-excited forces and the motion state, reflecting the path and magnitude of the work done by self-excited forces. For a given aerodynamic hysteresis curve in a single period, the work done by self-excited forces in the period can be expressed as follows:
where and represent the work in a vibration period done by the aerodynamic self-excited forces on the vertical and torsional degrees of freedom, respectively. The direction of the circumferential integral path determines the sign of and .
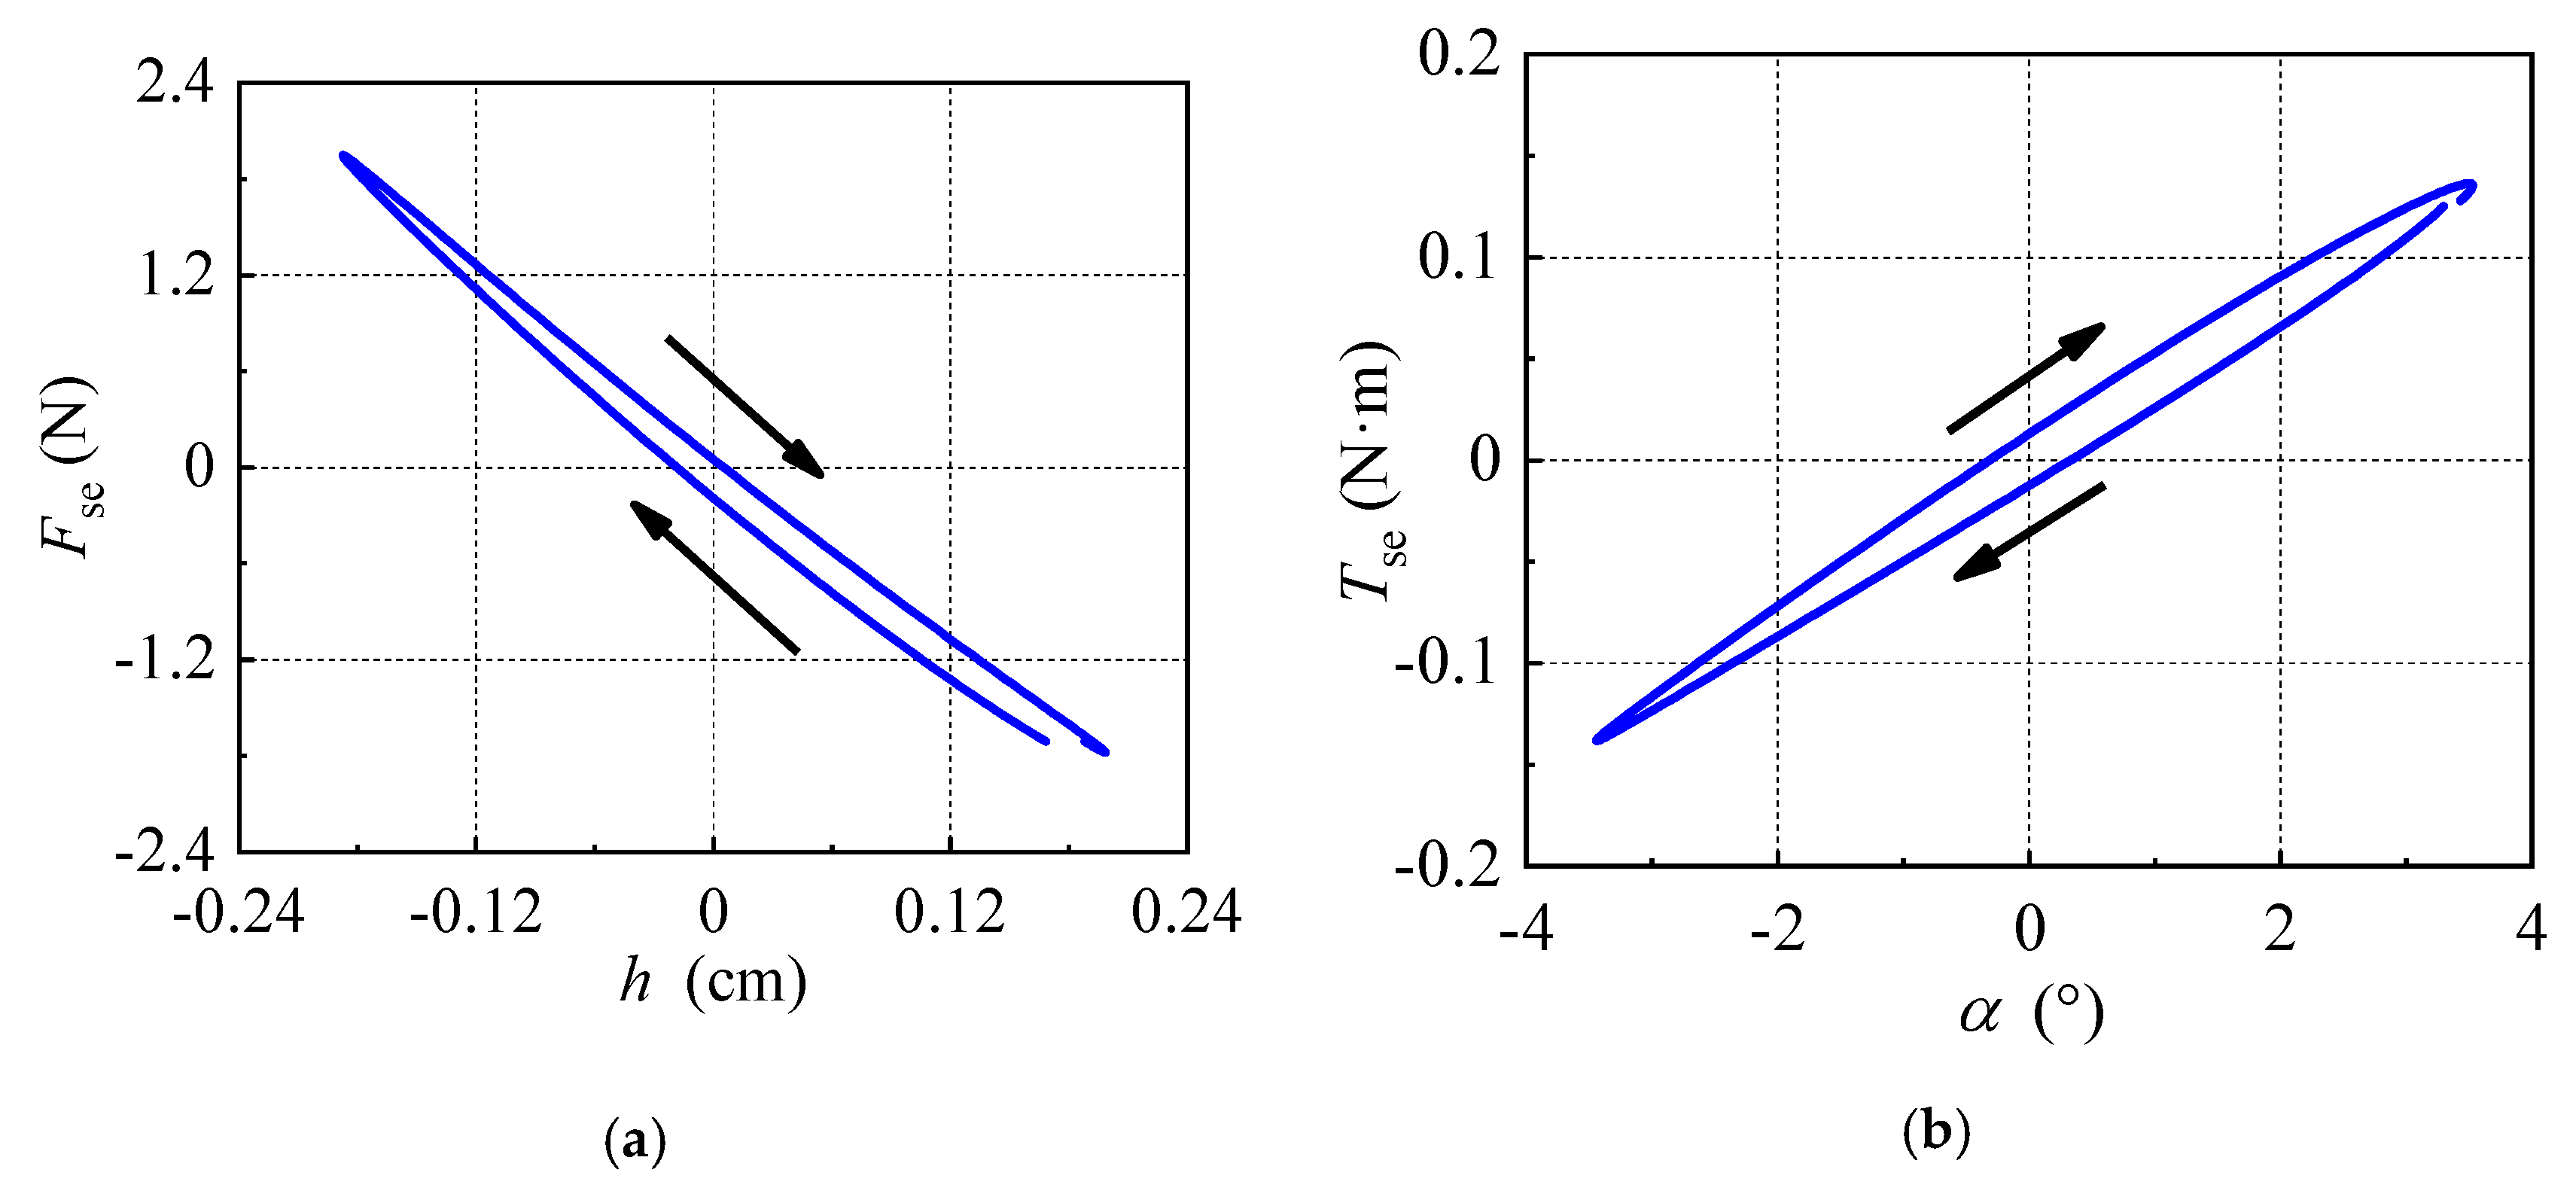
The aerodynamic hysteresis curves of two kinds of flutter were displayed in Figure 9 and Figure 10. For the two kinds of flutter, it can be seen that the aerodynamic hysteresis curve both formed a long and narrow annular region and rotated clockwise, which indicated the positive work done by the vertical and torsional self-excited forces in Equation (5). The aerodynamic hysteresis curve was formed by the vertical self-excited force, wherein displacement had a major distribution in the second and fourth quadrants. Nevertheless, the aerodynamic hysteresis curve formed by the torsional self-excited force and displacement mainly distributed in the first and third quadrants. It can be inferred that the vertical self-excited force and displacement were opposite in the phase while the torsional self-excited force and displacement were close in the phase.
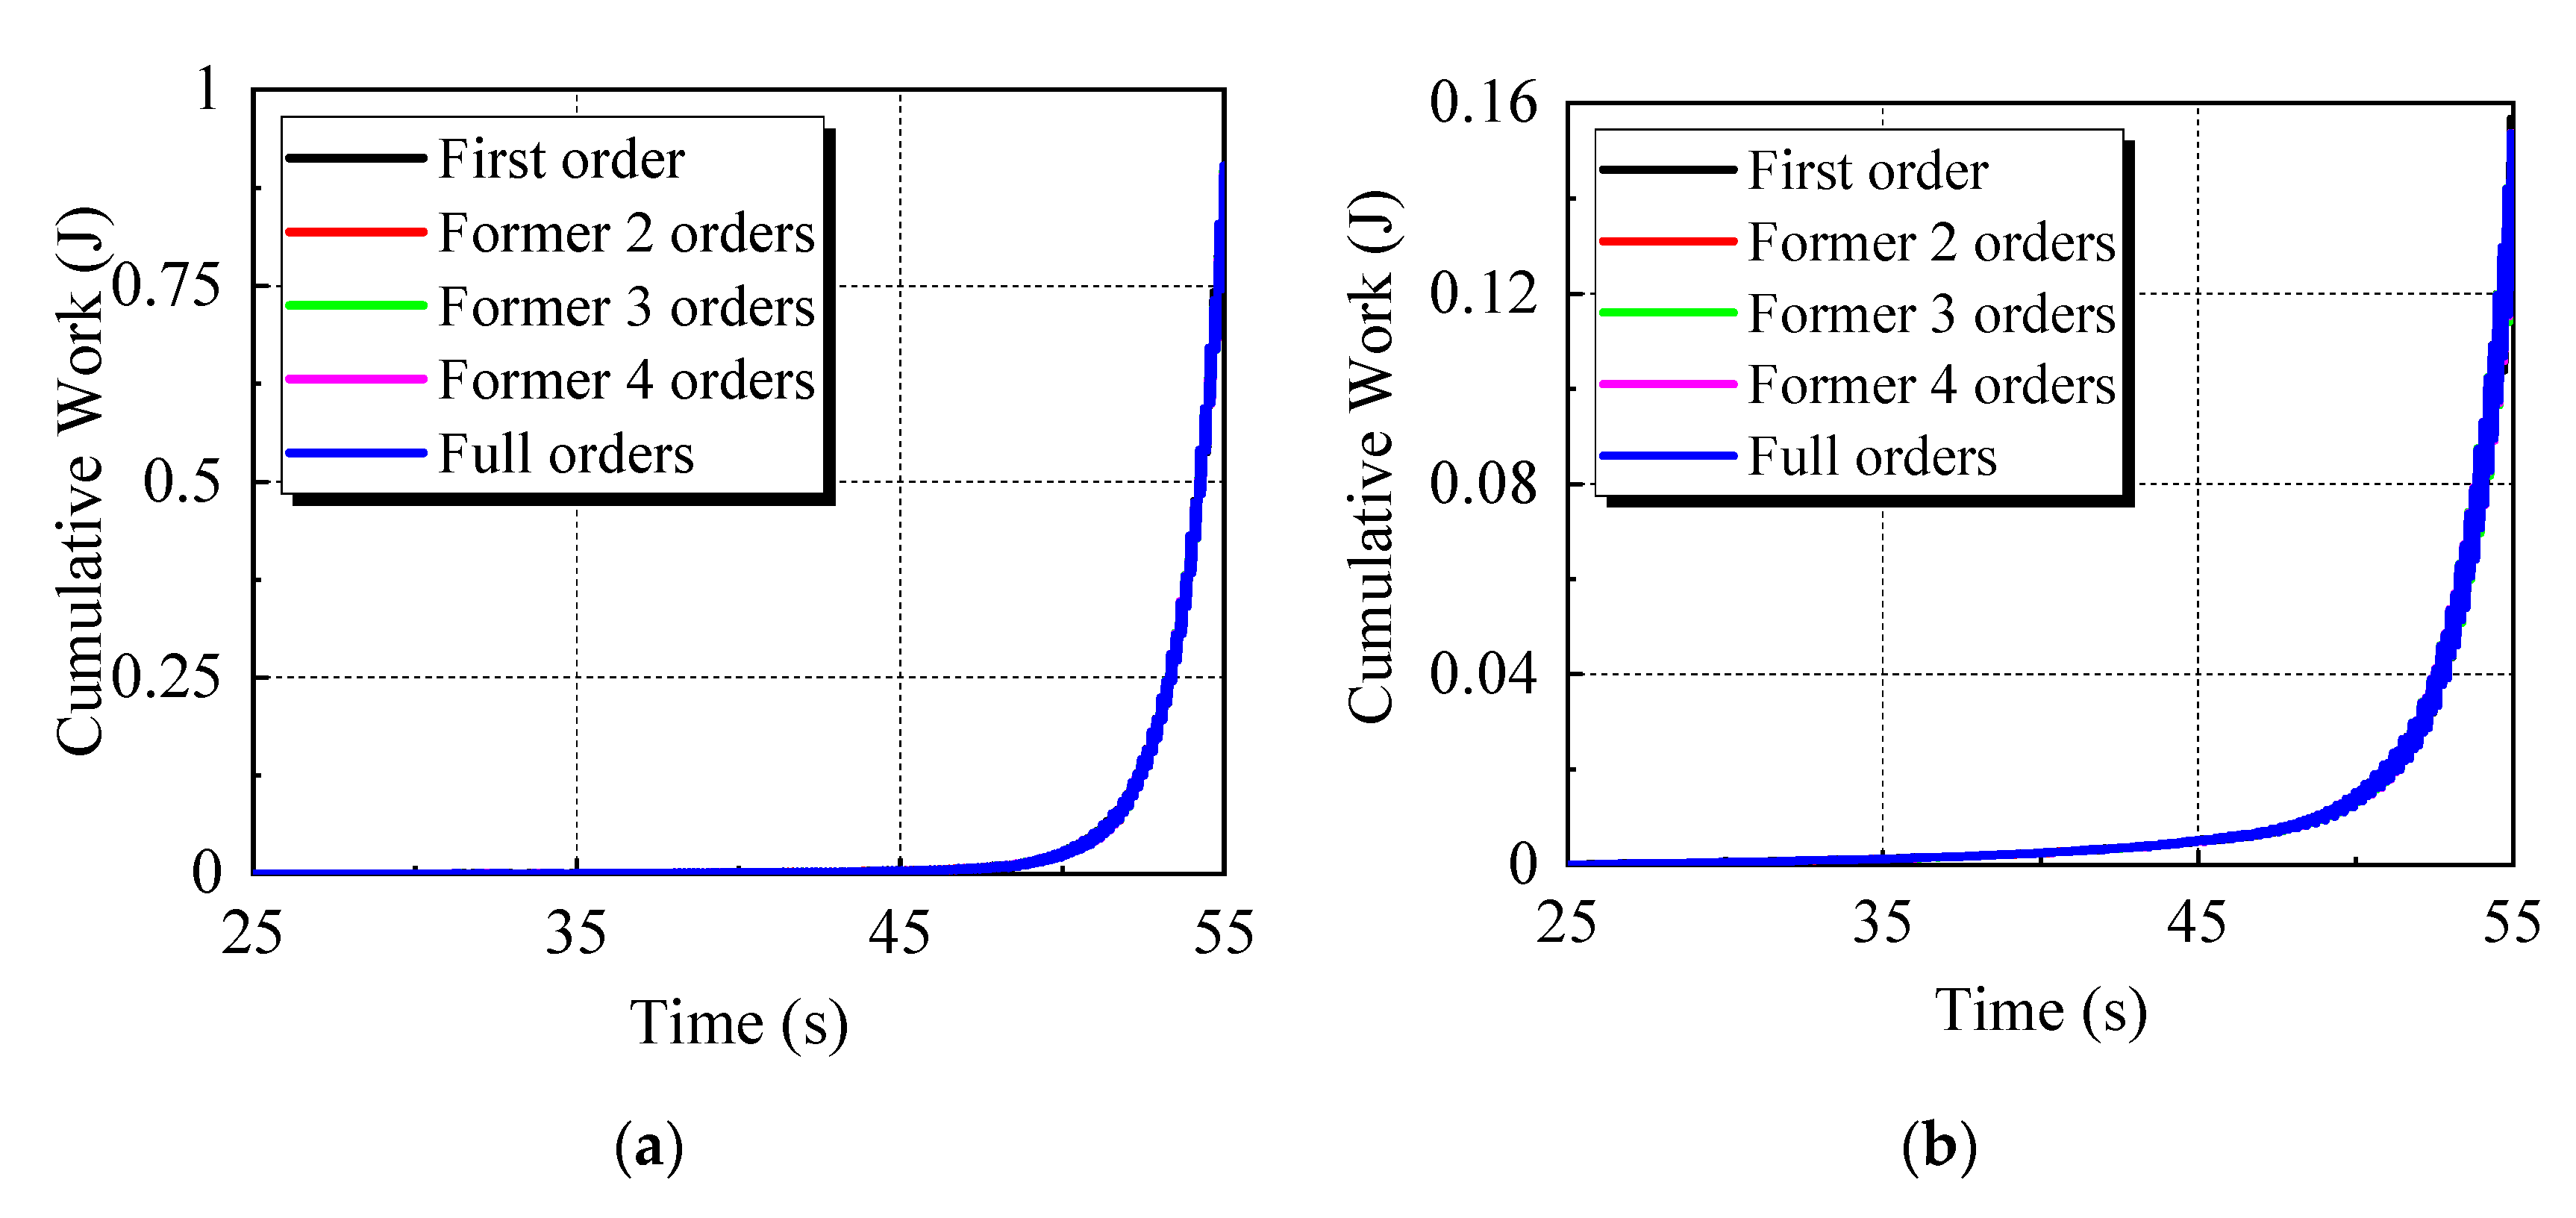
3.3. Work Analysis of Unsteady Aerodynamic Force
For the spring-suspended dynamic system, the cumulative work from to done by the aerodynamic self-excited forces when flutter occurred can be calculated as
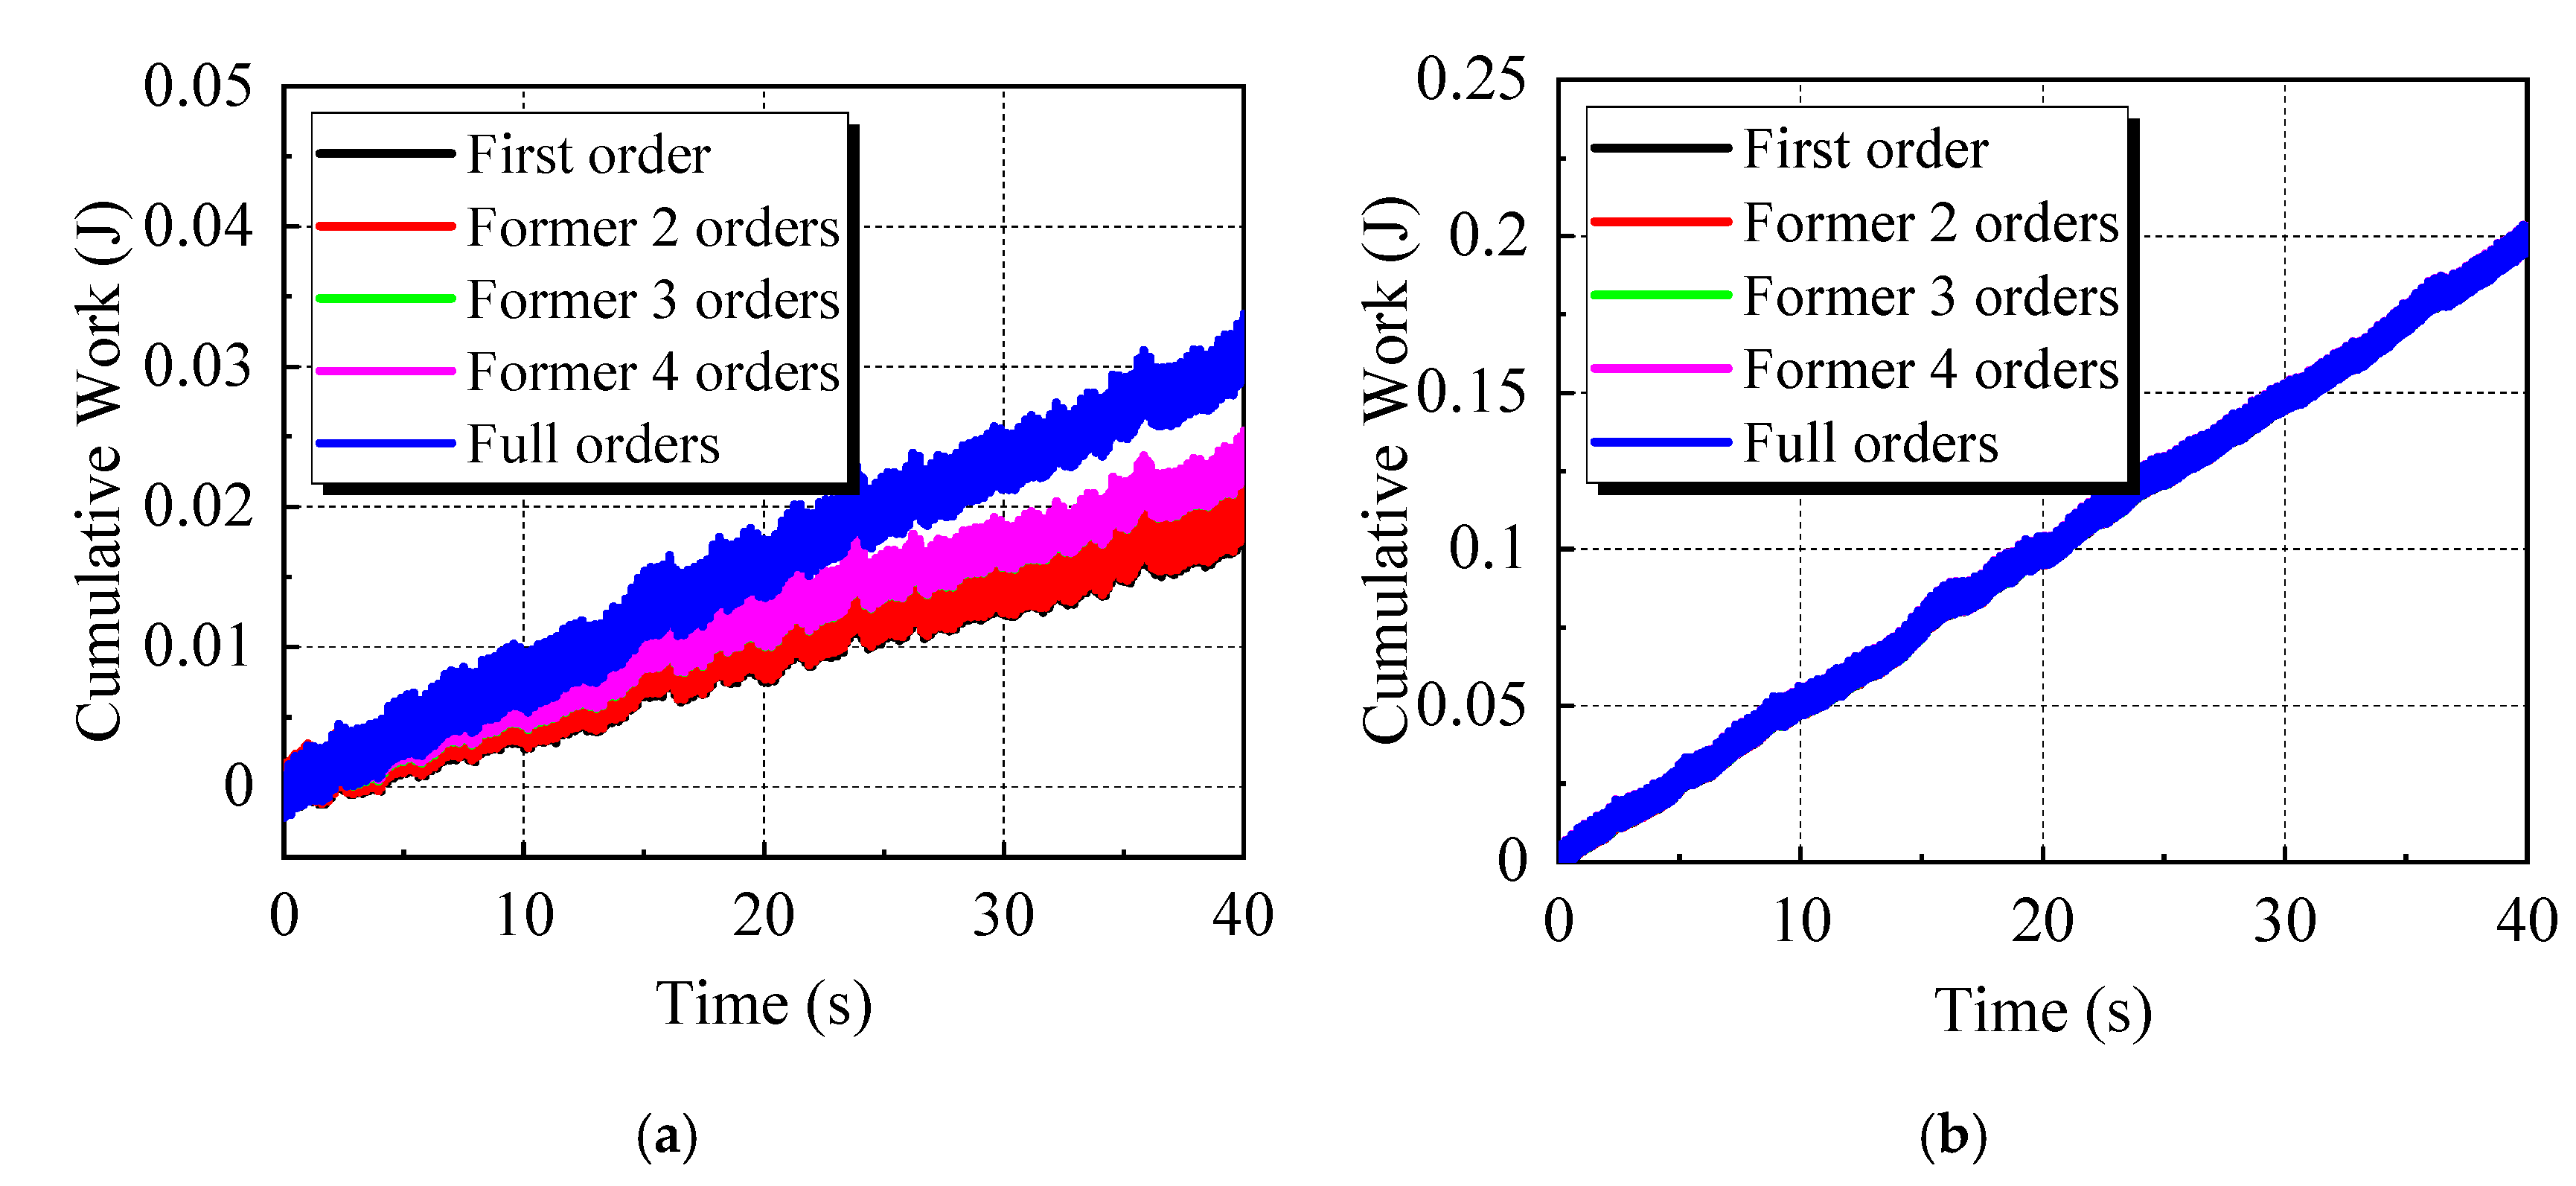
The cumulative work histories on the two degrees of freedom done by aerodynamic self-excited forces for the two kinds of flutter were displayed in Figure 11 and Figure 12. The self-excited forces and displacements were processed by a low-pass filter with different cut-off frequencies. Then, the first-order and higher-order harmonic components of the cumulative work were obtained.
The work done by the first-order component of the self-excited force was the largest. Yet the higher-order components of the self-excited force provided little energy input to the dynamic system. For the classical flutter, the cumulative work done by vertical and torsional self-excited forces both increased exponentially over time. The cumulative work done by vertical self-excited forces was much bigger than that of the torsional self-excited force, which indicated that the vertical degree of freedom had the main effect on the classical flutter. By contrast, for the postflutter LCO, the cumulative work on vertical and torsional degrees of freedom increased almost linearly. The cumulative work done by the vertical self-excited force was much smaller than the torsional self-excited force. It can be inferred that the torsional degree of freedom was the dominant mode in the postflutter LCO.
The aerodynamic hysteresis phenomenon during flutter resulted in a phase difference between vibration displacements and aerodynamic forces. This reflected the work characteristics of aerodynamic self-excited forces. The relationship of the work done by aerodynamic self-excited forces and the phase difference between vibration displacements and aerodynamic forces would be deduced further by the example of a vertical degree of freedom.
When the flutter vibration was reducible to a harmonic vibration with a slow amplitude variation, the vertical displacement in a single period can be expressed as follows:
where represents the slowly varied amplitude of harmonic vibration and can be regarded as a constant in a specific period. is the coupled circular frequency of flutter vibration. Then, the vertical velocity is
Suppose the phase difference between vertical displacements and self-excited forces is
where and are the phases of vertical self-excited force and displacement, respectively. The vertical self-excited force can be written as
where is the steady component of vertical self-excited force and is the slowly varied amplitude of the unsteady component of vertical self-excited force, which is a constant in a specific period. Then the work done by the vertical self-excited force in a period can be calculated by
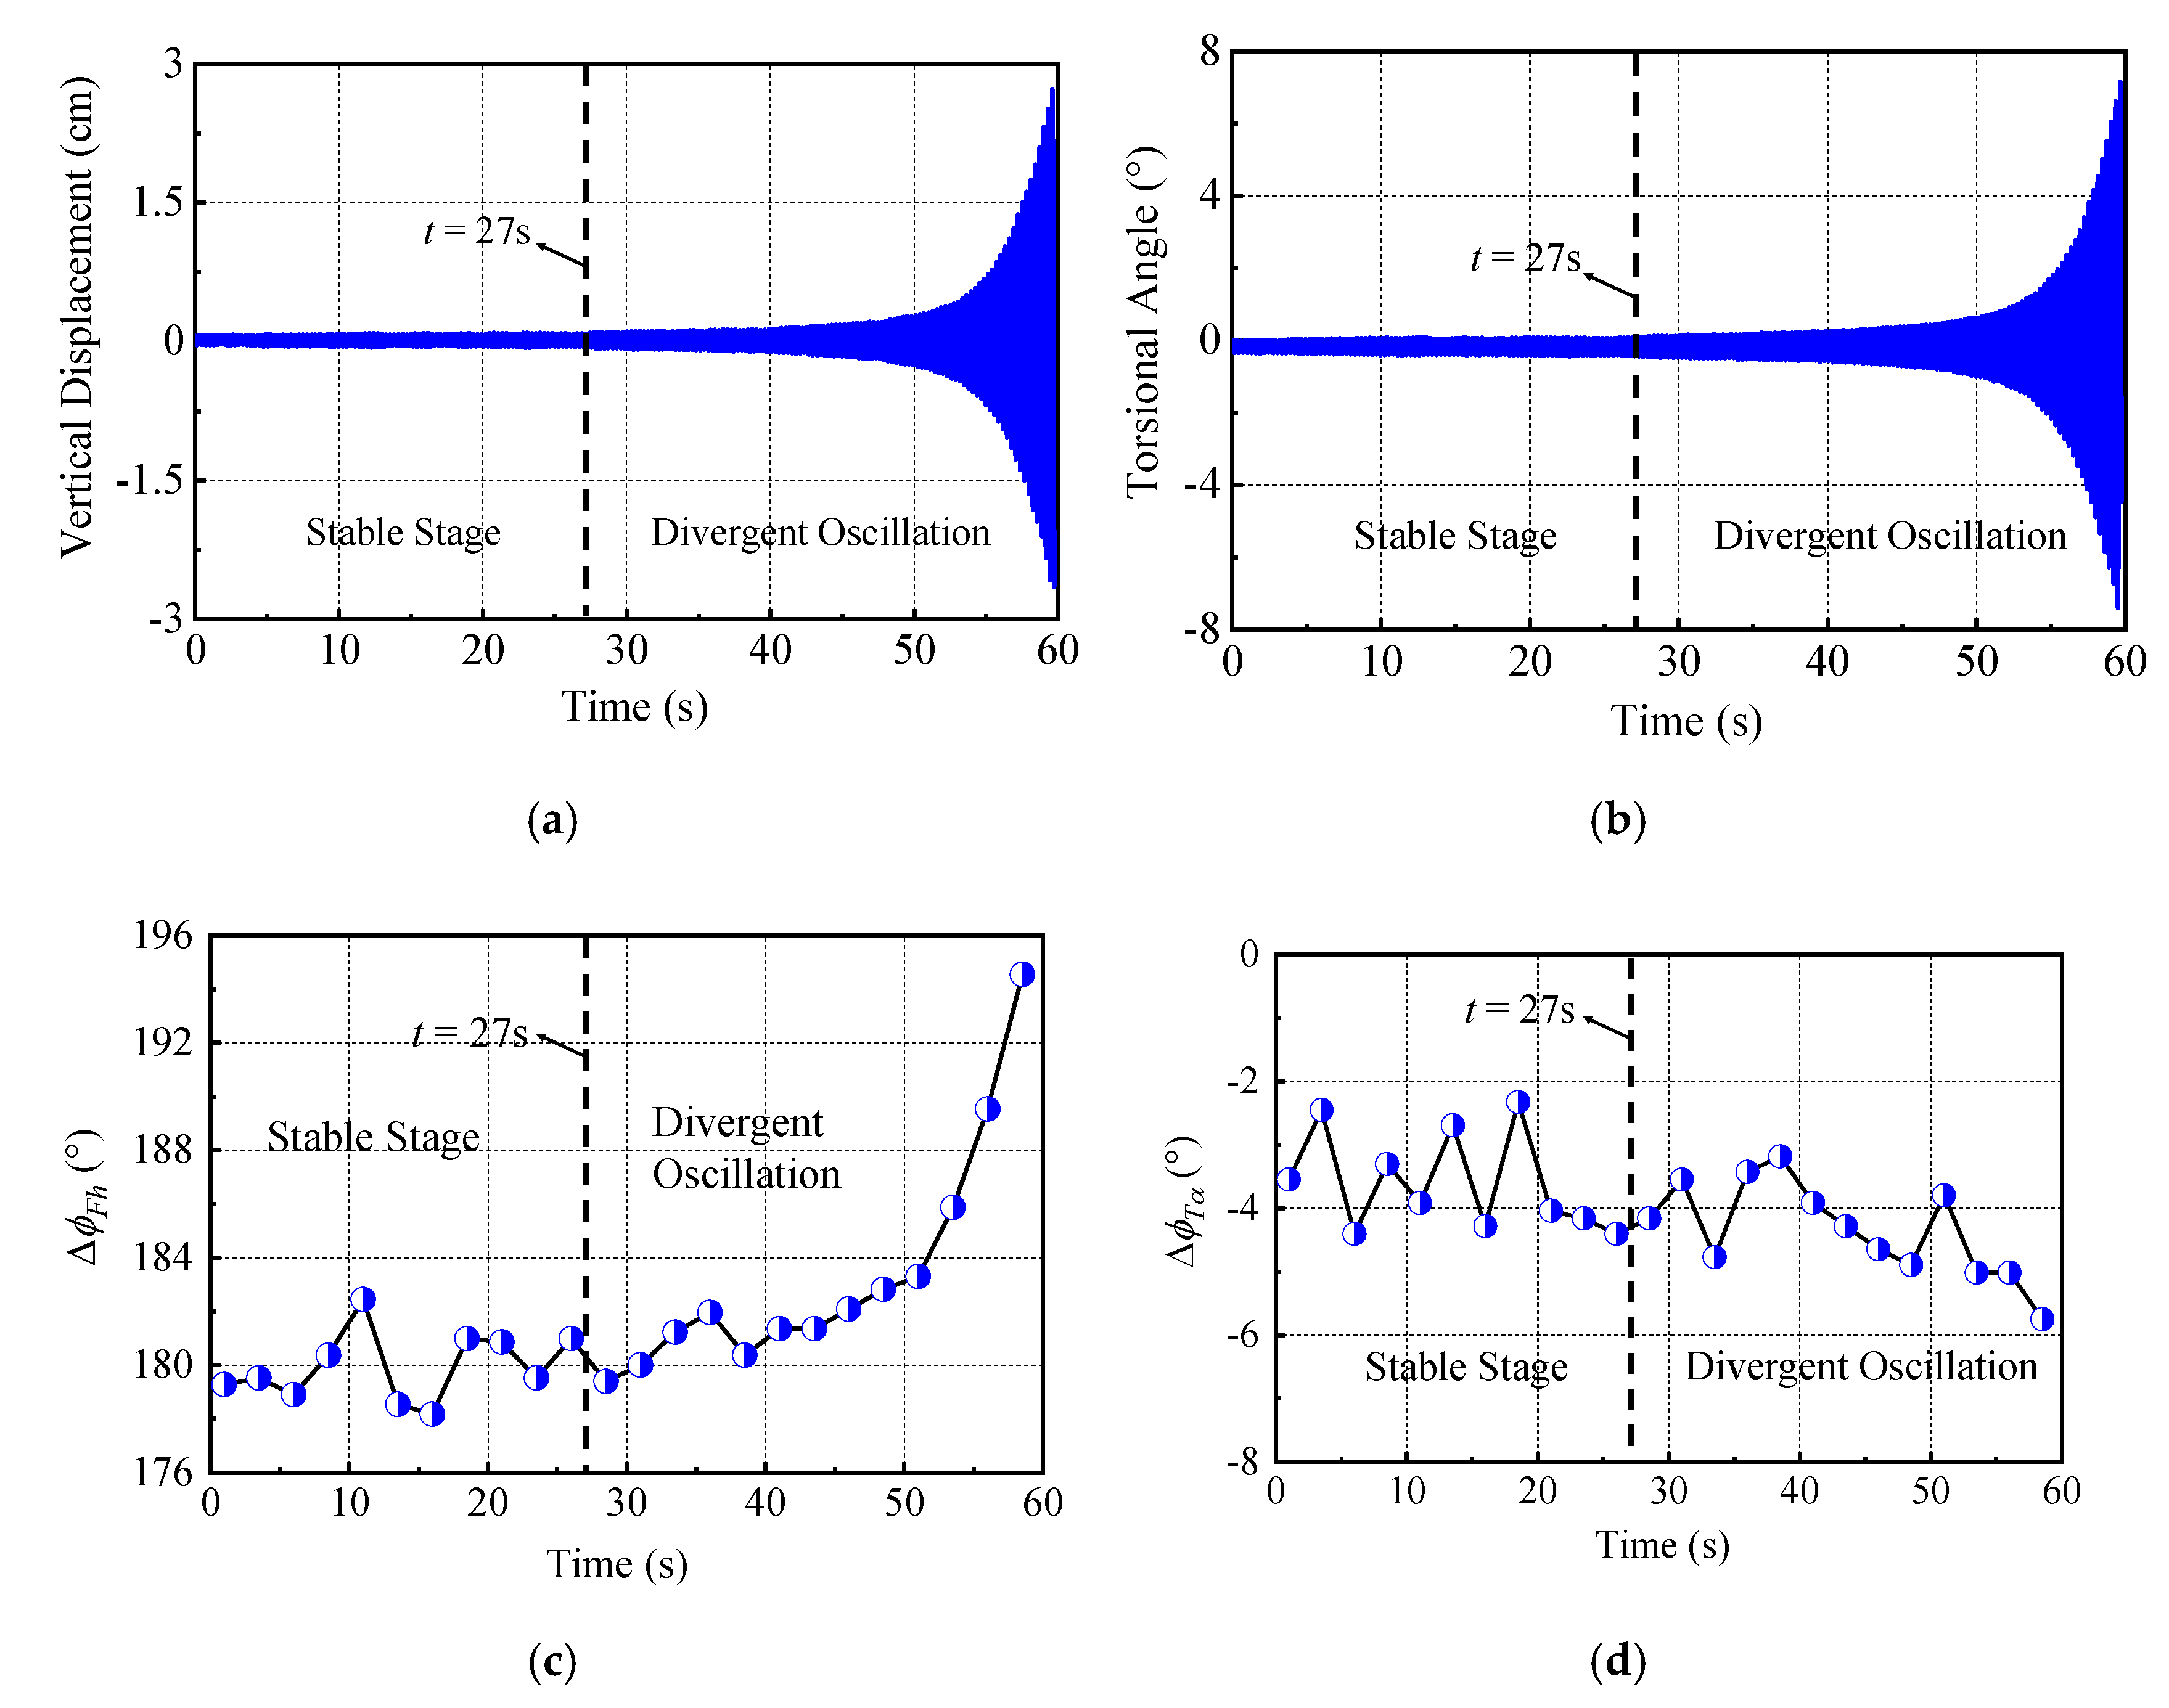
where , , and are all positive, so the sign of the work done by the vertical self-excited force is decided by the sign of . It can be seen that the phase difference between vertical displacements and self-excited forces plays a crucial role in the development of the flutter. To analyze the characteristics of aerodynamic hysteresis of the two kinds of flutter, the identification results of the phase difference in the whole flutter process is displayed in Figure 13 and Figure 14.
For the classical flutter, when the inflow velocity exceeded the flutter critical wind speed, the vertical and torsional phase differences were both unstable at the development stage of flutter, and were about 178.1 to 182.2° in the vertical degree of freedom and −2.2 to −4.4° in the torsional degree of freedom. At this stage, the work done by self-excited forces was small, and corresponding vibration amplitudes increased slowly. As the flutter evolved and increased in vibration amplitude, the vertical phase difference began to rise from 180 to 194.7° for 30 s while the torsional phase difference descended only from −3.6 to −5.8° in 30 s. This indicated that the fast enlargement of the vertical phase difference as a vibration amplitude resulted in a higher energy input in the dynamic system. Even the divergence of the dynamic system provided positive feedback.
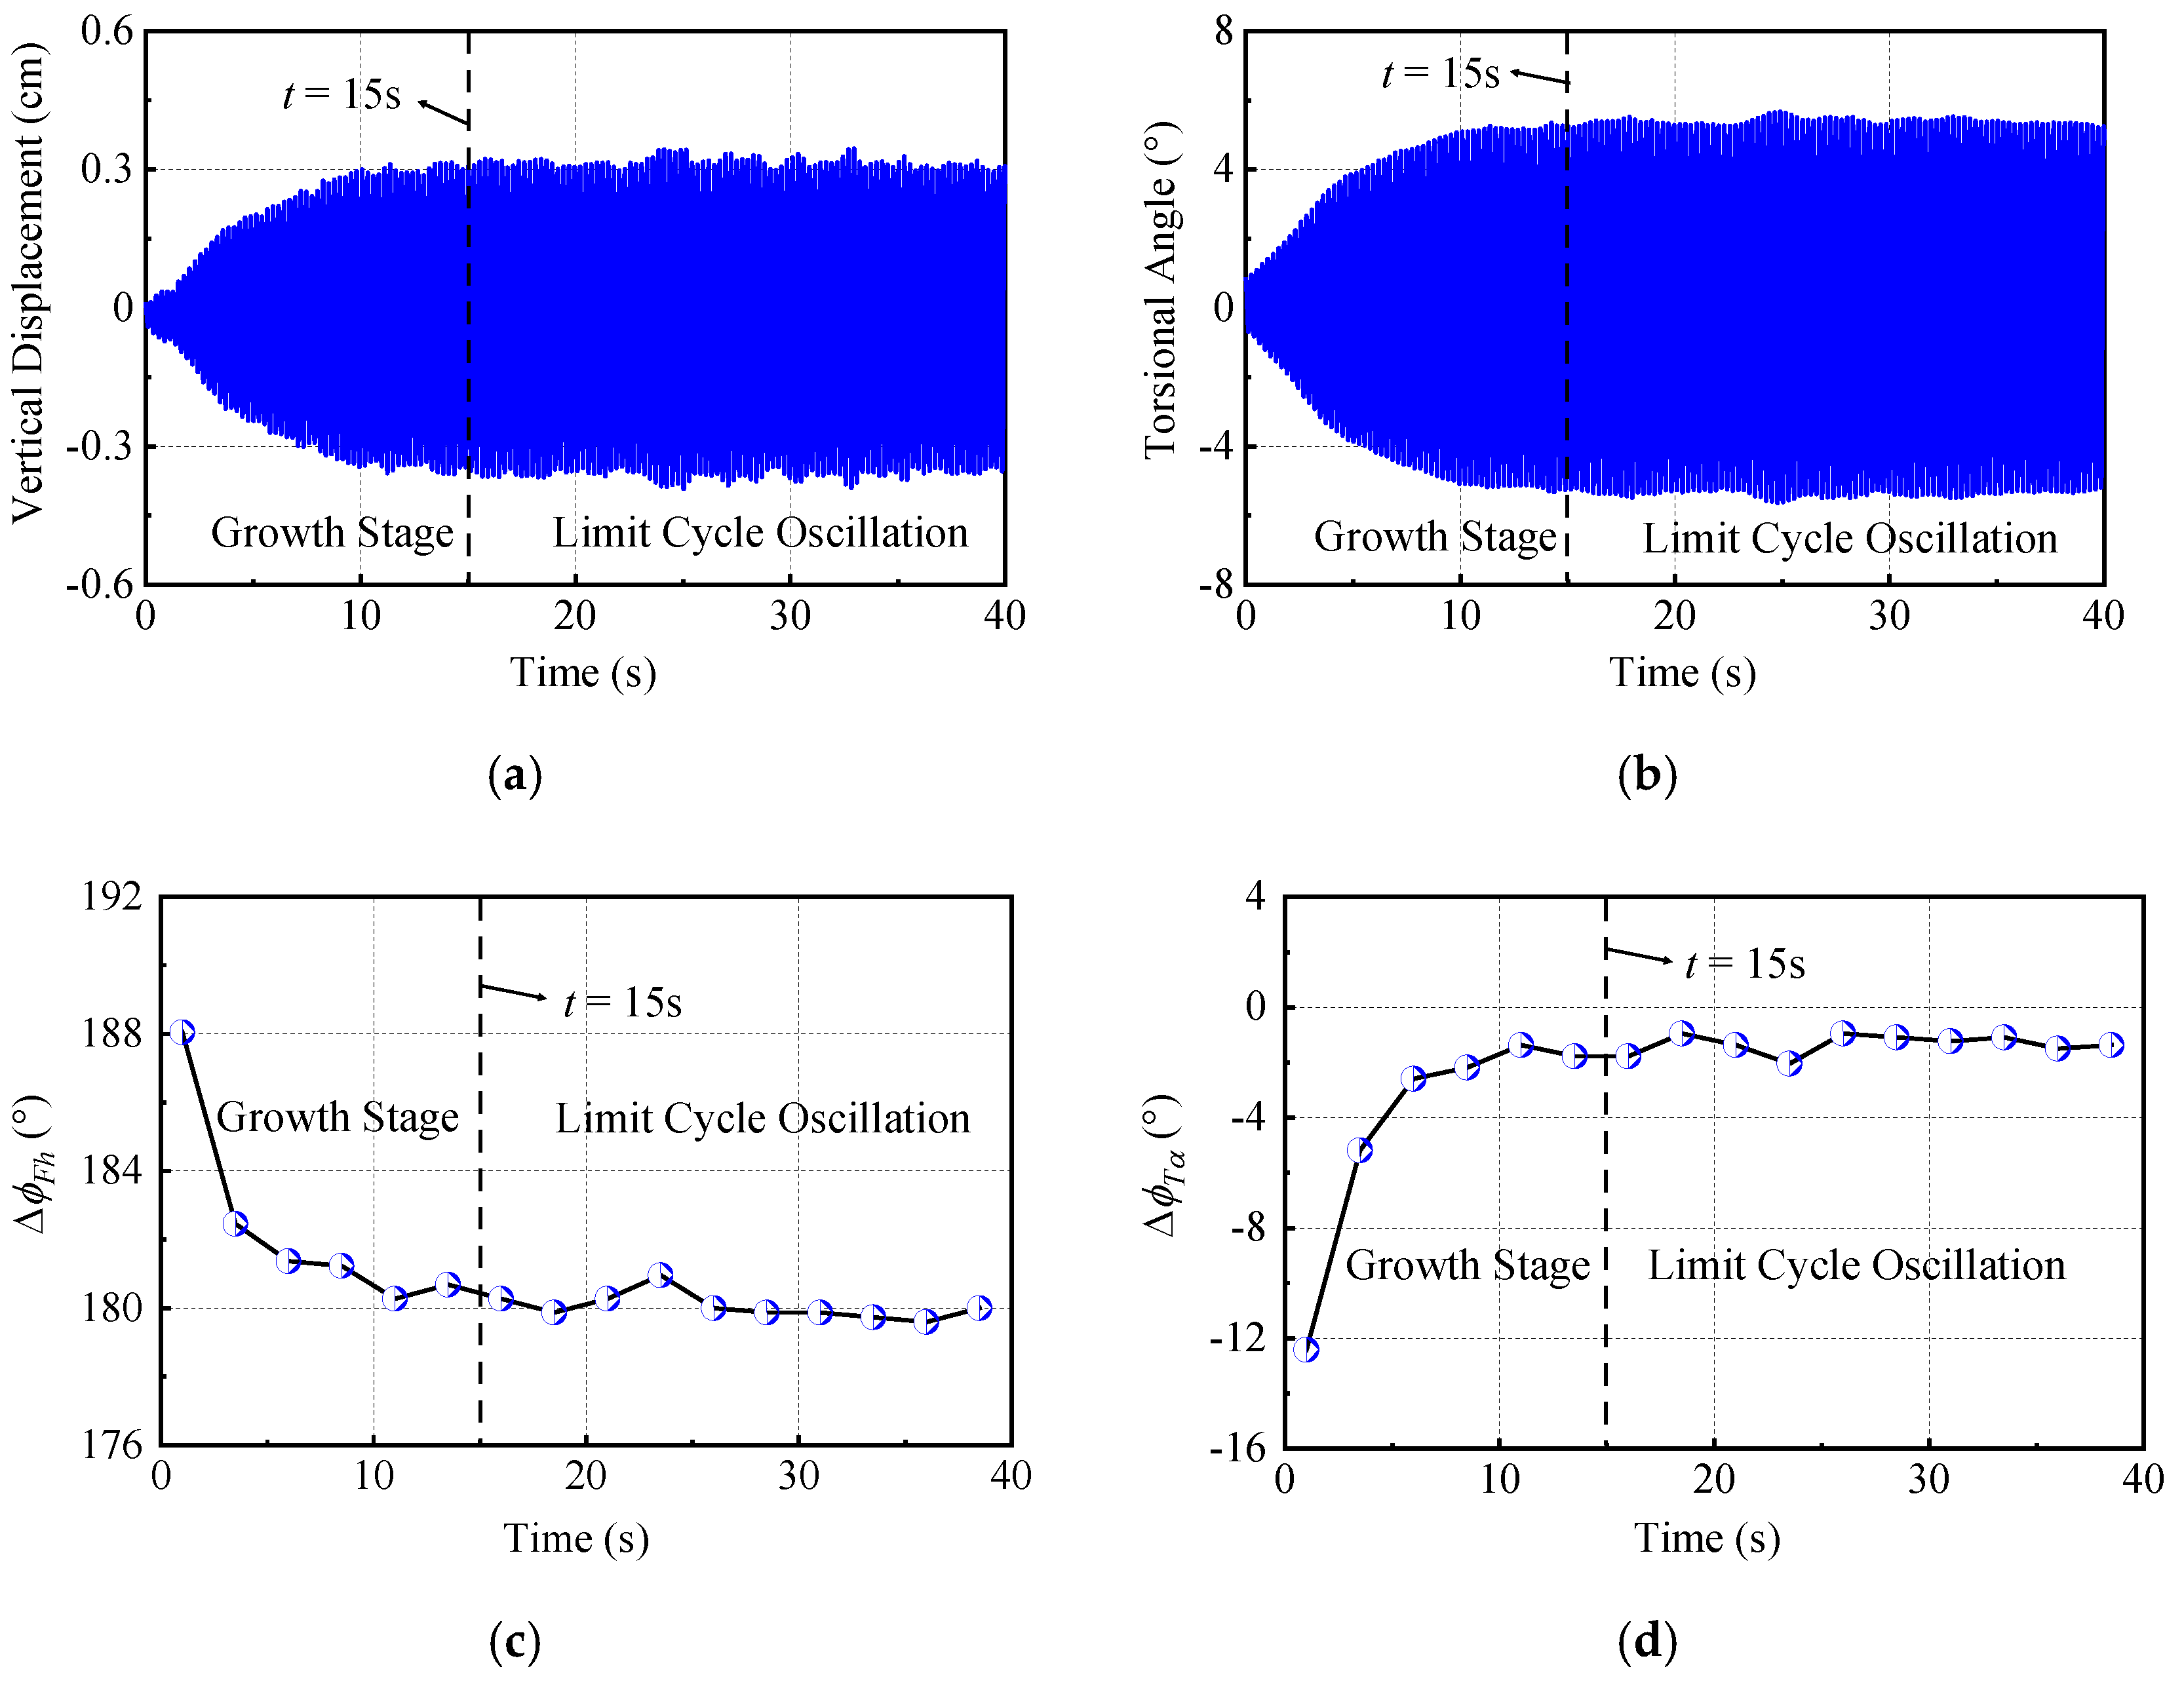
For the postflutter LCO, the changing rule of phase differences was significantly different. The radical changes of phase differences took place at the development stage of the flutter. In 15 s, the vertical phase difference descended quickly from 188.0 to 181.4° as the vibration amplitude increased. Similarly, the torsional phase difference changed from −12.1 to −2.0°. This indicated that there was a negative feedback pattern according to Equation (10), i.e., as the vibration amplitude increased, the hysteresis effect between the self-excited forces and displacements weakened gradually, and the energy input to the dynamic system did not grow rapidly but kept stable to limit further vibration divergence. Eventually, the dynamic system achieved equilibrium and the postflutter LCO occurred.
4. Conclusions
A series of flutter tests of spring-suspended sectional models with different leading edges and trailing edges were conducted to explore the influence of aerodynamic configurations on flutter behaviors. In the test, the classical flutter and postflutter LCOs were observed for different aerodynamic configurations. Based on the dataset of self-excited forces and flutter responses, the characteristics of coupling vibration and aerodynamic hysteresis of the two kinds of flutter were analyzed and compared. The following conclusions were obtained:
The aerodynamic configuration of leading edges played a more important role for flutter behaviors than it did for trailing edges. For a sectional model with an aspect ratio of 1:10 and a rectangular trailing edge, a postflutter LCO occurred when the vertex angle of the leading edge was more than 105°. Nevertheless, the flutter behavior kept a postflutter LCO whenever the aerodynamic configuration of the trailing edge was a leading edge rectangular shape.
The coupling vibrations were observed for both the classical flutter and postflutter LCOs. Compared with the classical flutter, the participation level of the torsional degree of freedom was higher in the postflutter LCO than for the classical flutter. The vertical degree of freedom played a more important role in both kinds of flutter, as the inflow velocity increased during the flutter process.
For the two kinds of flutter, the work was done by the first-order harmonic component of self-excited forces, which was the most dominant part of the energy input in the dynamic system. The work done by the higher-order harmonic components of the self-excited forces can be ignored. When the classical flutter occurs, the cumulative work done by the vertical self-excited force was much bigger than that of the torsional self-excited force. By contrast, the torsional degree of freedom was the main effect of the postflutter LCO.
The phase difference between the displacements and aerodynamic forces had a significant influence on nonlinear flutter behaviors. Different from the classical flutter, there was negative feedback for the postflutter LCO. As the vibration amplitude increased, the phase difference decreased gradually, and the energy input to the dynamic system did not grow rapidly, which limited further vibration divergence and resulted in a stable LCO.
Author Contributions
Conceptualization, W.L. and S.L; methodology, W.L. and S.L; software, W.L.; validation, W.L.; formal analysis, W.L.; investigation, W.L and S.L.; resources, S.L.; data curation, W.L.; writing—original draft, W.L.; writing—review and editing, S.L.; visualization, W.L.; supervision, S.L; project administration, S.L.; funding acquisition, S.L. Both authors have read and agreed to the published version of the manuscript.
Funding
This study was financially supported by NSFC under grant No. 51878230, and supported by the Fundamental Research Funds for the Central Universities.
Conflicts of Interest
The authors declare no conflict of interest.
References
- Diana, G.; Fiammenghi, G.; Belloli, M.; Rocchi, D. Wind tunnel tests and numerical approach for long span bridges: The Messina bridge. J. Wind. Eng. Ind. Aerodyn. 2013, 122, 38–49. [Google Scholar] [CrossRef]
- Scanlan, R.H.; Tomko, J.J. Airfoil and bridge deck flutter derivatives. J. Eng. Mech. Div. 1971, 97, 1717–1737. [Google Scholar]
- Iwamoto, M.; Fujino, Y. Identification of flutter derivatives of bridge deck from free vibration data. J. Wind. Eng. Ind. Aerodyn. 1995, 54, 55–63. [Google Scholar] [CrossRef]
- Larsen, A.; Walther, J.H. Discrete vortex simulation of flow around five generic bridge deck sections. J. Wind. Eng. Ind. Aerodyn. 1998, 77, 591–602. [Google Scholar] [CrossRef]
- Gu, M.; Zhang, R.; Xiang, H. Identification of flutter derivatives of bridge decks. J. Wind. Eng. Ind. Aerodyn. 2000, 84, 151–162. [Google Scholar] [CrossRef]
- Brusiani, F.; De Miranda, S.; Patruno, L.; Ubertini, F.; Vaona, P. On the evaluation of bridge deck flutter derivatives using RANS turbulence models. J. Wind. Eng. Ind. Aerodyn. 2013, 119, 39–47. [Google Scholar] [CrossRef]
- Sarkar, P.P.; Jones, N.; Scanlan, R.H. Identification of Aeroelastic Parameters of Flexible Bridges. J. Eng. Mech. 1994, 120, 1718–1742. [Google Scholar] [CrossRef]
- Chen, A.; He, X.; Xiang, H. Identification of 18 flutter derivatives of bridge decks. J. Wind. Eng. Ind. Aerodyn. 2002, 90, 2007–2022. [Google Scholar] [CrossRef]
- Watanabe, S.; Fumoto, K. Aerodynamic study of slotted box girder using computational fluid dynamics. J. Wind. Eng. Ind. Aerodyn. 2008, 96, 1885–1894. [Google Scholar] [CrossRef]
- Sato, H.; Hirahara, N.; Fumoto, K.; Hirano, S.; Kusuhara, S. Full aeroelastic model test of a super long-span bridge with slotted box girder. J. Wind. Eng. Ind. Aerodyn. 2002, 90, 2023–2032. [Google Scholar] [CrossRef]
- Nieto, F.; Montoya, M.C.; Hernández, S.; Kusano, I.; Casteleiro, A.; Álvarez, A.J.; Jurado, J.Á.; Fontán, A. Aerodynamic and aeroelastic responses of short gap twin-box decks: Box geometry and gap distance dependent surrogate based design. J. Wind. Eng. Ind. Aerodyn. 2020, 201, 104147. [Google Scholar] [CrossRef]
- Yang, Y.; Zhou, R.; Ge, Y.; Zou, X.; Zhang, L. Flutter characteristics of twin-box girder bridges with vertical central stabilizers. Eng. Struct. 2017, 133, 33–48. [Google Scholar] [CrossRef] [Green Version]
- Mei, H.; Wang, Q.; Liao, H.; Fu, H. Improvement of Flutter Performance of a Streamlined Box Girder by Using an Upper Central Stabilizer. J. Bridg. Eng. 2020, 25, 04020053. [Google Scholar] [CrossRef]
- Li, K.; Ge, Y.; Zhao, L. Cfd simulation of the feedback controlled twin-winglet system for flutter suppression of long-span suspension bridges. In Proceedings of the 14th International Conference on Wind Engineering (ICWE), Porto Alegre, Brazil, 21–26 June 2015. [Google Scholar]
- Bakis, K.N.; Massaro, M.; Williams, M.S.; Limebeer, D.J.N. Aeroelastic control of long-span suspension bridges with controllable winglets. Struct. Control. Heal. Monit. 2016, 23, 1417–1441. [Google Scholar] [CrossRef]
- Sangalli, L.A.; Braun, A.L. A fluid-structure interaction model for numerical simulation of bridge flutter using sectional models with active control devices. Preliminary results. J. Sound Vib. 2020, 477, 115338. [Google Scholar] [CrossRef]
- Náprstek, J.; Pospíšil, S.; Hračov, S. Analytical and experimental modelling of non-linear aeroelastic effects on prismatic bodies. J. Wind. Eng. Ind. Aerodyn. 2007, 95, 1315–1328. [Google Scholar] [CrossRef]
- Arena, A.; Lacarbonara, W. Nonlinear parametric modeling of suspension bridges under aeroelastic forces: Torsional divergence and flutter. Nonlinear Dyn. 2012, 70, 2487–2510. [Google Scholar] [CrossRef]
- Amandolese, X.; Michelin, S.; Choquel, M. Low speed flutter and limit cycle oscillations of a two-degree-of-freedom flat plate in a wind tunnel. J. Fluids Struct. 2013, 43, 244–255. [Google Scholar] [CrossRef] [Green Version]
- Král, R.; Pospíšil, S.; Náprstek, J. Wind tunnel experiments on unstable self-excited vibration of sectional girders. J. Fluids Struct. 2014, 44, 235–250. [Google Scholar] [CrossRef]
- Arena, A.; Lacarbonara, W.; Marzocca, P. Post-Critical Behavior of Suspension Bridges Under Nonlinear Aerodynamic Loading. J. Comput. Nonlinear Dyn. 2015, 11, 011005. [Google Scholar] [CrossRef]
- Ying, X.; Xu, F.; Zhang, Z. Study on numerical simulation and mechanism of soft flutter of a bridge deck. In Proceedings of the 2016 World Congress, Advances in Civil, Environmental, and Materials Research (ACEM16), Daejeon, Korea, 28 August–1 September 2016. [Google Scholar]
- Zhang, M.; Xu, F.; Ying, X. Experimental Investigations on the Nonlinear Torsional Flutter of a Bridge Deck. J. Bridg. Eng. 2017, 22, 04017048. [Google Scholar] [CrossRef]
- Zhang, M.; Xu, F.; Zhang, Z.; Ying, X. Energy budget analysis and engineering modeling of post-flutter limit cycle oscillation of a bridge deck. J. Wind. Eng. Ind. Aerodyn. 2019, 188, 410–420. [Google Scholar] [CrossRef]
- Tang, H.; Shum, K.; Li, Y. Investigation of flutter performance of a twin-box bridge girder at large angles of attack. J. Wind. Eng. Ind. Aerodyn. 2019, 186, 192–203. [Google Scholar] [CrossRef]
- Matsumoto, M.; Daito, Y.; Yoshizumi, F.; Ichikawa, Y.; Yabutani, T. Torsional flutter of bluff bodies. J. Wind. Eng. Ind. Aerodyn. 1997, 69, 871–882. [Google Scholar] [CrossRef]
- Ying, X.; Xu, F.; Zhang, M.; Zhang, Z. Numerical explorations of the limit cycle flutter characteristics of a bridge deck. J. Wind. Eng. Ind. Aerodyn. 2017, 169, 30–38. [Google Scholar] [CrossRef]
- Gao, G.; Zhu, L.; Han, W.; Li, J. Nonlinear post-flutter behavior and self-excited force model of a twin-side-girder bridge deck. J. Wind. Eng. Ind. Aerodyn. 2018, 177, 227–241. [Google Scholar] [CrossRef]
- Scanlan, R.H. Amplitude and Turbulence Effects on Bridge Flutter Derivatives. J. Struct. Eng. 1997, 123, 232–236. [Google Scholar] [CrossRef]
- Noda, M.; Utsunomiya, H.; Nagao, F.; Kanda, M.; Shiraishi, N. Effects of oscillation amplitude on aerodynamic derivatives. J. Wind. Eng. Ind. Aerodyn. 2003, 91, 101–111. [Google Scholar] [CrossRef]
- Wang, Y.; Chen, X.; Li, Y. Nonlinear self-excited forces and aerodynamic damping associated with vortex-induced vibration and flutter of long span bridges. J. Wind. Eng. Ind. Aerodyn. 2020, 204, 104207. [Google Scholar] [CrossRef]
- Gao, G.; Zhu, L. Nonlinearity of mechanical damping and stiffness of a spring-suspended sectional model system for wind tunnel tests. J. Sound Vib. 2015, 355, 369–391. [Google Scholar] [CrossRef]
Figure 1.
A sketch of the flutter test setup.

Figure 2.
Aerodynamic configurations of the sectional model; (a) schematic diagram of the sectional model structure; and (b) configurations of the various leading edges.
Figure 2.
Aerodynamic configurations of the sectional model; (a) schematic diagram of the sectional model structure; and (b) configurations of the various leading edges.

Figure 3.
Schematic diagram of self-excited force measurement; (a) snapshot of two six-axis force/torque transducers installation; and (b) dynamic balance principle.
Figure 3.
Schematic diagram of self-excited force measurement; (a) snapshot of two six-axis force/torque transducers installation; and (b) dynamic balance principle.

Figure 4.
An example of the identification results of the nonlinear structural frequency and damping ratio (Case: L30): (a) vertical free vibration histories; (b) vertical natural frequency; (c) vertical damping ratio; (d) torsional free vibration histories; (e) torsional natural frequency; and (f) torsional damping ratio.

Figure 5.
Root mean square (RMS) of oscillation responses versus wind speeds; (a) different leading edges, vertical; (b) different leading edges, torsional; (c) different trailing edges, vertical; and (d) different trailing edges, torsional. (Arrow: a divergent oscillation occurs when the wind speed is larger than the critical value.).

Figure 6.
The response histories of the classical flutter and postflutter LCO: (a) classical flutter (Case: L30); and (b) postflutter LCO (Case: L180).
Figure 6.
The response histories of the classical flutter and postflutter LCO: (a) classical flutter (Case: L30); and (b) postflutter LCO (Case: L180).

Figure 7.
The frequency spectrums of displacement of the classical flutter and postflutter LCO: (a) classical. U* = 10.47); and (b) postflutter LCO (Case: L180, U* = 6.12).
Figure 7.
The frequency spectrums of displacement of the classical flutter and postflutter LCO: (a) classical. U* = 10.47); and (b) postflutter LCO (Case: L180, U* = 6.12).

Figure 8.
The relationship between vibration frequency and reduced wind speed.

Figure 9.
The aerodynamic hysteresis curve for classical flutter (Case: L60, U* = 10.27): (a) vertical and (b) torsional.
Figure 9.
The aerodynamic hysteresis curve for classical flutter (Case: L60, U* = 10.27): (a) vertical and (b) torsional.

Figure 10.
The aerodynamic hysteresis curve for postflutter LCO (Case: L180, U* = 6.12): (a) vertical and (b) torsional.
Figure 10.
The aerodynamic hysteresis curve for postflutter LCO (Case: L180, U* = 6.12): (a) vertical and (b) torsional.

Figure 11.
The cumulative work done by self-excited force for classical flutter (Case: L60, U* = 10.27): (a) vertical and (b) torsional.
Figure 11.
The cumulative work done by self-excited force for classical flutter (Case: L60, U* = 10.27): (a) vertical and (b) torsional.

Figure 12.
The cumulative work done by self-excited force for postflutter LCO (Case: L180, U* = 6.12): (a) vertical and (b) torsional.
Figure 12.
The cumulative work done by self-excited force for postflutter LCO (Case: L180, U* = 6.12): (a) vertical and (b) torsional.

Figure 13.
The phase difference analysis for classical flutter (Case: L60, U* = 10.27), (a) vertical displacement, (b) torsional angle, (c) phase difference and (d) phase difference .
Figure 13.
The phase difference analysis for classical flutter (Case: L60, U* = 10.27), (a) vertical displacement, (b) torsional angle, (c) phase difference and (d) phase difference .

Figure 14.
The phase difference analysis for postflutter LCO (Case: L180, U* = 6.0), (a) vertical displacement, (b) torsional angle, (c) phase difference and (d) phase difference .
Figure 14.
The phase difference analysis for postflutter LCO (Case: L180, U* = 6.0), (a) vertical displacement, (b) torsional angle, (c) phase difference and (d) phase difference .


Table 1.
List of test cases.
| Case | L30 | L60 | L90 | L120 | L150 | L180/T180 | T30 | T60 | T90 | T120 | T150 |
|---|---|---|---|---|---|---|---|---|---|---|---|
| Leading edge | 30° | 60° | 90° | 120° | 150° | 180° | 180° | 180° | 180° | 180° | 180° |
| Trailing edge | 180° | 180° | 180° | 180° | 180° | 180° | 30° | 60° | 90° | 120° | 150° |
Table 2.
Structural dynamic parameters (linear results).
| Case | (Hz) | (%) | (Hz) | (%) | Case | (Hz) | (%) | (Hz) | (%) |
|---|---|---|---|---|---|---|---|---|---|
| L30 | 2.965 | 0.174 | 4.307 | 0.282 | T30 | 2.970 | 0.191 | 4.317 | 0.268 |
| L60 | 2.976 | 0.190 | 4.287 | 0.312 | T60 | 2.972 | 0.193 | 4.314 | 0.259 |
| L90 | 2.981 | 0.202 | 4.272 | 0.265 | T90 | 2.970 | 0.187 | 4.286 | 0.288 |
| L120 | 2.984 | 0.204 | 4.264 | 0.283 | T120 | 2.968 | 0.175 | 4.287 | 0.234 |
| L150 | 2.980 | 0.210 | 4.267 | 0.263 | T150 | 2.964 | 0.163 | 4.283 | 0.273 |
| L180/T180 | 2.966 | 0.171 | 4.274 | 0.260 |
Publisher’s Note: MDPI stays neutral with regard to jurisdictional claims in published maps and institutional affiliations. |
© 2020 by the authors. Licensee MDPI, Basel, Switzerland. This article is an open access article distributed under the terms and conditions of the Creative Commons Attribution (CC BY) license (http://creativecommons.org/licenses/by/4.0/).
Share and Cite
MDPI and ACS Style
Li, W.; Laima, S. Experimental Investigations on Nonlinear Flutter Behaviors of a Bridge Deck with Different Leading and Trailing Edges. Appl. Sci. 2020, 10, 7781. https://0-doi-org.brum.beds.ac.uk/10.3390/app10217781
AMA Style
Li W, Laima S. Experimental Investigations on Nonlinear Flutter Behaviors of a Bridge Deck with Different Leading and Trailing Edges. Applied Sciences. 2020; 10(21):7781. https://0-doi-org.brum.beds.ac.uk/10.3390/app10217781
Chicago/Turabian StyleLi, Wenjie, and Shujin Laima. 2020. "Experimental Investigations on Nonlinear Flutter Behaviors of a Bridge Deck with Different Leading and Trailing Edges" Applied Sciences 10, no. 21: 7781. https://0-doi-org.brum.beds.ac.uk/10.3390/app10217781
Note that from the first issue of 2016, this journal uses article numbers instead of page numbers. See further details here.