Densities and Viscosities of Ionic Liquid with Organic Solvents

MOE Key Laboratory of Thermo-Fluid Science and Engineering, School of Energy and Power Engineering, Xi’an Jiaotong University, Xi’an 710049, China
*
Author to whom correspondence should be addressed.
Appl. Sci. 2020, 10(23), 8342; https://0-doi-org.brum.beds.ac.uk/10.3390/app10238342
Submission received: 3 November 2020
/
Revised: 13 November 2020
/
Accepted: 20 November 2020
/
Published: 24 November 2020
Abstract
:The ionic liquid (IL) of 1-hexyl-3-methylimidazolium acetate is widely used in chemical and bio-chemical processes. In this work, due to the high viscosity of IL, the promising chemicals (i.e., N, N-dimethylacetamide, N, N-dimethylformamide, and dimethyl sulfoxide) were selected as the additives to lower IL viscosity. The thermophysical properties of density and viscosity for IL with solvents were measured using a digital vibrating U-tube densimeter and an Ubbelohde capillary viscometer from 303.15 to 338.15 K at atmospheric pressure (0.0967 MPa), respectively. The influences of the solvents on the thermophysical properties of ionic liquid were quantitatively studied. Furthermore, based on the measurement values, the derived properties of excess molar volumes, thermal expansion coefficient, and the energy barrier were calculated, and the results showed that the mixture composition had great impact on excess volume change and viscosity. The hard-sphere model was employed to reproduce the viscosity. The infrared spectroscopy was performed to study the chemical structure to further understand the interactions between IL and the solvents.
1. Introduction
Due to the depletion of fossil fuel and the continual emission of the harmful gas, biofuel has received reasonable attention and is considered a renewable energy. In a typical process for making biofuels from carbohydrates, the biomass (mainly containing the cellulose, hemicellulose, and lignin) has to be pretreated to break down the matrix and release the saccharides [1]. Rogers research group published the pioneer work on ionic liquids (ILs) for dissolving the biomass component [2]. Since then, more studies have focused on the use of ILs for bio-productions [3].
Ionic liquids have always consisted of organic cations and organic or inorganic anions. Generally, the anions and the cations can be assembled in different combinations and that makes ILs more tunable and designable. ILs can be synthetized regarding the requirements for the industrial processes. Due to the favorable properties, e.g., lower vapor pressure, high thermal stability, and conductivity, ILs are recognized as promising alternatives for conventional solvents and are widely used.
Among the huge number of ILs, imidazolium-based ILs are considered attractive solvents for biofuel and chemical processes [4,5]. During the use of ILs, there are several disadvantages that have to be overcome. It is well known that most of the ILs possess high viscosity and that impedes the biomass dissolution in the ILs, affects the mass transfer rate, and increases the pump costs [6]. One of the possible ways to reduce the effects is the use of organic solvents as the additives to lower the viscosity and improve the dissolution of biomass in ILs. The organic solvents, namely N,N-dimethylacetamide (DMA), N,N-dimethylformamide (DMF), and dimethyl sulfoxide (DMSO), are widely selected as the diluents for the homogeneous derivatization of biomass component in ILs [7,8,9]. The acetate-based imidazolium IL of 1-hexyl-3-methylimidazolium acetate ([C6mim] [OAc]) has attracted more attention and is chosen to study. More studies focus on the mechanism of making bio-productions using IL with solvents, however, little attention has been given to their thermophysical properties. Fillion et al. and Ma et al. worked on the densities of [C6mim] [OAc] at 0.1 MPa in the temperature range of 283.15–338.15 K [10,11]. Fillion et al. reported the viscosities at 278.15–343.15 K under 0.1 MPa with the relative standard uncertainty of 0.06 using a cone and plate ATS Viscoanalyzer [10]. Additionally, there is no publication concerning the properties of binary mixtures. Liquid density is important to engineers throughout chemical process industries. The knowledge of density is required in the design of storage and mass transfer. Viscosity is a measure of a fluid’s internal friction and it can be considered as the resistance to flow. Fluid flow characteristics are valuable in predicting the parameters relevant to many chemical processes, such as the pumpability.
In this work, the experimental studies on the viscosities and densities of [C6mim] [OAc] with organic solvents of DMA, DMF, and DMSO were conducted from 303.15–338.15 K at atmospheric pressure. The excess properties and energy barrier were calculated as well as the thermal expansion coefficient. Moreover, the microscopies for the binary mixtures of ionic liquid with organic solvents were determined to understand the interactions between ionic liquid with solvents. The hard-sphere model was employed to study the viscosities of pure substances and mixtures.
2. Experimental
2.1. Substance
Table 1 presents the details of the studied chemicals. The anhydrous organic solvents of DMA, DMF, and DMSO were obtained from Sigma-Aldrich (St Louis, MO, USA) and used without further purification. IL of [C6mim] [OAc] was supplied from the Center for Green Chemistry and Catalysis, Lanzhou Institute of Chemical Physics, Chinese Academy of Sciences. The molecular sieves (3A, 1.6 mm pellets), purchased from Sigma-Aldrich (St Louis, MO, USA), were performed to dry the IL.
2.2. Sample Treatment
It is recognized that the impurities in IL, e.g., the water, greatly affect the thermophysical properties, especially of viscosity. To eliminate the influences, the molecular sieves were performed as the desiccant to absorb the water in IL. Acetone and methanol were used to clean the residual ions in sieves before use. Then, the sieves were put into an oven at 473.15 K to dry for more than 8 h. The mixture of IL with the dried molecular sieve was treated by a vacuum oven with the pressure of less than 1 kPa for more than 24 h at 353.15 K. An analytical balance (ME204, Mettler-Toledo, 0.0001 g) was used for the sample preparation. The water content in the samples, including the pure substances and binary mixtures, were determined by a moisture titrator (Coulometric titration, Kyoto Electronics Manufacturing Co., Ltd.). The water content in the sample was less than 0.1 wt. %.
2.3. Density Measurement
The densities of the samples were measured using a digital vibrating U-tube densimeter (Anton Paar, model DMA 5000 M). The relative standard uncertainty for density is 0.005. The densimeter was cleaned by the hot water and methanol before and after the measurement. Moreover, it was calibrated by the purified water. During the experiment, the density values were determined in triplicate.
2.4. Viscosity Measurement
The viscosities of the pure chemicals and binary mixtures were determined by an Ubbelohde viscometer supplied by Cannon Instrument Company (9721-R50, 9721-R56, 9721-R59, 9721-R65, 9721-R71, and 9721-R77, Philadelphia, USA). The dynamic viscosity η was calculated as a function of viscometer constant k, the efflux time t of the sample and the density ρ corresponding to the same measurement condition. Considering the uncertainties of viscometer constant, efflux time, and the density as well as the impurities in IL, the relative combined standard uncertainty of the viscosity in the measurement was 0.10 [12]. More details about the measurement of viscosity were presented in the previous work [13].
2.5. IR Measurement
The Vertex 70 infrared spectrometer (IR) equipped with the DTGS & LN MCT(Manufacturer: Bruker Corporation, Billerica, MA, USA) detector purchased from Bruker was performed to obtain the infrared spectra to study the interactions between the solvents and IL. The spectrum range of the spectrometer was 350–8000 cm−1 with the wave number accuracy of 0.01 cm−1. The sampling speed was 65 pieces/s.
3. Results and Discussion
3.1. Experimental Density Data
Table 2 presents the density values of the pure substances together with the literature data to check the experimental apparatus [10,11,14,15,16,17,18].
The standard uncertainty (u) is u(T) = 0.01 K. The relative standard uncertainty (ur) is ur(ρ) = 0.005.
In general, a linear equation or a second-order polynomial function is always used to correlate the density. The function is given as follows:
where ρ (g·cm−3) is the experiment density; the parameters of a (g·cm−3) and b (g·cm−3·K−1) are correlated using the experimental data; T is the temperature in Kelvin.
To check the experimental values with the literature data, the average absolute relative deviation (AARD) is expressed by:
where n is the number of data points, Ecal,i and Eexp/lit,i are the calculated and experiment/literature value of i, respectively.
Equation (1) is used to fit the experimental density. Then the calculated value by Equation (1) is compared with the literature data because sometimes the value measured in the experiment is not at the same temperature with that of the literature.
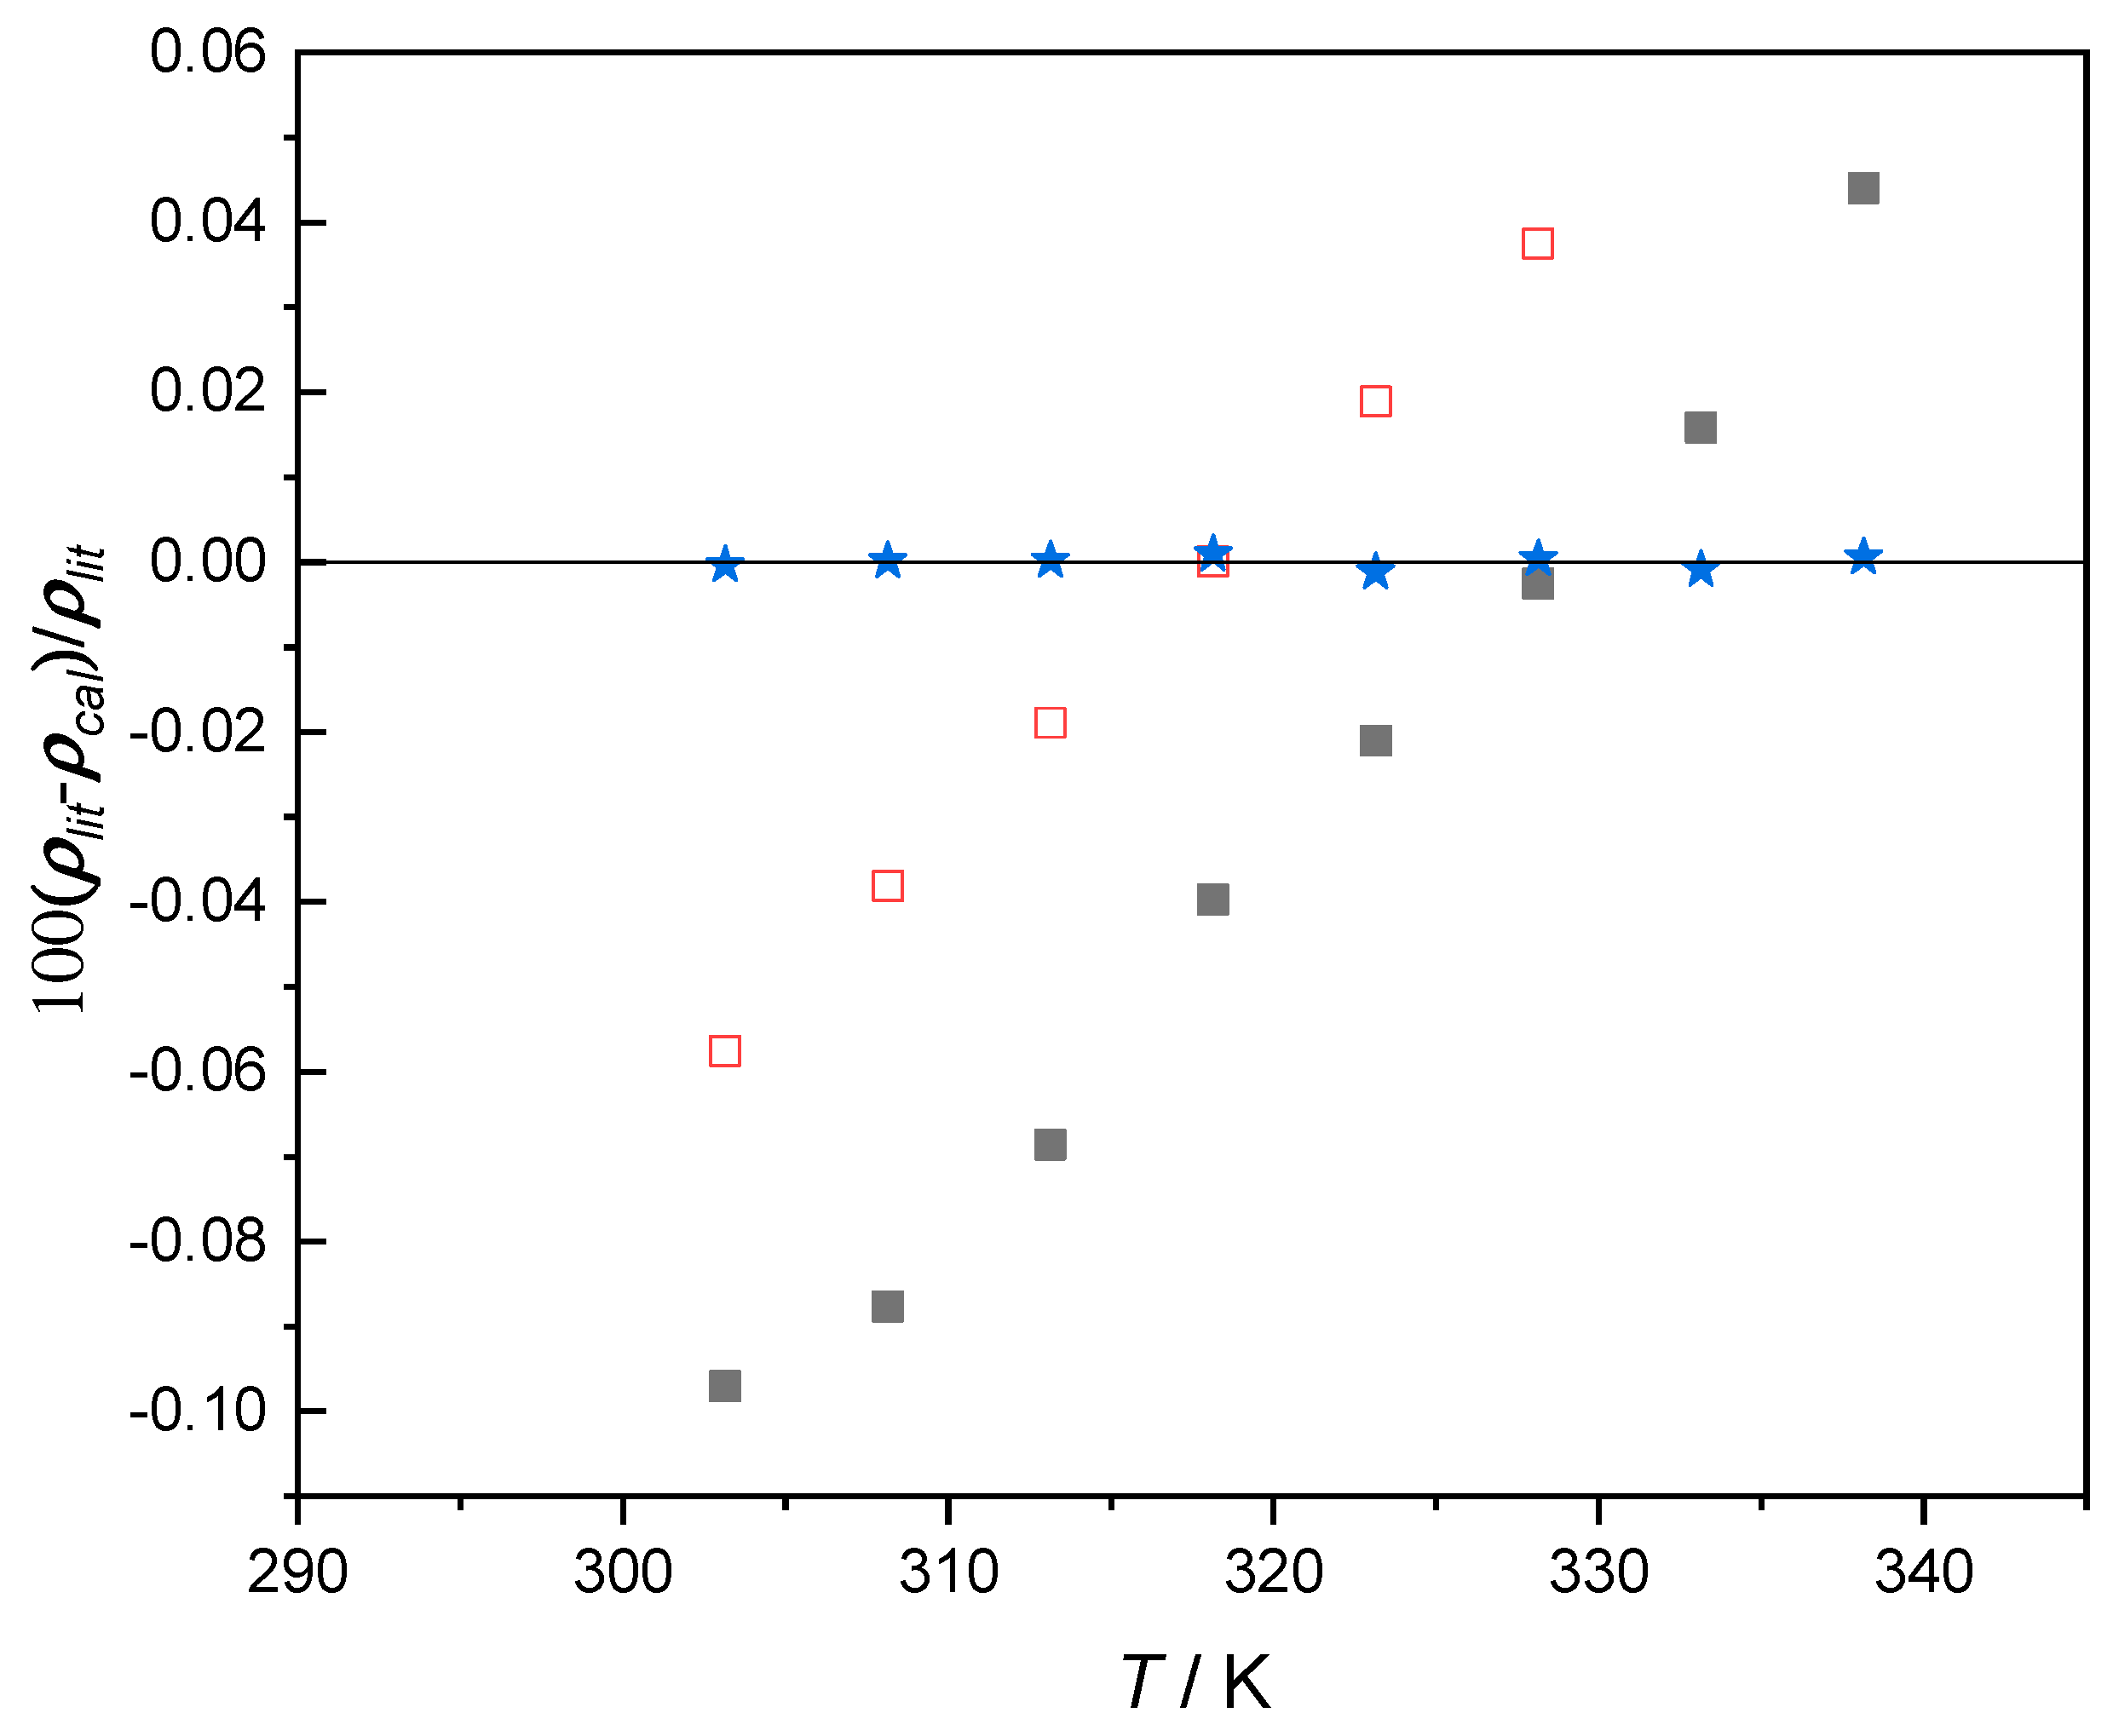
Figure 1 shows the relative deviations between the calculated densities of IL using Equation (1) and the literature data. AARD for IL is 0.05% [10], 0.03% [11]. Moreover, in Figures S1–S3 (in the Supplementary Material), the densities of the solvents in this work are compared with the literature data. AARD for DMA is 0.04% [19], 0.08% [20], 0.06% [21], 0.05% [22], 0.88% [23], 0.07% [24], 0.07% [25], 0.06% [26], 0.15% [27], 0.03% [28]. AARD for DMF is 0.02% [29], 0.07% [20], 0.16% [30], 0.10% [19], 0.09% [31], 0.19% [32], 0.18% [33], 0.14% [34], 0.09% [27], 0.09% [35], 0.04% [28], 0.17% [36], 0.07% [37], 0.14% [38], 0.03% [39], 0.13% [40]. AARD for DMSO is 0.14% [41], 0.02% [42], 0.02% [43], 0.01% [44], 0.02% [45], 0.01% [18], 0.03% [33], 0.08% [35], 0.02% [46], 0.05% [47], 0.05% [48], 0.02% [37]. No significant divergence is observed for IL density as well as the organic solvents, indicating that the experimental values are in accordance with the literature data. Then, the densities of the binary mixtures are measured and summarized in Table 3, Table 4 and Table 5.
Figures S4–S6 (in the Supplementary Material) depict the densities as a function of the temperature. In the three solvents, DMSO possesses the highest density, while DMA and DMF have similar values. Therefore, the densities of ionic liquid with DMSO possess the highest values compared to those of IL with DMA or DMF.
To evaluate the measurement data of density for the binary mixture, the excess molar volume is introduced. The excess molar volume VE is obtained by:
The subscripts of “m” and “i” present the mixture and pure substance. V is molar volume in cm3·mol−1; x is the mole fraction; ρ is the density; M is the molar mass.
Moreover, VE is usually correlated using the Redlich–Kister type equation [49]:
where T (K) is the temperature in Kelvin; the fit parameters of A (cm3·mol−1), B (cm3·mol−1·K−1), and C (cm3·mol−1) are correlated using the measurement data. Table S1 lists the parameters (in the Supplementary Material).
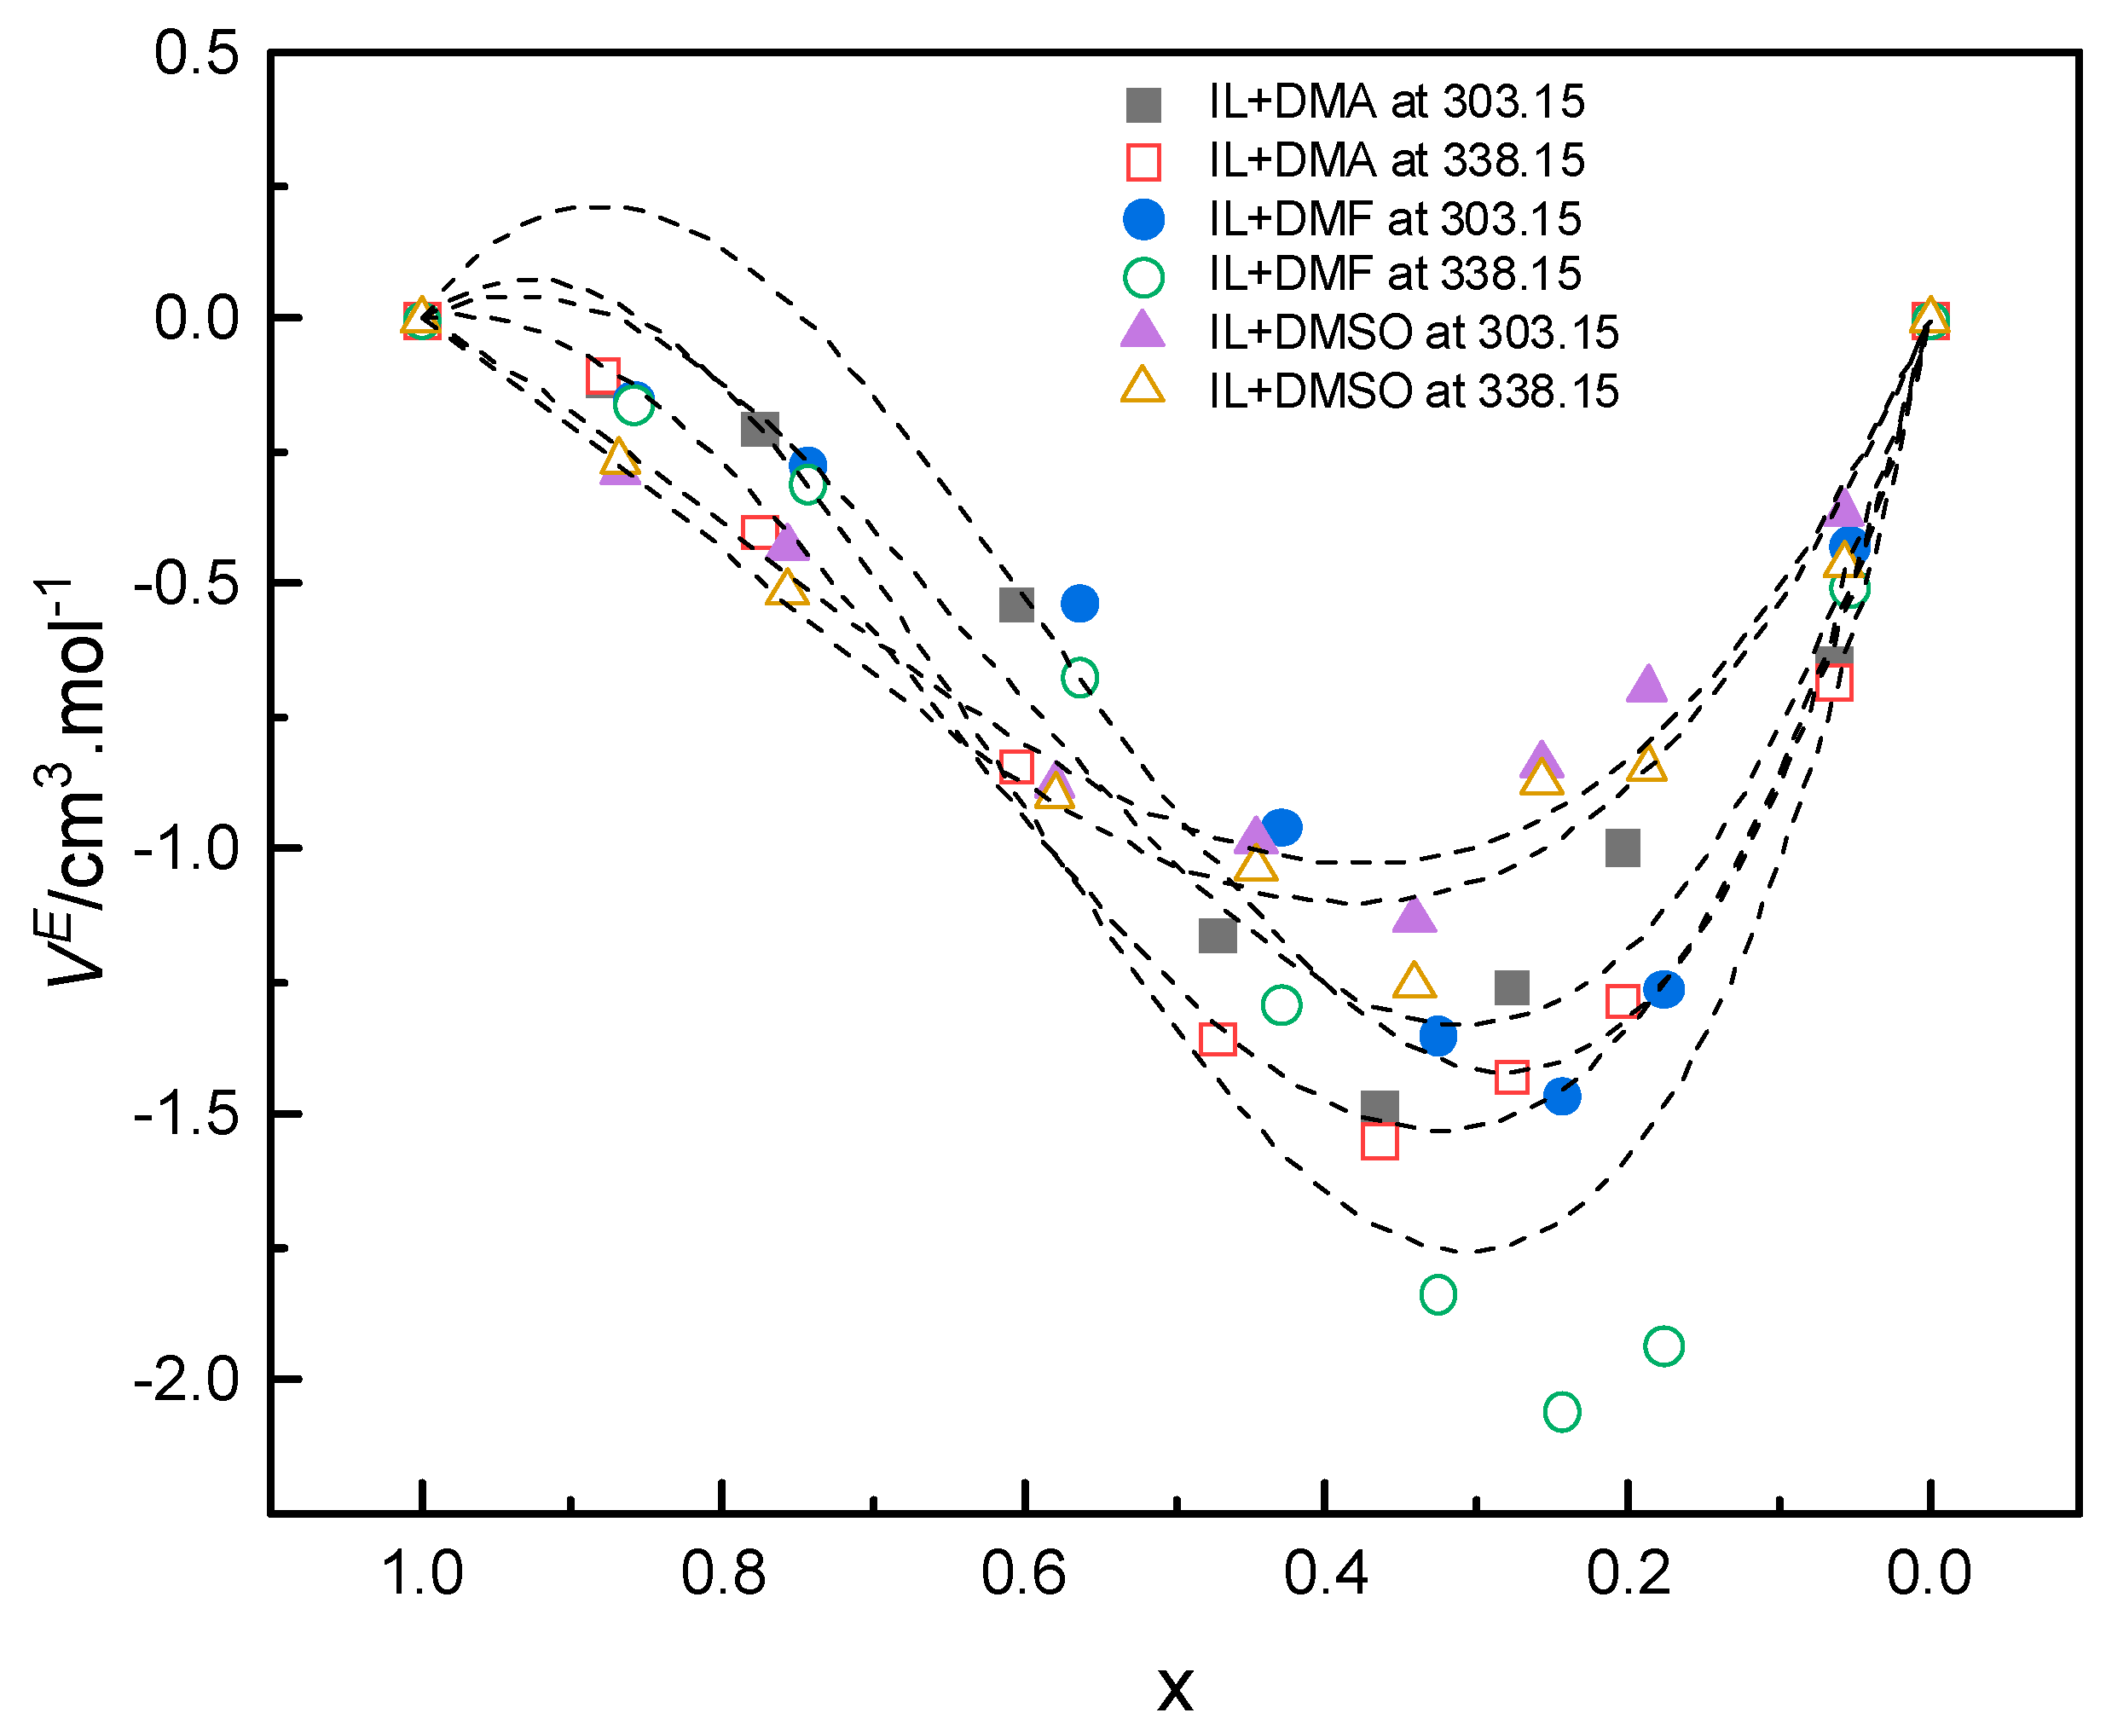
Figure 2 and Figures S7–S9 (in the Supplementary Material) give VE as a function of ionic liquid mole fraction. In the studied compositions and the temperatures, the values are negative, indicating that the molar volumes are smaller than those of the ideal ones. The minimum values of VE occur at the IL mole fraction of 0.24 (0.50 in mass).
Furthermore, based on the measurement density, the thermal expansion coefficient α is calculated using the following equation:
Combined with Equation (3), Equation (5) is changed to:
where α (K−1) and αi (K−1) are the thermal expansion coefficients of the mixture and pure component i, respectively.
The thermal expansion coefficients are calculated and summarized in Table 6, Table 7 and Table 8. Compared with solvents, the coefficients of IL are smaller. The coefficients of pure solvents and IL increase with the increase of temperature. In the mixture, the values increase with the increase of solvent content. Physically, the coefficient mathematically represents the expansion amount of a substance in reaction to a change in the temperature. It is observed that the solvents expand the thermal expansion coefficients of IL, making the molecules or atoms to be farther apart and the body to become larger.
3.2. Effects of Organic Solvents on The Viscosities of IL
In general, the Vogel–Fulcher–Tammann (VFT) equation is used to fit the viscosity [50]:
where the unit of the viscosity η is mPa·s; the parameters of η0 (mPa·s), B (K), and T0 (K) are correlated by the measurement viscosity.
To check the IL viscosity, Equation (7) is performed to fit the experimental data and the calculated values are compared with the literature data. Table 9 gives the viscosity data and the deviations for the IL viscosities in this work with the literature data [10,22,23,30,33,43,44].
The viscosity of IL is sensitive to the impurities. Due to the different production processes, the impurities in IL are usually different as ionic liquid is purchased from different manufacturers. It is seen that the literature values are larger than the experimental data, but AARD is 1.56%, the maximum relative deviation is 2.38%, illustrating that the divergence between the experimental data with the literature viscosity is acceptable. To the best of our knowledge, there is no more literature data for the comparison. Moreover, the viscosity values of the organic solvents in this work and those in the literature are compared as shown in Figures S10–S12 (in the Supplementary Material). AARD for DMA is 1.4% [20], 2.6% [22], 0.61% [23], 0.63% [26]. AARD for DMF is 1.29% [51], 1.07% [30], 1.77% [33], 1.85% [34], 3.34% [20], 10.96% [35], 6.82% [36], 2.31% [40]. AARD for DMSO is 0.54% [43], 1.96% [44], 1.46% [33], 2.26% [52], 6.67% [35], 2.54% [47], 2.98% [48]. There are some considerable deviations when the experimental viscosities are compared with the literature values, but most of the deviations are in the reasonable range. Then, the experimental viscosities of ionic liquid with the three solvents at atmospheric pressure in the temperature of 303.15 to 338.15 K are conducted and summarized in Table 10, Table 11 and Table 12.
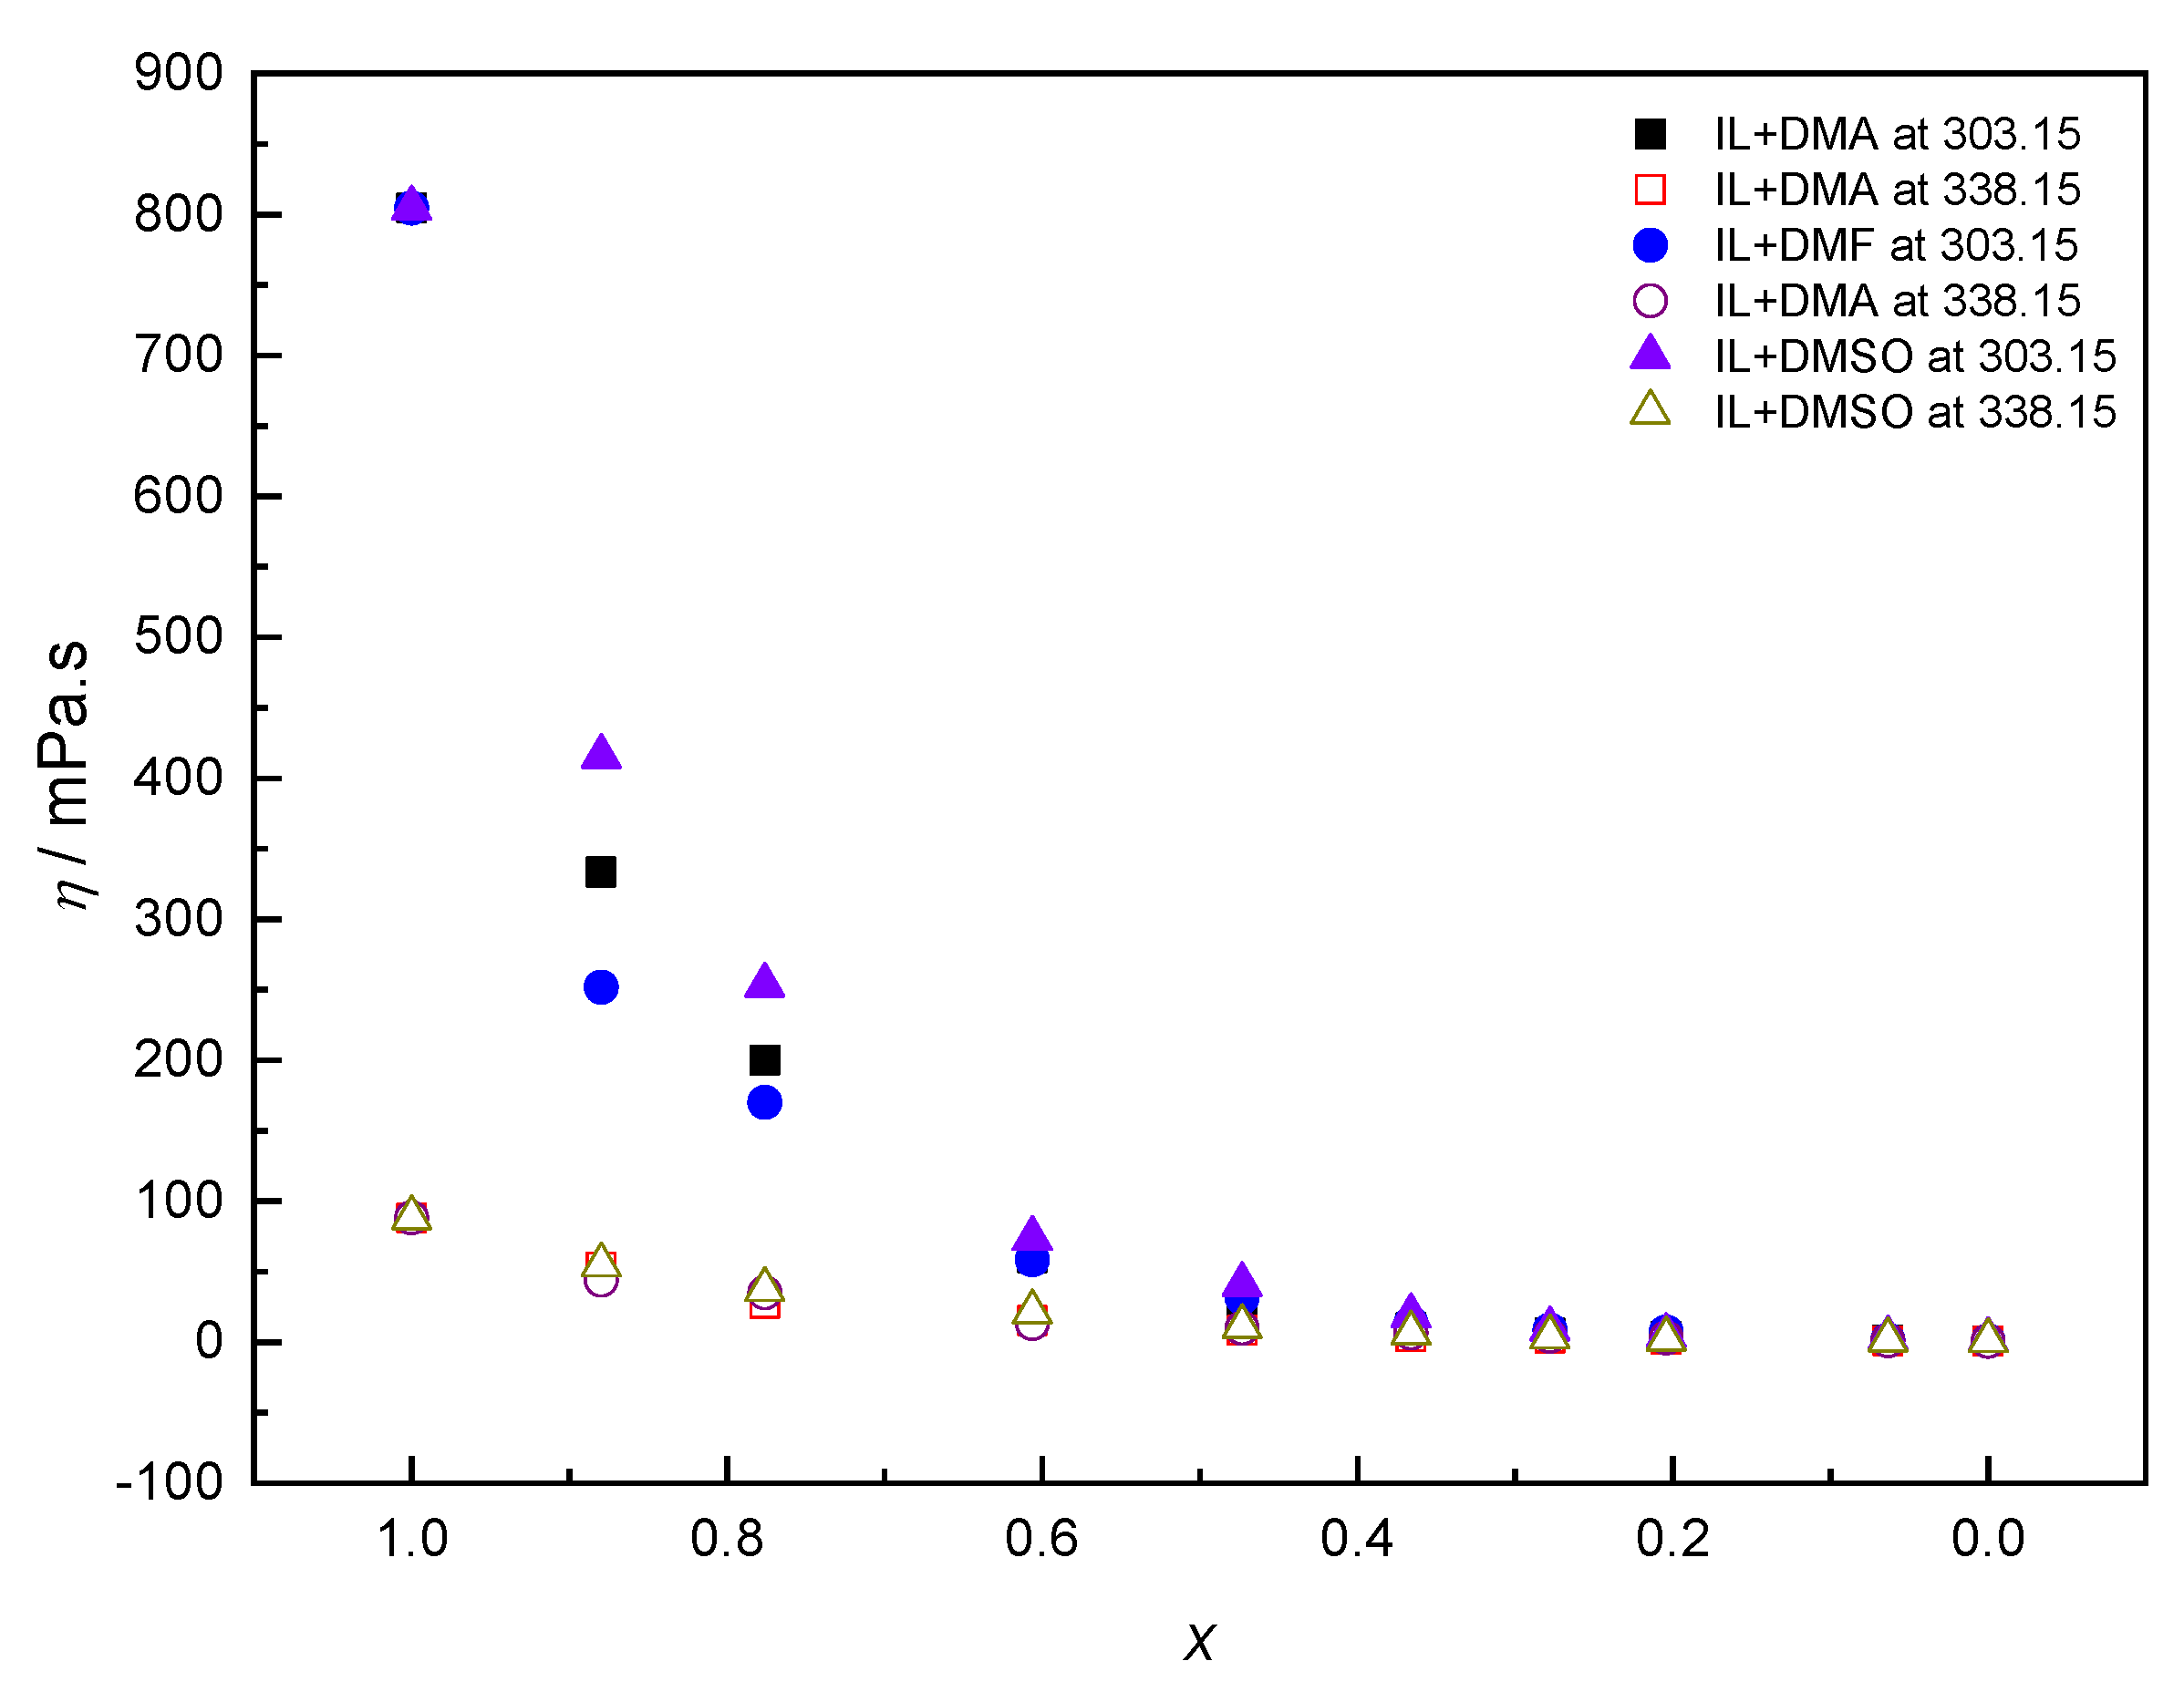
Figure 3 and Figures S13–S15 (in the Supplementary Material) depict the viscosities of binary mixtures as a function of IL mole fraction at atmospheric pressure. In Figure 3, for the pure IL, when the temperature is 303.15 K, the viscosity is 804.52 mPa⋅s; the value is 88.11 mPa⋅s when the temperature is 338.15 K. The temperature has a more influence on IL viscosity.
Considering the viscosities of binary mixtures, at the temperature of 303.15 K, when the mole fraction of DMA is 0.120 (0.05 in mass), the viscosity of the mixture drops from 804.52 to 333.51 mPa⋅s; when the mole fraction of DMA is 0.394 (0.20 in mass), the viscosity of the mixture drops to 59.74 mPa⋅s; when the mole fraction is more than 0.4, there is no significant change in the value of the viscosity. Similarly, the viscosity of IL drops dramatically when a small volume of DMF is added into IL. Moreover, at the temperature of 303.15 K, when the mole fraction of DMSO is 0.132 (0.05 in mass), the viscosity of the mixture drops from 804.52 to 415.49 mPa⋅s; when the mole fraction of DMSO is 0.420 (0.20 in mass), the viscosity of the mixture drops to 73.58 mPa⋅s. Among these solvents, as shown in Figure 3, the consequence for lowering the viscosity of IL is as: DMF>DMA>DMSO, namely, DMF has a more important effect on the reduction of IL viscosity.
Based on the experimental viscosity data and the VFT equation, the energy barrier Eη is studied and it describes the energy that must be overcome to move the ion onto the other ion. It is calculated by the following equation [53]:
where R is the ideal gas constant (approximate 8.3145 J·K−1·mol−1); η (mPa·s) is the viscosity, B (K), and T0 (K) are correlated from Equation (7).
Table 13 gives the fit parameters for Equation (7) as well as the energy barriers of the samples at 303.15 K. AARD is calculated between the experimental viscosity and the calculated data using Equation (7) correlated with the experimental value in this work. IL possesses the highest value of energy barrier, indicating that it is more difficult to move the ion upon the other ion in IL liquid. The value of the energy barrier decreases with the increase of the organic solvent content in the binary mixture that is consistent with the reduction of IL viscosity.
Towards further understanding the effects of organic solvents on the viscosity of IL, the viscosity deviation ∆η is obtained by:
where ηm is the viscosity of binary mixture, xi and ηi are the mole fraction and viscosity of pure substance i, respectively.
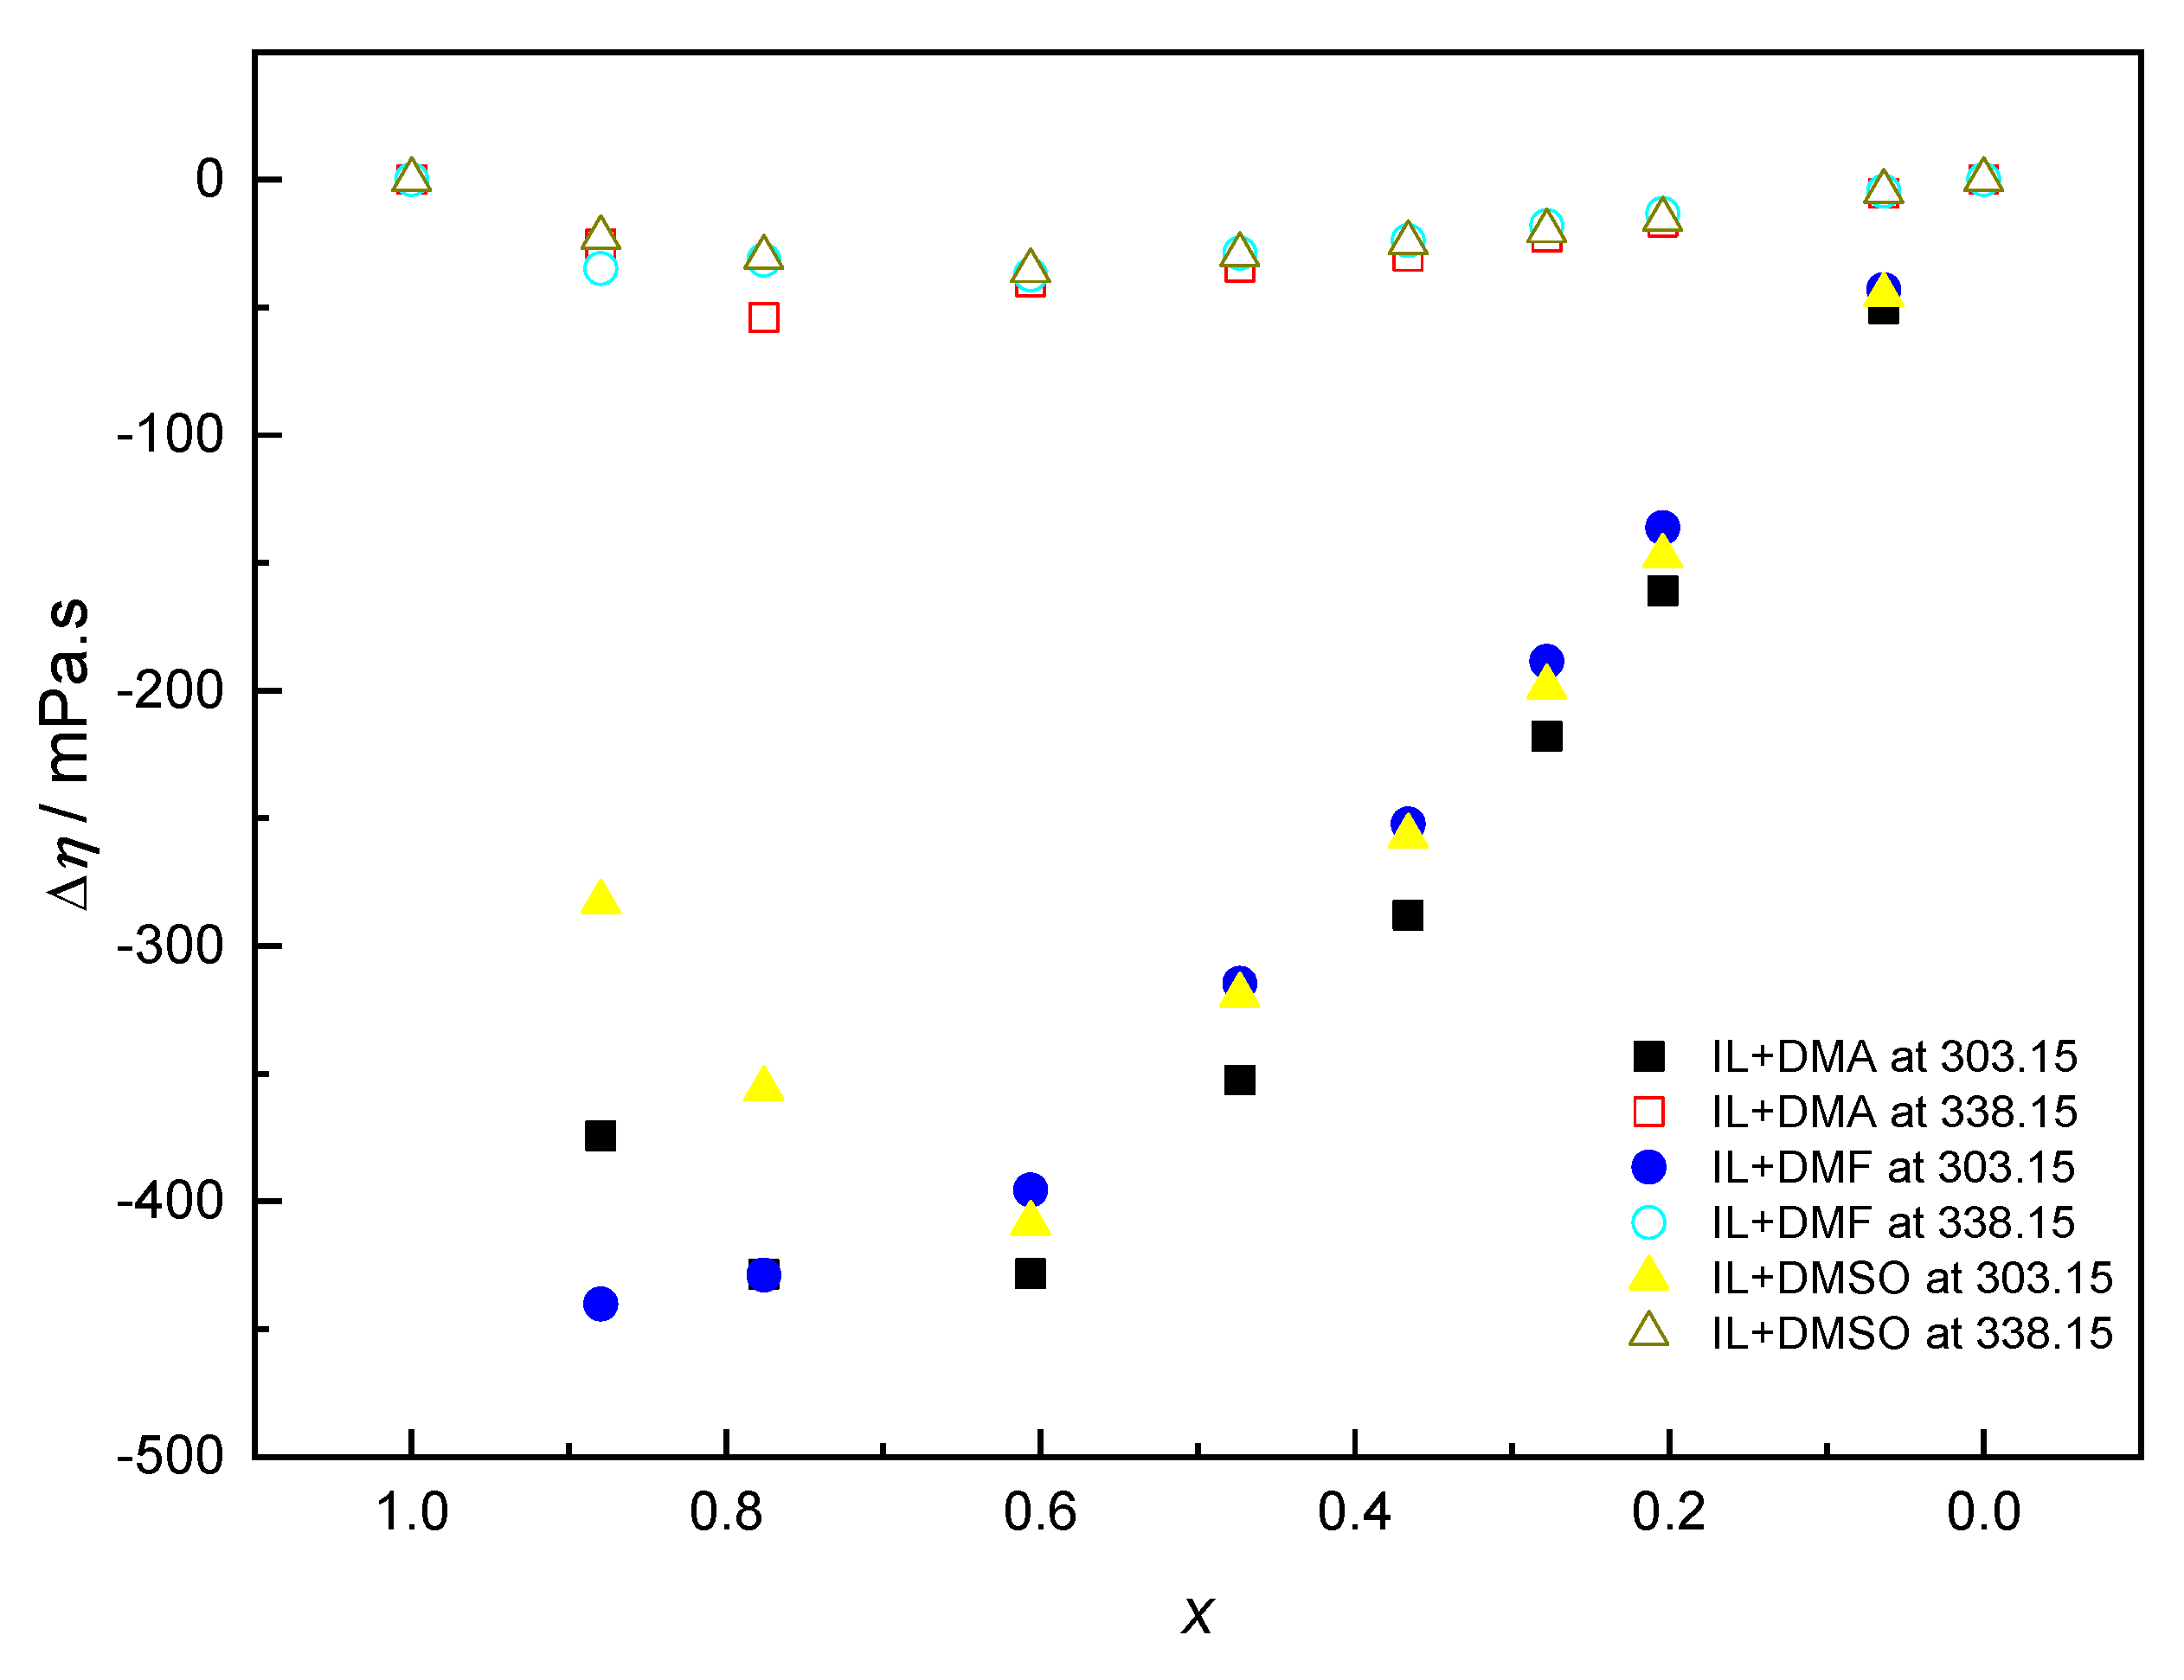
Figure 4 and Figures S16–S18 (in the Supplementary Material) present the viscosity deviations of binary mixtures as a function of IL mole fraction at atmospheric pressure. As shown in the figures, in the studied temperatures and compositions, all the deviations are negative, and the graphs are asymmetric. The absolute values decrease with the increase of temperature, indicating that at low temperature, the viscosities of the binary mixtures are far from those of the ideal mixtures. Moreover, the maximum absolute values are detected at the IL-rich area.
For the analysis, the solvatochromism is introduced to study the interactions in the binary mixtures using empirical solvent parameters: solvent acidity (α), solvent basicity (β), normalized empirical polarity (), and dipolarity/polarizability (π*). These values are α = 0, β = 0.76, = 0.377, π *= 0.88 for DMA, α = 0, β = 0.69, = 0.386, π* = 0.88 for DMF, α = 0, β = 0.76, = 0.444, π*≈1 for DMSO. The parameters for IL anion are α = 0.43, β = 1.05, = 0.611, π* = 1.04 [9]. The parameter of solvent acidity means the ability to be as the hydrogen bond donor and the values are zero, indicating that the solvents lack the ability. The parameters of solvent basicity in the solvents are in the range of 0.69–0.76, showing the ability to perform as the hydrogen bond acceptor. IL is overall polar ( = 0.611) and possesses the high dipolarity/polarizability (π* = 1.04) as well as the moderate tendency of hydrogen bond donor (α = 0.43) and the strong ability of hydrogen bond acceptor (β = 1.05) influenced by the cation and anion. These features in the combination of solvents with IL indicate that the contribution of Coulombic forces should be dominated for the interactions. In this work, the infrared spectrometer was used for the further studies and shown in the Supplementary Material [9,54].
Furthermore, the hard-sphere model is employed to reproduce the viscosity. The reduced viscosity of rough hard sphere is related to the reduced viscosity of smooth hard sphere using a proportionally constant Rη [55,56,57]:
is obtained by:
where the unit of viscosity η is Pa·s, T is the temperature in Kelvin, M is the formula weight in kg·mol−1, R is the universal gas constant (8.3141 J·mol−1·K−1), and V is the molar volume in m3·mol−1.
is calculated by:
Here, V/V0 is defined as the reduced molar volume Vr. V0 is a characteristic molar volume in m3·mol−1 and it is proposed as:
In Equation (12), the coefficients of aηi are extended by Ciotta et al. to dense liquids and they are 0, 5.14262, −35.5878, 192.05015, −573.37246, 957.41955, −833.36825, and 299.40932 [58].
In Equations (12) and (13), the parameters of a, b, and Rη are fitted using the measurement data. Table 14 lists the parameters of a, b, and Rη for pure substances, and AARD between the calculated data and experiment values. The hard-sphere model fits the viscosity data of pure substances well and the maximum absolute relative deviation (MD) is 1.2% for IL, 0.30% for DMA, 0.49% for DMF, and 0.61% for DMSO.
To predict the binary mixture viscosity based on the pure sample data, it is of importance to get the mixing rule. Warrier et al. modified the mixing rules to correlate the mixture viscosity of 1-ethoxy-1,1,2,2,3,3,4,4,4-nonafluorobutane (HFE 7200) with methanol and 1-ethoxybutane [56]. In this work, the mixing rules are modified to work on the viscous liquids:
The subscript of “1”, “2”, and “mix” in the equations mean the pure substances of “IL”, “solvent”, and “the mixture”, respectively.
In Equation (17), Kη is an adjustable parameter for any nonlinear dependence of viscosity, as shown in Table 15. The viscosities of IL with DMA and DMSO can be correlated reasonably well without the adjustable parameter of Kη with the AARD of 16.4% for IL-DMA and 17.8% for IL-DMSO. Large deviation is observed in IL-DMF mixture with AARD of 41.3%, but the deviation is reduced to 13.1% using Kη = -3.512 in the calculation. In Figure 4, in the three solvents, DMF has more effect on the reduction of IL viscosity and larger viscosity deviation in the observed IL-DMF mixture.
For further evaluation, another mixing rule proposed by Teja et al. is studied:
The mixing rule works well without the adjustable parameter k12 with the AARD of 11.8% for IL-DMA and 14.5% for IL-DMSO. When the parameter k12 is used, the values are reduced to 9.4% and 9.6%, respectively. For the mixture of IL with DMF, AARD are 26.8% and 15.3% with/without the parameter k12, which works better than that of the first mixing rule. Teja et al. studied the mixing rule of Equation (18) to predict the viscosity of IL-water with the deviation from 7.10% to 16.37% [57].
As discussed above, a small fraction of solvent in IL would cause the dramatic decrease in the viscosity, and the analysis indicates that interactions exit between IL and solvents, therefore, the mixing rules requires the additional study and further improvement concerning the interactions.
4. Conclusions
The effects of the solvents, namely DMA, DMF, and DMSO, on the thermophysical properties of 1-hexyl-3-methylimidazolium acetate were studied at atmospheric pressure in the temperature of 303.15 to 338.15 K. The calculated excess molar volumes VE are negative in the studied conditions, indicating the molar volumes become smaller than those of the ideal ones. The solvents have a great impact on the properties of ionic liquid and the addition of a small amount (e.g., 0.05 in mass) of solvents will significantly lower the viscosity to one-half that of IL. Among these three solvents, DMF has a more important effect on the reduction of IL viscosity. The rough hard-sphere model works reasonably well on the viscosity of the pure substances and binary mixtures. The hydrogen-bonding formations of the bands from IL and the organic solvents of DMA, DMF, and DMSO are not obviously observed in the IR spectra. The interactions of ion-dipole between IL and the organic solvents should be considered as the factors on influencing the viscosities of the binary mixtures.
Supplementary Materials
The following are available online at https://0-www-mdpi-com.brum.beds.ac.uk/2076-3417/10/23/8342/s1, IR studies, Figure S1: the deviation for DMA between the calculated density (ρcal) using Equation (1) fitted by the experimental value in this work and the literature value (ρlit), Figure S2: the deviation for DMF between the calculated density (ρcal) using Equation (1) fitted by the experimental value in this work and the literature value (ρlit), Figure S3: the deviation for DMSO between the calculated density (ρcal) using Equation (1) fitted by the experimental value in this work and the literature value (ρlit), Figure S4: density of [C6mim][OAc] with DMA as a function of the temperature at atmospheric pressure, Figure S5: density of [C6mim][OAc] with DMF as a function of the temperature at atmospheric pressure, Figure S6: density of [C6mim][OAc] with DMSO as a function of the temperature at atmospheric pressure, Figure S7: the excess molar volume of [C6mim][OAc] with DMA as a function of IL mole fraction at atmospheric pressure, Figure S8: the excess molar volume of [C6mim][OAc] with DMF as a function of IL mole fraction at atmospheric pressure, Figure S9: the excess molar volume of [C6mim][OAc] with DMSO as a function of IL mole fraction at atmospheric pressure, Figure S10: the deviation for DMA between the calculated viscosity (ηcal) using Equation (7) fitted by the experimental value in this work and the literature value (ηlit), Figure S11: the deviation for DMF between the calculated viscosity (ηcal) using Equation (7) fitted by the experimental value in this work and the literature value (ηlit), Figure S12: the deviation for DMSO between the calculated viscosity (ηcal) using Equation (7) fitted by the experimental value in this work and the literature value (ηlit), Figure S13: viscosity of [C6mim][OAc] with DMA as a function of IL mole fraction at atmospheric pressure, Figure S14: viscosity of [C6mim][OAc] with DMF as a function of IL mole fraction at atmospheric pressure, Figure S15: viscosity of [C6mim][OAc] with DMSO as a function of IL mole fraction at atmospheric pressure, Figure S16: the viscosity deviation of [C6mim][OAc] with DMA as a function of IL mole fraction at atmospheric pressure, Figure S17: the viscosity deviation of [C6mim][OAc] with DMF as a function of IL mole fraction at atmospheric pressure, Figure S18: the viscosity deviation of [C6mim][OAc] with DMSO as a function of IL mole fraction at atmospheric pressure, Figure S19: infrared spectra of pure IL with/without solvent of DMA, Figure S20: infrared spectra of pure IL with/without solvent of DMF, Figure S21: infrared spectra of pure IL with/without solvent of DMSO, Table S1: parameters fitted by the experimental data in this work for Equation (4).
Author Contributions
Conceptualization, F.Y.; Methodology, F.Y.; Software, F.Y.; Validation, F.Y.; Formal Analysis, F.Y.; Investigation, F.Y.; Resources, F.Y.; Data Curation, P.F.; Writing-Original Draft Preparation, F.Y.; Writing-Review & Editing, F.Y.; Visualization, F.Y.; Supervision, F.Y.; Project Administration, F.Y.; Funding Acquisition, F.Y. All authors have read and agreed to the published version of the manuscript.
Funding
This research was funded by National Natural Science Foundation of China grant number [51976166].
Conflicts of Interest
The authors declare no conflict of interest.
References
- Yang, F.; Liu, Z.; Afzal, W.; Liu, Z.; Bell, A.T.; Prausnitz, J.M. Pretreatment of Miscanthus giganteus with Lime and Oxidants for Biofuels. Energy Fuels 2015, 29, 1743–1750. [Google Scholar] [CrossRef] [Green Version]
- Swatloski, R.P.; Spear, S.K.; Holbrey, J.D.; Rogers, R.D. Dissolution of Cellose with Ionic Liquids. J. Am. Chem. Soc. 2002, 124, 4974–4975. [Google Scholar] [CrossRef] [PubMed]
- Li, Y.; Wang, J.; Liu, X.; Zhang, S. Towards a molecular understanding of cellulose dissolution in ionic liquids: Anion/cation effect, synergistic mechanism and physicochemical aspects. Chem. Sci. 2018, 9, 4027–4043. [Google Scholar] [CrossRef] [PubMed] [Green Version]
- Halder, P.; Kundu, S.; Patel, S.; Setiawan, A.; Atkin, R.; Parthasarthy, R.; Paz-Ferreiro, J.; Surapaneni, A.; Shah, K. Progress on the pre-treatment of lignocellulosic biomass employing ionic liquids. Renew. Sustain. Energy Rev. 2019, 105, 268–292. [Google Scholar] [CrossRef]
- Brandt, A.; Gräsvik, J.; Hallett, J.P.; Welton, T. Deconstruction of lignocellulosic biomass with ionic liquids. Green Chem. 2013, 15, 550–583. [Google Scholar] [CrossRef] [Green Version]
- Martins, M.A.R.; Neves, C.M.S.S.; Kurnia, K.A.; Carvalho, P.J.; Rocha, M.A.A.; Santos, L.M.N.B.F.; Pinho, S.P.; Freire, M.G. Densities, viscosities and derived thermophysical properties of water-saturated imidazolium-based ionic liquids. Fluid Phase Equilib. 2016, 407, 188–196. [Google Scholar] [CrossRef] [Green Version]
- Yang, F.; Wang, X.; Chen, Q.; Tan, H. Improvement of the properties of 1-ethyl-3-methylimidazolium acetate using organic solvents for biofuel process. J. Mol. Liq. 2019, 284, 82–91. [Google Scholar] [CrossRef]
- Wang, S.; Zhao, W.; Lee, T.S.; Singer, S.W.; Simmons, B.A.; Singh, S.; Yuan, Q.; Cheng, G. Dimethyl Sulfoxide Assisted Ionic Liquid Pretreatment of Switchgrass for Isoprenol Production. ACS Sustain. Chem. Eng. 2018, 6, 4354–4361. [Google Scholar] [CrossRef]
- Gericke, M.; Liebert, T.; Seoud, O.A.E.; Heinze, T. Tailored Media for Homogeneous Cellulose Chemistry: Ionic Liquid/Co-Solvent Mixtures. Macromol. Mater. Eng. 2011, 296, 483–493. [Google Scholar] [CrossRef]
- Fillion, J.J.; Xia, H.; Desilva, M.A.; Quiroz-Guzman, M.; Brennecke, J.F. Phase Transitions, Decomposition Temperatures, Viscosities, and Densities of Phosphonium, Ammonium, and Imidazolium Ionic Liquids with Aprotic Heterocyclic Anions. J. Chem. Eng. Data 2016, 61, 2897–2914. [Google Scholar] [CrossRef]
- Ma, X.-X.; Wei, J.; Zhang, Q.-B.; Tian, F.; Feng, Y.-Y.; Guan, W. Prediction of Thermophysical Properties of Acetate-Based Ionic Liquids Using Semiempirical Methods. Ind. Eng. Chem. Res. 2013, 52, 9490–9496. [Google Scholar] [CrossRef]
- Possolo, A. The NIST Simple Guide for Evaluating and Expressing Measurement Uncertainty. J. Phys. Conf. Ser. 2016, 772, 012024. [Google Scholar]
- Yang, F.; Ma, Q.; Wang, X.; Liu, Z. Effect of organic solvents on lowering the viscosity of 1-hexyl-3-methylimidazolium chloride. J. Chem. Thermodyn. 2017, 113, 358–368. [Google Scholar] [CrossRef]
- Gadžurić, S.; Tot, A.; Zec, N.; Papović, S.; Vraneš, M. Volumetric Properties of Binary Mixtures of 1-Butyl-1-Methylpyrrolidinium Tris(pentafluoroethyl)trifluorophosphate with N-Methylformamide, N-Ethylformamide, N,N-Dimethylformamide, N,N-Dibutylformamide, and N,N-Dimethylacetamide from (293.15 to 323.15) K. J. Chem. Eng. Data 2014, 59, 1225–1231. [Google Scholar] [CrossRef]
- Papamatthaiakis, D.; Aroni, F.; Havredaki, V. Isentropic compressibilities of (amide+water) mixtures: A comparative study. J. Chem. Thermodyn. 2008, 40, 107–118. [Google Scholar] [CrossRef]
- Xu, L.; Lin, G.; Wang, X.; Lin, R. Densities and volumetric properties of 2-chloroethanol with N,N-dimethylformamide and water at different temperatures. J. Mol. Liq. 2006, 123, 130–133. [Google Scholar] [CrossRef]
- Fan, X.-H.; Chen, Y.-P.; Su, C.-S. Density and Viscosity Measurements for Binary Mixtures of 1-Ethyl-3-methylimidazolium Tetrafluoroborate ([Emim][BF4]) with Dimethylacetamide, Dimethylformamide, and Dimethyl Sulfoxide. J. Chem. Eng. Data 2016, 61, 920–927. [Google Scholar] [CrossRef]
- Iulian, O.; Ciocirlan, O. Volumetric Properties of Binary Mixtures of Two 1-Alkyl-3-Methylimidazolium Tetrafluoroborate Ionic Liquids with Molecular Solvents. J. Chem. Eng. Data 2012, 57, 2640–2646. [Google Scholar] [CrossRef]
- García-Giménez, P.; Martínez-López, J.F.; Blanco, S.T.; Velasco, I.; Otín, S. Densities and Isothermal Compressibilities at Pressures up to 20 MPa of the Systems N,N-Dimethylformamide or N,N-Dimethylacetamide + 1-Chloroalkane. J. Chem. Eng. Data 2007, 52, 1693–1699. [Google Scholar] [CrossRef]
- Watanabe, M.; Kodama, D.; Makino, T.; Kanakubo, M. Density, Viscosity, and Electrical Conductivity of Protic Amidium Bis(trifluoromethanesulfonyl)amide Ionic Liquids. J. Chem. Eng. Data 2016, 61, 4215–4221. [Google Scholar] [CrossRef]
- Krakowiak, J.; Koziel, H.; Grzybkowski, W. Apparent molar volumes of divalent transition metal perchlorates and chlorides in N,N-dimethylacetamide. J. Mol. Liq. 2005, 118, 57–65. [Google Scholar] [CrossRef]
- Zarei, H.; Golroudbari, S.A.; Behroozi, M. Experimental studies on volumetric and viscometric properties of binary and ternary mixtures of N,N-dimethylacetamide, N-methylformamide and propane-1,2-diol at different temperatures. J. Mol. Liq. 2013, 187, 260–265. [Google Scholar] [CrossRef]
- Nain, A.K. Densities, ultrasonic speeds, viscosities and excess properties of binary mixtures of methyl methacrylate with N,N-dimethylformamide and N,N-dimethylacetamide at different temperatures. J. Chem. Thermodyn. 2013, 60, 105–116. [Google Scholar] [CrossRef]
- Płaczek, A.; Koziel, H.; Grzybkowski, W. Apparent Molar Compressibilities and Volumes of Some 1,1-Electrolytes in N,N-Dimethylacetamide and N,N-Dimethylformamide. J. Chem. Eng. Data 2007, 52, 699–706. [Google Scholar] [CrossRef]
- Warmińska, D.; Fuchs, A.; Lundberg, D. Apparent molar volumes and compressibilities of lanthanum, gadolinium, lutetium and sodium trifluoromethanesulfonates in N,N-dimethylformamide and N,N-dimethylacetamide. J. Chem. Thermodyn. 2013, 58, 46–54. [Google Scholar] [CrossRef]
- Wu, J.-Y.; Chen, Y.-P.; Su, C.-S. Density and Viscosity of Ionic Liquid Binary Mixtures of 1-n-Butyl-3-methylimidazolium Tetrafluoroborate with Acetonitrile, N,N-Dimethylacetamide, Methanol, and N-Methyl-2-pyrrolidone. J. Solut. Chem. 2015, 44, 395–412. [Google Scholar] [CrossRef]
- Zarei, H.; Keley, V. PρT measurement and PC-SAFT modeling of N,N-dimethyl formamide, N -methyl formamide, N,N-dimethyl acetamide, and ethylenediamine from T=(293.15–423.15) K and pressures up to 35 MPa. Fluid Phase Equilib. 2016, 427, 583–593. [Google Scholar] [CrossRef]
- Vraneš, M.; Tot, A.; Zec, N.; Papović, S.; Gadžurić, S. Volumetric Properties of Binary Mixtures of 1-Butyl-3-Methylimidazolium Tris(pentafluoroethyl)trifluorophosphate with N-Methylformamide, N-Ethylformamide, N,N-Dimethylformamide, N,N-Dibutylformamide, and N,N-Dimethylacetamide from (293.15 to 323.15) K. J. Chem. Eng. Data 2014, 59, 3372–3379. [Google Scholar] [CrossRef]
- Easteal, A.J.; Woolf, L.A. Self-diffusion and volumetric measurements for N-methyl-formamide and N,N-dimethylformamide at temperatures from 240 to 313 K and pressures up to 300 MPa. J. Chem. Soc. Faraday Trans. 1 1985, 81, 2821–2833. [Google Scholar] [CrossRef]
- Bernal-García, J.M.; Guzmán-López, A.; Cabrales-Torres, A.; Estrada-Baltazar, A.; Iglesias-Silva, G.A. Densities and Viscosities of (N,N-Dimethylformamide + Water) at Atmospheric Pressure from (283.15 to 353.15) K. J. Chem. Eng. Data 2008, 53, 1024–1027. [Google Scholar] [CrossRef]
- Venkatesu, P.; Lee, M.J.; Lin, H.M. Volumetric properties of (N,N-dimethylformamide + aliphatic diethers) at temperatures ranging from (298.15 to 358.15) K. J. Chem. Thermodyn. 2005, 37, 996–1002. [Google Scholar] [CrossRef]
- Kahl, H.; Wadewitz, T.; Winkelmann, J. Surface Tension of Pure Liquids and Binary Liquid Mixtures. J. Chem. Eng. Data 2003, 48, 580–586. [Google Scholar] [CrossRef]
- Yang, C.; He, G.; He, Y.; Ma, P. Densities and Viscosities of N,N-Dimethylformamide + N-Methyl-2-pyrrolidinone and + Dimethyl Sulfoxide in the Temperature Range (303.15 to 353.15) K. J. Chem. Eng. Data 2008, 53, 1639–1642. [Google Scholar] [CrossRef]
- Yang, C.; Wei, G.; Li, Y. Densities and Viscosities of N,N-Dimethylformamide + Formic Acid, and + Acetic Acid in the Temperature Range from (303.15 to 353.15) K. J. Chem. Eng. Data 2008, 53, 1211–1215. [Google Scholar] [CrossRef]
- Losetty, V.; Wilfred, C.D.; Shekar, M.C. Synthesis and study of ionic interactions by volumetric, transport, FT-IR and computational methods of alkyl imidazolium acetate ionic liquid with molecular solvents (DMSO, DMF & EG) at T=(293.15–363.15) K. J. Mol. Liq. 2016, 224, 480–491. [Google Scholar]
- Geng, Y.; Wang, T.; Yu, D.; Peng, C.; Liu, H.; Hu, Y. Densities and Viscosities of the Ionic Liquid [C4mim][PF6]+ N, N-dimethylformamide Binary Mixtures at 293.15 K to 318.15 K. Chin. J. Chem. Eng. 2008, 16, 256–262. [Google Scholar] [CrossRef]
- Sadeghi, R.; Shekaari, H.; Hosseini, R. Volumetric and Isentropic Compressibility Behavior of Ionic Liquid, 1-Propyl-3-Methylimidazolium Bromide in Acetonitrile, Dimethylformamide, and Dimethylsulfoxide at T = (288.15 to 308.15) K. Int. J. Thermophys. 2009, 30, 1491. [Google Scholar] [CrossRef]
- Vranes, M.; Dozic, S.; Djeric, V.; Gadzuric, S. Volumetric properties of ammonium nitrate in N,N-dimethylformamide. J. Chem. Thermodyn. 2012, 54, 245–249. [Google Scholar] [CrossRef]
- Vraneš, M.B.; Dožić, S.; Djerić, V.; Gadžurić, S.B. Volumetric Properties of Binary Mixtures of 1-Butyl-1-methylpyrrolidinium Bis(trifluoromethylsulfonyl)imide with N-Methylformamide and N,N-Dimethylformamide from (293.15 to 323.15) K. J. Chem. Eng. Data 2013, 58, 1092–1102. [Google Scholar] [CrossRef]
- Wang, J.; Tian, Y.; Zhao, Y.; Zhuo, K. A volumetric and viscosity study for the mixtures of 1-n-butyl-3-methylimidazolium tetrafluoroborate ionic liquid with acetonitrile, dichloromethane, 2-butanone and N, N – dimethylformamide. Green Chem. 2003, 5, 618–622. [Google Scholar] [CrossRef]
- Campbell, A.N. Density and vapor-pressure of dimethylsulfoxide at various temperatures and the (hypothetical) critical density. Can. J. Chem. 1979, 57, 705–707. [Google Scholar] [CrossRef]
- Egorov, G.I.; Makarov, D.M.; Kolker, A.M. Densities and Volumetric Properties of Ethylene Glycol + Dimethylsulfoxide Mixtures at Temperatures of (278.15 to 323.15) K and Pressures of (0.1 to 100) MPa. J. Chem. Eng. Data 2010, 55, 3481–3488. [Google Scholar] [CrossRef]
- Casteel, J.F.; Sears, P.G. Dielectric constants, viscosities, and related physical properties of 10 liquid sulfoxides and sulfones at several temperatures. J. Chem. Eng. Data 1974, 19, 196–200. [Google Scholar] [CrossRef]
- Ciocirlan, O.; Croitoru, O.; Iulian, O. Viscosity of binary mixtures of 1-ethyl-3-methylimidazolium tetrafluoroborate ionic liquid with four organic solvents. J. Chem. Thermodyn. 2016, 101, 285–292. [Google Scholar] [CrossRef]
- Wang, X.; Yang, F.; Gao, Y.; Liu, Z. Volumetric properties of binary mixtures of dimethyl sulfoxide with amines from (293.15 to 363.15) K. J. Chem. Thermodyn. 2013, 57, 145–151. [Google Scholar] [CrossRef]
- Egorov, G.I.; Makarov, D.M. Compressibility of ethylene glycol-dimethyl sulfoxide mixtures over the pressure range 0.1–100 MPa at 308.15 K. Russ. J. Phys. Chem. A 2011, 85, 171–178. [Google Scholar] [CrossRef]
- De Pablo, L.; Segovia, J.J.; Martín, A.; Martín, M.C.; Bermejo, M.D. Determination of density, viscosity and vapor pressures of mixtures of dimethyl sulfoxide+1-allyl-3-methylimidazolium chloride at atmospheric pressure. J. Chem. Thermodyn. 2018, 123, 185–194. [Google Scholar] [CrossRef]
- De Pablo, L.; Segovia Puras, J.J.; Martín, C.; Bermejo, M.D. Determination of Density and Viscosity of Binary Mixtures of Water and Dimethyl Sulfoxide with 1-Ethyl-3-methylimidazolium Diethylphosphate [EtMeIm]+[Et2PO4]− at Atmospheric Pressure. J. Chem. Eng. Data 2018, 63, 1053–1064. [Google Scholar] [CrossRef]
- Amararene, F.; Balz, P.; Bouallou, C.; Cadours, R.; Lecomte, F.; Mougin, P.; Richon, D. Densities of Water + Diethanolamine + Methanol and Water + N-Methyldiethanolamine + Methanol at Temperatures Ranging from (283.15 to 353.15) K. J. Chem. Eng. Data 2003, 48, 1565–1570. [Google Scholar] [CrossRef]
- Rodríguez, H.; Brennecke, J.F. Temperature and Composition Dependence of the Density and Viscosity of Binary Mixtures of Water + Ionic Liquid. J. Chem. Eng. Data 2006, 51, 2145–2155. [Google Scholar] [CrossRef]
- Cocchi, M.; Manfredini, M.; Manzini, D.; Marchetti, A.; Sighinolfi, S.; Tassi, L.; Ulrici, A.; Vignali, M.; Zannini, P. Viscosimetric properties and internal structure of N,N-dimethylformamide + 1,2-dimethoxyethane binary mixtures. J. Mol. Liq. 2003, 102, 309–345. [Google Scholar] [CrossRef]
- Ciocirlan, O.; Iulian, O. Properties of Pure 1-Butyl-2,3-dimethylimidazolium Tetrafluoroborate Ionic Liquid and Its Binary Mixtures with Dimethyl Sulfoxide and Acetonitrile. J. Chem. Eng. Data 2012, 57, 3142–3148. [Google Scholar] [CrossRef]
- Almeida, H.F.D.; Canongia Lopes, J.N.; Rebelo, L.P.N.; Coutinho, J.A.P.; Freire, M.G.; Marrucho, I.M. Densities and Viscosities of Mixtures of Two Ionic Liquids Containing a Common Cation. J. Chem. Eng. Data 2016, 61, 2828–2843. [Google Scholar] [CrossRef]
- Radhi, A.; Le, K.A.; Ries, M.E.; Budtova, T. Macroscopic and Microscopic Study of 1-Ethyl-3-methyl-imidazolium Acetate–DMSO Mixtures. J. Phys. Chem. B 2015, 119, 1633–1640. [Google Scholar] [CrossRef]
- Gaciño, F.M.; Comuñas, M.J.P.; Fernández, J.; Mylona, S.K.; Assael, M.J. Correlation and Prediction of Dense Fluid Transport Coefficients. IX. Ionic Liquids. Int. J. Thermophys. 2014, 35, 812–829. [Google Scholar] [CrossRef]
- Warrier, P.; Teja, A.S. Density, Viscosity, and Thermal Conductivity of Mixtures of 1-Ethoxy-1,1,2,2,3,3,4,4,4-nonafluorobutane (HFE 7200) with Methanol and 1-Ethoxybutane. J. Chem. Eng. Data 2011, 56, 4291–4294. [Google Scholar] [CrossRef]
- Hossain, M.Z.; Teja, A.S. Correlation and Prediction of the Transport Properties of Ionic Liquids. Int. J. Thermophys. 2016, 37, 9. [Google Scholar] [CrossRef]
- Ciotta, F.; Trusler, J.P.M.; Vesovic, V. Extended hard-sphere model for the viscosity of dense fluids. Fluid Phase Equilib. 2014, 363, 239–247. [Google Scholar] [CrossRef] [Green Version]
Figure 1.
The deviation between the literature density (ρlit) and the calculated density (ρcal) using Equation (1) fitted with the experimental data in this work for [C6mim][OAc]: ■ ref. [10], □ ref. [11], ★ this work.

Figure 2.
The excess molar volumes for [C6mim] [OAc] with solvents as a function of ionic liquid mole fraction. Dash curve calculated by Equation (4).
Figure 2.
The excess molar volumes for [C6mim] [OAc] with solvents as a function of ionic liquid mole fraction. Dash curve calculated by Equation (4).

Figure 3.
The viscosities of binary mixtures for [C6mim] [OAc] with solvents as a function of ionic liquid mole fraction.
Figure 3.
The viscosities of binary mixtures for [C6mim] [OAc] with solvents as a function of ionic liquid mole fraction.

Figure 4.
The viscosity deviations of binary mixtures for [C6mim] [OAc] with solvents as a function of ionic liquid mole fraction.
Figure 4.
The viscosity deviations of binary mixtures for [C6mim] [OAc] with solvents as a function of ionic liquid mole fraction.


Table 1.
Descriptions of the substances.
| Compound | Abbreviation | Initial Fraction Purity In Mass | Treatment | CAS NO. |
|---|---|---|---|---|
| 1-hexyl-3-methylimidazolium acetate | [C6mim] [OAc] | ≥0.980 | dry | 888320-05-6 |
| N, N-dimethylacetamide | DMA | ≥0.993 | none | 127-19-5 |
| N, N-dimethylformamide | DMF | ≥0.993 | none | 68-12-2 |
| dimethyl sulfoxide | DMSO | ≥0.993 | none | 67-68-5 |
Table 2.
Densities of pure compounds at 303.15 K and atmospheric pressure (0.0967 ± 0.002 MPa).
| Compound | Density/g·cm−3 | |
|---|---|---|
| This Work | Literature | |
| [C6mim] [OAc] | 1.01448 | 1.0135 [10], 1.0139 [11] |
| DMA | 0.93202 | 0.93162 [14], 0.93166 [15] |
| DMF | 0.93841 | 0.93900 [14], 0.93793 [16] |
| DMSO | 1.09056 | 1.09041 [17], 1.09073 [18] |
Table 3.
Experimental densities of [C6mim] [OAc] with dimethylacetamide (DMA) at (0.0967 ± 0.002) MPa from 303.15 to 338.15 K and x is IL mole fraction.
Table 3.
Experimental densities of [C6mim] [OAc] with dimethylacetamide (DMA) at (0.0967 ± 0.002) MPa from 303.15 to 338.15 K and x is IL mole fraction.
| x [C6mim] [OAc] + (1 − x) DMA, ρ/g·cm−3 | ||||||||||
|---|---|---|---|---|---|---|---|---|---|---|
| T/K | x | |||||||||
| 1.000 | 0.880 | 0.776 | 0.606 | 0.473 | 0.366 | 0.278 | 0.204 | 0.064 | 0.000 | |
| 303.15 | 1.01448 | 1.01056 | 1.00664 | 0.99996 | 0.99572 | 0.99027 | 0.98103 | 0.97370 | 0.94956 | 0.93202 |
| 308.15 | 1.01129 | 1.00735 | 1.00351 | 0.99668 | 0.99214 | 0.98568 | 0.97663 | 0.96985 | 0.94516 | 0.92744 |
| 313.15 | 1.00809 | 1.00412 | 1.00027 | 0.99345 | 0.98857 | 0.98149 | 0.97210 | 0.96574 | 0.94073 | 0.92285 |
| 318.15 | 1.00491 | 1.00090 | 0.99704 | 0.99010 | 0.98501 | 0.97770 | 0.96805 | 0.96213 | 0.93631 | 0.91823 |
| 323.15 | 1.00170 | 0.99760 | 0.99380 | 0.98676 | 0.98146 | 0.97402 | 0.96436 | 0.95827 | 0.93188 | 0.91386 |
| 328.15 | 0.99853 | 0.99425 | 0.99055 | 0.98352 | 0.97791 | 0.97054 | 0.96079 | 0.95437 | 0.92746 | 0.90922 |
| 333.15 | 0.99533 | 0.99094 | 0.98732 | 0.98019 | 0.97437 | 0.96694 | 0.95746 | 0.95066 | 0.92302 | 0.90457 |
| 338.15 | 0.99217 | 0.98760 | 0.98409 | 0.97691 | 0.97085 | 0.96339 | 0.95401 | 0.94679 | 0.91860 | 0.89992 |
The relative standard uncertainty (ur) is ur(ρ) = 0.005.
Table 4.
Experimental densities of [C6mim] [OAc] with DMF at (0.0967±0.002) MPa from 303.15 to 338.15 K and x is IL mole fraction.
Table 4.
Experimental densities of [C6mim] [OAc] with DMF at (0.0967±0.002) MPa from 303.15 to 338.15 K and x is IL mole fraction.
| x [C6mim] [OAc] + (1 − x) DMF, ρ/g·cm−3 | ||||||||||
|---|---|---|---|---|---|---|---|---|---|---|
| T/K | x | |||||||||
| 1.000 | 0.860 | 0.744 | 0.564 | 0.430 | 0.326 | 0.244 | 0.177 | 0.054 | 0.000 | |
| 303.15 | 1.01448 | 1.01113 | 1.00781 | 1.00164 | 0.99719 | 0.99332 | 0.98971 | 0.97935 | 0.95381 | 0.93841 |
| 308.15 | 1.01129 | 1.00787 | 1.00445 | 0.99821 | 0.99375 | 0.98989 | 0.98628 | 0.97591 | 0.94931 | 0.93395 |
| 313.15 | 1.00809 | 1.00459 | 1.00109 | 0.99478 | 0.99033 | 0.98646 | 0.98285 | 0.97249 | 0.94481 | 0.92887 |
| 318.15 | 1.00491 | 1.00130 | 0.99773 | 0.99134 | 0.98688 | 0.98301 | 0.97940 | 0.96904 | 0.94030 | 0.92408 |
| 323.15 | 1.00170 | 0.99802 | 0.99439 | 0.98785 | 0.98339 | 0.97953 | 0.97592 | 0.96555 | 0.93578 | 0.91928 |
| 328.15 | 0.99853 | 0.99476 | 0.99107 | 0.98436 | 0.97991 | 0.97604 | 0.97243 | 0.96207 | 0.93124 | 0.91446 |
| 333.15 | 0.99533 | 0.99151 | 0.98775 | 0.98087 | 0.97641 | 0.97255 | 0.96894 | 0.95857 | 0.92670 | 0.90964 |
| 338.15 | 0.99217 | 0.98817 | 0.98427 | 0.97739 | 0.97294 | 0.96907 | 0.96546 | 0.95510 | 0.92216 | 0.90479 |
The relative standard uncertainty (ur) is ur(ρ) = 0.005.
Table 5.
Experimental densities of [C6mim] [OAc] with dimethyl sulfoxide (DMSO)at (0.0967±0.002) MPa from 303.15 to 338.15 K and x is IL mole fraction.
Table 5.
Experimental densities of [C6mim] [OAc] with dimethyl sulfoxide (DMSO)at (0.0967±0.002) MPa from 303.15 to 338.15 K and x is IL mole fraction.
| x [C6mim] [OAc] + (1 − x) DMSO, ρ/g·cm−3 | ||||||||||
|---|---|---|---|---|---|---|---|---|---|---|
| T/K | x | |||||||||
| 1.000 | 0.868 | 0.757 | 0.580 | 0.446 | 0.341 | 0.257 | 0.187 | 0.057 | 0.000 | |
| 303.15 | 1.01448 | 1.01947 | 1.02397 | 1.03453 | 1.04354 | 1.05330 | 1.05923 | 1.06623 | 1.08332 | 1.09056 |
| 308.15 | 1.01129 | 1.01635 | 1.02070 | 1.03103 | 1.03986 | 1.04956 | 1.05528 | 1.06228 | 1.07882 | 1.08558 |
| 313.15 | 1.00809 | 1.01304 | 1.01736 | 1.02741 | 1.03616 | 1.04580 | 1.05120 | 1.05820 | 1.07429 | 1.08060 |
| 318.15 | 1.00491 | 1.00967 | 1.01405 | 1.02390 | 1.03247 | 1.04201 | 1.04708 | 1.05408 | 1.06976 | 1.07562 |
| 323.15 | 1.00170 | 1.00630 | 1.01075 | 1.02031 | 1.02879 | 1.03821 | 1.04315 | 1.05015 | 1.06521 | 1.07064 |
| 328.15 | 0.99853 | 1.00302 | 1.00743 | 1.01683 | 1.02511 | 1.03442 | 1.03896 | 1.04596 | 1.06066 | 1.06566 |
| 333.15 | 0.99533 | 0.99973 | 1.00416 | 1.01326 | 1.02145 | 1.03063 | 1.03497 | 1.04197 | 1.05610 | 1.06067 |
| 338.15 | 0.99217 | 0.99646 | 1.00087 | 1.00981 | 1.01780 | 1.02684 | 1.03088 | 1.03788 | 1.05151 | 1.05568 |
The relative standard uncertainty (ur) is ur(ρ) = 0.005.
Table 6.
Thermal expansion coefficients of [C6mim] [OAc] with organic solvent of DMA.
| x [C6mim] [OAc] + (1 − x) DMA, α/104·K−1 | ||||||||||
|---|---|---|---|---|---|---|---|---|---|---|
| T/K | x | |||||||||
| 1.000 | 0.880 | 0.776 | 0.606 | 0.473 | 0.366 | 0.278 | 0.204 | 0.064 | 0.000 | |
| 303.15 | 6.308 | 6.358 | 6.446 | 6.700 | 7.020 | 7.377 | 7.757 | 8.151 | 9.136 | 9.722 |
| 308.15 | 6.322 | 6.376 | 6.469 | 6.731 | 7.057 | 7.422 | 7.808 | 8.207 | 9.205 | 9.797 |
| 313.15 | 6.336 | 6.395 | 6.492 | 6.762 | 7.096 | 7.467 | 7.860 | 8.265 | 9.275 | 9.873 |
| 318.15 | 6.350 | 6.413 | 6.514 | 6.793 | 7.135 | 7.513 | 7.912 | 8.323 | 9.346 | 9.950 |
| 323.15 | 6.364 | 6.432 | 6.537 | 6.824 | 7.173 | 7.558 | 7.963 | 8.380 | 9.415 | 10.028 |
| 328.15 | 6.378 | 6.451 | 6.561 | 6.855 | 7.212 | 7.605 | 8.016 | 8.439 | 9.488 | 10.106 |
| 333.15 | 6.392 | 6.470 | 6.584 | 6.888 | 7.253 | 7.652 | 8.070 | 8.500 | 9.561 | 10.186 |
| 338.15 | 6.406 | 6.489 | 6.608 | 6.920 | 7.293 | 7.700 | 8.125 | 8.560 | 9.635 | 10.266 |
The relative standard uncertainty (ur) is ur(ρ) = 0.005.
Table 7.
Thermal expansion coefficients of [C6mim] [OAc] with organic solvent of DMF.
| x [C6mim] [OAc] + (1 − x) DMF, α/104·K−1 | ||||||||||
|---|---|---|---|---|---|---|---|---|---|---|
| T/K | x | |||||||||
| 1.000 | 0.860 | 0.744 | 0.564 | 0.430 | 0.326 | 0.244 | 0.177 | 0.054 | 0.000 | |
| 303.15 | 6.308 | 6.368 | 6.479 | 6.789 | 7.168 | 7.585 | 8.017 | 8.457 | 9.556 | 10.201 |
| 308.15 | 6.322 | 6.386 | 6.500 | 6.818 | 7.203 | 7.627 | 8.064 | 8.509 | 9.619 | 10.274 |
| 313.15 | 6.336 | 6.404 | 6.523 | 6.848 | 7.241 | 7.671 | 8.115 | 8.566 | 9.689 | 10.348 |
| 318.15 | 6.350 | 6.423 | 6.545 | 6.878 | 7.279 | 7.715 | 8.164 | 8.622 | 9.757 | 10.422 |
| 323.15 | 6.364 | 6.441 | 6.568 | 6.909 | 7.316 | 7.759 | 8.215 | 8.678 | 9.825 | 10.498 |
| 328.15 | 6.378 | 6.460 | 6.591 | 6.940 | 7.354 | 7.804 | 8.266 | 8.735 | 9.895 | 10.574 |
| 333.15 | 6.392 | 6.479 | 6.614 | 6.971 | 7.393 | 7.850 | 8.318 | 8.793 | 9.966 | 10.651 |
| 338.15 | 6.406 | 6.498 | 6.637 | 7.002 | 7.432 | 7.896 | 8.370 | 8.851 | 10.037 | 10.729 |
The relative standard uncertainty (ur) is ur(ρ) = 0.005.
Table 8.
Thermal expansion coefficients of [C6mim] [OAc] with organic solvent of DMSO.
| x [C6mim] [OAc] + (1 − x) DMSO, α/104·K−1 | ||||||||||
|---|---|---|---|---|---|---|---|---|---|---|
| T/K | x | |||||||||
| 1.000 | 0.868 | 0.757 | 0.580 | 0.446 | 0.341 | 0.257 | 0.187 | 0.057 | 0.000 | |
| 303.15 | 6.308 | 6.396 | 6.500 | 6.739 | 7.004 | 7.285 | 7.575 | 7.877 | 8.654 | 9.126 |
| 308.15 | 6.322 | 6.412 | 6.518 | 6.760 | 7.028 | 7.313 | 7.606 | 7.911 | 8.695 | 9.171 |
| 313.15 | 6.336 | 6.428 | 6.536 | 6.782 | 7.053 | 7.341 | 7.638 | 7.946 | 8.736 | 9.216 |
| 318.15 | 6.350 | 6.444 | 6.553 | 6.803 | 7.078 | 7.370 | 7.669 | 7.981 | 8.778 | 9.262 |
| 323.15 | 6.364 | 6.460 | 6.571 | 6.825 | 7.104 | 7.398 | 7.701 | 8.016 | 8.821 | 9.309 |
| 328.15 | 6.378 | 6.476 | 6.590 | 6.847 | 7.129 | 7.427 | 7.733 | 8.051 | 8.864 | 9.356 |
| 333.15 | 6.392 | 6.493 | 6.608 | 6.869 | 7.155 | 7.456 | 7.766 | 8.087 | 8.907 | 9.403 |
| 338.15 | 6.406 | 6.509 | 6.626 | 6.891 | 7.181 | 7.486 | 7.799 | 8.123 | 8.951 | 9.451 |
The relative standard uncertainty (ur) is ur(ρ) = 0.005.
Table 9.
Viscosities of pure compounds at (0.0967 ± 0.002 MPa).
| Compound | Viscosity/mPa·s | |||
|---|---|---|---|---|
| T/K | This Work | Literature | Relative Deviation/% | |
| [C6mim] [OAc] | 303.15 | 804.52 | 816 [10] | 1.41 |
| 308.15 | 529.18 | 537 [10] | 1.46 | |
| 313.15 | 365.96 | 372 [10] | 1.62 | |
| 318.15 | 260.01 | 265 [10] | 1.88 | |
| 323.15 | 190.39 | 194 [10] | 1.86 | |
| 328.15 | 144.73 | 147 [10] | 1.55 | |
| 333.15 | 110.31 | 113 [10] | 2.38 | |
| 338.15 | 88.11 | 90 [10] | 2.10 | |
| DMA | 303.15 | 0.88 | 0.856 [22], 0.8792 [23] | −2.80, 0.09 |
| DMF | 303.15 | 0.77 | 0.766 [30], 0.759 [33] | −0.52, 1.43 |
| DMSO | 303.15 | 1.81 | 1.843 [44], 1.808 [43] | 1.79, 0.11 |
The relative combined standard uncertainty (uc,r) is uc,r(η) = 0.10.
Table 10.
Experimental viscosities of [C6mim] [OAc] with DMA at (0.0967 ± 0.002) MPa from 303.15 to 338.15 K and x is IL mole fraction.
Table 10.
Experimental viscosities of [C6mim] [OAc] with DMA at (0.0967 ± 0.002) MPa from 303.15 to 338.15 K and x is IL mole fraction.
| x [C6mim] [OAc] + (1 − x) DMA, η/mPa·s | ||||||||||
|---|---|---|---|---|---|---|---|---|---|---|
| T/K | x | |||||||||
| 1.000 | 0.880 | 0.776 | 0.606 | 0.473 | 0.366 | 0.278 | 0.204 | 0.064 | 0.000 | |
| 303.15 | 804.52 | 333.51 | 200.06 | 59.74 | 28.66 | 10.44 | 6.34 | 3.99 | 1.42 | 0.88 |
| 308.15 | 529.18 | 229.16 | 148.59 | 45.98 | 23.53 | 8.62 | 5.49 | 3.66 | 1.27 | 0.83 |
| 313.15 | 365.96 | 176.11 | 110.66 | 37.02 | 19.27 | 7.35 | 4.80 | 3.25 | 1.18 | 0.78 |
| 318.15 | 260.01 | 128.63 | 80.53 | 30.73 | 15.92 | 6.45 | 4.25 | 2.86 | 1.10 | 0.73 |
| 323.15 | 190.39 | 99.42 | 60.91 | 24.39 | 13.28 | 5.64 | 3.68 | 2.58 | 1.03 | 0.70 |
| 328.15 | 144.73 | 77.50 | 46.16 | 20.56 | 11.34 | 4.99 | 3.37 | 2.35 | 0.97 | 0.66 |
| 333.15 | 110.31 | 63.80 | 36.07 | 17.54 | 9.52 | 4.42 | 3.01 | 2.19 | 0.90 | 0.63 |
| 338.15 | 88.11 | 53.21 | 27.32 | 15.32 | 8.21 | 3.89 | 2.73 | 2.06 | 0.87 | 0.60 |
The relative combined standard uncertainty (uc,r) is uc,r(η) = 0.10.
Table 11.
Experimental viscosities of [C6mim] [OAc] with DMF at (0.0967 ± 0.002) MPa from 303.15 to 338.15 K and x is IL mole fraction.
Table 11.
Experimental viscosities of [C6mim] [OAc] with DMF at (0.0967 ± 0.002) MPa from 303.15 to 338.15 K and x is IL mole fraction.
| x [C6mim] [OAc] + (1 − x) DMF, η/mPa·s | ||||||||||
|---|---|---|---|---|---|---|---|---|---|---|
| T/K | x | |||||||||
| 1.000 | 0.860 | 0.744 | 0.564 | 0.430 | 0.326 | 0.244 | 0.177 | 0.054 | 0.000 | |
| 303.15 | 804.52 | 251.76 | 170.00 | 58.35 | 31.54 | 13.33 | 8.43 | 6.95 | 1.39 | 0.77 |
| 308.15 | 529.18 | 194.05 | 122.57 | 44.84 | 25.64 | 11.85 | 7.42 | 5.95 | 1.29 | 0.72 |
| 313.15 | 365.96 | 145.26 | 90.29 | 35.55 | 20.99 | 10.77 | 6.46 | 4.96 | 1.22 | 0.69 |
| 318.15 | 260.01 | 110.98 | 70.48 | 28.78 | 17.75 | 9.64 | 5.66 | 4.26 | 1.17 | 0.65 |
| 323.15 | 190.39 | 85.62 | 58.06 | 22.02 | 15.56 | 8.73 | 5.20 | 3.86 | 1.13 | 0.62 |
| 328.15 | 144.73 | 69.41 | 48.05 | 18.64 | 13.20 | 7.73 | 4.79 | 3.50 | 1.08 | 0.59 |
| 333.15 | 110.31 | 55.69 | 40.93 | 15.73 | 11.23 | 7.17 | 4.41 | 3.26 | 1.04 | 0.56 |
| 338.15 | 88.11 | 43.88 | 34.92 | 13.19 | 9.84 | 6.46 | 4.18 | 2.97 | 1.01 | 0.54 |
The relative combined standard uncertainty (uc,r) is uc,r(η) = 0.10.
Table 12.
Experimental viscosities of [C6mim] [OAc] with DMSO at (0.0967 ± 0.002) MPa from 303.15 to 338.15 K and x is IL mole fraction.
Table 12.
Experimental viscosities of [C6mim] [OAc] with DMSO at (0.0967 ± 0.002) MPa from 303.15 to 338.15 K and x is IL mole fraction.
| x [C6mim] [OAc] + (1 − x) DMSO, η/mPa·s | ||||||||||
|---|---|---|---|---|---|---|---|---|---|---|
| T/K | x | |||||||||
| 1.000 | 0.868 | 0.757 | 0.580 | 0.446 | 0.341 | 0.257 | 0.187 | 0.057 | 0.000 | |
| 303.15 | 804.52 | 415.49 | 253.23 | 73.58 | 40.72 | 18.72 | 9.22 | 4.65 | 2.74 | 1.81 |
| 308.15 | 529.18 | 291.71 | 181.65 | 59.71 | 32.09 | 15.77 | 8.02 | 4.10 | 2.46 | 1.66 |
| 313.15 | 365.96 | 211.71 | 133.22 | 49.18 | 26.55 | 12.97 | 6.93 | 3.65 | 2.21 | 1.52 |
| 318.15 | 260.01 | 155.72 | 99.12 | 41.38 | 21.91 | 10.79 | 5.91 | 3.25 | 2.00 | 1.40 |
| 323.15 | 190.39 | 114.79 | 77.72 | 34.71 | 17.90 | 9.34 | 5.15 | 2.90 | 1.86 | 1.30 |
| 328.15 | 144.73 | 87.91 | 60.42 | 29.13 | 14.75 | 8.06 | 4.66 | 2.59 | 1.72 | 1.20 |
| 333.15 | 110.31 | 68.43 | 46.67 | 24.89 | 12.74 | 7.07 | 4.23 | 2.31 | 1.58 | 1.13 |
| 338.15 | 88.11 | 54.76 | 37.28 | 21.34 | 10.95 | 6.40 | 3.61 | 2.06 | 1.47 | 1.04 |
The relative combined standard uncertainty (uc,r) is uc,r(η) = 0.10.
Table 13.
The parameters for Equation (7), the average absolute relative deviations, and the energy barriers at 303.15 K.
Table 13.
The parameters for Equation (7), the average absolute relative deviations, and the energy barriers at 303.15 K.
| (1 − x) Co-Solvent | x IL | η0/mPa·s | B/K | T0/K | AARD/% | Eη (303.15 K)/kJ·mol−1 |
|---|---|---|---|---|---|---|
| DMA | 1.000 | 0.29 | 713.53 | 213.03 | 0.34 | 67.13 |
| 0.880 | 0.62 | 532.00 | 218.60 | 1.15 | 56.86 | |
| 0.776 | 0.00 | 4731.69 | 30.50 | 0.96 | 48.64 | |
| 0.606 | 0.27 | 553.48 | 200.43 | 0.98 | 40.08 | |
| 0.473 | 0.00 | 1913.12 | 89.26 | 0.44 | 31.95 | |
| 0.366 | 0.27 | 353.04 | 205.97 | 0.93 | 28.57 | |
| 0.278 | 0.08 | 626.69 | 158.80 | 0.47 | 22.98 | |
| 0.204 | 0.10 | 544.50 | 154.29 | 1.39 | 18.77 | |
| 0.064 | 0.31 | 110.03 | 230.29 | 0.52 | 15.84 | |
| 0.000 | 0.06 | 541.64 | 99.64 | 0.10 | 9.99 | |
| DMF | 0.860 | 0.01 | 1844.67 | 126.91 | 1.11 | 45.38 |
| 0.744 | 2.96 | 222.14 | 248.34 | 0.71 | 43.12 | |
| 0.564 | 0.04 | 1001.77 | 166.63 | 1.17 | 41.07 | |
| 0.430 | 0.23 | 568.28 | 187.96 | 0.98 | 32.72 | |
| 0.326 | 0.02 | 1776.25 | 26.16 | 0.68 | 28.22 | |
| 0.244 | 1.13 | 127.29 | 240.03 | 0.75 | 24.42 | |
| 0.177 | 0.78 | 119.72 | 248.63 | 0.98 | 16.95 | |
| 0.054 | 0.62 | 43.92 | 248.21 | 0.40 | 11.12 | |
| 0.000 | 0.12 | 288.97 | 149.77 | 0.25 | 9.39 | |
| DMSO | 0.868 | 0.02 | 1412.70 | 163.95 | 0.63 | 55.71 |
| 0.757 | 0.03 | 1149.61 | 174.13 | 0.80 | 52.77 | |
| 0.580 | 0.04 | 1348.75 | 124.03 | 0.41 | 43.39 | |
| 0.446 | 0.03 | 1163.37 | 144.04 | 0.84 | 35.11 | |
| 0.341 | 0.14 | 586.78 | 183.05 | 1.01 | 31.08 | |
| 0.257 | 0.02 | 1122.56 | 113.98 | 1.31 | 23.97 | |
| 0.187 | 0.00 | 2047.47 | 21.19 | 0.53 | 19.68 | |
| 0.057 | 0.21 | 289.89 | 191.35 | 0.43 | 17.72 | |
| 0.000 | 0.04 | 791.15 | 95.50 | 0.20 | 14.02 |
Table 14.
The fit parameters a, b, and Rη for the hard-sphere theory in Equations (11) and (12).
| IL/Solvent | a × 105 | b × 103 | Rη | AARD | MD |
|---|---|---|---|---|---|
| [C6mim] [OAc] | 12.137 | 21.094 | 8.792 | 0.42 | 1.1 |
| DMA | 4.950 | 3.990 | 1.419 | 0.12 | 0.30 |
| DMF | 1.817 | 7.967 | 3.191 | 0.25 | 0.49 |
| DMSO | 4.766 | 1.713 | 0.7885 | 0.20 | 0.61 |
Table 15.
The parameter Kη for the hard-sphere theory in Equation (17).
| Mixture | Kη | AARD |
|---|---|---|
| IL-DMA | 0 | 16.4 |
| −0.1854 | 15.1 | |
| IL-DMF | 0 | 41.3 |
| −3.512 | 13.1 | |
| IL-DMSO | 0 | 17.8 |
| −0.1976 | 16.7 |
Table 16.
The parameters k12 for the hard-sphere theory in Equation (18).
| Mixture | k12 | AARD |
|---|---|---|
| IL-DMA | 0 | 11.8 |
| 0.3413 | 9.4 | |
| IL-DMF | 0 | 26.8 |
| 1.254 | 15.3 | |
| IL-DMSO | 0 | 14.5 |
| 0.6750 | 9.6 |
Publisher’s Note: MDPI stays neutral with regard to jurisdictional claims in published maps and institutional affiliations. |
© 2020 by the authors. Licensee MDPI, Basel, Switzerland. This article is an open access article distributed under the terms and conditions of the Creative Commons Attribution (CC BY) license (http://creativecommons.org/licenses/by/4.0/).
Share and Cite
MDPI and ACS Style
Yang, F.; Feng, P. Densities and Viscosities of Ionic Liquid with Organic Solvents. Appl. Sci. 2020, 10, 8342. https://0-doi-org.brum.beds.ac.uk/10.3390/app10238342
AMA Style
Yang F, Feng P. Densities and Viscosities of Ionic Liquid with Organic Solvents. Applied Sciences. 2020; 10(23):8342. https://0-doi-org.brum.beds.ac.uk/10.3390/app10238342
Chicago/Turabian StyleYang, Fuxin, and Peng Feng. 2020. "Densities and Viscosities of Ionic Liquid with Organic Solvents" Applied Sciences 10, no. 23: 8342. https://0-doi-org.brum.beds.ac.uk/10.3390/app10238342
Note that from the first issue of 2016, this journal uses article numbers instead of page numbers. See further details here.