Article

Nanoporous Activated Carbon Derived via Pyrolysis Process of Spent Coffee: Structural Characterization. Investigation of Its Use for Hexavalent Chromium Removal

by
Georgios Asimakopoulos
1,
Maria Baikousi
1,
Vasilis Kostas
1,
Marios Papantoniou
1,
Athanasios B. Bourlinos
2,
Radek Zbořil
3,4,
Michael A. Karakassides
1,5,* and
Constantinos E. Salmas
1,*
1
Department of Materials Science and Engineering, University of Ioannina, GR-45110 Ioannina, Greece
2
Physics Department, University of Ioannina, GR-45110 Ioannina, Greece
3
Regional Centre of Advanced Technologies and Materials, Faculty of Science, Department of Physical Chemistry and Experimental Physics, Palacky University, 77146 Olomouc, Czech Republic
4
Nanotechnology Centre, VŠB—Technical University of Ostrava, 17. listopadu 2172/15, 70800 Ostrava-Poruba, Czech Republic
5
Institute of Materials Science and Computing, University Research Center of Ioannina (URCI), 45110 Ioannina, Greece
*
Authors to whom correspondence should be addressed.
Submission received: 30 October 2020 / Revised: 2 December 2020 / Accepted: 4 December 2020 / Published: 9 December 2020
(This article belongs to the Special Issue Characterization and Application of Nanoporous Materials)

Abstract

:

Featured Application

This work deals with the development of an activated carbon adsorber via the exploitation of spent coffee waste. Economic and environmental benefits from such processes are extended. The application on hexavalent chromium removal was tested.

Abstract

Hexavalent chromium (Cr(VI)) is a heavy metal that is highly soluble and exhibits toxic effects on biological systems. Nevertheless, it is used in many industrial applications. The adsorption process of Cr(VI), using activated carbon (AC), is under investigation globally. On the other hand, around six million tons of spent coffee is sent to landfill annually. In the spirit of cyclic economy, this research investigated the production of AC from spent coffee for the removal of Cr(VI) from wastewater. The AC was produced via pyrolysis process under a nitrogen atmosphere. Chemical activation using potassium hydroxide (KOH) occurred simultaneously with the pyrolysis process. The produced AC was tested as an absorber of Cr(VI). The best fitted kinetic model was the diffusion–chemisorption model. A 24-h adsorption experiment was carried out using a solution with a pH of 3 and an initial Cr(VI) concentration of 54.14 ppm. This resulted in an experimental maximum capacity of 109 mg/g, while the theoretical prediction was 137 mg/g. It also resulted in an initial adsorption rate (ri) of 110 (mg/(g h)). The Brunauer–Emmett–Teller surface area (SgBET) was 1372 m2/g, the Langmuir surface area (SgLang.) was 1875 m2/g, and the corrugated pore structure model surface area (SgCPSM) was 1869 m2/g. The micropore volume was 84.6%, exhibiting micropores at Dmicro1 = 1.28 and Dmicro2 = 1.6 nm. The tortuosity factor (τ) was 4.65.

1. Introduction

Nowadays, the cyclic economy spirit globally makes imperative the need for exploitation of biomass and biowaste to balance the impact of industrial activities on environmental pollution and public health. One of the biomass exploitation products is the biomass derived from activated carbon (AC). Since the age of the ancient Egyptians, biomass-derived activated carbon (AC) has been used to enhance land fertility, as fuel, or in medical applications. Activated carbon (AC) is also used in many advanced applications such as catalyst supports, electrode materials, air filters, and gas storage, and since 1800, as an adsorbent for wastewater treatment [1,2,3,4]. The last one is of great importance because clean water supply scarcity is one of the major problems in our days [5]. As a result, the world requirements for activated carbon (AC) are expected to increase dramatically and to reach the amount of 5424.9 kilotons by the year 2021 [6]. The USA and China will be the two largest markets of AC. Τhis high demand will cause a high increase in the cost of AC [7] and consequently a limitation of the applications of AC as an adsorbent. A promising and ecofriendly approach to handle this problem is the production of activated carbon derived from biomass or biowaste [8]. Various adsorbents have been developed and used to remove dyes and other organic compounds from water. Among them, activated carbon (AC) is one of the most wildly used. This is because it has a well-developed pore structure with a high specific pore surface area, large pore volume, low density, high chemical resistance, and high adsorption capacity for various organic compounds [9]. Spent coffee (SCF) is a biowaste, the main quantity of which, following the linear economy model, ends up in a landfill. According to a study for the city of Sydney, this amount is around 93% of an annual quantity of 3000 tonnes of waste coffee grounds. The turn to the circular economy model proposes the exploitation of this biowaste for energy and high added value material production [10]. One of the major interests of these materials is the activated carbon (AC) produced via pyrolysis of spent coffee (SCF) and used for hexavalent chromium (Cr(VI)) removal. Hexavalent chromium (Cr(VI)) is considered to be one of the most toxic heavy metals. According to the World Health Organization (WHO), the permissible level in the water is 0.05 ppm [11]. This toxic pollutant waste is derived from chemical and metallurgical industries. The wastewater from such industrial activities contains 0.5–270 ppm of Cr(VI). For such concentrations, water purification is of vital importance. Nowadays, several researchers are investigating one of the most popular, simple, and eco-friendly methods for water treatment. This method is the adsorption of Cr(VI) on activated carbon (AC) originated from biomass or biowaste pyrolysis process. Spent coffee (SCF) is one of such biosources [12,13,14]. Although many conventional processes exhibited promising results for hexavalent chromium (Cr(VI)) removal from wastewater (e.g., chemical precipitation, ion exchange, membrane filtration, electrochemical treatment, and adsorption) [15,16,17,18], each one of these processes also exhibited limitations [11]. Our method is an ecofriendly method, is not a high-cost process because the precursor material is waste, and exhibits high adsorption potential to reduce Cr(VI) concentration close to values required by the legislation.
The main aim of this work was to combine the benefits of spent coffee biowaste valorization and wastewater purification through Cr(VI) removal by adsorption in bio-activated carbon. This attempt was expected to be successful because of the micropore structure of the produced AC. Similar studies are reported in literature where the exploitation of different biomass raw materials (e.g., cocoa shell, bamboo fibers, coconut shell, orange peel, palm shell, rice husk, sawdust, walnut shell, and Macoré fruit shell) led to the production of AC with a high specific surface area [19,20,21,22,23,24,25,26]. Furthermore, this attempt was expected to be successful considering other reported results in literature where AC was produced from spent coffee via different processes (pyrolysis, microwaves, ultrasonic, using potassium hydroxide (KOH), using phosphoric acid (H3PO4), using sulfuric acid (H2SO4), etc.), and tested for Cr(VI) adsorption capability. According to these results, the adsorption capacity was from 22.75 mg/g [27] to 157 mg/g [28].

2. Materials and Methods

2.1. Materials

Spent coffee was collected from the student café of the University of Ioannina. After a drying procedure at 80 °C, it was used for AC production via pyrolysis in a nitrogen atmosphere. Potassium hydroxide (KOH, 85%), purchased from Riedel-de Haen company (Darmstadt, Germany), was used as a chemical activation reagent. For Cr(VI) removal kinetic measurements, potassium dichromate (K2Cr2O7, 99.98%), 1,5-diphenylcarbazide (≥97%), and phosphoric acid (H3PO4, 85%), purchased from Sigma-Aldrich (Steinheim, Germany), were used. Hydrochloric acid (HCl, 37%) and acetone (99.9%), purchased from Merck (Darmstadt, Germany), were also used.

2.2. Preparation of Activated Carbon

Activated carbon (AC@SCF) was produced via the pyrolysis process of spent coffee. After drying for 24 h at 80 °C, an amount of 5 g of spent coffee was impregnated with KOH aqueous solution (5 g KOH/100 mL H2O). Seven different samples from the produced sludge were heated up at seven different temperatures (i.e., 450 °C, 500 °C, 550 °C, 600 °C, 650 °C, 700 °C, and 800 °C) and kept at this temperature for 2 h. This heating procedure was carried out under an inert atmosphere (nitrogen flow of 0.2 mL/min) to estimate the optimum temperature for this process. The criterion for this estimation was the specific surface area of the produced AC@SCF. It was observed that, for pyrolysis temperatures equal to or higher than 650 °C, the specific surface area and the micropore volume fraction of the produced AC were almost stable, and the chosen temperature value of 650 °C was the optimum. The pyrolysis process took place in a muffle furnace mounted with a controlling atmosphere system and the temperature increasing rate was 5 °C/min. The cooling process was carried out for 24 h randomly just by switching off the furnace, but always under an inert atmosphere. The produced activated carbon was added to an HCl solution (1 N) and stirred for 2 h. Sequentially, the liquid was filtered and the precipitate was washed with deionized water to a neutral pH of approximately 7. The final material was dried at 80 °C for 24 h and tested for its Cr(VI) removal capacity.

2.3. Batch Experiments

A precursor Cr(VI) aqueous solution was prepared by dissolving an appropriate amount of K2Cr2O7 with distilled water, targeting an initial Cr(VI) concentration of 1 mg/mL in the precursor solution. Solutions with various concentrations were achieved by the dilution of this precursor solution with deionized water. Solutions with an initial Cr(VI) concentration of 6 ppm were used to investigate the optimum pH value for the adsorption process. The tested pH values were in the range of 1.5–5.5 and were adjusted using a 0.1 N HCl aqueous solution. The optimum pH value was 3. After this, hexavalent chromium aqueous solutions with the optimum pH value (i.e., pH = 3) and with various initial concentrations (i.e., 5.23, 14,55, 20,94, 26.73, 35.40, 45, and 54.14 ppm) were prepared. All these solutions were treated with AC@SCF at 21 °C. More specifically, AC@SCF powder was added to these solutions in a final concentration of 180 mg/L and stirred for 24 h at 21 °C in a lab-scale batch reactor. Sequentially, a sample of 5 mL was centrifuged immediately and a smaller amount from the overnatant solution was measured colorimetrically, while the rest of the sample was returned to the reactor. To carry out these colorimetrical measurements, the overnatant sample was mixed with 1,5-diphenylcarbazide for the formation of a chromium–1,5-diphenylcarbazide complex. This complex exhibited a red-purple colour, and the Cr(VI) concentrations were calculated via the light absorbance of such samples at 540 nm. A calibration curve was developed before these measurements using solutions with standard Cr(VI) concentrations (i.e., 0–1 mg/L). The interpretation of the light absorbance measurements led to adsorption kinetic results for Cr(VI) sorption process in AC@SCF.

2.3.1. Kinetic Study for the Sorption Process of Cr(VI) in AC@SCF

The Cr(VI) removal capacity of AC@SCF depends on the contact time as well as Cr(VI) initial concentration. Kinetic experiments were carried out at pH = 3, temperature T = 21 °C, and for five Cr(VI) initial concentrations (i.e., 5.23, 20.94, 26.73, 35.40, and 54.14 ppm). Samples, each of 5 mL, were withdrawn from the liquid solutions at different periods (0, 0.5, 1, 2, 3, 6, 9, and 24 h), centrifuged, and titrated for Cr(VI) concentration determination. Measurements are depicted as relative liquid Cr(VI) concentration, that is, C(t)/Cinit versus contact time t (h). A further transformation of these experimental measurements was carried out taking into account that the solid activated carbon concentration in the liquid was 180 mg/L. The kinetic curves are depicted as adsorbed Cr(VI) concentration in AC@SCF solid q(t) (mg/g) versus contact time t (h).
Four kinetic models were used to interpret these data. The first two models were based on the mass balance equations for a continuous stirred batch reactor, assuming complete mixing (ideal) conditions. For an nth order process, this equation is as follows:
d q ( t ) d t = k n × [ q e q ( t ) ] n
where q(t) (mgCr(VI)/gAC) is the total Cr(VI) adsorbed in AC@SCF activated carbon after t (h) contact time, qe (mgCr(VI)/gAC) is the total Cr(VI) adsorbed to AC@SCF activated carbon at equilibrium stage (t→∞), and kn ((gAC/mgCr(VI))n−1 h−1) is the sorption rate constant for an nth order adsorption process. The initial rate ri for such an adsorption process becomes by the substitution of t = 0 and q(t) = 0 to Equation (1) and reads as:
r i = d q ( t ) d t | t = 0 = k n × q e n
By the substitution of n = 1 and n = 2 to Equations (1) and (2), we achieved the most commonly used kinetic models of pseudo-first and pseudo-second orders [29,30].

Pseudo-First Order Kinetic Model

For a process with a first-order kinetic (n = 1), Equation (1) is transformed to Equation (3) and assuming the boundary conditions q(t) = 0 at t = 0 and q(t) = qt at t = t, the definite integration of Equation (3) leads to Equation (4). Moreover, the initial adsorption rate is derived from Equation (3) by assuming qt = 0 for t = 0 and it is described by the Equation (5).
d q t d t = k 1 × ( q e q t )
q t = q e × ( 1 e k 1 × t )
r i = d q t d t | t = 0 = k 1 × q e

Pseudo-Second Order Kinetic Model

For a process with a second-order kinetic (n = 2), the mass balance of Equation (1) is transformed as follows [30]:
d q t d t = k 2 × ( q e q t ) 2
The definite integration of the above mass balance, using qt = 0 for t = 0 and qt = t for t = t as boundary conditions, gives the following expression:
q t = q e 2 × k 2 × t q e × k 2 × t + 1
Furthermore, the initial rate for this second-order model is as follows:
r i = d q t d t | t = 0 = k 2 × q e 2

Intraparticle Diffusion Kinetic Model

Weber and Morris (1962) [31] proposed Equation (9) as a semi-empirical equation for the calculation of the rate of the intraparticle diffusion process.
q t = K I D × t 1 2 + c
Similarly to the abovementioned models, the qt (mgCR(VI)/gAC@SCF) variable is the adsorbate uptake on the activated carbon at time t (h). Moreover, the constant KID (mg/(g h1/2)) is rate constant considering the intraparticle diffusion process and C (mg/g) is an index of the boundary layer thickness at the surface of the AC@SCF particles.

Diffusion–Chemisorption Kinetic Model

Sutherland (2004) [32] expressed the following empirical differential equation which describes the diffusion–chemisorption process:
d q t d t = n × K D C × t n 1 q e 2 × ( q e q t ) 2
where qt (mg/g) is the uptake of Cr(VI) on the AC@SCF particles at time t (h), qe (mg/g) is the uptake at the equilibrium stage, KDC (mg/(g h0.5)) is the rate constant of Cr(VI) ion transfer from the liquid into the solid particles and n is a dimensionless empirical time constant which exhibits a best universal value centred around 0.5.
For boundary conditions qt = 0 at t = 0, and qt = qt at t = t, the definite integration of the diffusion–chemisorption empirical differential equation leads to:
q t = 1 1 q e + 1 K D C   ×   t 0.5
The initial rate is provided by the empirical ratio:
r i = K D C 2 q e

2.3.2. Initial Cr(VI) Concentration and pH Influence Experiments

To test the effect of the initial Cr(VI) concentration on the sorption capacity of AC@SCF, seven samples, each of 100 mL, with different initial Cr(VI) concentrations (i.e., 5.23, 14.55, 20.94, 26.73, 35.40, 45, and 54.14 ppm) were tested for 24 h. The adsorption process was carried out at pH = 3 using 18 mg of AC@SCF. Moreover, the influence of pH on the sorption capacity of AC@SCF was tested via experiments at pH 1.5, 3.0, 4.0, 4.5, 5.5, and 6.5. The adsorption process was carried out using 18 mg of AC@SCF and at 7.44 ppm of Cr(VI) initial concentration. The sampling and measuring were carried out according to the method described above.

2.4. Thermodynamics of Cr(VI) Adsorption

Equations (13) and (14) were used for the calculation of Gibbs free energy (ΔG0) for the adsorption process of Cr(VI) in AC@SCF at temperature T = 21 °C and pH = 3,
KD = qe/Ce
and
ΔG0 = −RT ln KD
where Ce is the concentration of Cr(VI) in the liquid phase at the equilibrium stage (mg/mL), qe is the amount of Cr(VI) adsorbed in the activated carbon at equilibrium stage (mg/g), KD is the distribution coefficient (mL/g), R is the gas constant (8.134 J/mol K), and T is the process temperature in Kelvin (K).

2.5. Characterization

Nitrogen porosimetry measurements were carried out at 77 K on a Sorptomatic 1990, Thermo Finnigan porosimeter. The AC@SCF sample was outgassed under vacuum (i.e., 10−6 mbar) at 150 °C for 10 h, before such measurements. Using the Corrugated Pore Structure Model (CPSM) which is reported in the literature, pore structure parameters, such as specific surface area (SSA), pore size distribution (PSD), total pore volume (TPV) [33,34,35], micropore volume (Vmicro) [36], and tortuosity factor (τCPSM) [37], were estimated. These estimations were achieved by the simulation and interpretation of the raw nitrogen porosimetry data using the free available CPSM software [38]. For comparison reasons, the SSA was also calculated by the Brunauer–Emmett–Teller [39] and Langmuir (monolayer) methods [40], while the PSD in the micropore region was also calculated by the Density Funcional Theory (DFT) model [41]. Finally, the microporosity fraction was also calculated by the Dubinnin–Raduskevitch method [42]. The overall pore volume was calculated via the total adsorbed nitrogen amount at P/P0 = 0.998.
Fourier-transformed infrared (FT-IR) attenuated total reflectance (ATR) measurements were carried out in a JASCO FT/IR-6200 instrument using the EasiDiff apparatus from PIKE Technologies. The samples were grounded and mixed with pure KBr reagent and placed in a holder (1 cm in diameter). The resultant spectra were the average of 64 scans at 2 cm−1 resolution and the frequency range was from 400 to 4000 cm−1. The final spectra were obtained after Kubelka–Munk calculations (F(R) = (1−R)2/2R, R is the attenuated reflectance).
Raman spectra for the AC@SCF material were recorded using a micro-Raman RM 1000 Renishaw system. Laser excitation line was at 532 nm (Nd-YAG) and the frequency range was from 250 to 3500 cm−1. The power of the laser was ~10 mW and a 2 μm focus spot was used.
X-ray powder diffraction data were reported using a D8 Advance Bruker diffractometer. Measurements were carried out with CuKα radiation (40 kV, 40 mA, λ = 1.54178 Å) and using a secondary beam graphite monochromator. The 2θ range of the diffraction patterns was from 0.5° to 80° and the increasing step was 0.02° for 2 s counting time.
Thermogravimetric analysis (TGA) and differential thermal analysis (DTA) were performed using a Perkin Elmer Pyris Dimond instrument. Approximately 5 mg of the sample was heated from 25 °C to 900 °C following a temperature increasing rate of 5 °C/min.
Scanning electron microscope (SEM) images were taken using a JEOL JSM-5600 apparatus, which is equipped with X-act EDS by Oxford Instruments company. The sample was covered by a thin gold film before the measurements.
Observations of transmission electron microscopy (TEM) were reported using a JEOL JEM-2010 instrument equipped with an LaB6 cathode (accelerating voltage of 200 kV; point-to-point resolution of 0.194 nm).
Finally, the concentration of the chromium solutions was calculated using the spectra of a UV-visible (UV-Vis) instrument. These measurements were performed using a quartz vesicle and a UV-2401(PC)-Shimadzu apparatus with a halogen lamp. The scanning range was 400–700 nm and the increasing step was 0.5 nm.

3. Results and Discussion

3.1. Characterization of AC@SCF Activated Carbon

Nitrogen sorption measurements (Figure 1a) indicated clearly that the produced AC@SCF material was microporous (Dmicropore ≤ 2 nm). Porosimetry hysteresis loop exhibited a sharp knee in the low-pressure range (i.e., P/P0 < 0.01) and an insignificant increase of the adsorbed nitrogen amount in the pressure range P/P0 > 0.1, which is characteristic of microporous materials. Interpretation of sorption data by both CPSM and DFT models provided pore volume distributions, which exhibited peaks at pore diameters Dmicro ≤ 2nm. As can be seen from Figure 1b and Table 1, such peaks, according to the DFT model, were observed at 0.67, 1.2, and 2 nm, while, according to the CPSM model (Figure 1c, Table 2), such peaks were observed at 1.28 and 1.6 nm. Both models supported the evidence that AC@SCF was a highly microporous material. Moreover, CPSM model provided a too-low peak at 27 nm (Figure 1d), which corresponded to the insignificant increase of the adsorbed nitrogen at 0.97 < P/P0 < 0.997. The micropore volume percentage was calculated by both the CPSM model [36] and the Dubinnin–Raduskevitch (D–R) method [42]. The last one is also depicted in Figure 1e. As reported in Table 2, according to the CPSM model, the micropore volume was 84.5%. This evidence was supported by the D–R calculations, which estimated a micropore volume of 86.6% (Table 1). Furthermore, the CPSM model predicted 8.9% of the pore volume in the pore diameter range from 2 to 3 nm and 6.6% of the pore volume in the pore diameter range from 3 to 100 nm. According to Table 2, the total pore volume of the AC@SCF material was 0.748 cm3/g. The curvature effect on specific surface area (SSA) calculations is significant for such microporous materials. The higher the micropore volume percentage, the higher the deviation of the Brunauer–Emmett–Teller (BET) model estimations for the SSA [39] from the real value. More realistic predictions for the SSA of the microporous materials are provided by the Langmuir model (monolayer adsorption) [40]. A commonly used criterion for the accuracy of the estimations of the BET and Langmuir model is the C constant which should be positive and equal or greater to the unity (1). But for microporous material cases, the CBET is negative, while the CLangmuir (CLang.) is positive. As shown in Table 1, for the AC@SCF carbon, the SSA according to the BET method was 1372 m2/g with a CBET value of −93 (P/P0 range was from 0.05 to 0.25), while the SSA according to the Langmuir approach was 1875 m2/g with a CLang. value of 98. According to the CPSM model [33,34,35], the SSA was 1870 m2/g. As shown in Table 2, the mean pore diameter calculated from the pore number distribution (DCPSMNmean) was 1.47 nm and the mean pore diameter calculated from the pore volume distribution (DCPSMVmean) was 3.71 nm [33,34]. Finally, the structure complexity and the resistance to diffusion through the pore channels were described with the tortuosity factor which, according to the CPSM model, was 4.65 [37]. This is in good agreement with the values reported in the literature for Filtrasorb 400 activated carbon derived from biomass [43], which ranged between 3 and 4.6.
FT-IR spectra of the fresh coffee, the spent coffee, and activated carbon which was derived from the pyrolysis and chemical activation of the spent coffee are presented in Figure 2a. The spectra of fresh coffee and spent coffee were very similar, showing several characteristic vibration bands of organic groups and oxygen-containing carbon groups. The sharp bands at 2855 cm−1 and 2925 cm−1 correspond to stretching vibration modes of CH3 and CH2 groups [44], whereas the broadband at 1650 cm−1 can be attributed to physically adsorbed water molecules, stretching vibration modes of C=C groups in aromatic rings, and/or to –COO groups [45]. The last band at 1750 cm−1 in both spectra reveals the presence of ketonic groups C=O that exist in aromatic rings or other organic rings such as those of caffeine [46,47]. The band at 1250 cm−1 can be attributed to stretching vibration modes of –C–C–C bridges on ketonic groups and/or deformation vibration modes of O–H bonds in carboxylic groups (–COOH) [45]. On the other hand, in the spectrum of activated carbon AC@SCF, only a few broadbands were observed and the most important were those at 1590 cm−1 and 1260 cm−1; these bands can be assigned to stretching vibration modes of carbonylic groups (–COO) and C–O bonds that exist in ether and hydroxyl groups, respectively [48,49].
The Raman spectrum of the activated carbon AC@SCF is presented in Figure 2b. The spectrum exhibited the characteristic peaks of carbon-based materials at 1585 cm−1 and 1345 cm−1, corresponding to the well-known G- and D-band vibrations, respectively. The G-band having E2g symmetry derives from the in-plane-bond stretching motion of pairs of sp2 carbon atoms, both in aromatic rings and conjugated chains, whereas the D band corresponds to lattice breathing mode and has A1g symmetry. The D band only becomes active in the presence of disorder and derives from sp2 edge plane breathing vibrations [50]. Several factors such as the carbonization degree, clustering of the sp2 phase, bond disorder, presence of sp2 rings or chains, sp2/sp3 ratio, porosity, crystallite size distribution, and concentration of amorphous component affect the position and width of D and G bands [50,51,52]. For instance, the position of G band of pure crystalline graphite (~1580 cm−1) can be correlated with the presence of surface graphene layers or graphitic molecular nanostructures with strained geometry [50,53]. The ratio of relative intensities of D and G bands ID/IG is also related to the structural disorder degree and hence with the size of the graphitic domains [50,51,52,53]. In case of AC@SCF, the ID/IG ratio (0.88) as well as the shape and position of G and D bands, indicate the existence of mainly amorphous carbon structure and amorphous regions with negligible graphitic ordering. Finally, the crystallite size (La) of AC@SCF carbon was calculated using the Tuinstra and Koenig law [52,53,54,55] and was found to be 21.85 nm.
An amorphous carbon structure was also revealed from the X-ray diffraction (XRD) pattern of AC@SCF sample in Figure 2c. The XRD pattern exhibited two broad reflection peaks at 2θ = 25° and 43°; these peaks can be attributed to the (002) and the (100) reflections of graphite, respectively, and originate from the stacking of the (002) graphene layers and the (100) in-plane structure of graphitic crystallites. The broadening of these peaks compared with the XRD pattern of graphitic carbon expressed a more amorphous carbon structure.
Figure 2d shows DTA and %TG (Thermo Gravimetric) curves of AC@SCF in air. The inset image of Figure 2d shows the corresponding curves of spent coffee before the pyrolysis and chemical activation. The DTA curve of spent coffee consisted of three exothermic peaks at 310, 420, and 472 °C accompanied with 100% weight loss, which correspond to the combustion of the organic ingredients of the wasted coffee. After pyrolysis and chemical activation, the DTA curve of AC@SCF exhibited two exothermic peaks at 394 and 422 °C, which correspond to the carbon matrix combustion, and were accompanied with 76% weight loss. At lower temperature (<100 °C), there was an endothermic peak, which corresponds to the removal of physically adsorbed water molecules. The TGA curve exhibited some remaining mass (~4%), which was composed when the TGA temperature was raised to values >450 °C. This observation could be attributed to K impurities from KOH that have been used for the chemical activation and trapped in carbon’s pores. The TGA curve of spent coffee did not show remaining mass after combustion of the organic phases.
Figure 3 shows SEM (a,b) and TEM (c,d) images of the AC@SCF material. From SEM images, the material seemed to have a “sponge-like” morphology consisting of macropores with 1 μm diameter, whereas TEM images also showed the existence of micropores.

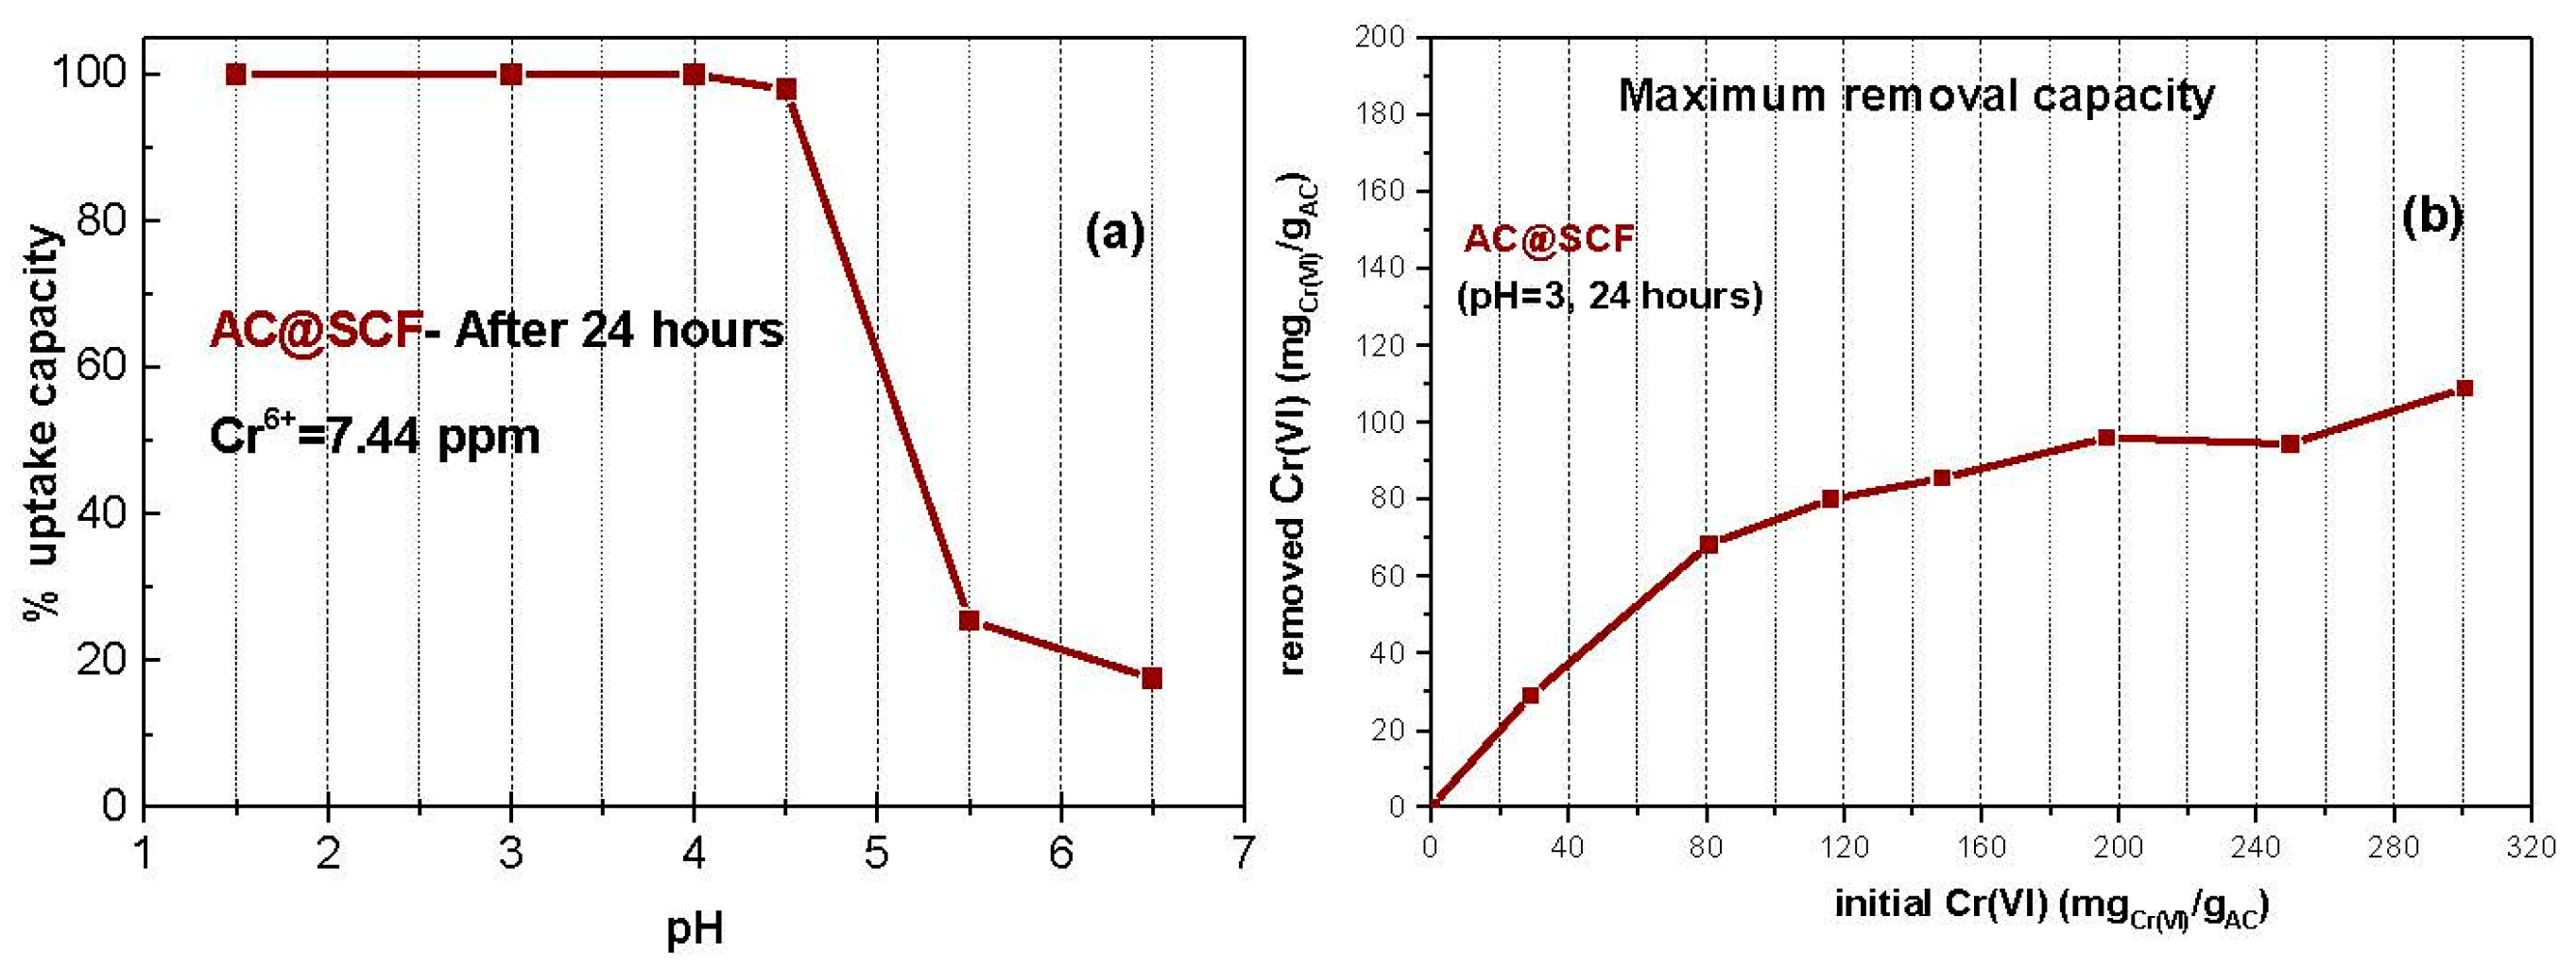
3.2. Effect of the Initial Cr(VI) Concentration and the pH Values on the AC@SCF Sorption Capacity

The effect of solution pH value on Cr(VI) uptake capacity after 24 h as well as the effect of the initial Cr(VI) concentration on Cr(VI) sorption at pH = 3 are shown in Figure 4. At pH equal to and lower than 4, the Cr(VI) uptake was 100% for 7.44 ppm initial concentration, whereas this capacity was reduced to almost 17% at pH 6.5 (Figure 4a). At a lower pH, the carbon surface of AC@SCF was positively charged due to the presence of H+ ions and attracted electrostatically the hexavalent chromate anions (HCrO4, CrO42−, and Cr2O72−). At pH > 4.5, the carbon surface was more negatively charged (due to the presence of OH) and the chromate anions (HCrO4, CrO42−) were electrostatically repulsed from the carbon surface. For this reason, the sorption efficiency gradually decreased. According to the literature [29], the predominant species of Cr(VI) in aqueous solutions are HCrO4 and Cr2O72− for pH < 6 and Cr2O72− and CrO42− for pH ≥ 6. The pH value also affects the charge of the AC surface active sites and by extension the Cr(VI) removal capacity. This is also supported by Figure 4a, where the % uptake capacity versus pH is depicted. The 24-h adsorption capacity of AC@SCF increased by increasing Cr(VI) initial concentration and the experimental values for the initial concentration range (Cinit) of 29–300 mg/g fell in the range of qmax = 29–109 mgCr(VI)/gAC@SCF. Figure 4b presents such values in details.

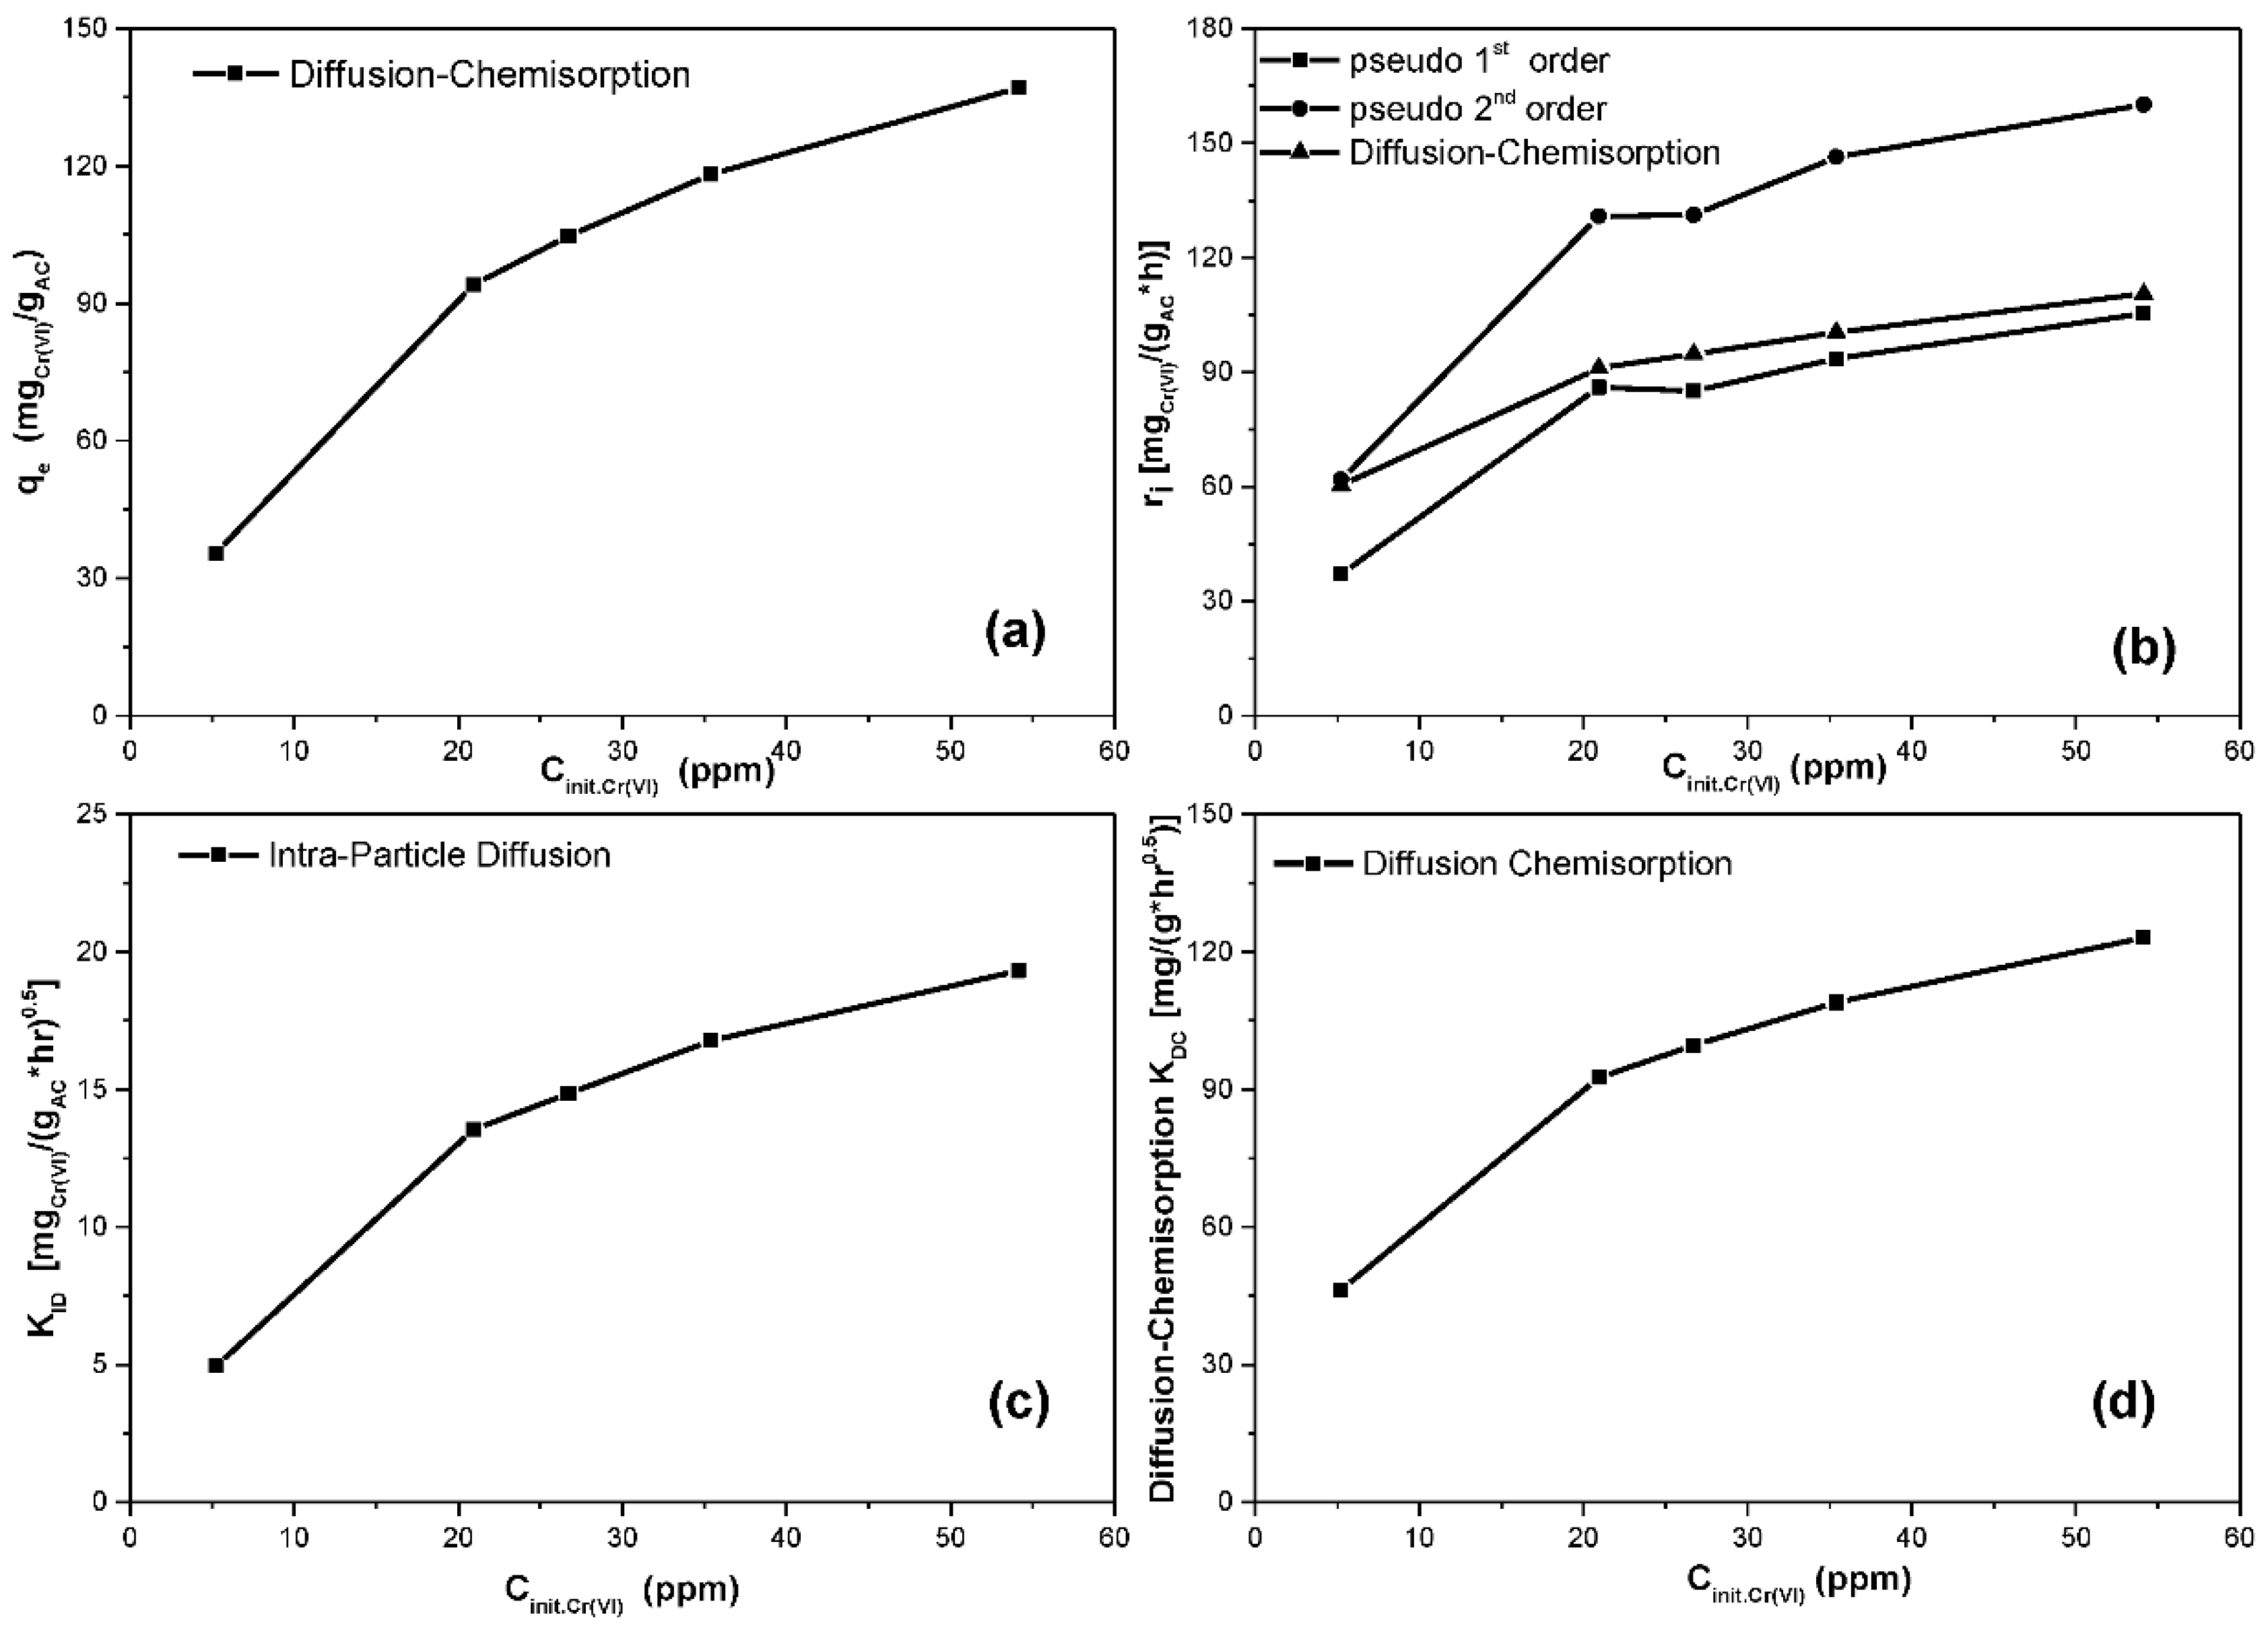
3.3. Sorption Kinetics for Hexavalent Chromium

The kinetic behavior for the adsorption process of Cr(VI) on AC@SCF, for different Cr(VI) initial concentrations and pH = 3, is depicted in Figure 5a. Solutions of 100 mL each, which contained 18 mg of AC@SCF and five different Cr(VI) initial concentrations (i.e., 5.23, 20.94, 26.73, 35.40, and 54.14 ppm), were used to carry out 24-h adsorption experiments.
As can be seen from the same figure, apart from the 5.23 ppm initial concentration, all the other Cr(VI) initial concentrations were enough for AC@SCF to almost reach the intraparticle saturation stage after 24 h of adsorption activity. Nevertheless, this data set, in combination with the other four data sets, is useful for the interpretation of the kinetic behaviour of the process and the evaluation of the influence of the initial concentration on kinetic parameters for different kinetic models. For the study of the complete adsorption process as to the chemical equilibrium stage and for the prediction of the maximum uptake capacity of AC@SCF, an initial concentration beyond 20 ppm Cr(VI) in combination with 1.8 gAC@SCF/L was required. The main criterion which was used for the choice of the most appropriate kinetic model for the adsorption process was the goodness of fitting of the model over the experimental data. Figure 5b–f and the values of the correlation coefficient R2, which are presented in Table 3, showed that the diffusion–chemisorption (DC) model provided the most accurate estimations. It was also obvious that the intraparticle diffusion (ID) model provided the worst estimations and the worst fitting. The pseudo-second model also provided good enough estimations with R2 values quite close to these of the DC model. Moreover, in the case of the 5.23 ppm initial Cr(VI) concentration, the R2 value was better. But in this case, no equilibrium stage was reached. For this reason, reduced chi values are also presented in Table 3. The bigger the difference between qt values, experimental and predicted by a model, the bigger the reduced chi-squared values. In theory, if the observed (experimental) and expected (theoretical) values were identical, then chi-square would be zero. It is also obvious from Table 3, that apart from the case of 5.23 ppm, the DC model was superior to the pseudo-second model. The values in Table 3 were achieved using the OriginPro 2015 software of OriginLab Corporation. Moreover, the IBM SPSS Statistics software, version 26, was deployed to statistically investigate the hypothesis further that the diffusion–chemisorption model is the most appropriate kinetic model. The Akaike and Bayesian criteria showed that the diffusion–chemisorption model was the preferred model with KDC = 46–123 mg/(g h0.5). Moreover, the predicted uptake capacity of AC@SCF at the equilibrium stage was higher than the experimental maximum adsorbed amount (qmax) for 24 h and fell in the range of qe = 35–137 mgCr(VI)/gAC@SCF.
This is presented in Figure 6a, which was based on the predictions of the DC model. This figure showed that, for temperature 21 °C and pH 3, the maximum uptake of Cr(VI) on AC@SCF activated carbon at the equilibrium stage was obtained for the initial concentration of 54.14 ppm and it was around 137 mgCr(VI)/gAC@SCF. It was also obvious from this figure that a sharp trend existed for increased qe in cases of increased initial concentrations.
According to Figure 6b, all the applied models predicted that the initial rate of the adsorption process increased as the initial Cr(VI) concentration increased. More specifically, according to the DC model, the initial adsorption rate (rinit) was in the range from 60 mg/(g h) to 110 mg/(g h). This result agreed with Fick’s first law, where the mass transport rate is proportional to the driving force of the mass transfer (i.e., dC/dx). The second competitive kinetic model, the pseudo-second model, predicted the initial rate (rinit) in the range of 60–110 mg/(g h). It was obvious from Figure 6c,d that, considering the intraparticle diffusion model and the diffusion–chemisorption model, the adsorption rate constants KID and KDC increased as the initial concentration increased, which is in accordance with the previous results.
According to the literature [56], Table 3 values could be interpreted as follows:
Although the pseudo-first model could not perfectly fit the experimental kinetic data, we could say that the initial adsorption rate ri increased as the initial concentration increased, but not proportionally, as it was obvious by the reduction of the k1 values. The maximum uptake capacity also increased as it was obvious from the qe quantity. Moreover, the external film diffusion seemed not to be the controlling stage because this model was not the best-fitted model. Even though the pseudo-second model exhibited the same behavior, the better pseudo-second R2 values indicated that pore diffusion influenced the adsorption rate more than the external film diffusion. The increase of the KID of the intraparticle diffusion model indicated that the surface diffusion rate increased as the initial concentration increased. Moreover, the increase of the C parameter indicated the increase of the contribution of the surface adsorption in the rate-limiting step. Finally, the better R2 values obtained from the fitting of the diffusion–chemisorption kinetic model over the experimental data indicated that this was the dominant mechanism. According to the literature [32], this indicated that the increase of the initial concentration sequentially increased the dependence of the adsorption rate on both the diffusion and chemisorption mechanisms. Moreover, the domination of this model indicated that Cr(VI) was bonding on the AC pore surface and the migration or desorption processes became difficult. The last was consistent with the thermodynamic analysis results, which are described in the following section.

3.4. Thermodynamics of Cr(VI) Adsorption. Results for Gibbs Free Energy

By excluding the 5.23 ppm initial Cr(VI) concentration case, where the total dissolved Cr(VI) amount was adsorbed and no equilibrium stage was obtained, for initial concentrations of 20.94, 26.73, 35.40, and 54.14 ppm at which AC@SCF became saturated with Cr(VI), ΔG0 was calculated as −24.1, −22,7, −21.6, and −20.2 kJ/mol respectively. The negative values confirmed the spontaneous nature of the adsorption process, where the values of −20 > ΔG0 > −80 kJ/mol were attributed to the transition stage from physisorption to chemisorption. Thus, both physisorption and chemisorption phenomena occurred, and ion exchange and/or surface complexion were likely the main mechanisms. This was inconsistent with the diffusion–chemisorption model, which is the preferable model for sorption kinetic studies. Moreover, such ΔG0 values indicate that other mechanisms of adsorption (like ion exchange and/or surface complexation) mainly occur [56,57].

3.5. Comparison of AC@SCF with Other Adsorbents for Cr(VI) Adsorption

Table 4 presents the maximum adsorption capacity (ascending values) of various adsorbents for Cr(VI) removal. As shown in this table, the adsorption capacity of AC@SCF was much higher (109 mg/g, 24 h experimental value; 137 mg/g, theoretical prediction for equilibrium stage at pH 3) than other adsorbents reported elsewhere.
Micropore size, micropore volume fraction, and the specific surface area seemed to have greater influence on the adsorption capacity of Cr(VI) in the AC@SCF sorbent. The surface area of the activated carbon derived from “spent coffee” pyrolysis process was highly noticeable and the abundant microporous structure probably increased the probability of adsorption of Cr(VI) at available active surface sites.

4. Conclusions

Chemical activation of spent coffee using KOH as an activation agent led to a highly porous, activated carbon with high surface area and almost a 100% microporous pore structure. Moreover, this process decreased the activation temperature (i.e., 650 °C) compared to that of a physical activation process (i.e., ≥ 900 °C). This material also exhibited excellent sorption properties for hexavalent chromium removal from aqueous solutions, with a maximum uptake capacity of 137 mgCr(VI)/gAC@SCF. According to the porosimetry results, the real specific surface area of the AC@SCF approached the value of 2000 m2/g, while the micropore volume fraction approached the value of 90%. This was probably the main reason for its high performance on Cr(VI) removal from aqueous solutions via the adsorption process. According to the results of adsorption experiments, the maximum Cr(VI) removal capacity was at pH ≤ 4. An optimal pH value of 3 was chosen for carrying out the experiments because it was most promising for achieving stable and economic conditions in a future scaled-up production line. For pH ≥ 4.5, a sharp decrease of the maximum adsorption capacity existed. The interpretation of the kinetic experimental data using four different kinetic models and for five different initial Cr(VI) concentrations resulted in the conclusion that the diffusion–chemisorption model was the most appropriate model for the simulation of the adsorption process. Apart from the statistical criteria, this evidence was also supported by the thermodynamic results where Gibbs free energy was in the range of −20 > ΔG0 > −80 kJ/mol, which meant that both physisorption and chemisorption control, such as ion exchange and/or surface complexation, existed. The thermodynamic study suggested that the adsorption reaction was an endothermic and entry-driven process. In conclusion, spent coffee, a waste material which is in abundance globally, could play a significant role as a useful precursor for water treatment to remove toxic hexavalent chromium as well as in different modern applications that require low cost and easily prepared carbon materials with a high surface area.
Moreover, the environmental fingerprint of this research is highly positive, and it gives strong momentum to the cyclic economy which is the trend in our days.

Author Contributions

G.A. contributed to the experimental design and carrying out the adsorption kinetic experiments. M.B. contributed to the experimental design, AC@SCF synthesis, FT-IR, XRD, and TG experimental measurements and interpretation, and the writing of the paper. M.P. contributed to AC@SCF synthesis and characterization. V.K. contributed to AC@SCF synthesis and characterization. A.B.B. contributed to the experimental design and interpretation of all the experimental data. R.Z. contributed to TEM measurements and interpretation. M.A.K. contributed to the supervision of the whole work, experimental design, FT-IR, XRD, and Raman experimental measurements, interpretation of all the experimental data, and writing of the paper. C.E.S. contributed to the supervision of the whole work, experimental design, AC@SCF preparation process, kinetic experimental process, nitrogen porosimetry measurements, interpretation of all the experimental data, and writing of the paper. All authors have read and agreed to the published version of the manuscript.

Funding

This research was co-funded by the European Union and Greek National Funds through the Operational Program, “Competitiveness, Entrepreneurship and Innovation”, under the call “RESEARCH-CREATE-INNOVATE” (project code: T2EDK-02073).

Acknowledgments

The authors greatly acknowledge Cecilia Maria Reyes Pérez for her contribution in TEM measurements. This project has received funding from the Hellenic Foundation for Research and Innovation (HFRI, Greece) and the General Secretariat for Research and Technology (GSRT, Greece), under grant agreement number 1508. Finally, RZ acknowledges the support from the Czech Science Foundation, Czech Republic, project No. 19-27454X.

Conflicts of Interest

The authors declare no conflict of interest.

References

  1. Hassan, F.M.; Sabri, M.A.; Fazal, H.; Hafeez, A.; Shezad, N.; Hussain, M. Recent trends in activated carbon fibres production from various precursors and applications—A comparative review. J. Anal. Appl. Pyrolysis 2020, 145, 104715. [Google Scholar] [CrossRef]
  2. Rocha, L.; Pereira, D.; Sousa, É.; Otero, M.; Esteves, V.; Calisto, V. Recent advances on the development and application of magnetic activated carbon and char for the removal of pharmaceutical compounds from waters: A review. Sci. Total Environ. 2020, 718, 137272. [Google Scholar] [CrossRef] [PubMed]
  3. Heidarinejad, Z.; Dehghani, M.H.; Heidari, M.; Javedan, G.; Ali, I.; Sillanpää, M. Methods for preparation and activation of activated carbon: A review. Environ. Chem. Lett. 2020, 18, 393–415. [Google Scholar] [CrossRef]
  4. Januszewicz, K.; Kazimierski, P.; Klein, M.; Kardaś, D.; Łuczak, J. Activated Carbon Produced by Pyrolysis of Waste Wood and Straw for Potential Wastewater Adsorption. Materials 2020, 13, 2047. [Google Scholar] [CrossRef] [PubMed]
  5. Boretti, A.; Rosa, L. Reassessing the projections of the World Water Development Report. NPJ Clean Water 2019, 2, 15. [Google Scholar] [CrossRef]
  6. Activated Carbon Market by Type (Powdered, Granular, Others (Pelletized, Bead)), Application (Liquid Phase (Water Treatment, Foods & Beverages, Pharmaceutical & Medical), Gaseous Phase (Industrial, Automotive)), Region—Global Forecast to Report code CH 4940, January 2017. Available online: https://www.researchandmarkets.com/reports/5143005/activated-carbon-filters-market-by-type (accessed on 28 October 2020).
  7. Sahin, Ö.; Saka, C.; Ceyhan, A.A.; Baytar, O. Preparation of High Surface Area Activated Carbon from Elaeagnus angustifolia Seeds by Chemical Activation with ZnCl2 in One-Step Treatment and its Iodine Adsorption. Sep. Sci. Technol. 2015, 50, 886–891. [Google Scholar] [CrossRef]
  8. Wong, S.; Ngadi, N.; Inuwa, I.M.; Hassan, O. Recent advances in applications of activated carbon from biowaste for wastewater treatment: A short review. J. Clean. Prod. 2018, 175, 361–375. [Google Scholar] [CrossRef]
  9. Maneerung, T.; Liew, J.; Dai, Y.; Kawi, S.; Chong, C.; Wang, C.-H. Activated carbon derived from carbon residue from biomass gasification and its application for dye adsorption: Kinetics, isotherms and thermodynamic studies. Bioresour. Technol. 2016, 200, 350–359. [Google Scholar] [CrossRef]
  10. Cameron, A.; O’Malley, S. Coffee Ground Recovery Program Summary Report, January 2016. Available online: https://assets.ctfassets.net/fqjwh0badmlx/7Jb4U4q1tH8awgNl51E31m/44cb75f992f1a414fb468e1dd844a0a9/doc-1793-cos-final-report-2016--5-.pdf (accessed on 28 October 2020).
  11. Owlad, M.; Aroua, M.K.; Daud, W.A.W.; Baroutian, S. Removal of Hexavalent Chromium-Contaminated Water and Wastewater: A Review. Water Air Soil Pollut. 2009, 200, 59–77. [Google Scholar] [CrossRef]
  12. Valdivia, A.E.O.; Osorio, C.M.; Vargas-Rodríguez, Y.M. Preparation of Activated Carbon from Coffee Waste as an Adsorbent for the Removal of Chromium (III) from Water. Optimization for an Experimental Box-Behnken Design. Chemistry 2020, 2, 2. [Google Scholar] [CrossRef] [Green Version]
  13. Atabania, A.E.; Al-Muhtaseb, A.H.; Kumarc, G.; Sarataled, G.D.; Aslame, M.; Khanf, H.A.; Saidg, Z.; Mahmoudh, E. Valorization of spent coffee grounds into biofuels and value-added products: Pathway towards integrated bio-refinery. Fuel 2019, 254, 115640. [Google Scholar] [CrossRef]
  14. Atabani, A.E.; Mercimek, S.M.; Arvindnarayan, S.; Shobana, S.; Kumar, G.; Cadire, M.; Al-Muhatseb, A.H. Valorization of spent coffee grounds recycling as a potential alternative fuel resource in Turkey: An experimental study. J. Air Waste Manag. Assoc. 2018, 68, 196–214. [Google Scholar] [CrossRef] [PubMed] [Green Version]
  15. Aroua, M.K.; Zuki, F.M.; Sulaiman, N.M. Removal of chromium ions from aqueous solutions by polymer-enhanced ultrafiltration. J. Hazard. Mater. 2007, 147, 752–758. [Google Scholar] [CrossRef] [PubMed]
  16. Babel, S.; Kurniawan, T.A. Cr(VI) removal from synthetic wastewater using coconut shell charcoal and commercial activated carbon modified with oxidizing agents and/or chitosan. Chemosphere 2004, 54, 951–967. [Google Scholar] [CrossRef] [PubMed]
  17. Almaguer-Busso, G.; Velasco-Martinez, G.; Aguilera, G.C.; Granados, S.; Torres-Reyes, E.; Alatorre-Ordaz, A. A comparative study of global hexavalent chromium removal by chemical and electrochemical processes. Electrochem. Commun. 2009, 11, 1097–1100. [Google Scholar] [CrossRef]
  18. Chaudhary, A.J.; Goswami, N.C.; Grimes, S.M. Electrolytic removal of hexavalent chromium from aqueous solutions. J. Chem. Technol. Biotechnol. 2003, 78, 877–883. [Google Scholar] [CrossRef]
  19. Saucier, C.; Adebayo, M.A.; Lima, E.C.; Cataluña, R.; Thue, P.S.; Prola, L.D.T.; Puchana-Rosero, M.J.; Machado, F.M.; Pavan, F.A.; Dotto, G.L. Microwave-assisted activated carbon from cocoa shell as adsorbent for removal of sodium diclofenac and nimesulide from aqueous effluents. J. Hazard. Mater. 2015, 289, 18–27. [Google Scholar] [CrossRef]
  20. Zhao, Y.; Fang, F.; Xiao, H.-M.; Feng, Q.-P.; Xiong, L.-Y.; Fu, S.-Y. Preparation of pore-size controllable activated carbon fibers from bamboo fibers with superior performance for xenon storage. Chem. Eng. J. 2015, 270, 528–534. [Google Scholar] [CrossRef]
  21. Li, W.; Peng, J.; Zhang, L.; Yang, K.; Xia, H.; Zhang, S.; Guo, S.-H. Preparation of activated carbon from coconut shell chars in pilot-scale microwave heating equipment at 60 kW. Waste Manag. 2009, 29, 756–760. [Google Scholar] [CrossRef]
  22. Fernandez, M.E.; Ledesma, B.; Roman, S.; Bonelli, P.R.; Cukierman, A.L. Development and characterization of activated hydrochars from orange peels as potential adsorbents for emerging organic contaminants. Bioresour. Technol. 2015, 183, 221–228. [Google Scholar] [CrossRef]
  23. Choi, G.-G.; Oh, S.-J.; Lee, S.-J.; Kim, J.-S. Production of bio-based phenolic resin and activated carbon from bio-oil and biochar derived from fast pyrolysis of palm kernel shells. Bioresour. Technol. 2015, 178, 99–107. [Google Scholar] [CrossRef] [PubMed]
  24. Kaźmierczak-Raźna, J.; Gralak-Podemska, B.; Nowicki, P.; Pietrzak, R. The use of microwave radiation for obtaining activated carbons from sawdust and their potential application in removal of NO2 and H2S. Chem. Eng. J. 2015, 269, 352–358. [Google Scholar] [CrossRef]
  25. Heibati, B.; Rodriguez-Couto, S.; Al-Ghouti, M.A.; Asif, M.; Tyagi, I.; Agarwal, S.; Gupta, V.K. Kinetics and thermodynamics of enhanced adsorption of the dye AR 18 using activated carbons prepared from walnut and poplar woods. J. Mol. Liq. 2015, 208, 99–105. [Google Scholar] [CrossRef]
  26. Aboua, K.N.; Yobouet, Y.A.; Yao, K.B.; Goné, D.L.; Trokourey, A. Investigation of dye adsorption onto activated carbon from the shells of Macoré fruit. J. Environ. Manag. 2015, 156, 10–14. [Google Scholar] [CrossRef] [PubMed]
  27. Mohan, G.V.K.; Babu, A.N.; Kalpana, K.; Ravindhranath, K. Removal of chromium (VI) from water using adsorbent derived from spent coffee grounds. Int. J. Environ. Sci. Technol. 2017, 16, 101–112. [Google Scholar] [CrossRef]
  28. Suganya, S.; Kumar, P.S. Influence of ultrasonic waves on preparation of active carbon from coffee waste for the reclamation of effluents containing Cr(VI) ions. J. Ind. Eng. Chem. 2018, 60, 418–430. [Google Scholar] [CrossRef]
  29. Karthikeyan, T.; Rajgopal, S.; Miranda, L.R. Chromium(VI) adsorption from aqueous solution by Hevea brasilinesis sawdust activated carbon. J. Hazard. Mater. 2005, 124, 192–199. [Google Scholar] [CrossRef]
  30. Ho, Y.S.; McKay, G. Kinetic model for lead(II) sorption on to Peat. Adsorpt. Sci. Technol. 1998, 16, 243–255. [Google Scholar] [CrossRef]
  31. Weber, W.; Morris, C. Advances in water pollution research: Removal of biologically resistant pollutants from waste water by adsorption. In Proceedings of the International Conference on Water Pollution Symposium; Pergamon Press: Oxford, UK, 1962; Volume II, pp. 231–266. [Google Scholar]
  32. Sutherland, C. Removal of Heavy Metals from Waters Using Lowcost Adsorbents: Process Development. Ph.D. Thesis, The University of the West Indies, St. Augustine, Trinidad, 2004; pp. 150–164. [Google Scholar]
  33. Androutsopoulos, G.P.; Salmas, C.E. A New Model for Capillary Condensation−Evaporation Hysteresis Based on a Random Corrugated Pore Structure Concept: Prediction of Intrinsic Pore Size Distributions. Model Formulation. Ind. Eng. Chem. Res. 2000, 39, 3747–3763. [Google Scholar] [CrossRef]
  34. Androutsopoulos, G.P.; Salmas, C.E. A New Model for Capillary Condensation−Evaporation Hysteresis Based on a Random Corrugated Pore Structure Concept: Prediction of Intrinsic Pore Size Distribution. Model Application. Ind. Eng. Chem. Res. 2000, 39, 3764–3777. [Google Scholar] [CrossRef]
  35. Salmas, C.E.; Androutsopoulos, G.P. Rigid Sphere Molecular Model Enables an Assessment of the Pore Curvature Effect upon Realistic Evaluations of Surface Areas of Mesoporous and Microporous Materials. Langmuir 2005, 21, 11146–11160. [Google Scholar] [CrossRef] [PubMed]
  36. Salmas, C.E.; Ladavos, A.K.; Skaribas, S.P.; Pomonis, P.J.; Androutsopoulos, G.P. Evaluation of Microporosity, Pore Tortuosity, and Connectivity of Montmorillonite Solids Pillared with LaNiOx Binary Oxide. A Combined Application of the CPSM Model, the αs-Plot Method and a Pore Percolation−Connectivity Model. Langmuir 2003, 19, 8777–8786. [Google Scholar] [CrossRef]
  37. Salmas, C.E.; Androutsopoulos, G.P. A Novel Pore Structure Tortuosity Concept Based on Nitrogen Sorption Hysteresis Data. Ind. Eng. Chem. Res. 2001, 40, 721–730. [Google Scholar] [CrossRef]
  38. DOWNLOADS. CPSM_Nitrogen. Available online: http://users.uoi.gr/ksalmas/ (accessed on 28 October 2020).
  39. Brunauer, S.; Emmett, P.H.; Teller, E. Adsorption of Gases in Multimolecular Layers. J. Am. Chem. Soc. 1938, 60, 309–319. [Google Scholar] [CrossRef]
  40. Itodo, A.U.; Itodo, H.U.; Gafar, M.K. Estimation of Specific Surface Area using Langmuir Isotherm Method. J. Appl. Sci. Environ. Manag. 2010, 14, 141–145. [Google Scholar] [CrossRef]
  41. Dombrowski, R.J.; Hyduke, D.R.; Lastoskie, C.M. Pore Size Analysis of Activated Carbons from Argon and Nitrogen Porosimetry Using Density Functional Theory. Langmuir 2000, 16, 5041–5050. [Google Scholar] [CrossRef]
  42. Chen, S.G.; Yang, R.T. Theoretical Basis for the Potential Theory Adsorption Isotherms. The Dubinin-Radushkevich and Dubinin-Astakhov Equations. Langmuir 1994, 10, 4244–4249. [Google Scholar] [CrossRef]
  43. Leyva-Ramos, R.; Geankoplis, C.J. Diffusion in liquid-filled pores of activated carbon. I. Pore volume diffusion. Can. J. Chem. Eng. 1994, 72, 262–271. [Google Scholar] [CrossRef]
  44. Aldana-Pérez, A.; Lartundo-Rojas, L.; Gómez, R.; Niño-Gómez, M.E. Sulfonic groups anchored on mesoporous carbon Starbons-300 and its use for the esterification of oleic acid. Fuel 2012, 100, 128–138. [Google Scholar] [CrossRef]
  45. Baikousi, M.; Georgiou, Y.; Daikopoulos, C.; Bourlinos, A.B.; Filip, J.; Zbořil, R.; Deligiannakis, Y.; Karakassides, M.A. Synthesis and characterization of robust zero valent iron/mesoporous carbon composites and their applications in arsenic removal. Carbon 2015, 93, 636–647. [Google Scholar] [CrossRef]
  46. Nie, B.; Stutzman, J.; Xie, A. A vibrational spectral maker for probing the hydrogen-bonding status of protonated Asp and Glu residues. Biophys. J. 2005, 88, 2833–2847. [Google Scholar] [CrossRef] [PubMed] [Green Version]
  47. De Taeye, J.; Huyskens, T.Z. Infrared Spectrum of Caffeine and its Hydrochloride Dihydrate. Spectrosc. Lett. 1986, 19, 299–310. [Google Scholar] [CrossRef]
  48. Dandekar, A.; Baker, R.T.K.; Vannice, M.A. Characterization of activated carbon, graphitized carbon fibers and synthetic diamond powder using TPD and DRIFTS. Carbon 1998, 36, 1821–1831. [Google Scholar] [CrossRef]
  49. Fanning, P.E.; Vannice, M.A. A DRIFTS study of the formation of surface groups on carbon by oxidation. Carbon 1993, 31, 721–730. [Google Scholar] [CrossRef]
  50. Ferrari, A.C.; Robertson, J. Interpretation of Raman spectra of disordered and amorphous carbon. Phys. Rev. B 2000, 61, 14095–14107. [Google Scholar] [CrossRef] [Green Version]
  51. Ferrari, A.C.; Robertson, J. Resonant Raman spectroscopy of disordered, amorphous, and diamondlike carbon. Phys. Rev. B 2001, 64, 075414. [Google Scholar] [CrossRef] [Green Version]
  52. Sisu, C.; Iordanescu, R.; Stanciu, V.; Stefanescu, I.; Vlaicu, A.M.; Grecu, V.V. Raman Spectroscopy Studies of Some Carbon Molecular Sieves. Dig. J. Nanomat. Biostruct. 2016, 11, 435–442. Available online: http://www.chalcogen.ro/435_SisuC.pdf (accessed on 28 October 2020).
  53. Shimodaira, N.; Masui, A. Raman spectroscopic investigations of activated carbon materials. J. Appl. Phys. 2002, 92, 902–909. [Google Scholar] [CrossRef]
  54. Tuinstra, F.; Koenig, J.L. Raman spectrum of graphite. J. Chem. Phys. 1970, 53, 1126–1130. [Google Scholar] [CrossRef] [Green Version]
  55. Mallet-Ladeira, P.; Puech, P.; Toulouse, C.; Cazayous, M.; Ratel-Ramond, N.; Weisbecker, P.; Vignoles, G.L.; Monthioux, M. A Raman study to obtain crystallite size of carbon materials: A better alternative to the Tuinstra–Koenig law. Carbon 2014, 80, 629–639. [Google Scholar] [CrossRef]
  56. Pholosi, A.; Naidoo, E.B.; Ofomaja, A.E. Intraparticle diffusion of Cr(VI) through biomass and magnetite coated biomass: A comparative kinetic and diffusion study. South Afr. J. Chem. Eng. 2020, 32, 39–55. [Google Scholar] [CrossRef]
  57. Asimakopoulos, G.; Baikousi, M.; Salmas, C.; Bourlinos, A.; Zboril, R.; Karakassides, M. Advanced Cr(VI) sorption properties of activated carbon produced via pyrolysis of the “Posidonia oceanica” seagrass. J. Hazard. Mater. 2020, in press. [Google Scholar] [CrossRef] [PubMed]
  58. Selvi, K.; Pattabhi, S.; Kadirvelu, K. Removal of Cr(VI) from aqueous solution by adsorption onto activated carbon. Bioresour. Technol. 2001, 80, 87–89. [Google Scholar] [CrossRef]
  59. Dubey, S.P.; Gopal, K. Adsorption of chromium(VI) on low cost adsorbents derived from agricultural waste material: A comparative study. J. Hazard. Mater. 2007, 145, 465–470. [Google Scholar] [CrossRef]
  60. Rai, M.; Shahi, G.; Meena, V.; Meena, R.; Chakraborty, S.; Singh, R.; Rai, B. Removal of hexavalent chromium Cr (VI) using activated carbon prepared from mango kernel activated with H3PO4. Resour. Technol. 2016, 2, S63–S70. [Google Scholar] [CrossRef]
  61. A Alothman, Z.; Ali, R.; Naushad, M. Hexavalent chromium removal from aqueous medium by activated carbon prepared from peanut shell: Adsorption kinetics, equilibrium and thermodynamic studies. Chem. Eng. J. 2012, 184, 238–247. [Google Scholar] [CrossRef]
  62. Ranganathan, K. Chromium removal by activated carbons prepared from Casurina equisetifolia leaves. Bioresour. Technol. 2000, 73, 99–103. [Google Scholar] [CrossRef]
  63. Anandkumar, J.; Mandal, B. Removal of Cr(VI) from aqueous solution using Bael fruit (Aegle marmelos correa) shell as an adsorbent. J. Hazard. Mater. 2009, 168, 633–640. [Google Scholar] [CrossRef]
  64. Ponou, J.; Kim, J.; Wang, L.P.; Dodbiba, G.; Fujita, T. Sorption of Cr(VI) anions in aqueous solution using carbonized or dried pineapple leaves. Chem. Eng. J. 2011, 172, 906–913. [Google Scholar] [CrossRef]
  65. Mohanty, K.; Jha, M.; Meikap, B.; Biswas, M. Removal of chromium (VI) from dilute aqueous solutions by activated carbon developed from Terminalia arjuna nuts activated with zinc chloride. Chem. Eng. Sci. 2005, 60, 3049–3059. [Google Scholar] [CrossRef]
  66. Yang, J.; Yu, M.; Chen, W. Adsorption of hexavalent chromium from aqueous solution by activated carbon prepared from longan seed: Kinetics, equilibrium and thermodynamics. J. Ind. Eng. Chem. 2015, 21, 414–422. [Google Scholar] [CrossRef]
  67. Hamadi, N. Adsorption kinetics for the removal of chromium(VI) from aqueous solution by adsorbents derived from used tyres and sawdust. Chem. Eng. J. 2001, 84, 95–105. [Google Scholar] [CrossRef]
  68. Verma, A.; Chakraborty, S.; Basu, J.K. Adsorption study of hexavalent chromium using tamarind hull-based adsorbents. Sep. Purif. Technol. 2006, 50, 336–341. [Google Scholar] [CrossRef]
  69. Demiral, H.; Demiral, I.; Tümsek, F.; Karabacakoğlu, B. Adsorption of chromium(VI) from aqueous solution by activated carbon derived from olive bagasse and applicability of different adsorption models. Chem. Eng. J. 2008, 144, 188–196. [Google Scholar] [CrossRef]
  70. Labied, R.; Benturki, O.; Hamitouche, A.Y.E.; Donnot, A. Adsorption of hexavalent chromium by activated carbon obtained from a waste lignocellulosic material (Ziziphus jujube cores): Kinetic, equilibrium, and thermodynamic study. Adsorpt. Sci. Technol. 2018, 36, 1066–1099. [Google Scholar] [CrossRef] [Green Version]
Figure 1. Nitrogen adsorption–desorption data and pore size distributions for Activated Carbon from Spent Coffee (AC@SCF). (a): nitrogen sorption hysteresis loop simulated by the CPSM model; (b): differential pore volume distribution estimated by the DFT model; (c): differential pore volume distribution estimated by the CPSM model in the micro-pore range; (d): differential pore volume distribution estimated by the CPSM model in the meso-macro-pore range; (e): Dubbinin-Raduskevitch curve fore micropore volume fraction estimation.
Applsci 10 08812 g001
Figure 2. (a) Fourier-transformed infrared (FT-IR) spectra, (b) Raman spectra, (c) X-ray diffraction (XRD) pattern, and (d) differential thermal analysis (DTA)/TG% (Thermo Gravimetric) curves of AC@SCF.
Applsci 10 08812 g002
Figure 3. Scanning electron microscope (SEM) (a,b) and transmission electron microscope (TEM) (c,d) images of the AC@SCF activated carbon.
Applsci 10 08812 g003
Figure 4. Effect of the initial pH (a) and the initial concentration of hexavalent chromium (Cr(VI)) (b) on the uptake capacity of AC@SCF.
Applsci 10 08812 g004
Figure 5. (a) Kinetic behavior of Cr(VI) removal via adsorption on AC@SCF activated carbon. The 24-h experiments at pH = 3 for different Cr(VI) initial concentrations (5.23, 20.94, 26.73, 35.40, and 54.14 ppm). Best fit of four kinetic models on adsorption process experimental data for initial concentrations of (b) 5.23 ppm, (c) 20.94 ppm, (d) 26.73 ppm, (e) 35.40 ppm, (f) 54.14 ppm.
Applsci 10 08812 g005
Figure 6. (a) Predictions for maximum loading of Cr(VI) at equilibrium conditions on AC@SCF for different initial concentrations. (b) Initial rate estimation for different initial concentrations using the three different kinetic models (except the intraparticle diffusion model). (c) Intraparticle diffusion constant for different initial concentrations. (d) Diffusion–chemisorption constant for different initial concentrations.
Applsci 10 08812 g006
Table 1. Pore structure parameters derived from N2 adsorption–desorption data and classic models.
SgBET
(m2/g)
CBETSgLang.
(m2/g)
CLang.Vpore
(cm3/g)
DDFTmicro
(nm)
VD-Rmicro
(% cm3/g)
1372−931875980.7480.67/1.2/286.6
Table 2. Pore structure parameters derived from Corrugated Pore Structure Model (CPSM) model simulation of the overall N2 adsorption–desorption hysteresis loop.
SCPSM
(m2/g)
VCPSMpore
(cm3/g)
DCPSMNmean
(nm)
DCPSMVmean
(nm)
DCPSMmicro
(nm)
DCPSMmeso
(nm)
VCPSMmicro
(% cm3/g)
τ
(Tortuosity)
18690.7481.473.711.28/1.62784.64.65
Table 3. Predicted parameters from the Cr(VI) uptake kinetic study.
Initial Cr(VI) Concentration (ppm)
5.2320.9426.7335.4054.14
Pseudo 1stk1
(h−1)
1.34441.274141.12031.104821.0753
Std.Err.0.20870.323080.183990.254780.19029
qe
(mg/g)
27.632167.5110275.8898284.6400597.99323
Std.Err.0.953043.883272.968954.673884.19475
ri
(mg/(g h))
37.148686.0184985.0193793.51202105.37212
R20.9620.900730.956370.913040.94961
Reduced Chi-Square3.6462259.0894532.5228180.0658763.65652
Pseudo 2ndk2
(g/(mg h))
0.069130.023660.018840.01690.01368
Std.Err.0.007150.005850.002190.00350.00196
qe
(mg/g)
29.8988274.3715483.4341993.05058108.16824
Std.Err.0.489023.086111.690073.358032.76546
ri
(mg/(g h))
61.79803130.86644131.15021146.32714160.06104
R20.994340.966160.992330.975460.98824
Reduced Chi-Square0.5430720.140765.7207422.5889114.8523
Intraparticle
Diffusion
Model
KID (mg/(g h0.5))4.9424813.5431114.8457716.7677219.31547
Std.Err.1.633033.35123.952214.218555.15192
C
(mg/g)
11.9404926.0658128.6664231.7107936.17903
Std.Err.3.894547.99219.4254210.0605912.28655
R20.538260.686550.651910.678880.65098
Reduced Chi-Square44.30361186.57304259.49435295.64733440.94717
Diffusion–
Chemisorption
Model
KDC
(mg/(g h0.5))
46.2954292.5663999.60416108.97757123.08776
Std.Err.4.847634.761277.163024.291313.07894
qe
(mg/g)
35.5251694.11232104.76698118.20737137.06461
Std.Err.1.473172.365863.776042.386537.6133
ri
(mg/(g h))
60.3360291.0458594.69576100.46845110.53617
R20.988550.996510.99320.997880.9848
Reduced Chi-Square1.098732.075375.072881.9505719.20491
Where Std.Err is the Standard Error.
Table 4. The maximum adsorption capacity of literature reported adsorbents which were used for removal of Cr(VI) ions from aqueous solution.
Adsorbent
Activated Carbon (AC)
SBET (m2/g)Pore Diameter (nm)
(micro/meso)
Solution
pH
Maximum Adsorption Capacity (mg/g)Reference
AC coconut tree sawdust------3.03.46[58]
AC groundnut husk------3.07.0[59]
AC mango kernel490.43---2.07.8[60]
AC coconut shell5–10---4.010.88[16]
AC peanut shell95.5111.02.016.26[61]
AC Casuarina equisetifolia leaves156–735---3.017.2[62]
AC bael fruit shell------2.017.27[63]
AC pineapple leaves374.93.662.018.77[64]
Spent coffee
AC@SCF
------222.75[27]
AC Terminalia arjuna nuts1260---1.028.43[65]
AC longan seed15110.483.035.02[66]
AC Hevea brasiliensis (rubberwood) sawdust1674---2.044.05[29]
AC tires832---2.058.50[67]
AC tamarind hull431---2.070[68]
AC olive bagasse7180.4-2.0/3.0–4.12.088.59[69]
AC Posidonia oceanica seagrass11480.57/1.38/6.38/35.33.0118[57]
AC Ziziphus jujuba cores608.311.02.0124.25[70]
Spent coffee AC@SCF13720.67/1.28/1.6/273.0137This work
Spent coffee
AC@SCF
---------156.7[28]
Publisher’s Note: MDPI stays neutral with regard to jurisdictional claims in published maps and institutional affiliations.

