Development of Cost and Schedule Data Integration Algorithm Based on Big Data Technology


1
Department of Construction Big Data Research Center, Ninetynine Inc., Seoul 01905, Korea
2
Department of BIM Research Center, Yunwoo Technologies Inc., Seoul 05854, Korea
3
The Centre for Spatial Data Infrastructures and Land Administration, Department of Infrastructure Engineering, The University of Melbourne, Victoria 3010, Australia
*
Authors to whom correspondence should be addressed.
Appl. Sci. 2020, 10(24), 8917; https://0-doi-org.brum.beds.ac.uk/10.3390/app10248917
Submission received: 22 November 2020
/
Revised: 8 December 2020
/
Accepted: 9 December 2020
/
Published: 14 December 2020
(This article belongs to the Special Issue BIM and Its Integration with Emerging Technologies)
Abstract
:In the information age, the role of data in any industry is getting more and more important. In the construction industry, however, experts’ experience and intuition are still key determinants in decision-making, while other industries achieve tangible improvement in paradigm shifts by adopting cutting-edge information technology. Cost and schedule controls, which are closely connected, are decisive in the success of construction project execution. While a vast body of research has developed methodologies for cost-schedule integration over 50 years, there is no method used in practice; it remains a significant challenge in the construction industry. This study aims to propose a data processing algorithm for integrated cost-schedule data management employing big data technology. It is designed to resolve the main obstacle to the practicality of existing methods by providing integrity and flexibility in integrating cost-schedule data and reducing time on building and changing databases. The proposed algorithm is expected to transform field engineers’ current perception regarding information management as one of the troublesome tasks in a data-friendly way.
1. Introduction
At present, we are living in a big data era. As the information age proceeds, there has been a large increase in demand and dependence on information to achieve data-driven insights in decision-making [1]. In the construction industry, the significance of data and its latent value also become greater to enhance project management. There have been various efforts to systematically manage information in construction projects by introducing information management systems, such as continuous acquisition and life-cycle support (CALS), project management information system (PMIS), enterprise resource planning (ERP), and building information modeling (BIM). These systems, however, have contributed to a relatively low improvement of efficiency rate over recent decades; data management is still trying to catch up with the exponential data growth in this sector.
Data in construction management has characteristics with a vast amount, various formats, complicated structure, and frequent changes as projects proceed [2]. The magnitude and complexity of gathered data are continuously growing as projects progress. It leads to challenges in standardization and generalization of data utilization.
In construction projects, data management is still under a paper document-oriented process, which results in (1) loss of critical construction management data after project completion, (2) lack of available and meaningful data, and (3) absence of database for knowledge share in future projects. Developing a methodology for processing and analyzing construction project data that reflects data characteristics is essential for innovation in this industry. This paper aims to propose a data processing algorithm for construction management, which extracts and analyzes the required data by various stakeholders from a wide range of data sources associated with construction projects.
Construction project management is a series of systematic procedures to manage the design, cost, schedule, quality, and safety. Cost and schedule management are regarded as project success factors [3]; data associated with them is not only used for cost and schedule control but also management of productivity, labor, periodic payment, and material of construction projects. Based on its connectivity and importance, existing studies highlight the integration of cost and schedule data as an effective solution for effective project management [4]. However, there has been a lack of applicable models in practice due to the issues inherent in the vast, dynamic, and complex nature of data. As fundamental data for construction management, the proposed algorithm in this research focuses on integrating cost and schedule data management; it involves quantity, cost, schedule, and payment, which are intertwined with each other, from the database perspective.
To achieve this aim, this paper proceeds as follows. First, the related works and concepts related to the integration of cost-schedule data are discussed in Section 2. In Section 3, characteristics and challenges in cost-schedule data integration are identified, and the feasibility of big data technology is examined as solutions for the challenges. Based on the previous study [4], Section 4 addresses the development of an algorithm for integrating cost and schedule management that consists of a multi-dimensional and -level data structure and seven modules incorporating big data technology. Lastly, Section 5 present a case study of the implemented algorithm to analyze its validity from three perspectives: data integrity and flexibility, data building and transformation time, and practicability.
2. Literature Review
2.1. Current Status of Cost and Schedule Integration
In construction projects, cost and schedule control is one of the most critical management items. It can be used as a quantitative performance indicator that allows evaluating the success of projects [5]. The common informatization process for managing projects, particularly data associated with cost and schedule, is as follows. First, cost reports are prepared by applying unit cost for each construction activity to quantity-takeoff on building elements. Based on the quantity of construction part, schedule management is performed according to materials, equipment, and work productivity. Measuring progress to plan over time allows operating construction projects in line with progress rate assessment and performance payment. It indicates that quantity, payment, schedule, productivity, progress, and resource management (i.e., labor, material, equipment) have strong correlations and need to be updated as projects proceed. Despite the correlations, however, the vast amount of data associated with project cost and schedule shows a lack of interoperability. It is because the data are produced by individual systems for different purposes, such as quantity take-off, schedule management, cost management.
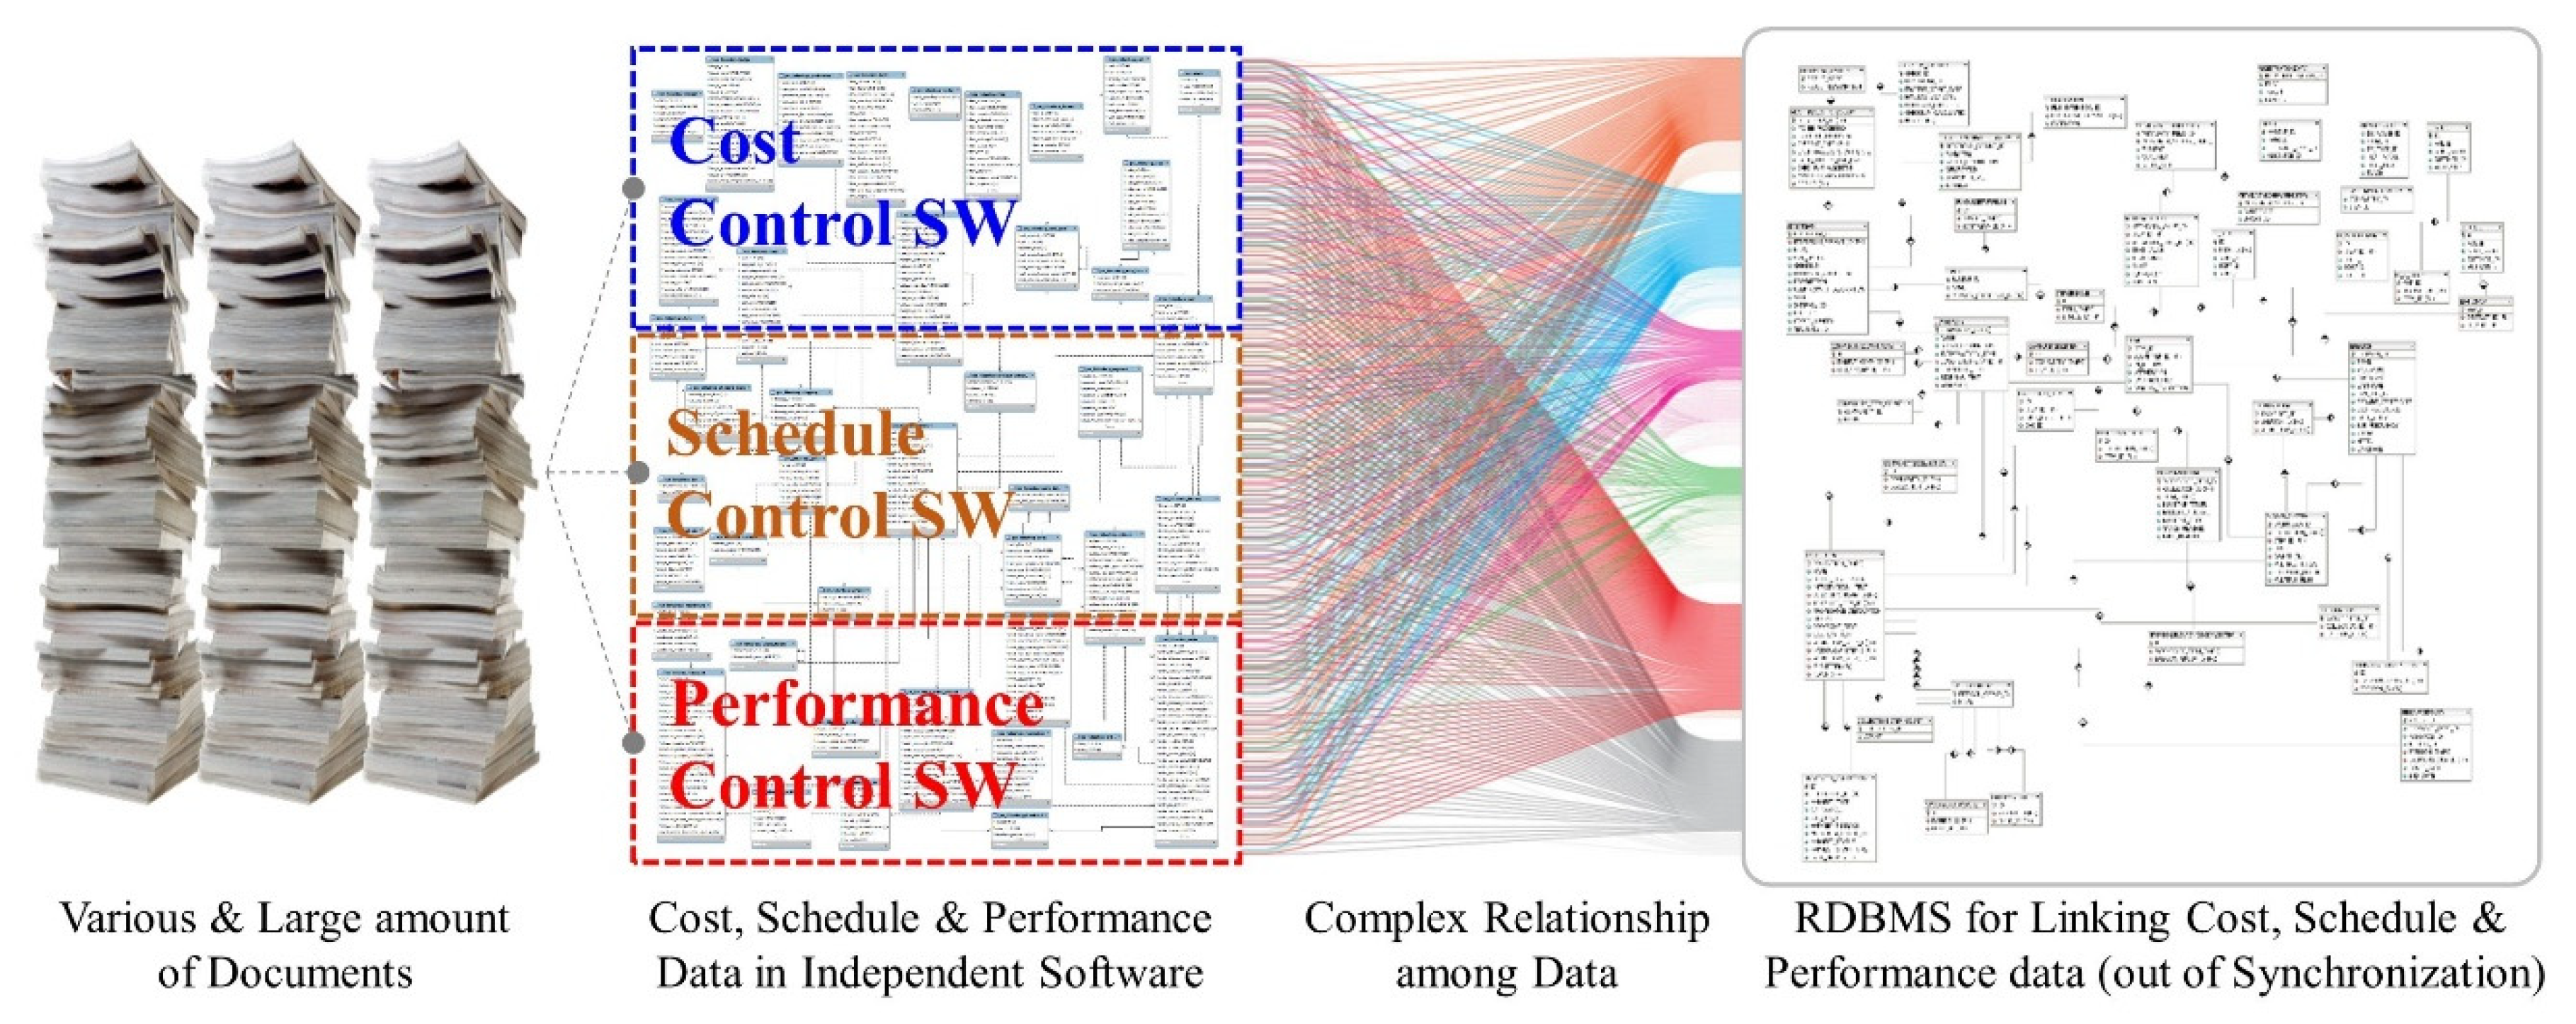
Current practice generally uses (1) various documents for construction management, (2) software for independent functions to produce the documents, and (3) relational database management system (RDBMS) to link data in the documents (see Figure 1). Consequently, data associated with cost and schedule are addressed in individual documents with different templates in diverse file formats at various information levels. This fragmented data storage and management causes difficulties in processing, synchronizing, and updating data across the documents with the lack of data connectivity. It brings redundant data input, repeated data management processes, and discrepancies in data during construction management. For instance, quantity-takeoff has been conducted at least six times during construction projects [6]; the same data has been generated seven times on average due to differences in formats [7]. According to the authors’ interview, most construction project managers consider information management as cumbersome work and tend to conduct the management at a minimum level.
2.2. Challenges in Cost and Schedule Integration
For cost-schedule integration, a match in hierarchies for data associated with them is essential to store, manage, and use the data in the same environment. However, cost data and schedule data are managed by different information units at different levels [8]. According to Cho et al. [4], the lowest unit of typical cost items in project cost control focuses on the Element and Operation level (i.e., Floor, Formwork) in line with the cost breakdown structure (CBS). Regardless of location, these items are synthesized at the Operation level (i.e., Formwork) for cost estimation reports and at the Work Section (i.e., Concrete) level for project budget reports. On the other hand, the lowest unit of typical schedule items refers to deliverable works in locations at the Zone and Operation level, without regard to an element (i.e., Area B-3, Formwork). The item is based on the work breakdown structure (WBS); they are grouped in a master schedule by the Location or Operation level (i.e., 4th Floor, Formwork or Area B-3, Concrete).
In construction management, cost and schedule data show large differences in types and levels of detail (LOD). Although both data share operation data, it is used at different LODs in different types of cost and schedule reports. On the other hand, element and zone data are related to both cost data and schedule control; however, they show various LODs according to reporting purposes, likewise operation data. This variety within cost and schedule data leads to the independent use of multiple information hierarchies with complicated parameters. It results in challenges in the cost-schedule integration with interoperable data hierarchies and the dynamic cost and schedule tracking.
2.3. Cost and Schedule Integration Models
The Cost-schedule integration is required for systematic management of quantity, payment, productivity, material, and labor. The unified system for cost and schedule data can be used as a basis for (1) securing consistent, accurate, and objective information management, (2) improving systematic and well-informed construction management, and (3) establishing a database for major projects. Much research has contributed to this area of study and proposed various models based on WBS, faceted classification, or work-packaging model, such as Percent Allocation Model [9], Work Element Model [10], Design Object Model [11], Work-package Model [3], Earned Value Management System (EVMS) [12], Faceted System [13], and Flexible WBS System [14].
Although there are differences in detailed procedures and methods, the above models show common features. They utilize hierarchical forms to represent data in a top-down approach, ranging from projects to organization (project, space, system/element, task, organization). In addition, they link WBS, CBS, and organization breakdown structure (OBS) by incorporating numbering systems in standard construction information classifications. The connection represents data in a 2-way matrix with rows and columns. The matrixes establish a complicated relational database that ties various planned or progress data for quantity, schedule, and cost. These models show limitations in achieving data consistency and sufficient flexibility in the data structure and produce a vast amount of data whenever low-level information units are added.
The closest model to this paper is the Construction Information Database Framework (CIDF) proposed by Cho et al. [4]. It develops 5W1H facets (Who, Where, What, Why, When, and How dimensions) to cost, schedule, and performance data. It incorporates operation, zone, element, task, date, organization at five levels for integrating cost, schedule, and performance data. Each facet acts as metadata in a spreadsheet-based application and allows for the various transformation and integration of data. Compared to the above-discussed models, it achieves flexibility and full connectivity of cost and schedule data; however, it fails to discuss how to extract and build data from various project documents, which is essential for securing practical application in the construction project. Yet, there is a dearth of cost-schedule integration theory that is practical and applicable in construction management.
2.4. Big Data Technology in Construction Project
The definition of big data refers to as “a collection of data that cannot be captured, managed, and manipulated with conventional software tools for a period of time, requiring new processing models to have a greater decision-making power, a process optimization massive capacity, high growth rates, and diversified information assets” [15]. It is regarded as a promising futuristic technology that generates user-customized and fit-for-purpose information, together with a more accurate prediction. According to statistics [16], the global big data market is projected to grow to 103 billion dollars by 2027, which indicates a 10.48% annual increase from 2018. It has been expected that this technology brings a new paradigm for competition, productivity growth, innovation, and consumer surplus [17].
The application of big data technology has raised significant attention in construction project management. While data-driven analytics has been widely introduced in the building sector, the adoption of big data technology has been low [2]. Ma and Wu [18] used big data to develop a construction schedule evaluation model in terms of project risk. The proposed model is based on EVMS [12] and addressed cost and schedule data only for three types of activities at a single level. Bilal et al. [19] proposed a big data architecture to analyze construction project profitability. It is designed to provide insight into project margin based on project value and profit made. Marzouk and Amin [20] suggested a statistical model to identify sensitive materials for price change, using data for ten years. They defined essential elements for any cost item, such as materials, equipment, labor, and administrative expenses. Wang et al. [21] employed big data technologies to build data from building information models for building projects in order to predict the quality of several construction activities. Guo et al. [22] utilized big data to detect workers’ unsafe behaviors in construction projects linked to WBS.
The existing studies have centered on using big data to provide data-driven insight or to understand trends or patterns for specific purposes in construction management. There is a dearth of research exploring how big data technology can facilitate cost and schedule management. Few studies have dealt with cost and schedule data in their big data architecture; however, both data were mostly addressed respectively and simply connected to each other without an in-depth consideration of their relationships. Moreover, these studies represented all cost and schedule items at a single level. More research on the application of big data technology to extract, clean, and integrate cost-schedule data, which consider their intertwined and multi-hierarchical characteristics, is required to facilitate integrated management of cost and schedule.
3. Cost-Schedule Integration and Big Data Technology
3.1. Characteristics of Cost and Schedule Data
There has been a consensus that the cost-schedule integration provides improved information management and solutions for challenges in construction projects [5], [23]. However, its application in practice still at a nascent stage, compared to other industries, such as manufacturing. The core obstacles of it can be found in characteristics of cost and schedule data in construction projects, as follows.
- Mismatched level of cost and schedule data: As addressed in Section 2.2, cost data and schedule data in construction projects consist of different information units at different LODs that are mismatched to each other [8]. In practice, schedules at various levels are created and utilized, such as overall schedules, monthly schedules, weekly schedules, and subcontractor schedules. Each of them requires cost assignment and aggregation at the appropriate level for corresponding the activity levels addressed in the schedule. To support it, the database structure needs to be flexible to various schedules; it is essential for achieving data consistency in the integrated management of project cost and schedule.
- A vast amount of data: For cost-schedule integrated management, multiple dimensional data for construction projects need to be defined as lowest-level information units. The dimensions cover unit quantities of materials, spaces, building elements, activities, organization, and time. Each dimension contains multiple levels, and activity data associated with quantities needs to be connected to unit and unit pricing (unit material, unit labor, unit equipment). According to the authors’ case studies, around 10 million building elements exist in a 90-million-dollar building project located in Korea, such as structure, envelope, fire safety, mechanical, electrical, and plumbing. Each element needs to be decomposed into lowest-level information units and linked to (1) space data (project, section, floor, zone, room); (2) activity data (i.e., forming, reinforcing, concrete curing); (3) working organization data (subcontractors, crew); (4) management organization data (contractors, management team, manager, construction manager); (5) time data (year, quarter, month, week, day); and (6) unit pricing data. The level of data decomposition can vary according to the required information level and management level. However, it has been identified that approximately one billion data cells should be prepared for achieving high data consistency for cost-schedule integrated management.
- Variable data: The lowest-level information units are generated while operating a construction project. They are updated from time to time as design, construction methods, material, pricing, or contracts change. These updates need to be reflected in the database for cost-schedule integrated management in order to keep data integrity.
- Complicated data structure: There have been efforts to establish databases for lowest-level information units using WBS, CBS, and OBS. The hierarchical approaches in existing studies are not sufficient to incorporate required data at all levels from all dimensions and show limitations in providing enough flexibility and connectivity of data for cost-schedule integration. Consequently, the limited flexibility results in an enormous amount of lower data created by data decomposition at a higher level, which causes challenges in information management.
- Semantic issues: The existing methods utilized construction classification standards and their codes for data standardization as well as data mining. Key data represented as a complicated combination of codes hinder intuitive understanding and communication of the data. From the technical perspective, these methods rely on a database to store and manage the codes, whose establishment requires significant time and effort. The specialized software and administrative information management procedures for database operation require significant installation and maintenance costs. These requirements and the nonintuitive codes have obstructed the active introduction of cost-schedule integrated management.
3.2. Feasibility of Big Data Technology on Cost-Schedule Integration
Big data has its outstanding features, which can be summarized as Volume, Variety, Veracity, and Value (as known as 4Vs) [24]. The feasibility of the application of big data technology to the cost-schedule data integration has been analyzed.
- As discussed in Section 3.1, the cost-schedule data is vast and created in different forms by different stakeholders in construction projects. Data including quantity, cost, schedule, payment, material, and labor are generated in varied formats (i.e., quantity calculation, bill of quantities, schedules) for multiple purposes and changed as the project proceeds. The 4Vs of big data clearly explain vital attributes of construction data, which is large, heterogeneous, and dynamic with value in decision making [25]. Big data technology can be regarded as a suitable method to integrate and manage the ‘big’ cost-schedule data in construction management.
- The data accumulated in construction firms are mostly associated with financial and schedule management. According to the survey with 89 firms in Korea in 2014, 76% and 49% of them have stored cost-related data and schedule-related data, respectively [26]. It infers that the available data for cost-schedule integration is accessible and easy to collect.
- The technical level of handling big data can be categorized according to a data structure (i.e., structured, semi-structured, unstructured), data type (i.e., text, log, sensor, image), data format (i.e., RDB, HTML, XML, Json). Most of the cost-schedule data is structured text data in document format; it facilitates data processing, transmission, storage, and evaluation. Technology for collecting, storing, analyzing, and visualizing data has been developed rapidly and published as open-source packages. The high accessibility of technology and the low difficulty in handling cost-schedule data indicate the possibility of the active application of big data technology to the integrated management of cost-schedule.
- Big data technology, which enhances the accuracy of analysis and prediction, is ideal for engineering analysis, including construction engineering [27]. From a statistical perspective, big data infer the patterns within a population using random sampling. The sampling technique is useful for analyzing limited data size, especially overcoming challenges in collecting and processing data; however, it might have the disadvantage of the overfitted prediction to sample, which leads to the failure to capture real patterns of the population.
3.3. Requirements for Cost-Schedule Integration
The improvement of cost-schedule integration by leveraging big data technology needs to incorporate data characteristics while resolving the limitations within existing cost-schedule integration models. For developing an applicable method in construction projects, three requirements have been identified as followed.
- Data integrity and flexibility: the integrity of lowest-level information units for cost and schedule data is fundamental for addressing mismatched information levels between them. It is essential to build a flexible data structure to accommodate various information units at different LODs from multiple dimensions. It should allow data decomposition and aggregation in response to purposes of construction management, including quantity, cost, schedule, productivity, labor, periodic payment, and material of construction projects.
- Efficiency in establishing and transforming data: The enormous time and effort required to develop the integrated database of cost and schedule data play a role as the root cause of the failure to adopt existing models in practice. A novel approach for efficiently and cost-effectively establishing and updating a database as projects proceed is necessary for its wide application in practice.
- Practicability: the new method needs to support a range of data extraction and analysis for practical cost and schedule control, and it should be easy to use for practitioners. In addition, the method should be fit for the work process and documentation in construction projects. The adoption of new technologies changes not only work activities but also work paradigm, including work processes, collaboration methods, information and administrative activities, working knowledge, and organization networks [28]. In this context, the new method should reflect sufficiently current construction management practices to minimize the changes to minimize practitioners’ hesitation to use.
4. Big Data Algorithm for Integrated Cost-Schedule Data Management
4.1. Data Structure for Cost-Schedule Integration
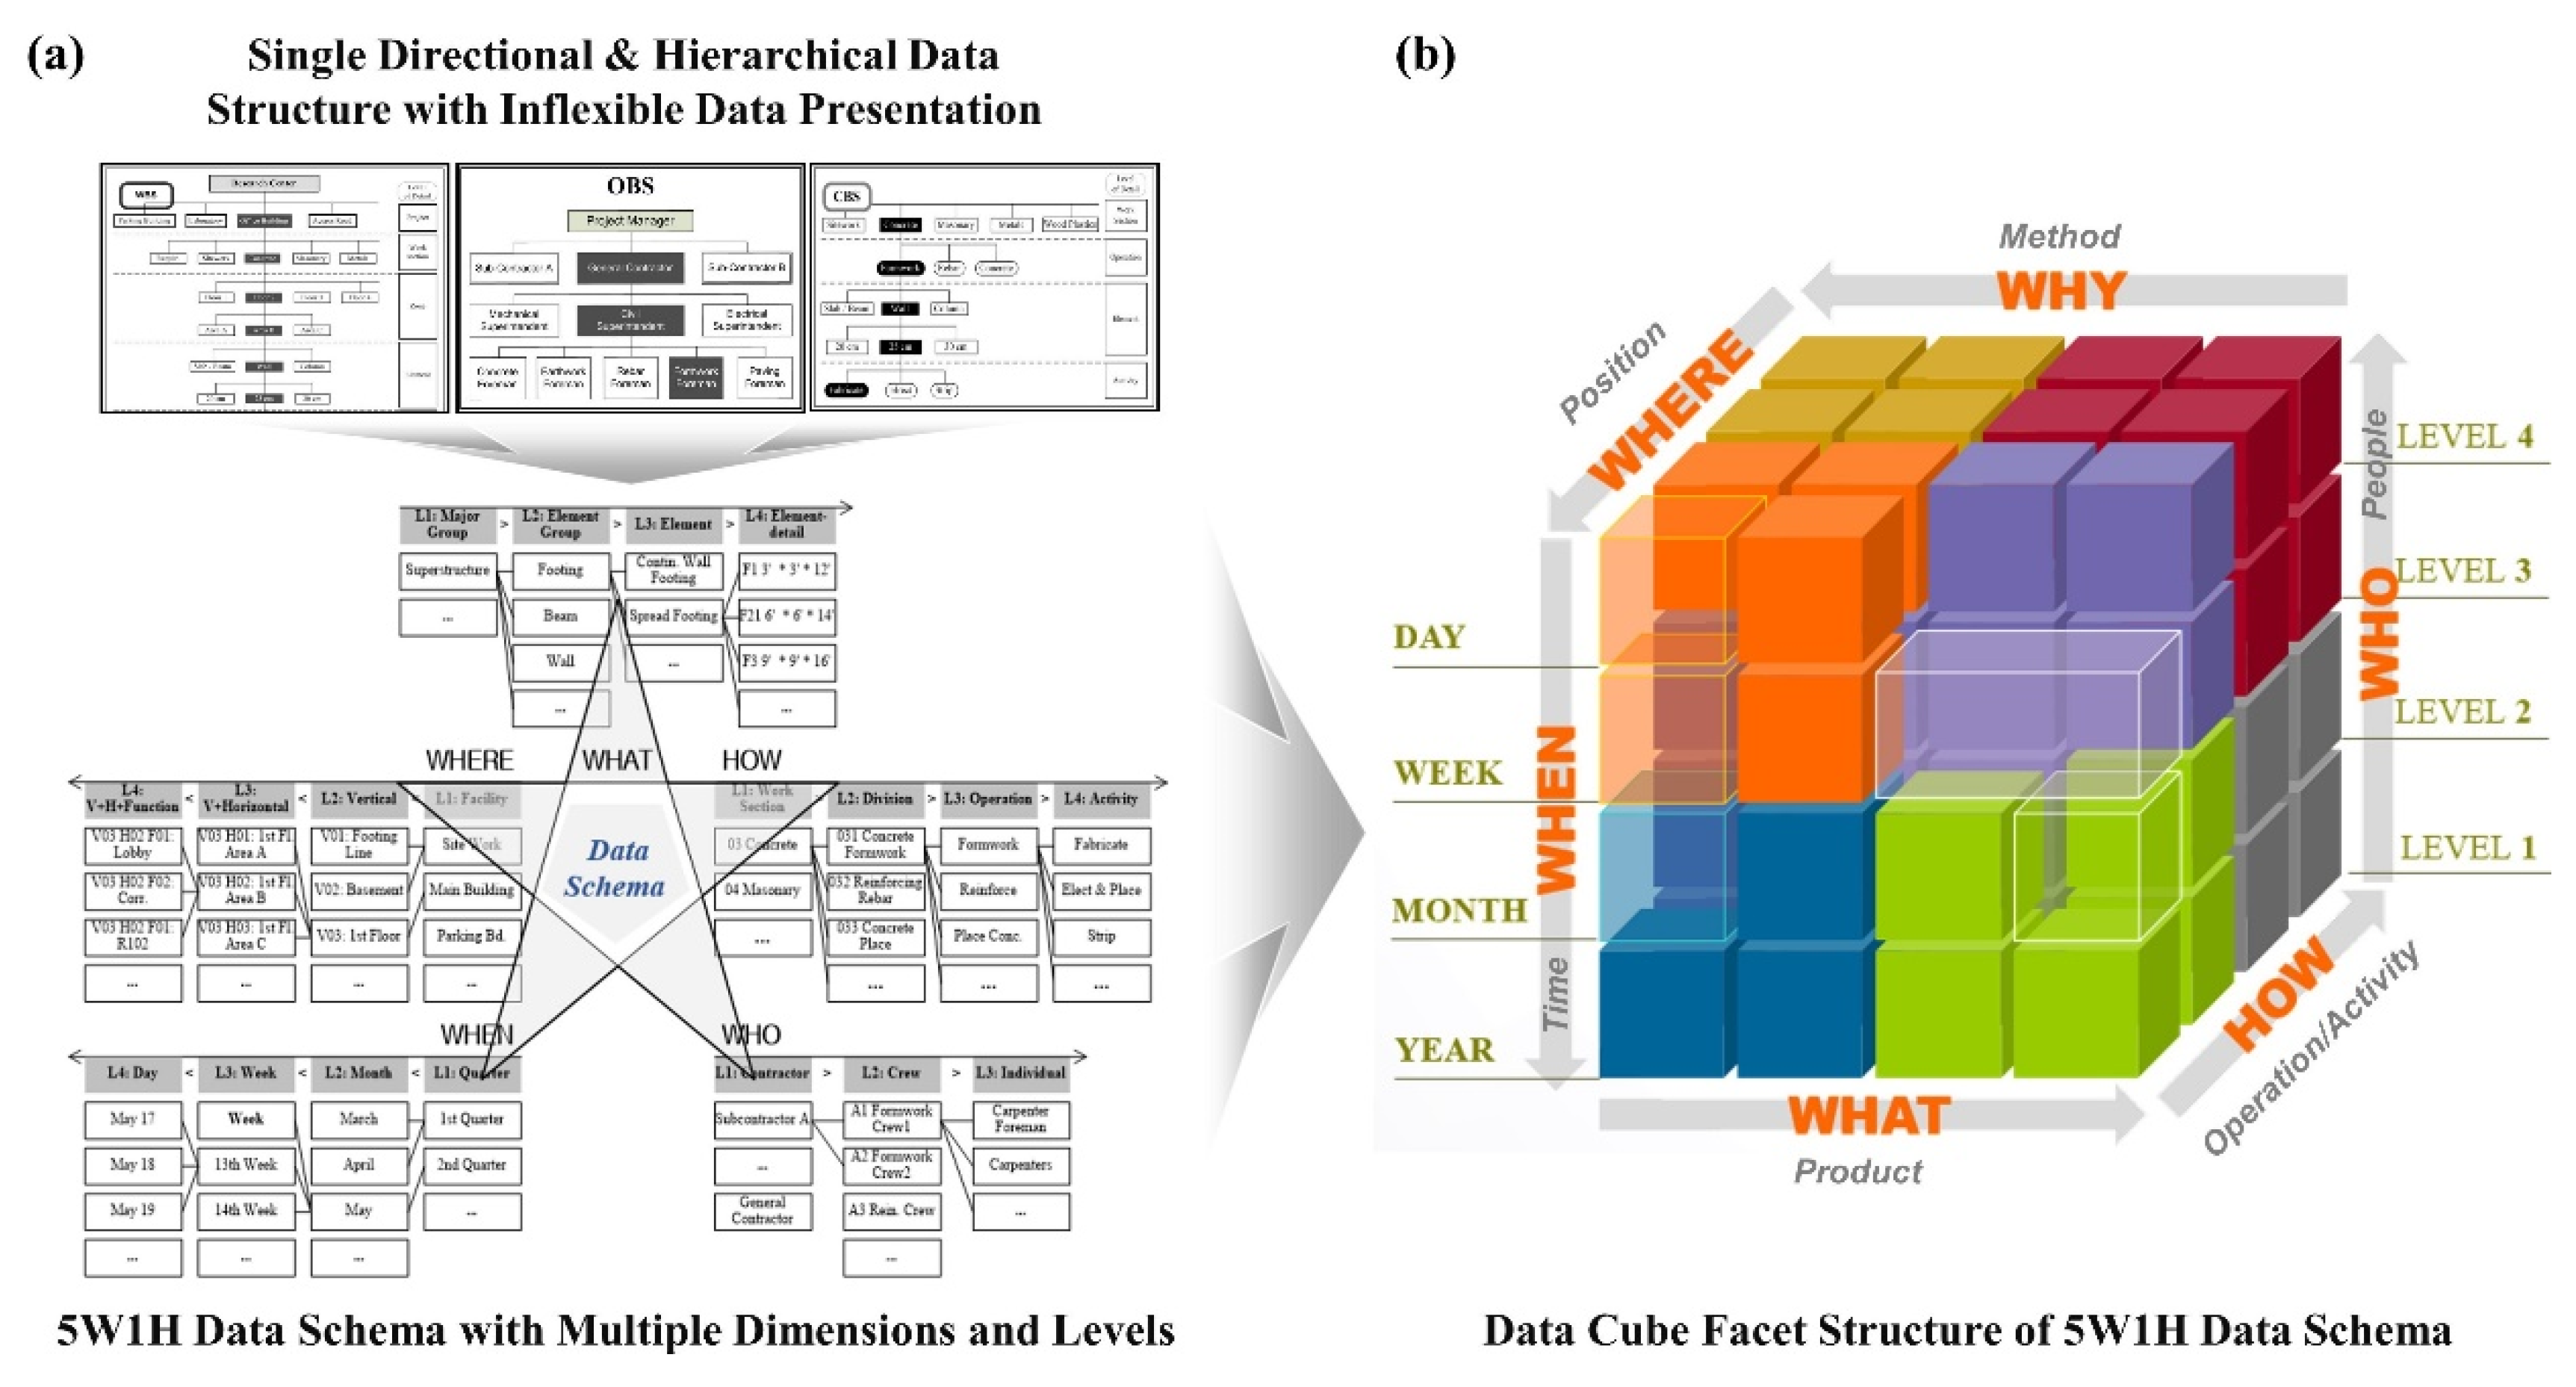
This research establishes a framework for cost-schedule data integration in line with the identified requirement in Section 3.3. The data framework is established by extending the CIDF model proposed by Cho et al. [4] since it allows flexible and dynamic data fusion. Cost and schedule management is a series of operating activities while asking fundamental questions continuously—"Who did which work in which location with what construction method?”, “How much has it done?”, and “When has it done?” The 5W1H data structure can be a tool to understand the questions by standardizing data into six dimensions (Where, What, How, When, Who, and Why) and combining the dimensions at different levels according to the need [29].
Two construction classification standards are applied to this research. UniFormat (Level 2–5) [30] is used as a benchmark for information units in the WHAT dimension as it is an element-oriented classification system for cost estimation. In the HOW dimension, the LOD of each information unit is defined based on MasterFormat (Level 1–5) [31], which is an operation-oriented system and widely used for specifications of construction contract documents. The conceptual data structure based on the 5W1H schema is illustrated in Figure 2.
The WHAT dimension indicates physical or functional elements (i.e., building components, systems). Construction project data commonly comprises the sum of physical elements, together with other information items linked to its own units. In this context, this dimension provides a basic information unit in the proposed structure. Based on the UniFormat, physical elements in this research are decomposed into four LODs: Major Group (Uniformat Level 2) > Sub-Group (Uniformat Level 3) > Element (Uniformat Level 4) > Element Detail (Uniformat Level 5).
The WHERE dimension represents space/zone classification data. It provides specifications of locations where construction activities happen using physical breakdown structures. The location of every element in the WHAT dimension can be defined by using six LODs: Project > Sub-Project > Facility > Vertical > Horizontal > Space.
The HOW dimension expresses construction activities/operations required to generate physical elements. It describes construction methods comprising activities and provides linkage to basic cost elements and organization, such as productivity rate, unit material, unit labor. Based on MasterFormat, information units are be decomposed into five LODs: Work (Masterformat Level 1) > Work Section (Masterformat Level 2) > Division (Masterformat Level 3) > Operation (Masterformat Level 4) > Activity (Masterformat Level 5).
The WHEN dimension organizes time information, such as a completion duration of each work item related to quantity. As a major resource of schedule control, it is divided into eight LODs: Year > Quarter > Month > Week > Planned Early Start Time (EST) > Planned Early Finish Time (EFT) > Actual EST > actual EFT.
The WHO dimension defines responsible organizations for each activity in the HOW dimension on elements in the WHAT dimension. The project organization is classified into six LODs: Contractor > Work Crew > Individual > Management Corporation > Management Organization > Manager.
The WHY dimension addresses data required for specifying detailed information of each work item in the HOW dimension. The dimension is utilized to distinguish items from the database, such as materials supplied by an owner, works completed by a special construction method, materials carried by a crane, and required equipment. The dimension is not mandatory but optional.
Table 1 shows how information units for cost and schedule data are defined within the suggested structure. As occasion demands, the LOD of each dimension can be extended, but a minimum number of LODs is recommended to reduce the complexity of data structure. The proposed schema allows answering the fundamental questions for performing construction management at different levels. For instance, questions regarding work progress at two levels can be answered by the data structure—“What is the quantity of concrete that needs to be placed this month?” and “What is the quantity of concrete that needs to be placed for a slab on the third floor of Building A?”. For the first question, simple extraction of two information units is necessary: this month (WHEN, L3) and concrete placement (HOW, L3). In the case of the second question, the composition of three extracted data is required: this week (WHEN, L4), Building A (WHERE, L3), third floor (WHERE, L4).
4.2. Three Principles for Cost-Schedule Integration Algorithm
Based on the proposed data structure, this research develops a cost and schedule data integration algorithm using big data technology. The three principles have been applied to the development. The first one is that the data for construction management exists somewhere in any format. It means that organization charts, contract documents, schedule reports, quantity take-offs, and cost reports are available. Information units for the WHO dimension can be retrieved from organization and contract documents, while the units for the WHEN can be extracted from schedules. In addition, data for the WHERE, WHAT, and HOW dimensions come from quantity take-offs; one for the WHY dimension is captured from cost reports.
The second principle is that a higher level of dimensions can be decided using a lower-level information unit. When lowest-level data is defined, the upper levels are automatically determined, using their hierarchical relationship within standard construction classifications (i.e., MasterFormat and UniFormat) and construction project management standards. For example, slip forming from the cost report is matched to “031113.13 Concrete Slip Forming” in Masterformat; from its code, all five levels in HOW dimension can be assigned: Concrete Slip Forming (L5, code 031113.13) < Structural Cast-in-Place Concrete Forming (L4, code: 031113) < Concrete Forming (L3, code: 0311) < Concrete Forming and Accessories (L2, code: 031) < Concrete (L1, code: 03).
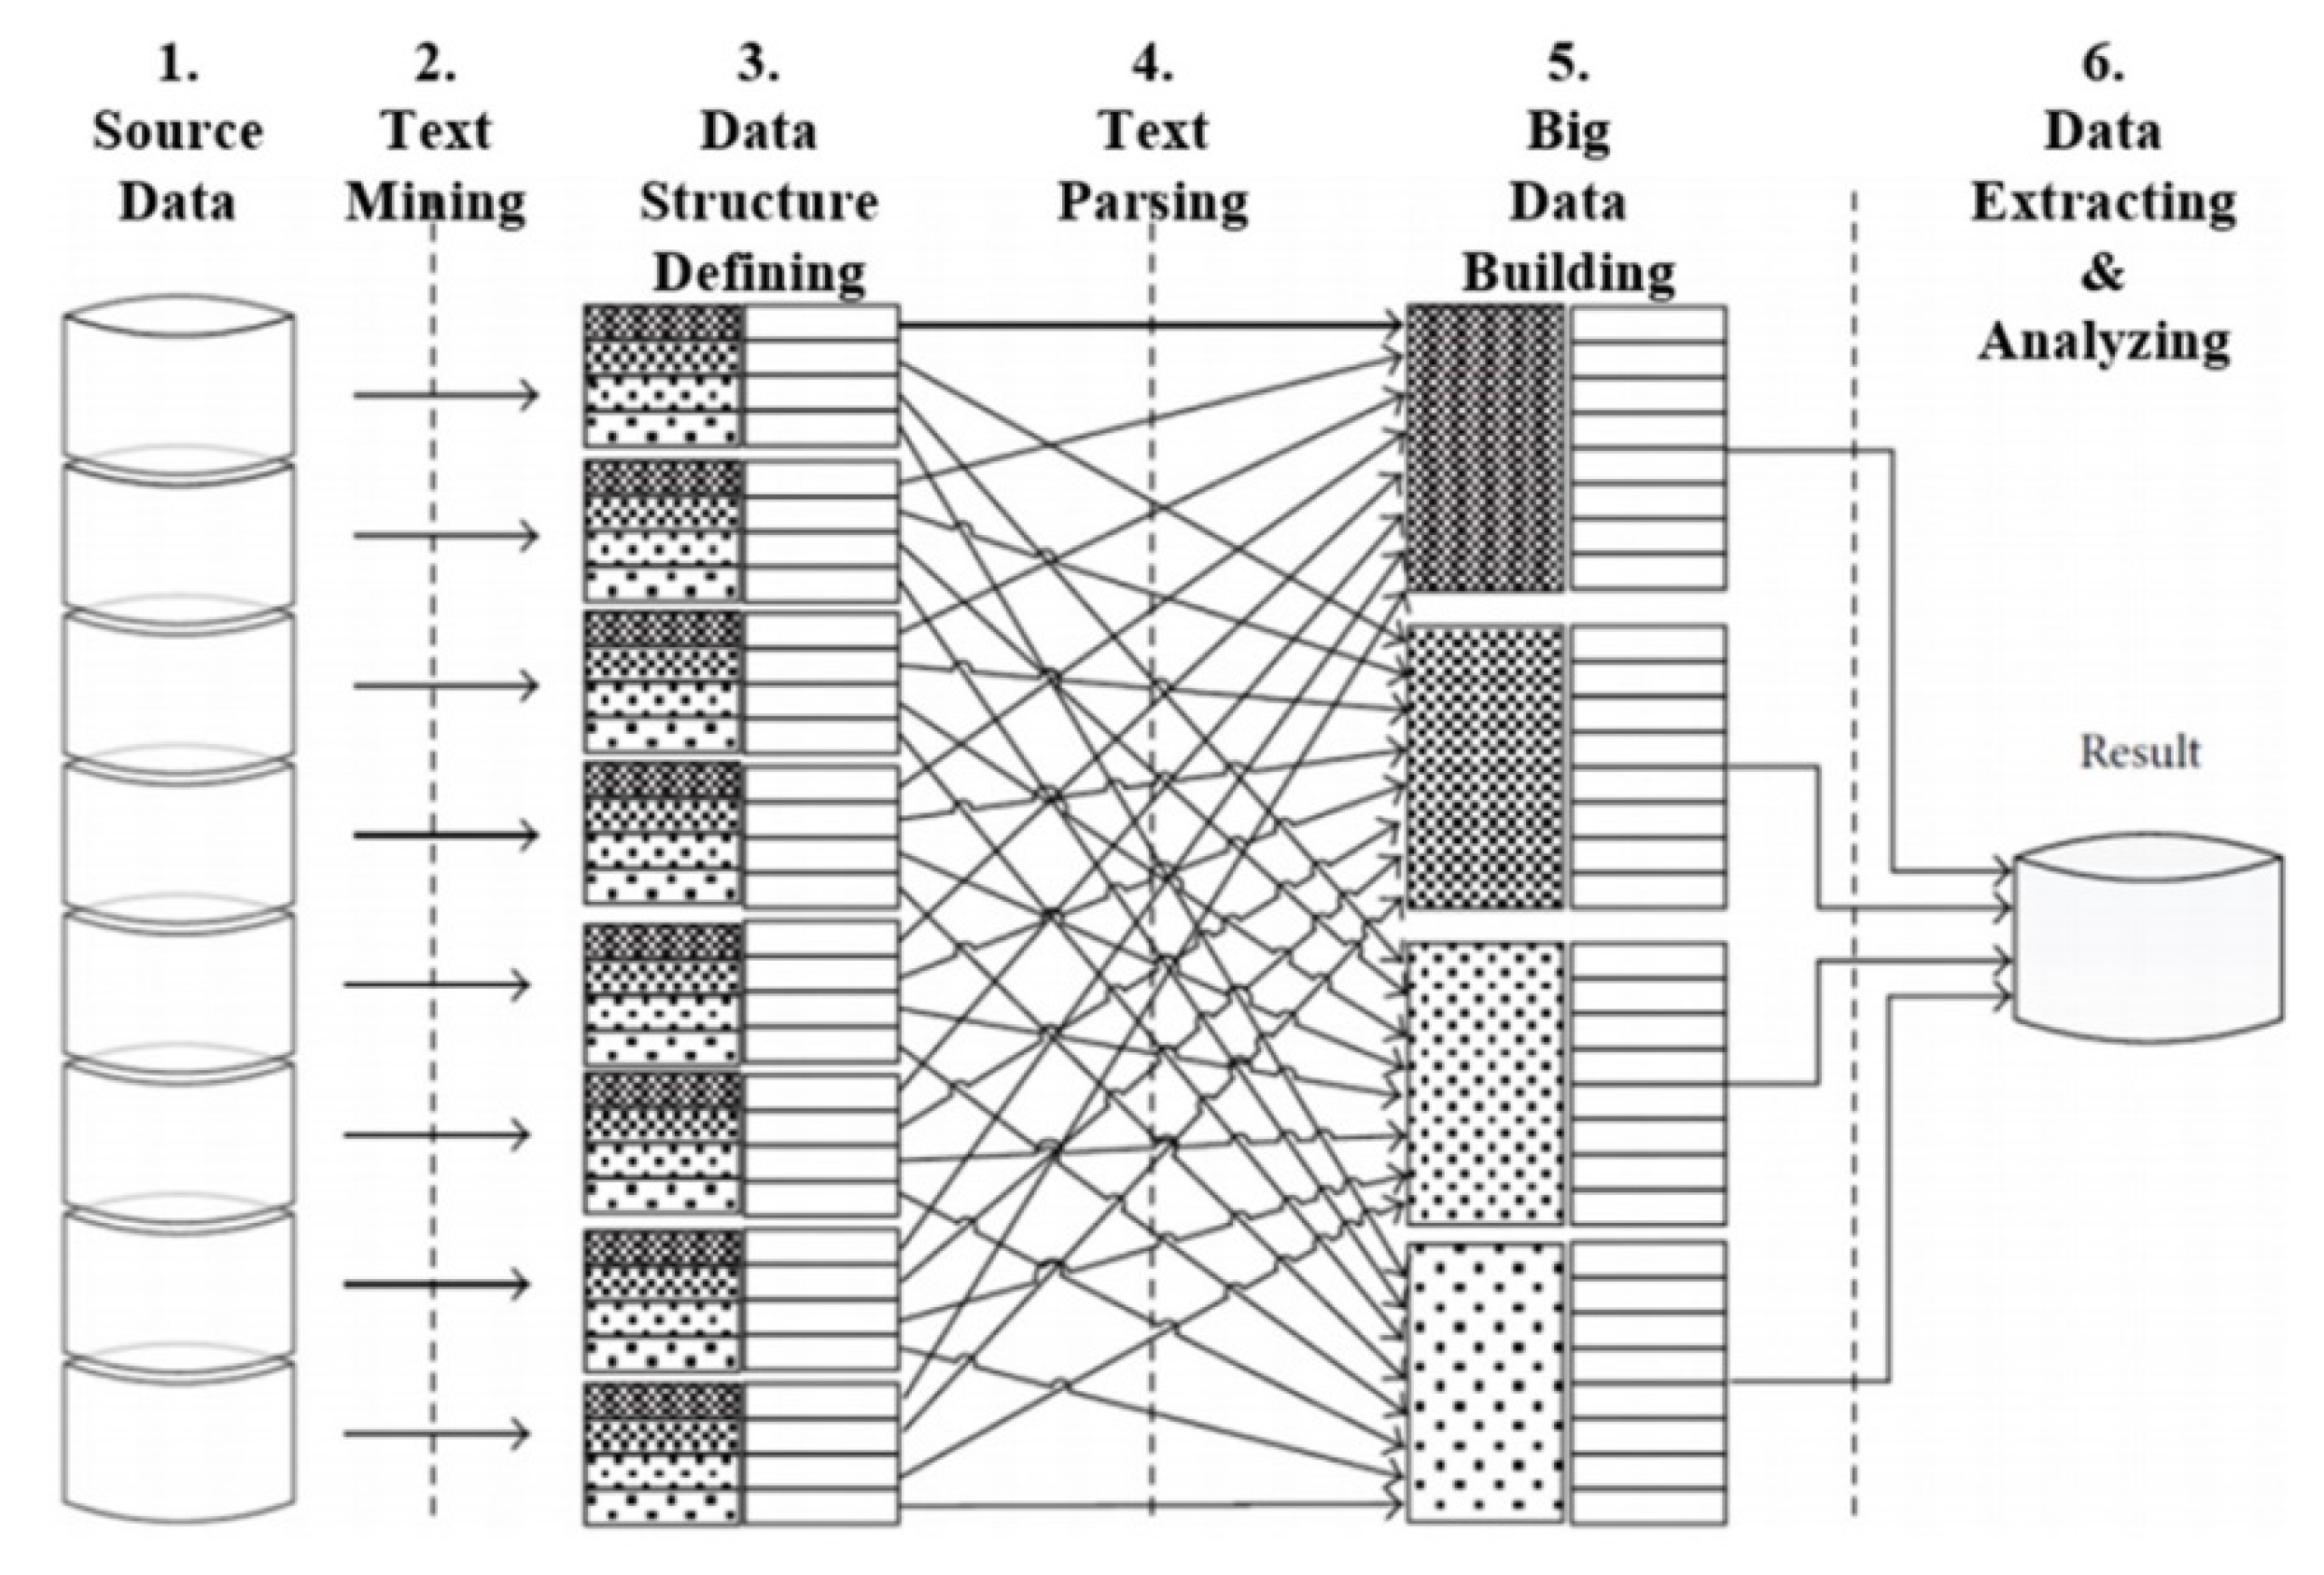
The third principle is that big data technology is available to collect, structure, extract, and analyze cost and schedule data, which is scattering across different documents. Figure 3 shows the conceptual process of extracting and analyzing cost-schedule data using big data technology. The detailed processes will be discussed in Section 4.3.
4.3. Big Data Technology-driven Algorithm for Cost-Schedule Integration
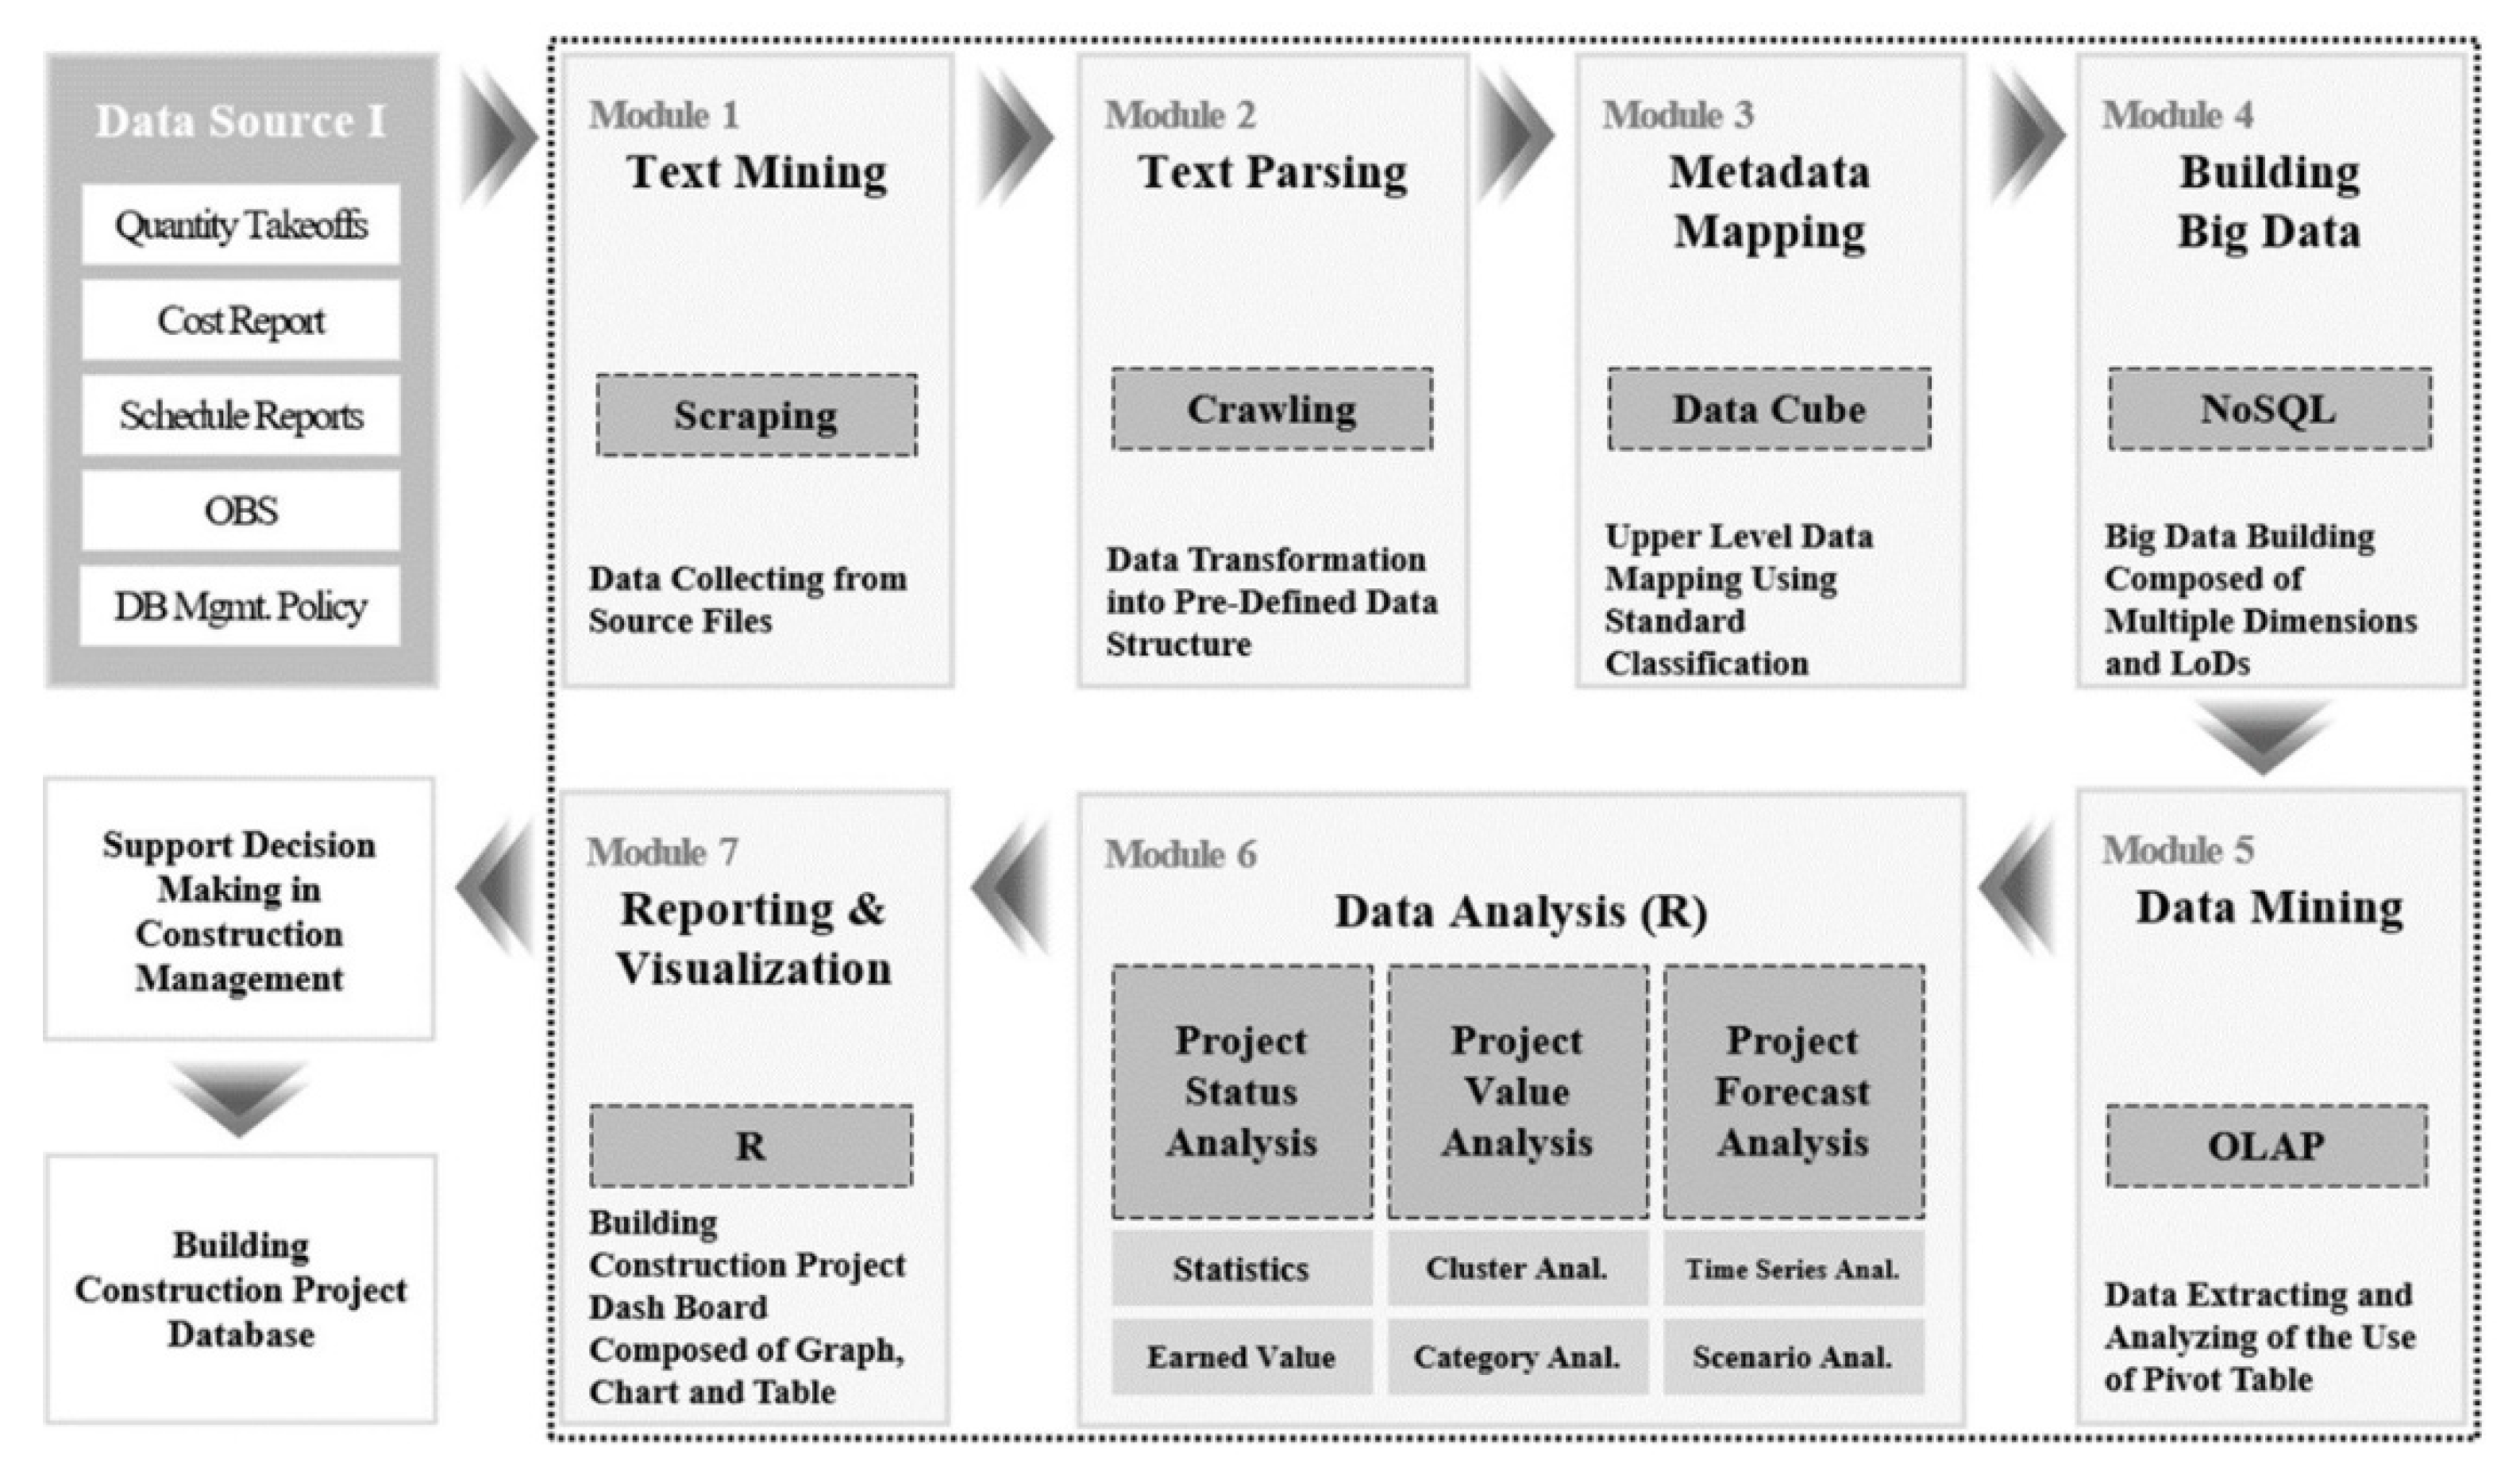
This research proposes a cost-schedule data integration algorithm employing big data technology, as shown in Figure 4. It consists of seven modules and provides four main functions:
- building big data from various data sources based on the 5W1H data schema (Module 1–4),
- extracting data for users’ requirements (Module 5),
- analyzing data using extracted data (Module 6),
- visualizing analysis results by creating graphs, charts, and diagrams (Module 7).
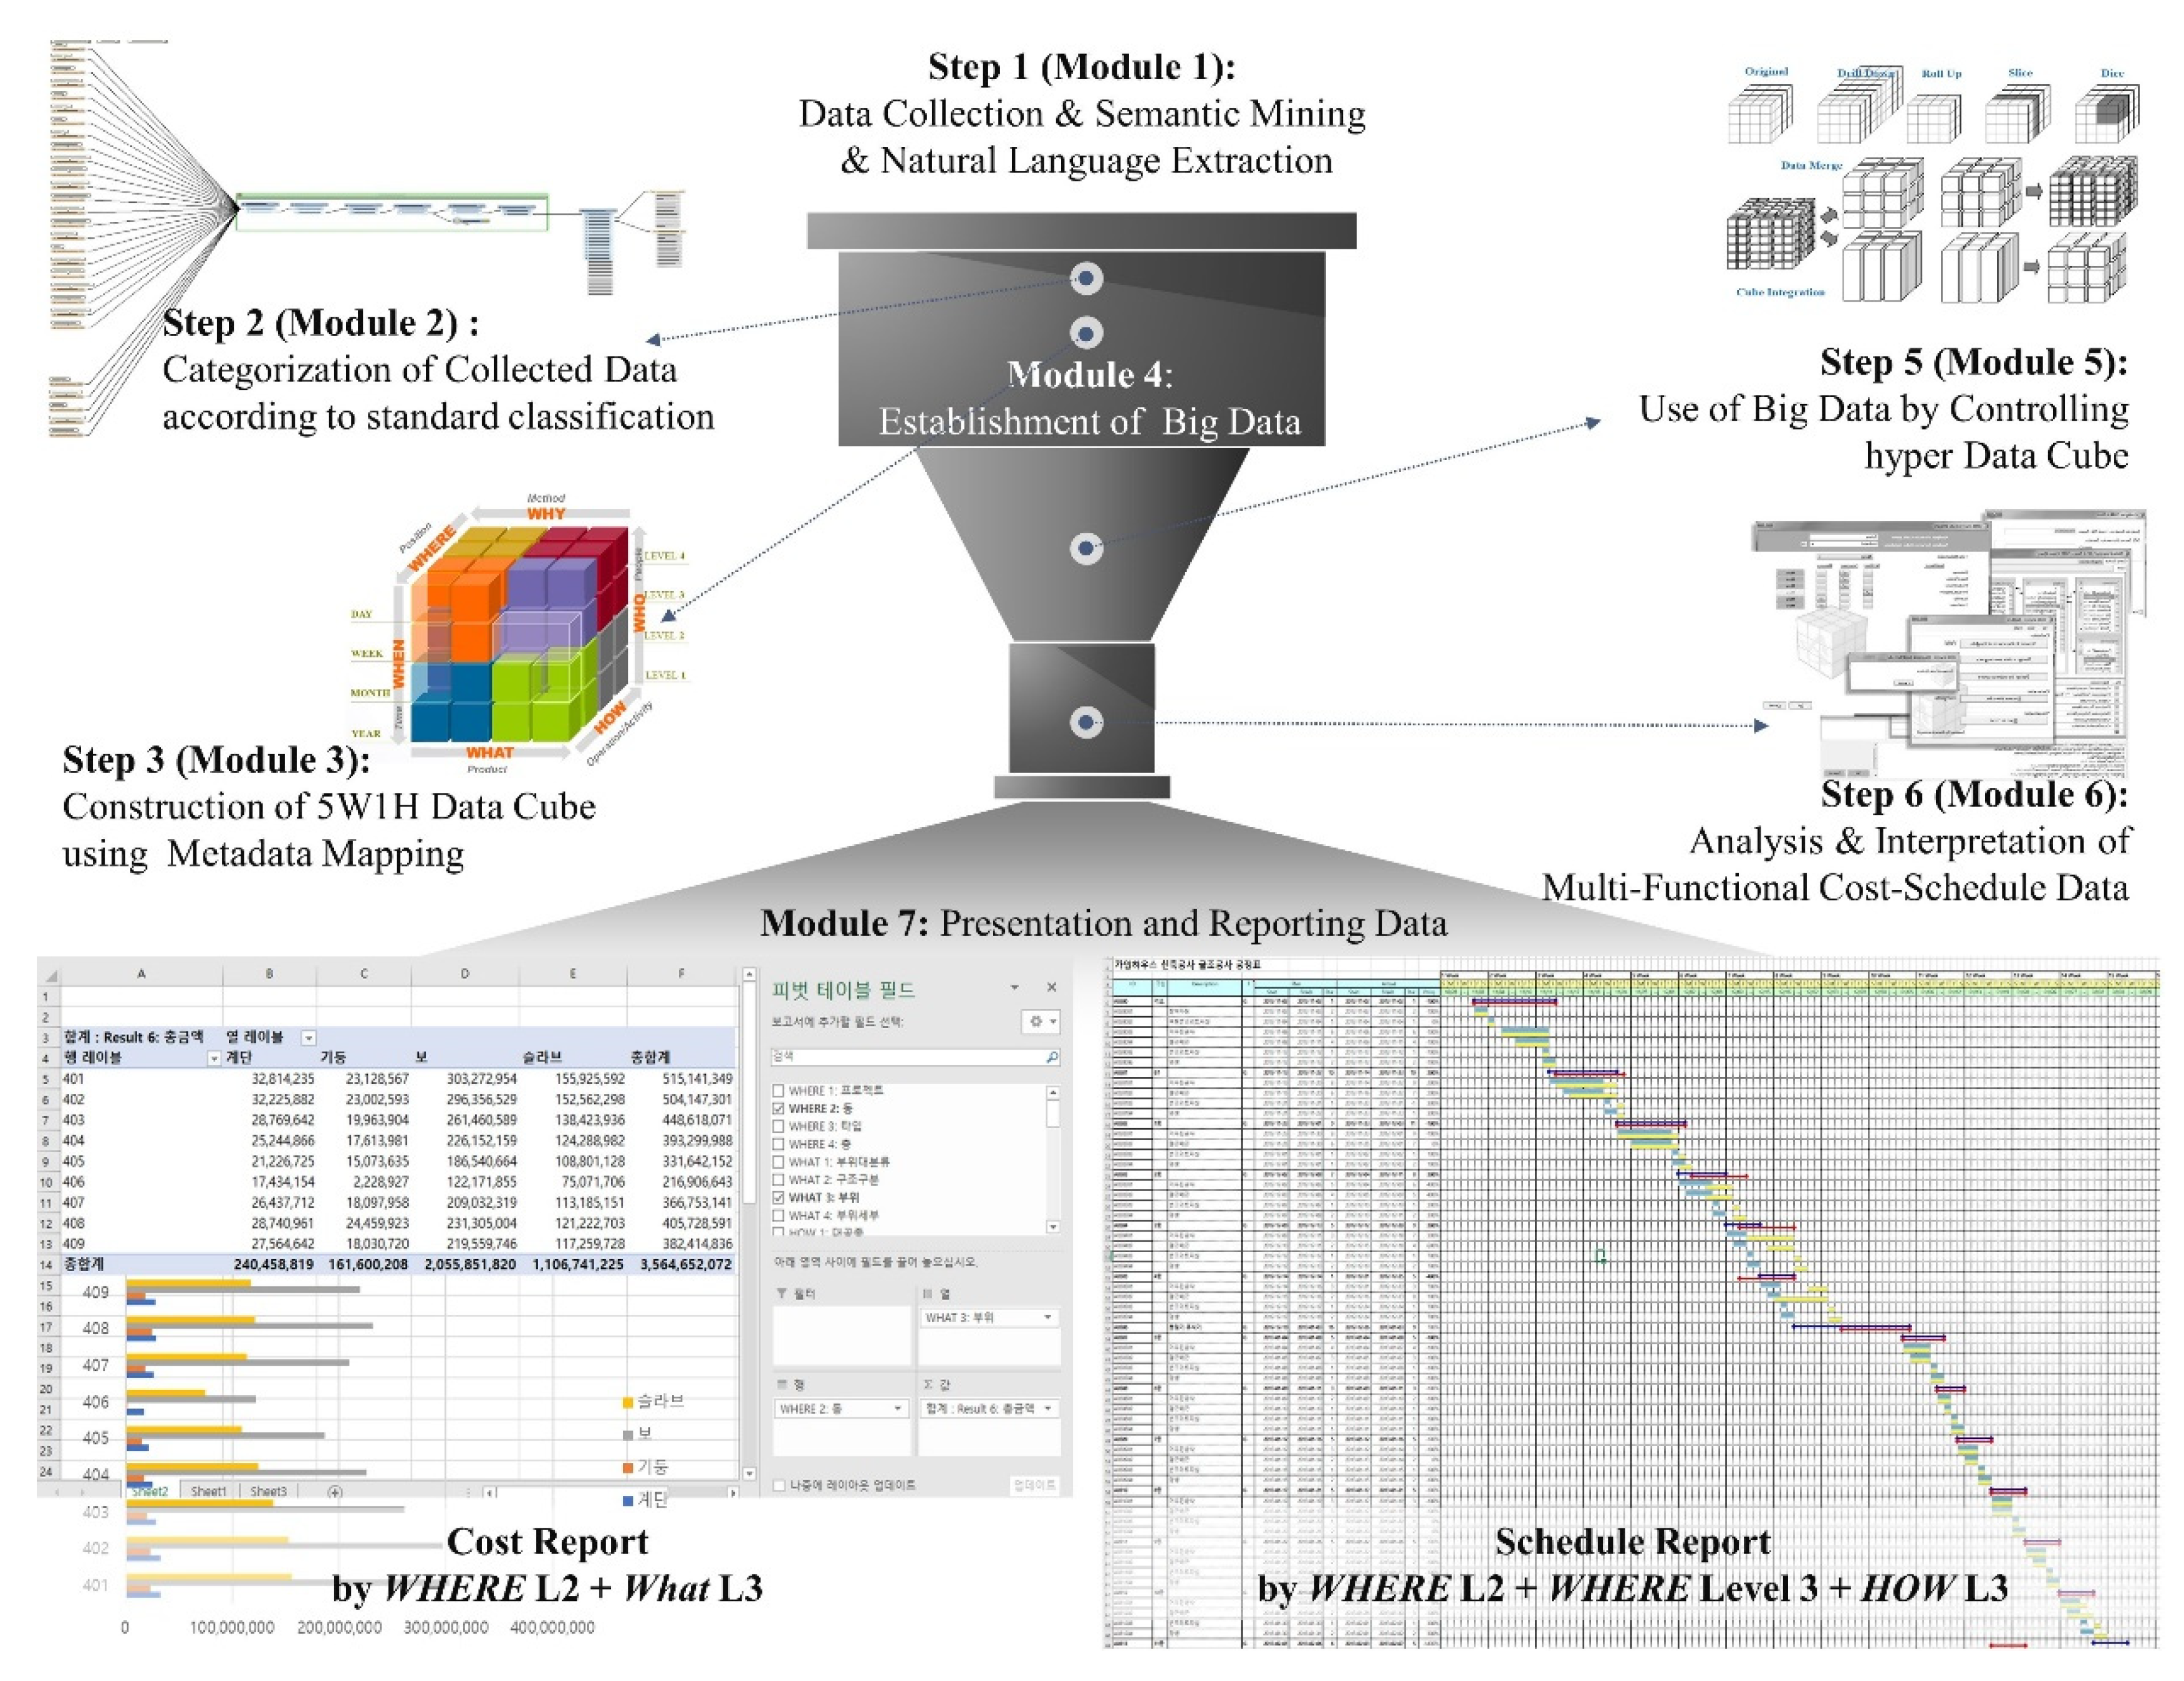
The detailed definitions and functions of the seven modules are represented in Figure 5. Module 1 is an Automatic Text Mining module, collects information units for cost and schedule data, which are at the lower level of the 5W1H data structure, from data sources (including quantity take-off, cost reports, and schedule reports). The big data scraping technology that extracts structured or unstructured data in natural language is applied to this module. Module 2, named Data Parsing module, incorporates crawling technology to transform and process the data collected by Module 1 into structured data stored in the database. This module first conducts mapping the collected data into the corresponding items in MasterFormat, UniFormat, and construction project management standards, and imports the items’ codes. It also finds shared data among different sources and uses it as a medium to link all collected data; it integrates and stores all data into the 5W1H data structure in the MSSQL database.
Module 3, Metadata Mapping module, automatically assigns values for higher-levels, using lowest-level data. It is in line with the second principle in Section 4.2. The codes of lowest-level data identified in Module 2 are used as metadata for inferring higher-level data. Each inferring rule for each dimension that is related to the classification systems and standards has been developed in Python. Module 4 is called Big Data Building module and establishes big data of all level information units in six dimensions, according to the 5W1H schema.
Module 5, Big Data Mining module, is designed to extract the required data from the big data. It adopts functions of online analytical processing (OLAP) (slice, dice, rotation, rollup, drill-down, query optimizer) to allow data extracting from multi-level of details and multi-perspectives. As Module 6, a Big Data Analysis module provides various analyses regarding project status, project value, and project forecast, using the extracted data by Module 5. Lastly, Module 7 for Data Reporting & Visualization visualizes analysis results with the help of R or Microsoft Power BI.
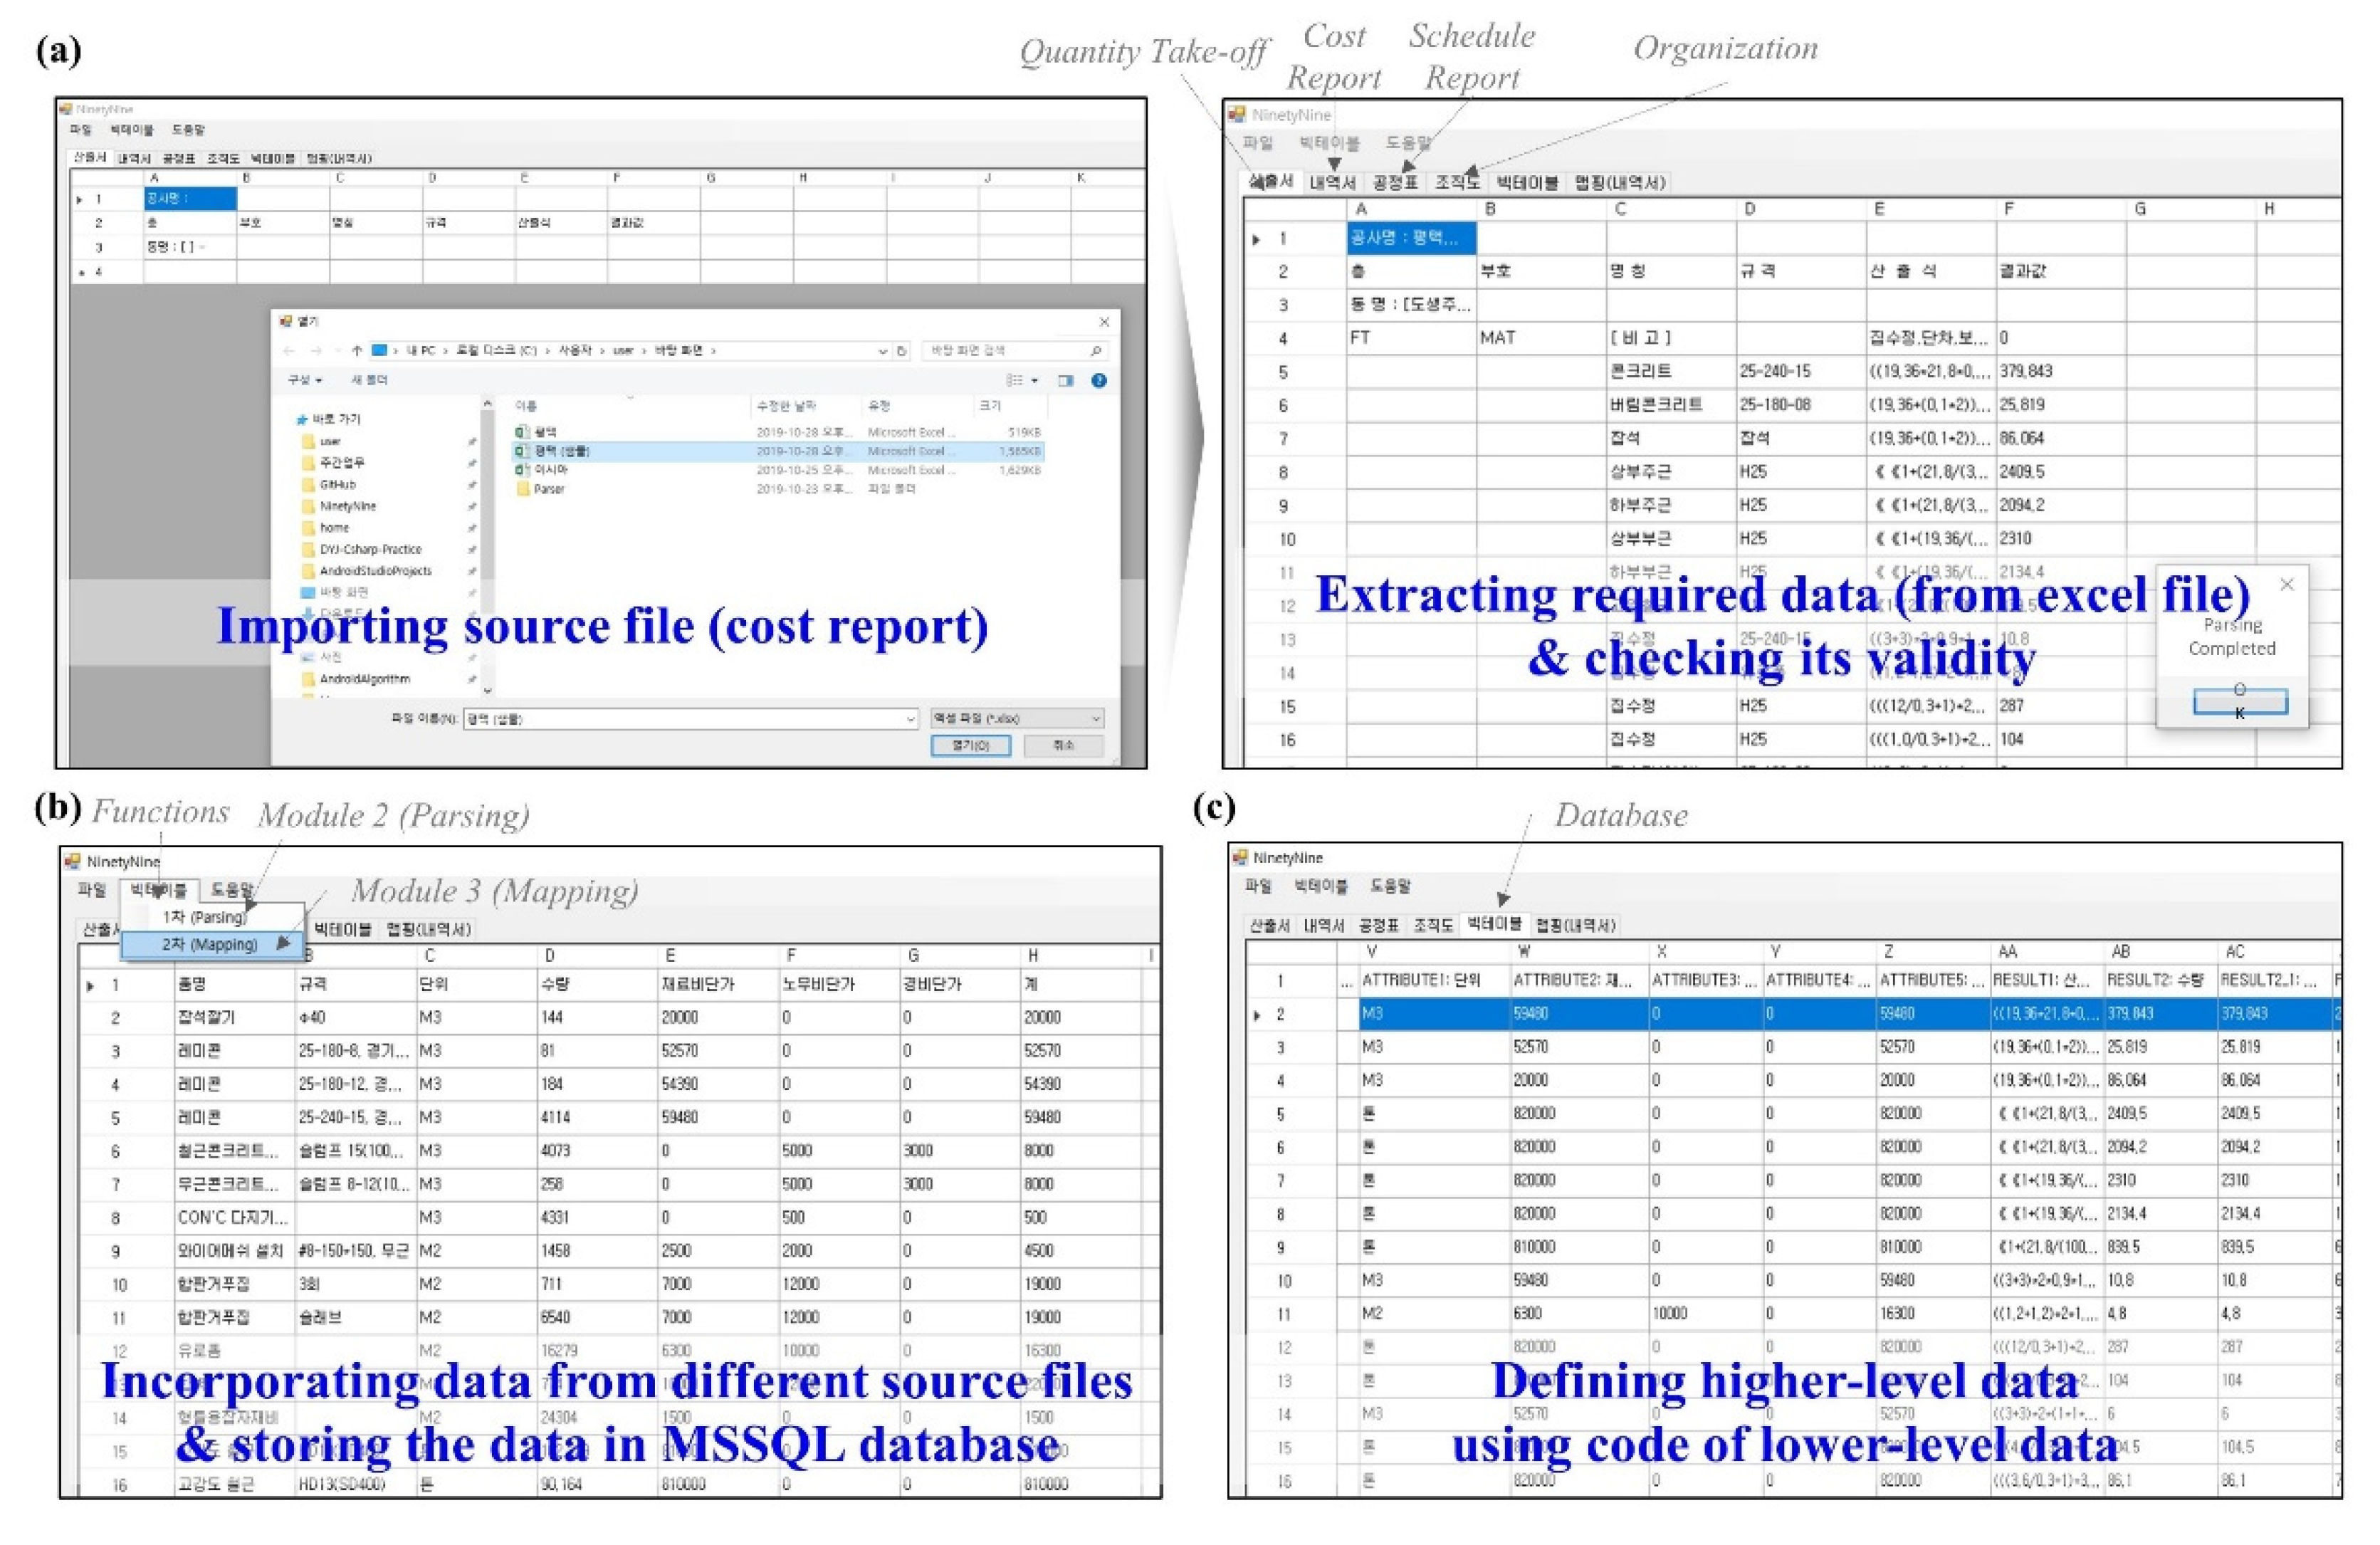
The implementation of Module 1 uses Python; the scraped data from sources is translated into Open XML format and checked its validity. Module 2 has been developed by Python to (1) categorize the collected lowest-level data from different sources, (2) incorporate them using shared data, and (3) store it into the data structure in MSSQL database. Module 3 has also been constructed using Python to infer upper-level data according to the metadata—the codes of lower-level data. Three Python libraries are used in the implementation: openpyxl, pymssql, and time. Module 1 utilizes the openpyxl to extract data from source files (Excel file), and Module 2 uses the pymssql to transform and store the extracted data in the MSSQL database. The time is adopted to Module 3 to update and store the inferred higher-level data in the MSSQL database. Interfaces of the modules are shown in Figure 6.
5. Case Study of Proposed Algorithm
5.1. Summary of Case Study
The proposed cost-schedule data integration algorithm has been applied to a real construction project of one apartment complex in South Korea with mixed-use (residential and commercial). This research selected this case study project since apartment projects have been ordered continuously over many decades globally [32], as the most common type of construction project. It is considered that the application of the proposed algorithm to this project can show its feasibility of one of the prevalent types of construction projects.
The complex involves nine buildings with 774 units. This case study only focuses on the structural part of the buildings, which corresponds to the 03 Concrete in MasterFormat. All data associated with foundation, walls, slabs, stairs, columns, and beams of nine buildings have been demonstrated. Several email discussions and semi-structural interviews with project managers were conducted to enhance understanding of the project data. As sources of data, eight types of project documents (drawings, specifications, quantity-takeoffs, project budget reports, detailed cost estimate report, master schedule, bar chart schedule, and monthly progress curve) were provided.
According to project managers’ requests, the database was established in Microsoft Excel since it is the primary tool used in project management. In addition, the Individual level of the WHO dimension (L3) was omitted, but its contents were represented in the Labor Unit Cost (Attribute 3). Two levels were incorporated into the WHAT and HOW dimensions, WHAT L5 (Element Type), HOW L6 (Activity Detail), in response to the project organizations’ complexity.
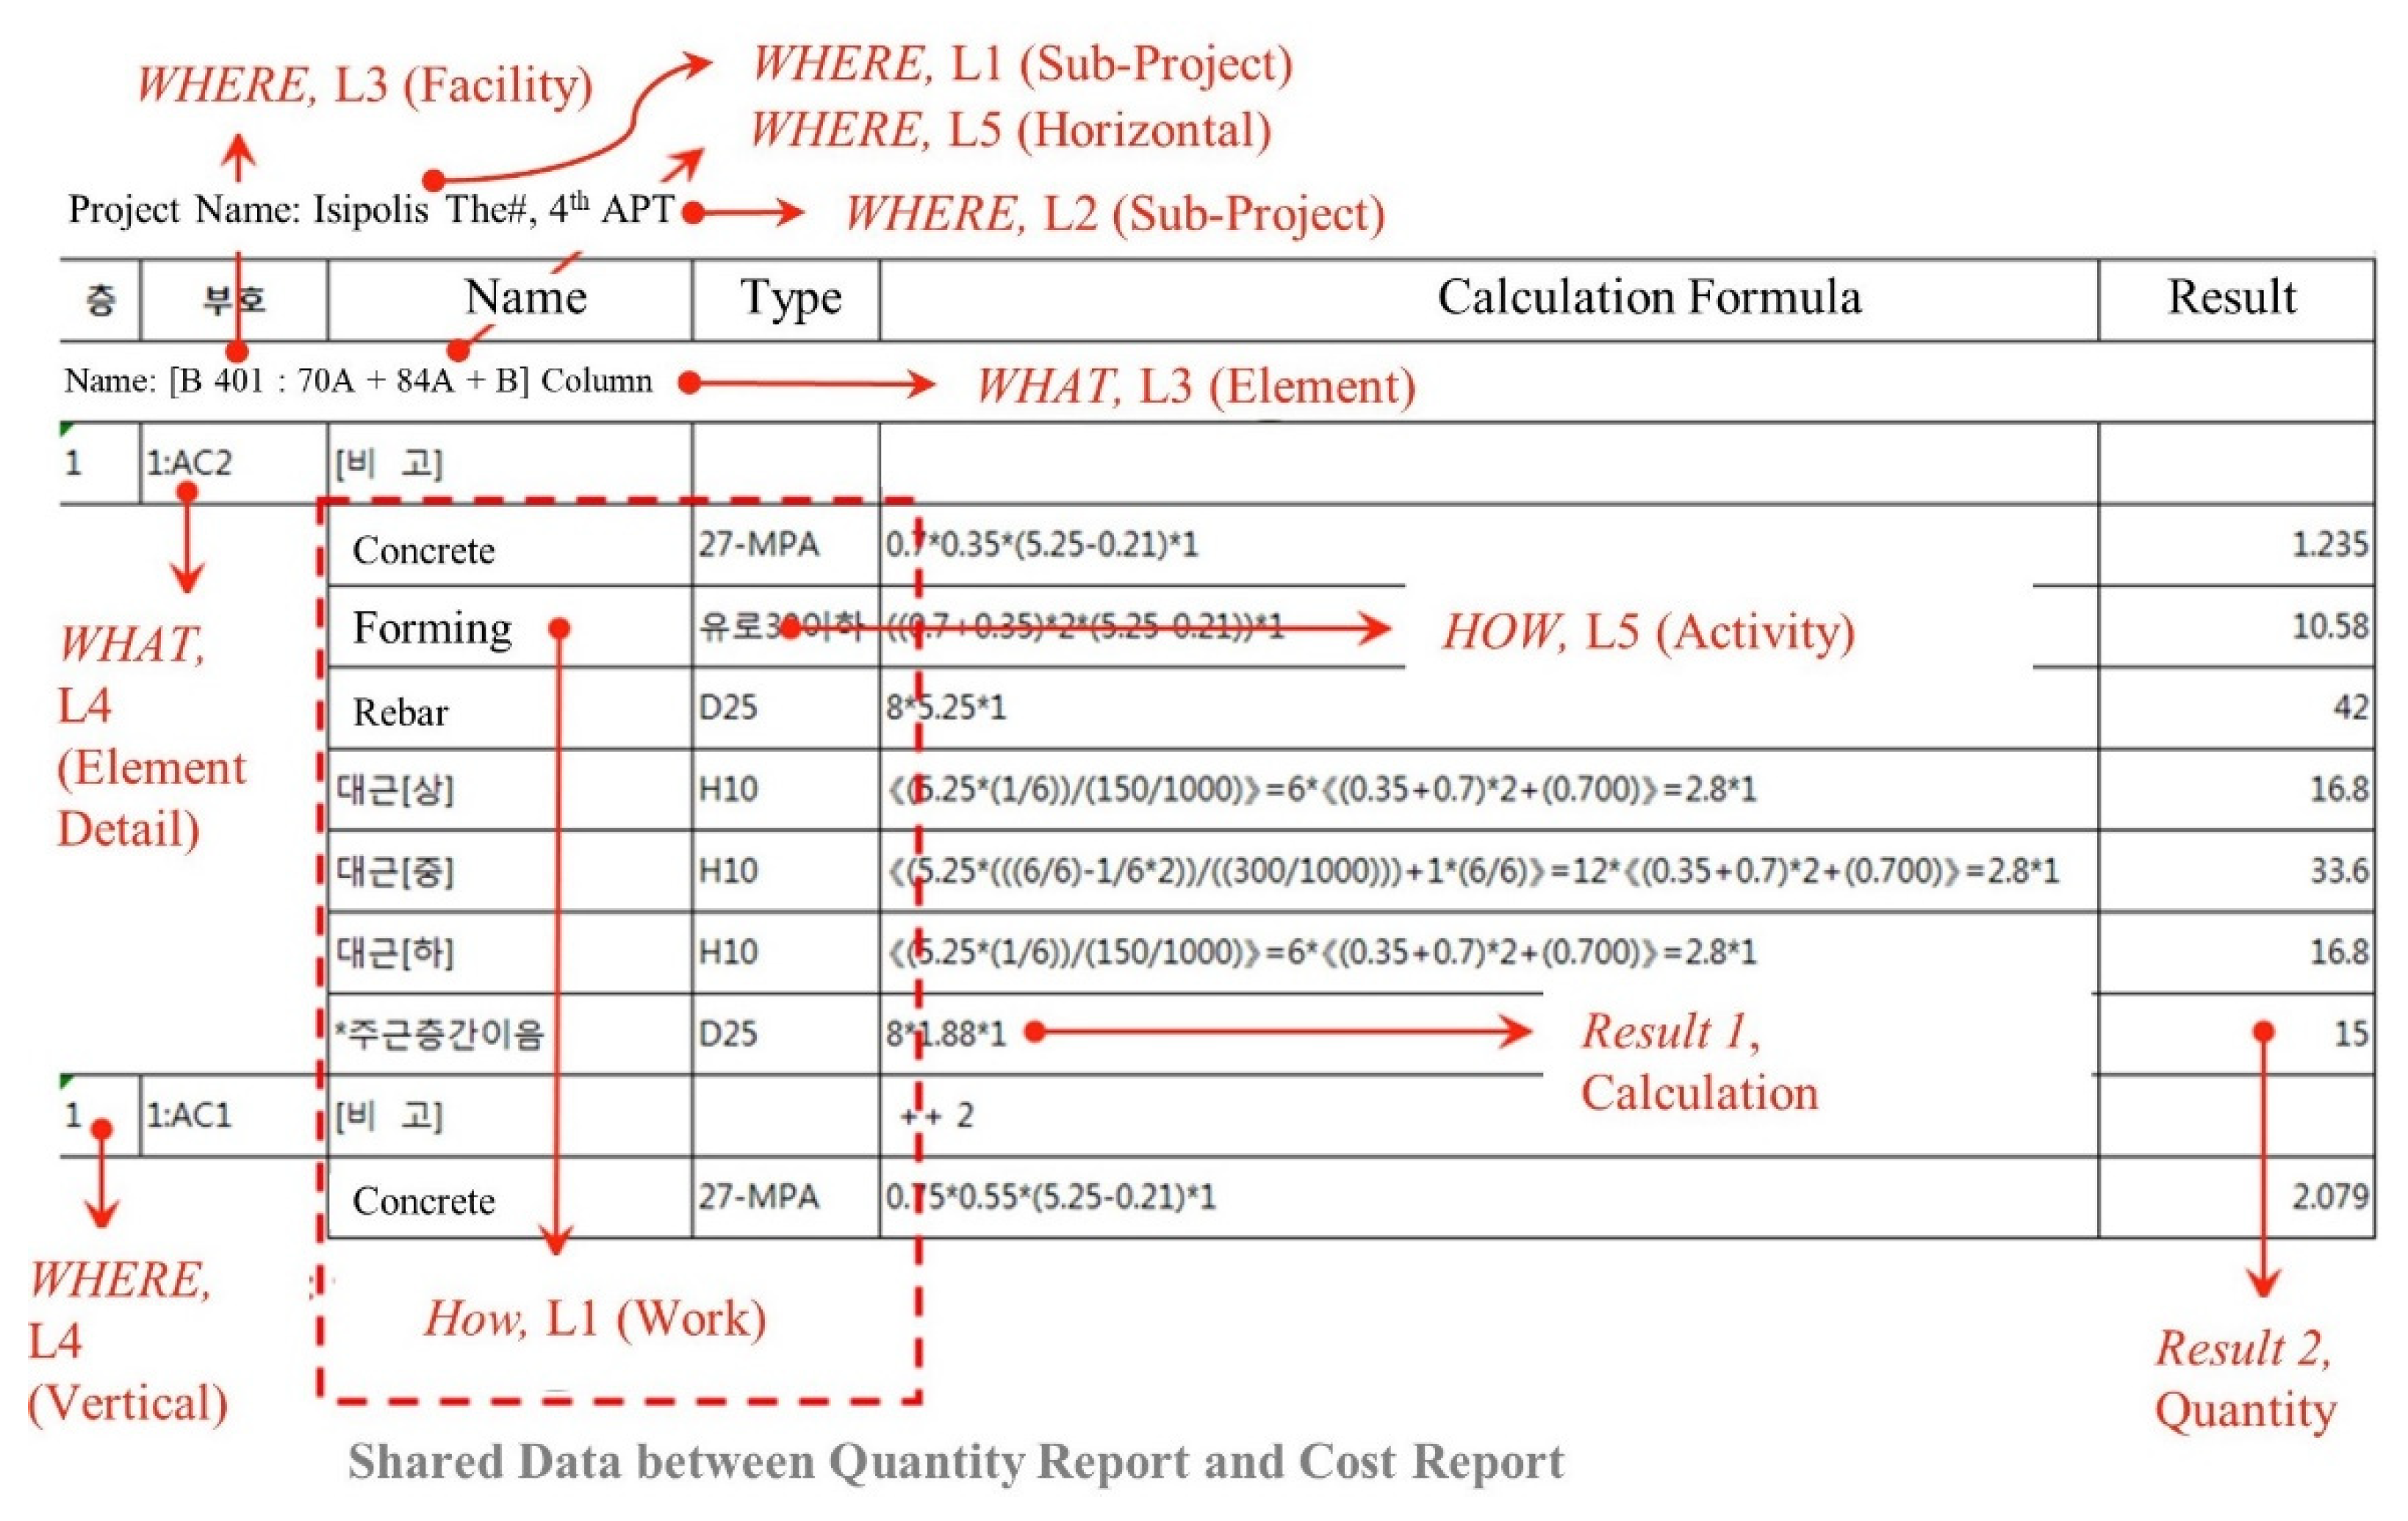
Module 1 extracted the data associated with six dimensions and 31 levels from all provided documents. The 20,315 pages of quantity take-offs, 28 pages of cost report, overall and monthly schedule report, and project organization chart were used to develop the integrated cost-schedule big data. For instance, data associated with the WHERE, WHAT, HOW dimensions at different LODs were extracted from quantity-takeoffs, together with quantity data (see Figure 7).
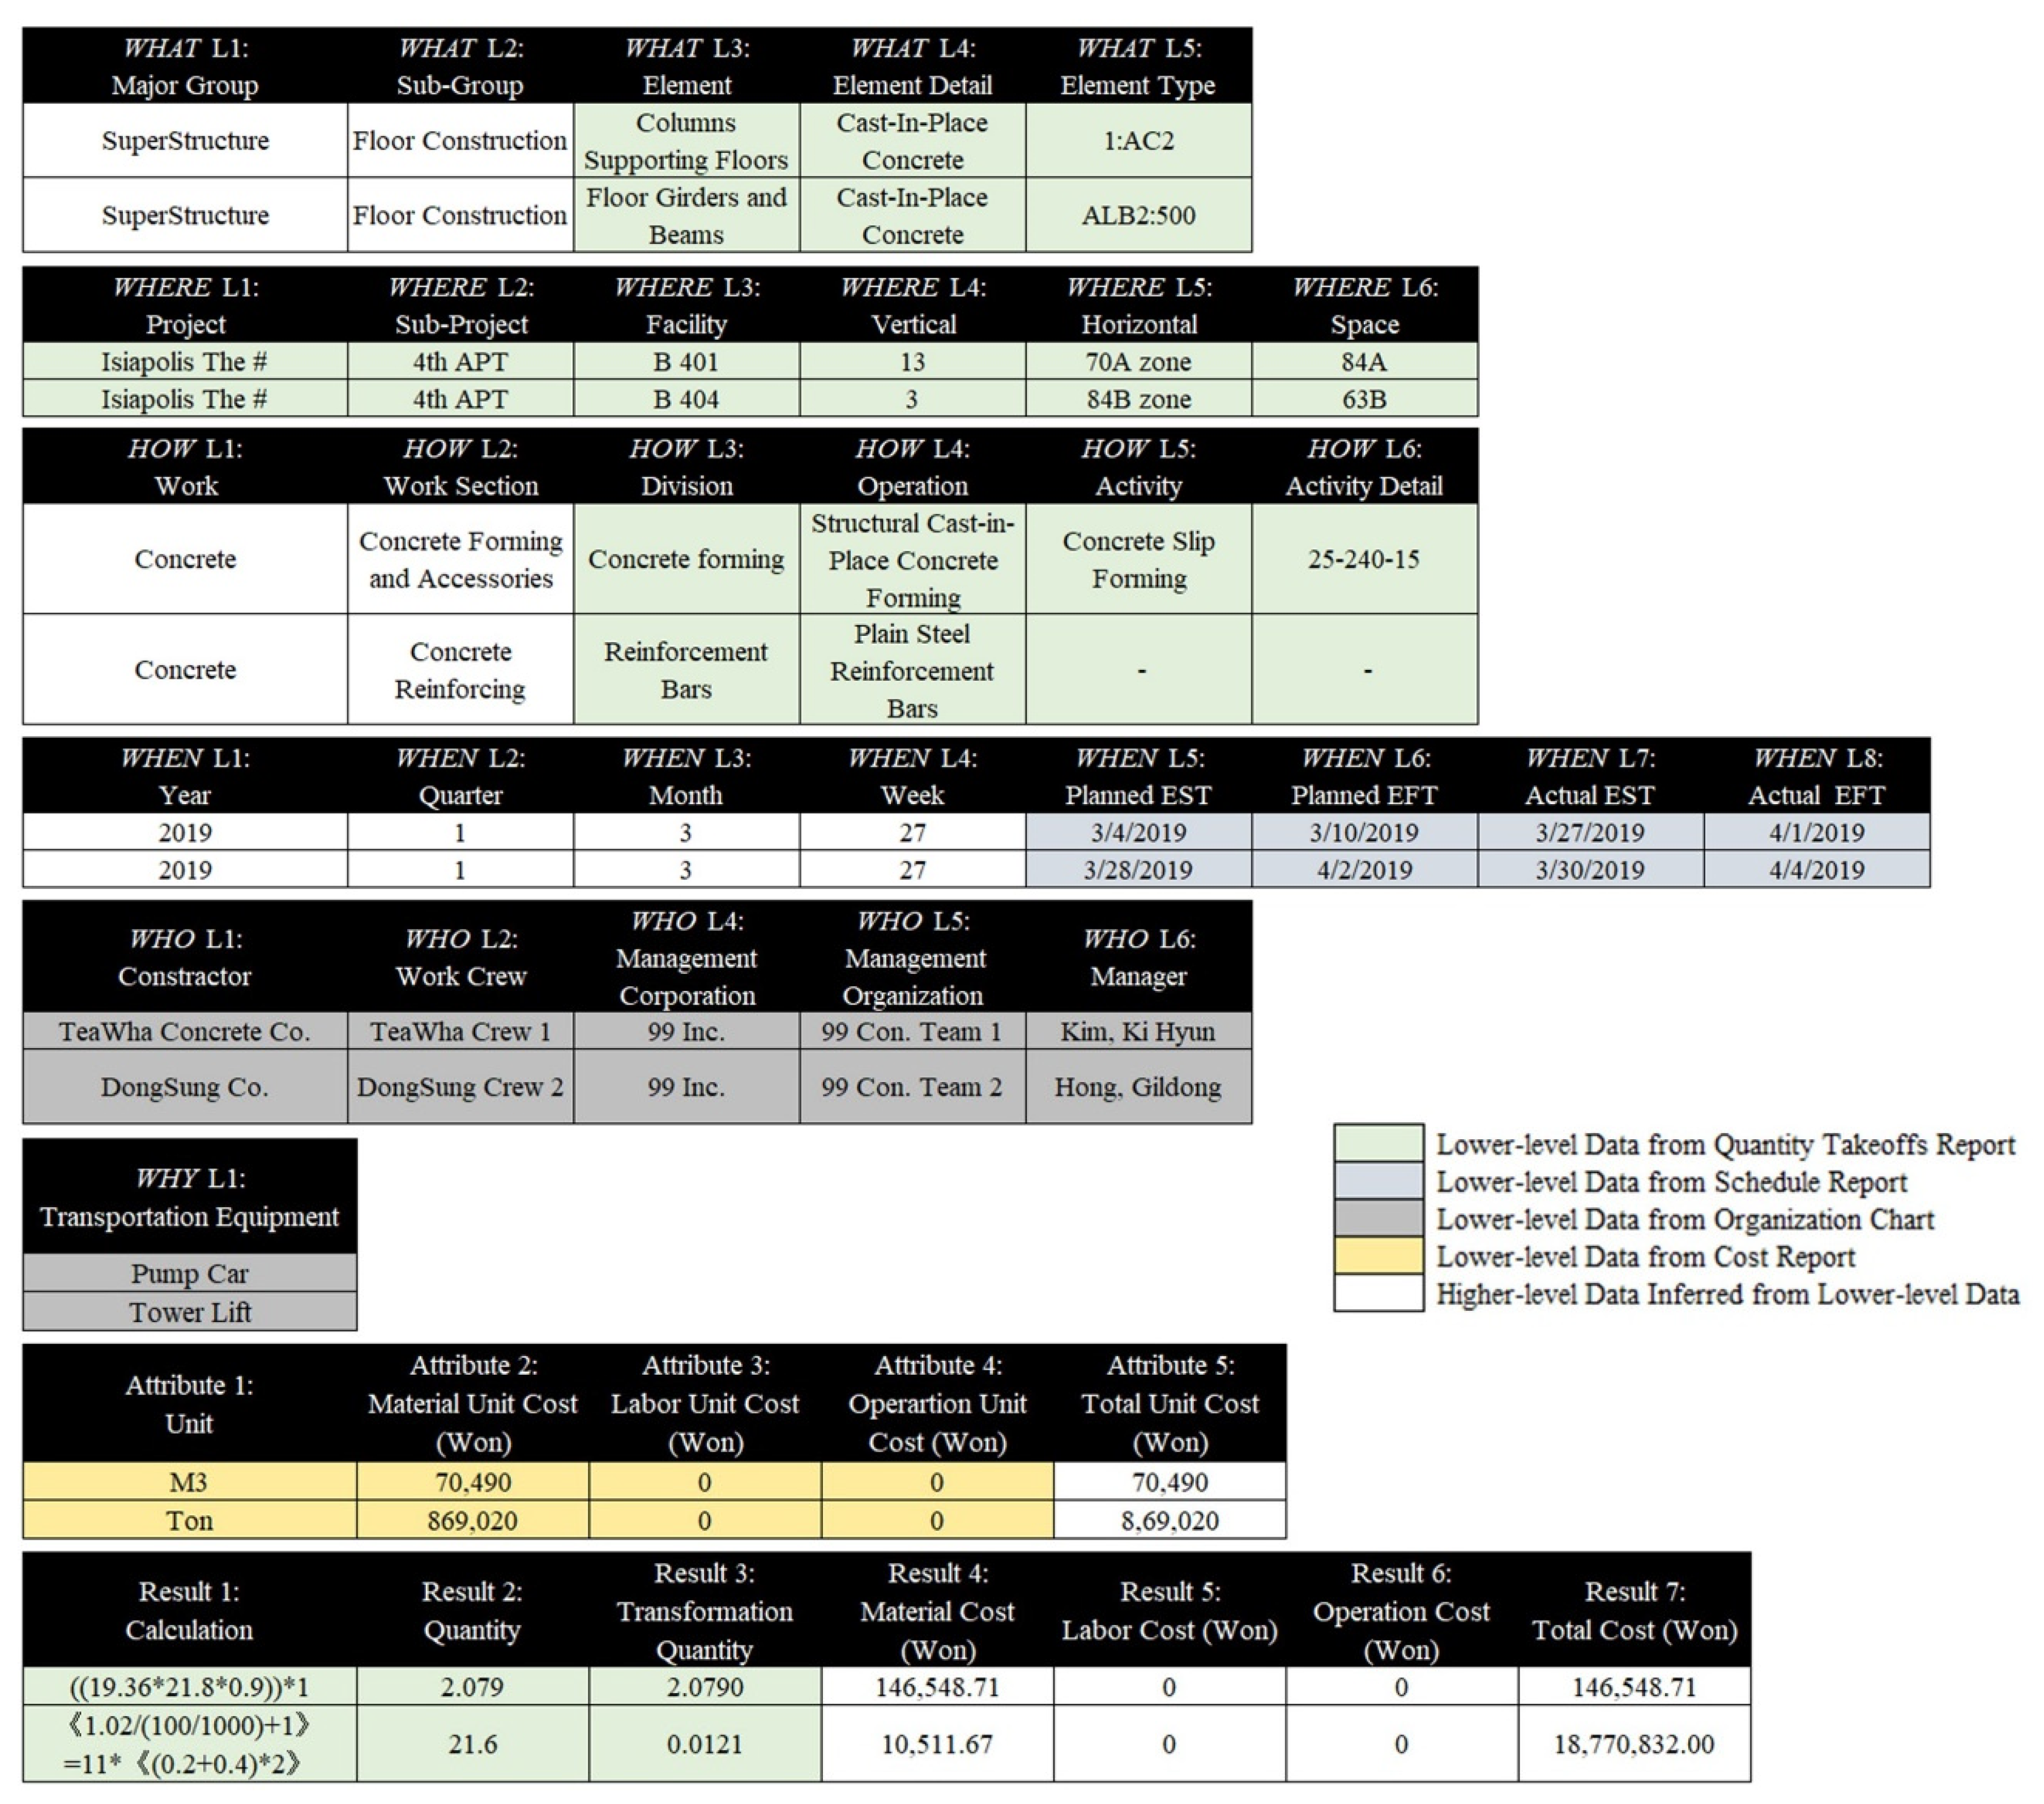
The collected data are mapped into items in MasterFormat, UniFormat, and project management standard and integrated into the 5W1H data schema using shared data in different documents by Module 2. As represented in Figure 7, the HOW, L1 (Work) is addressed in quantity-takeoffs as well as cost estimate reports. Module 2 used this data as a medium to link six types of data from quantity-takeoffs and ten types of data from cost reports. The part of transformed data, which are derived from four data sources (quantity-takeoff, schedule report, cost report, and organization chart) within the data schema, is represented as Figure 8.
Module 3 automatically infers higher-level data of each dimension from the lowest-level data. As represented in Figure 8, the lower-level data is directly achieved from the data sources, while the rest of the higher-level data in the 5W1H data structure are derived from the lower-level. For WHAT and HOW dimensions, the developed rules are in line with UniFormat and MasterFormat, respectively. The rules (1) import the codes of lowest-level data identified Module 2, (2) use them as metadata to retrieve code for upper-level, and (3) map corresponding data into its upper-level data in the 5W1H data schema. Likewise, the rules in line with construction project management standards derive the data for higher levels in other dimensions.
The database comprising a total of 11,031,220 cells (43 columns and 256,540 rows) was established by Module 4. It contains all data transformed and inferred data from Module 2 and 3. The database covers data at 31 different levels in the six dimensions and associated five core unit data (i.e., unit, unit cost); these two types of data are called independent variables. The database also involves cost and schedule estimation data (dependent variables) using the independent variables. The composition of the implemented database is summarized in Table 2. The variables and attributes are accumulated in each row item.
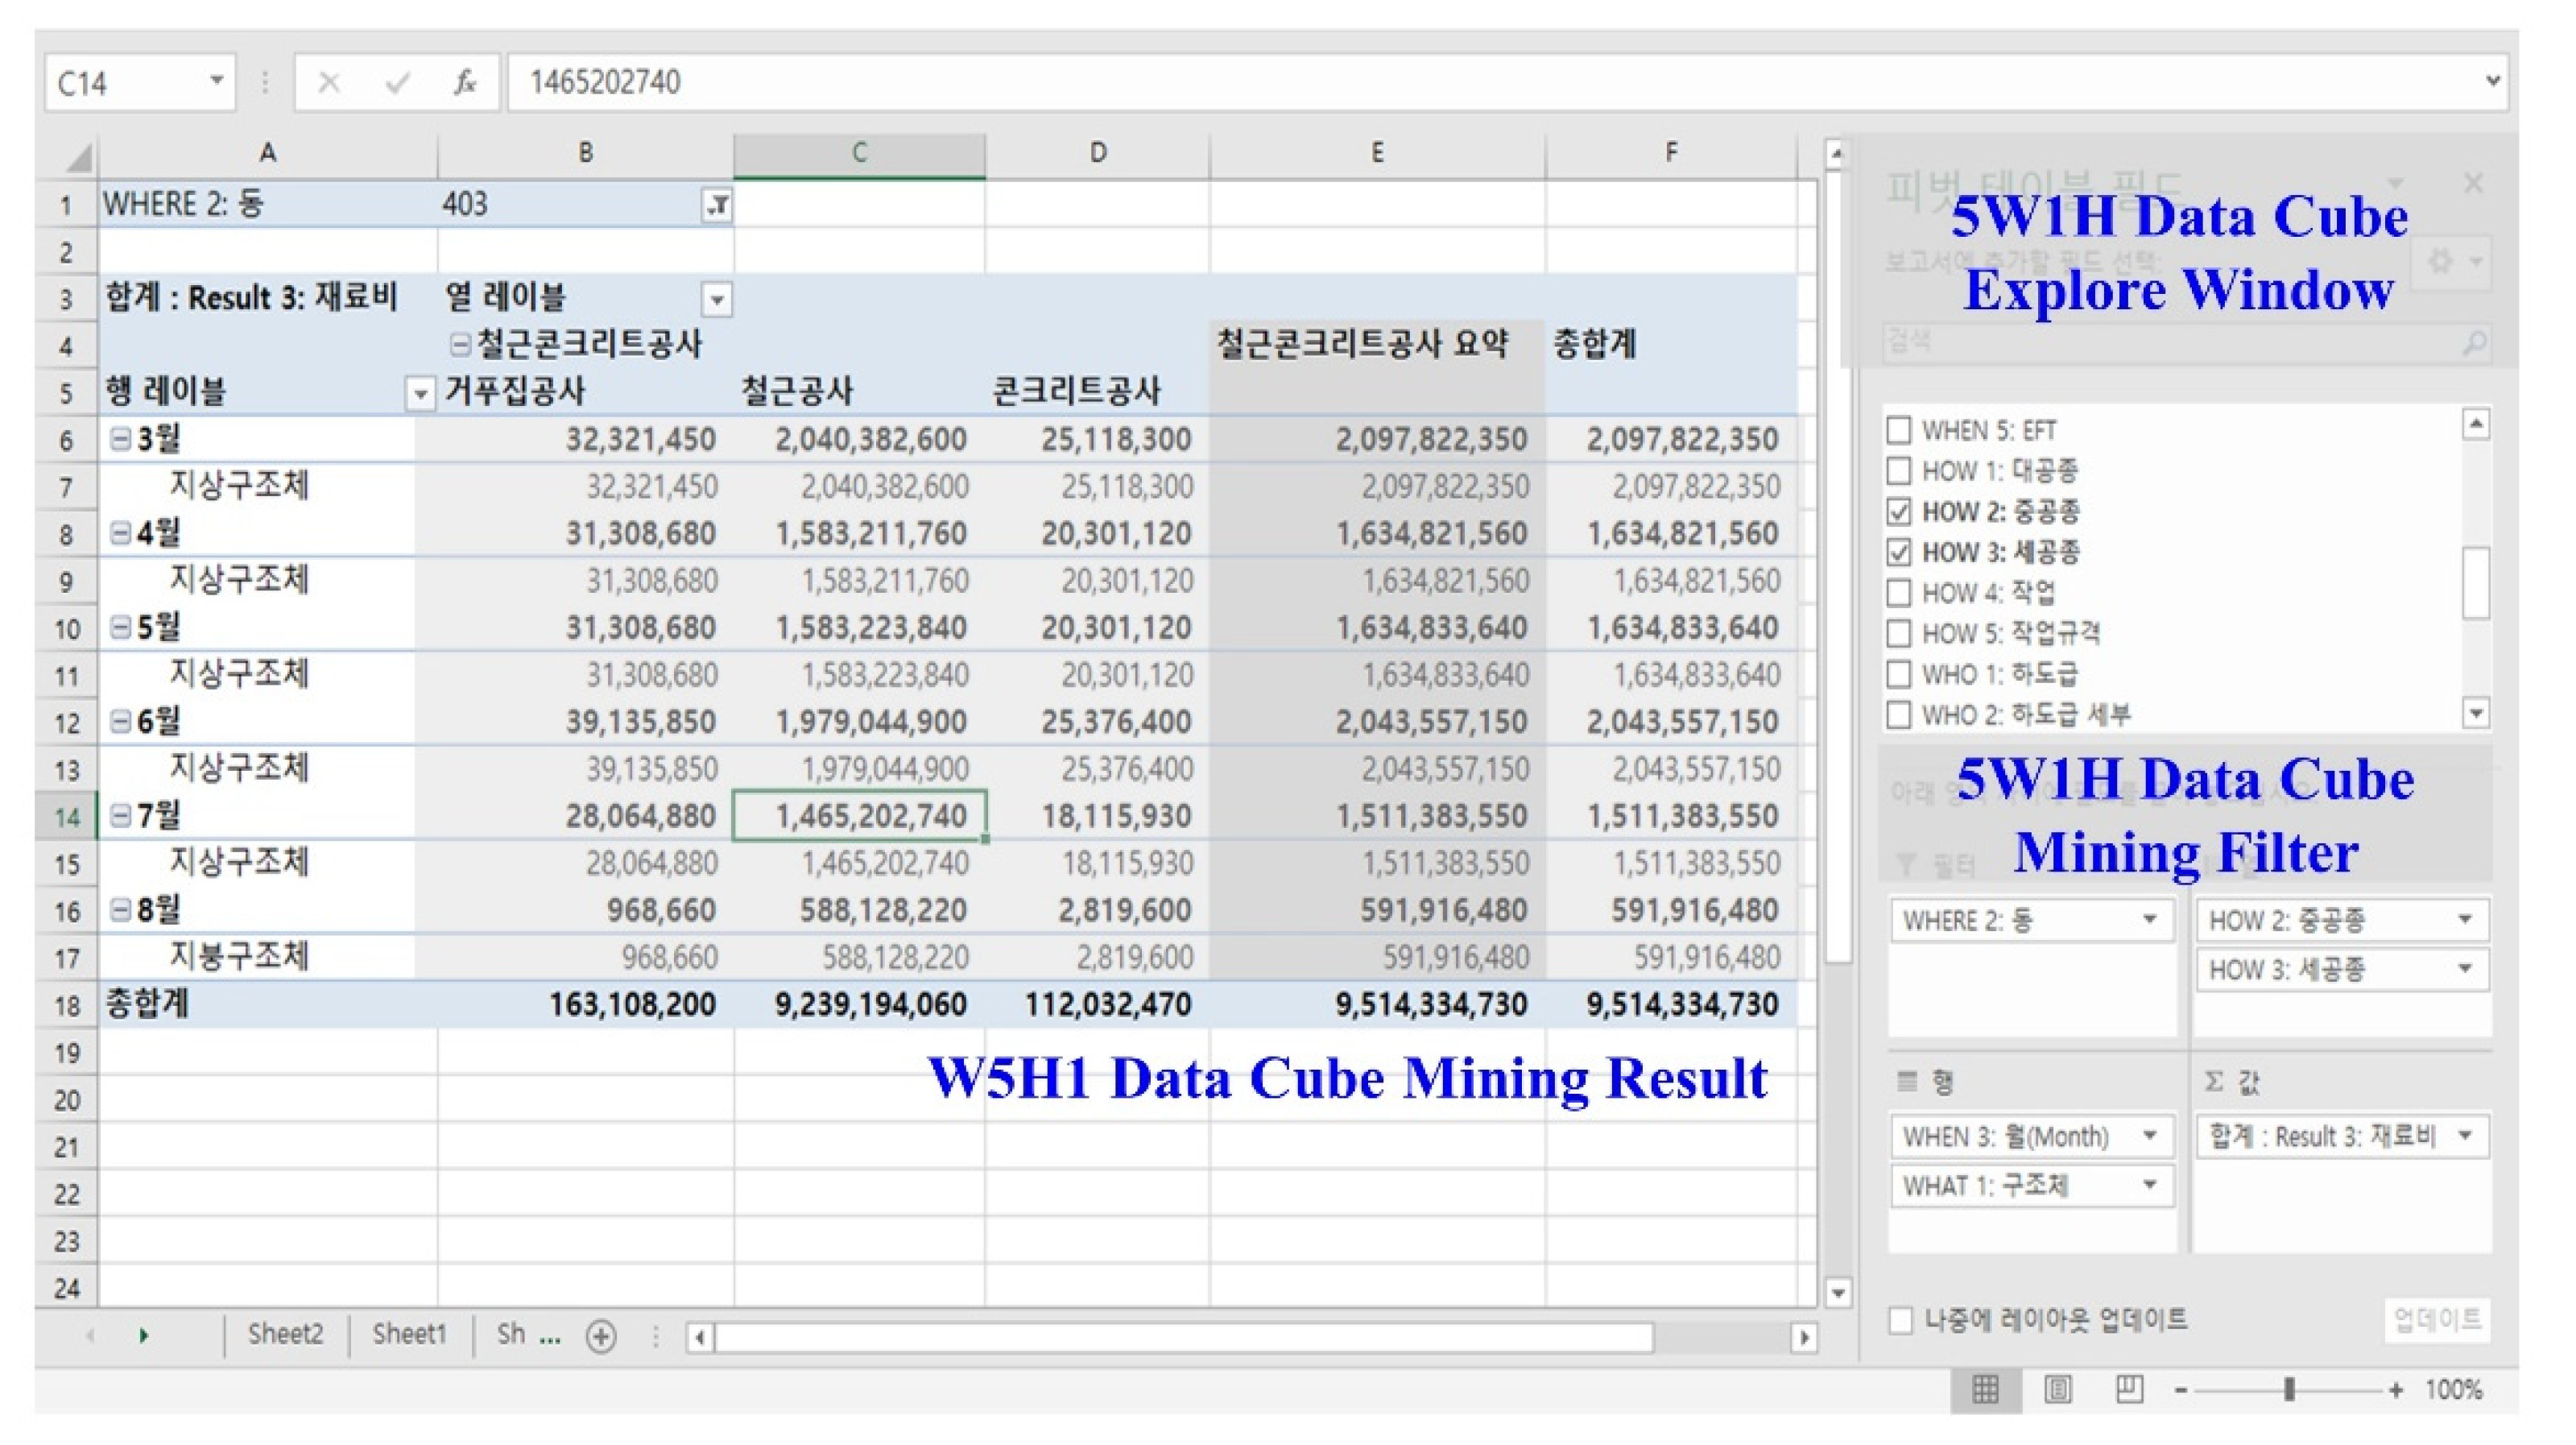
Since this case study used Excel as a database, algorithms for data mining, analysis, and visualization (Module 5–7) were also developed in the Excel environment. Pivot Table is utilized to develop Module 5, as an OLAP tool offering functions for data mining and query interactively from multiple perspectives and LODs (see Figure 9). It was also used as a data analysis platform to analyze cost and schedule data (Module 6) and report it (Module 7). The rules for checking project status concerning cost, schedule, productivity, quantity, labor, periodic payment, and material of construction projects were defined within the Excel environment. Users also can analyze the data for their purposes by querying the multiple dimension and levels.
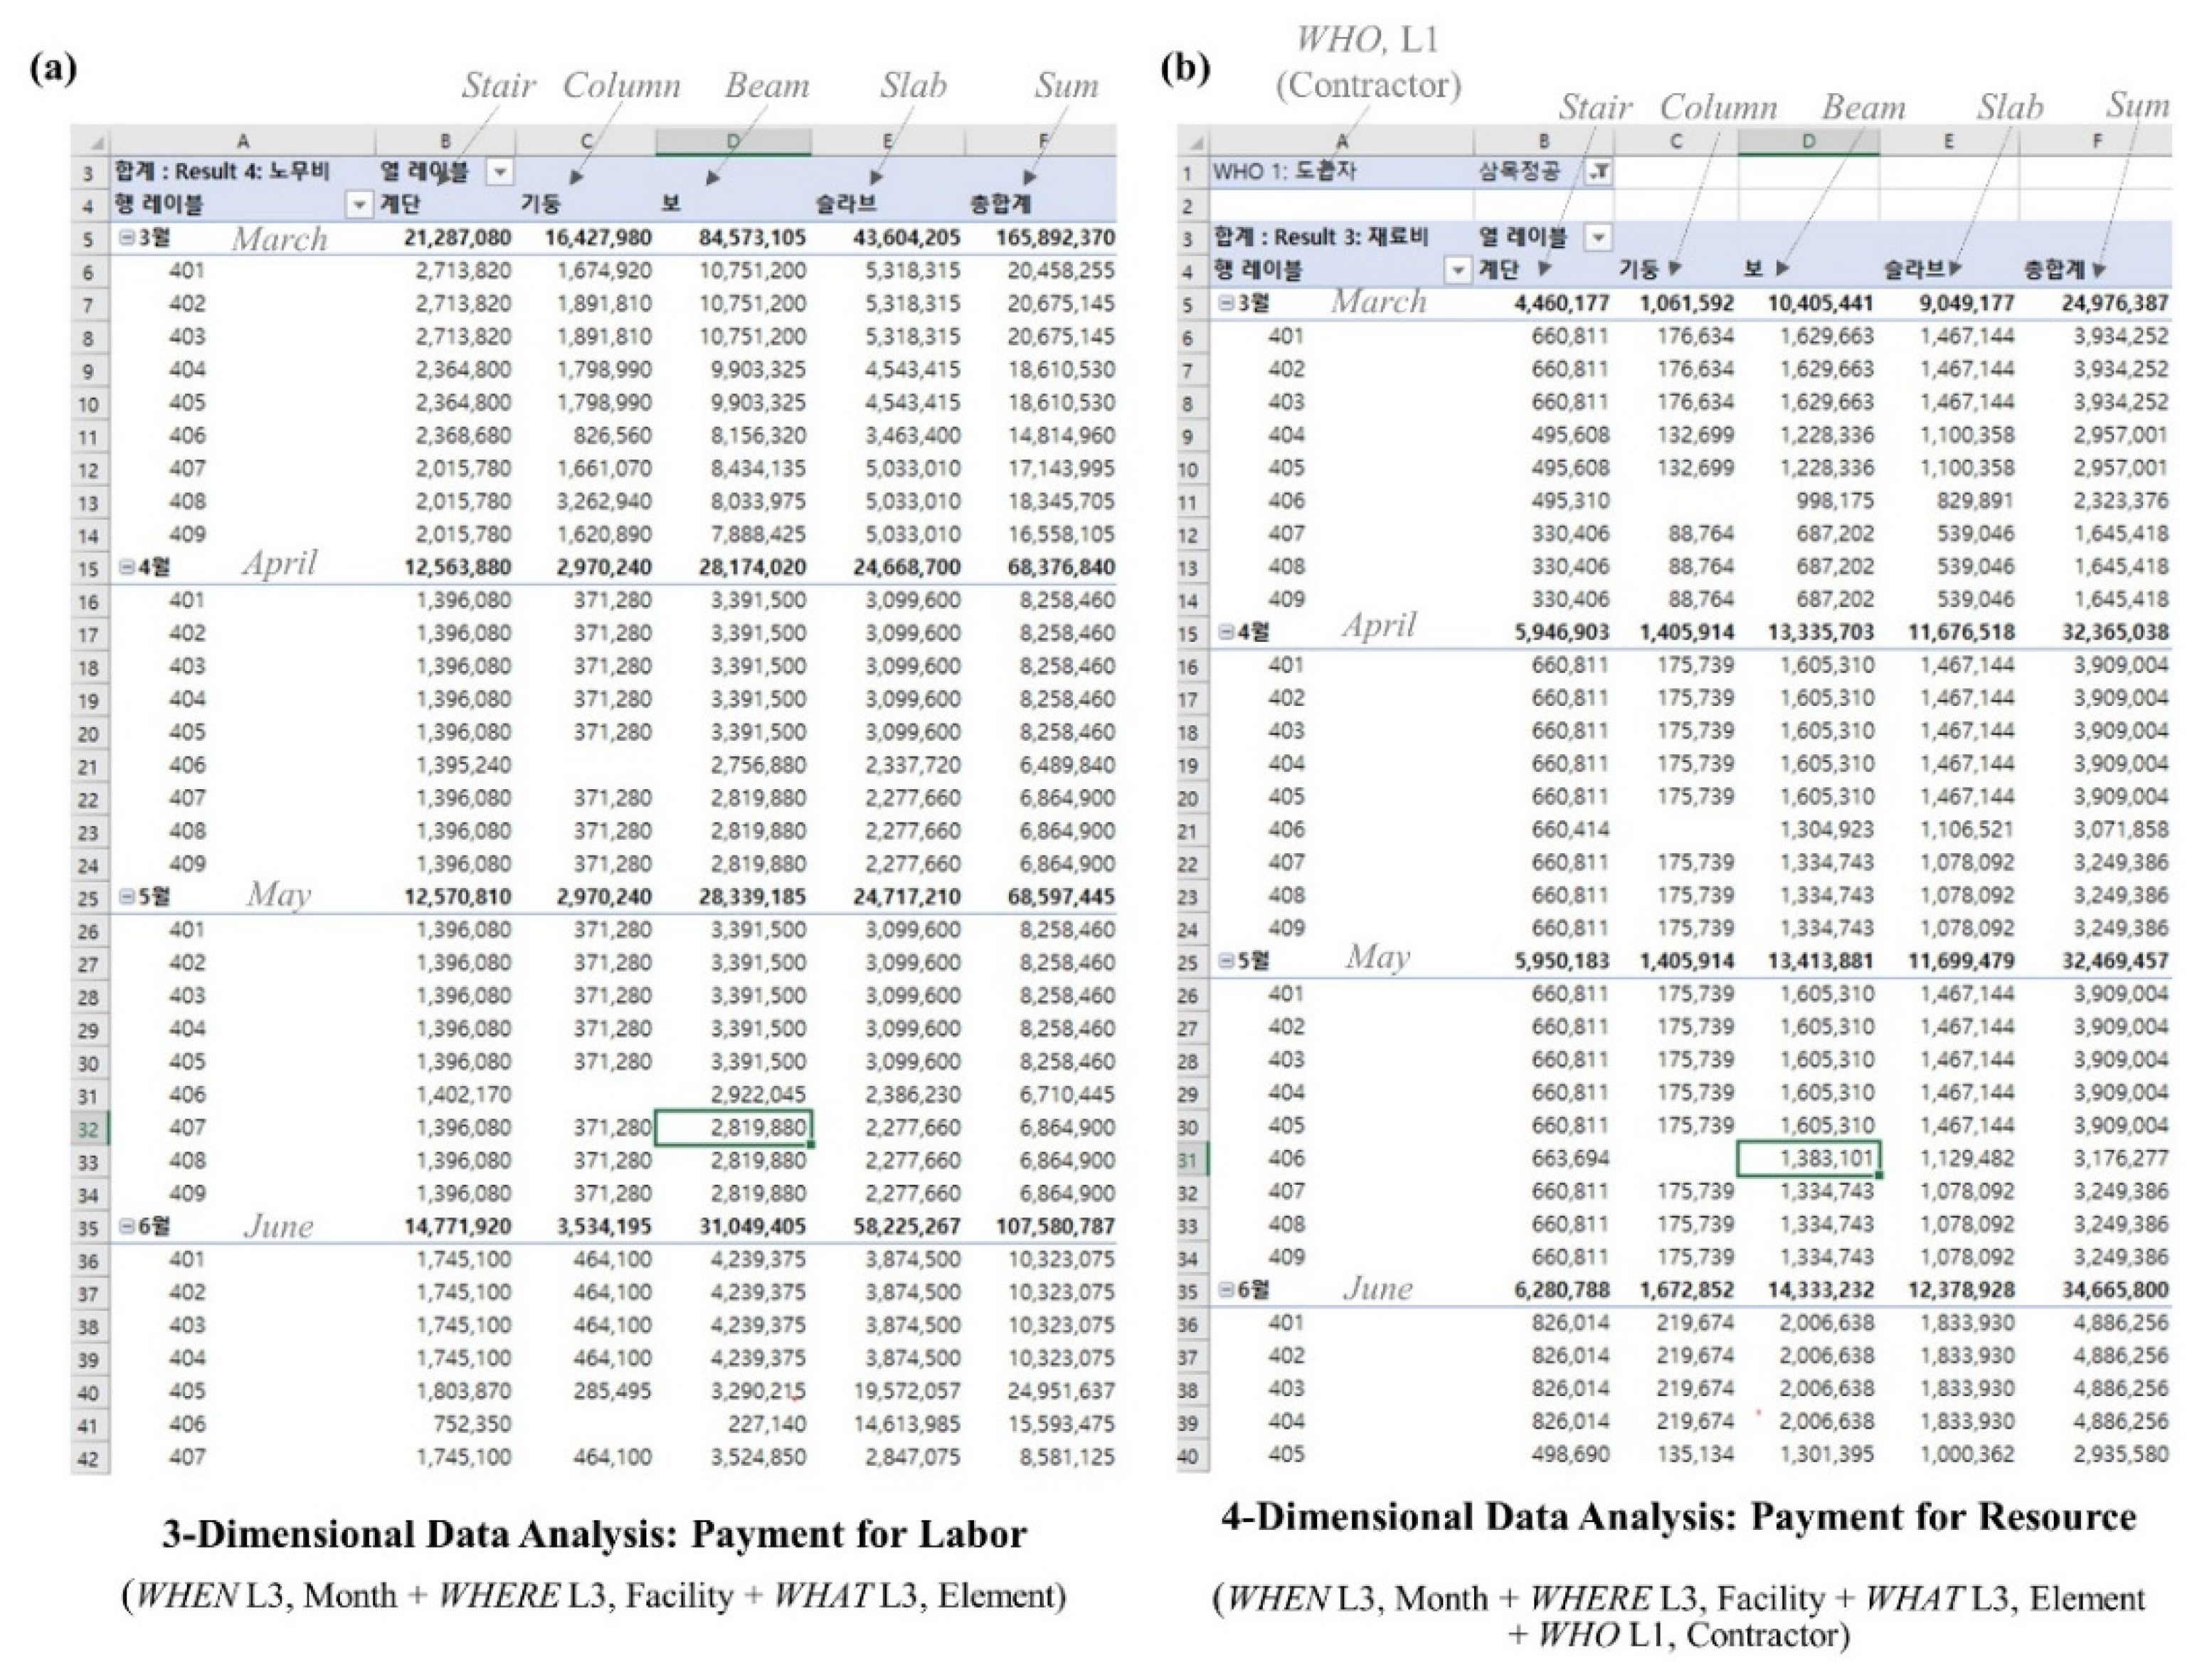
The implemented algorithm generated various types of reports focusing on integrated dimensions and levels accurately. Figure 10 represents two reports created from the algorithm—periodic payment for labor (a) and resource (b). The labor payment for concrete work on superstructures in each building for a fixed period was extracted accurately. The result is derived by using three dimensions: WHEN L3 (Month), WHERE L3 (Facility), and WHAT L3 (Element). For resource payment, a combination of WHEN L3 (Month), WHERE L3 (Facility), WHAT L3 (Element), and WHO L1 (Contractor) correctly created a total payment to contractors for concrete work on superstructures of each building from March to June. The reports in a similar context but different focuses were quickly produced by controlling a set of variables based on fully integrated cost and schedule data.
5.2. Verification and Discussion
The validity of the cost-schedule data integration algorithm based on big data technology is evaluated according to the three requirements discussed in Section 3.3: data integrity and efficiency, efficiency in establishing and transforming data, and practicality. First, data in the established system has its basis on the lowest-level of quantity data; it results in a high degree of data integrity in cost-schedule data integration. Furthermore, all lowest-level quantity data in the 5W1H database have 43 types of variables and attributes and keep relationships with multiple upper-level data via metadata. This data structure created schedule reports at any level of detail by flexibly combining the related information units at different levels on multiple dimensions. For instance, one schedule item in a monthly schedule report, “Structure concrete work on the 13-floor of Building 401 (early start time: 4 March, early finish time: 10 March)”, was well subdivided into a weekly schedule by the proposed system. The system automatically generated a corresponding schedule at the week level, “Concrete Formwork 70A zone on the 13-floor of Building 401 (early start time: 4 March, early finish time: 6 March)”. It is an outcome of combining the query results from search conditions, WHERE L5 (70A zone) and the HOW L4 (Concrete Forming). Although processing time varies from activity number, the system showed five man·min as the average response to time to data synchronization for 100 activities.
In this case study, the demonstration of big data consisting of 11,031,220 cells took less than 20 man·min. It is a representative processing time since data building and transformation time differs depending on data engineers’ proficiency. However, it can be said that the proposed algorithm with developed modules significantly improves efficiency in integrating cost-schedule data, considering the fact that this task takes at least ten man·h with existing systems. In addition, updating changes in data caused by project changes (i.e., design, quantity, construction methods) requires less than one man·mins by searching metadata.
The developed big data system provides Microsoft Excel as its main interface. Users outside of data engineering can retrieve and extract required data from the big data by using the Pivot table in Excel; it allows more than 50,000 types of data extraction with simple mouse drag-and-drop. In the case of big projects, Hadoop or NoSQL can be used instead of Excel to incorporate more amount of data supported by Excel (maximum number of cells: 17,179,870). From the interview with project managers, the high practicality of the proposed system has been identified. After the 10-min instruction, new users are enabled to use the system and show no-burden in adopting this new system to their projects.
The overall algorithm, including data mining, parsing, building, extracting, and analyzing, can be applied to various projects with any scale, complexity, and function. Particularly, it can be used in any type of building projects regardless of its functions as those projects share similar information classification systems (such as Public, Office, gymnasium, Theater, Residential). The used standard systems, such as Masterformat and Uniformat, can be flexibly addressed the project specifications, including building elements, operations, and organizations.
However, it shows several limitations that need to be addressed by future research. First, the proposed algorithm can be hard to be applied to infrastructure construction projects (i.e., road, bridge, dam). It is because the employed classification systems might not cover the required information for controlling the cost and schedule of these projects. To respond to it, the future study will improve the flexibility of the algorithm that allows its application to different scales and types of projects. The new methodology for using different classification systems according to project types and extracting and inferring data in line with the chosen system will be developed. Second, the application of the proposed algorithm can be limited to the project using the unusual naming conventions. Although the algorithm flexibly extracts data from different structured documents by using the metadata in establishing a database, the mechanism for collecting required data cannot be customized by users according to the naming convention in each document. The future research will develop an additional module for editing data collection mechanism to enhance its applicability in different data structure environments.
6. Conclusions
This research suggested a novel method to integrate cost and schedule data, a long-lasting challenge in the construction industry, by adopting big data technology. The proposed cost-schedule data integration algorithm allows securing consistency and integrity in complicated, various, dynamic, and vast data of construction management. In addition, its flexible data structure provides the ease of data extraction and analysis and high efficiency in building and transforming data that reduce significant time and effort required for information managing in construction projects. It is expected that the proposed algorithm will contribute to the leap of the construction industry toward a data-driven industry. This research facilitates the accumulation of construction management knowledge, informed decision-making, and the creation of a higher value in the management.
For future research, a new methodology for using different classification systems and extracting and inferring data according to the project types will be investigated to ensure its flexible usability. Other future work could include developing an additional module for editing the data collection mechanism to improve its applicability in different data structure environments, such as naming conventions and document structures. The proposed algorithm only uses the data of an ongoing construction project. It is supposed to be utilized in several construction firms in South Korea; more than 1,000 databases of individual projects are expected to be collected. Future research will focus on improving the integrated cost-schedule management by employing insights generated by applying statistical algorithms (i.e., machine learning, deep learning) to the accumulated databases.
Author Contributions
Conceptualization, D.C. and M.L.; algorithm development, D.C. and J.S.; software, M.L.; validation, M.L. and J.S.; formal analysis, D.C.; investigation, M.L.; resources, D.C. and J.S.; data curation, M.L.; writing—original draft preparation, J.S.; writing—review and editing, J.S.; funding acquisition, D.C. All authors have read and agreed to the published version of the manuscript.
Funding
This work is supported by the Korea Agency for Infrastructure Technology Advancement (KAIA) grant funded by the Ministry of Land, Infrastructure and Transport (Grant 20CTAP-C152263-02).
Conflicts of Interest
The authors declare no conflict of interest.
References
- Sivarajah, U.; Kamal, M.M.; Irani, Z.; Weerakkody, V. Critical analysis of Big Data challenges and analytical methods. J. Bus. Res. 2017, 70, 263–286. [Google Scholar] [CrossRef] [Green Version]
- Bilal, M.; Oyedele, L.O.; Qadir, J.; Munir, K.; Ajayi, S.O.; Akinade, O.O.; Owolabi, H.A.; Alaka, H.A.; Pasha, M. Big Data in the construction industry: A review of present status, opportunities, and future trends. Adv. Eng. Inform. 2016, 30, 500–521. [Google Scholar] [CrossRef]
- Rasdorf, W.J.; Abudayyeh, O.Y. Cost-and schedule-control integration: Issues and needs. J. Constr. Eng. Manag. 1991, 117, 486–502. [Google Scholar] [CrossRef] [Green Version]
- Cho, D.; Russell, J.S.; Choi, J. Database framework for cost, schedule, and performance data integration. J. Comput. Civ. Eng. 2013, 27, 719–731. [Google Scholar] [CrossRef]
- Jung, Y.; Gibson, G.E. Planning for computer integrated construction. J. Comput. Civ. Eng. 1999, 13, 217–225. [Google Scholar] [CrossRef]
- Oinas, M. The utilization of product model data in production and procurement planning. In Proceedings of the Life-Cycle of Construction IT Innovations—Technology Transfer from Research to Practice, Stockholm, Sweden, 3–5 June 1998; pp. 1–8. [Google Scholar]
- Davis, D. LEAN, Green and Seen (The Issues of Societal Needs, Business Drivers and Converging Technologies Are Making BIM An Inevitable Method of Delivery and Management of the Built Environment). J. Build. Inf. Model. 2007, Fall, 16–18. [Google Scholar]
- Perera, A.; Imriyas, K. An integrated construction project cost information system using MS AccessTM and MS ProjectTM. Constr. Manag. Econ. 2004, 22, 203–211. [Google Scholar] [CrossRef]
- Teicholz, P.M. Current needs for cost control systems. In Project Controls: Needs and Solutions; ASCE: New York, NY, USA, 1987; pp. 47–57. [Google Scholar]
- Hendrickson, C.; Hendrickson, C.T.; Au, T. Project Management for Construction: Fundamental Concepts for Owners, Engineers, Architects, and Builders; Prentice-Hall: Upper Saddle River, NJ, USA, 1989. [Google Scholar]
- Kim, J.J. An Object-Oriented Database Management System Approach to Improve Construction Project Planning and Control. Ph.D. Thesis, University of Illinois, Urbana, IL, USA, 1989. [Google Scholar]
- Fleming, Q.W.; Koppelman, J.M. Earned Value Project Management. 3. Painos; Project Management Institute: Newtown Square, PA, USA, 2005. [Google Scholar]
- Kang, L.S.; Paulson, B.C. Information management to integrate cost and schedule for civil engineering projects. J. Constr. Eng. Manag. 1998, 124, 381–389. [Google Scholar] [CrossRef]
- Jung, Y.; Woo, S. Flexible work breakdown structure for integrated cost and schedule control. J. Constr. Eng. Manag. 2004, 130, 616–625. [Google Scholar] [CrossRef]
- Ma, Y. Research on Technology Innovation Management in Big Data Environment. IOP Conf. Ser. Earth Environ. Sci. 2018, 113, 12141. [Google Scholar] [CrossRef]
- Holst, A. Big Data Market Size Revenue Forecast Worldwide from 2011 to 2027. 2018. Available online: https://0-www-statista-com.brum.beds.ac.uk/statistics/254266/global-big-data-market-forecast/ (accessed on 20 October 2019).
- Manyika, J.; Chui, M. Big Data: The Next Frontier for Innovation, Competition, and Productivity; McKinsey Global Institute, 2011; Available online: https://www.mckinsey.com/~/media/McKinsey/Business%20Functions/McKinsey%20Digital/Our%20Insights/Big%20data%20The%20next%20frontier%20for%20innovation/MGI_big_data_full_report.pdf (accessed on 25 October 2020).
- Ma, G.; Wu, M. A Big Data and FMEA-based construction quality risk evaluation model considering project schedule for Shanghai apartment projects. Int. J. Qual. Reliab. Manag. 2019. [Google Scholar] [CrossRef]
- Bilal, M.; Oyedele, L.O.; Kusimo, H.O.; Owolabi, H.A.; Akanbi, L.A.; Ajayi, A.O.; Akinade, O.O.; Davila Delgado, J.M. Investigating profitability performance of construction projects using big data: A project analytics approach. J. Build. Eng. 2019, 26, 100850. [Google Scholar] [CrossRef]
- Marzouk, M.; Amin, A. Predicting construction materials prices using fuzzy logic and neural networks. J. Constr. Eng. Manag. 2013, 139, 1190–1198. [Google Scholar] [CrossRef]
- Wang, D.; Fan, J.; Fu, H.; Zhang, B. Research on optimization of big data construction engineering quality management based on RNN-LSTM. Complexity 2018, 2018, 9691868. [Google Scholar] [CrossRef]
- Guo, S.; Luo, H.; Yong, L. A big data-based workers behavior observation in China metro construction. Procedia Eng. 2015, 123, 190–197. [Google Scholar] [CrossRef] [Green Version]
- Carr, R.I. Cost, schedule, and time variances and integration. J. Constr. Eng. Manag. 1993, 119, 245–265. [Google Scholar] [CrossRef] [Green Version]
- Kitchin, R.; McArdle, G. What makes Big Data, Big Data? Exploring the ontological characteristics of 26 datasets. Big Data Soc. 2016, 3. [Google Scholar] [CrossRef]
- Aouad, G.; Kagioglou, M.; Cooper, R.; Hinks, J.; Sexton, M. Technology management of IT in construction: A driver or an enabler. Logist. Inf. Manag. 1999, 12, 130–137. [Google Scholar] [CrossRef]
- Kim, H.; Kim, W.; Yi, Y. Awareness on Big Data of Construction Firms and Future Directions; Construction & Economy Research Institute of Korea: Seoul, Korea, 2014. [Google Scholar]
- Sørensen, A.Ø.; Olsson, N.; Landmark, A.D. Big Data in Construction Management Research. In Proceedings of the CIB World Building Congress 2016, Tampere, Finland, 30 May–3 June 2016; pp. 405–416. [Google Scholar]
- Turk, Ž.; Klinc, R. A social–product–process framework for construction. Build. Res. Inf. 2020, 48, 747–762. [Google Scholar] [CrossRef]
- Cho, D. Construction Information Database Framework (CIDF) for Integrated Cost, Schedule, and Performance Control. Ph.D. Thesis, University of Wisconsin, Madison, WI, USA, 2009. [Google Scholar]
- Construction Specifications Institute (CSI) and Construction Specifications Canada (CSC). UniFormat; 2010; Available online: https://www.csiresources.org/standards/uniformat (accessed on 16 October 2020).
- The Construction Specifications Institute and Construction. MasterFormat; 2016; Available online: https://www.csiresources.org/standards/masterformat (accessed on 14 October 2020).
- Paulsson, J.; Paasch, J.M. 3D property research from a legal perspective. Comput. Environ. Urban Syst. 2013, 40, 7–13. [Google Scholar] [CrossRef]
Figure 1.
Current Practice of Data Control in Construction Management.

Figure 2.
Data Framework for Integrated Cost-Schedule Management, (a) the 5W1H Data Schema (adopted from Cho et al. [4]), (b) Data Cube Facet Structure of the 5W1H Data Schema.
Figure 2.
Data Framework for Integrated Cost-Schedule Management, (a) the 5W1H Data Schema (adopted from Cho et al. [4]), (b) Data Cube Facet Structure of the 5W1H Data Schema.

Figure 3.
Big Data Building Steps for Cost and Schedule Data Integration.

Figure 4.
Conceptual Workflow of the Proposed Algorithm for Cost-Schedule Integration.

Figure 5.
Big Data System Architecture for Cost-Schedule Integration Consisting of Seven Modules.

Figure 6.
Interfaces of Module 1, 2, and 3 implemented using Python, (a) Module 1 for Automatic Text Mining, (b) Module 2 for Data Parsing, and (c) Module 3 for Metadata Mapping.
Figure 6.
Interfaces of Module 1, 2, and 3 implemented using Python, (a) Module 1 for Automatic Text Mining, (b) Module 2 for Data Parsing, and (c) Module 3 for Metadata Mapping.

Figure 7.
Data Extracting and Mapping from Quantity-takeoffs into the 5W1H Data Schema.

Figure 8.
Part of Transformed Data into the 5W1H Data Schema using Module 2 for Data Parsing.

Figure 9.
Interface of Data Mining and Analysis Modules using Pivot Table in Excel.

Figure 10.
Periodic Payment Report Generated by the Implemented Algorithm, (a) Payment for Labor, (b) Payment for Resource in the Case Study Project.
Figure 10.
Periodic Payment Report Generated by the Implemented Algorithm, (a) Payment for Labor, (b) Payment for Resource in the Case Study Project.


Table 1.
Information units of Six Dimensions at Levels of Detail (adopted from Cho et al. [4]).
Table 1.
Information units of Six Dimensions at Levels of Detail (adopted from Cho et al. [4]).
| Data Dimension | Level of Detail | |||||
|---|---|---|---|---|---|---|
| Level 1: L1 | Level 2: L2 | Level 3: L3 | Level 4: L4 | Level 5: L5 | Level 6: L6 | |
| WHAT | Major Group A10: Foundations | Sub-Group A1010: Standard Foundation | Element A1010.10: Wall Foundation | Element Detail A1010.10. CF: Continuous Footings | ||
| WHERE | Project XX Hospital Project | Sub-Project Surgical Ward Building | Facility Building A | Vertical V01: Baseline, 2nd Floor | Horizontal H01: B Zone | Space Operating Room |
| HOW | Work 03: Concrete | Work Section 031: Concrete Form & Accessories | Division 0311: Concrete Forming | Operation 031113: Structural Cast-in-Place Concrete Forming | Activity 031113.13: Concrete Slip Forming | |
| WHEN | Year 2019 | Quarter 1st Quarter | Month March | Week 12th Week | Planned EST 17 May | Planned EFT 23 March |
| WHO | Contractor Subcontractor A | Work Crew A01 Formwork Crew 1 | Individual 1 Carpenter Foreman, 4 Carpenters, 1 Laborer | Management Corporation M01: Management Firm A | Management Organization M01.01: Management Team A | Manager M01.01.01: Manager A |
| WHY | Transportation Equipment Tower Crane | |||||
Table 2.
Types of Data in the Implemented Database Based on the 5W1H Schema.
| Independent Variables | Dependent Variables | |
|---|---|---|
| Levels of Dimension | Core Unit Attributes | Result |
| 5 Levels of WHAT Dimension | Attribute 1. Unit | Result 1. Calculation |
| 6 Levels of WHERE Dimension | Attribute 2. Material Unit Cost | Result 2. Quantity |
| 6 Levels of HOW Dimension | Attribute 3. Labor Unit Cost | Result 3. Transformation Quantity |
| 8 Levels of WHEN Dimension | Attribute 4. Operation Unit Cost | Result 4. Material Cost |
| 5 Levels of WHO Dimension | Attribute 5. Total Unit Cost | Result 5. Labor Cost |
| 1 Levels of WHY Dimension | - | Result 6. Operation Cost |
| - | - | Result 7. Total Cost |
Publisher’s Note: MDPI stays neutral with regard to jurisdictional claims in published maps and institutional affiliations. |
© 2020 by the authors. Licensee MDPI, Basel, Switzerland. This article is an open access article distributed under the terms and conditions of the Creative Commons Attribution (CC BY) license (http://creativecommons.org/licenses/by/4.0/).
Share and Cite
MDPI and ACS Style
Cho, D.; Lee, M.; Shin, J. Development of Cost and Schedule Data Integration Algorithm Based on Big Data Technology. Appl. Sci. 2020, 10, 8917. https://0-doi-org.brum.beds.ac.uk/10.3390/app10248917
AMA Style
Cho D, Lee M, Shin J. Development of Cost and Schedule Data Integration Algorithm Based on Big Data Technology. Applied Sciences. 2020; 10(24):8917. https://0-doi-org.brum.beds.ac.uk/10.3390/app10248917
Chicago/Turabian StyleCho, Daegu, Myungdo Lee, and Jihye Shin. 2020. "Development of Cost and Schedule Data Integration Algorithm Based on Big Data Technology" Applied Sciences 10, no. 24: 8917. https://0-doi-org.brum.beds.ac.uk/10.3390/app10248917
Note that from the first issue of 2016, this journal uses article numbers instead of page numbers. See further details here.