Influence of Carbon Fiber Incorporation on Electrical Conductivity of Cement Composites

1
Future and Fusion Lab of Architectural, Civil and Environmental Engineering, Korea University, 145 Anamro, Seongbuk-gu, Seoul 02841, Korea
2
Advanced Railroad Civil Engineering Division, Korea Railroad Research Institute, 176 Cheoldobang Mulgwan-ro, Uiwang-si 16105, Gyeonggi-do, Korea
3
School of Civil, Environmental and Architectural Engineering, Korea University, 145 Anam-ro, Seongbukgu, Seoul 02841, Korea
4
College of Pipeline and Civil Engineering, China University of Petroleum (East China), No. 66 Changjiang West Rd., Qingdao 266580, China
*
Author to whom correspondence should be addressed.
Appl. Sci. 2020, 10(24), 8993; https://0-doi-org.brum.beds.ac.uk/10.3390/app10248993
Submission received: 24 November 2020
/
Revised: 10 December 2020
/
Accepted: 14 December 2020
/
Published: 16 December 2020
(This article belongs to the Special Issue Multifunctional Cement Composites for Structural Health Monitoring)
Abstract
:This study investigated the effects of carbon fiber (CF) length, electrode spacing, and probe configuration on the electrical conductivity of cement composites. Accordingly, 57 different types of samples were prepared, considering three different CF lengths, five different CF contents, three different electrode spacings, and two different probe configurations. This research found that the influence of CF length on the electrical resistivity of cement composite depends electrode spacing. For the cement composite with wide electrode spacing of 40 mm, its resistivity decreased as increasing CF length as in the previous study. However, when the electrode spacing is 10 mm, which is narrow (10 mm), the resistivity of the cement composite rather increased with increasing CF length. The results implied that when an electrode is designed for the cement composite incorporating CF, the CF length should be short compared to the electrode spacing. The percolation threshold of CF measured by the two-probe configuration was 2% or more. This is higher than that measured by the four-probe configuration (1%). At a lower CF content than 2%, the two-probe configuration gave higher resistivity of the cement composite than the four-probe configuration. However, the difference coming from the different probe configurations was marginal as increasing the CF content.
1. Introduction
Incorporating carbon-based materials, such as carbon nanotube (CNT), carbon black, and carbon fiber (CF) into a cement composite enhances its conductivity to that of a semiconductor. Conductive cement composites have novel applications in the field of construction, such as self-sensing [1,2,3,4,5,6,7], self-heating [8,9,10], and electromagnetic shielding [11,12]. Among the aforementioned materials, CNT, and carbon black are nanoscale fillers. Such fillers are too small to be dispersed in cement composites. Hence, the dispersion techniques of sonication [5,13,14,15,16,17], surface treatment [13,16,17,18,19], or both [13,16,17], are necessary. Otherwise, the agglomerated fillers may cause mechanical and electric faults in cement composites due to the van der Waals interaction.
CFs can be dispersed relatively easily, compared with nanoscale fillers because CFs are micrometers in diameter and millimeters in length. Since the dispersion of CFs can be improved simply by incorporating silica fume [20,21,22,23], the above-mentioned dispersion techniques may not be required. In previous studies, the percolation threshold of CF was reported to be approximately between 0.5% and 1.0% [11,21,22,24,25,26,27], while those of carbon nanotubes and carbon black were reported to be approximately 1.0% [5,28,29] and 7.22–11.39% [30], respectively. In other words, CFs are more efficient in forming electric pathways in cement composites [31]. Several researchers showed that incorporating 0.1% CF into a cement composite with 0.5% CNT resulted in a stable electrical conductivity [23] and outstanding self-sensing performance [4]. In particular, Lee et al. [4] reported the feasibility of replacing 0.5% CNT with 0.1% CF for improving the self-sensing performance.
Owing to the relatively low unit cost of CF (approximately 19% of CNT [4]), mass production of CF is more suitable than that of nanoscale fillers. Thus, CF has been applied to the reinforcements of various types for concrete structures such as CF reinforced polymer (CFRP) sheet [32,33], grid [34,35], rebar [36,37] and so on.
Additionally, since commercial CF is produced by chopping a CF bundle with thousand monofilaments, it is possible to be produced in various lengths. Generally, long CFs are more difficult to be dispersed than short CFs [38]. Such poor dispersion serves as mechanical drawbacks [39]. Thus, short CF is preferred due to this dispersion problem [40,41].
Several researchers have investigated the effects of CF length on the electrical conductivity, and they have agreed that the longer the CF, the higher the electrical conductivity of the cement composite [21,42,43]. This is because the contact probability of each CF filament increases as the length of CF increases. However, if the CF filament is long, a wide electrode spacing may be required. If the electrode spacing is narrow, there is not sufficient space for the CF to be dispersed. Although most researchers have studied only the influence of the CF length on the electrical conductivity of cement composites, they did not consider the effects of electrode spacing.
Generally, to measure the electrical properties of a cement composite, the electrodes are set based on the two- or four-probe configurations [44,45]. The former configuration is conceptually simple: two electrodes inserted in a cement composite serve as current (sources) and voltage (sense) terminals. However, the measurement of the resistance in the two-probe method can be overestimated because the resistance includes the contact resistance arising from the interface between the electrode and cement composite [44,45]. This overestimation is considerably large for a high resistance range. On the contrary, in a four-probe configuration, the current (source) and voltage (sense) terminals operate separately; the voltage is measured from the inner electrodes, while the current flows between the outer electrodes. This configuration is preferred for a precise measurement of resistance because it overcomes the problem of contact resistance [44]. Electrode configuration is one of the key concerns in the fabrication of conductive cement composites and therefore, its effect should be investigated.
This study aims to investigate the influence of the length of CF, electrode spacing, and electrode configuration on the conductivity of a cement composite. Accordingly, 57 different types of samples were prepared with three different CF lengths (4, 6, and 10 mm), five different CF contents (0.1, 0.5, 1.0, 1.5, and 2.0%), three different electrode spacings (10, 25, and 40 mm), and two different probe configurations (two and four-probe). Through the results of this study, the authors suggest that when designing a conductive cement composite containing CF, the CF length and the electrode spacing should be considered simultaneously. This can help the methodology of design of a conductive cement composite containing CFs.
2. Materials and Methods
2.1. Materials
Commercially available Type I ordinary Portland cement (OPC) and silica fume (SF) were used as binders. Their chemical compositions were given in Table 1. The chopped CFs with lengths of 4, 6, and 10 mm (L04, L06, and L10) were provided by Ace C & Tech Co., Ltd. (Yeongju-si, South Korea). As shown in Figure 1, their lengths were verified by an image analysis; once the scanned image of more than 40 CF bundles was converted into a binary image, the length of each bundle was measured by a mean of image analysis. In this study, ImageJ was employed as a tool of image analysis. This program is a Java-based freeware for an image processing. It can analyze images with from binary to 32-bit images. The counts depending on the lengths of CF bundles was expressed as a normal distribution as shown in Figure 1.
The diameter and density of the samples were 15 μm and 1.8 g/cm3. A sizing agent was used to reduce the number of CF filaments in the chopped bundle to less than 1.0% because a large number of filaments in a CF bundle hinders dispersion.
To prepare the cement composite samples, the water-to-binder ratio was set at 0.35. Among the total OPC weight of 1498 kg/m3, 30% was replaced with SF. CFs were incorporated into cement composites at different volume contents in the range of 0.1% to 2.0% (CF0.1, CF0.5, CF1.0, CF1.5, and CF2.0). The flow of the fresh cement composites was controlled within the range of 150–200 mm using a polycarboxylic acid-base superplasticizer.
The fresh CF-incorporated cement composites were cast into cubic molds with dimensions of 50 × 50 × 50 mm3, and subsequently, compacted using a shaking table. The hardened cement composites were demolded after two days of casting. Thereafter, they were cured at room temperature (temperature: 20 ± 2 °C and relative humidity: 65 ± 5%).
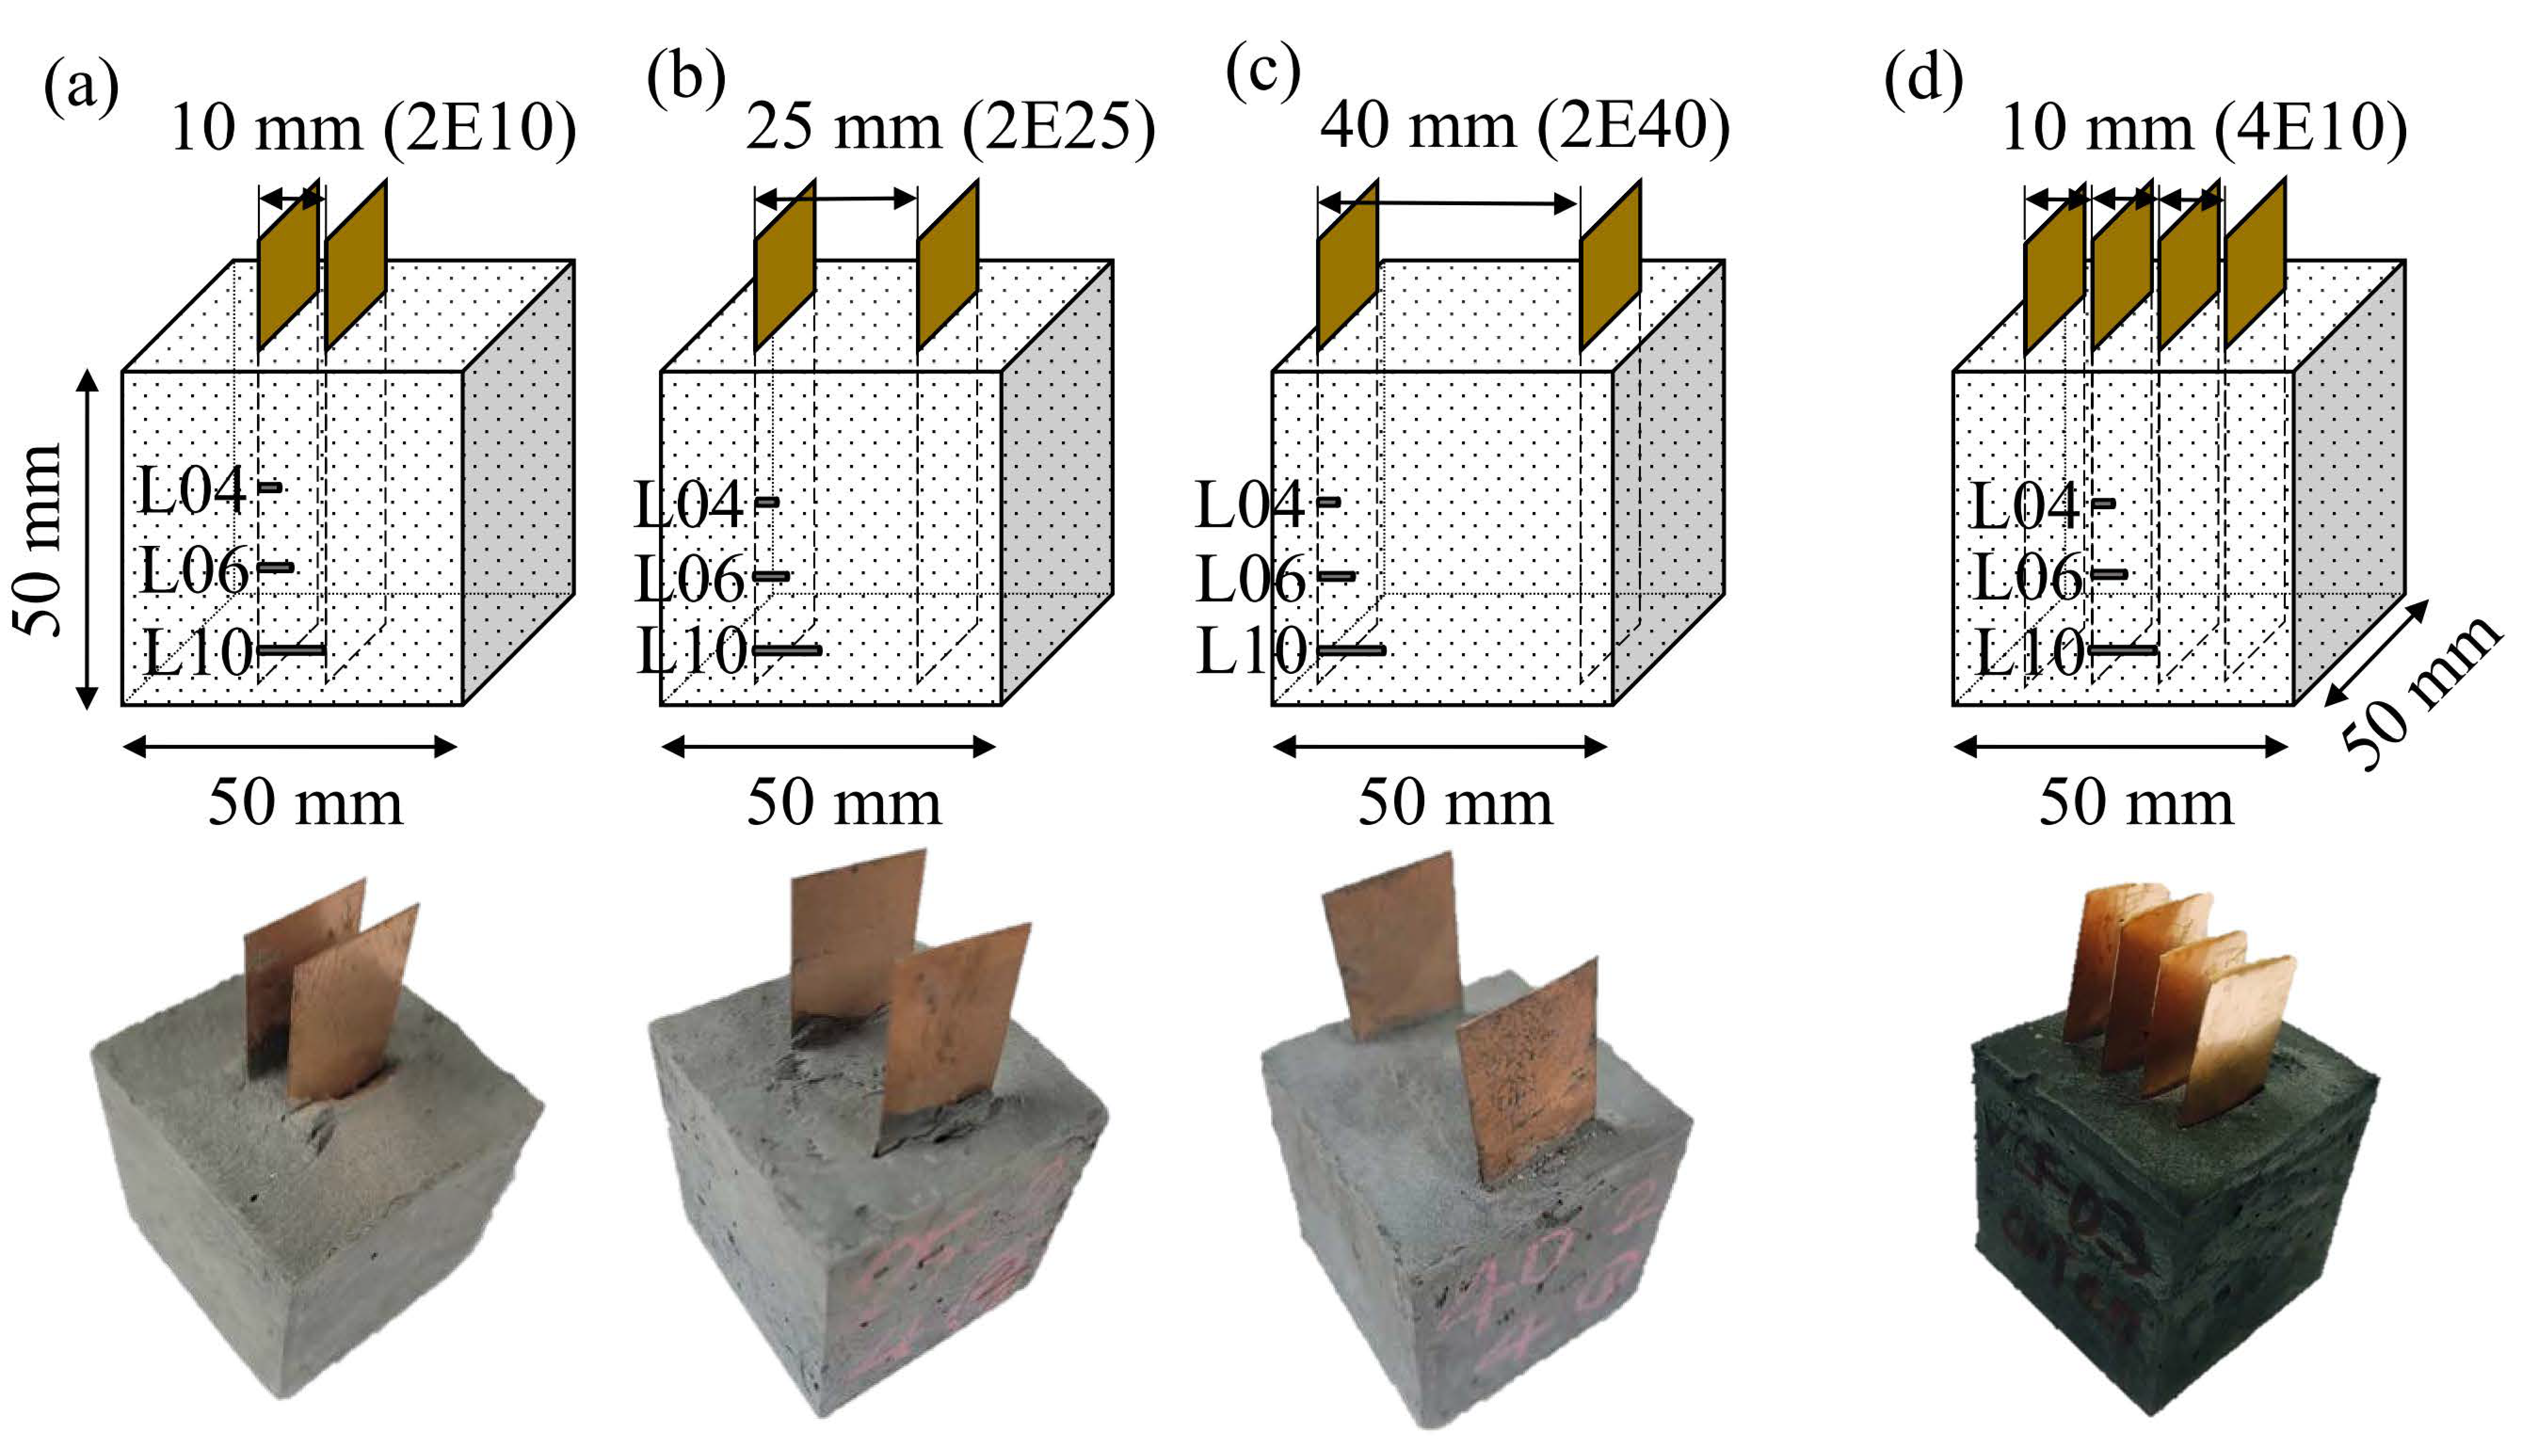
2.2. Probe Configuration
To investigate the effect of the different probe configurations, along with the CF length and CF contents, the electrical resistance of the cement composites was measured through both the two- and four-probe configurations. Figure 2 shows a graphical description of the test samples and their real pictures. Copper plate with 75 × 20 × 0.3 mm3 was used as an electrode. The electrodes were inserted to the end of the cement composite, the remaining 25 mm part of the electrode was used for linking with the alligator clip. The electrode spacing in the two-probe configuration were set at 10, 25, and 40 mm (2E10, 2E25, and 2E40). In the four-probe configuration, all the electrodes were installed into the cement composites at spacing of 10 mm (4E10).
2.3. Measurement Technique
The resistivity parameter was adopted to overcome the problems due to the difference in resistance arising from the different electrode spacing configurations. The resistivity of the cement composite was determined through the following equation:
where R is the resistance in Ohm (Ω), A is the contact area between the electrode and cement composite, i.e., 100 mm2, and E represents the electrode spacing.
The resistance of the cement composite samples was measured at the same environment with the curing condition using LCR-819 (GW INSTEK, New Taipei City, Taiwan). LCR-819 is available to measure the resistance ranging from 0.00001 to 99,999 kOhm with a high accuracy of 0.05%. Its frequency range is from 12 to 100 kHz of alternating current. In this study, the 100 kHz frequency was applied at a constant voltage of 1.2 V.
3. Results and Discussions
3.1. Two-Probe Configuration Results
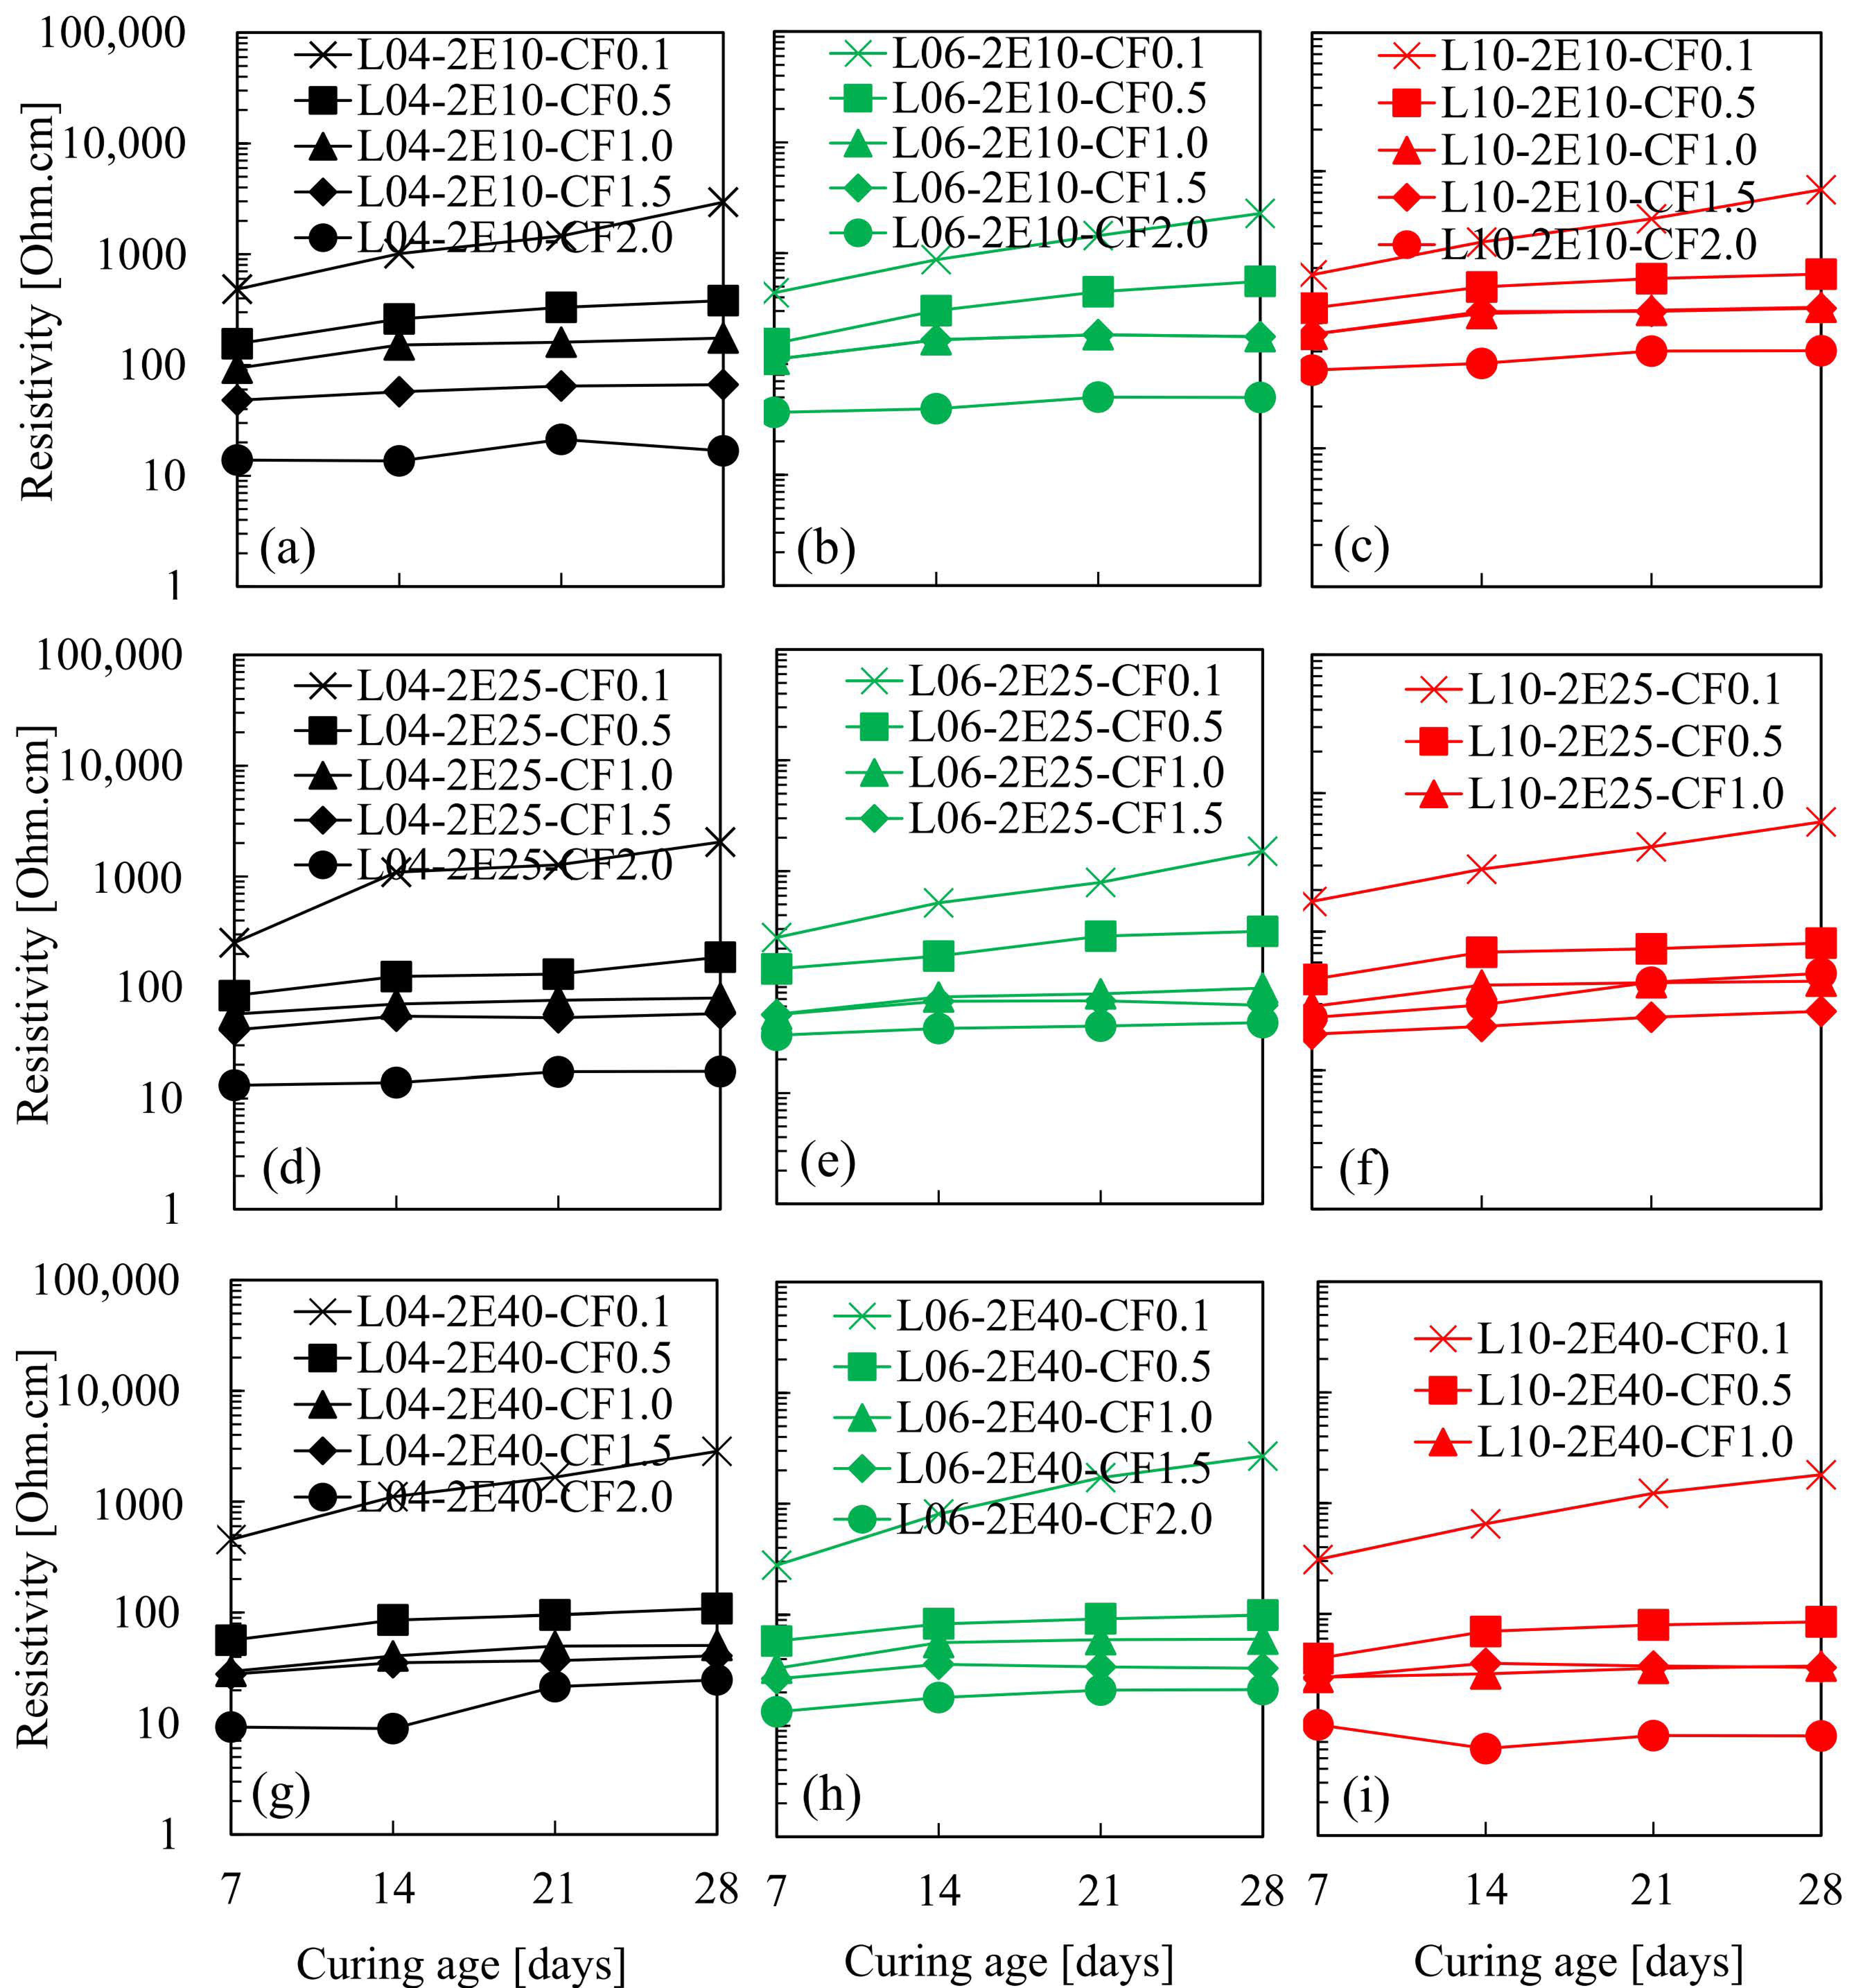
For the cement composites of two probe configuration, the change in resistivity as a function of the curing age are presented in Figure 3, and their values are given in Table 2. The cement composite test samples were prepared based on different sets of values of the CF content, CF length, and electrode spacing. The resistivity of all the cement composites with 0.1% CF increased, clearly, until 28 days of curing. This is attributed to the decrease in the pore solution. Generally, at 0.1% CF content, the resistivity of the cement composite is affected by the electrolyte because the CF content is not sufficient to predominate the electrical conductivity of the cement composite. Beyond 0.5% CF content, there was no significant increase in the resistivity with respect to the increase in the curing age. Therefore, it was concluded that the influence of CF was greater than that of the electrolyte on the electrical conductivity of the cement composite.
The resistivity of the cement composites after 28 days of curing is plotted in Figure 4. Regardless of the CF length, the cement composites with 0.1% CF (L04-CF0.1, L06-CF0.1, and L10-CF0.1) showed insignificant changes in resistivity with increasing electrode spacing. This is because 0.1% CF did not affect the electrical conductivity of a cement composite, as mentioned in the previous paragraph. For a relatively high CF content, the cement composite containing 4 mm CF of 2% (L04-CF2.0) showed a marginal change in resistivity with increasing electrode spacing, while the resistivity of the cement composite with 10 mm CF of 2% (L10-CF2.0) decreased at an electrode spacing of 40 mm (Figure 4c). This is attributed to the fact that when the CF length is the same as the electrode spacing value (10 mm in this case), the distribution of CF is difficult; however, when the electrode spacing is four times the CF length, dispersion of CF is improved because of increased space (CF length: 10 mm and electrode spacing: 40 mm).
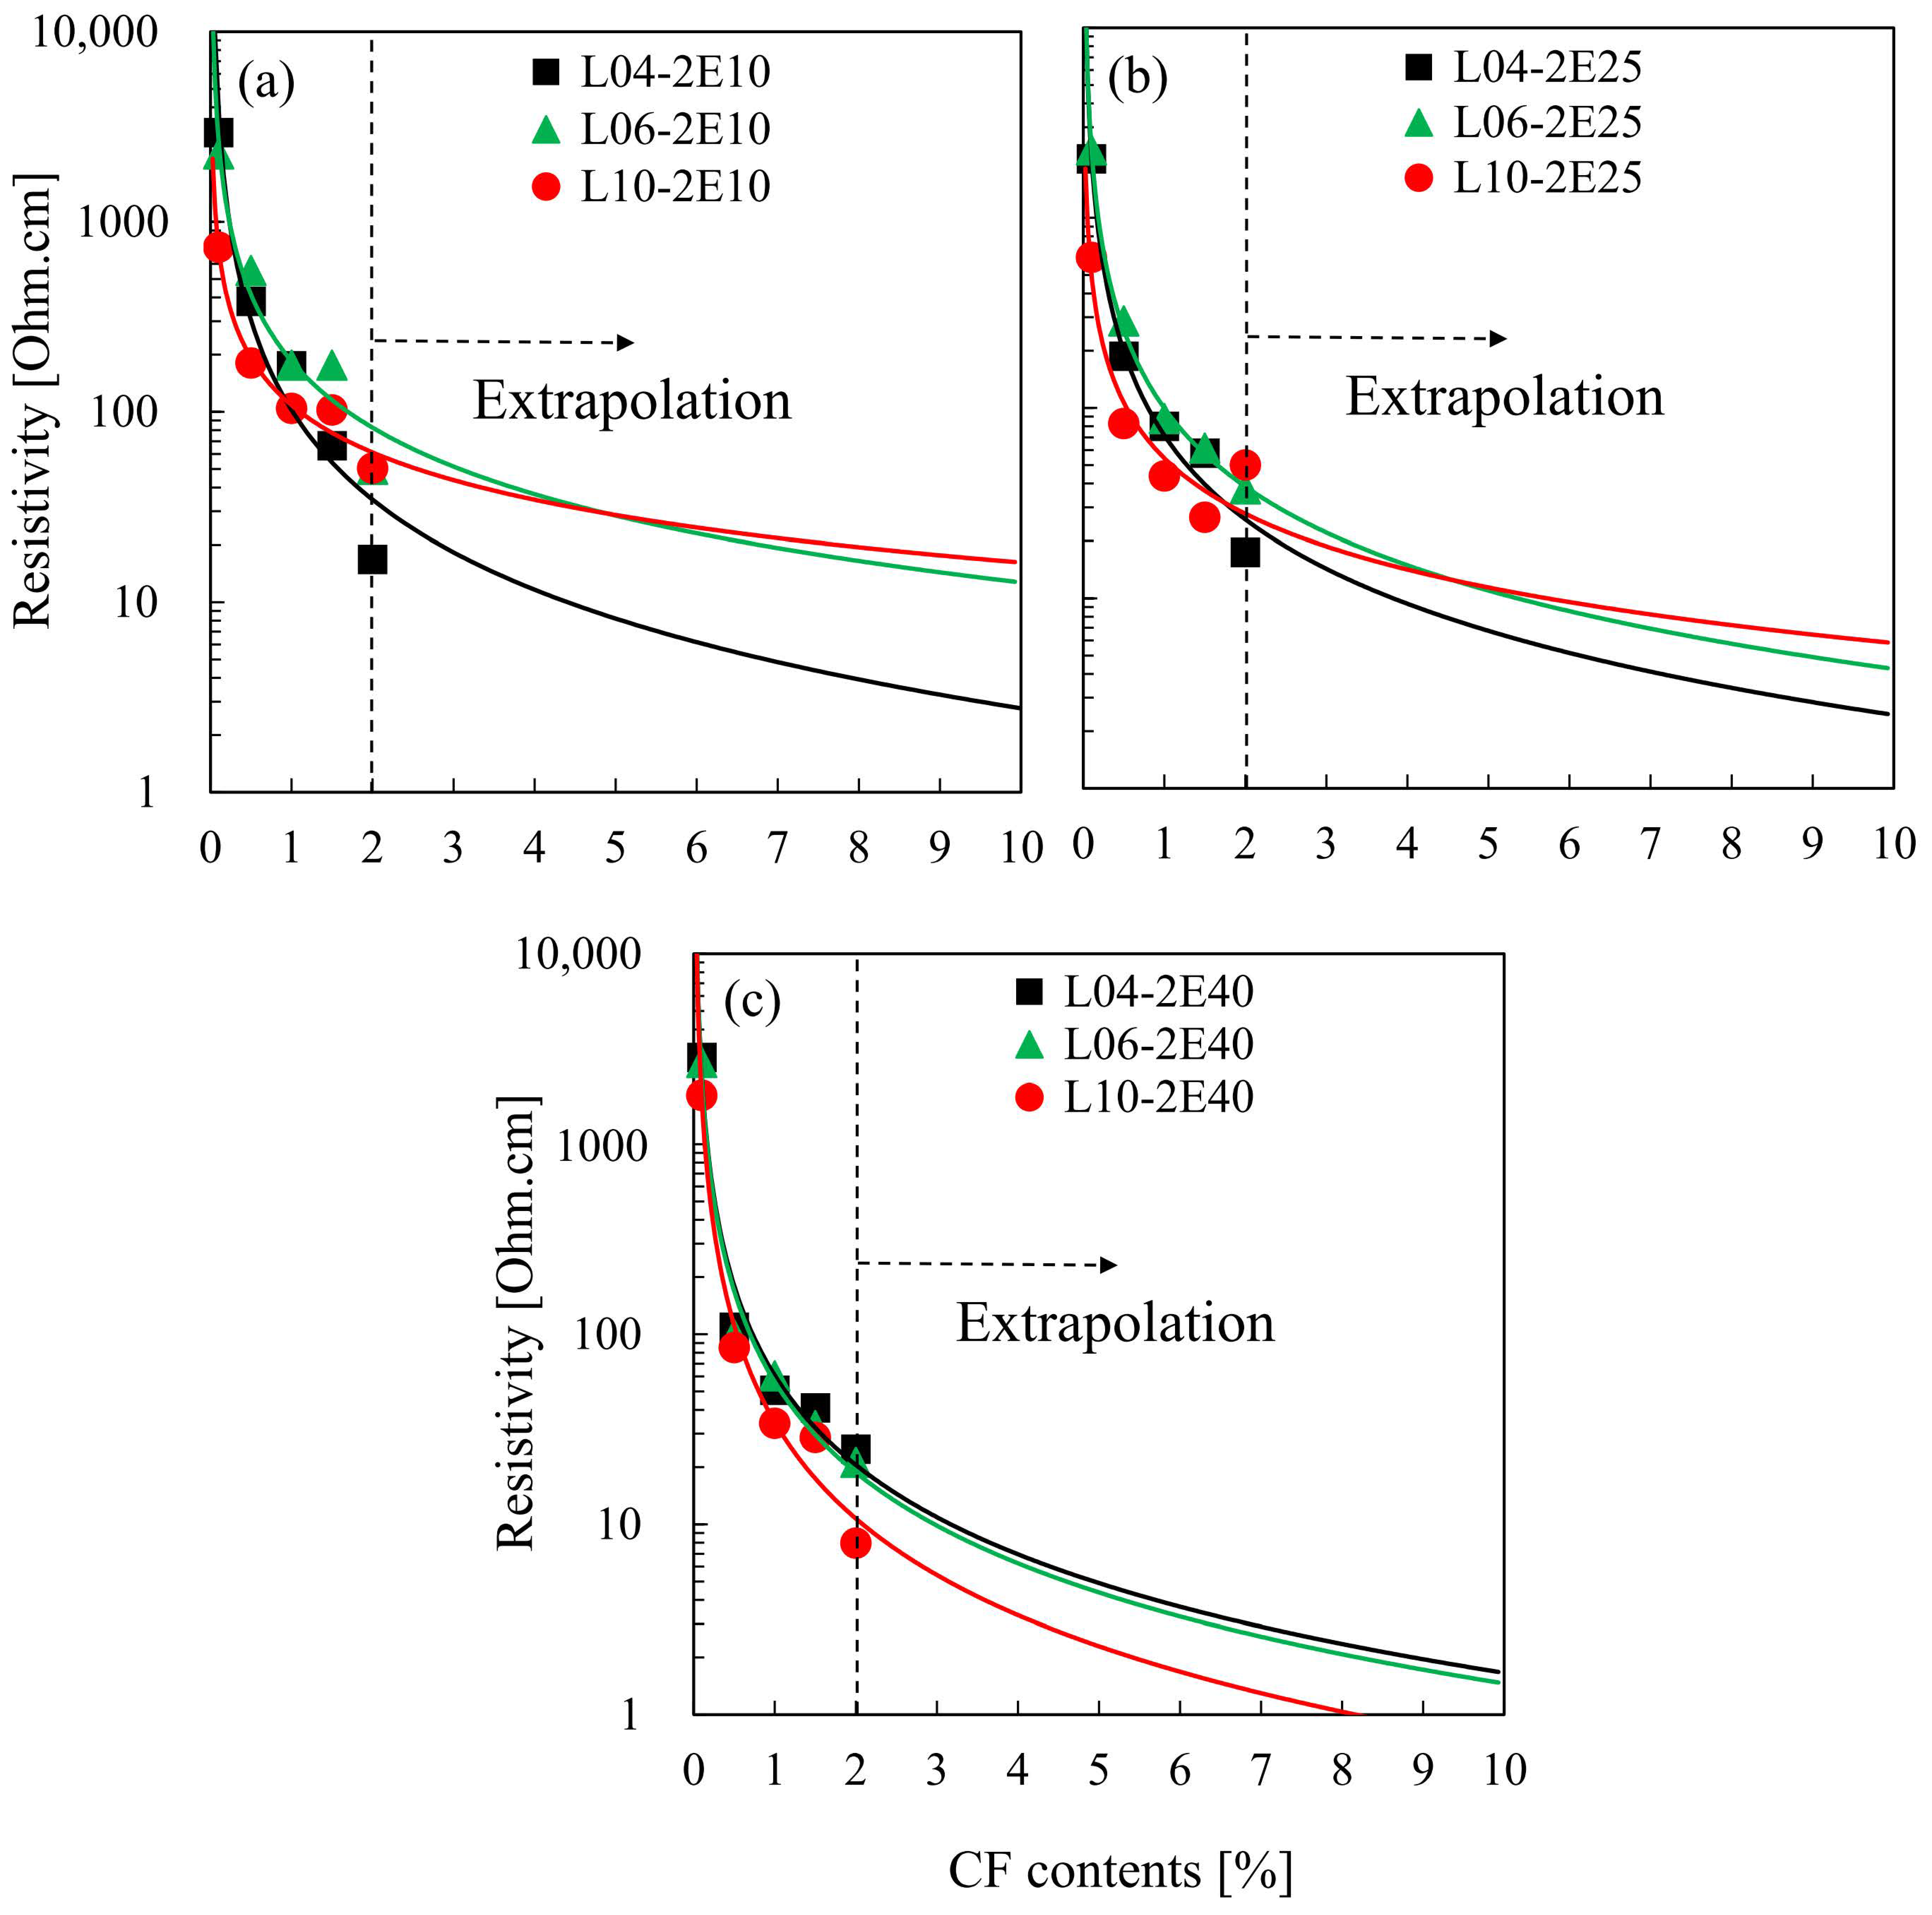
The effects of the CF lengths, electrode spacing and CF contents on the resistivity of cement composites are shown in Figure 5. The resistivity beyond the 2% CF content was determined by extrapolation. Interestingly, the resistivity of the cement composite increased with increasing CF length at a relatively narrow electrode spacing, as shown in Figure 5a,b. This result contrasts the CF length effect, wherein the longer the CF, the lower the resistivity of the cement composite [21,42,43]. At the electrode spacings of 10 and 25 mm, the cement composite with 4 mm CF (L04-2E10, L04-2E25) showed the lowest resistivity beyond 2% CF content. A relatively narrow electrode spacing with respect to the CF length might hinder the dispersion of CF. This is because a long CF tends to entangle with one another [38]. Additionally, Azhari [46] reported that the cube size can influenced affect the percolation threshold content of CF, particularly if it is smaller than CF length.
However, at an electrode spacing of 40 mm, the resistivities of the cement composites with CF lengths of 6 and 10 mm (L06-2E40 and L10-2E40) were lower than that of the cement composite with 4 mm CF length (L04mm-2E04), for all CF content values. This implies that the CF length effect reported in previous studies [21,42,43] is valid only when the electrode spacing is sufficiently wide.
3.2. Four-Probe Configuration Results
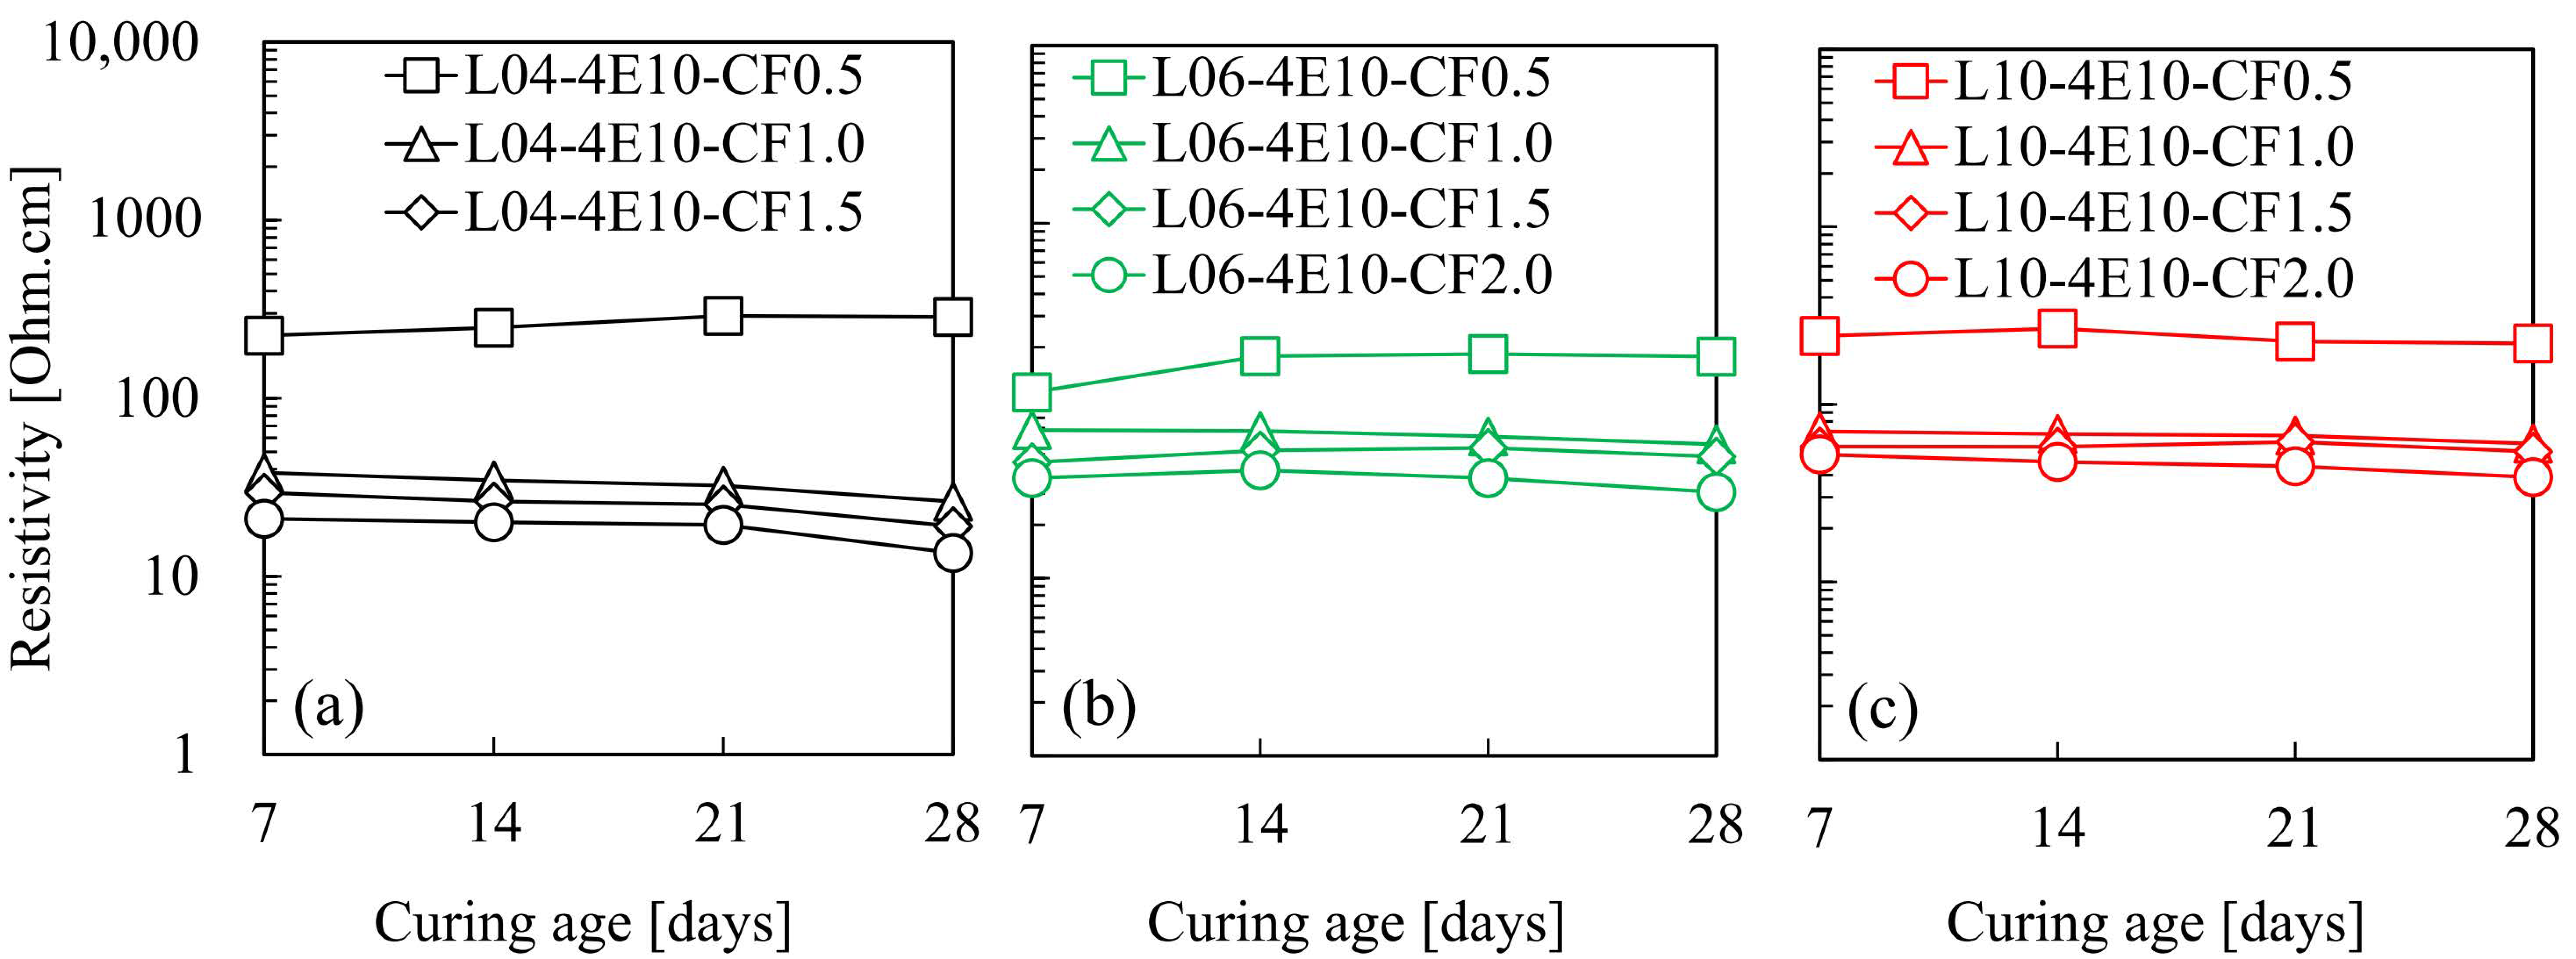
For the cement composites of four-probe configuration, the change in resistivity as a function of curing age is presented in Figure 6, and their values are given in Table 3. Regardless of the CF length, the cement composites incorporating more than 0.5% CF showed constant resistivity despite the increase in curing age. In Figure 6, the resistivity of the cement composites with 0.5% CF can be clearly distinguished from the other cement composites with different CF contents; no further decrease in the resistivity was observed beyond 1.0% CF content, indicating that the percolation threshold was 1.0% CF content [11,22,24]. This result is more clearly seen in Figure 7.
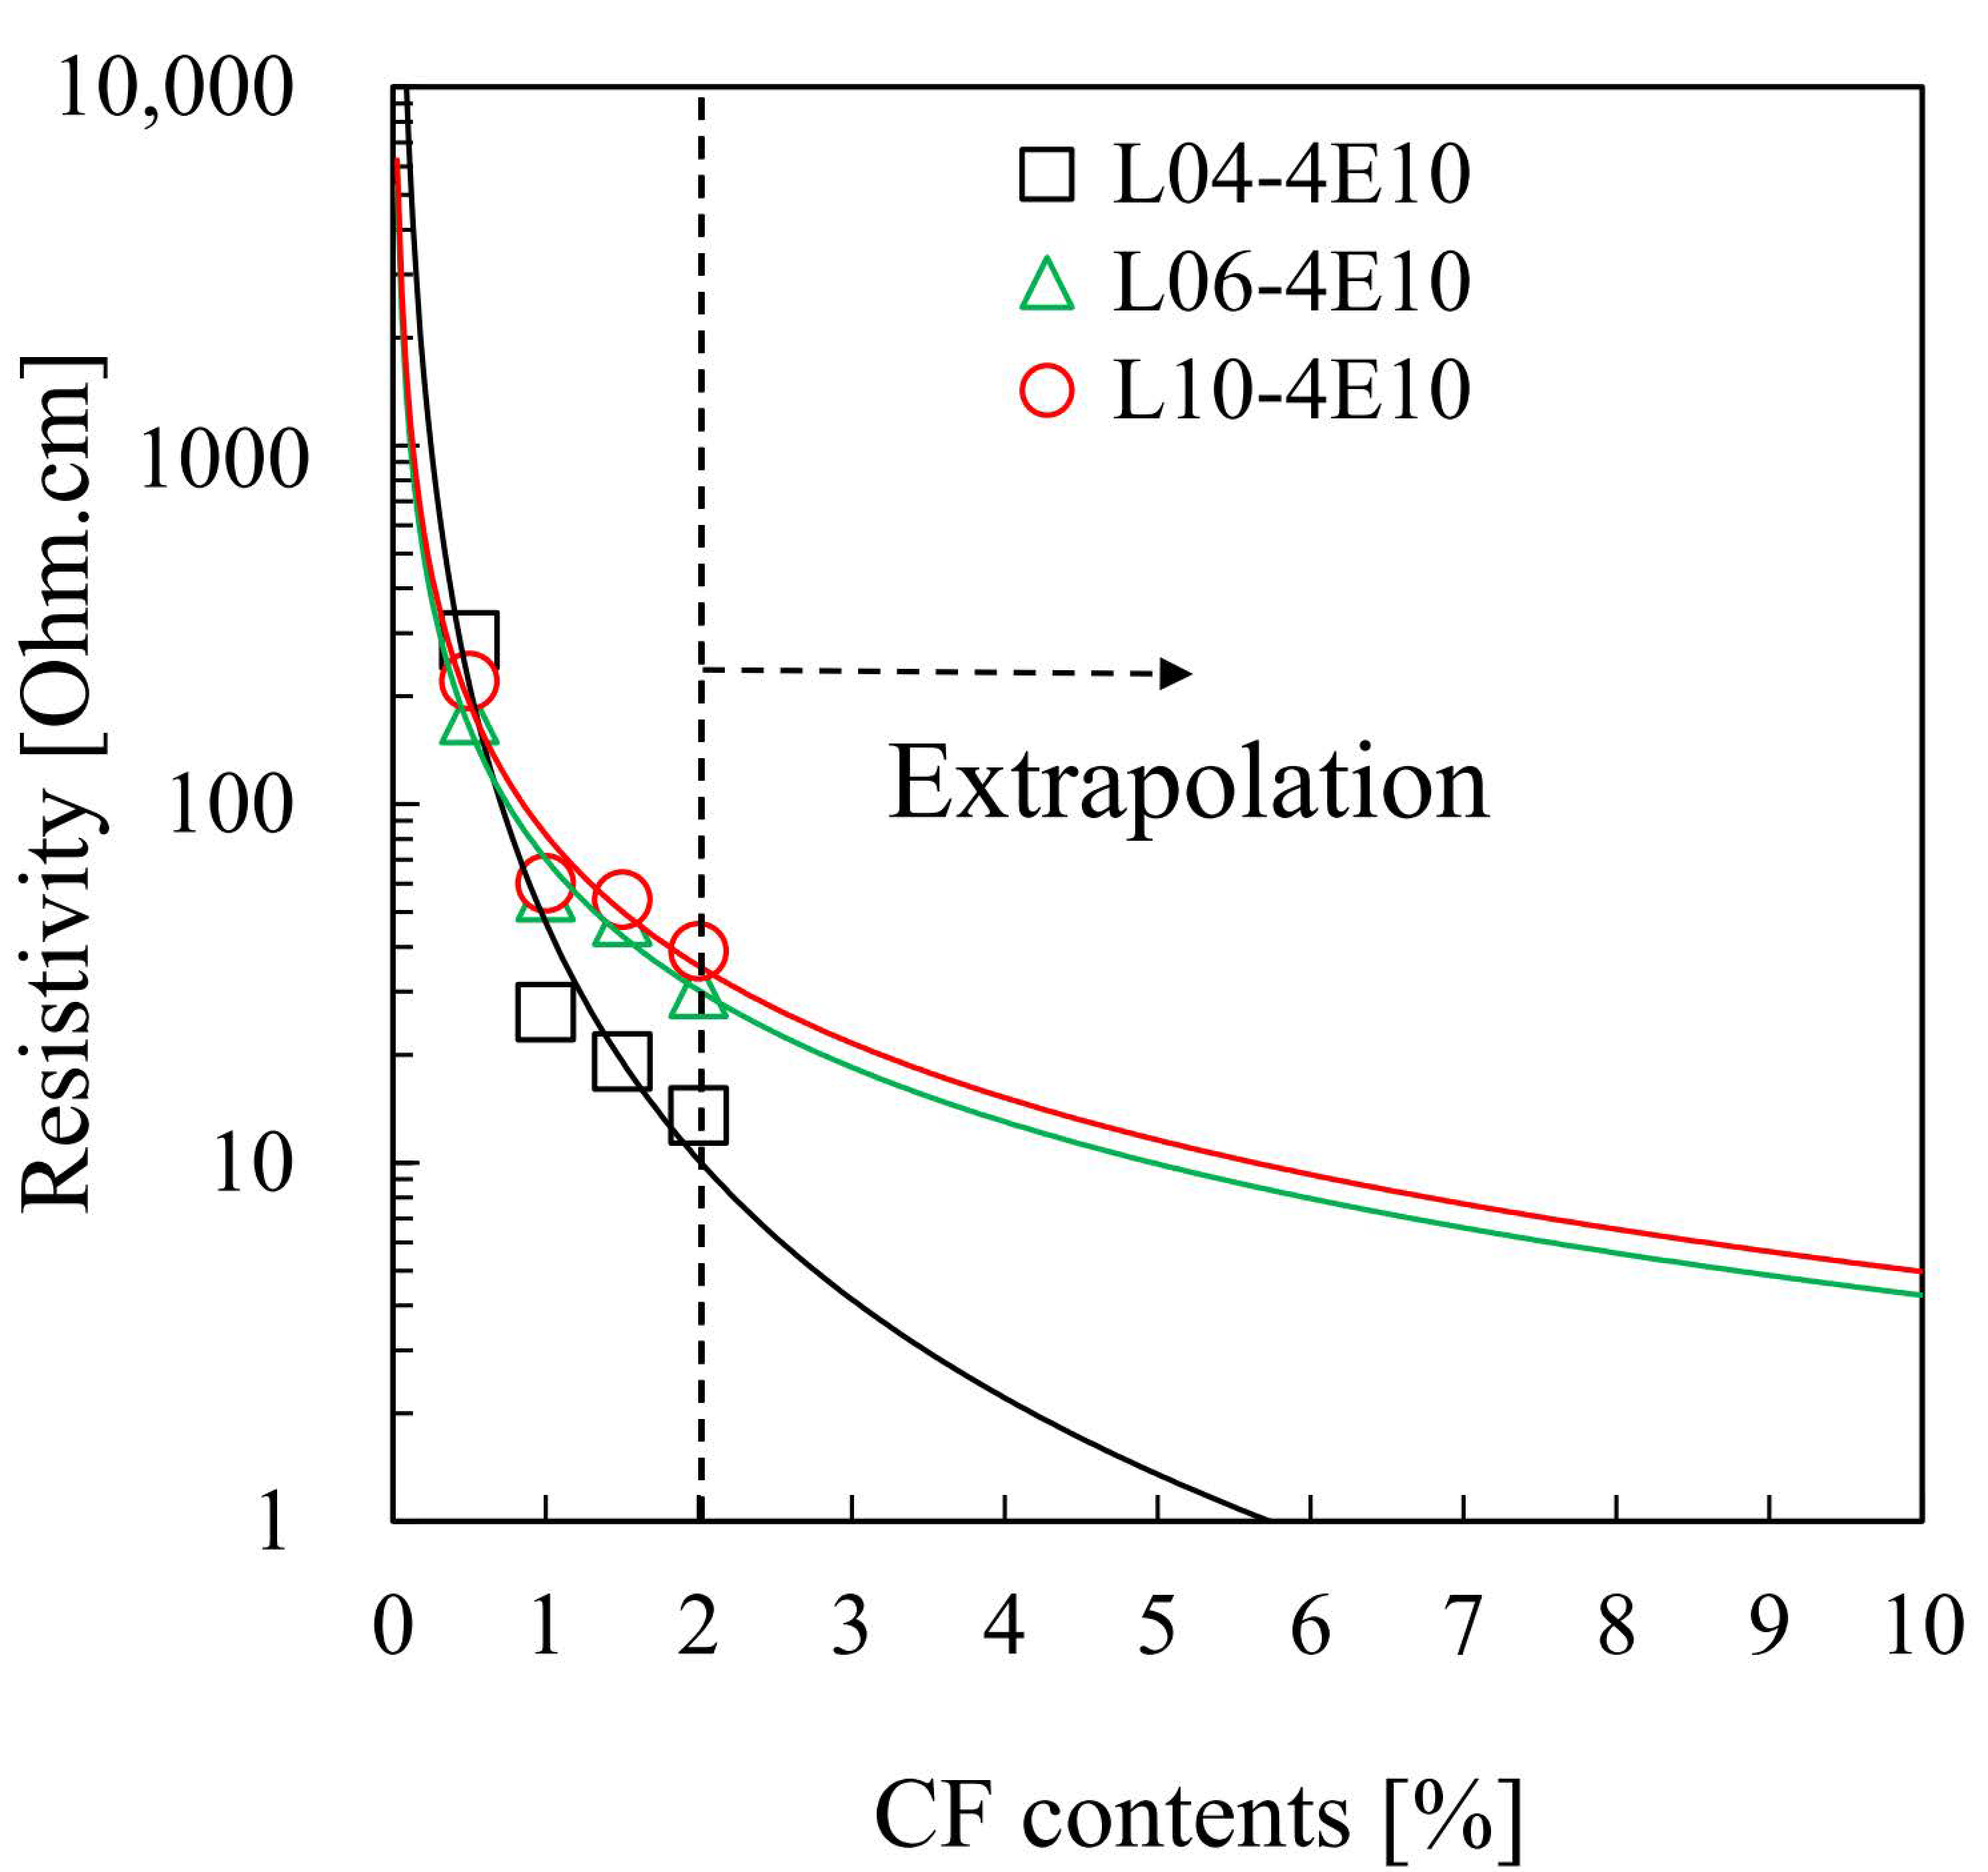
For the cement composites of four-probe configuration with 10 mm electrode spacing, the change in the resistivity as a function of CF content is shown in Figure 7. Similar trend in the decreasing resistivity with increasing CF lengths was also observed in the four-probe configuration, as in the two-probe configurations (Figure 5). This is because the relatively short 4 mm CF (L04) is easily dispersed, the resistivity of the cement composite decreased continuously with the increase in CF contents, while relatively long 6 or 10 mm CFs (L06 and L10) were difficult to be dispersed in the electrode spacing of 10 mm. Poor dispersion may cause an increase in the resistivity of the cement composite. This phenomenon became worse with increasing CF content.
3.3. Comparison between Two- and Four-Probe Configurations and Corresponding Percolation Thresholds
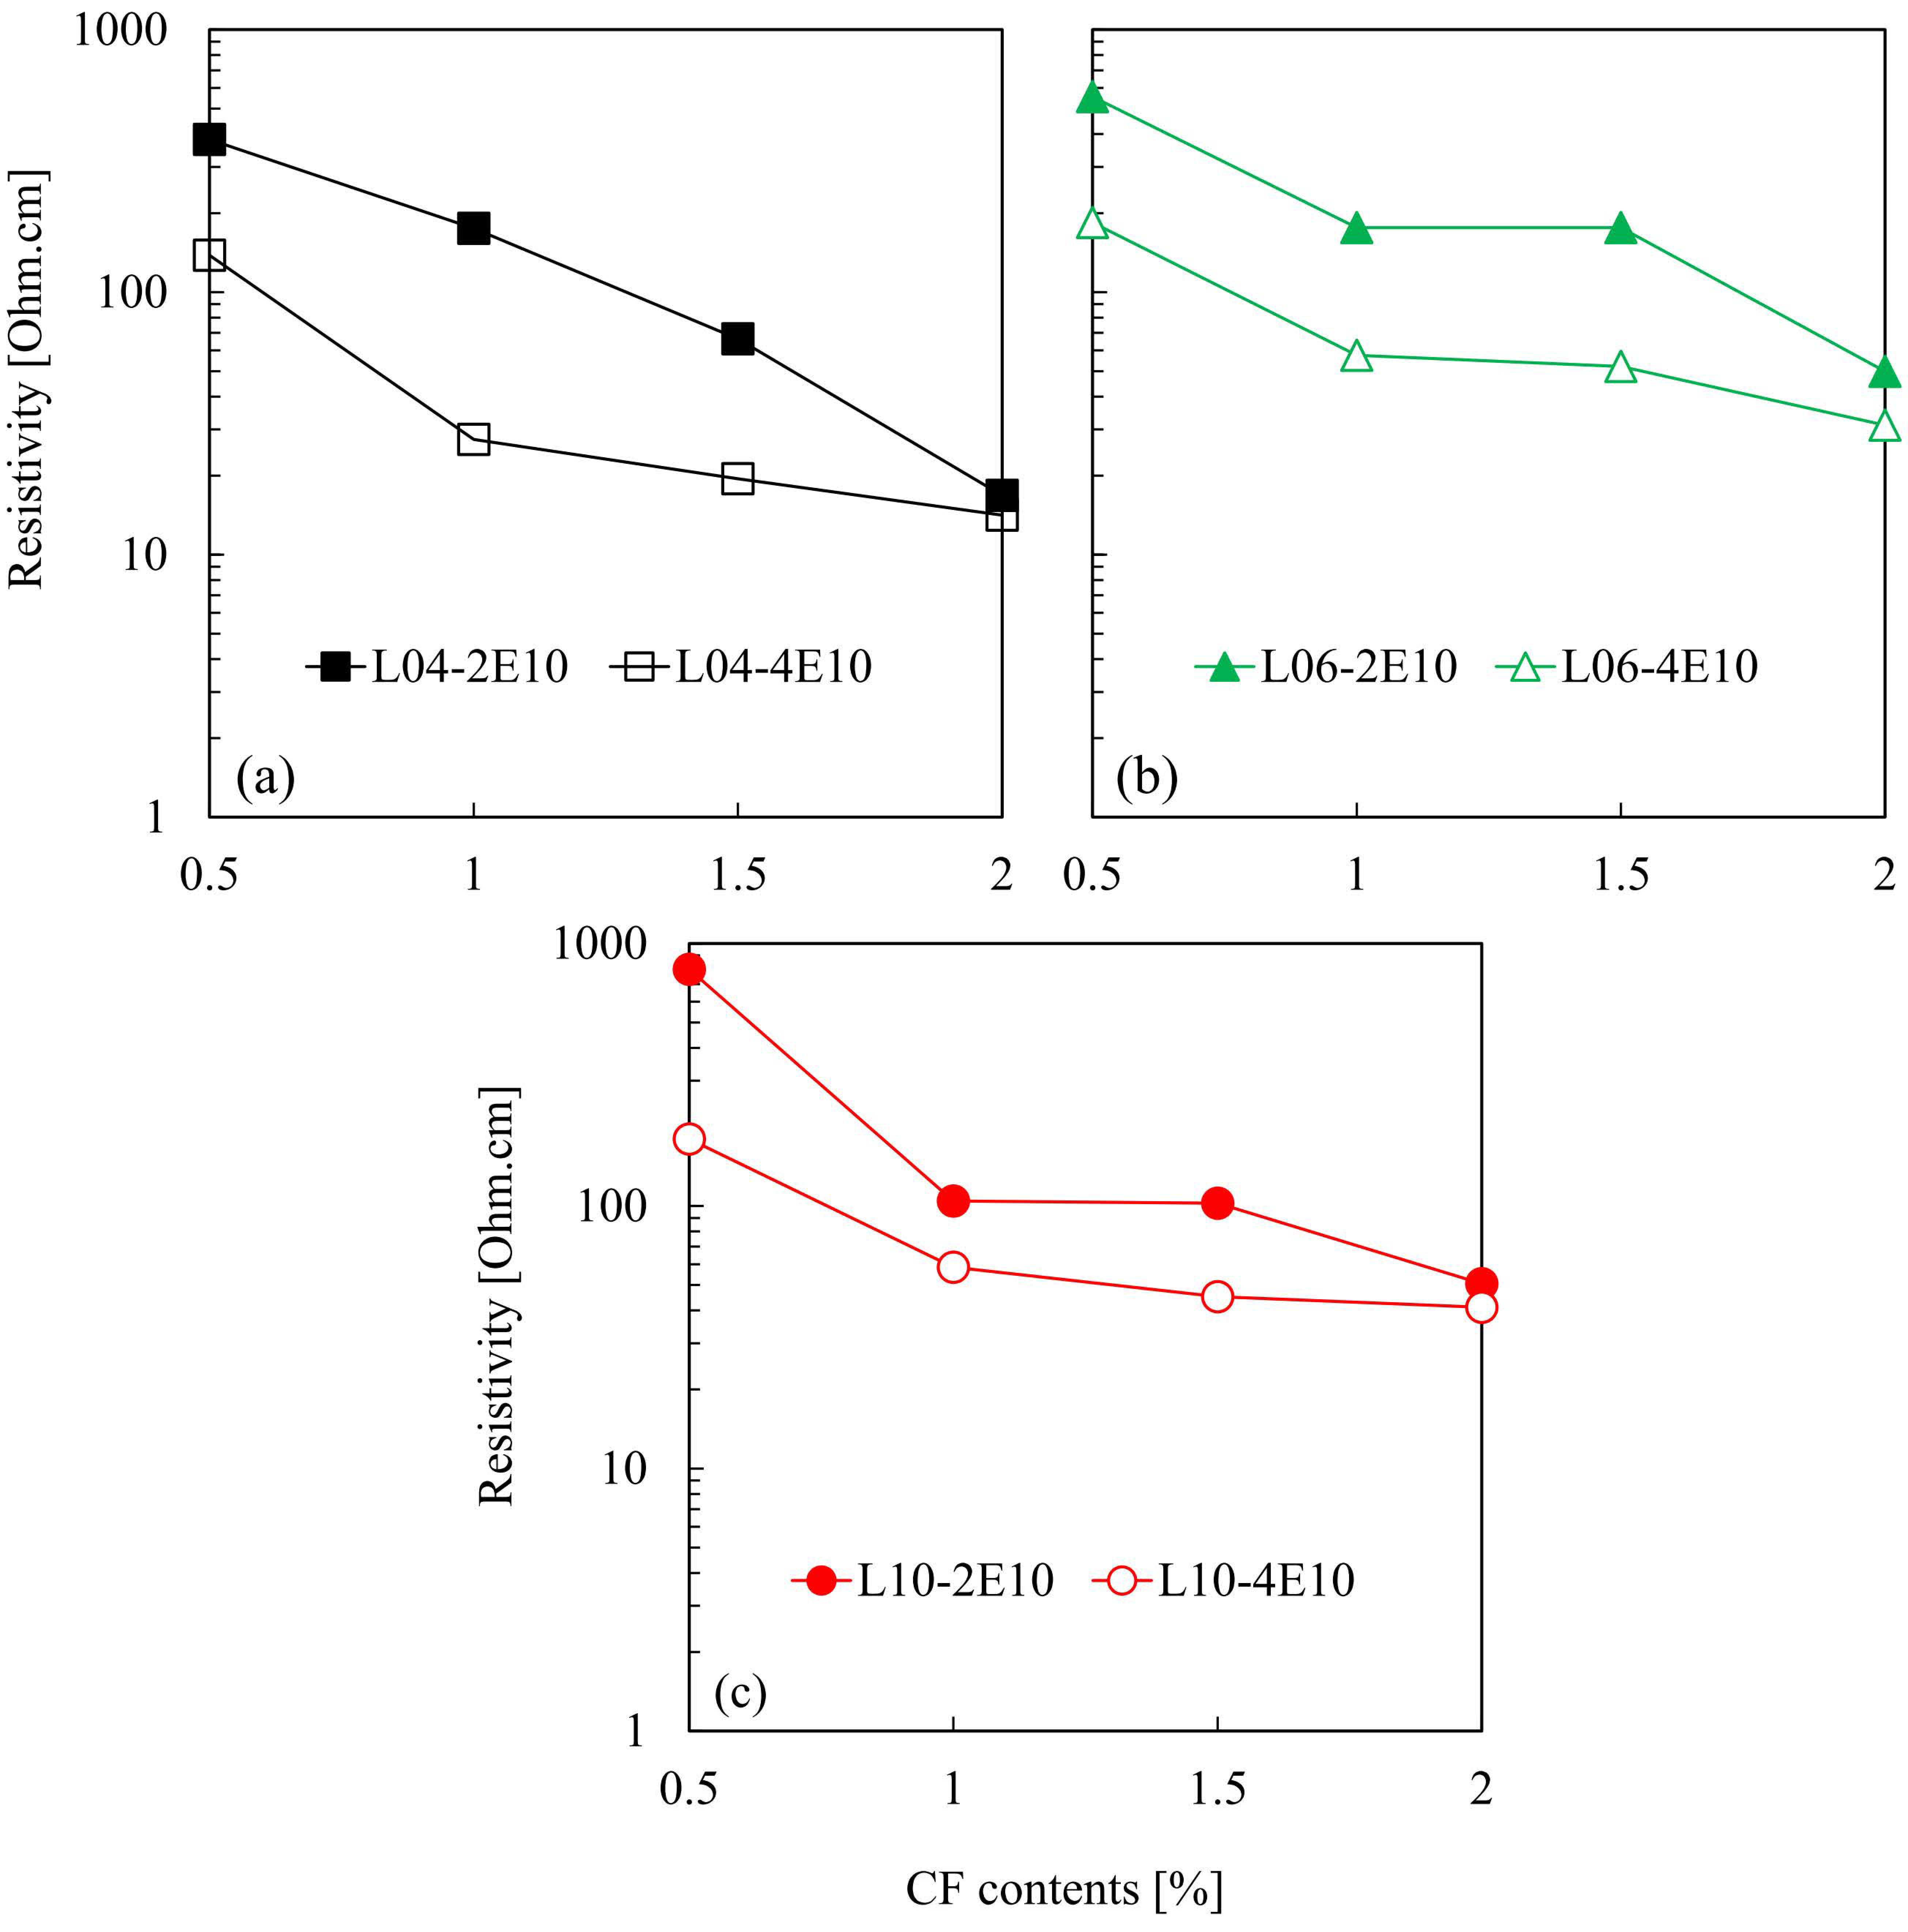
The comparison of the resistivity depending on the different probe configurations is shown in Figure 8. Regardless of the CF lengths, the resistivity of cement composites was lower for the four-probe configuration compared with the two-probe configuration, at the same electrode spacing. As mentioned previously, unlike the two-probe configuration, in the four-probe configuration, the contact resistance is not included in the measurement of resistivity [44,45]. There was no significant decrease in the resistivity beyond the 1.0% CF content for the electrode spacing of 10 mm, indicating that the percolation threshold of the composites measured via the four-probe configuration was 1.0% CF. The resistivity of the cement composite measured via the two-probe configuration showed a continuous decrease as the CF content increased to 2% CF; therefore, the percolation threshold measured via the two-probe configuration was 2% or lower, corresponding to the electrode spacing of 10 mm.
The differences in the variation in resistivity as a function of the CF content observed between the two- and four-probe configurations became less distinct with increasing CF content. The contact resistance depends on both the conductivities of the electrode and cement composite; however, the former can be neglected because of its very low resistance [44]. The influence of contact resistance is small at a high CF content [44]. Therefore, it may be concluded that the difference between the resistivities measured via the two different probe configurations would be insignificant at a high CF content of 2%.
4. Conclusions
The electrical conductivity of a cement composite depends on curing age, CF content, CF length, electrode spacing, and probe configuration. The research findings are summarized below:
- The conductivity of the cement composite incorporating 0.1% CF was predominantly influenced by the electrolyte of the pore solution, rather than the CF content. Beyond 0.5% CF content, the influence of CF on the conductivity was greater than that of the electrolyte of the pore solution.
- Only when the electrode spacing was relatively wide (40 mm), the resistivity decreased with increasing CF length. Further, for narrow electrode spacing (10 mm), the resistivity of the cement composite increased with an increase in the CF length. These results imply that the CF length should be considered along with the electrode spacing when composing the electrodes of the cement composite by incorporating CF.
- For the four-probe configuration, there was no significant difference between the cement composites with 1.0% and 2.0% CF. Additionally, they showed low resistivity values of less than 100 Ω∙cm. This indicates that the percolation threshold of CF was 1.0% corresponding to the four-probe configuration. The cement composites evaluated via the two-probe configuration showed continuous decreases in resistivity until the 2.0% CF content value.
- Regardless of the CF length, the measured resistivity differences between the two- and four-probe configurations were large at low CF contents. These gaps became marginal as the CF content increased.
- As a major conclusion of this study, for the efficient conductivity of cement composites, CF length should be sufficiently short compared to electrode spacing. Since the conductive cement composite is basis to implement functional cement composite structure such as self-heating and self-sensing. This finding can help the methodology of design of a conductive cement composite containing CFs.
Author Contributions
Conceptualization, I.Y. and S.-J.L.; methodology, I.Y. and D.L.; validation, S.-J.L. and G.Z.; investigation, I.Y. and D.L.; writing—original draft preparation, I.Y.; writing—review and editing, S.-J.L. and G.Z.; visualization, I.Y. and D.L.; supervision, S.-J.L.; project administration, S.-J.L. and G.Z.; funding acquisition, S.-J.L. All authors have read and agreed to the published version of the manuscript.
Funding
This research was supported by the National Research Foundation of Korea (NRF) funded by the Ministry of Education (NRF-2020R1I1A1A01071824) and the Korea government (MIST) (No. 2019R1C1C1008190).
Conflicts of Interest
The authors declare no conflict of interest.
References
- You, I.; Yoo, D.Y.; Kim, S.; Kim, M.J.; Zi, G. Electrical and self-sensing properties of ultra-high-performance fiber-reinforced concrete with carbon nanotubes. Sensors 2017, 17, 2481. [Google Scholar] [CrossRef] [PubMed] [Green Version]
- Lee, S.H.; Kim, S.; Yoo, D.Y. Hybrid effects of steel fiber and carbon nanotube on self-sensing capability of ultra-high-performance concrete. Constr. Build. Mater. 2018, 185, 530–544. [Google Scholar] [CrossRef]
- Yoo, D.-Y.D.Y.; You, I.; Lee, S.-J. Electrical properties of cement-based composites with carbon nanotubes, graphene, and graphite nanofibers. Sensors 2017, 17, 1064. [Google Scholar] [CrossRef] [PubMed]
- Lee, S.J.; You, I.; Zi, G.; Yoo, D.Y. Experimental investigation of the piezoresistive properties of cement composites with hybrid carbon fibers and nanotubes. Sensors 2017, 17, 2516. [Google Scholar] [CrossRef] [PubMed] [Green Version]
- D’Alessandro, A.; Rallini, M.; Ubertini, F.; Materazzi, A.L.; Kenny, J.M. Investigations on scalable fabrication procedures for self-sensing carbon nanotube cement-matrix composites for SHM applications. Cem. Concr. Compos. 2016, 65, 200–213. [Google Scholar] [CrossRef]
- Pisello, A.L.; D’Alessandro, A.; Sambuco, S.; Rallini, M.; Ubertini, F.; Asdrubali, F.; Materazzi, A.L.; Cotana, F. Multipurpose experimental characterization of smart nanocomposite cement-based materials for thermal-energy efficiency and strain-sensing capability. Sol. Energy Mater. Sol. Cells 2017, 161, 77–88. [Google Scholar] [CrossRef]
- Lee, S.-J.; Ahn, D.; You, I.; Yoo, D.-Y.; Kang, Y.S.Y.-S. Wireless cement-based sensor for self-monitoring of railway concrete infrastructures. Autom. Constr. 2020, 119, 103323. [Google Scholar] [CrossRef]
- Sun, Y.; Wu, S.; Liu, Q.; Hu, J.; Yuan, Y.; Ye, Q. Snow and ice melting properties of self-healing asphalt mixtures with induction heating and microwave heating. Appl. Therm. Eng. 2018, 129, 871–883. [Google Scholar] [CrossRef]
- Chang, C.; Ho, M.; Song, G.; Mo, Y.L.; Li, H. A feasibility study of self-heating concrete utilizing carbon nanofiber heating elements. Smart Mater. Struct. 2009, 18. [Google Scholar] [CrossRef]
- Kim, G.M.; Naeem, F.; Kim, H.K.; Lee, H.K. Heating and heat-dependent mechanical characteristics of CNT-embedded cementitious composites. Compos. Struct. 2016, 136, 162–170. [Google Scholar] [CrossRef]
- Chung, D.D.L. Cement reinforced with short carbon fibers: A multifunctional material. Compos. Part B Eng. 2000, 31, 511–526. [Google Scholar] [CrossRef]
- Chung, D.D.L. Electrically conductive cement-based materials. Adv. Cem. Res. 2004, 16, 167–176. [Google Scholar] [CrossRef]
- Collins, F.; Lambert, J.; Duan, W.H. The influences of admixtures on the dispersion, workability, and strength of carbon nanotube-OPC paste mixtures. Cem. Concr. Compos. 2012, 34, 201–207. [Google Scholar] [CrossRef]
- Han, B.; Yu, X.; Ou, J. Effect of water content on the piezoresistivity of MWNT/cement composites. J. Mater. Sci. 2010, 45, 3714–3719. [Google Scholar] [CrossRef]
- Konsta-Gdoutos, M.S.; Metaxa, Z.S.; Shah, S.P. Highly dispersed carbon nanotube reinforced cement based materials. Cem. Concr. Res. 2010, 40, 1052–1059. [Google Scholar] [CrossRef]
- Sobolkina, A.; Mechtcherine, V.; Khavrus, V.; Maier, D.; Mende, M.; Ritschel, M.; Leonhardt, A. Dispersion of carbon nanotubes and its influence on the mechanical properties of the cement matrix. Cem. Concr. Compos. 2012, 34, 1104–1113. [Google Scholar] [CrossRef]
- Mendoza, O.; Sierra, G.; Tobón, J.I. Influence of super plasticizer and Ca(OH)2 on the stability of functionalized multi-walled carbon nanotubes dispersions for cement composites applications. Constr. Build. Mater. 2013, 47, 771–778. [Google Scholar] [CrossRef]
- Yu, X.; Kwon, E. A carbon nanotube/cement composite with piezoresistive properties. Smart Mater. Struct. 2009, 18. [Google Scholar] [CrossRef]
- Sanchez, F.; Ince, C. Microstructure and macroscopic properties of hybrid carbon nanofiber/silica fume cement composites. Compos. Sci. Technol. 2009, 69, 1310–1318. [Google Scholar] [CrossRef]
- Wang, C.; Li, K.Z.; Li, H.J.; Jiao, G.S.; Lu, J.; Hou, D.S. Effect of carbon fiber dispersion on the mechanical properties of carbon fiber-reinforced cement-based composites. Mater. Sci. Eng. A 2008, 487, 52–57. [Google Scholar] [CrossRef]
- Chuang, W.; Geng-sheng, J.; Bing-liang, L.; Lei, P.; Ying, F.; Ni, G.; Ke-zhi, L. Dispersion of carbon fibers and conductivity of carbon fiber-reinforced cement-based composites. Ceram. Int. 2017, 43, 15122–15132. [Google Scholar] [CrossRef]
- Wen, S.; Chung, D.D.L. The role of electronic and ionic conduction in the electrical conductivity of carbon fiber reinforced cement. Carbon N. Y. 2006, 44, 2130–2138. [Google Scholar] [CrossRef]
- Kim, G.M.; Park, S.M.; Ryu, G.U.; Lee, H.K. Electrical characteristics of hierarchical conductive pathways in cementitious composites incorporating CNT and carbon fiber. Cem. Concr. Compos. 2017, 82, 165–175. [Google Scholar] [CrossRef]
- Chen, P.W.; Chung, D.D.L. Improving the electrical conductivity of composites comprised of short conducting fibers in a nonconducting matrix: The addition of a nonconducting particulate filler. J. Electron. Mater. 1995, 24, 47–51. [Google Scholar] [CrossRef]
- Xu, J.; Zhong, W.; Yao, W. Modeling of conductivity in carbon fiber-reinforced cement-based composite. J. Mater. Sci. 2010, 45, 3538–3546. [Google Scholar] [CrossRef]
- Azhari, F.; Banthia, N. Carbon fiber-reinforced cementitious composites for tensile strain sensing. ACI Mater. J. 2017, 114, 129–136. [Google Scholar] [CrossRef]
- Zhu, S.; Chung, D.D.L. Numerical assessment of the methods of measurement of the electrical resistance in carbon fiber reinforced cement. Smart Mater. Struct. 2007, 16, 1164–1170. [Google Scholar] [CrossRef] [Green Version]
- Yoon, I.-S. Interaction Experiment on Chloride Ion Adsorption Behavior of C-S-H Phases. J. Korea Concr. Inst. 2017, 29, 65–75. [Google Scholar] [CrossRef] [Green Version]
- Yoo, D.-Y.; You, I.; Youn, H.; Lee, S.-J. Electrical and piezoresistive properties of cement composites with carbon nanomaterials. J. Compos. Mater. 2018, 52. [Google Scholar] [CrossRef]
- Li, H.; Xiao, H.G.; Ou, J.P. Effect of compressive strain on electrical resistivity of carbon black-filled cement-based composites. Cem. Concr. Compos. 2006, 28, 824–828. [Google Scholar] [CrossRef]
- Yoo, D.-Y.; You, I.; Zi, G.; Lee, S.-J. Effects of carbon nanomaterial type and amount on self-sensing capacity of cement paste. Meas. J. Int. Meas. Confed. 2019, 134. [Google Scholar] [CrossRef]
- Ostrowski, K.; Dudek, M.; Sadowski, Ł. Compressive behaviour of concrete-filled carbon fiber-reinforced polymer steel composite tube columns made of high performance concrete. Compos. Struct. 2020, 234. [Google Scholar] [CrossRef]
- Yan, Y.; Liang, H.; Lu, Y.; Huang, Y. Behaviour of concrete-filled steel-tube columns strengthened with high-strength CFRP textile grid-reinforced high-ductility engineered cementitious composites. Constr. Build. Mater. 2020, 2020, 121283. [Google Scholar] [CrossRef]
- Huang, Z.; Zhao, Y.; Zhang, J.; Wu, Y. Punching shear behaviour of concrete slabs reinforced with CFRP grids. Structures 2020, 26, 617–625. [Google Scholar] [CrossRef]
- Wang, B.; Wang, Z.; Uji, K. Experimental verification of a novel anchorage method of CFRP grid in mortar. Structures 2020, 28, 1646–1660. [Google Scholar] [CrossRef]
- Sayed Ahmad, F.; Foret, G.; Le Roy, R. Bond between carbon fibre-reinforced polymer (CFRP) bars and ultra high performance fibre reinforced concrete (UHPFRC): Experimental study. Constr. Build. Mater. 2011, 25, 479–485. [Google Scholar] [CrossRef]
- Dong, Z.; Wu, G.; Zhao, X.L.; Zhu, H.; Shao, X. Behaviors of hybrid beams composed of seawater sea-sand concrete (SWSSC) and a prefabricated UHPC shell reinforced with FRP bars. Constr. Build. Mater. 2019, 213, 32–42. [Google Scholar] [CrossRef]
- Chung, D.D. Dispersion of Short Fibers in Cement. J. Mater. Civ. Eng. 2005, 17, 379–383. [Google Scholar] [CrossRef]
- Song, W.; Yin, J. Hybrid effect evaluation of steel fiber and carbon fiber on the performance of the fiber reinforced concrete. Materials 2016, 9, 704. [Google Scholar] [CrossRef] [Green Version]
- Li, Y.F.; Yang, T.H.; Kuo, C.Y.; Tsai, Y.K. A study on improving the mechanical performance of carbon-fiber-reinforced cement. Materials 2019, 12, 2715. [Google Scholar] [CrossRef] [Green Version]
- Wei, H.; Wu, T.; Yang, X. Properties of lightweight aggregate concrete reinforced with carbon and/or polypropylene fibers. Materials 2020, 13, 640. [Google Scholar] [CrossRef] [PubMed] [Green Version]
- Han, B.; Zhang, L.; Zhang, C.; Wang, Y.; Yu, X.; Ou, J. Reinforcement effect and mechanism of carbon fibers to mechanical and electrically conductive properties of cement-based materials. Constr. Build. Mater. 2016, 125, 479–489. [Google Scholar] [CrossRef] [Green Version]
- Chiarello, M.; Zinno, R. Electrical conductivity of self-monitoring CFRC. Cem. Concr. Compos. 2005, 27, 463–469. [Google Scholar] [CrossRef]
- Han, B.; Guan, X.; Ou, J. Electrode design, measuring method and data acquisition system of carbon fiber cement paste piezoresistive sensors. Sensors Actuators A Phys. 2007, 135, 360–369. [Google Scholar] [CrossRef]
- Han, B.; Ding, S.; Yu, X. Intrinsic self-sensing concrete and structures: A review. Meas. J. Int. Meas. Confed. 2015, 59, 110–128. [Google Scholar] [CrossRef]
- Azhari, F.; Banthia, N. A 3D percolation model for conductive fibrous composites: Application in cement-based sensors. J. Mater. Sci. 2015, 50, 5817–5821. [Google Scholar] [CrossRef]
Figure 1.
Carbon fiber (CF) bundles with different lengths and their length verifications; (a) 4 mm CF (L04), (b) 6 mm CF (L06), (c) 10 mm CF (L10), and (d) probability density of the different CF lengths obtained by image analysis.
Figure 1.
Carbon fiber (CF) bundles with different lengths and their length verifications; (a) 4 mm CF (L04), (b) 6 mm CF (L06), (c) 10 mm CF (L10), and (d) probability density of the different CF lengths obtained by image analysis.

Figure 2.
Schematic diagram of the probe configurations of the cement composites; (a–c) cement composites with different electrode spacings in the two-probe configuration and (d) cement composite with 10 mm electrode spacing in the four-probe configuration. L04, L06, and L10 correspond to the CF filament lengths of 4, 6, and 10 mm, respectively. In Figure 2a–c, 2E10, 2E25, and 2E40 indicate the electrode spacings of 10, 25, and 40 mm, respectively, in the two-probe configuration. In Figure 2d, 4E10 indicates the electrode spacing of 10 mm in the four-probe configuration.

Figure 3.
Variation in resistivity of cement composites as a function of the curing age for the two-probe configuration; (a–c) electrode spacing of 10 mm, (d–f) electrode spacing of 25 mm, and (g–i) electrode spacing of 40 mm. L04, L06, and L10 correspond to the carbon fiber (CF) lengths of 4, 6, and 10 mm, respectively. 2E10, 2E25, and 2E40 indicate the electrode spacings of 10, 25, and 40 mm, respectively. CF0.1–2.0 indicate the CF content (0.1–2%) incorporated into the cement composites.

Figure 4.
Resistivity of cement composites after 28 days of curing measured through the two-probe configuration for different electrode spacings and carbon fiber (CF) lengths of (a) 4 mm (L04), (b) 6 mm (L06), and (c) 10 mm (L10). CF0.1–2.0 indicate the CF content (0.1–2%) incorporated into the cement composites.

Figure 5.
Change in resistivity of cement composites as a function of the carbon fiber (CF) content measured by the two-probe configuration for different CF lengths and electrode spacings of (a) 10 mm (2E10), (b) 25 mm (2E25), and (c) 40 mm (2E40). L04, L06, and L10 correspond to the CF filament lengths of 4, 6, and 10 mm, respectively.

Figure 6.
Resistivity of cement composites as a function of the curing age measured via four-probe configuration for different carbon fiber (CF) contents and electrode spacing of 10 mm (4E10) for CF lengths of (a) 4 mm, (b) 6 mm, and (c) 10 mm. L04, L06, and L10 correspond to the CF lengths of 4, 6, and 10 mm, respectively. CF0.1–2.0 indicate the CF content (0.1–2%) incorporated into the cement composites.

Figure 7.
Resistivity of cement composites measured via four-probe configuration as a function of the carbon fiber (CF) content at the electrode spacing of 10 mm (4E10) for different CF lengths; L04, L06, and L10 correspond to the CF lengths of 4, 6, and 10 mm, respectively.
Figure 7.
Resistivity of cement composites measured via four-probe configuration as a function of the carbon fiber (CF) content at the electrode spacing of 10 mm (4E10) for different CF lengths; L04, L06, and L10 correspond to the CF lengths of 4, 6, and 10 mm, respectively.

Figure 8.
Comparison of resistivity of cement composites as a function of the CF content measured via two- and four-probe configurations corresponding to 10 mm electrode spacing (2E10 and 4E10) and CF lengths of (a) 4 mm (L04), (b) 6 mm (L06), and (c) 10 mm (L10).
Figure 8.
Comparison of resistivity of cement composites as a function of the CF content measured via two- and four-probe configurations corresponding to 10 mm electrode spacing (2E10 and 4E10) and CF lengths of (a) 4 mm (L04), (b) 6 mm (L06), and (c) 10 mm (L10).


Table 1.
Chemical compositions of ordinary Portland cement (OPC) and silica fume (SF).
| Binders | CaO | SiO2 | Al2O3 | Fe2O3 | MgO | Na2O | K2O | SO3 |
|---|---|---|---|---|---|---|---|---|
| OPC | 65.30 | 18.80 | 4.18 | 3.72 | 2.43 | 0.15 | 1.10 | 3.28 |
| SF | 0.67 | 92.60 | 0.07 | 0.49 | 1.80 | 0.02 | 1.13 | 0.12 |
Table 2.
Resistivity [Ohm∙cm] of cement composites as a function of the curing age for the two-probe configuration; each resistivity is the average of 3 test samples, and S.D. stands for standard deviation.
Table 2.
Resistivity [Ohm∙cm] of cement composites as a function of the curing age for the two-probe configuration; each resistivity is the average of 3 test samples, and S.D. stands for standard deviation.
| Mixture ID | 7 Days | 14 Days | 21 Days | 28 Days | ||||
|---|---|---|---|---|---|---|---|---|
| Resistivity | S.D. | Resistivity | S.D. | Resistivity | S.D. | Resistivity | S.D. | |
| L04-2E10-CF0.1 | 482.62 | 1.63 | 1010.59 | 2.65 | 1461.56 | 0.55 | 2949.77 | 20.21 |
| L06-2E10-CF0.1 | 438.55 | 2.84 | 874.03 | 0.56 | 1439.73 | 4.46 | 2278.57 | 10.36 |
| L10-2E10-CF0.1 | 178.57 | 1.47 | 308.50 | 1.35 | 452.79 | 2.30 | 735.29 | 3.33 |
| L04-2E25-CF0.1 | 252.19 | 4.36 | 1095.29 | 42.09 | 1274.35 | 100.92 | 2047.92 | 45.97 |
| L06-2E25-CF0.1 | 251.45 | 7.09 | 516.40 | 20.35 | 791.12 | 14.75 | 1510.21 | 9.08 |
| L10-2E25-CF0.1 | 165.45 | 3.34 | 282.30 | 7.37 | 409.52 | 12.10 | 619.95 | 28.78 |
| L04-2E40-CF0.1 | 454.55 | 65.28 | 1107.27 | 45.61 | 1664.42 | 199.96 | 2846.45 | 366.35 |
| L06-2E40-CF0.1 | 278.77 | 2.24 | 807.10 | 14.46 | 1716.76 | 78.64 | 2679.78 | 17.11 |
| L10-2E40-CF0.1 | 309.94 | 25.01 | 649.55 | 79.22 | 1226.74 | 11.15 | 1804.18 | 8.92 |
| L04-2E10-CF0.5 | 155.55 | 1.05 | 260.54 | 1.32 | 331.05 | 4.03 | 381.74 | 7.65 |
| L06-2E10-CF0.5 | 152.79 | 0.62 | 302.27 | 1.43 | 447.76 | 4.20 | 555.37 | 6.12 |
| L10-2E10-CF0.5 | 102.70 | 0.35 | 146.20 | 0.08 | 167.80 | 1.67 | 797.13 | 0.90 |
| L04-2E25-CF0.5 | 84.09 | 2.14 | 125.24 | 8.55 | 131.75 | 11.62 | 187.17 | 4.17 |
| L06-2E25-CF0.5 | 130.93 | 1.64 | 171.38 | 0.60 | 259.17 | 2.20 | 286.77 | 0.43 |
| L10-2E25-CF0.5 | 45.26 | 0.41 | 71.02 | 2.09 | 75.33 | 2.15 | 82.89 | 0.99 |
| L04-2E40-CF0.5 | 56.58 | 2.72 | 85.97 | 6.24 | 95.31 | 7.68 | 108.80 | 1.14 |
| L06-2E40-CF0.5 | 58.11 | 0.20 | 82.92 | 4.20 | 92.24 | 3.61 | 99.45 | 2.29 |
| L10-2E40-CF0.5 | 39.87 | 1.33 | 69.95 | 0.42 | 79.91 | 5.22 | 85.06 | 4.53 |
| L04-2E10-CF1.0 | 93.70 | 0.71 | 151.75 | 1.86 | 160.61 | 2.33 | 174.90 | 2.22 |
| L06-2E10-CF1.0 | 110.18 | 0.43 | 165.52 | 1.57 | 183.64 | 1.86 | 176.16 | 1.71 |
| L10-2E10-CF1.0 | 66.49 | 2.37 | 93.92 | 1.78 | 98.98 | 1.77 | 104.40 | 1.87 |
| L04-2E25-CF1.0 | 57.22 | 3.09 | 70.67 | 2.39 | 76.54 | 3.32 | 80.09 | 3.60 |
| L06-2E25-CF1.0 | 50.97 | 1.24 | 73.08 | 0.66 | 78.03 | 0.74 | 87.96 | 0.13 |
| L10-2E25-CF1.0 | 28.82 | 1.28 | 41.09 | 0.14 | 42.77 | 0.88 | 43.93 | 1.32 |
| L04-2E40-CF1.0 | 29.60 | 2.77 | 40.81 | 1.82 | 50.14 | 0.41 | 50.70 | 0.27 |
| L06-2E40-CF1.0 | 33.02 | 1.56 | 56.21 | 3.55 | 59.89 | 4.06 | 60.46 | 3.34 |
| L10-2E40-CF1.0 | 26.87 | 0.09 | 28.91 | 0.17 | 32.37 | 1.05 | 33.99 | 0.86 |
| L04-2E10-CF1.5 | 47.99 | 0.61 | 57.40 | 0.75 | 64.59 | 0.60 | 66.43 | 0.66 |
| L06-2E10-CF1.5 | 110.18 | 0.43 | 165.52 | 1.57 | 183.64 | 1.86 | 176.16 | 1.71 |
| L10-2E10-CF1.5 | 66.27 | 2.26 | 97.07 | 4.43 | 97.21 | 3.94 | 102.50 | 4.58 |
| L04-2E25-CF1.5 | 41.25 | 2.29 | 54.85 | 2.10 | 53.20 | 1.63 | 57.93 | 2.15 |
| L06-2E25-CF1.5 | 50.73 | 0.42 | 66.79 | 0.07 | 67.68 | 0.79 | 61.51 | 1.19 |
| L10-2E25-CF1.5 | 18.20 | 0.77 | 20.70 | 0.42 | 24.11 | 0.46 | 26.63 | 0.44 |
| L04-2E40-CF1.5 | 27.90 | 0.33 | 35.38 | 0.60 | 36.94 | 0.57 | 40.96 | 0.94 |
| L06-2E40-CF1.5 | 26.55 | 2.34 | 35.93 | 1.16 | 33.98 | 0.64 | 33.03 | 0.46 |
| L10-2E40-CF1.5 | 16.50 | 1.03 | 24.94 | 1.90 | 27.75 | 1.18 | 28.65 | 1.12 |
| L04-2E10-CF2.0 | 13.85 | 0.15 | 13.61 | 0.12 | 21.26 | 0.70 | 16.81 | 0.14 |
| L06-2E10-CF2.0 | 36.50 | 0.28 | 39.40 | 0.26 | 50.11 | 0.16 | 49.89 | 0.16 |
| L10-2E10-CF2.0 | 36.67 | 1.23 | 41.04 | 1.27 | 50.30 | 1.87 | 50.56 | 1.67 |
| L04-2E25-CF2.0 | 13.15 | 0.20 | 13.87 | 0.33 | 17.33 | 0.41 | 17.45 | 0.53 |
| L06-2E25-CF2.0 | 18.59 | 0.67 | 22.21 | 0.14 | 35.92 | 1.50 | 37.56 | 1.11 |
| L10-2E25-CF2.0 | 22.78 | 0.31 | 29.57 | 0.02 | 43.21 | 0.92 | 50.07 | 0.00 |
| L04-2E40-CF2.0 | 9.31 | 0.13 | 9.02 | 0.07 | 21.54 | 0.43 | 24.82 | 0.10 |
| L06-2E40-CF2.0 | 5.94 | 0.32 | 6.15 | 0.43 | 15.01 | 0.23 | 15.02 | 0.98 |
| L10-2E40-CF2.0 | 5.60 | 0.01 | 6.12 | 0.27 | 8.01 | 0.48 | 7.96 | 0.41 |
Table 3.
Resistivity [Ohm∙cm] of cement composites as a function of the curing age for the four-probe configuration; each resistivity is the average of 3 test samples, and S.D. stands for standard deviation.
Table 3.
Resistivity [Ohm∙cm] of cement composites as a function of the curing age for the four-probe configuration; each resistivity is the average of 3 test samples, and S.D. stands for standard deviation.
| Mixture ID | 7 Days | 14 Days | 21 Days | 28 Days | ||||
|---|---|---|---|---|---|---|---|---|
| Resistivity | S.D. | Resistivity | S.D. | Resistivity | S.D. | Resistivity | S.D. | |
| L04-4E10-CF0.5 | 225.21 | 184.30 | 249.31 | 182.93 | 290.19 | 195.22 | 286.05 | 205.15 |
| L06-4E10-CF0.5 | 111.28 | 71.07 | 178.34 | 78.80 | 183.01 | 89.74 | 177.04 | 89.75 |
| L10-4E10-CF0.5 | 242.40 | 96.21 | 267.67 | 93.00 | 226.16 | 69.07 | 220.29 | 69.20 |
| L04-4E10-CF1.0 | 38.23 | 0.98 | 34.66 | 2.70 | 32.31 | 0.82 | 26.31 | 1.30 |
| L06-4E10-CF1.0 | 68.20 | 10.27 | 67.55 | 12.02 | 62.89 | 9.89 | 56.76 | 9.80 |
| L10-4E10-CF1.0 | 70.42 | 15.84 | 68.14 | 16.54 | 66.71 | 17.22 | 60.11 | 17.86 |
| L04-4E10-CF1.5 | 29.52 | 1.28 | 26.35 | 2.91 | 25.36 | 2.13 | 19.15 | 1.71 |
| L06-4E10-CF1.5 | 44.92 | 0.44 | 52.35 | 2.88 | 54.22 | 2.41 | 48.46 | 2.37 |
| L10-4E10-CF1.5 | 57.84 | 13.34 | 57.79 | 15.95 | 61.42 | 21.25 | 54.18 | 20.48 |
| L04-4E10-CF2.0 | 21.09 | 2.83 | 20.12 | 1.92 | 19.48 | 2.28 | 13.53 | 2.32 |
| L06-4E10-CF2.0 | 36.58 | 4.38 | 40.54 | 5.59 | 36.64 | 4.24 | 30.55 | 4.25 |
| L10-4E10-CF2.0 | 52.21 | 9.01 | 47.48 | 7.82 | 44.82 | 8.64 | 38.91 | 8.09 |
Publisher’s Note: MDPI stays neutral with regard to jurisdictional claims in published maps and institutional affiliations. |
© 2020 by the authors. Licensee MDPI, Basel, Switzerland. This article is an open access article distributed under the terms and conditions of the Creative Commons Attribution (CC BY) license (http://creativecommons.org/licenses/by/4.0/).
Share and Cite
MDPI and ACS Style
You, I.; Lee, S.-J.; Zi, G.; Lim, D. Influence of Carbon Fiber Incorporation on Electrical Conductivity of Cement Composites. Appl. Sci. 2020, 10, 8993. https://0-doi-org.brum.beds.ac.uk/10.3390/app10248993
AMA Style
You I, Lee S-J, Zi G, Lim D. Influence of Carbon Fiber Incorporation on Electrical Conductivity of Cement Composites. Applied Sciences. 2020; 10(24):8993. https://0-doi-org.brum.beds.ac.uk/10.3390/app10248993
Chicago/Turabian StyleYou, Ilhwan, Seung-Jung Lee, Goangseup Zi, and Daehyun Lim. 2020. "Influence of Carbon Fiber Incorporation on Electrical Conductivity of Cement Composites" Applied Sciences 10, no. 24: 8993. https://0-doi-org.brum.beds.ac.uk/10.3390/app10248993
Note that from the first issue of 2016, this journal uses article numbers instead of page numbers. See further details here.