Synthesis and Characterization of Mechanically Alloyed, Nanostructured Cubic MoW Carbide

 , , ,
, , ,
Abstract
:1. Introduction
2. Materials and Methods
2.1. Synthesis
2.2. Structural Analysis
2.3. Desulfurization Analysis
3. Results and Discussion
3.1. Structural and Morphological Properties of the Power Particles
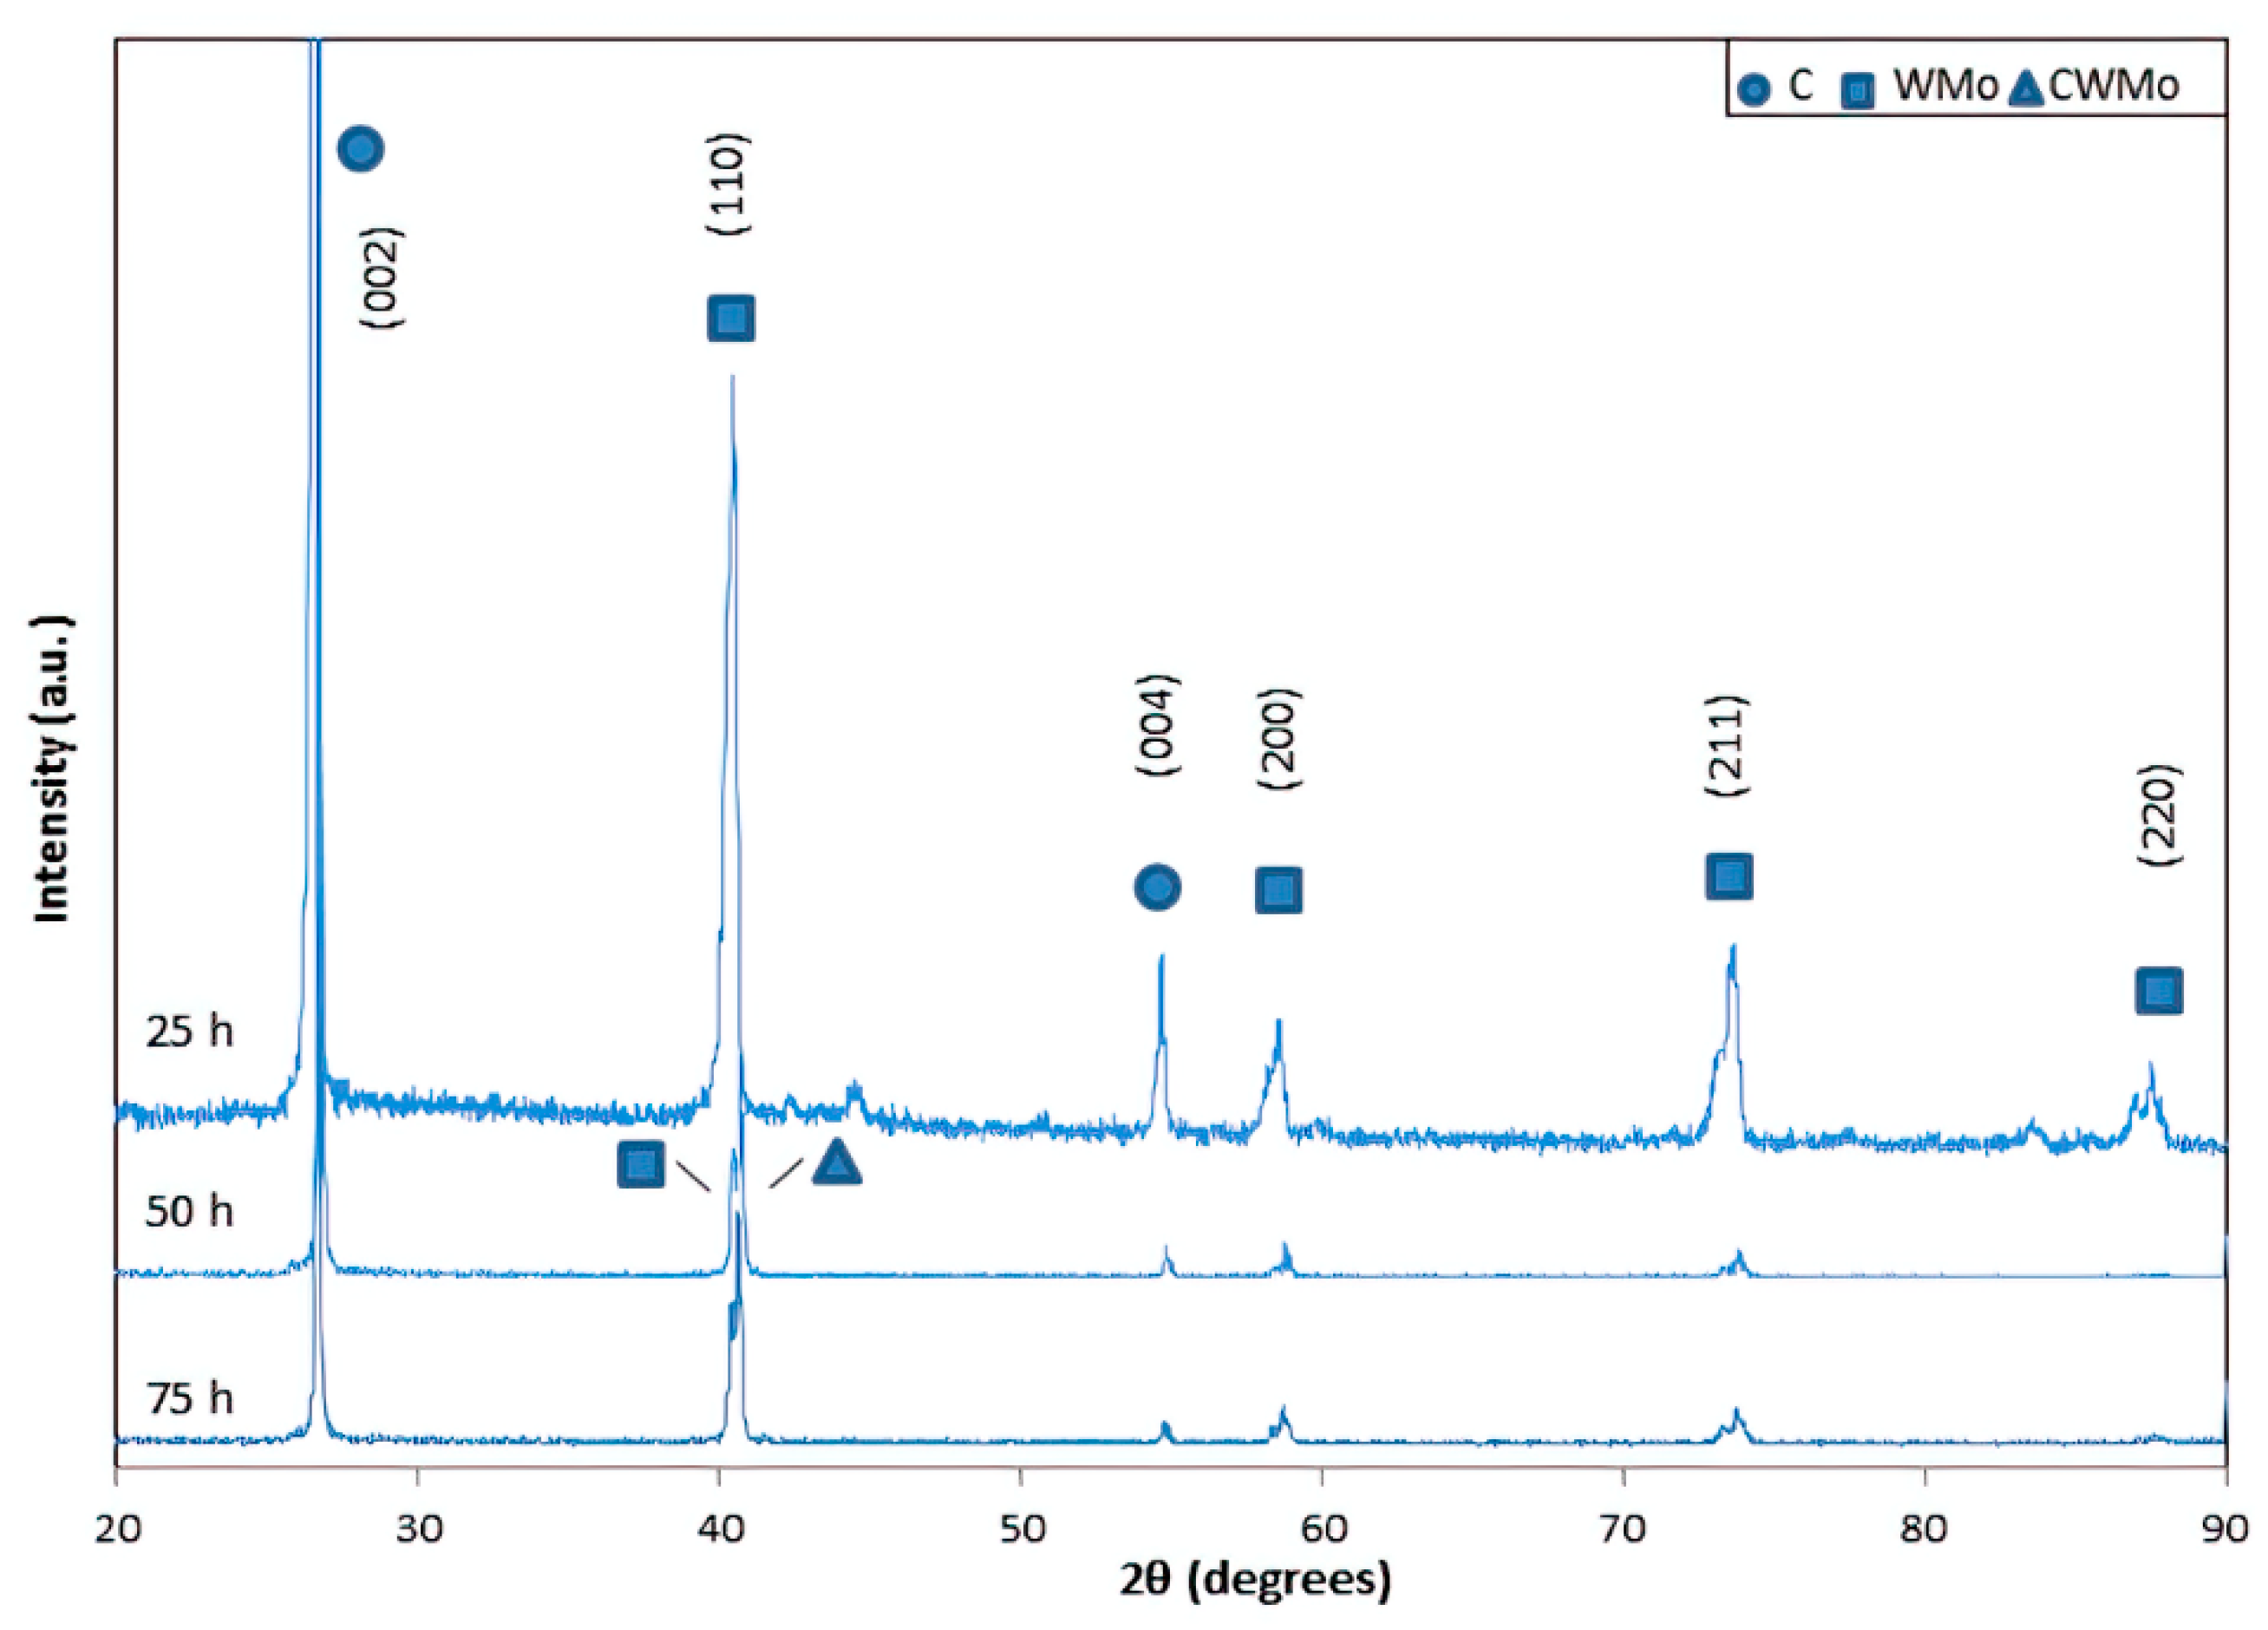
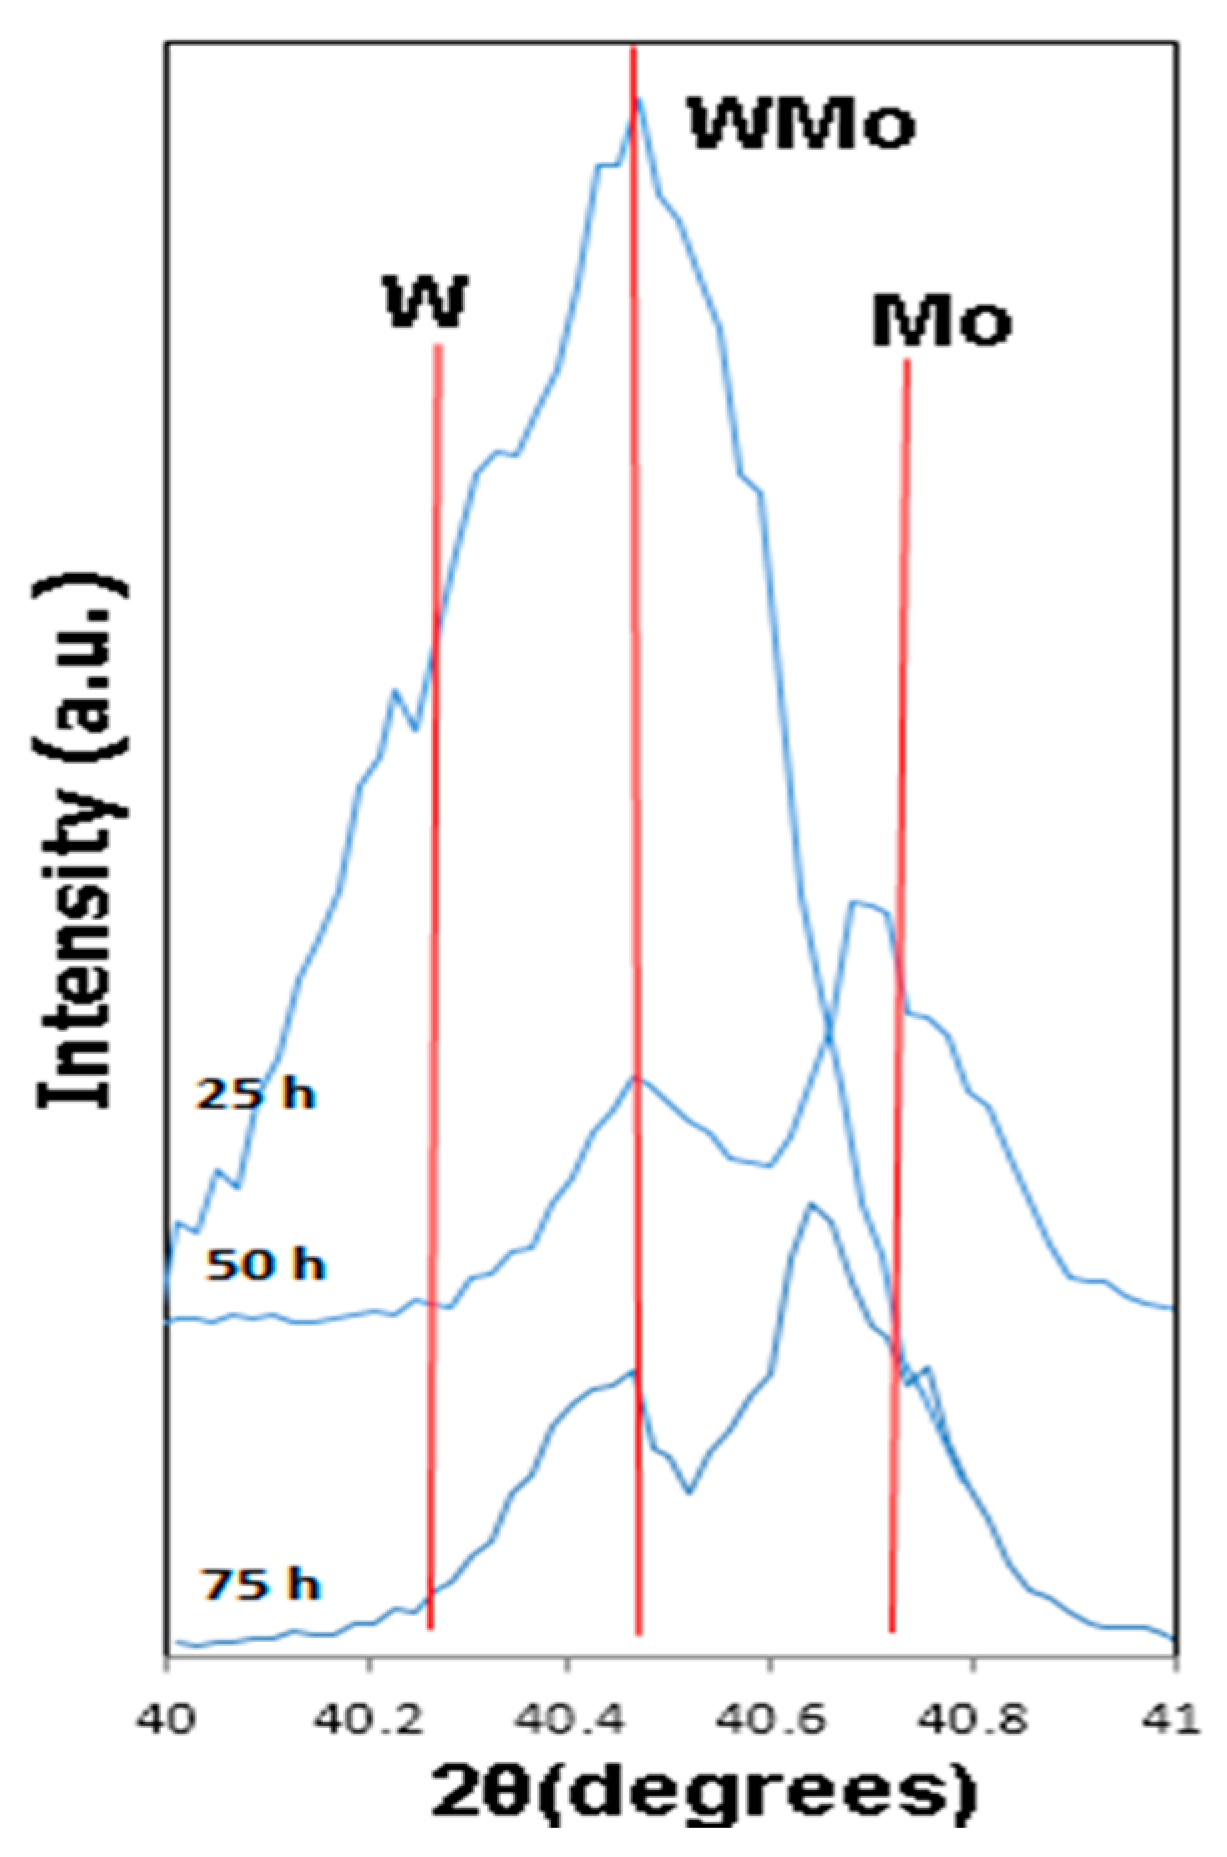
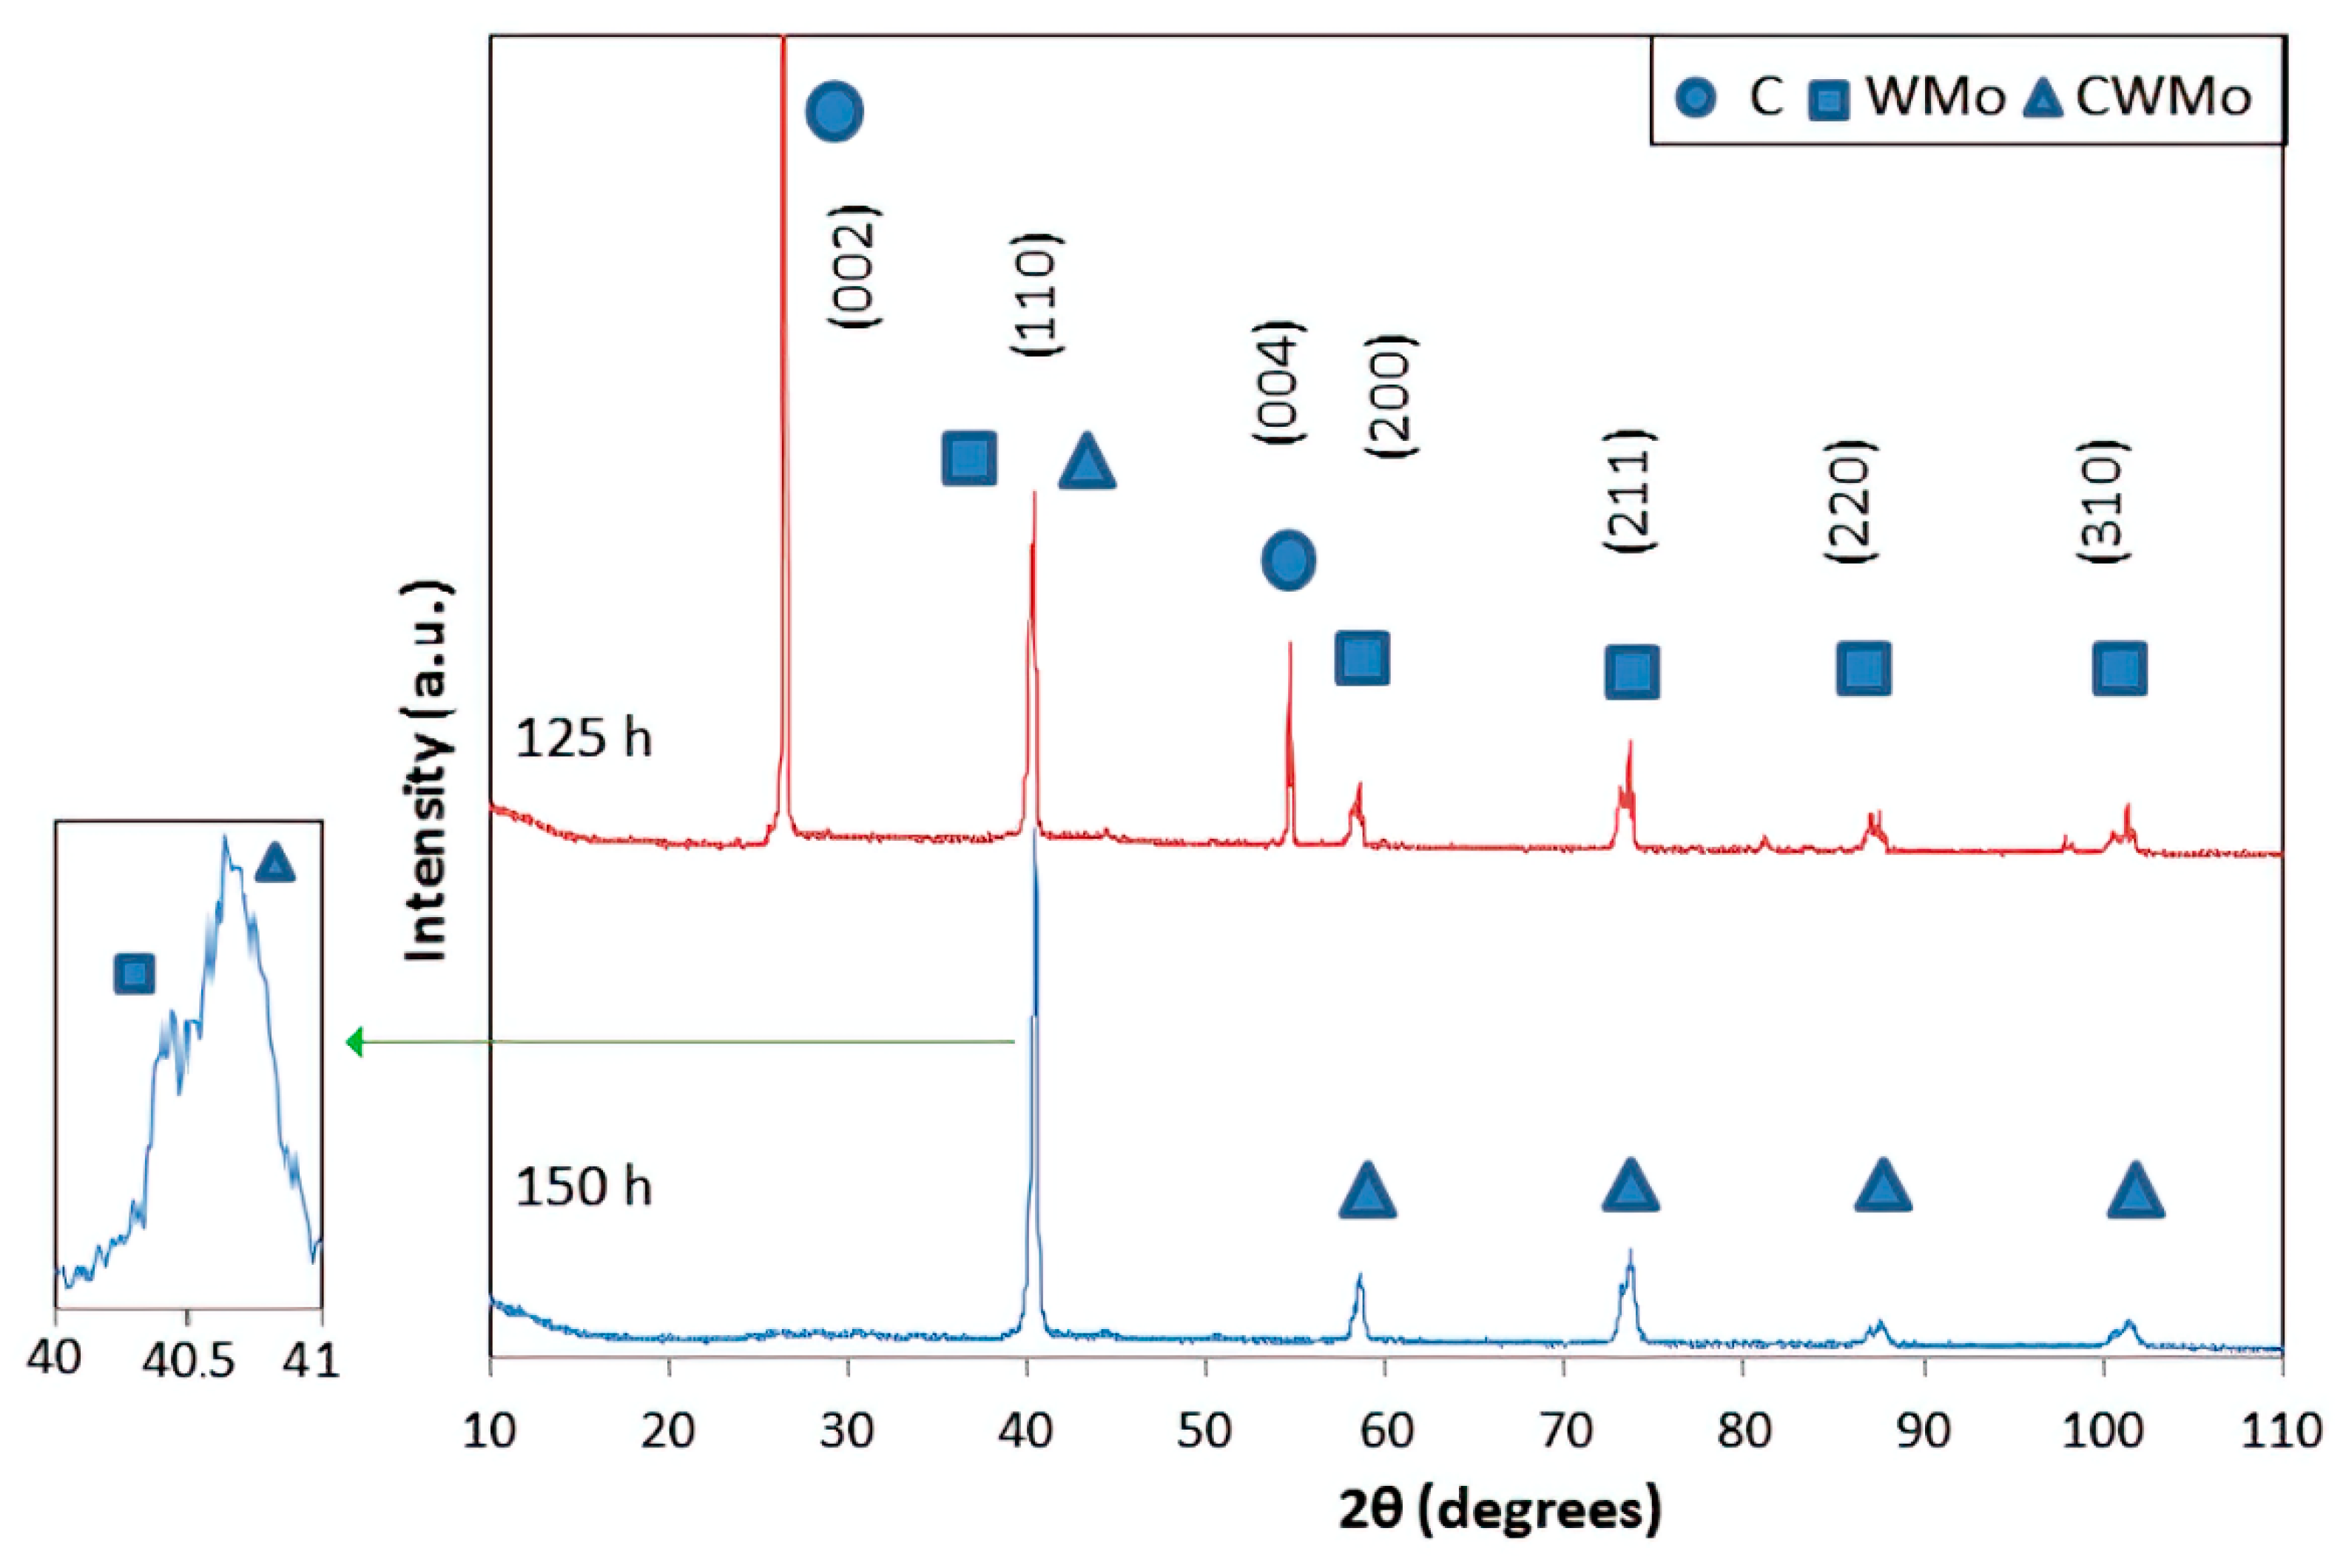
3.1.1. X-ray Diffraction
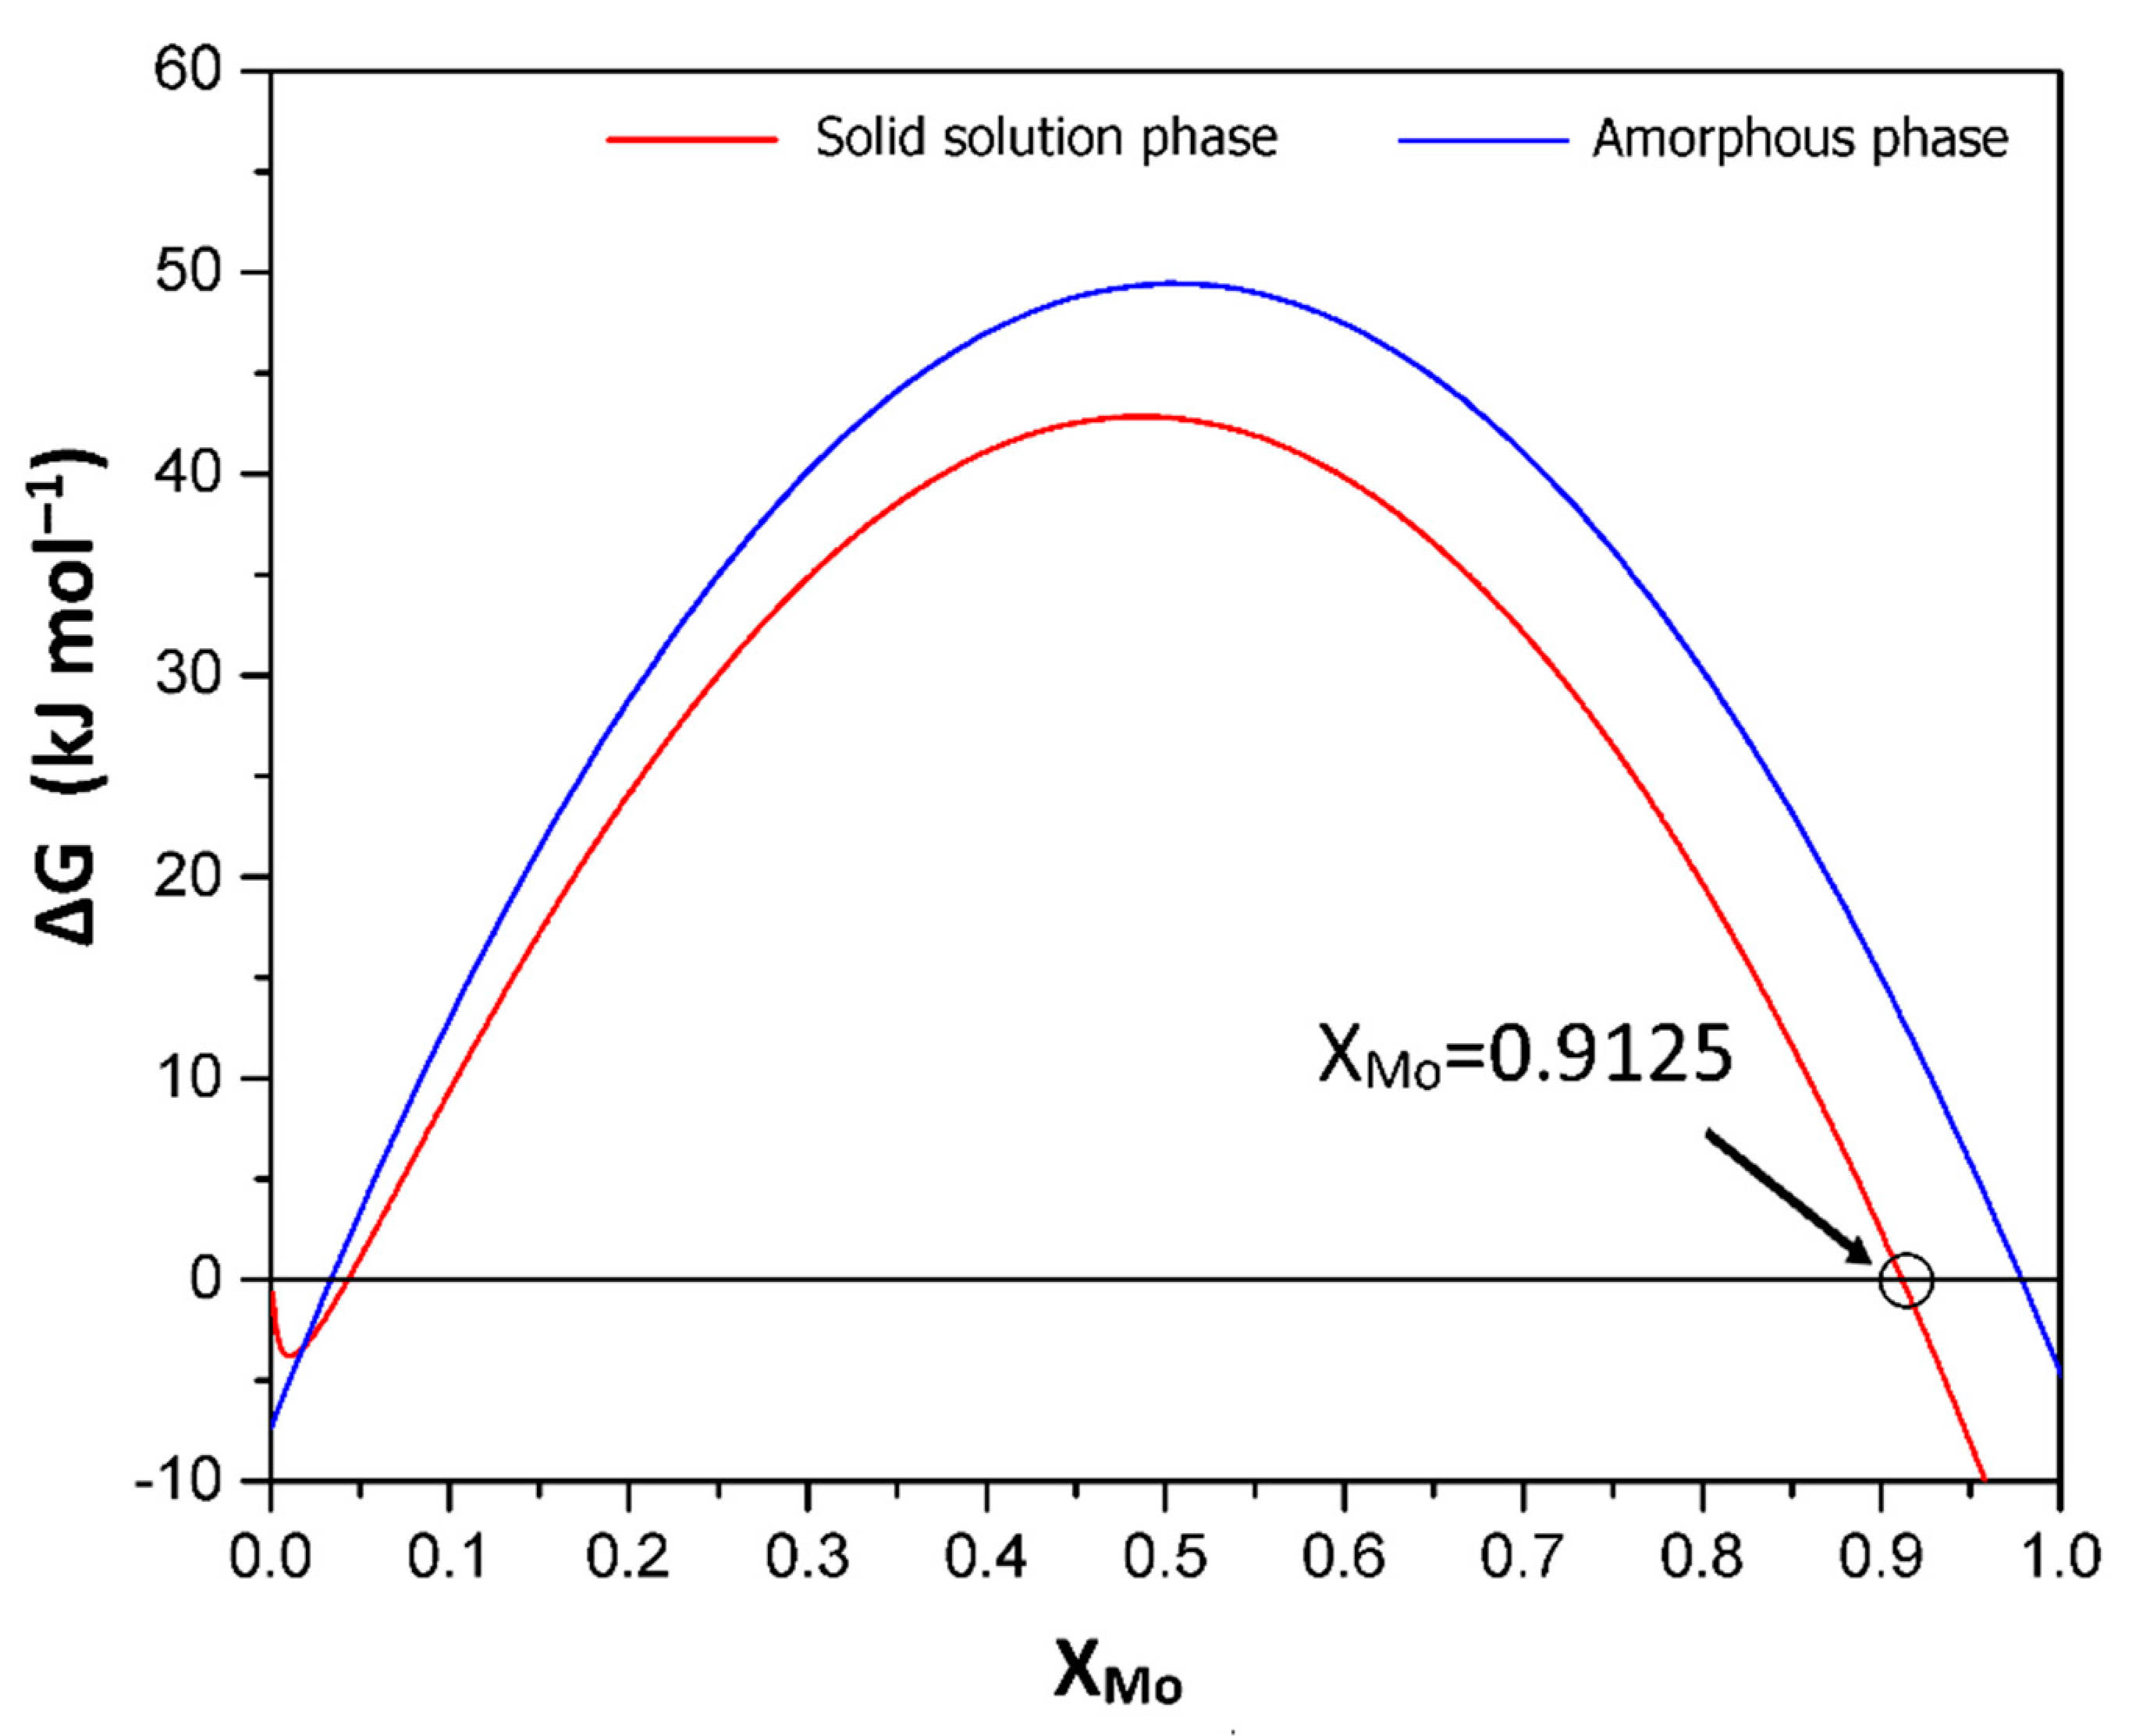
3.1.2. Thermodynamic Analysis for MoW Synthesis during Mechanical Alloying
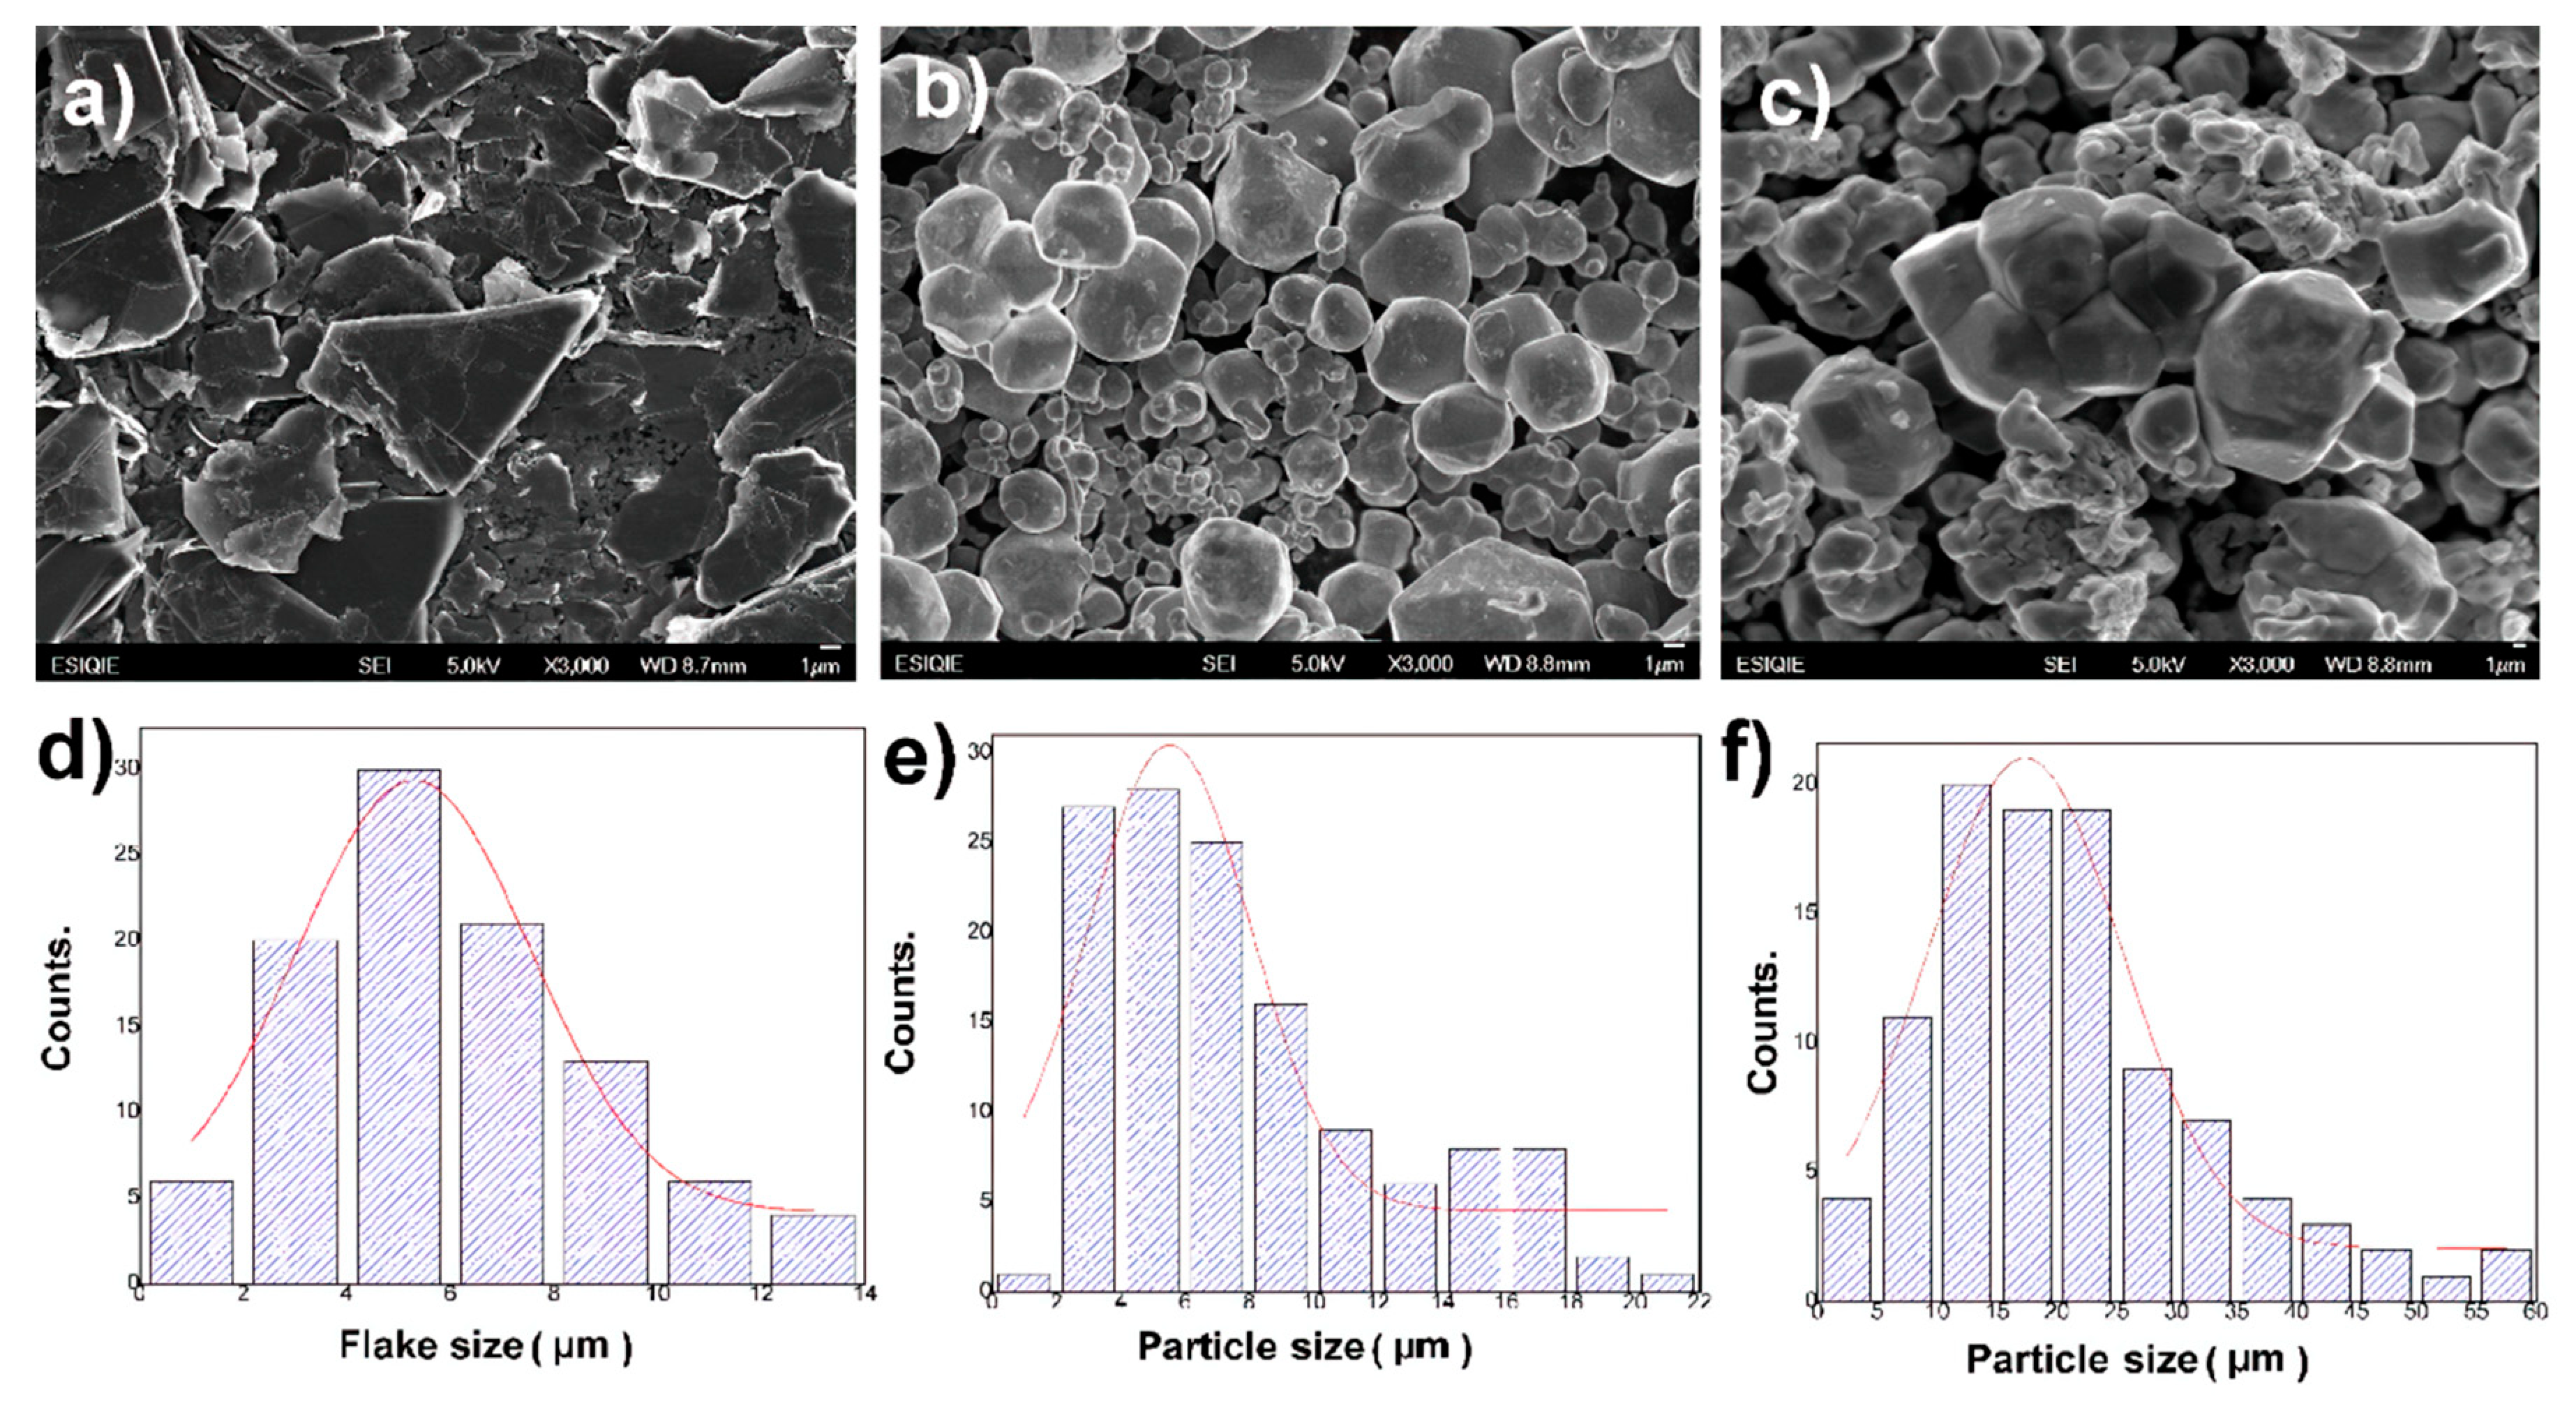
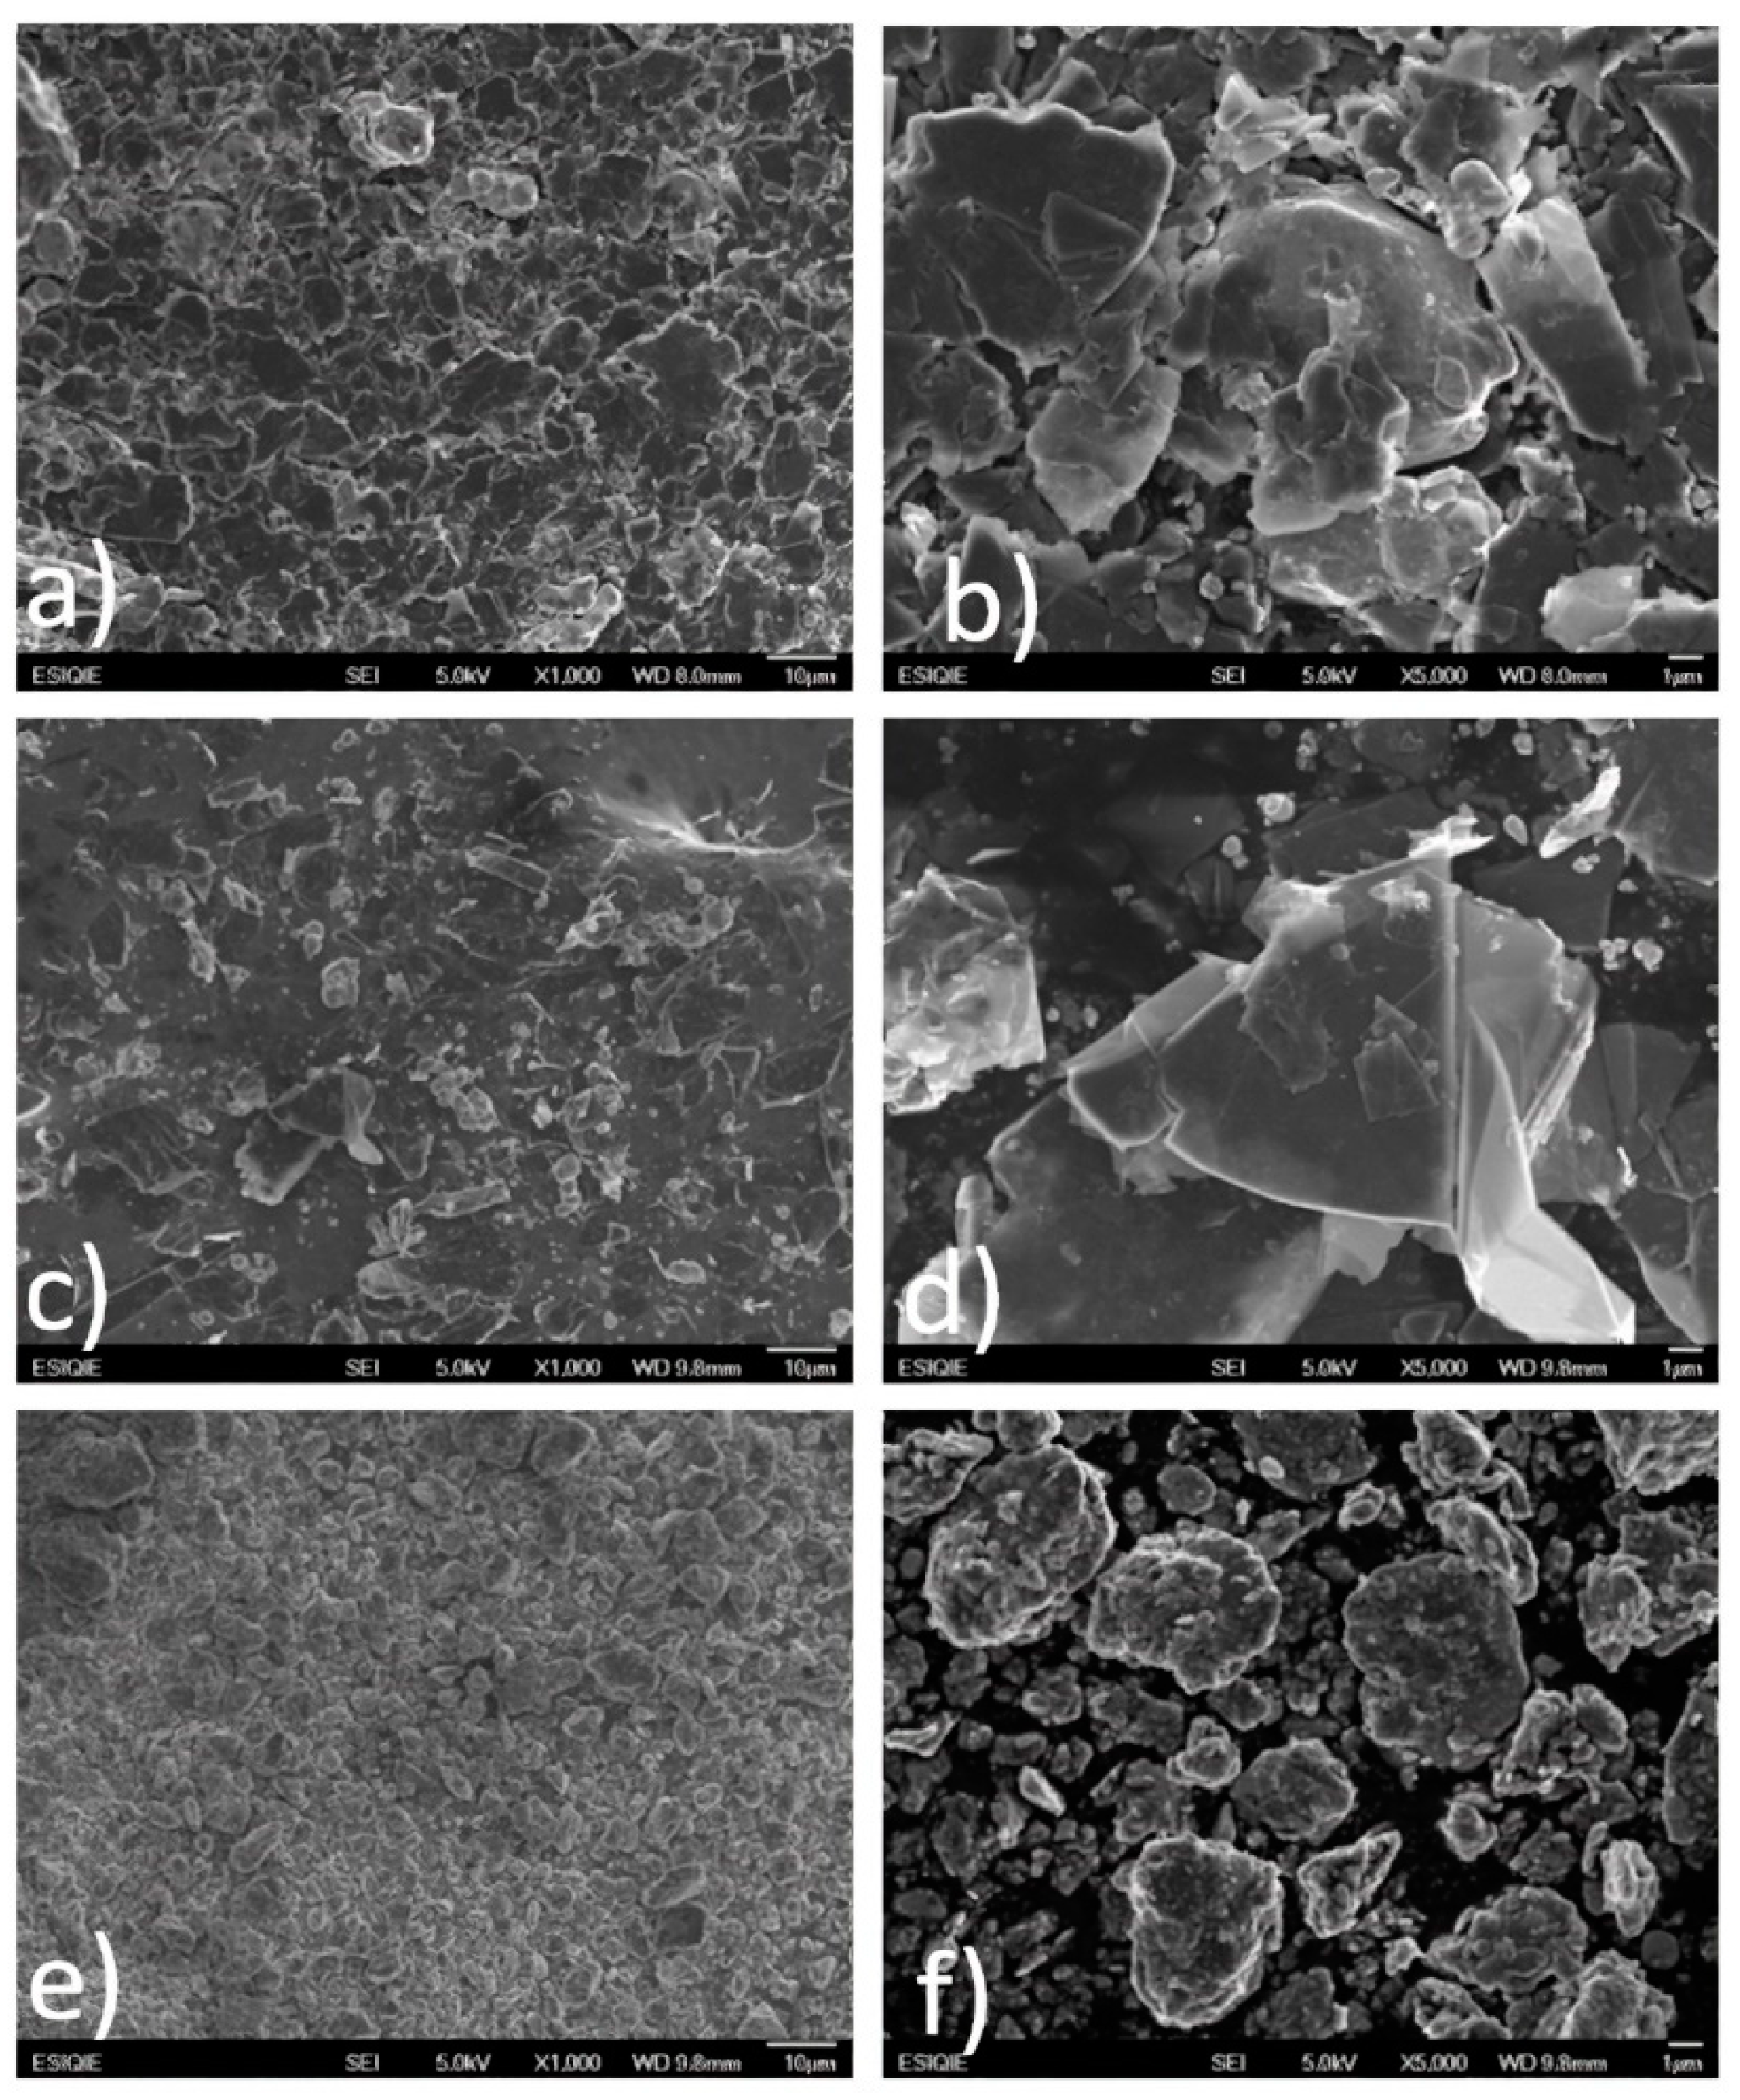
3.1.3. Scanning Electron Microscopy
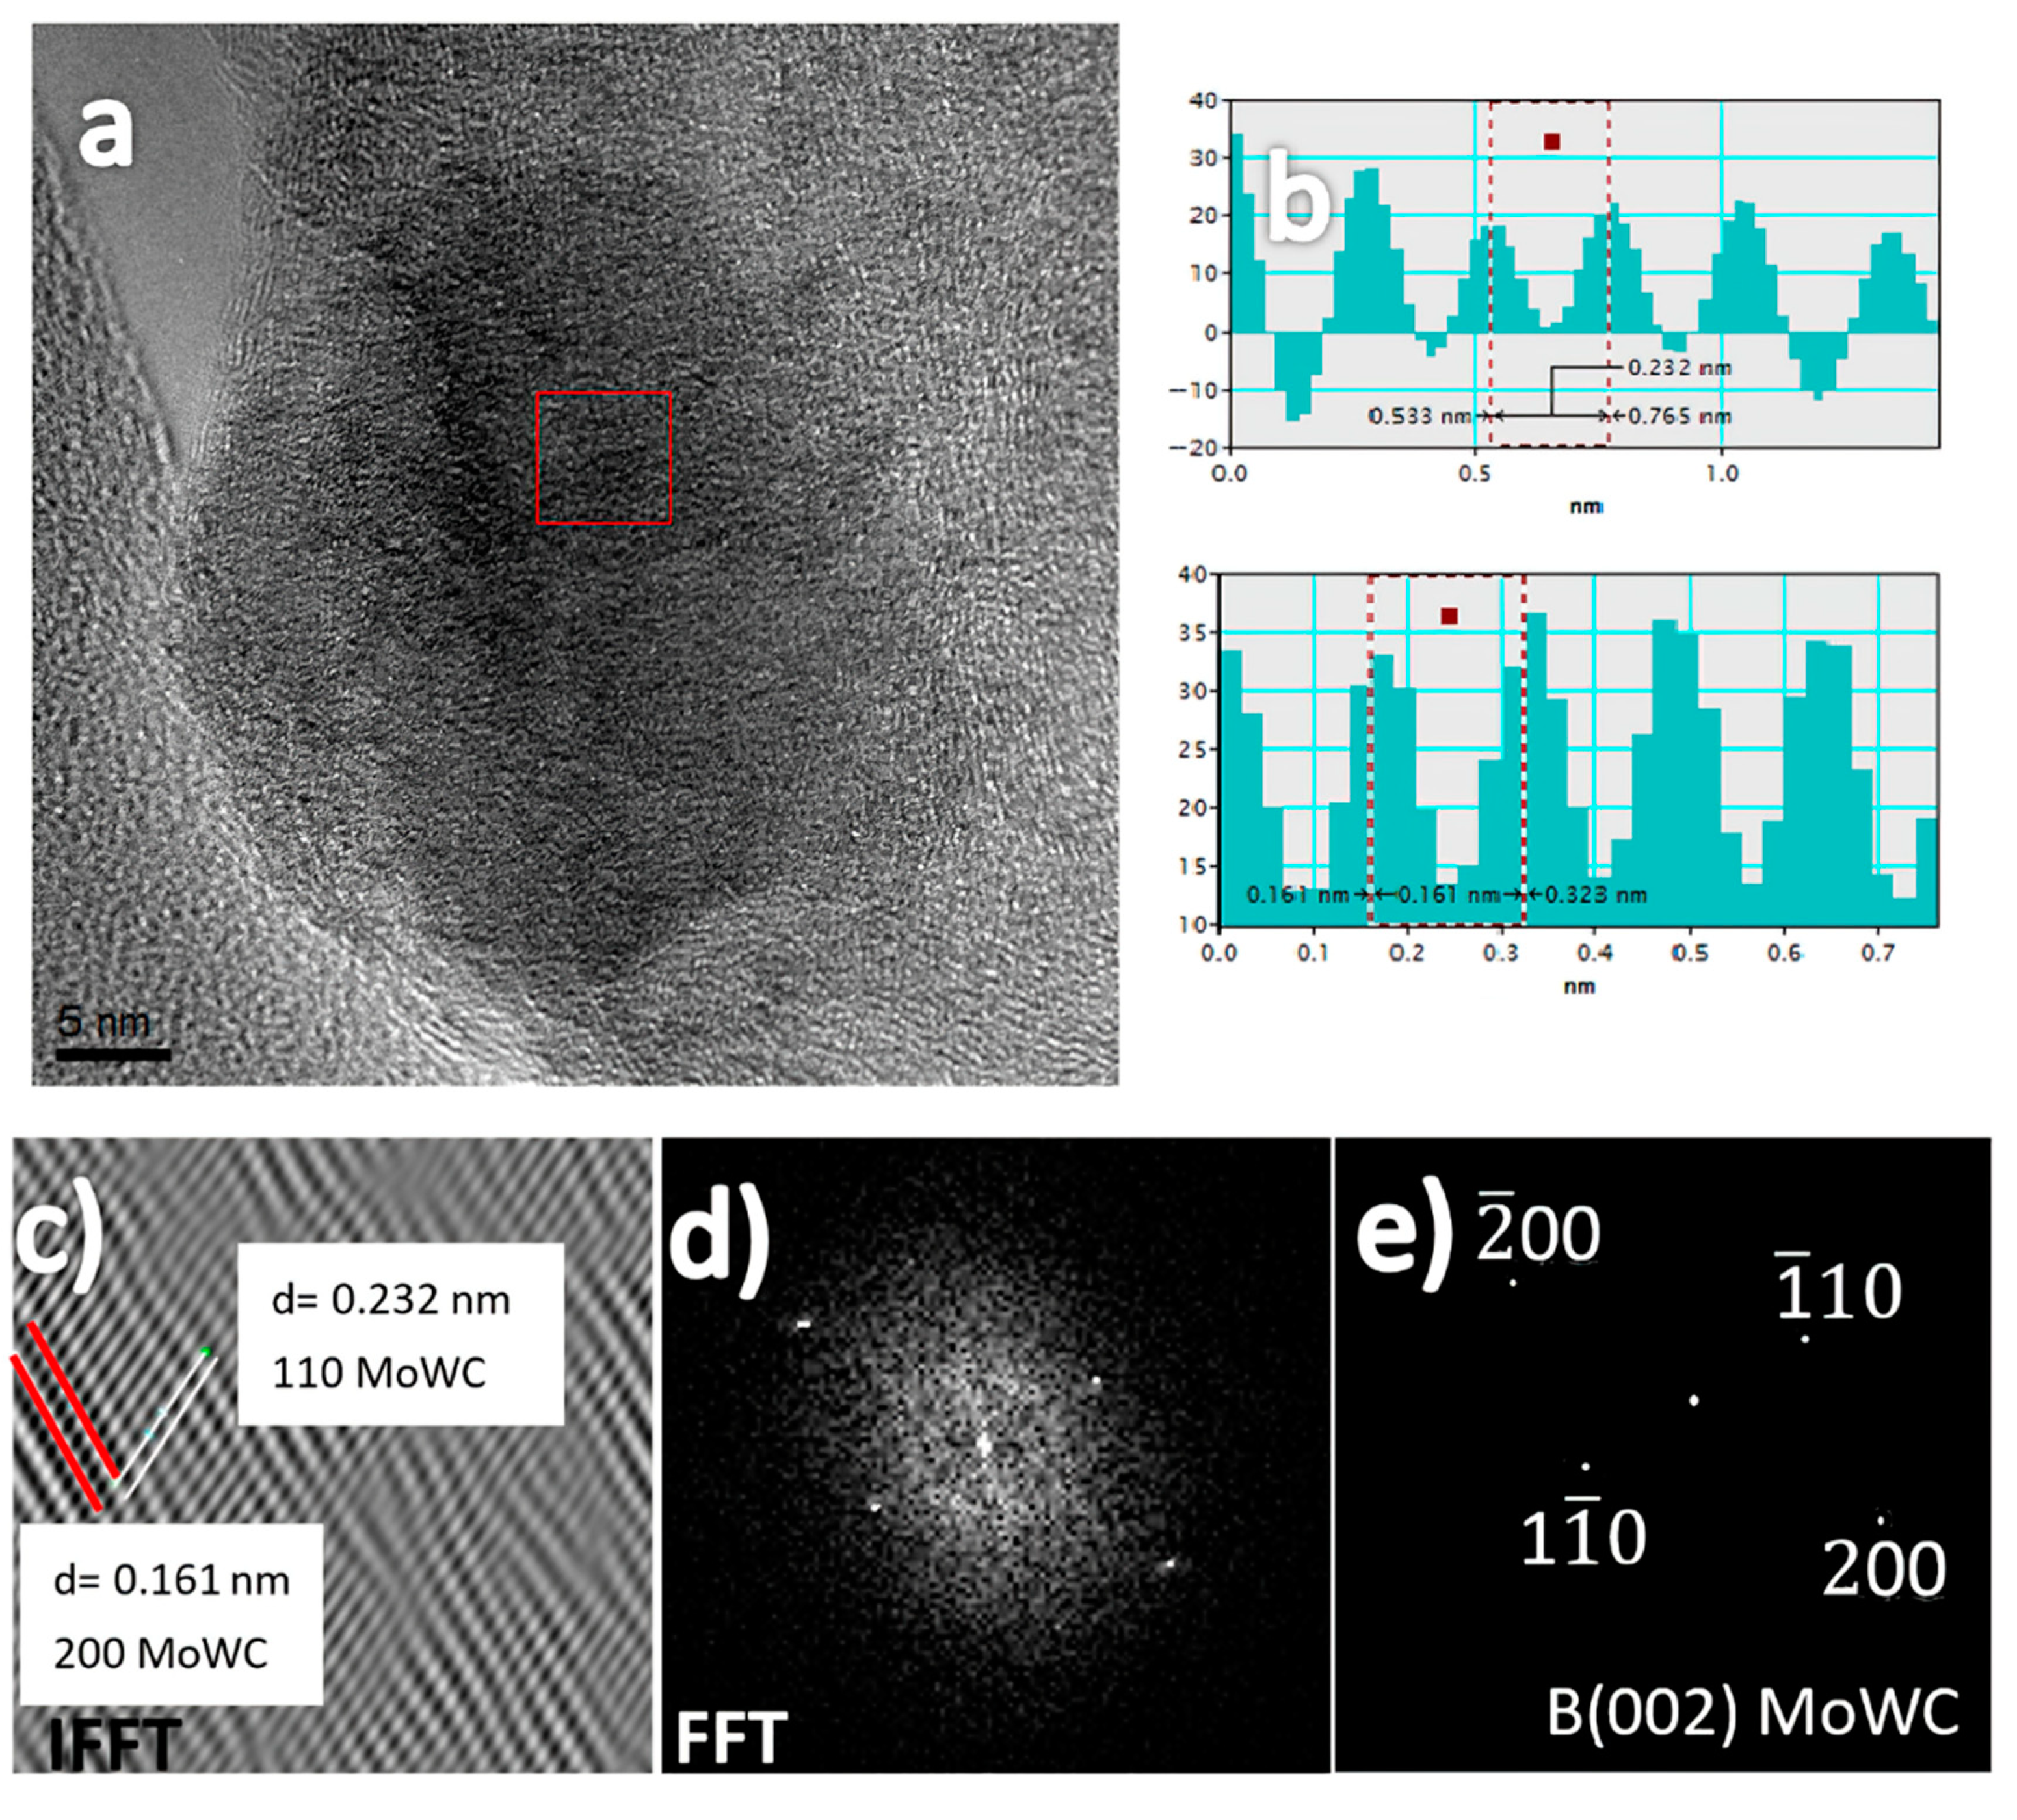
3.1.4. High-Resolution Electron Microscopy
3.2. Vickers Hardness
3.3. Desulfurization Properties
Fourier transform infrared (FTIR) Spectroscopy
4. Conclusions
Author Contributions
Funding
Acknowledgments
Conflicts of Interest
References
- Theofanidis, S.A.; Galvita, V.V.; Konstantopoulos, C.; Poelman, H.; Marin, G.B. Fe-based nano-materials in catalysis. Materials 2018, 11, 831. [Google Scholar] [CrossRef] [PubMed] [Green Version]
- Kalita, D.; Chetia, L.; Ahmed, G.A. Synthesis of MoW-Sulfide compound nanoparticles as a photocatalyst and comparison of its performance with MoS2 and WS2 nanoparticles. J. Environ. Chem. Eng. 2017, 5, 3161–3171. [Google Scholar] [CrossRef]
- Olvera, J.N.R.; Gutiérrez, G.J.; Serrano, J.A.R.; Ovando, A.M.; Febles, V.G.; Arceo, L.D.B. Use of unsupported, mechanically alloyed NiWMoC nanocatalyst to reduce the viscosity of aquathermolysis reaction of heavy oil. Catal. Commun. 2014, 43, 131–135. [Google Scholar] [CrossRef]
- Villasana, Y.; Méndez, F.J.; Luis-Luis, M.; Brito, J.L. Pollutant reduction and catalytic upgrading of a Venezuelan extra-heavy crude oil with Al2O3-supported NiW catalysts: Effect of carburization, nitridation and sulfurization. Fuel 2019, 235, 577–588. [Google Scholar] [CrossRef]
- Díaz de León, J.N.; Castañeda-García, A.L.; Soto-Arteaga, C.E.; Torres-Otañez, G.; Esqueda-Barrón, Y.; Guzmán-Cruz, M.A.; Alonso-Nuñez, G.; Fuentes-Moyado, S. Selective removal of sulfur from 3-methyl thiophene under mild conditions over NiW/Al2O3-TiO2 modified by surfactants. Catal. Today 2020. [Google Scholar] [CrossRef]
- Guo, T.; Huang, P.; Wang, F. Unusual high strain rate sensitivity of amorphous/crystalline NiW composites. Mater. Lett. 2019, 248, 189–192. [Google Scholar] [CrossRef]
- Rivera Olvera, J.N.; Gutiérrez Paredes, G.J.; Romero Serrano, A.; Rivera López, E.; Martínez Franco, E.; Tamayo Meza, P.; Díaz Barriga Arceo, L. Synthesis and characterization of a MoWC-WC-NiC nanocomposite via mechanical alloying and sintering. Powder Technol. 2015, 271, 292–300. [Google Scholar] [CrossRef]
- Li, B.; Zhang, W.; Li, D.; Wang, J. Electrodeposition of Ni[sbnd]W/ZrO2 nanocrystalline film reinforced by CeO2 nanoparticles: Structure, surface properties and corrosion resistance. Mater. Chem. Phys. 2019, 229, 495–507. [Google Scholar] [CrossRef]
- Ashenaeian, S.; Haghighi, M.; Rahemi, N. Hybrid plasma-sono-coprecipitation dispersion of NiMo nanocatalyst over functionalized multiwall carbon nanotube used in hydrodesulfurization of thiophene. Adv. Powder Technol. 2019, 30, 502–512. [Google Scholar] [CrossRef]
- Wu, Z.M.; Liang, Y.X.; Fu, E.G.; Du, J.L.; Wang, P.P. The process and mechanisms for the transformation of coarse grain to nanoscale grain in tungsten by ball milling. Powder Technol. 2018, 326, 222–227. [Google Scholar] [CrossRef]
- Chen, Q.; Liang, S.; Zhang, J.; Zhang, X.; Wang, C.; Song, X.; Zhuo, L. Preparation and characterization of WMo solid solution nanopowders with a wide composition range. J. Alloys Compd. 2020, 823, 153760. [Google Scholar] [CrossRef]
- González, G.; Sagarzazu, A.; Villalba, R.; Ochoa, J. Comparative study of NiW, NiMo and MoW prepared by mechanical alloying. J. Alloys Compd. 2007, 434–435, 525–529. [Google Scholar] [CrossRef]
- Gonzalez, G.; Sagarzazu, A.; Bonyuet, D.; D’Angelo, L.; Villalba, R. Solid state amorphisation in binary systems prepared by mechanical alloying. J. Alloys Compd. 2009, 483, 289–297. [Google Scholar] [CrossRef]
- Ren, C.; Fang, Z.Z.; Koopman, M.; Butler, B.; Paramore, J.; Middlemas, S. Methods for improving ductility of tungsten—A review. Int. J. Refract. Met. Hard Mater. 2018, 75, 170–183. [Google Scholar] [CrossRef]
- Ohser-Wiedemann, R.; Martin, U.; Müller, A.; Schreiber, G. Spark plasma sintering of Mo-W powders prepared by mechanical alloying. J. Alloys Compd. 2013, 560, 27–32. [Google Scholar] [CrossRef]
- Díaz Barriga, L.; González, L.; Rivera, O.J.N.; Medina, O.; Garibay, V. Intercalated intermetallic compounds AlTi3 and Fe2Ti in microrods and microtubes obtained by invariant reaction of mechanically milled system Al43Ti36Fe21. Materials 2019, 12, 3086. [Google Scholar] [CrossRef] [Green Version]
- Suryanarayana, C. Mechanical Alloying and Milling; CRC Press: NewYork, NY, USA, 2004; pp. 22–25. ISBN 9780203020647. [Google Scholar]
- Intrater, J. Mechanical Alloying and Milling: A book review. Mater. Manuf. Process. 2007, 22, 790–791. [Google Scholar] [CrossRef]
- Zaara, K.; Chemingui, M.; Gallet, S.L.; Gaillard, Y.; Escoda, L.; Saurina, J.; Suñol, J.J.; Bernard, F.; Khitouni, M.; Optasanu, V. High-entropy feconib0.5si0.5 alloy synthesized by mechanical alloying and spark plasma sintering. Crystals 2020, 10, 929. [Google Scholar] [CrossRef]
- Wang, Y.; Chen, Y.; He, J.; Li, P.; Yang, C. Mechanism of catalytic aquathermolysis: Influences on heavy oil by two types of efficient catalytic ions: Fe3+ and Mo6+. Energy Fuels 2010, 24, 1502–1510. [Google Scholar] [CrossRef]
- Hu, Y.; Jia, G.; Ma, S.; Hu, J.; Zhu, P.; Cui, T.; Li, Z.; Zou, Z. Hydrogen evolution reaction of γ-Mo0.5W0.5 C achieved by high pressure high temperature synthesis. Catalysts 2016, 6, 208. [Google Scholar] [CrossRef] [Green Version]
- Ma, S.; Bao, K.; Tao, Q.; Huang, X.; Zhu, P.; Cui, T. An ultra-incompressible ternary transition metal carbide. RSC Adv. 2014, 4, 63544–63548. [Google Scholar] [CrossRef]
- Toth, L. Transition Metal Carbides and Nitrides, 1st ed.; Academic Press, Inc.: Cambridge, MA, USA, 1971; ISBN 9780323157223. [Google Scholar]
- Mousavi, T.; Abbasi, M.H.; Karimzadeh, F. Thermodynamic analysis of NiTi formation by mechanical alloying. Mater. Lett. 2009, 63, 786–788. [Google Scholar] [CrossRef]
- Pierson, H.O. Handbook of Refractory Carbides and Nitrides: Properties, Characteristics, Processing, and Applications; Noyes Publication: Westwood, NJ, USA, 1996; ISBN 978 0 8155 1392 6. [Google Scholar]
- Suryanarayana, C.; Grant, N.M. X-rays and Diffraction: A Practical Approach; Springer: New York, NY, USA, 1998; ISBN 978 1 4899 0148 4. [Google Scholar]
- Askeland, D.; Fulay, P.; Wright, W. The Science & Engineering of Materials; Thomson: Stamford, CT, USA, 2010; ISBN 0 495 296 023. [Google Scholar]
- Nishizawa, T. Thermodyn. Microstruct; ASM International: Geauga, OH, USA, 2008; ISBN 1615031286. [Google Scholar]
- Cottrell, S.A. An Introduction to Metallurgy, 2nd ed.; Edward Arnold Publisher: London, UK, 1995; ISBN 0 901716 93 6. [Google Scholar]
- Torkan, S.; Ataie, A.; Abdizadeh, H.; Sheibani, S. Effect of milling energy on preparation of nano-structured Fe70Si30 alloys. Powder Technol. 2014, 267, 145–152. [Google Scholar] [CrossRef]
- Ray, P.K.; Akinc, M.; Kramer, M.J. Applications of an extended Miedema’s model for ternary alloys. J. Alloys Compd. 2010, 489, 357–361. [Google Scholar] [CrossRef]
- Rivera Olvera, J.N.; Acevedo Martínez, J.; Herrera Hernández, H.; García Orozco, I.; Díaz Barriga Arceo, L. Microstructural characterization and thermodynamic analysis of MoZn produced by mechanical alloying. J. Alloys Compd. 2017, 696, 329–337. [Google Scholar] [CrossRef]
- De Boer, F.R.; Boom, R.; Mattens, W.C.M.; Miedema, A.R.; Niessen, A.K. Cohesion in Metals: Transition Metal Alloys; North-Holland Editorial: Amsterdam, The Netherlands, 1989; ISBN 0 44 487098 9. [Google Scholar]
- Al-Joubori, A.A.; Suryanarayana, C. Synthesis of metastable NiGe2 by mechanical alloying. Mater. Des. 2015, 87, 520–526. [Google Scholar] [CrossRef]
- Bermudez-Polonio, J. Métodos de Difraccion de Rayos X: Principios y Aplicaciones; Piramide Editorial: Madrid, Spain, 1981; ISBN 9781624102141. [Google Scholar]
- Cullity, B.D.; Stock, S.R. Elements of X-ray Diffraction, 3rd ed.; Prentice Hall: New York, NY, USA, 2001; ISBN 0201610914. [Google Scholar]
- Martínez, C.; Aguilar, C.; Briones, F.; Guzmán, D.; Zelaya, E.; Troncoso, L.; Rojas, P.A. Effects of Zr on the amorphization of Cu-Ni-Zr alloys prepared by mechanical alloying. J. Alloys Compd. 2018, 765, 771–781. [Google Scholar] [CrossRef]
- Chen, C.L. Suprianto investigation of W-Ti ODS coating on SUS304 steel fabricated by mechanical alloying technique. Surf. Coatings Technol. 2018, 350, 1105–1111. [Google Scholar] [CrossRef]
- Dorfman, M.R. Thermal spray materials. Adv. Mater. Process. 2002, 160, 49–51. [Google Scholar]
- Li, C.; Huang, W.; Zhou, C.; Chen, Y. Advances on the transition-metal based catalysts for aquathermolysis upgrading of heavy crude oil. Fuel 2019, 257, 115779. [Google Scholar] [CrossRef]
- Wu, C.; Lei, G.L.; Yao, C.J.; Gai, P.Y.; Cao, Y.B.; Li, X.N. Mechanism for reducing the viscosity of extra-heavy oil by aquathermolysis with an amphiphilic catalyst. J. Fuel Chem. Technol. 2010, 38, 684–690. [Google Scholar] [CrossRef]
- Jung, Y.; Stevens, E.; Ding, B.; Kim, S.D.; Woo, S.K.; Lee, J.K. Microstructure and electrical conductivity in shape and size controlled molybdenum particle thick film. J. Mater. Sci. 2013, 48, 3760–3768. [Google Scholar] [CrossRef]


| Line | h | k | l | h2 + k2 + l2 | a0 (nm) | dhkl (nm) |
|---|---|---|---|---|---|---|
| 1 | 1 | 1 | 0 | 2 | 0.3149 | 0.2227 |
| 2 | 2 | 0 | 0 | 4 | 0.3149 | 0.1575 |
| 3 | 2 | 1 | 1 | 6 | 0.3149 | 0.1285 |
| 4 | 2 | 2 | 0 | 8 | 0.3147 | 0.1113 |
| 5 | 3 | 1 | 0 | 10 | 0.3146 | 0.0995 |
| Element | a (V) | n1/3ws (d.u. **)1/3 | G (1010 N m−2) | K (1010 N m−2) | Vm (cm3 mol−1) | T (K) |
|---|---|---|---|---|---|---|
| Mo | 4.65 | 1.77 | 2 | 23 | 9.33 | 2896 |
| W | 4.80 | 1.81 | 1.61 | 31 | 9.47 | 3695 |
| Milling Times (h) | Average Particle Size (μm) | Std. Dev. σ (μm) | SEM Micrograph Figure | % Reduction in Average Particle Size | Phases in XRD Patterns | Graphite Peak I/IO Counts (a.u.) of (002) | Ball Mill Energy |
|---|---|---|---|---|---|---|---|
| 0 | 13.54 * | C = 2.8583 | 5a, b, and c | - | C + Mo + W | 150,000 | - |
| Mo = 4.7581 | |||||||
| W = 5.1682 | |||||||
| 75 | 9.32 | 2.6867 | 6a and b | 31.18 | C + MoW + MoWC | 1761 | Low |
| 125 | 5.18 | 2.3547 | 6c and d | 61.74 | C + MoW + MoWC | 3791 | High |
| 150 | 4.86 | 1.5124 | 6e and f | 64.10 | MoW + MoWC | 0 | High |
| Element | %Weight | Element | %Atomic |
|---|---|---|---|
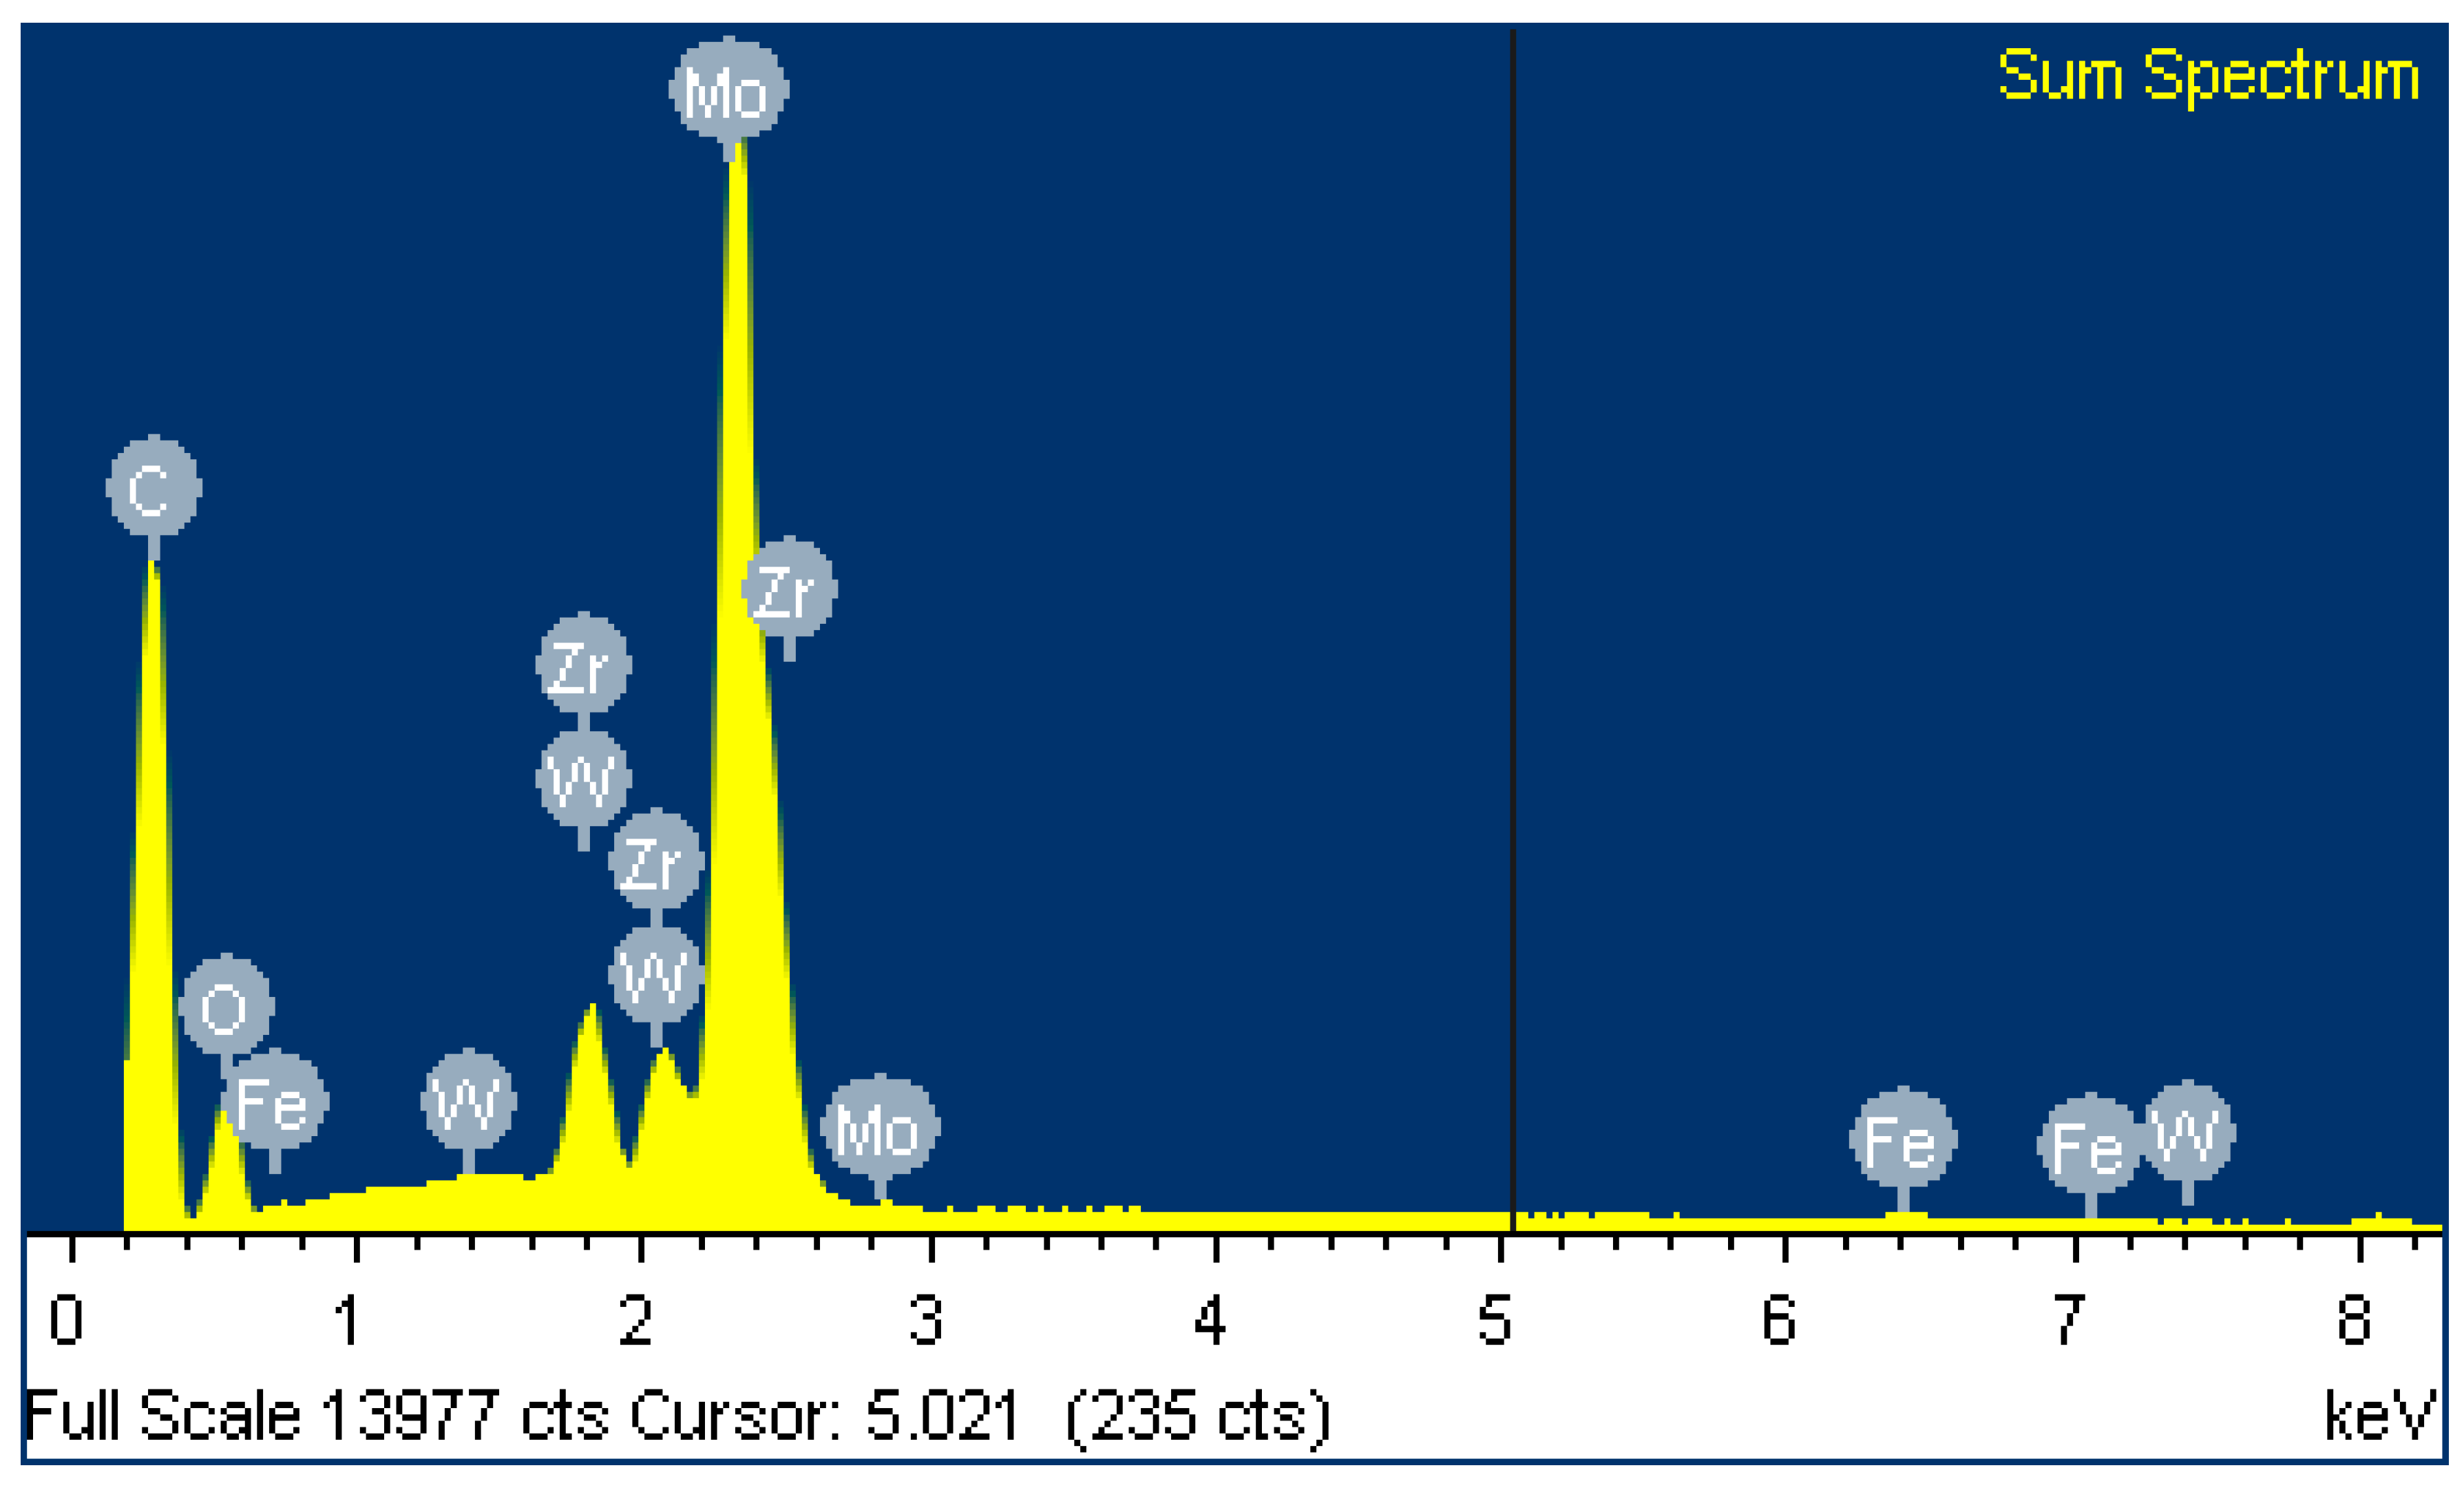
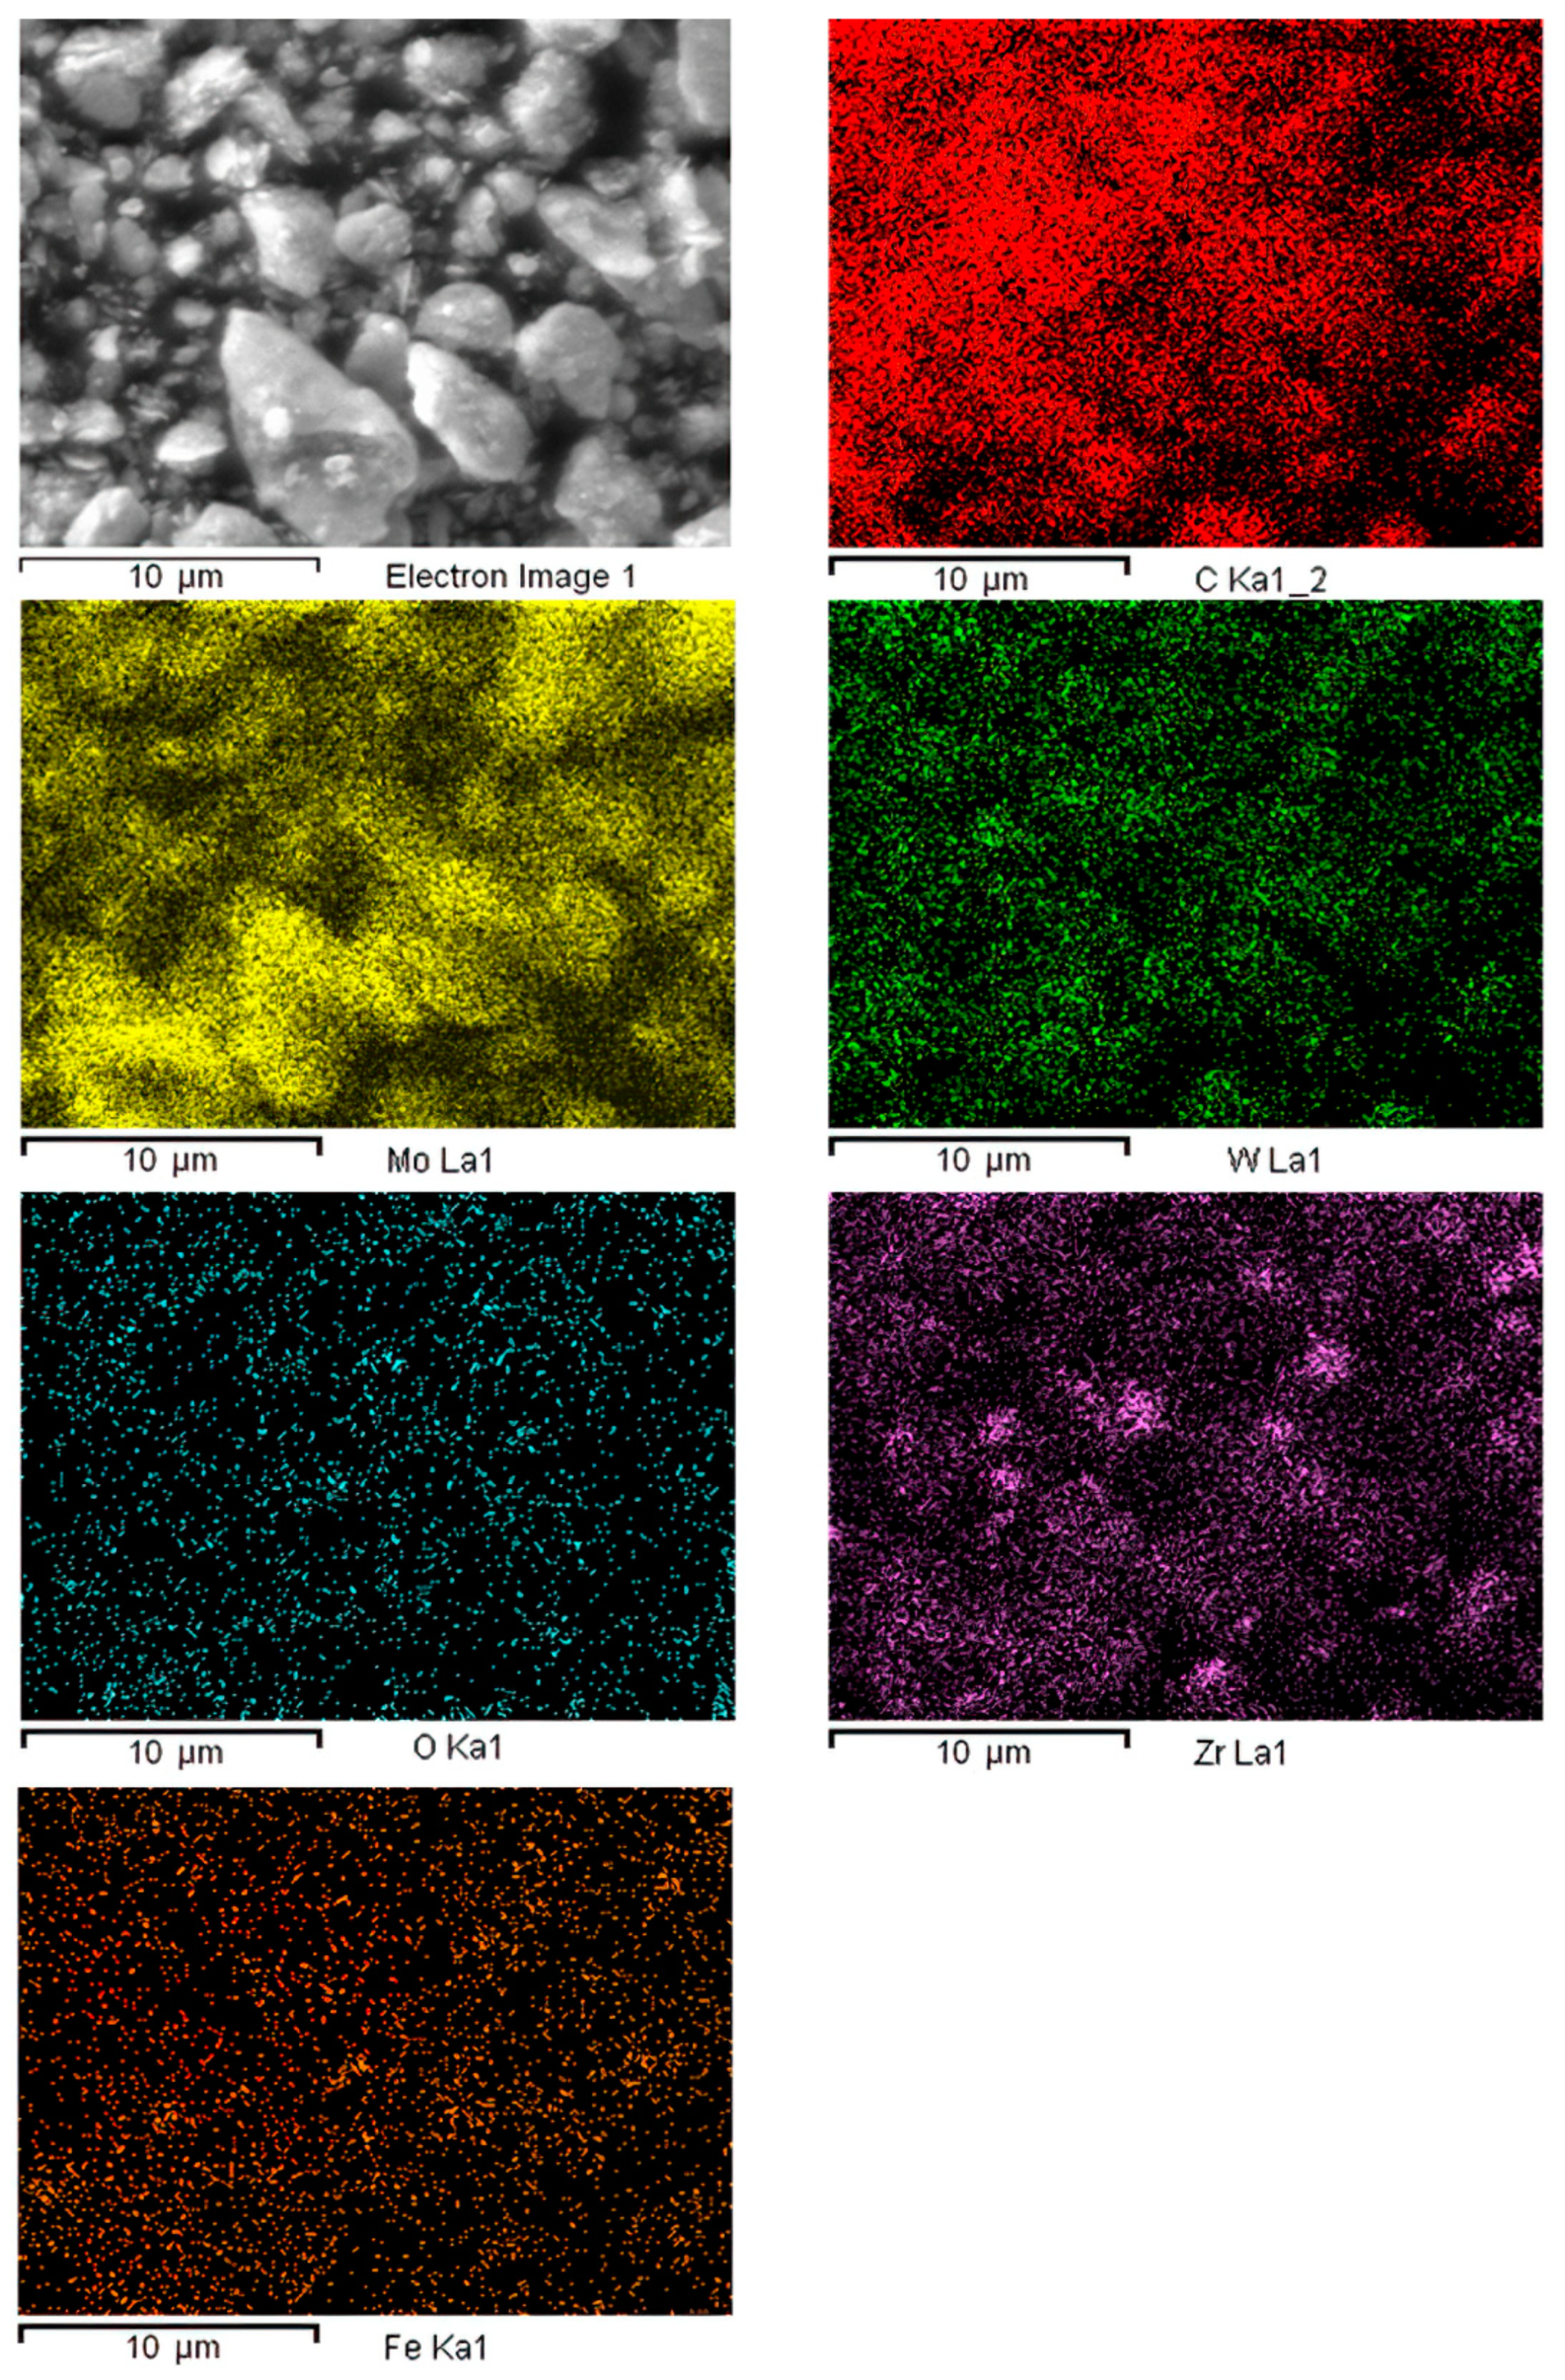
| C-K | 54.59 | C-K | 86.56 |
| O-K | 5.18 | O-K | 6.16 |
| Fe-K | 0.73 | Fe-K | 0.25 |
| Zr-K | 4.32 | Zr-K | 0.90 |
| Mo-K | 26.11 | Mo-K | 5.18 |
| W-K | 9.09 | W-K | 0.94 |
| Sample (h) | Speed (rpm) | Crystal Size (nm) | Vickers Hardness (GPa) | Vickers Std. Dev. (GPa) |
|---|---|---|---|---|
| 25 | 500 | 118.3 | 10.5 | 1.1154 |
| 50 | 500 | 84.1 | 13.35 | 1.1542 |
| 75 | 500 | 58.7 | 24.97 | 2.0584 |
| 125 | 1500 | 45.6 | 27.48 | 2.0685 |
| 150 | 1500 | 40.8 | 31.48 | 2.1258 |
Publisher’s Note: MDPI stays neutral with regard to jurisdictional claims in published maps and institutional affiliations. |
© 2020 by the authors. Licensee MDPI, Basel, Switzerland. This article is an open access article distributed under the terms and conditions of the Creative Commons Attribution (CC BY) license (http://creativecommons.org/licenses/by/4.0/).
Share and Cite
Martinez Ruiz, M.; Rivera Olvera, J.N.; Morales Davila, R.; González Reyes, L.; Garibay Febles, V.; Garcia Martinez, J.; Diaz Barriga Arceo, L.G. Synthesis and Characterization of Mechanically Alloyed, Nanostructured Cubic MoW Carbide. Appl. Sci. 2020, 10, 9114. https://0-doi-org.brum.beds.ac.uk/10.3390/app10249114
Martinez Ruiz M, Rivera Olvera JN, Morales Davila R, González Reyes L, Garibay Febles V, Garcia Martinez J, Diaz Barriga Arceo LG. Synthesis and Characterization of Mechanically Alloyed, Nanostructured Cubic MoW Carbide. Applied Sciences. 2020; 10(24):9114. https://0-doi-org.brum.beds.ac.uk/10.3390/app10249114
Chicago/Turabian StyleMartinez Ruiz, Martin, Jesús Noé Rivera Olvera, Rodolfo Morales Davila, Leonardo González Reyes, Vicente Garibay Febles, Jesus Garcia Martinez, and Lucía G. Diaz Barriga Arceo. 2020. "Synthesis and Characterization of Mechanically Alloyed, Nanostructured Cubic MoW Carbide" Applied Sciences 10, no. 24: 9114. https://0-doi-org.brum.beds.ac.uk/10.3390/app10249114