Triaxial Compression Performance Research of Steel Slag Concrete on the Unified Strength Theory


1
College of Civil Engineering and Architecture, Guangxi University, Nanning 530004, China
2
Key Laboratory of Disaster Prevention and Structural Safety of Ministry of Education, Nanning 530004, China
3
Guangzhou Design Institute, Guangzhou 510620, China
*
Author to whom correspondence should be addressed.
Appl. Sci. 2021, 11(1), 128; https://0-doi-org.brum.beds.ac.uk/10.3390/app11010128
Submission received: 14 November 2020
/
Revised: 17 December 2020
/
Accepted: 22 December 2020
/
Published: 24 December 2020
(This article belongs to the Special Issue Mechanical Performance of New Concrete Materials)
Abstract
:To better explore the mechanical properties of steel slag concrete (SSC) under triaxial compression, true triaxial tests were performed on SSC with three replacement ratios (30%, 70%, 100%) by a servo-controlled setup (TAWZ-5000/3000). Through the test, failure modes, peak stress, and corresponding strain of SSC are obtained. Results show that the failure modes of SSC are plate-splitting and slant-shear. Compared with the corresponding uniaxial strength, the triaxial compressive strength of SSC is significantly improved and is influenced by the stress ratio and the replacement ratio. Finally, based on unified strength theory, the strength failure criterion formula of SSC with different replacement rates under triaxial compression is given.
1. Introduction
Steel slag is a by-product of the steelmaking process and accounts for 15–20% of crude steel output [1]. Every year a large amount of waste steel slag is produced in the steelmaking process. Still, steel slag use is not high [2], especially in underdeveloped countries in Southeast Asia, such as Vietnam and Thailand, where it is less than 10% [3]. At present, a great quantity of waste steel slag can only be stacked and buried as garbage, which causes the grim situation of destroyed land resources and a worsening environment [4]. Meanwhile, urban construction requires huge amounts of building material, leading to a high demand globally for natural coarse aggregates. Using steel slag to replace natural aggregate in concrete can reduce the environmental damage caused by mining natural aggregates and prevent environmental pollution from waste steel slag [5,6].
In the past ten years, the viability of steel slag as a coarse aggregate substitute for gravel in concrete has been extensively investigated [7,8,9,10,11,12,13]. Steel slag aggregate is different from the natural aggregate. It has a rougher surface and larger contact area, making the bond between mortar and aggregate tighter [7]. Therefore, concrete with appropriate steel slag has superior compressive properties than ordinary concrete [8,9]. Arabani [10] shows that concrete with appropriate steel slag coarse aggregate is greater than natural aggregate concrete under dynamic load. Yu et al. [11] researched steel slag aggregate concrete-filled steel tubular. The research showed that the expansion of steel slag significantly affects the ultimate bearing capacity and peak strain of confined concrete. Devi [12] shows that concrete durability combined with 21% coarse steel slag replacement is more excellent. Also, steel slag concrete (SSC) has better temperature resistance than plain concrete [13]. When steel slag is added into concrete as coarse aggregate, it also functions as active cement and concrete admixtures [14]. The reason is that many kinds of chemical components in the steel slag, such a C3S, C2S, C4AF, and C2F, can be fully compatible with cement [15,16]. At the same time, the emission of toxic substances in steel slag is effectively suppressed by concrete [17], which indicates that the SSC can be applied safely to the construction industry. Presently, the world is advancing sustainable development strategies, and it is of great strategic significance to use waste steel slag.
In reality, concrete is not only subjected to uniaxial forces but may also be subjected to forces in multiple directions. Concrete in applying engineering practice is mostly under complex stress states [18], such as the shear wall, beam-column connection, arch dams, nuclear reactor pressure container, and shell structure [19]. Moreover, many experts and scholars prove that the behavior of concrete under triaxial compression is not the same as uniaxial compression [18,19,20,21]. Therefore, it is not comprehensive to only consider uniaxial strength theory in actual engineering. Due to the constraint of lateral stresses, concrete under triaxial compression has advantages in ductility, bearing capacity, and peak strain [22]. The results show that concrete’s multiaxial mechanical behaviors are closely related to the type of concrete [23,24,25,26]. Many studies have focused on concrete’s uniaxial mechanical behaviors; however, few studies have investigated the multiaxial mechanical behaviors of concrete, especially steel slag coarse aggregate (SSCA). It would appear necessary to research the triaxial mechanical properties of SSC.
Based on the background, we have investigated the triaxial mechanical properties of SSC. The failure mode, strength, peak strain, and stress-strain curve of SSC are analyzed. Draw on the unified strength theory Yu [27] put forward, a modified strength failure criterion for SSC is given. This paper’s experimental data and theoretical models can provide a reference for SSC, which has great significance for reusing waste steel slag and environmental protection.
2. Materials and Experimental Procedures
2.1. Specimen Production
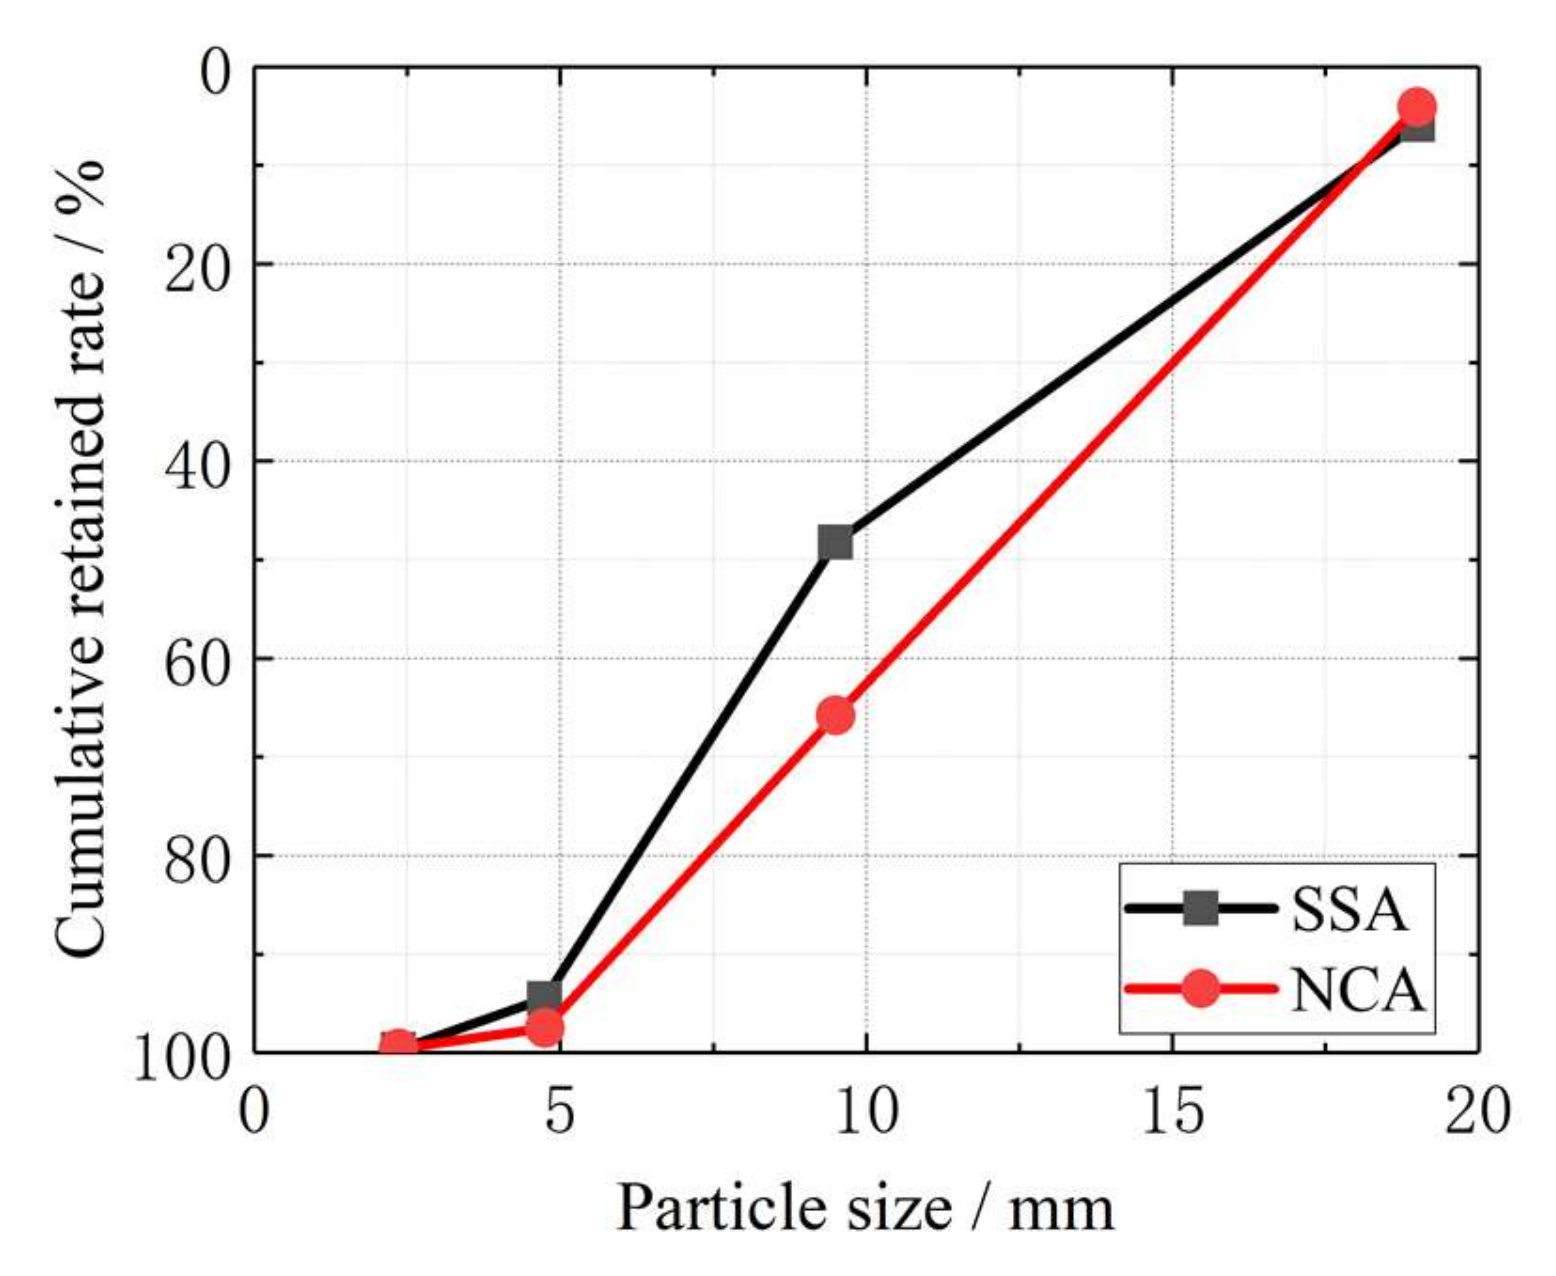
There are two types of coarse aggregates used in this true triaxial tests: Natural Coarse Aggregate (NCA) and Steel Slag Aggregate (SSA). NCA was natural gravel produced in Nanning, China. SSA was by-products from Guangxi Liuzhou Iron and Steel Group. As shown in Figure 1, NCA and SSA’s diameter is in the range of 5–20 mm. Table 1 shows the material performance of the coarse aggregate. Steel slag concrete was made of P. O 42.5 Ordinary Portland cement, and the fine aggregate was the natural river sand with a fineness modulus of 2.5.
Table 2 shows the mixing ratio of the mixture and the main parameters of SSC. The concrete mix ratio was designed according to the Specification for Mix Proportion Design of Ordinary Concrete [28]. Three kinds of SSA replacement ratios were designed: 30%, 70%, 100% by mass of NCA. SSC-30 means that the SSA with a replacement ratio of 30%.
After mixing, the concrete was cast in a mold and then transported to a vibrating table for vibrating to remove air bubbles in the specimen. After 24 h cured in the room, the specimens were put into a standard curing room with a temperature of 20 ± 2 °C and relative humidity of 95% for 28 days. Ten stress ratios ( = 0.00:0.00:1, 0.00:1.00:1, 0.05:0.25:1, 0.05:0.5:1, 0.05:0.75:1, 0.05:1:1, 0.1:0.25:1, 0.1:0.5:1, 0.1:0.75:1, and 0.1:1:1) were designed for each mix of proportions. The test specimens in this test were cubes with a side length of 100 mm, and there were three directions of vertical stress on the surface of the specimens, as shown in Figure 2. Three specimens were tested for each mixture, so a total of 90 specimens were tested. The experimental results took the average of each data set after deleting the discrete ones in this study.
2.2. Testing Method
Specimens of multiaxial mechanical properties were tested using a servo-controlled setup (TAWZ-5000/3000) (Changchun City Chaoyang Testing Instrument Co. LTD, Changchun, China), which was performed at the State Key Laboratory of Structural Engineering at Guangxi University. The test machine consisted of six independent hydraulic actuators and can simultaneously apply complex stress in three directions. In the Z-direction of the test machine, the machine’s maximum load can reach 5000 kN, and the other two directions can reach 3000 kN. The built-in load sensor collected load information, and displacement information was measured by the linear displacement sensors (LVDTs). The test setup and installation of the specimen and the LVDTs are shown in Figure 2. Figure 2a shows the exterior of the setup, and Figure 2b shows the setup’s interior. The loading schematic of the specimen is shown in Figure 2c and the specimen’s loading direction is shown in Figure 2d. To eliminate the restraint on the loading surfaces, before installing the fixture, the friction-reducing pads which were using three layers of polyethylene film with glycerin were attached to the six sides of the specimens for all tests; an attrition machine polished the surfaces of the specimens to eliminate the adverse effects of uneven surfaces. After pre-loading 5 kN, the specimens started loading. The loading rate in the principal stress direction was 0.3 MPa/s. At the same time, in the other two directions, the loading rate was determined by the stress ratio during the loading process. During the test, the deformation, strength, and stress-strain curves of the specimens can be obtained from the data acquisition system. The principal stresses were expressed as . Compression is expressed as negative, and tension is expressed as positive. The stress-strain curve of SSC generated by the data acquisition system can be seen in Figure 3.
3. Test Results and Discussion
3.1. Failure Modes
Under the triaxial compression stage, the typical failure modes of SSC are shown in Figure 4, they were failure modes of the single-splitting, slant-shear, respectively. Generally speaking, the effect of replacement ratios on SSC had not to change the failure modes. However, SSC’s brittleness was more significant with the increase of the SSA replacement ratio. The number of cracks on the specimen’s surface increases with the SSA replacement ratio, which indicated that the SSC with a high replacement ratio was more seriously damaged. The failure mode of SSC was significantly affected by the stress ratio. When the stress ratio was relatively small (e.g., = 0.25:1), the failure mode that appeared in SSC was plate-splitting. Because the third principal stress was much greater than the others, the tensile strain appeared in the vertical direction of the surfaces of and . However, due to the constraint of , the tensile strain that appeared in the normal direction of the surfaces of was prevented. With the increase of the load, microcracks appeared on the surfaces of and and gradually extended throughout the specimens. The typical plate-splitting of SSC is shown in Figure 4a–c. With the increase of stress ratio, the tensile strain was prevented due to the constraint of , and the slant-shear cracks occurred on the surface of due to the large shear stress . It can be found in Figure 4d–i. There are the single-shear and double-shear cracks on the surface of , and the angles between slant-shear cracks and the direction are about 20°–30°. In addition, the stress ratio also affects the failure mode of the specimen. When the stress ratio was constant, the number of cracks generated by stress ratio = 0.1:1 was less than that of by = 0.05:1.
3.2. Triaxial Strength
According to Table 3, the peak stress and peak strain of this experiment have been summarized. The coefficient of variation for each group in Table 3 was not greater than 15% (most of that were not more than 10%). As shown in Table 3, compared with uniaxial strength, SSC’s strength under triaxial compression has been greatly improved. The constraints in other directions have an obvious effect on the improvement of . The value of stress can improve to 108–189 Mpa due to the constraint of and . The relative value (triaxial strength to uniaxial strength) is between 2.93 and 5.05, which means that SSC’s triaxial compressive strength is obviously enhanced.
It can be seen that the influence of stress ratio on the value of in Figure 5. When the stress ratio is constant, increases first and decreases with the increase of . Most of (except for the SSC-30 at a stress ratio of = 0.1) the maximal value of was obtained at = 0.5. It can be seen that the influence of the first principal stress on is visible. When the stress ratio is constant, the values of at = 0.1 is larger than that at = 0.05, which proves that the stress ratio also can influences the triaxial strength. The reason is that the first principal stress constrains the lateral expansion of the concrete in the direction and effectively slows the crack extension. The greater stress is, the more obvious the constraint is. Using SSC-100 as an example, when stress ratio = 0.75:1, growth can reach 159% from = 0.05 to = 0.1.
On the other hand, the SSA replacement ratio also has an effect on triaxial strength. When the stress ratio = 0.05, the value of is very close at different replacement ratios, and the maximal value of is SSA replacement ratio of 100%. When the stress ratio = 0.1, the maximal value of was obtained at the replacement ratio of 100%.
3.3. Deformation Characteristic
Table 3 shows the peak strain of SSC under triaxial compression. We can see that under triaxial compression, the strains in the three directions are not equal () and strain ’s value depends on the stress ratio. The influence of stress ratio on the peak strain is shown in Figure 6. In the direction, compare with strain under uniaxial stress, the peak strain under triaxial compression is much higher, and increases first and then decreases as increases. The maximal value of is obtained at the stress ratio = 0.5. In the direction, the peak strain increases approximately linearly with the increase of and reaches the maximum compressive strain at , where . When = 0.05, all of the strain are compressive strain, but when = 0.1, the is positive at the stress ratio = 0.25, and changes to negative at = 0.5. When intermediate stress is small, tensile stress occurs in the direction because of the direction’s extrusion pressure. In the direction, the value of depends on the stress ratios and, and increases as increases but decreases as increases. When the stress ratio is small, the growth rate of is faster. As the stress ratio increases, the growth rate of slows down. The strain of SSC was also affected by the replacement ratio. It can be seen that , , and increased first and then decreased with the increase in the replacement ratio. When the stress ratio is constant, the general trends of , , and with replacement ratio were SSC-70 > SSC-30 > SSC-100, which means that the strain of , , and reach the maximal value at a replacement ratio of 70%.
3.4. Failure Criterion
The unified strength theory established by Professor “Yu” [27] can be applied to concrete under the triaxial compression. Its expression is as follows:
The relationship between the cylindrical coordinates (,,) and the primary stresses (,,)are shown below:
, are the quadratic function of the hydrostatic stress axis, and the expressions be calculated from:
The tension meridian and the compress meridian expression as follows:
The parameters ,,,,, and in Equation (3a,b) can be determined by the test data and the characteristics of the destruction envelope surface. When the hydrostatic pressure increases gradually, the partial plane is approximately circular, and. In the triaxial experiments, the triaxial tensile stress point (> 0) is difficult to test, we used the point (0,) to replace it. In the cylindrical coordinates (,,), the boundary conditions are uniaxial compressive stress (,,), uniaxial tensile stress (,,), biaxial compressive stress (,,), a point in the tensile meridian (,,), and a point in the compression meridian (,,). By simplifying the boundary conditions, the coefficients of Equation (3a,b) can be expressed by Equation (4a–f).
where = 0.1, , represents tensile strength, represents compressive strength, and represents biaxial compressive strength. The results are shown in Table 4:
For Equation (4a–f), there is , so:
The ultimate strength expression of the failure surface can is as follows:
Substituting into Equation (6a–c) the limit expression of the failure surface can be obtained.
As shown in Figure 7, the tensile strength, meridian, and strength envelopes in the deviatoric plane of SSC fit well with the experimental data. In Figure 7, stands for hydrostatic stress, stands for deviatoric stress. When the increases, the shear strength also increases, and the trend of the meridian curve for SSC is approximately the same. Steel slag as coarse aggregate is well combined with concrete, but the steel slag replacement rate of 100% has an attenuating effect on the meridian.
It can be seen from Table 5 that the theoretical value calculated by the unified theory is close to the experimental value . The relative error reflects the difference between the computation data and the experimental data and was computed using , which is within 6%. Except for the = 0.1:0.25:1, the error reaches 12%. It shows that the simplified meridian model can accurately predict the triaxial compressive strength of SSC.
4. Conclusions
- The failure modes of SSC are plate-splitting and slant-shear. When the stress ratio = 0.25: 1, the failure mode of SSC is plate-splitting. At other stress ratios, the failure mode is slant-shear.
- Compared with uniaxial compressive strength, the strength of SSC under triaxial compression is greater at the same replacement ratio, and the influence of stress ratio on the triaxial compressive strength is obvious. When the stress ratio is constant, increases first and then decreases with the increase of. When the stress ratio is constant, The value of increases with the increase of stress ratio .
- The triaxial peak strain is larger than the corresponding uniaxial peak strain , and increases first and then decreases as increases. The peak strain increases with the increase of the stress ratio . The value of increases and increases as increases but decreases as increases. , and increased first and then decreased as the replacement ratio increases.
- The unified theory established the failure criterion of SSC under triaxial compression on experimental data. It can accurately predict the envelope of concrete under different Lode angles.
Author Contributions
Conceptualization, Z.D.; methodology, B.C.; software, J.Z.; validation, Z.D., B.L.; investigation, B.C.; resources, Z.D.; writing—original draft preparation, J.Z.; writing—review and editing, X.W. All authors have read and agreed to the published version of the manuscript.
Funding
This research was funded by the National Natural Science Foundation of China, Grant Nos. 51478126, 51868005.
Data Availability Statement
Data is contained within the article.
Acknowledgments
The support from the program is gratefully acknowledged.
Conflicts of Interest
The authors declare no conflict of interest.
References
- Rondi, L.; Bregoli, G.; Sorlini, S.; Cominoli, L.; Collivignarelli, C.; Plizzari, G. Concrete with EAF steel slag as aggregate: A comprehensive technical and environmental characterization. Compos. Part B Eng. 2016, 90, 195–202. [Google Scholar] [CrossRef]
- Yi, H.; Xu, G.P.; Chen, H.G.; Wang, J.S.; Wan, Y.F.; Chen, H. An overview of utilization of steel slag. Procedia Environ. Sci. 2012, 16, 791–801. [Google Scholar] [CrossRef] [Green Version]
- Zhao, J.H.; Yan, P.Y.; Wang, D.M. Research on mineral characteristics of converter steel slag and its comprehensive utilization of internal and external recycle. J. Clean. Prod. 2017, 156, 50–61. [Google Scholar] [CrossRef]
- Guo, Y.C.; Xie, J.H.; Zheng, W.Y.; Li, J.L. Effects of steel slag as fine aggregate on static and impact behaviours of concrete. Constr. Build. Mater. 2018, 192, 194–201. [Google Scholar] [CrossRef]
- Anastasiou, E.; Filikas, K.G.; Stefanidou, M. Utilization of fine recycled aggregates in concrete with fly ash and steel slag. Constr. Build. Mater. 2014, 50, 154–161. [Google Scholar] [CrossRef]
- Qasrawi, H.; Shalabi, F.; Asi, I. Use of low CaO unprocessed steel slag in concrete as fine aggregate. Constr. Build. Mater. 2009, 23, 1118–1125. [Google Scholar] [CrossRef]
- Maslehuddin, M.; Sharif, A.M.; Shameem, M.; Ibrahim, M.; Barry, M.S. Comparison of properties of steel slag and crushed limestone aggregate concretes. Constr. Build. Mater. 2003, 17, 105–112. [Google Scholar] [CrossRef]
- Guo, Y.C.; Xie, J.H.; Zhao, J.B.; Zuo, K.X. Utilization of unprocessed steel slag as fine aggregate in normal-and high-strength concrete. Constr. Build. Mater. 2019, 204, 41–49. [Google Scholar] [CrossRef]
- Ashadi, H.W.; Aprilando, B.A.; Astutiningsih, S. Effects of steel slag substitution in geopolymer concrete on compressive strength and corrosion rate of steel reinforcement in seawater and an acid rain environment. Int. J. Technol. 2015, 6, 227–235. [Google Scholar] [CrossRef] [Green Version]
- Arabani, M.; Azarhoosh, A.R. The effect of recycled concrete aggregate and steel slag on the dynamic properties of asphalt mixtures. Constr. Build. Mater. 2012, 35, 1–7. [Google Scholar] [CrossRef]
- Yu, F.; Cao, Y.; Fang, Y.; Zhang, Y.; Niu, K. Mechanical behavior of self-stressing Steel Slag Aggregate Concrete Filled Steel Tubular short columns with different loading modes. Structures 2020, 26, 947–957. [Google Scholar] [CrossRef]
- Devi, V.S. Durability properties of multiple blended concrete. Constr. Build. Mater. 2018, 179, 649–660. [Google Scholar] [CrossRef]
- Netinger, I.; Varevac, D.; Bjegovic, D.; Moric, D. Effect of high temperature on properties of steel slag aggregate concrete. Fire Saf. J. 2013, 59, 1–7. [Google Scholar] [CrossRef]
- Peng, Y.Z.; Hu, S.G.; Ding, Q.J. High performance cementing materials from industrial slags—A review. J. Wuhan Univ. Technol. 2010, 25, 349–354. [Google Scholar] [CrossRef]
- Shi, C.J.; Qian, J.S. High performance cementing materials from industrial slags—A review. Resour. Conserv. Recy 2000, 29, 195–207. [Google Scholar] [CrossRef]
- Roslan, N.H.; Ismail, M.; Abdul-Majid, Z.; Ghoreishiamiri, S.; Muhammad, B. Performance of steel slag and steel sludge in concrete. Constr. Build. Mater. 2016, 104, 16–24. [Google Scholar] [CrossRef]
- Manso, J.M.; Polanco, J.A.; Losanez, M.; Gonzalez, J.J. Durability of concrete made with EAF slag as aggregate. Cement Concrete Compos. 2006, 28, 528–534. [Google Scholar] [CrossRef]
- Ren, Y.; Yu, Z.P.; Huang, Q.; Ren, Z. Constitutive model and failure criterions for lightweight aggregate concrete: A true triaxial experimental test. Constr. Build. Mater. 2018, 171, 759–769. [Google Scholar] [CrossRef] [Green Version]
- Deng, Z.H.; Wang, Y.M.; Sheng, J.; Hu, X. Strength and deformation of recycled aggregate concrete under triaxial compression. Constr. Build. Mater. 2017, 156, 1043–1052. [Google Scholar] [CrossRef]
- Chi, Y.; Xu, L.; Mei, G.; Hu, N.; Su, J. A unified failure envelope for hybrid fibre reinforced concrete subjected to true triaxial compression. Compos. Struct. 2014, 109, 31–40. [Google Scholar] [CrossRef]
- Shi, L.L.; Wang, L.C.; Song, Y.P.; Shen, L. Dynamic properties of large aggregate concrete under triaxial loading. Mag. Concrete Res. 2015, 67, 282–293. [Google Scholar] [CrossRef]
- Rong, C.; Shi, Q.X.; Zhang, T.; Zhao, H.C. New failure criterion models for concrete under multiaxial stress in compression. Constr. Build. Mater. 2018, 161, 432–441. [Google Scholar] [CrossRef]
- Zhou, J.J.; Pan, J.L.; Leung, C.K.Y.; Li, Z.J. Experimental study on mechanical behavior of high performance concrete under multi-axial compressive stress. Sci. China Technol. Sci. 2014, 57, 2514–2522. [Google Scholar] [CrossRef]
- Deng, Z.H.; Sheng, J.; Wang, Y.M. Strength and constitutive model of recycled concrete under biaxial compression. KSCE J. Civ. Eng. 2019, 23, 699–710. [Google Scholar] [CrossRef]
- Deng, Z.H.; Huang, H.Q.; Ye, B.L.; Xiang, P.; Li, C.Q. Mechanical Performance of RAC under True-Triaxial Compression after High Temperatures. J. Mater. Civ. Eng. 2020, 32, 0420194. [Google Scholar] [CrossRef]
- He, Z.J.; Zhang, J.X. Strength characteristics and failure criterion of plain recycled aggregate concrete under triaxial stress states. Constr. Build. Mater. 2014, 54, 354–362. [Google Scholar] [CrossRef]
- Yu, M.H. Unified Strength Theory its Applications; Springer: Berlin, Germany, 2004; pp. 237–291. [Google Scholar]
- The Profession Standard of China. Specification for Mix Proportion Design of Ordinary Concrete (JGJ 55-2011); China Architecture & Building Press: Beijing, China, 2011. [Google Scholar]
Figure 1.
The graining curves for SSA and NCA.

Figure 2.
Triaxial loading setup: (a) the exterior of the setup; (b) the interior of the setup; (c) the loading schematic of the specimen; (d) the loading direction of the specimen.
Figure 2.
Triaxial loading setup: (a) the exterior of the setup; (b) the interior of the setup; (c) the loading schematic of the specimen; (d) the loading direction of the specimen.

Figure 3.
The stress-strain curves for SSC under triaxial compression: (a) = 0.05:1, SSC-30; (b) = 0.05:1, SSC-70; (c) = 0.05:1, SSC-100; (d) = 0.1:1, SSC-30; (e) = 0.1:1, SSC-70; (f) = 0.1:1, SSC-100.
Figure 3.
The stress-strain curves for SSC under triaxial compression: (a) = 0.05:1, SSC-30; (b) = 0.05:1, SSC-70; (c) = 0.05:1, SSC-100; (d) = 0.1:1, SSC-30; (e) = 0.1:1, SSC-70; (f) = 0.1:1, SSC-100.


Figure 4.
Schematic diagram of failure form under triaxial compression: (a) Plate-splitting cracks, = 0.05:0.25:1, SSC-70; (b) 0.05:0.25:1, SSC-100; (c) 0.1:0.25:1, SSC-70; (d) Single-shear cracks, 0.05:0.5:1, SSC-70; (e) 0.05:0.75:1, SSC-100; (f) 0.1:0.75:1, SSC-100; (g) Double-shear cracks, 0.05: 0.75:1, SSC-70; (h) 0.05:0.5:1, SSC-100; (i) 0.1:1:1, SSC-100.

Figure 5.
Influence of stress ratio on : (a) = 0.05:1; (b) = 0.1:1.

Figure 6.
Variation of peak strain with stress ratio under triaxial compression: (a) = 0.05:1; (b) = 0.1:1.
Figure 6.
Variation of peak strain with stress ratio under triaxial compression: (a) = 0.05:1; (b) = 0.1:1.

Figure 7.
The meridians of SSC and the strength envelopes in deviatoric plane: (a) The meridians of SSC; (b) The deviatoric plane of SSC-30; (c) SSC-70; (d) SSC-100.
Figure 7.
The meridians of SSC and the strength envelopes in deviatoric plane: (a) The meridians of SSC; (b) The deviatoric plane of SSC-30; (c) SSC-70; (d) SSC-100.


Table 1.
The material performance of coarse aggregates.
| Classification | Gradation (mm) | Bulk Density (kg/m3) | Apparent Density (kg/m3) | Crush Index (%) | Water Absorption (%) |
|---|---|---|---|---|---|
| SSA | 5–20 | 2280 | 3230 | 6.10 | 1.36 |
| NCA | 5–20 | 1480 | 2760 | 10.40 | 0.65 |
Table 2.
Mix proportions and major parameters of concrete (kg/m3).
| No. | W/C 1 | Water | Cement | Sand | SSA2 | NCA3 |
|---|---|---|---|---|---|---|
| SSC-30 | 0.56 | 200 | 357 | 777 | 350 | 816 |
| SSC-70 | 0.56 | 200 | 357 | 777 | 816 | 350 |
| SSC-100 | 0.56 | 200 | 357 | 777 | 1166 | 0 |
1 Water/Cement; 2 steel slag coarse aggregate; 3 natural coarse aggregate.
Table 3.
Test results of SSC under triaxial compression.
| No | Stress Ratio | |||||||
|---|---|---|---|---|---|---|---|---|
| SSC-30 | 0.00: 0.00:1 | 0.00 | 0.00 | −38.32 | 1.00 | - | - | −2.11 |
| 0.00:1.00:1 | 0.00 | −50.86 | −50.86 | 1.33 | - | −2.27 | −2.27 | |
| 0.05:0.25:1 | −5.66 | −28.29 | −113.17 | 2.95 | 4.02 | −2.12 | −10.87 | |
| 0.05:0.50:1 | −6.00 | −60.04 | −120.07 | 3.13 | 7.92 | −4.14 | −12.04 | |
| 0.05:0.75:1 | −5.84 | −87.59 | −116.79 | 3.05 | 10.74 | −8.31 | −11.14 | |
| 0.05:1.00:1 | −5.73 | −114.53 | −114.53 | 2.99 | 14.32 | −10.36 | −10.36 | |
| 0.1:0.25:1 | −15.44 | −38.61 | −154.42 | 4.03 | 3.61 | −0.64 | −17.50 | |
| 0.1:0.50:1 | −17.33 | −86.67 | −173.33 | 4.52 | 6.12 | −5.75 | −18.48 | |
| 0.1:0.75:1 | −17.91 | −134.36 | −179.14 | 4.68 | 7.61 | −10.96 | −17.69 | |
| 0.1:1.00:1 | −16.78 | −167.75 | −167.75 | 4.38 | 8.15 | −15.92 | −15.92 | |
| SSC-70 | 0.00:0.00:1 | 0.00 | 0.00 | −43.86 | 1.00 | - | - | −2.29 |
| 0.00:1.00:1 | 0.00 | −58.83 | −58.83 | 1.34 | - | −2.42 | −2.42 | |
| 0.05:0.25:1 | −6.43 | −32.13 | −128.53 | 2.93 | 4.58 | −2.59 | −11.68 | |
| 0.05:0.50:1 | −6.91 | −69.09 | −138.17 | 3.15 | 8.12 | −4.91 | −12.34 | |
| 0.05:0.75:1 | −6.72 | −100.83 | −134.44 | 3.07 | 11.03 | −8.62 | −11.56 | |
| 0.05:1.00:1 | −6.58 | −131.61 | −131.61 | 3.00 | 15.14 | −10.92 | −10.92 | |
| 0.1:0.25:1 | −16.51 | −41.29 | −165.14 | 3.77 | 4.03 | −0.78 | −18.95 | |
| 0.1:0.50:1 | −18.97 | −94.85 | −189.69 | 4.32 | 6.73 | −5.98 | −20.49 | |
| 0.1:0.75:1 | −18.84 | −141.29 | −188.38 | 4.29 | 8.07 | −11.94 | −18.47 | |
| 0.1:1.00:1 | −18.01 | −180.12 | −180.12 | 4.11 | 8.56 | −16.68 | −16.68 | |
| SSC-100 | 0.00: 0.00:1 | 0.00 | 0.00 | −36.17 | 1.00 | − | − | −1.92 |
| 0.00:1.00:1 | 0.00 | −54.04 | −54.04 | 1.49 | − | −2.07 | −2.07 | |
| 0.05:0.25:1 | −5.43 | −27.15 | −108.59 | 3.00 | 3.71 | −1.87 | −10.11 | |
| 0.05:0.50:1 | −5.85 | −58.49 | −116.95 | 3.23 | 7.32 | −3.64 | −10.98 | |
| 0.05:0.75:1 | −5.64 | −84.63 | −112.84 | 3.12 | 9.92 | −7.56 | −10.32 | |
| 0.05:1.00:1 | −5.55 | −111.07 | −111.07 | 3.07 | 13.17 | −9.76 | −9.76 | |
| 0.1:0.25:1 | −15.99 | −39.98 | −159.92 | 4.42 | 3.44 | 0.25 | −16.92 | |
| 0.1:0.50:1 | −18.26 | −91.28 | −182.55 | 5.05 | 5.96 | −5.45 | −18.24 | |
| 0.1:0.75:1 | −17.94 | −134.56 | −179.41 | 4.96 | 7.36 | −10.25 | −17.58 | |
| 0.1:1.00:1 | −16.92 | −169.15 | −169.15 | 4.68 | 7.73 | −15.83 | −15.83 |
Table 4.
Values of m and n for SSC under triaxial compression.
| No | ||||||
|---|---|---|---|---|---|---|
| SSC-30 | 0.119101 | −0.647975 | −0.0121243 | 0.19794 | −1.07837 | −0.0121243 |
| SSC-70 | 0.119322 | −0.651706 | −0.0139721 | 0.197478 | −1.08024 | −0.0139721 |
| SSC-100 | 0.119839 | −0.660695 | −0.0133628 | 0.196045 | −1.08237 | −0.0133628 |
Table 5.
The validation of SSC.
| Stress Ratio | SSC-30 | SSC-70 | SSC-100 | ||||||
|---|---|---|---|---|---|---|---|---|---|
| (%) | (%) | (%) | |||||||
| 0.05:0.25:1 | 2.09 | 2.16 | 3.32% | 2.08 | 2.14 | 3.27% | 2.13 | 2.22 | 4.27% |
| 0.05:0.50:1 | 2.11 | 2.11 | 0.35% | 2.12 | 2.12 | 0.02% | 2.17 | 2.20 | 1.20% |
| 0.05:0.75:1 | 2.12 | 2.10 | 1.17% | 2.13 | 2.10 | 1.58% | 2.17 | 2.17 | 0.18% |
| 0.05:1.00:1 | 2.32 | 2.26 | 2.53% | 2.33 | 2.26 | 3.00% | 2.38 | 2.34 | 1.57% |
| 0.1:0.25:1 | 2.75 | 3.09 | 12.34% | 2.57 | 2.26 | 12.07% | 3.01 | 3.38 | 12.14% |
| 0.1:0.50:1 | 2.88 | 3.06 | 6.16% | 2.76 | 2.93 | 6.08% | 3.22 | 3.40 | 5.62% |
| 0.1:0.75:1 | 3.07 | 3.13 | 2.06% | 2.82 | 2.89 | 2.43% | 3.26 | 3.33 | 2.17% |
| 0.1:1.00:1 | 3.22 | 3.22 | 0.00% | 3.02 | 3.02 | 0.00% | 3.44 | 3.44 | 0.00% |
1 is measured experimentally. 2 is computed using Equation 6(a–c), 3 is the relative error.
Publisher’s Note: MDPI stays neutral with regard to jurisdictional claims in published maps and institutional affiliations. |
© 2020 by the authors. Licensee MDPI, Basel, Switzerland. This article is an open access article distributed under the terms and conditions of the Creative Commons Attribution (CC BY) license (http://creativecommons.org/licenses/by/4.0/).
Share and Cite
MDPI and ACS Style
Deng, Z.; Zhou, J.; Chen, B.; Wen, X.; Liu, B. Triaxial Compression Performance Research of Steel Slag Concrete on the Unified Strength Theory. Appl. Sci. 2021, 11, 128. https://0-doi-org.brum.beds.ac.uk/10.3390/app11010128
AMA Style
Deng Z, Zhou J, Chen B, Wen X, Liu B. Triaxial Compression Performance Research of Steel Slag Concrete on the Unified Strength Theory. Applied Sciences. 2021; 11(1):128. https://0-doi-org.brum.beds.ac.uk/10.3390/app11010128
Chicago/Turabian StyleDeng, Zhiheng, Jingkai Zhou, Beiquan Chen, Xiaoyan Wen, and Bing Liu. 2021. "Triaxial Compression Performance Research of Steel Slag Concrete on the Unified Strength Theory" Applied Sciences 11, no. 1: 128. https://0-doi-org.brum.beds.ac.uk/10.3390/app11010128
Note that from the first issue of 2016, this journal uses article numbers instead of page numbers. See further details here.