Evaluating the Impact of Drone Signaling in Crosswalk Scenario


1
Lamoed Laboratory, National Engineer School of Tunis, University of Tunis El Manar, Tunis 1068, Tunisia
2
IBISC Lab, Université Paris Saclay, Univ Evry, 40 rue du Pelvoux, 91025 Évry-Courcouronnes, France
*
Author to whom correspondence should be addressed.
Appl. Sci. 2021, 11(1), 157; https://0-doi-org.brum.beds.ac.uk/10.3390/app11010157
Submission received: 15 November 2020
/
Revised: 13 December 2020
/
Accepted: 17 December 2020
/
Published: 26 December 2020
(This article belongs to the Special Issue Future Intelligent Transportation System for Tomorrow and Beyond)
Abstract
:The characteristic pillars of a city are its economy, its mobility, its environment, its inhabitants, its way of life, and its organization. Since 1980, the concept of smart city generally consists of optimizing costs, organization, and the well-being of inhabitants. The idea is to develop means and solutions capable of meeting the needs of the population, while preserving resources and the environment. Owing to their little size, their flexibility, and their low cost, Unmanned Aerial Vehicles (UAV) are today used in a huge number of daily life applications. UAV use cases can be classified into three categories: data covering (like surveillance and event covering), data relaying (like delivery and emergency services), and data dissemination (like cartography and precise agriculture). In addition, the interest to Cooperative Intelligent Transportation Systems (C-ITS) has risen in these recent years, especially in the context of smart cities. In such systems, both drivers and traffic managers share the information and cooperate to coordinate their actions to ensure safety, traffic efficiency, and environment preservation. In this work, we aimed at introducing a UAV in a use case that is likely to happen in C-ITS. A conflict is considered involving a car and a pedestrian. A UAV observes from the top of the scene and will play the role of the situation controller, the information collector, and the assignment of the instructions to the car driver in case of a harmful situation to avoid car-pedestrian collision. To this end, we highlight interactions between the UAV and the car vehicle (U2V communication), as well as between the UAV and infrastructure (U2I communication). Hence, the benefit of using UAV is emphasized to reduce accident gravity rate, braking distance, energy consumption, and occasional visibility reduction.
1. Introduction
Unmanned Aerial Vehicles (UAV) are used today in a large number of daily life applications [1]. In fact, since the beginning of the 2010s, UAV are being introduced to improve the road traffic efficiency [2]. In addition, the interest to Cooperative Intelligent Transportation Systems (C-ITS) has risen in recent years, especially in the context of smart cities [3]. Several works and research projects identified multiple scenarios for the application of UAVs in these environments [4]. In C-ITS, where autonomous vehicles interact, road safety is a complex research problem, especially when Vulnerable Road Users (VRU) are involved. Currently, the use of UAVs in urban areas is not yet authorized in most countries in the world (see Reference [5] for more details about local UAV regulations). In the white paper by Reference [6], the authors have shown how and why various regulations and requirements influence the use of radio in drones. They focused on data link reliability for professional drone use by providing the technical background and links to where such regulatory ruling can be found, focusing in the U.S. and some countries in Europe. Despite this restrictive legal context, various recent works have shown the benefits of UAV technologies to improve efficiency and safety in urban areas. In most of these applications, UAVs have a certain level of intelligence, which allows them to be used as high-performance sensors, information collectors, or even as communication relays, particularly when land cover is not sufficient [7,8]. The advances of C-ITS technologies and the interesting properties of UAVs provide a favorable context to introduce a UAV in a use case where we consider a conflict involving a car and a pedestrian. In this work, UAV is expected to control the situation, collect information, and send instructions to the car driver in a case of harmful situation in order to avoid collision between the car and the pedestrian. For this, we take into account two cases: in the first, case the car arrives to the crosswalk through a straight line; in the second case, the car approaches the crosswalk through a curved trajectory. The UAV is likely to detect the presence of the pedestrian before the latter becomes in the Visual Line Of Sight (VLOS) of the terrestrial vehicle. Hence, the UAV can send the information earlier to the driver, and this is likely to provide an earlier reaction of the car driver. If we assume that the driver is cooperative, he will adapt his behavior based on the messages received from the UAV. In these conditions, the UAV signaling contributes to reduce both accident rate, braking distance, and energy consumption. In addition, the UAV improves occasional visibility reduction. To this end, the rest of the paper is organized as follows. In Section 2, we detail related works and state-of-the-art. In Section 3, we present the studied scenario, as well as our proposed algorithm, the made hypotheses, and the chosen simulation parameters. Then, in Section 4, we present the simulations results and associated analysis to finally discuss these results in relation to the national statistics in accidentology in France in Section 5. Section 6 is, lastly, dedicated to summarize the main conclusions and further work.
2. Related Work
For more than twenty years, many research works have investigated the potential of drones in traffic monitoring scenarios. Collected data from drones flying in urban environment are used for a wide range of applications [9], such as evaluating the real traffic flow conditions in urban areas [10]. In a first survey [11], the authors highlighted how aerial monitoring has the potential to yield detailed information to help traffic planners. In a second survey [12], the authors listed UAV-based systems for traffic monitoring and research trends in the area. References [11,12] mentioned extensive efforts to carry UAV-based systems for traffic monitoring in universities (California, Ohio, Florida, etc.) and research centers. Reshma et al. [13] developed a security situational aware intelligent traffic management using a UAV that gives decision commands for routing or shortest traffic paths. Then, in Reference [2], a universal guiding framework for ensuring a safe and efficient execution of UAV-based traffic studies has been proposed. More recently, some patents have been submitted to design particular UAV structures able to meet efficient traffic monitoring purposes. As an example, Reference [14] deals with a system of two drones: a surveillance drone based on the recognition of difficult situations on fast road lanes, and a signaling drone which makes decisions to display the most relevant signaling messages on a LED-based variable messages panel.
In addition, the interest to Cooperative Intelligent Transportation Systems (C-ITS) has risen in recent years, especially in the context of smart cities. Authors surveyed major techniques and solutions for both signalized and non-signalized cooperative intersections [3]. Garcia-Castellano et al. developed and constructed an adaptive street light system that improves safety at intersections with a focus on rural intersections, which have an elevated number of road accidents [15]. In C-ITS systems, thanks to Vehicle to everything (V2X) and everything to Vehicle (X2V) communications, both drivers and traffic managers share the information and cooperate to coordinate their actions to ensure safety, traffic efficiency, and environment preservation. Authors surveyed the concept of V2X, as well as the standardization techniques presently in use for communication by describing V2X applications, requirements, threats, and solutions. They have focused on the required initiatives for understanding the importance of V2X security in vehicular communication [16]. In addition, the integration of block chain, as a strong security mechanism, in next-generation V2X communications was examined, which comes up with new opportunities to empower advanced V2X networks, capabilities, applications, and services [17]. UAV can be used in a lot of ITS applications, thanks to the development of UAV-based systems. For example, Martinez Herdia et al. presented an emergency radio beacon specifically designed to find and recover small UAVs. They carried experiments to show its high precision and endurance [18]. According to Reference [4], UAV can be used in a lot of ITS applications, and there are huge potential and numerous challenges for UAV-enabled ITS for next generation smart cities. One among these challenges is UAV communications in smart cities. In Reference [19], the author developed algorithms and mathematical frameworks to design, optimize, deploy and operate UAV-based communication systems. In fact, UAVs can act as intermediate relays to collect information and transmit it to ground vehicles, due to their flexible mobility, especially if the communication ground infrastructure is not available [20]. The work in Reference [21] highlighted the minimum number of UAVs needed to guarantee a target connectivity threshold among vehicles, for a given geographical area and vehicle density, especially in the case of road side unit (RSU) failure and lack of Vehicle-to-Vehicle (V2V) communication. Reference [22] proposed UAV-assisted vehicular ad-hoc network (VANET) routing protocols to improve data routing and connectivity among ground vehicles through the use of drones. Several researchers have been more particularly interested in the interaction between drones and cars and suggested the development of hybrid ad-hoc networks. In Reference [23], authors proposed an infrastructure-less Vehicle-Drone hybrid ad-hoc network (VDNet), where UAVs are expected to boost V2V data message transmission. Authors in Reference [24] investigated the use of an heterogeneous network of drones and vehicles in an urban context, where communications between drones and vehicles may be crucial for transmitting important information, such as real time traffic. Hadiwardoyo et al. tackled different aspects of the communication between cars and drones. In Reference [25], they proposed an experimental characterization of UAV to Car communications and emphasized that its range could reach 3 km in a rural area, when the 5 GHz frequency band is used. In Reference [26], they proposed a realistic model for simulating this type of communication link, enabling alert broadcasts in emergency situations. In Reference [27], they have recently developed a technique to optimize the UAV positioning in a 3D space, for dynamic Drone to Car communication. One can find more information about open problems and remaining challenges in the field of UAV communications in Reference [28].
Another C-ITS feature is that vehicles are expected to be autonomous (no human intervention is needed). Hence, road safety is an important aspect that should be considered and highlights number of issues that are still open problems, especially when Vulnerable Road Users (VRU), such as pedestrians, cyclists, or two-wheel-vehicles, are involved. As far as road safety is concerned, authors in Reference [29] surveyed communications between vehicles and VRUs and suggested that an open research challenge in the area is that a vehicle and a VRU that are potentially on the verge of collision may need to communicate with each other using real-time algorithms in the presence of V2X communications. In addition, drones can be a viable technology for monitoring pedestrian traffic characteristics in outdoor pedestrian zones [30]. UAVs are also used as aerial sensors to collect videos aiming at analyzing surrogate safety of pedestrian-vehicle conflicts at intersections [8]. In Reference [31], authors tackled pedestrian safety diagnosis at signalized crosswalks using traffic conflict technique, and emphasized that the most serious pedestrian-vehicle conflicts occur when vehicles travel at high speed. Tracking and simulating pedestrian movements is part of the solution to protect their safety at intersections [7]. In Reference [32], the reader can also find models for pedestrian path prediction at 2 s time horizon, and this helps to analyze interactions between pedestrians and straight-going vehicle at non-signalized crosswalks. Extensive research studied pedestrian behaviors, while other works focused on the car driver behavior, like the recent patent [33] where the inventor proposed a traffic control system, controller, and method for directing vehicle behavior at a defined spatial location, based on a UAV hovering above a roadway.
Analyzing the vehicle driver behavior is of interest not only to avoid collisions with other road users but also to reduce gas emissions and their impact on the environment. This trend is related to climate change issues, especially in crowded cities. Extensive research works tackled the aspect of energy consumption minimization. In fact, based on the Pulse Width Modulation (PWM) dimming principle, authors in Reference [34] presented a partial feed-back closed loop control scheme for LEDs, which has the capability to stabilize illuminance satisfactorily and which calculates economically the quantity of electric light to compensate the illuminance. Authors in Reference [35] showed that the driver behavior has a direct impact on the environment and the vehicle emission. This impact depends on the trip purpose and is the highest for work-related trips. Researchers in Reference [36,37] have provided tips for drivers on how to efficiently minimize fuel consumption and emission levels, including hard braking, sudden acceleration or deceleration, and idling (these items are the main principles of ecodriving). Authors in Reference [38] demonstrated that energy feedback has an influence on ecodriving, and they developed an interactive energy feedback interface and tested it on multiple types of vehicles. An approach to optimize throughput and maximize comfort, while minimizing travel delay and fuel consumption assuming vehicle to infrastructure communication, is proposed in Reference [39]. Some other works focused on behavior at the vicinity of intersections. Authors in Reference [40] developed algorithms and modeled and tested ecodriving at the approach of a roadway intersection. Bento et al. (2019) [41] presented an intersection traffic management system for automated vehicles arriving to the intersection without colliding with each other, while, at the same time, reducing the intersection delay, as well as the environmental impacts (fuel consumption and greenhouse gas emissions of CO). Regarding the fuel consumption model, Loulizi, Rakha, and Bichiou (2017) [42] showed that it depends on the grade and on the instantaneous power, as a function of the driver acceleration and resistance forces on the vehicle. Authors in Reference [43] recently proved that the optimization of the road infrastructure is also a part of the solution to reduce road vehicles consumption, and they developed a road speed sectioning technique for this purpose.
In this work, we were interested in the intersection between the different research areas mentioned above (drones for traffic monitoring, drones communications in smart cities, road safety, and minimization of the energy consumption). More specifically, we aimed at studying to which extent the presence of a drone that communicates with vehicles and infrastructure may improve both road safety and energy efficiency, in a specific use case that is likely to occur often in a smart city context and involves a VRU. For this, we considered a crosswalk involving a car and a pedestrian. We placed a UAV at the top of the scene which is expected to control the situation, collect information, and send instructions to the car driver and/or the infrastructure in case of harmful situation to avoid car-pedestrian collision. Hence, we emphasize the benefit from using an UAV to reduce both accidents rate and braking distance, as well as to improve energy efficiency in the global system and occasional visibility reduction. It will be taken into account two situations: when the car is arriving through straight line and when the car approaches the crosswalk through a curved trajectory.
3. Materials and Methods
3.1. Problem Statement
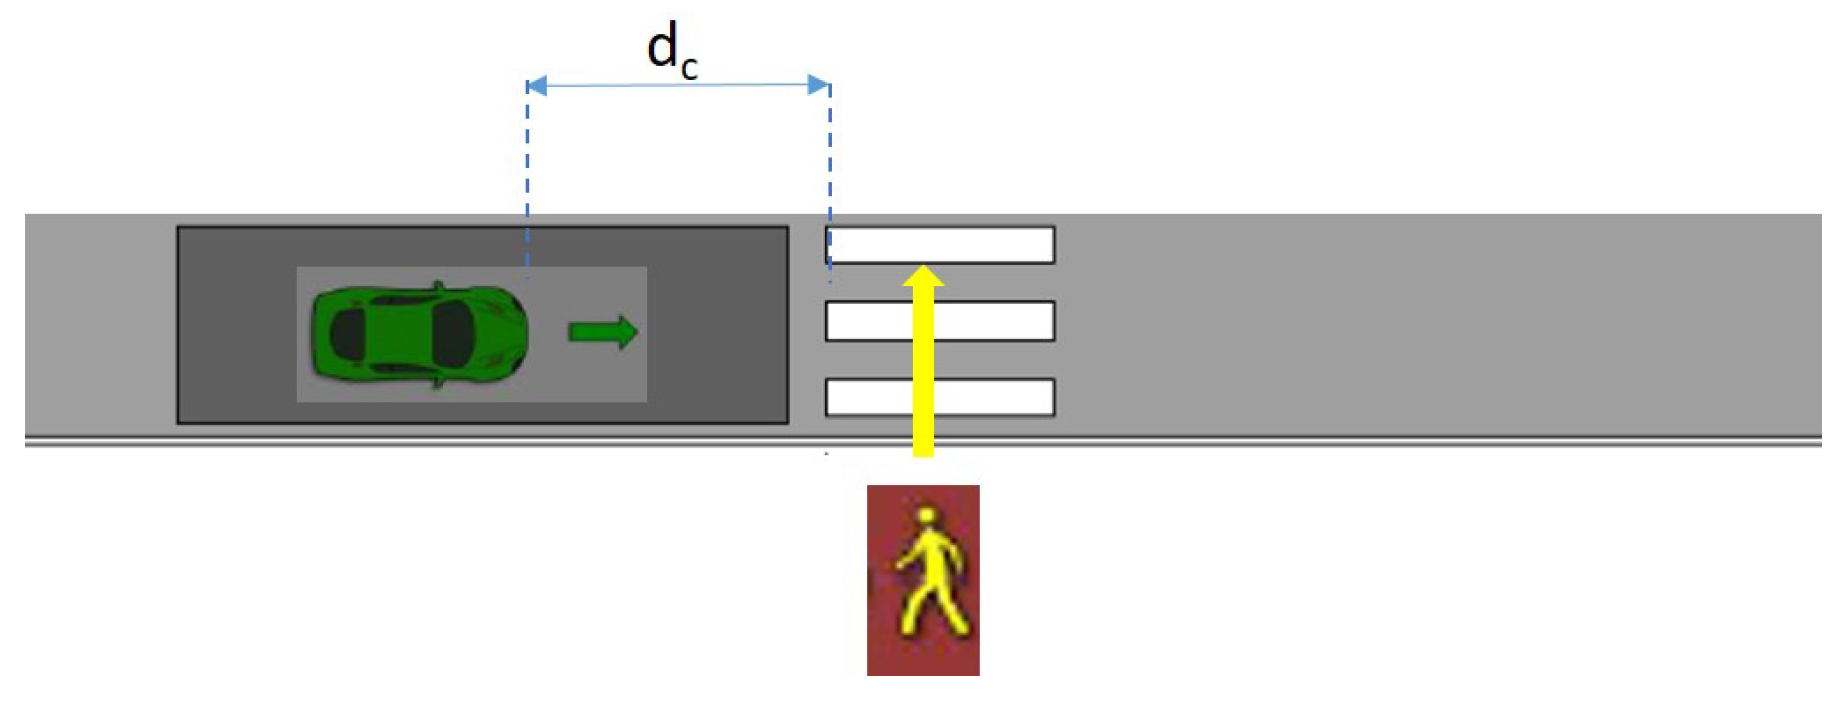
We consider a crosswalk involving a car and a pedestrian. The car approaches the crosswalk (at a distance , with a speed and an acceleration ). The pedestrian intends to cross the road at the same moment. This scenario is represented in Figure 1.
To avoid the collision, the car must stop and let the pedestrian safely cross the intersection (final speed ). When the pedestrian becomes in the field of view of the car driver, the latter brakes to stop before the crosswalk. The traveled distance during this process is the stopping distance , defined by Equation (1), where is the perception-reaction distance (this corresponds to the traveled distance during the perception-reaction time of the driver), and is the braking distance (this corresponds to the distance while the speed is decreasing up to the vehicle stops). In addition, we use Equation (2) to compute .
To compute the braking distance, we consider the model of kinetic energy dissipation. The theoretical braking distance can be computed by determining the work required to dissipate the vehicle’s kinetic energy. The model is detailed in Reference [44]. The braking distance satisfies Equation (3), where m is the mass of the car, and L represents the longitudinal frictional forces (see Equation (4)).
with N being the normal tire-pavement reaction, the coefficient of friction between the road surface and the tires, and g the gravity of Earth. If we consider an average coefficient of friction over the braking distance (not depending on the speed), by applying Newton’s second law and equation of motion, the braking distance is determined by equation
To avoid collisions, must be lower than , at the instant the car driver sees the pedestrian. This condition is likely to be satisfied if is below a threshold (usually the authorized speed limit). However, if is too high, the stopping distance would be too large, and there would be a collision between the car and the pedestrian at the limit condition of braking. In fact, a too high value of can be due to several factors, essentially related to both drivers and pedestrians behaviors:
- visibility limits when driving by night or by curved road,
- lack of attention from the driver,
- lack of attention from the pedestrian, and
- infrastructure characteristics.
Moreover, during braking, to evaluate exactly the evolution of the speed as a function of the distance (), we consider that depends on the speed (), and, in this case, we consider an average deceleration (), obtained empirically [45].
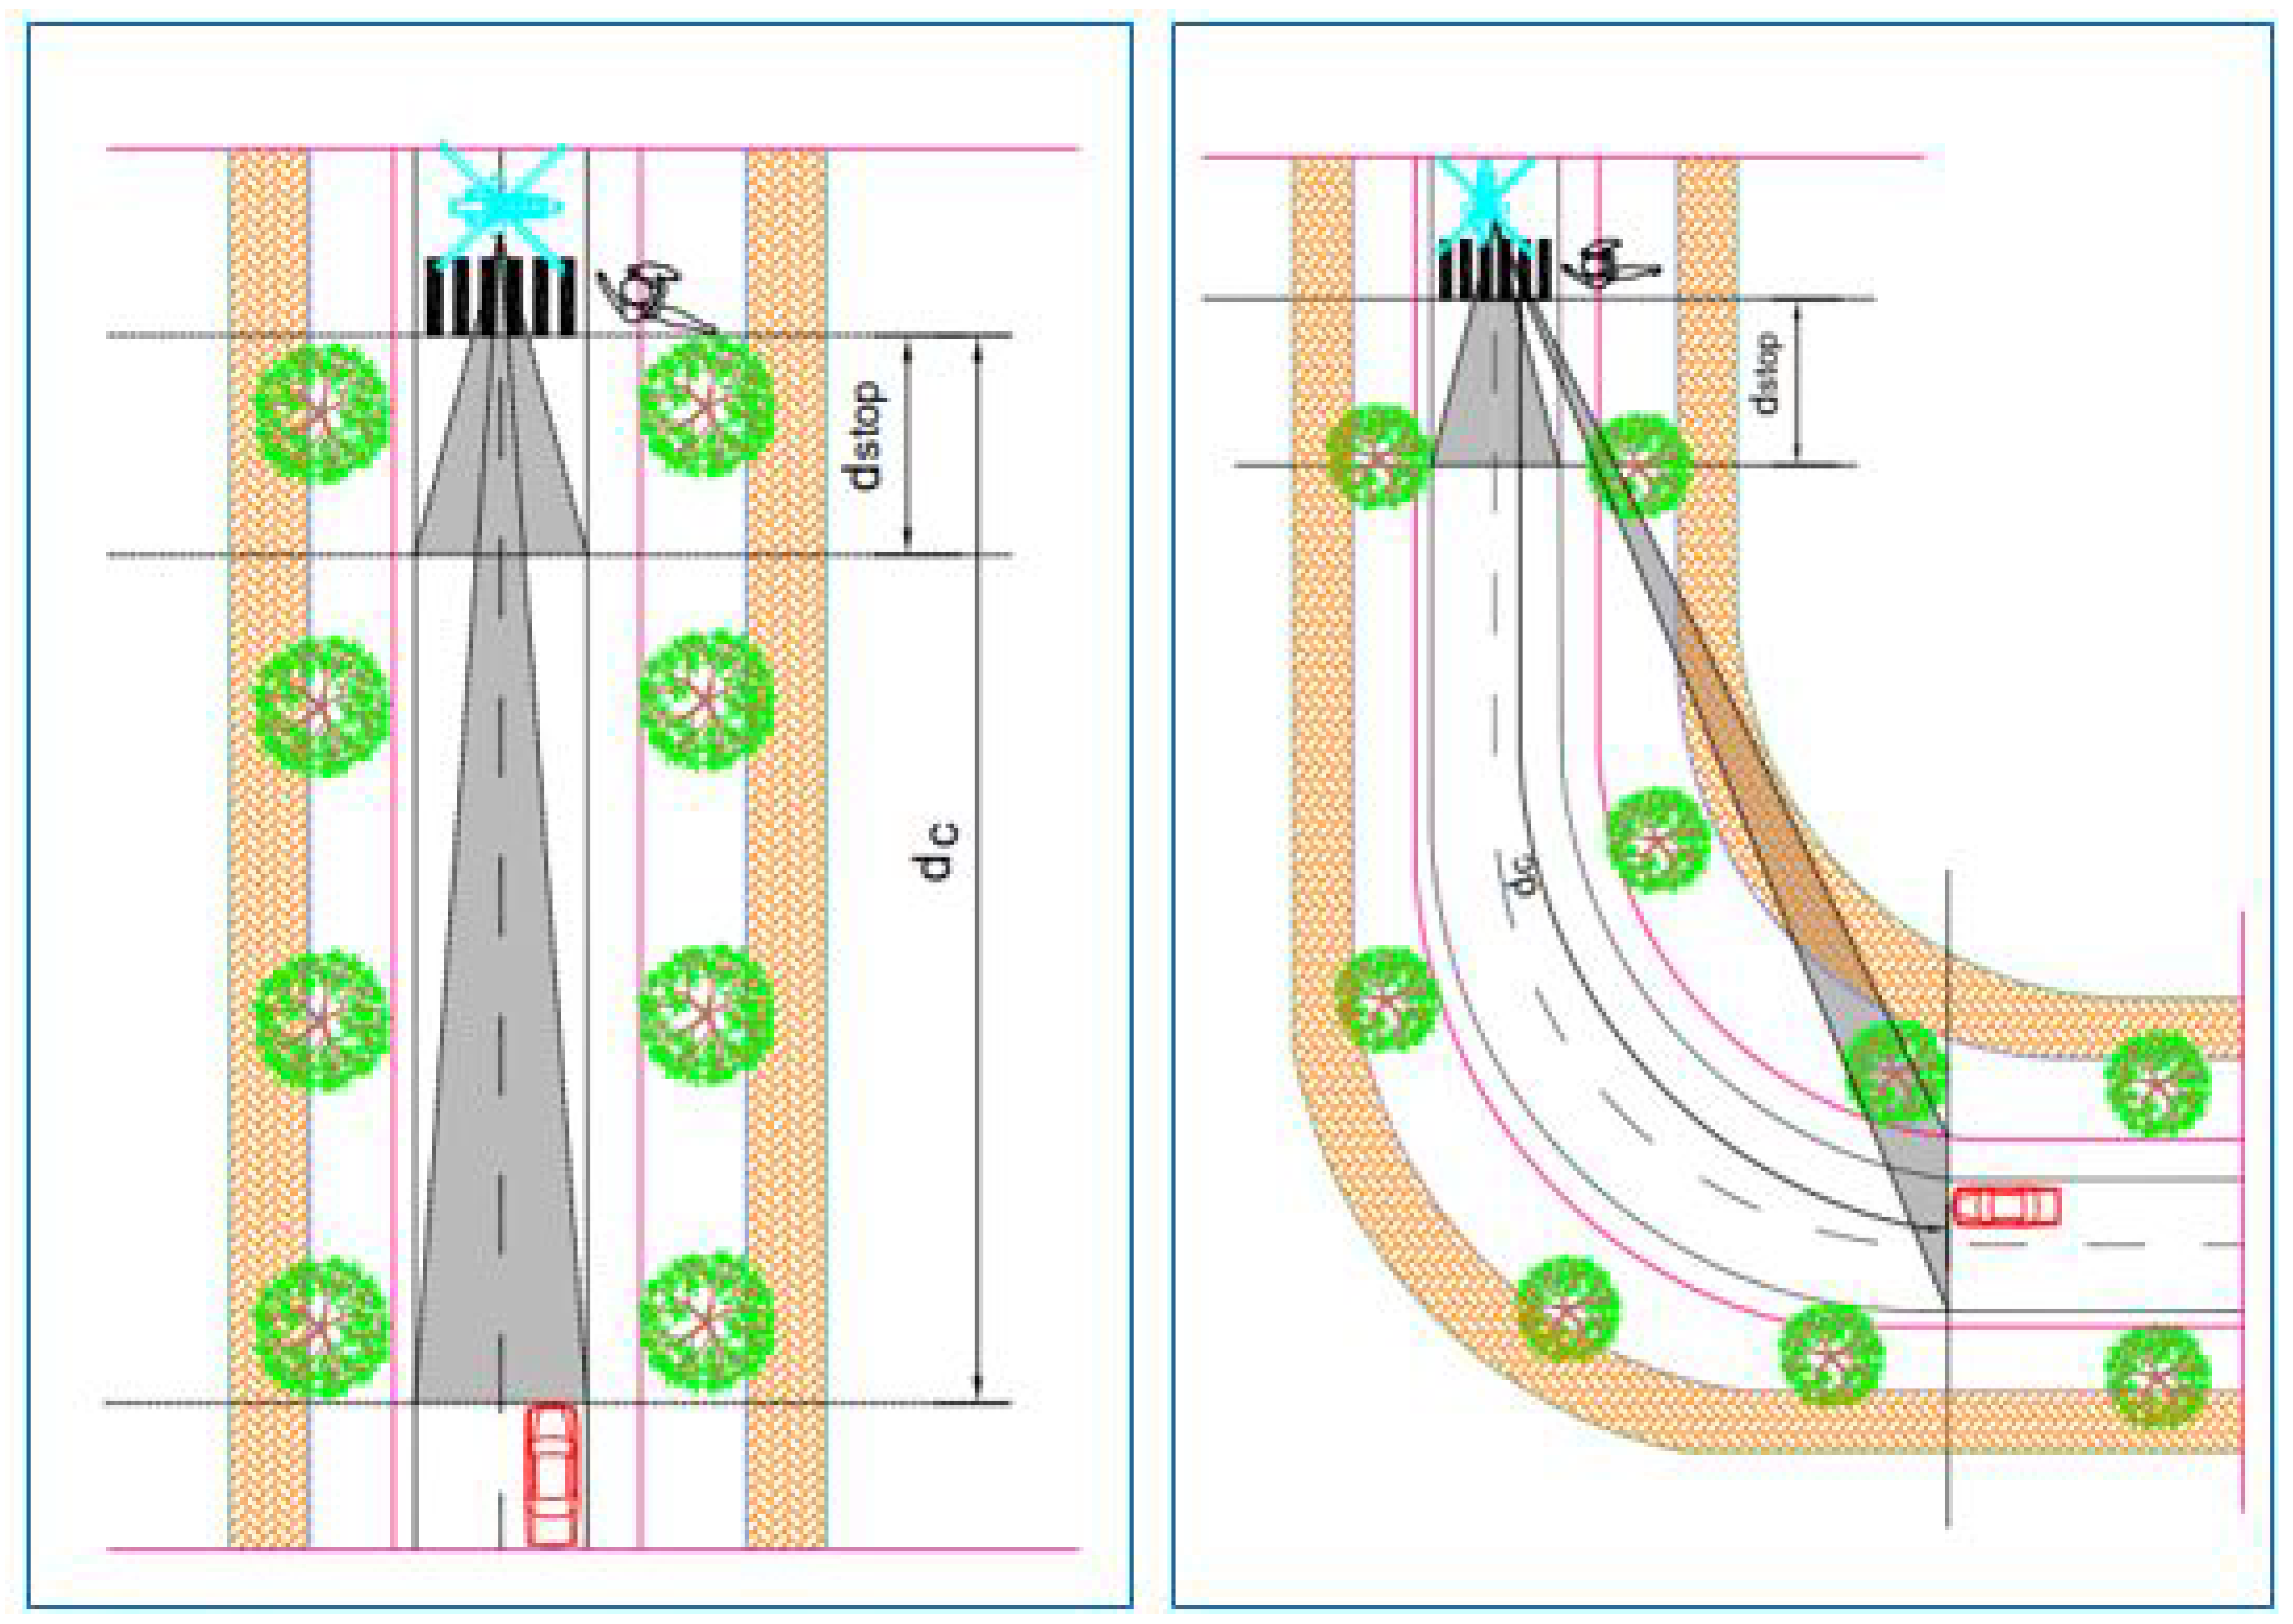
In this work, we focused on adding a drone on the top of the scene, just over the crosswalk, named “controlled by drone”. The drone observes the vehicle and sends alerts to its driver and/or to the infrastructure in case of harmful situation. The authors in Reference [29] mentioned that there are alerts for both pedestrians and vehicle drivers for signalized street crossing scenario. The alert for pedestrians is based on Mobile Accessible Pedestrian Signal System. Message exchanges are suggested as starting before the driver sees the pedestrian. In this case, the drone helps the driver to progressively adjust the vehicle speed before braking, thus reducing its fuel consumption. We take into account two situations (see Figure 2). In the first situation, the vehicle approaches the crosswalk through a straight line. In the second situation, the vehicle has a curved trajectory. This has an impact on the friction coefficient and, consequently, on the braking distance , as can be noticed below. For pedestrians’ safety purposes, we added a safety barrier several meters before the beginning of the crosswalk (at distance ). The barrier automatically rises in the case that the driver does not react to all the alerts coming from the UAV. The presence of safety barriers is helpful on roads where traffic flow is dense, such as shopping streets and business districts. More generally, and to include all use cases and all types of roads, audible alerts are sent to both drivers and pedestrians, as an alternative solution. The survey in Reference [29] discussed a similar solution in the case of vehicle-to-pedestrian communication.
3.2. Metrics of Interest
3.2.1. Speed Profile
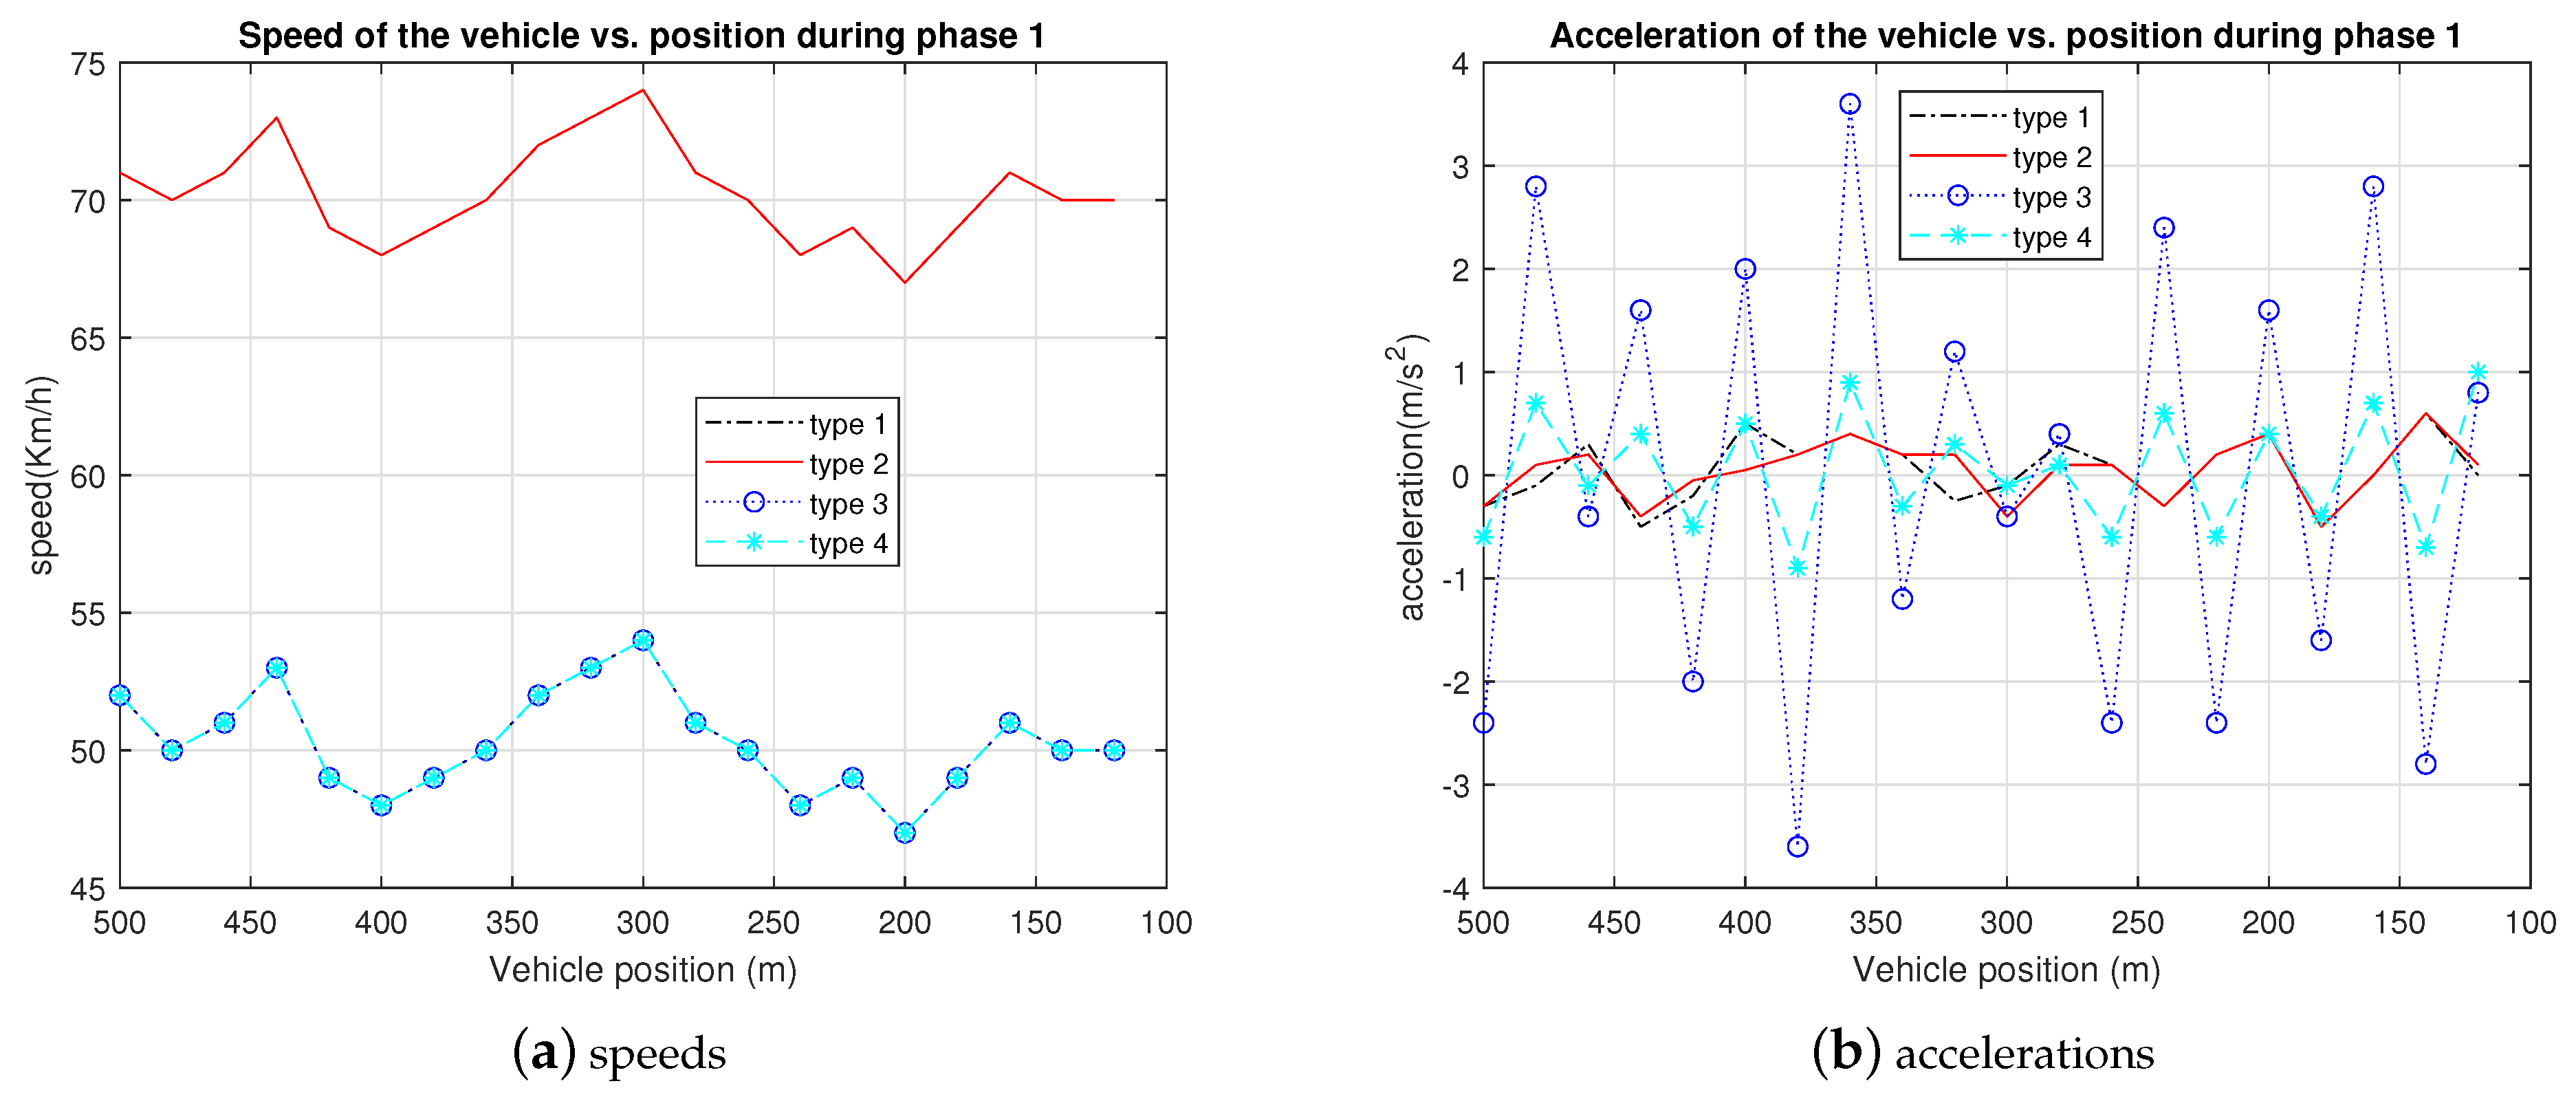
This profile is determined by the values of with respect to time. Generally, for a normal driver’s behavior, , being the authorized speed limit. One can see, in Figure 3, some examples of speed profile plots.
3.2.2. Acceleration Profile
This profile is determined by the values of with respect to time. As mentioned in Reference [46], it is hard to precisely determine the set of physical parameters that guarantee passengers’ comfort. However, after a large number of experiments and observations, it has been proposed that the comfort is lost if , being the maximum tolerable longitudinal acceleration (). For a normal driver’s behavior, . In practice, we consider that the comfort is lost if the percentage of time where is higher than a threshold . One can see, in Figure 3, some examples of acceleration profile plots.
3.2.3. Perception-Reaction Distance
The perception-reaction distance depends on the perception-reaction time. Typical values of in different situations and for different drivers profiles can be found in Reference [47]. It reaches from less than 1 s to more than 2.5 s to specifically accommodate very elderly, debilitated, intoxicated, or distracted drivers.
3.2.4. Braking Distance
The braking distance depends on the vehicle speed and the friction coefficient . There are many methods in the literature to determine , like mentioned in Reference [48]. In this work, we use the coefficients given in Table 1 for different values of the speed , for straight dry, straight wet, curved dry, and curved wet trajectories.
3.2.5. Fuel Consumption
We are also interested in the instantaneous fuel consumption by the vehicle at the vicinity of the crosswalk. To compute this parameter, we are inspired from the model detailed in Reference [42], where depends on the instantaneous power and road-related parameters (, and ):
To assess the impact of studies on optimizing energy consumption, monitoring is required over substantial distances (at least hundreds of meters); this is why we will apply our approach to the longer phase of our study, which is phase 1 (see Section 4).
3.3. Assumptions
To emphasize the drone contribution to road safety in the scenario described below, several assumptions are taken into account.
It is considered that only one car is about to arrive to the crosswalk. Hence, in this work, we do not take into account any traffic model. In addition, for problem simplification purposes, we consider that, at each time instant t, there is a pedestrian intending to cross. This means that the probability of pedestrian presence at the crosswalk is equal to 1.
In addition, the infrastructure is assumed to be equipped with enough number of relaying sensors, such that the drone receives instantly reliable information about the scene. Moreover, the drone is equipped with sensors that correctly exchange information with both the car and the infrastructure. Hence, in this paper, we do not focus on the way how the information flows transit, and we do not take into account the transmission delays from and to the drone. Moreover, all the metrics of interest can be expressed as functions of the distance (instead of time t).
3.4. Algorithm
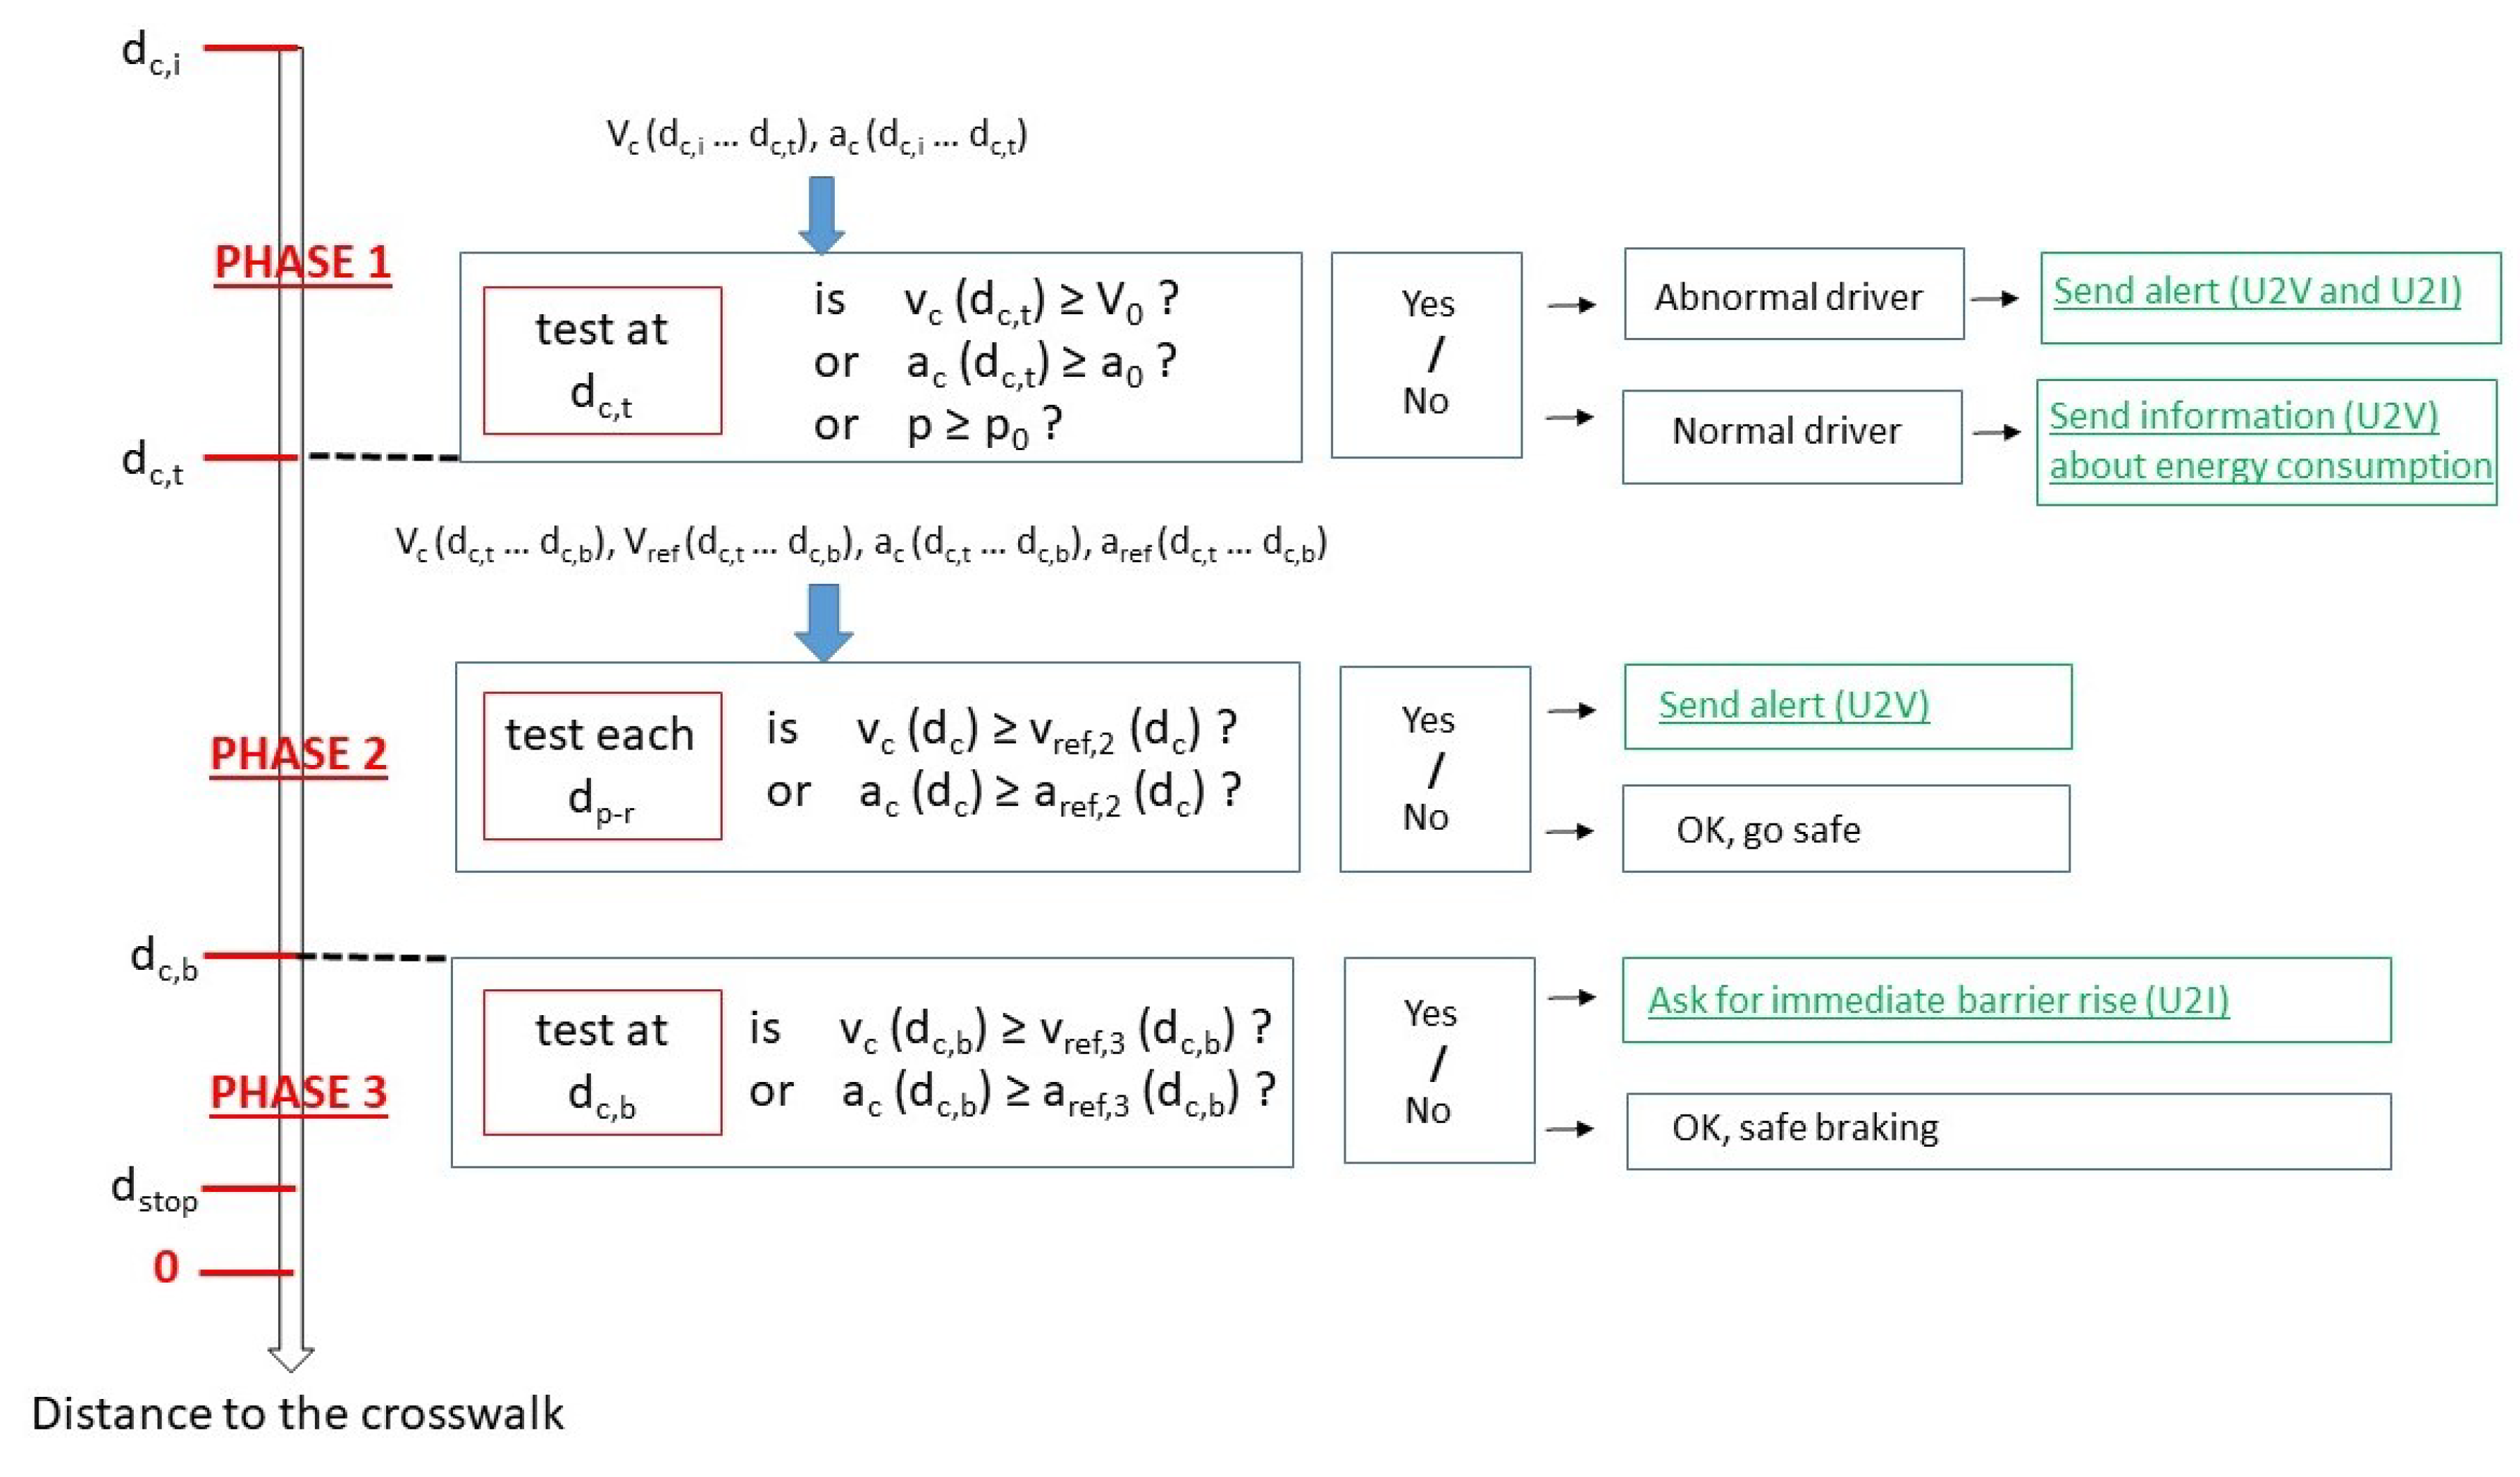
We now detail our proposed algorithm which consists in three phases. The first phase aims at determining if the vehicle driver is normal or abnormal. During the second phase, the drone suggests as a decision to the vehicle to progressively decrease its own speed if necessary. Finally, the third phase concerns the final braking step. The algorithm is summarized in Figure 4.
3.4.1. Phase 1: Driver Behavior Checking
This phase aims at identifying if the car driver has normal or abnormal behavior. For this, the drone observes the car from initial distance to a threshold distance , between the car and the crosswalk. The collected information are the speed profile and the acceleration profile .
At distance , the drone checks the driver behavior. Two situations are possible. If either or or that more than values in the acceleration profile are greater than , then the drone considers that the driver behavior is abnormal. This means that either the car is approaching the crosswalk too fast or that it has sudden acceleration/deceleration or that it presents residual acceleration (respectively). In this case, the drone sends an alert to the driver, as well as to the infrastructure, unless the drone considers that the car driver behaves normally. In addition, the drone sends information to the vehicle about energy consumption and informs it on whether or not its consumption is well optimized.
3.4.2. Phase 2: Progressive Speed Adjustment
During this phase, the drone focuses on the car progression up to the braking distance. The idea is to compare speed and acceleration profiles with reference profiles and , and this operation is repeated at the expiration of each perception and reaction distance up to the braking distance.
The reference profiles are designed for energy minimization purposes and are similar to those presented in Reference [43] (road speed sectioning). The reference speed varies linearly with respect to the distance (constant speed grade , see Equation (14)), and the acceleration is then a negative constant (it is a deceleration before the driver starts to brake; see Equation (15)).
If or (considering the iteration), this means that either the vehicle is still traveling at too high speed or that it is not decelerating enough. In this case, the drone sends an alert to the driver to reduce the speed, unless the drone considers that the trip is safe and thus it remains silent. The drone forecasts and anticipates the braking distance. However, the most important part of the process holds in the last meters before the crosswalk. If the vehicle has very well predicted its speed within the allotted time, phase 3 does not take place if the pedestrian had time to leave the vehicle driver’s visual line of sight.
3.4.3. Phase 3: Braking
This phase starts at (the vehicle stops, at worst, at the same position as the barrier). Reference braking profiles are given by Equations (17) and (18). The speed profile is determined by kinetic energy dissipation model, and the acceleration profile is related to the time derivative of the former. At , the drone compares the vehicle speed with the reference speed value (i.e., ). If (cooperative driver), the braking will be safe, and the vehicle will stop before the barrier, unless there will be a collision between the car and the barrier but the pedestrian remains safe. In all cases, to compute speed and acceleration in this phase, should be replaced by in (17) and (18).
3.5. Simulation Setup
3.5.1. Simulation Parameters
In the following, we consider that the earth gravity is equal to m·s and that the friction coefficients satisfy Equation (8) or (9) or (10) or (11). The other parameter sets are detailed in Table 2 (for road-related parameters) and Table 3 (for vehicle-related parameters). We recall that, in all our equations, the parameters are defined in the International System of Units. In Table 2, the speed limit and the speed grade are given in another unit (km·h), more representative of what is used in practice. Finally, for phase 1, we assumed that the data (speeds and accelerations) are collected each m.
3.5.2. Driver Profiles
To perform all the simulations and cover all the possible cases in phase 1, four examples of drivers profiles are considered. We recall that data are in practice collected through U2V communication channels.
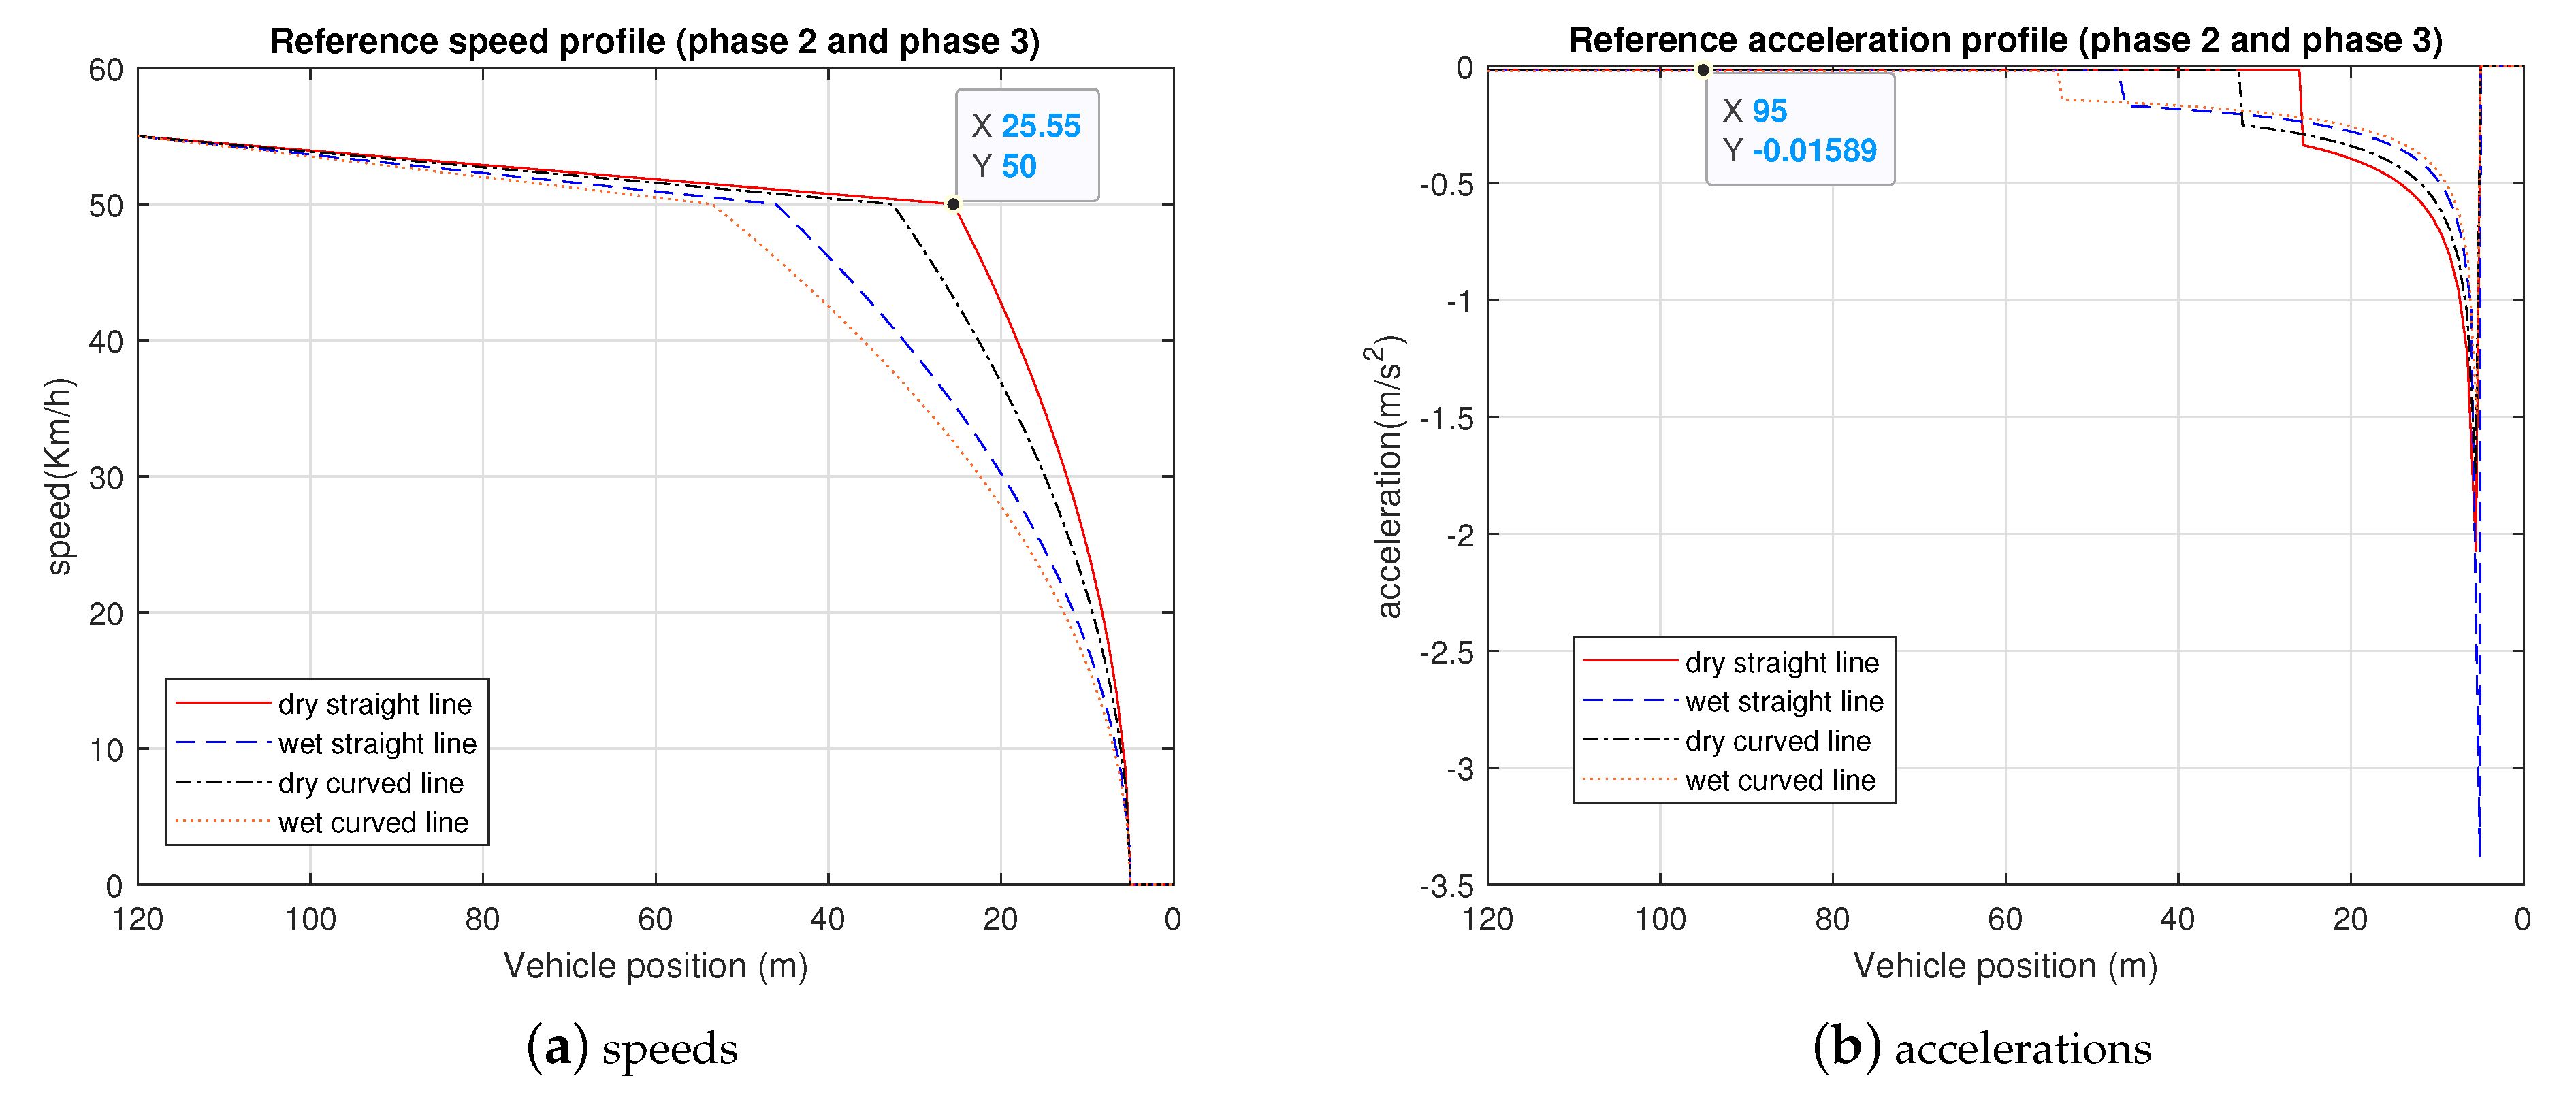
3.5.3. Reference Speed and Acceleration Profiles
Based on these parameters, the braking process starts at m if the trajectory is a dry straight-line, at m if the trajectory is a wet straight-line, at m if the trajectory is a dry curved-line, and at m if the trajectory is a wet curved-line. In Figure 5, we depict the speed and acceleration reference profiles for all cases.
4. Results
4.1. Drivers Behavior Identification
We now present the simulation results, starting by the phase 1. The algorithm outputs are summarized in Table 4. One can see that the results are coherent with data from Figure 3.
At distance m, the driver “type 1” arrives with a speed of 50 km·h (speed limit) and a null acceleration. Moreover, all the acceleration absolute values are at most equal to 0.6 m·s. This means that type 1 corresponds to a normal driver. For the driver “type 2”, despite the fact that all acceleration values are similar to those of driver type 1, the speed at m reaches 70 km·h. The driver is abnormal because of exceeding the speed limit. For the driver “type 3”, despite the fact that the speed satisfies the limit at m, the acceleration absolute values are, however, mostly higher than 1 m·s (16 values among 20). Hence, this driver is abnormal because of residual acceleration. For the driver “type 4”, despite the fact that the speed satisfies the limit at m and that acceleration absolute values are all lower than 0.9 m·s, the last value is equal to 1 m·s. Hence, this driver is abnormal because of sudden acceleration at m.
4.2. Speed and Acceleration Variations
We are now interested in both speed and acceleration profiles from m to 0 m. During phase 2, for driver type 1, 3, and 4, the perception and reaction distance is equal to 25 m (and they have the same speed at ). For driver type 2, the perception and reaction distance is equal to 35 m. In addition, hence, from now on, we show results only for driver type 1 and 2.
During each iteration of phase 2, if the driver does not react to the drone alert, the speed is kept constant (compared to the previous iteration), and the acceleration is equal to 0. If the driver reacts to the drone alert (cooperative driver) or if there is no drone alert, at each iteration, the speed decreases by 10 km·h, and the acceleration is a negative constant (−0.1 m·s.
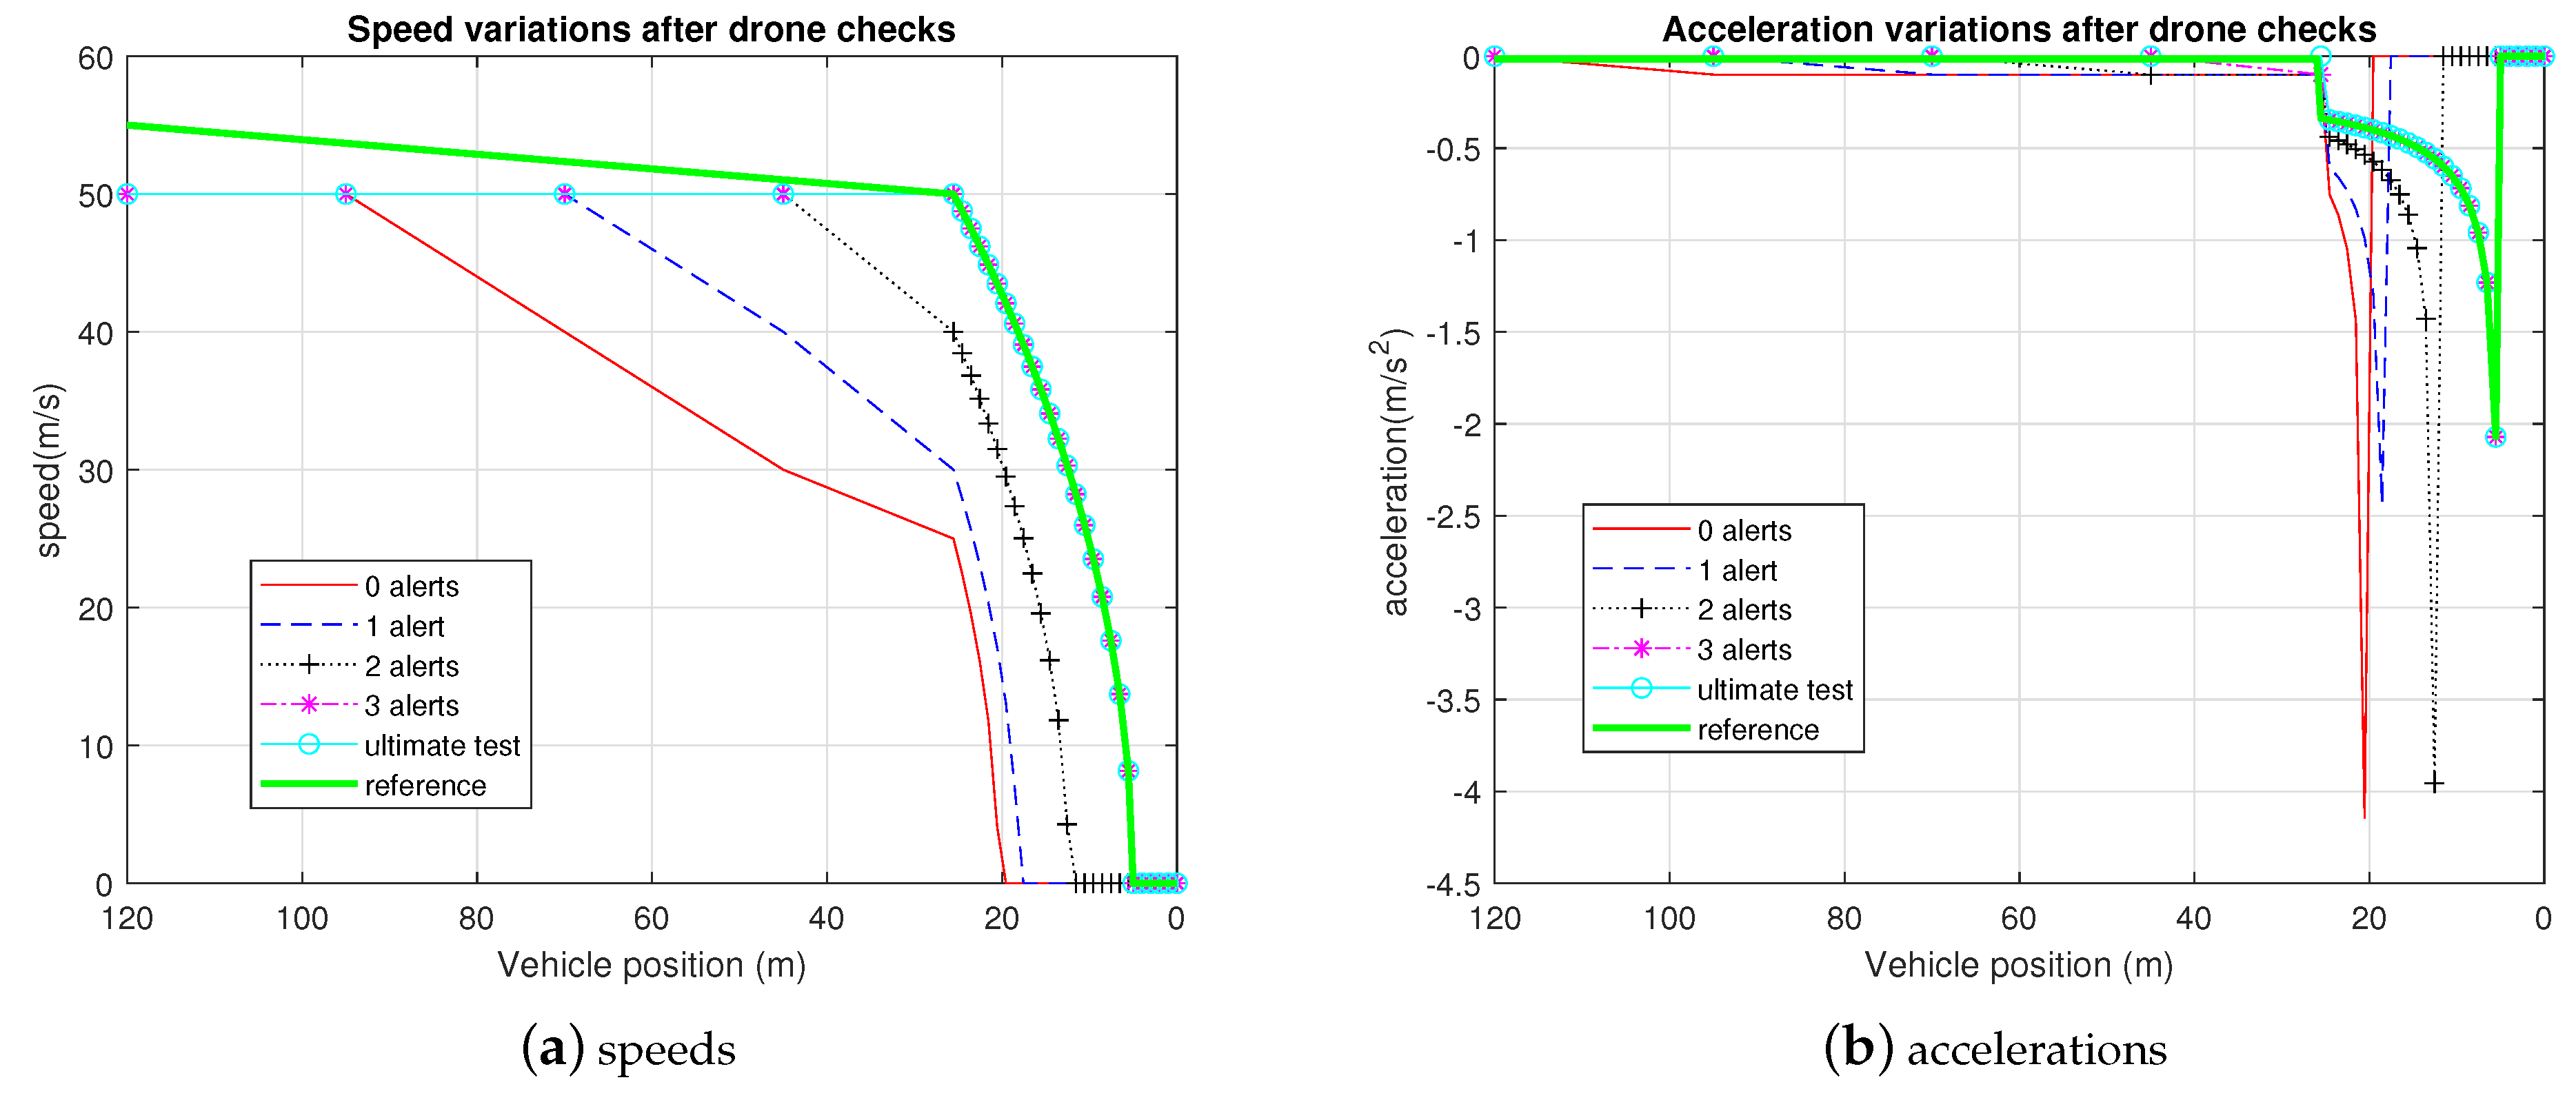
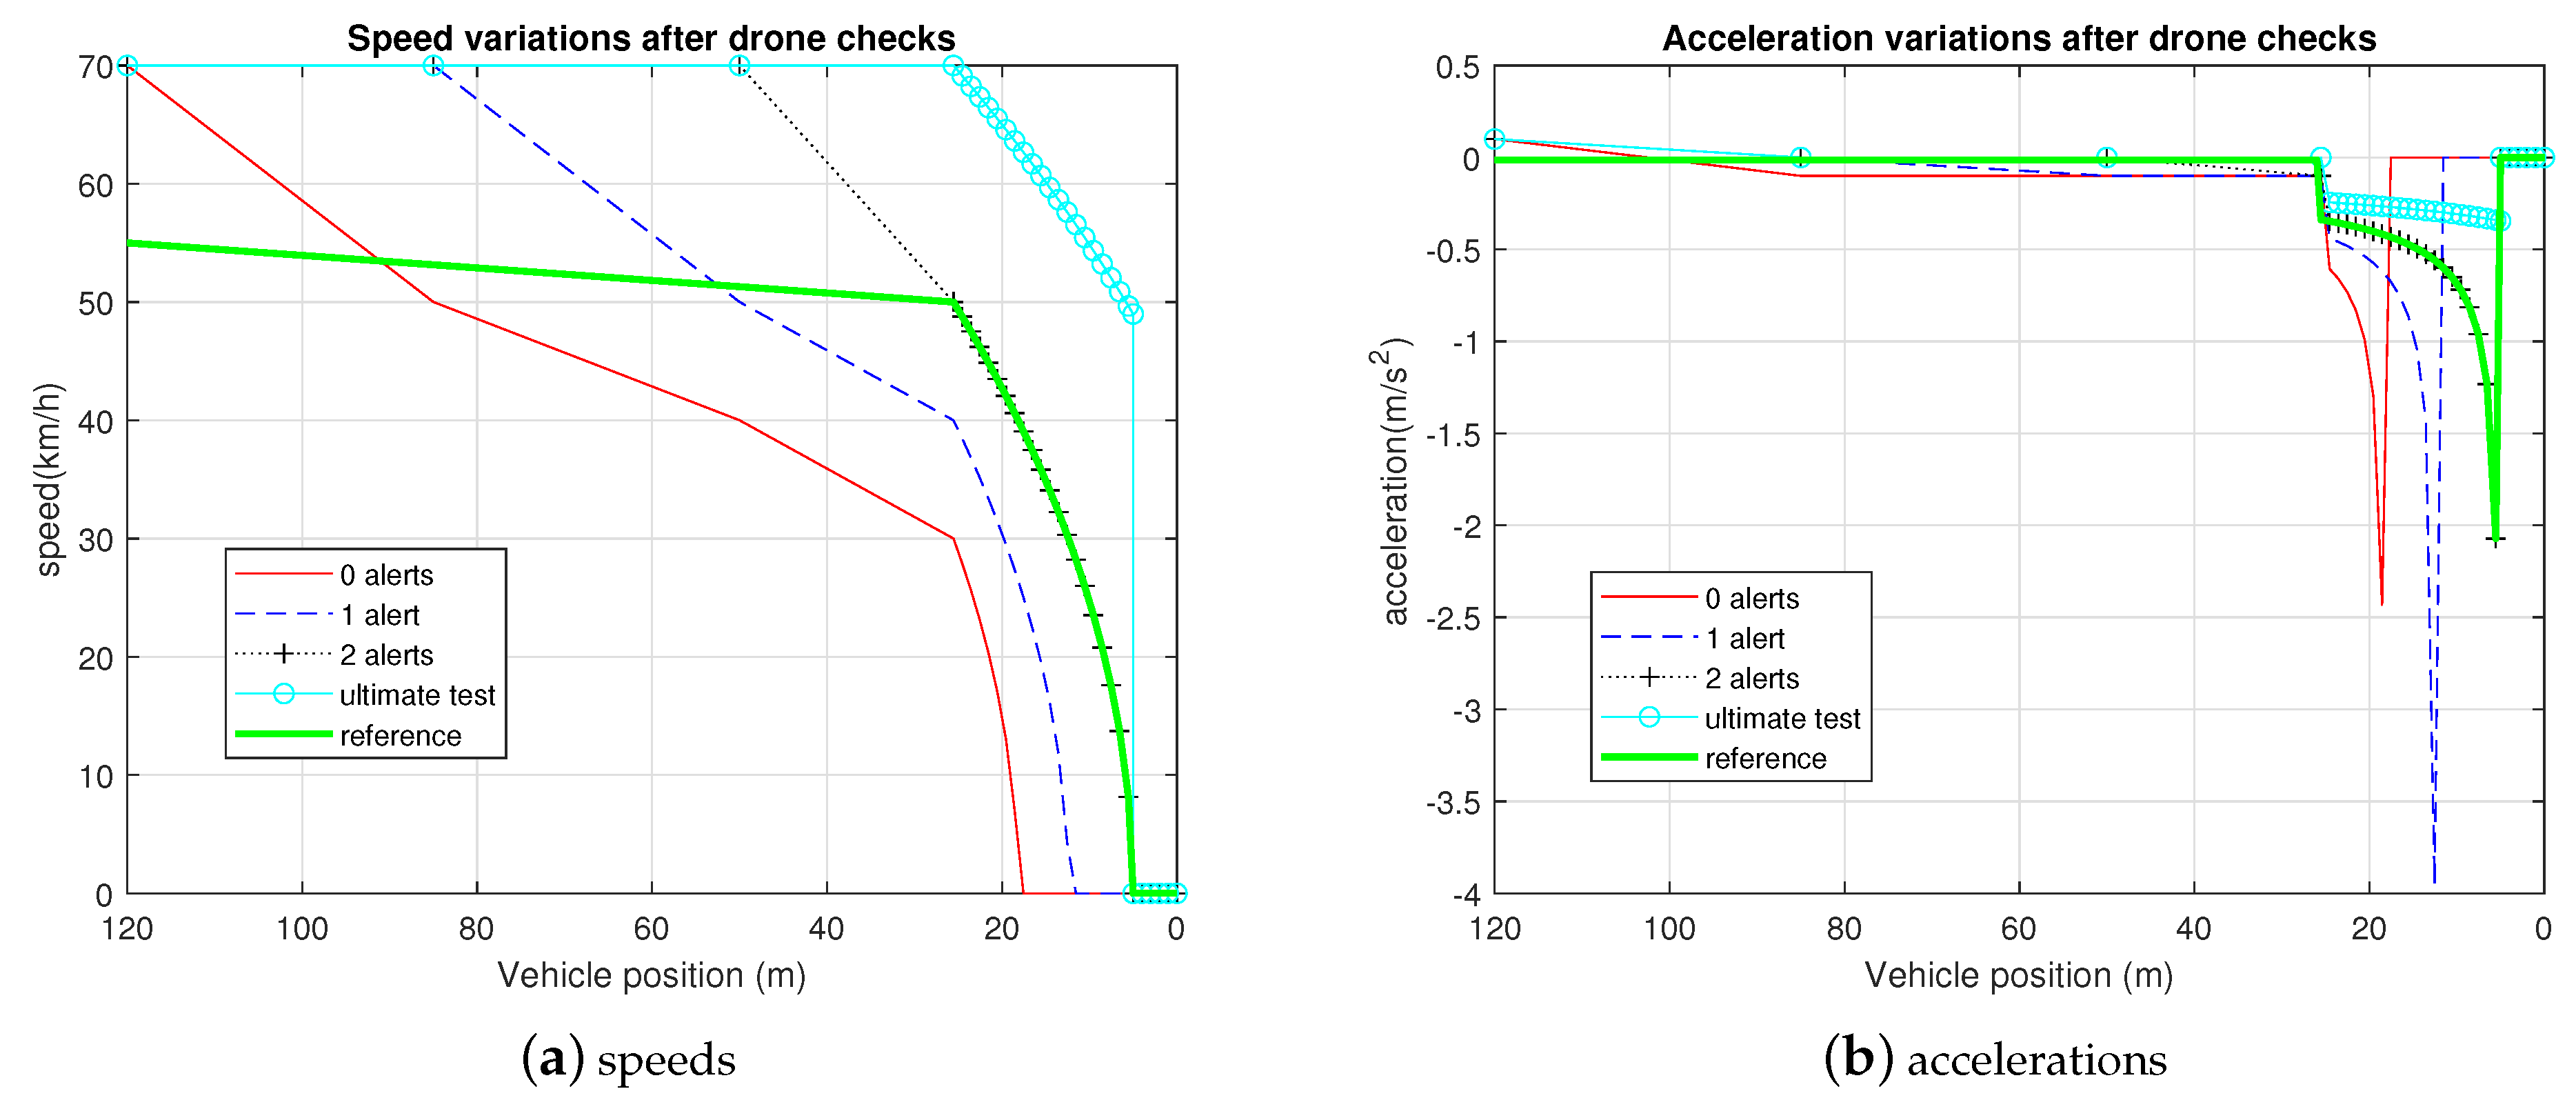
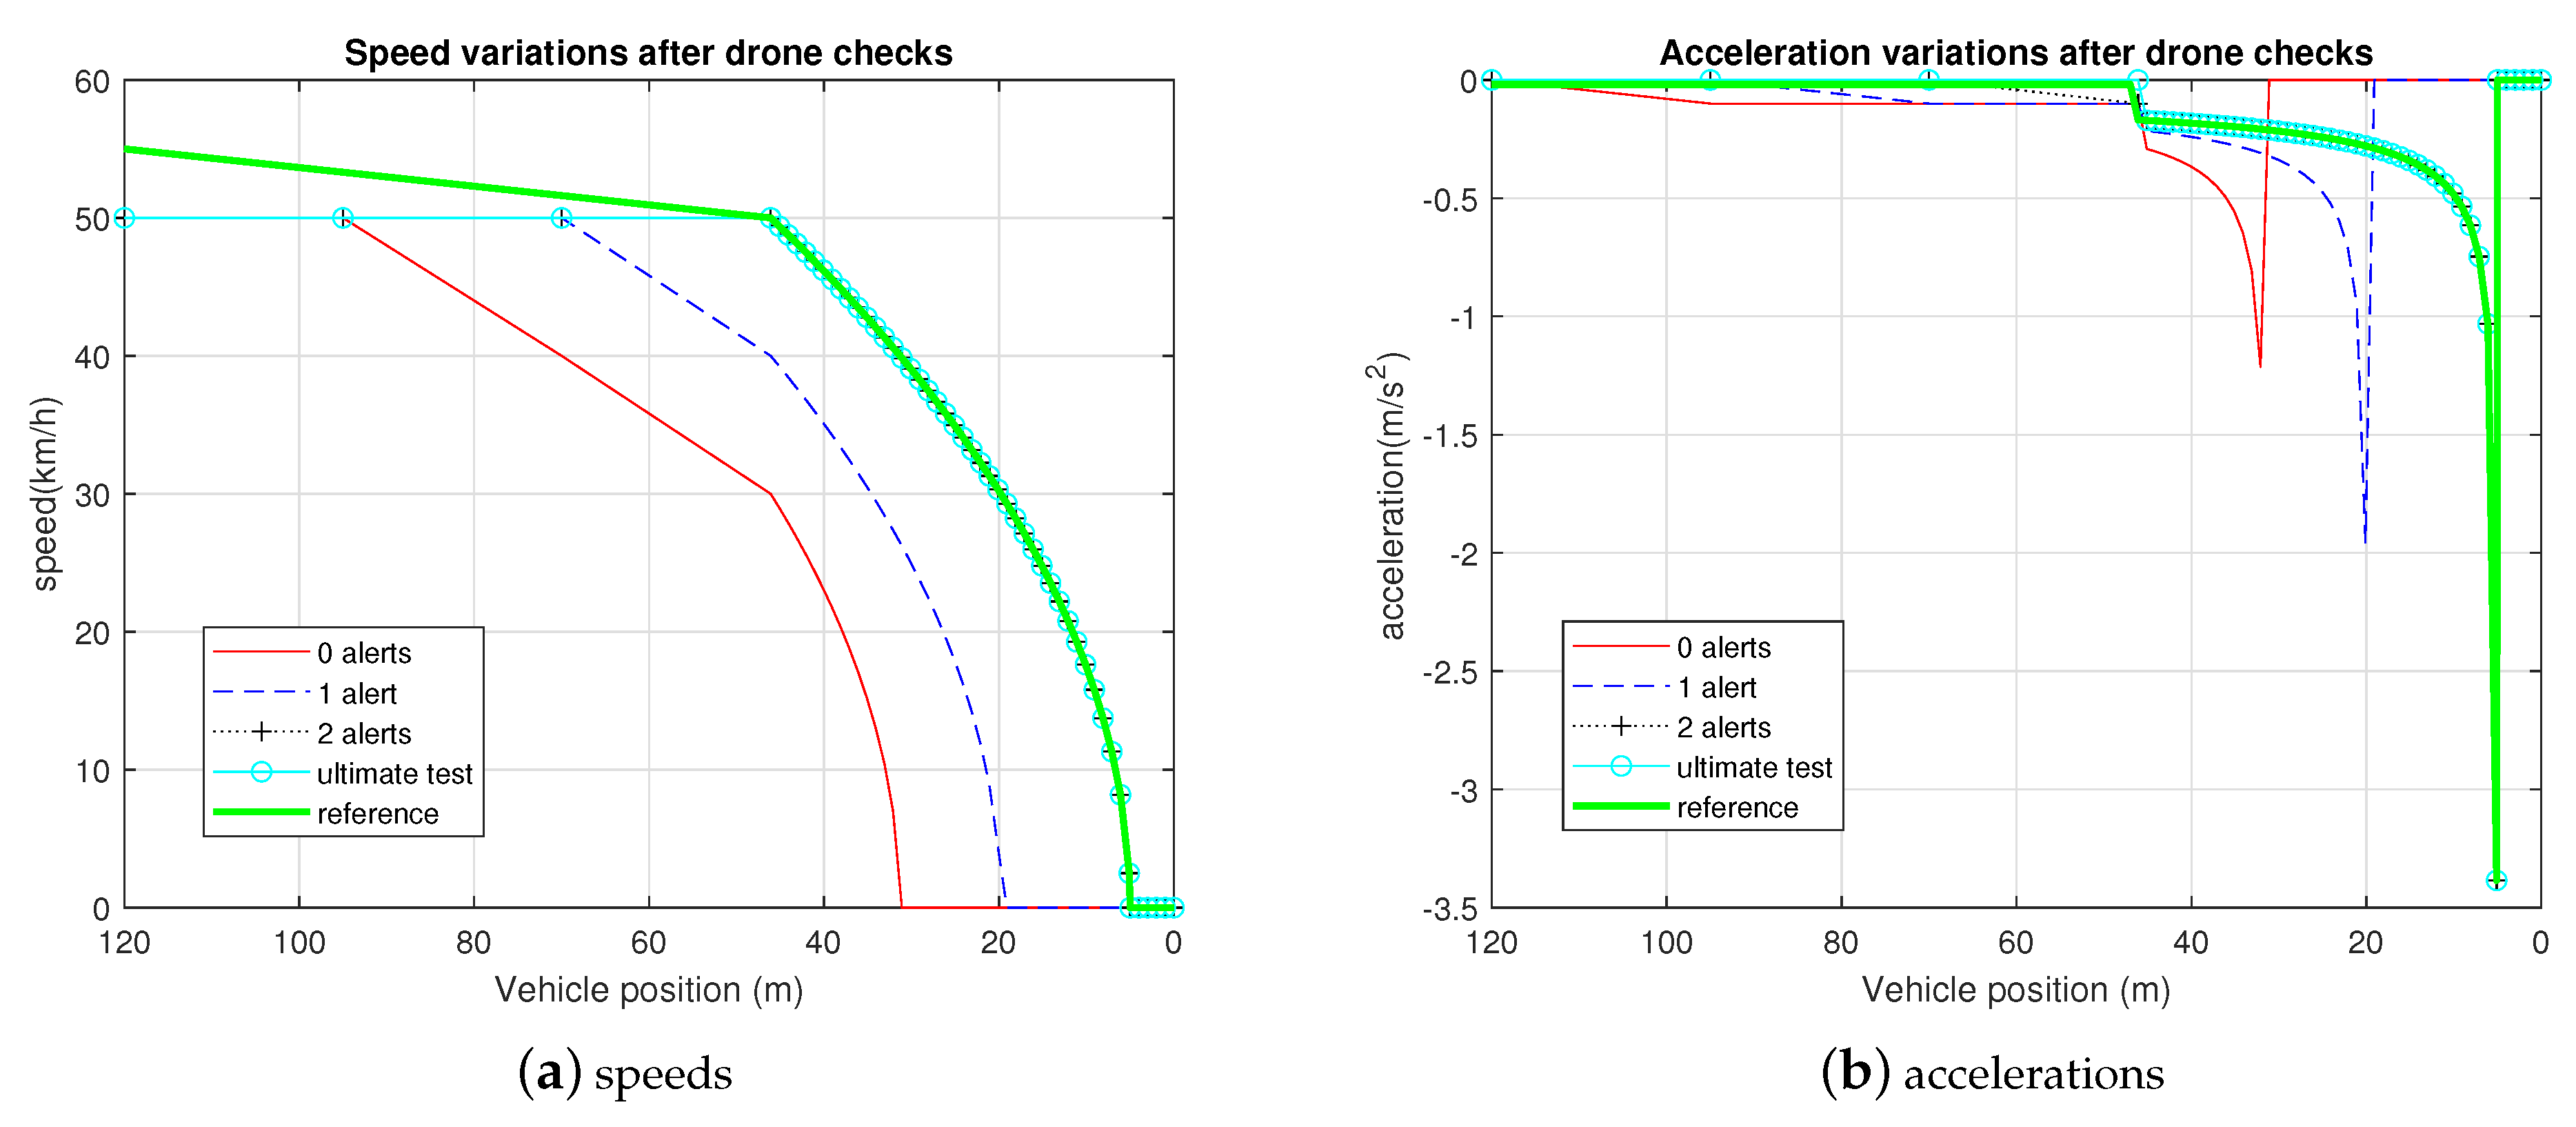
4.2.1. Case of Dry Straight Line
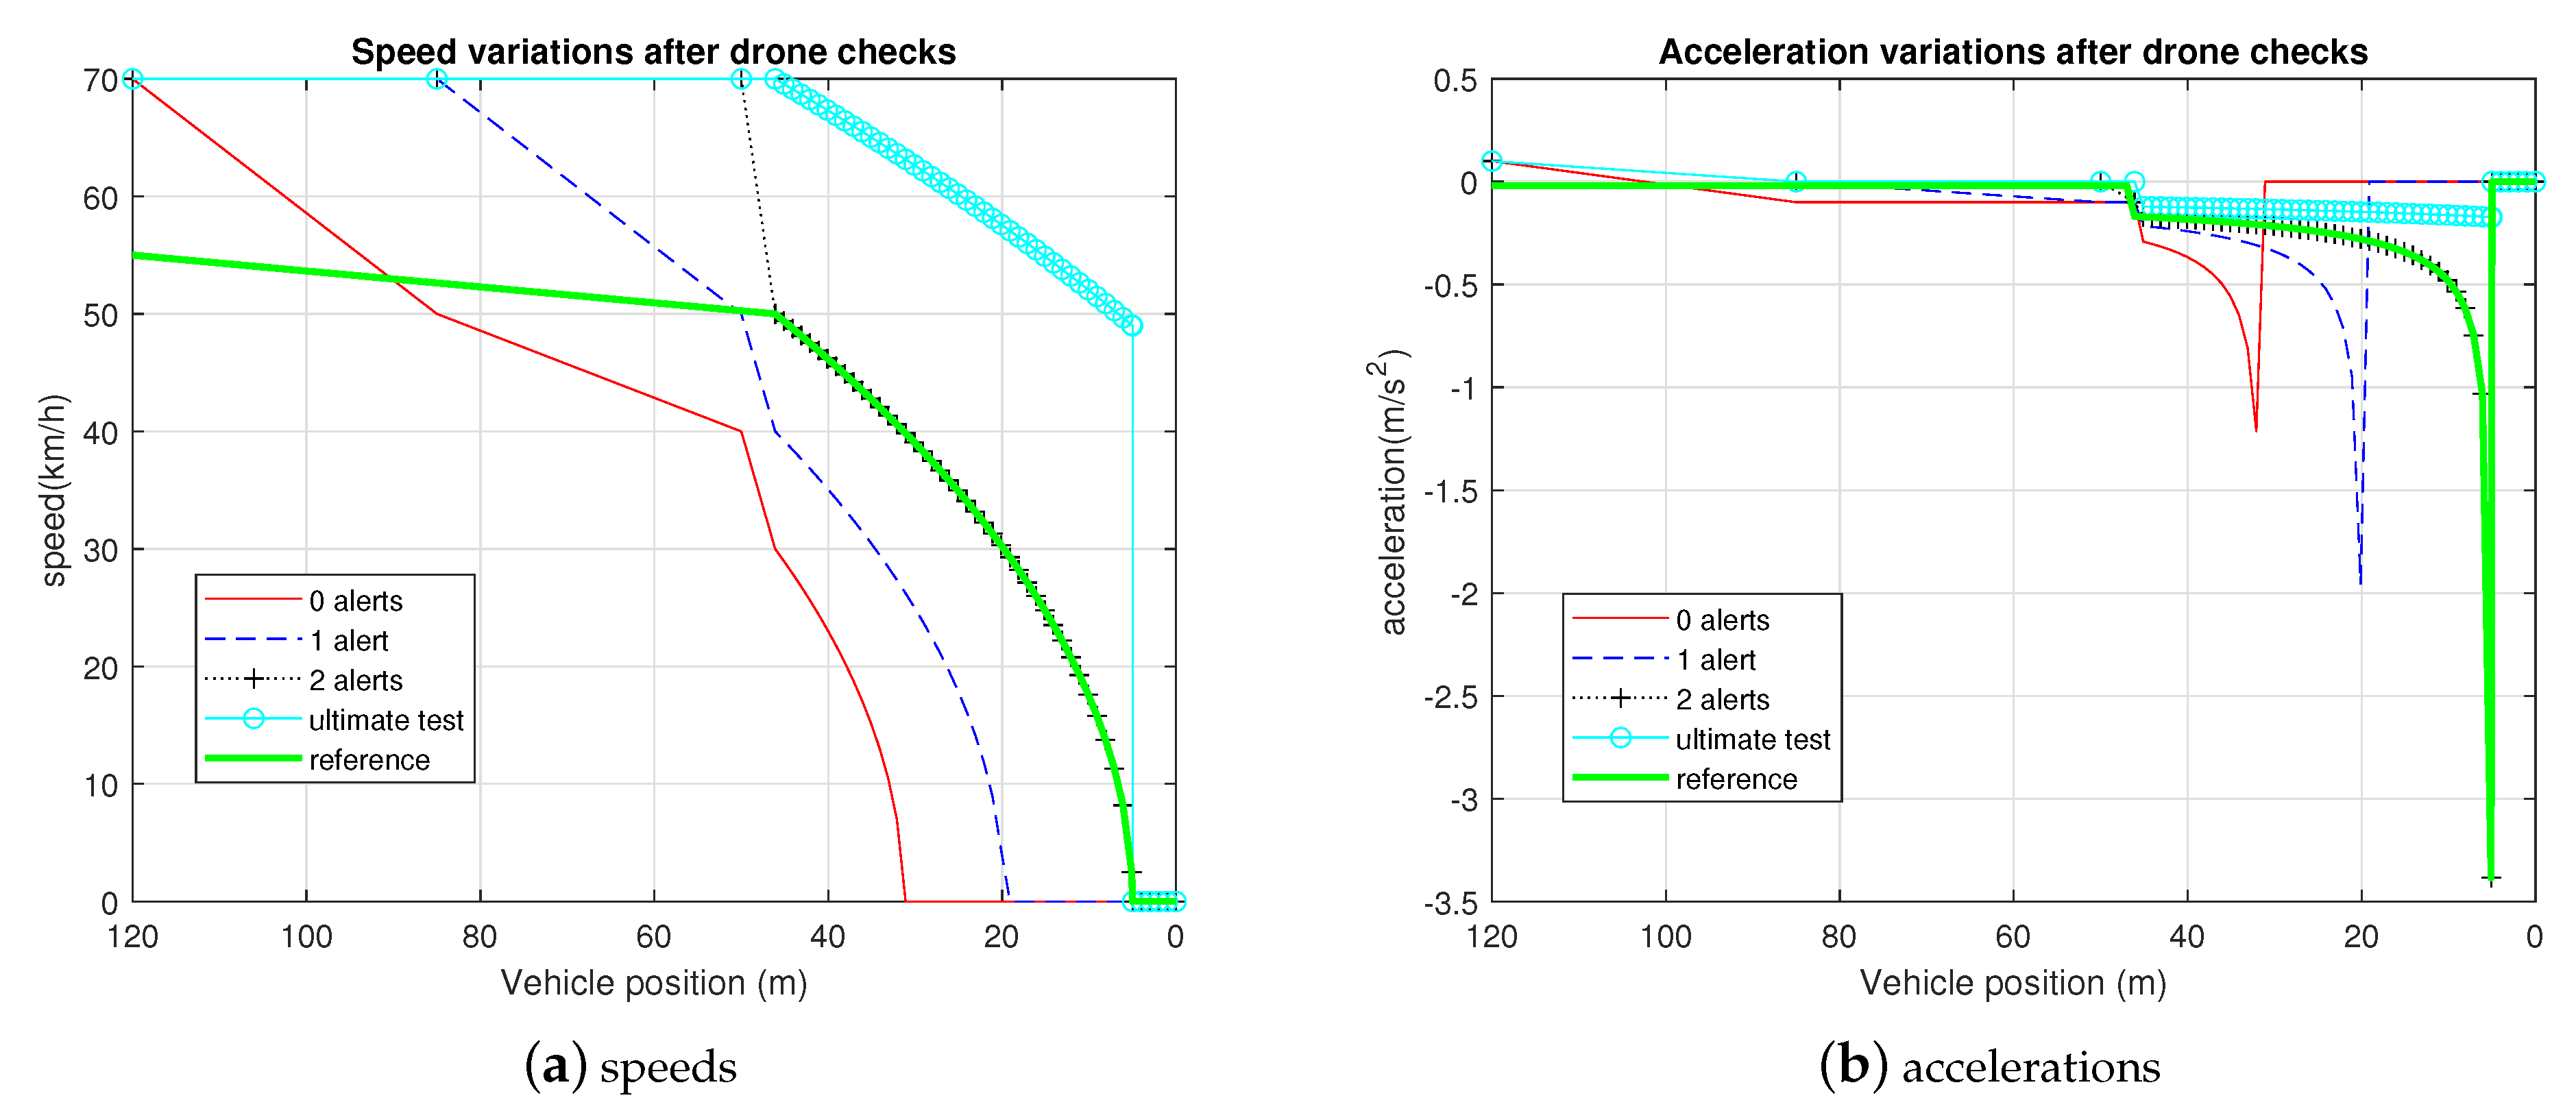
In this case, phase 3 starts at m (ultimate test) for all the considered driver types. This means that there are 3 intermediate behavior checks (at 95 m, at 70 m, and at 45 m) for driver type 1 and 2 intermediate behavior checks (at 85 m and at 50 m) for driver type 2. We summarize the results for both drivers in Figure 6 and Figure 7.
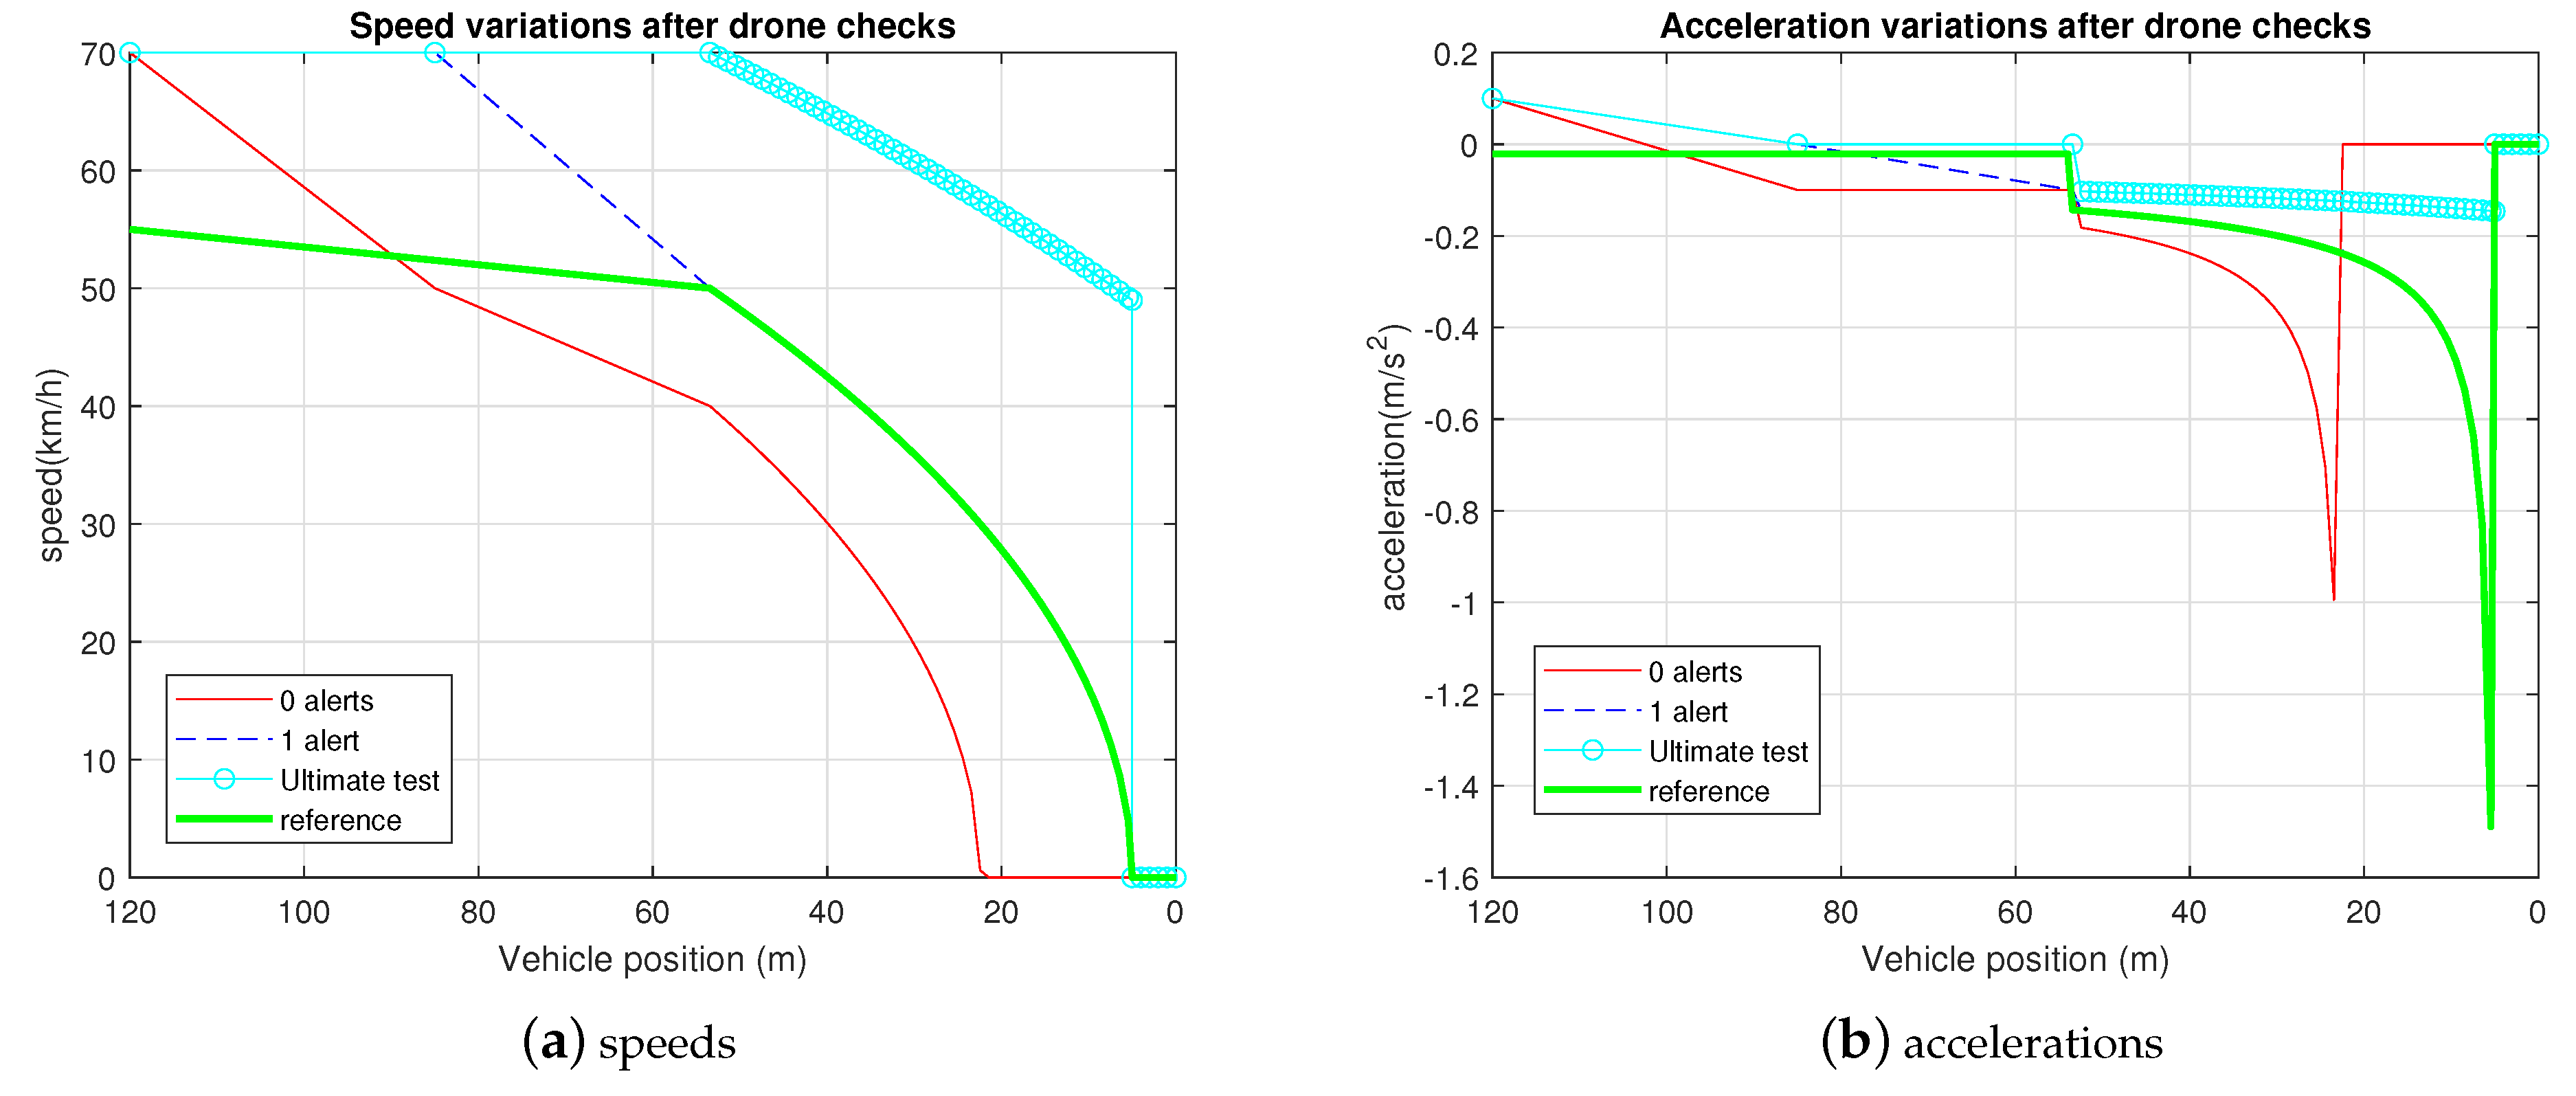
As expected, we notice that, for both driver types, the earlier that the car driver reacts to the drone alert(s), the shorter is the braking distance. In particular, if the deceleration starts after the first drone alert (i.e., at 95 m for driver type 1 and at 85 m for driver type 2), driver type 1 and 2 are likely to stop 13 m and 9 m before the barrier (both speeds and accelerations drop to 0), respectively, which means that there will be no collision risk. If the driver reacts after the second alert (i.e., at 70 m for driver type 1 and at 50 m for driver type 2), driver type 1 can still stop several meters before the barrier, whereas driver type 2 becomes at the braking limit. In fact, for the latter, the braking process must start at m, whereas the perception and reaction distance is 35 m, which means that, if driver type 2 does not react to the second drone alert (at 50 m), it will be too late to change the behavior before the ultimate test, and there will be a collision. This phenomenon is emphasized in “ultimate test” curves (see Figure 7a), where one can see a vertical segment at 5 m. We now focus on the acceleration variations. We can see that, for both driver types, the shorter the braking distance is, the shorter is the braking process, i.e., the earlier the acceleration goes to 0 m·s. At the braking limit, driver type 2 starts to brake at m, but the deceleration is insufficient to avoid the collision with the safety barrier.
4.2.2. Case of Wet Straight Line
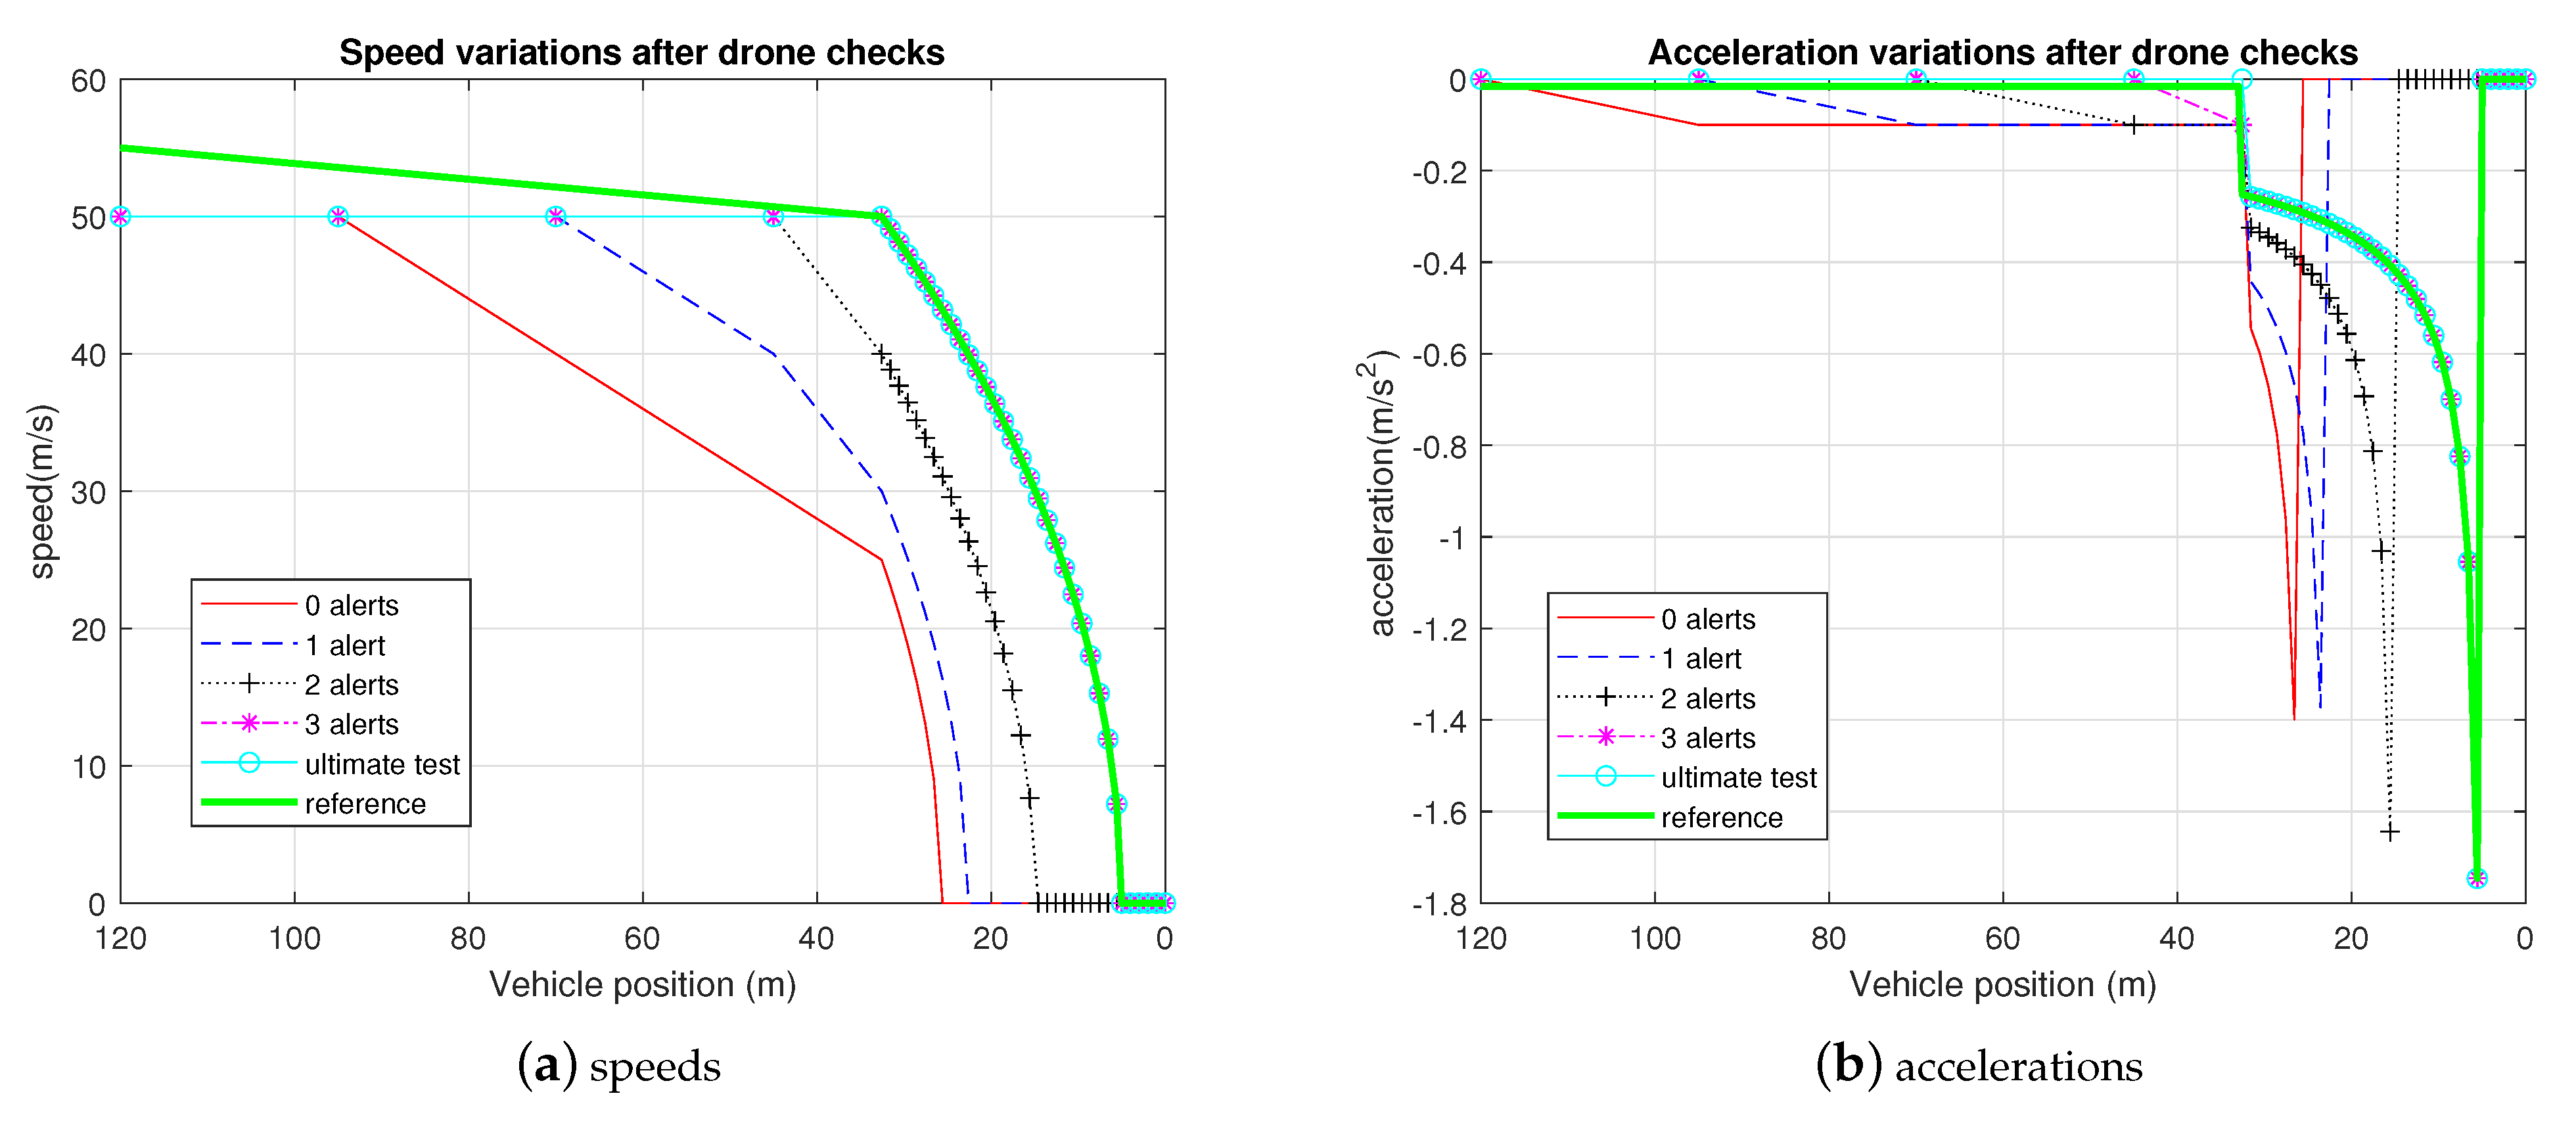
In this case, phase 3 starts at m (ultimate test) for all the considered drivers types. This means that there are 2 intermediate behavior checks (at 95 m and at 70 m) for driver type 1 and 2 intermediate behavior checks (at 85 m and at 50 m) for driver type 2. We summarize the results in Figure 8 and Figure 9.
In terms of drone signaling impact on the braking distance, we obtain similar results as the previous case. The difference herein is that the braking process starts much earlier, which means that the driver has to be more careful to avoid collisions due to the less favorable friction coefficient .
We can see that, for both driver types, if there is no reaction, at least after the drone second intermediate alert, the vehicle will be at the braking limit, and there will be a collision between driver type 2 and the safety barrier.
4.2.3. Case of Dry Curved Line
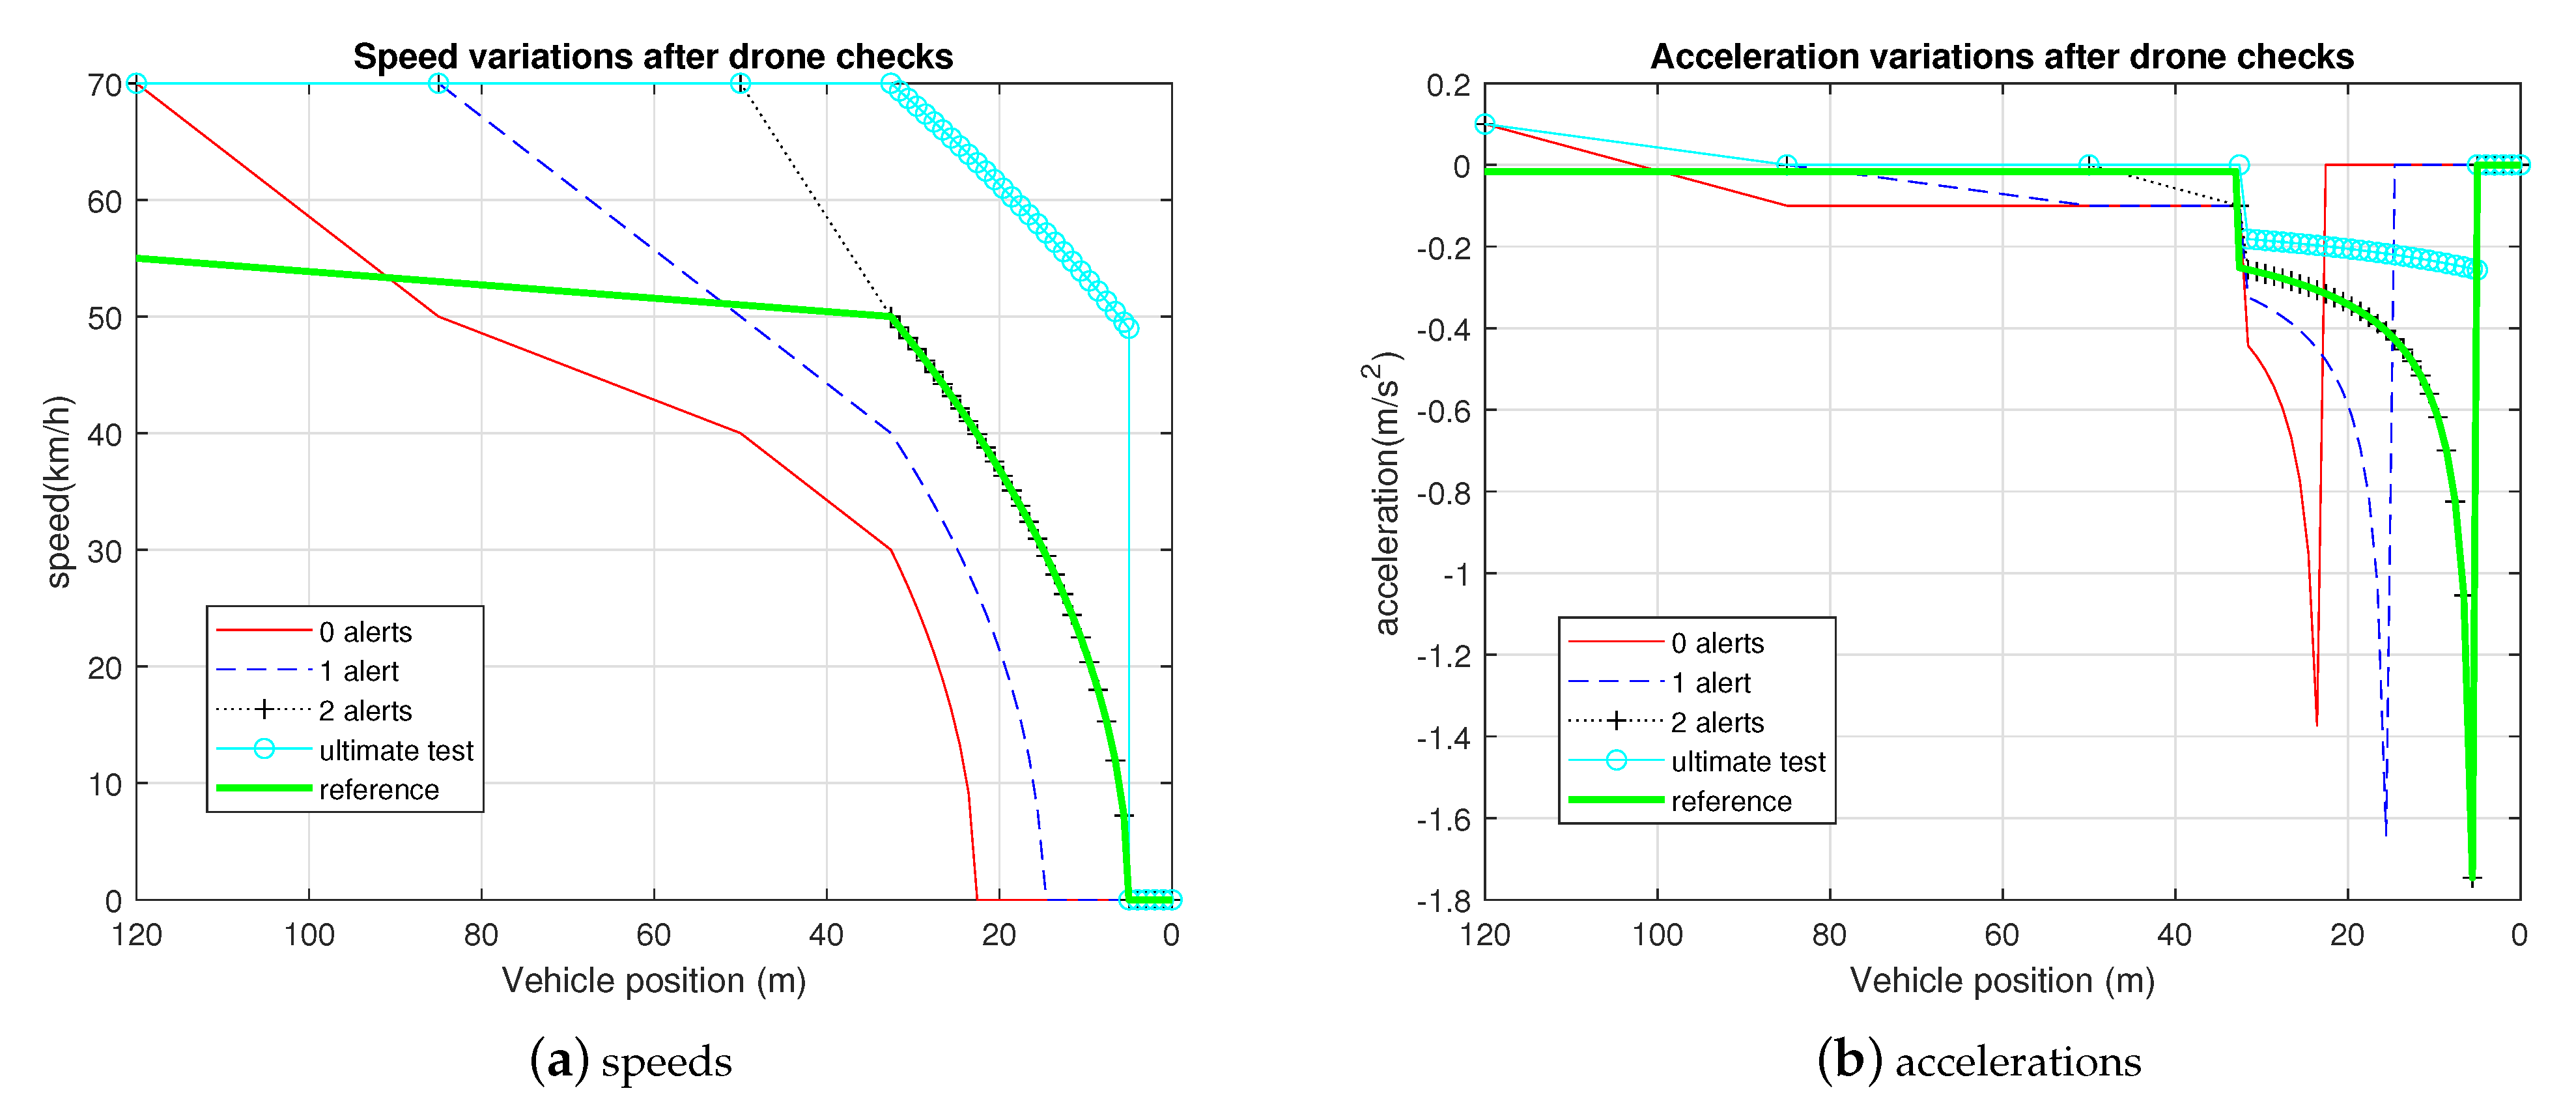
In this case, phase 3 starts at m (ultimate test) for all the considered drivers types. This means that there are 3 intermediate behavior checks (at 95 m, at 70 m, and at 45 m) for driver type 1 and 2 intermediate behavior checks (at 85 m and at 50 m) for driver type 2. We summarize the results in Figure 10 and Figure 11.
Herein, we can also see that drone signaling helps both drivers to stop safely and avoid any collision with the safety barrier. Moreover, in the case of curved line, the pedestrian is likely to be out of the direct visibility of the driver. By applying Equation (6), if the pedestrian comes into the visibility field of the car, driver type 1 needs m to stop, while driver type 2 needs m to stop.
4.2.4. Case of Wet Curved Line
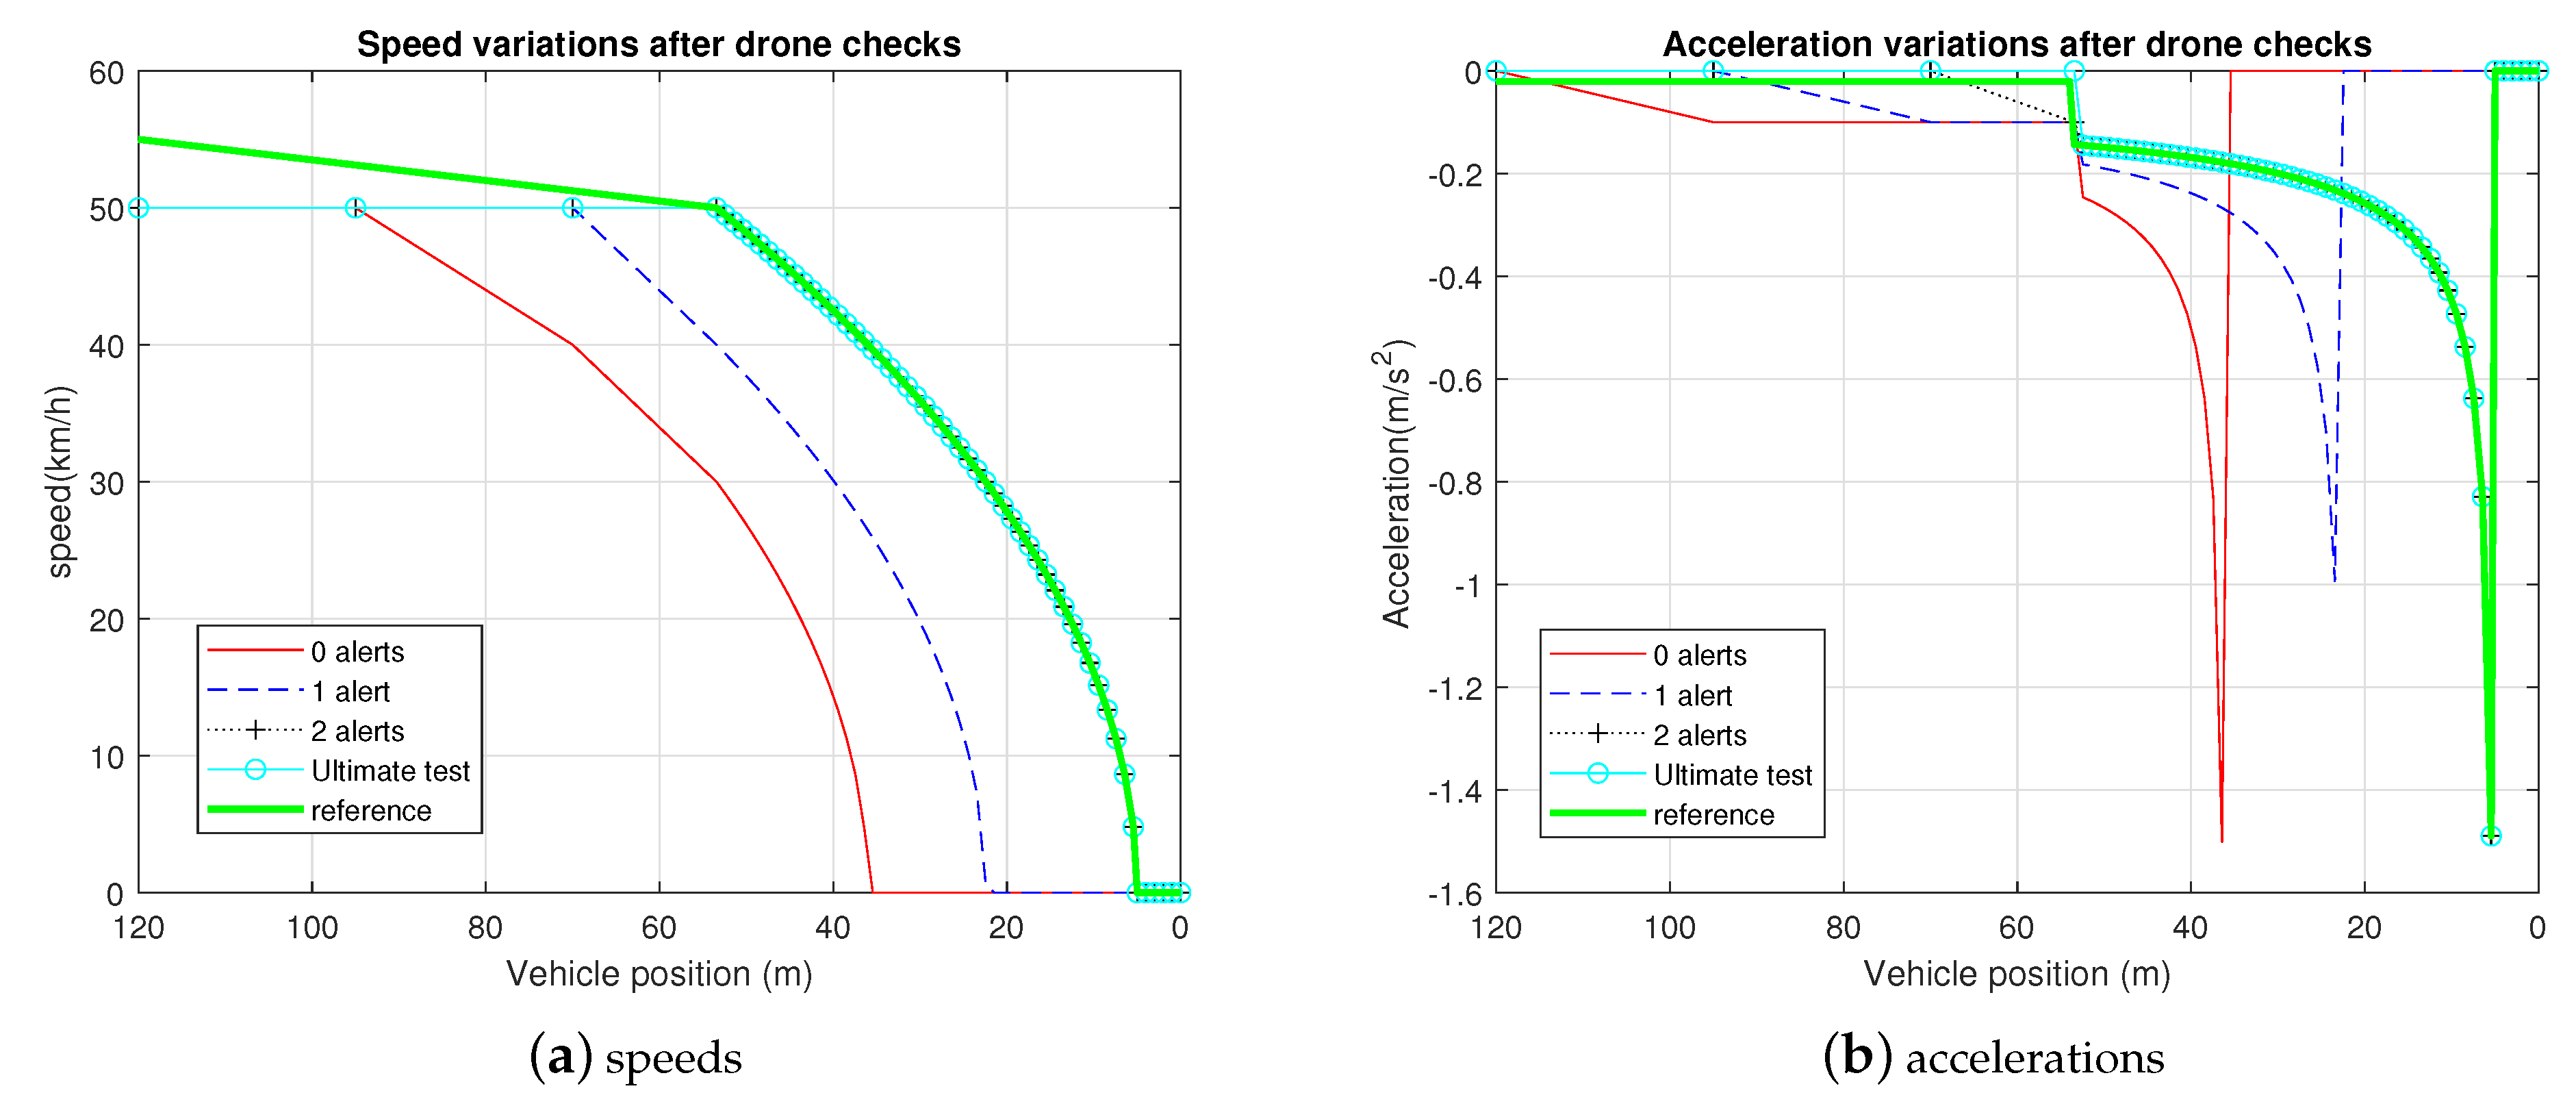
In this case, phase 3 starts at m (ultimate test) for all the considered drivers types. This means that there are 2 intermediate behavior checks (at 95 m and at 70 m) for driver type 1 and 1 intermediate behavior check (at 85 m) for driver type 2. We summarize the results in Figure 12 and Figure 13.
We get similar results compared to the previous cases. More particularly, if the driver 2 does not react after the drone intermediate alert, the vehicle will be at the braking limit, and there will be a collision with the safety barrier.
4.3. Assessment of Power and Fuel Consumption
We are now interested in the influence of driving behavior on fuel consumption along the (500 m) covered distance. We consider the global consumption in liters and the instantaneous consumption in liters per second for the 4 types of drivers already introduced (type 1 to 4).
Figure 14 shows the global consumption in liters for the 4 types of driving along the distance of 500 m. It is easy to notice the peak consumption generated by driving characterized by residual accelerations. Normal driving at near-constant speed within the fuel efficiency range of the vehicle saves up to of energy. Abrupt acceleration also results in fuel consumption increases of up to double that amount. We can easily conclude that driving behavior directly influences fuel consumption and thus has an immediate impact on the vehicle’s harmful emissions. The use of UAVs allows us to predict this behavior and to assist drivers in reducing the fuel consumption of their vehicle.
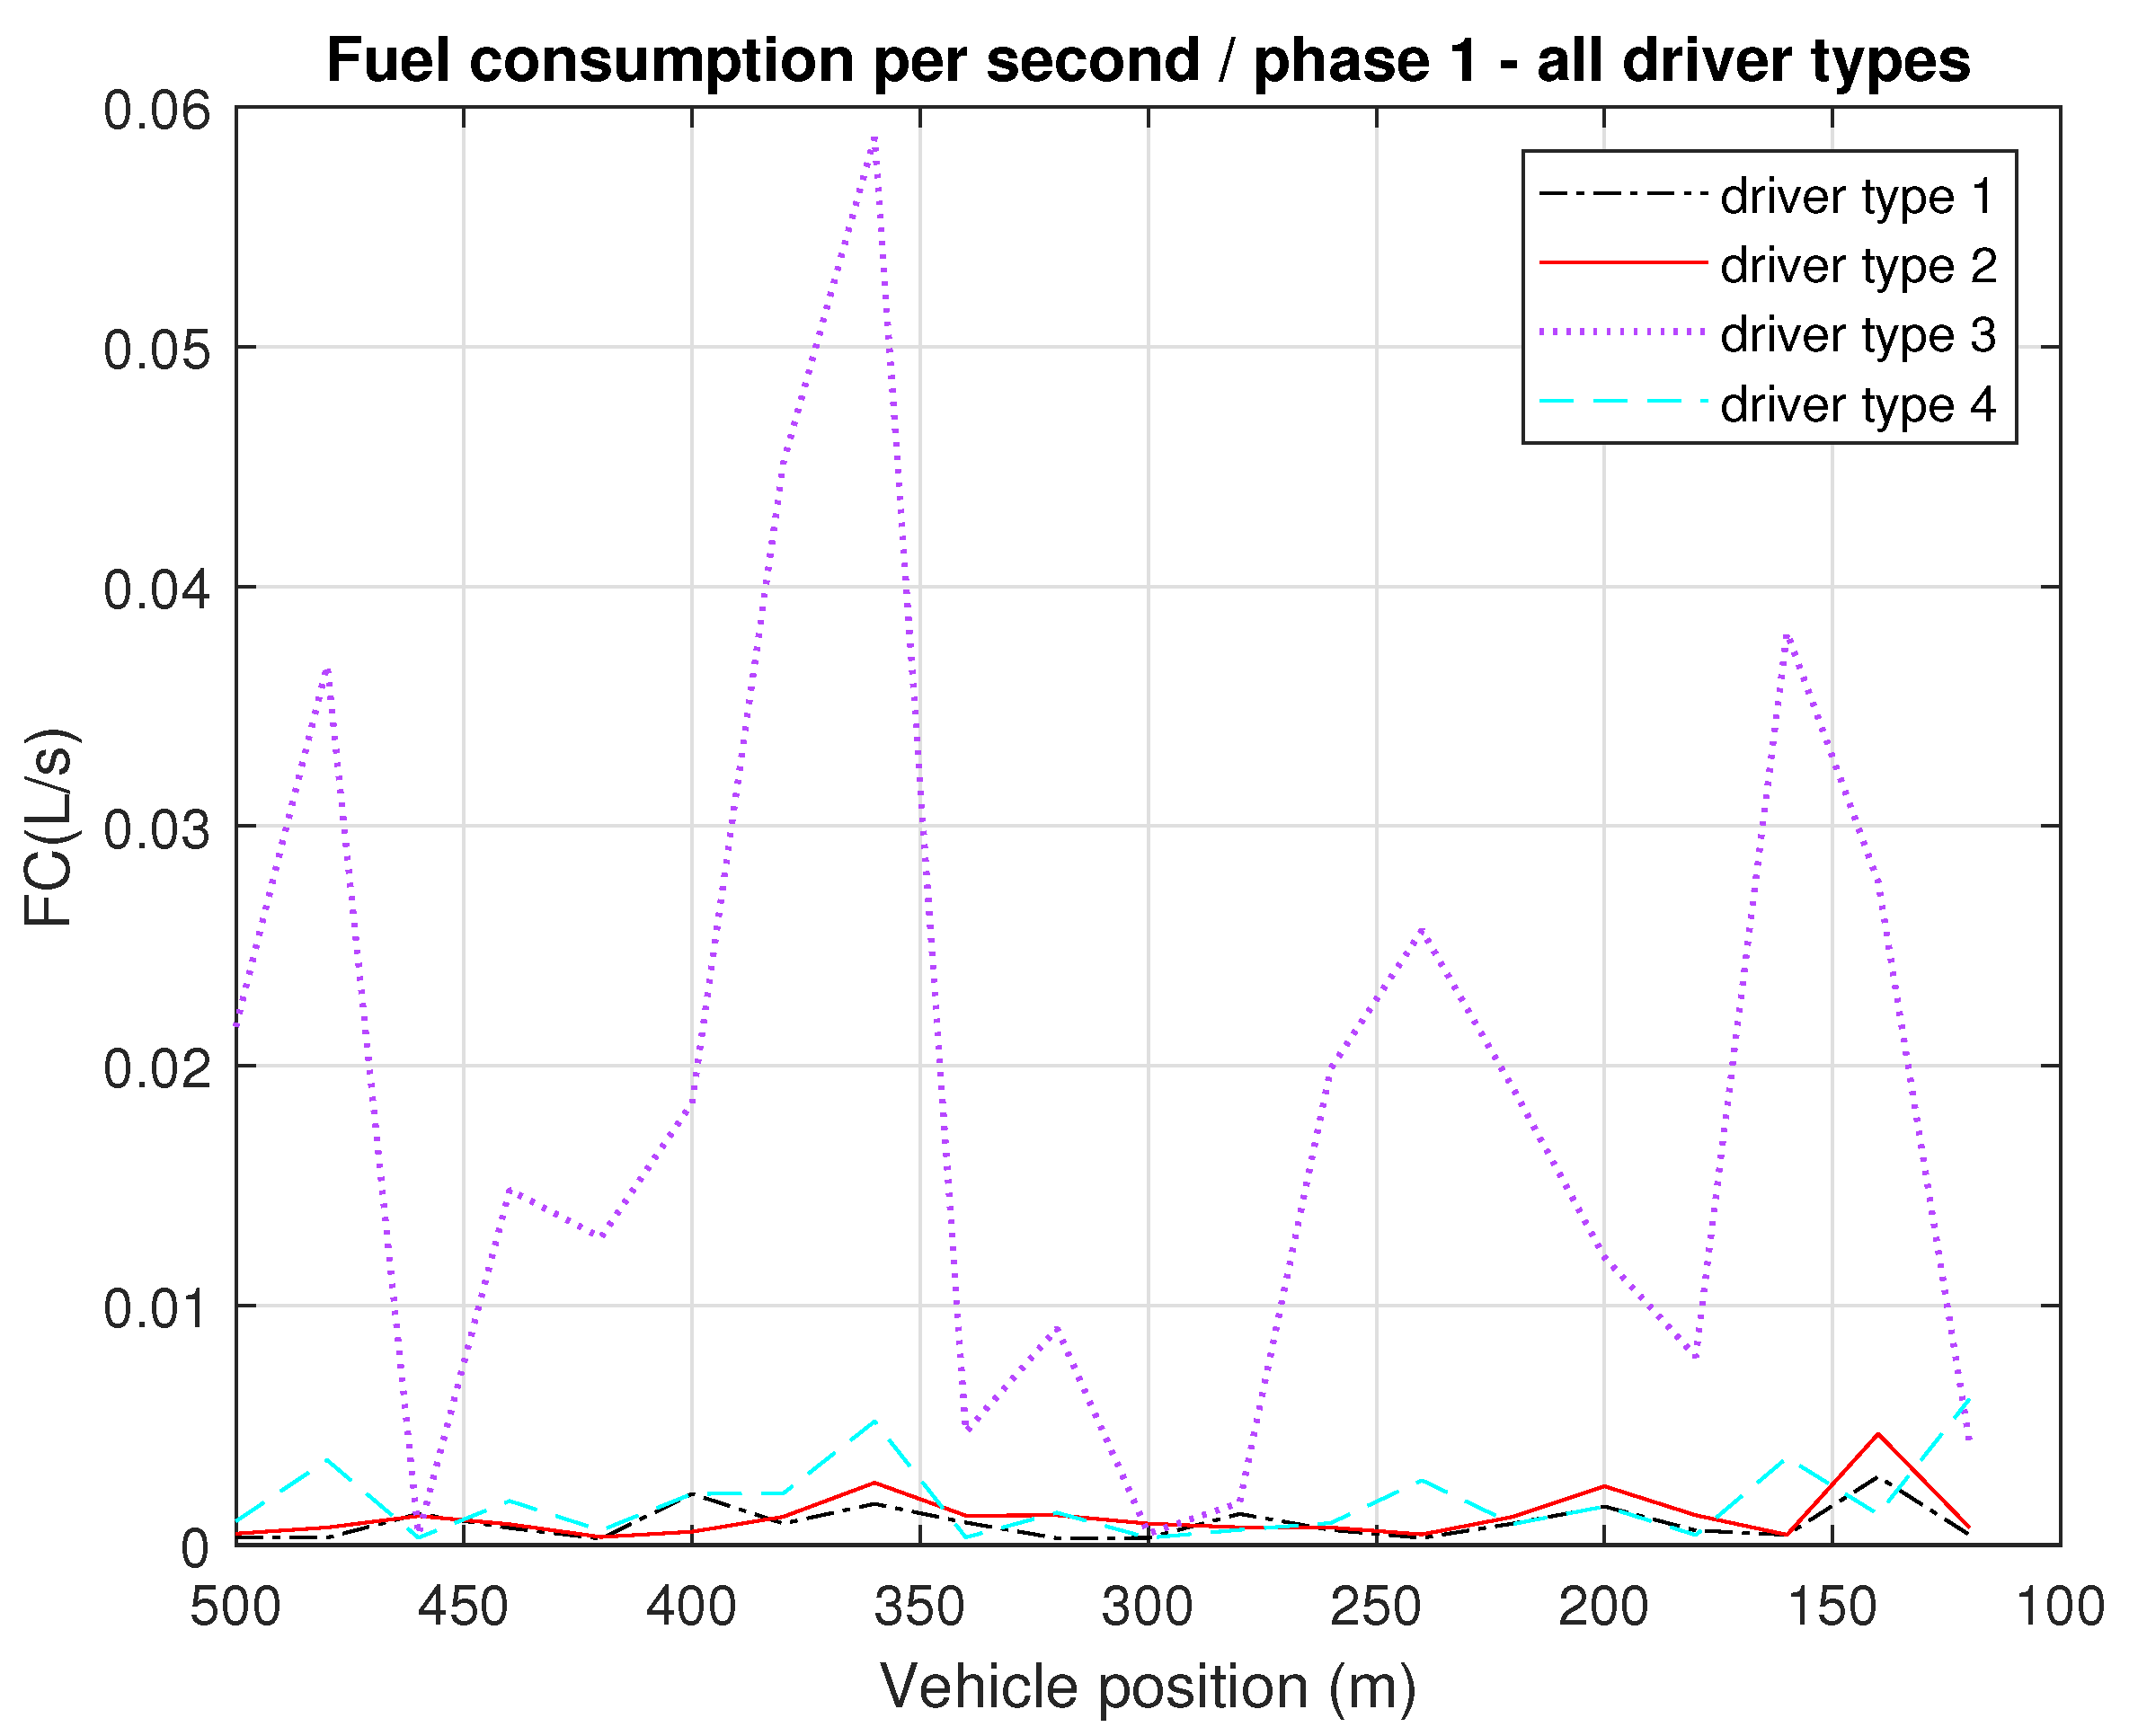
We now represent the energy consumption per second to compare the energy consumption during the three phases (phase 1: observation, phase 2: speed progressive adjusting, and phase 3: braking). We recall that phase 1 reaches from 500 m to 120 m, and phases 2 and 3 together are from 120 m to 5 m. We illustrate the results of phase 1 in Figure 15, for all driver types.
From Figure 15, we can see that driver type 3 has the highest instantaneous fuel consumption. As a consequence, the acceleration is the main parameter behind fuel consumption (and not the speed). Indeed, even though driver type 2 has the greatest speed, its fuel consumption is close to driver type 1 because their acceleration profiles are similar.
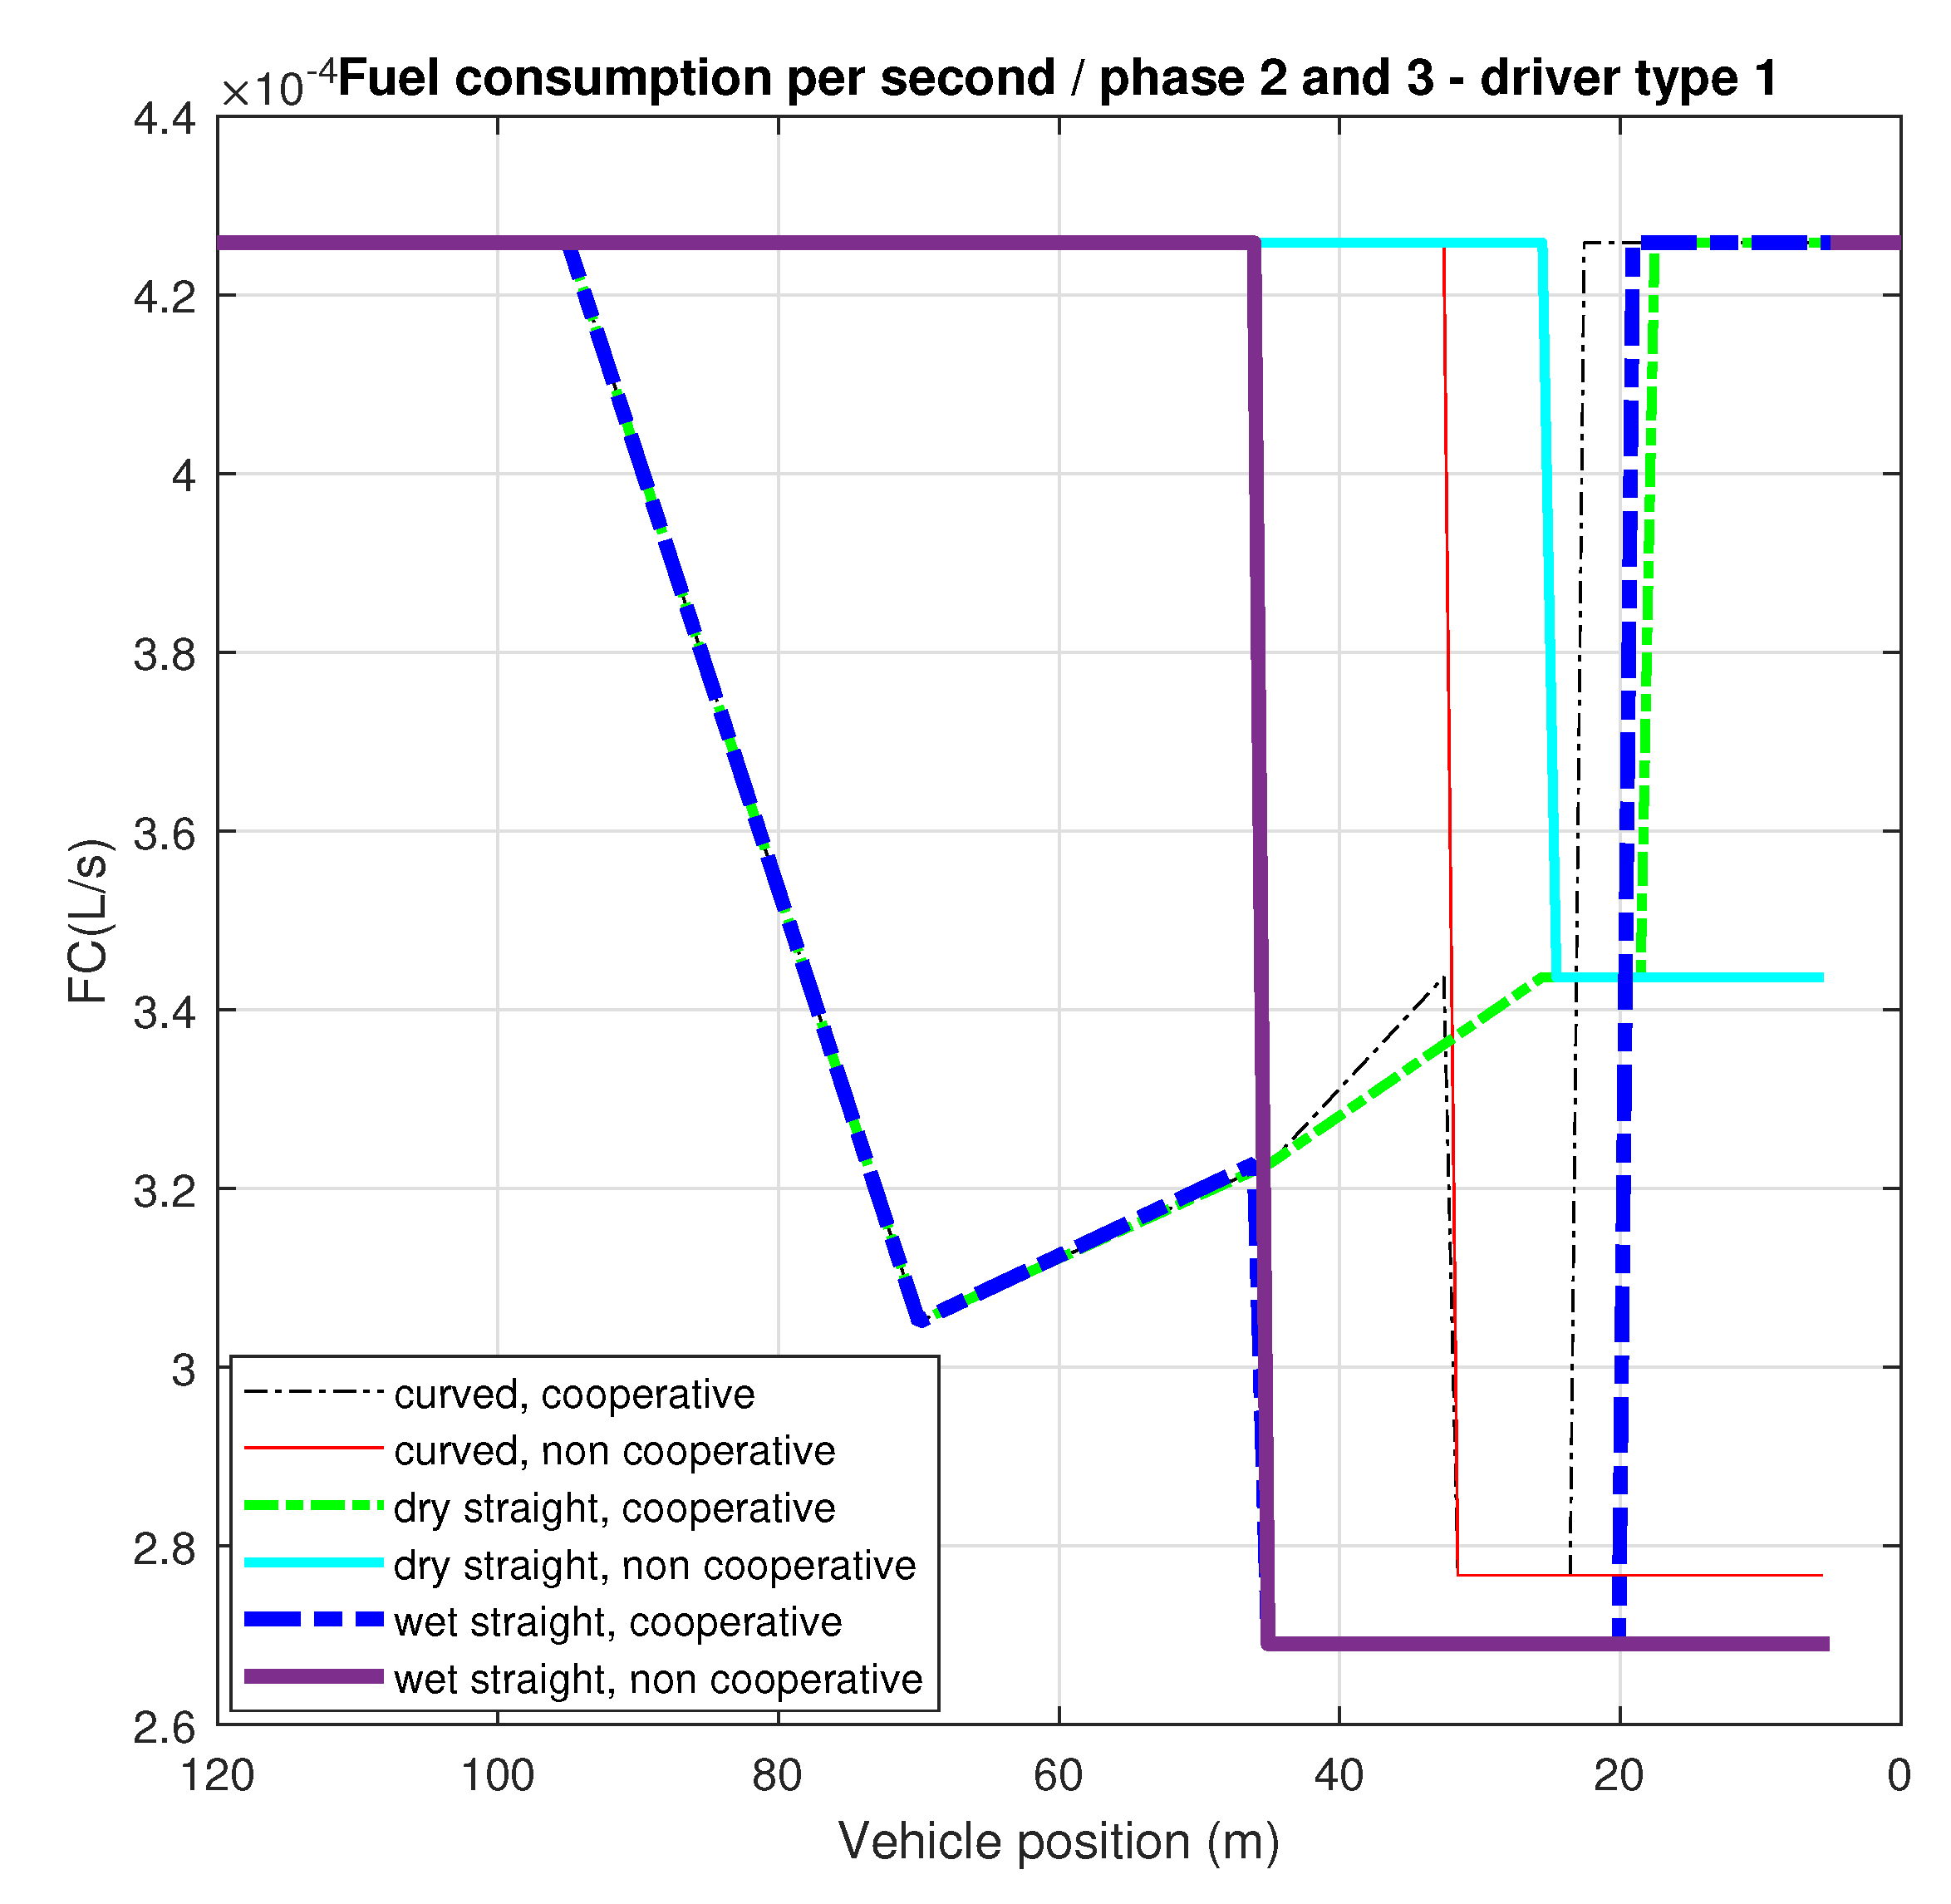
We are now interested in phases 2 and 3 (the stopping process). We illustrate the corresponding results for driver type 1 (as an example) in Figure 16. In this figure, we emphasize the fuel consumption for dry straight line, wet straight line, and curved line. In fact, the main impact of the road type is observed during the stopping process. In addition, we consider cooperative driver (dash lines) and non-cooperative driver (solid lines). The former corresponds to a driver that reacts to the first drone alert, whereas the latter corresponds to a driver that does not take into account the drone signaling.
First, we can see that, during phases 2 and 3, the deceleration is close to zero, compared to phase 1. Consequently, the fuel consumption is lower, and most of the energy is consumed in phase 1, as expected. In addition, during phase 2, the consumed energy in the case of cooperative driver is lower than the case of non-cooperative driver (and this holds for all the investigated road types). Hence, drone signaling helps the driver to reduce the car impact on the environment.
5. Discussion
The French Inter-ministerial Road Safety Delegation indicated in 2019 that the number of accidents increased by over the time slot from 5 p.m. to 7 p.m. and by between 7 a.m. and 9 a.m. As a reminder, pedestrians have priority. Cars must give way to pedestrians crossing or about to cross. Common sense also dictates that we slow down when approaching a pedestrian crossing and that we do not drive with fogged windows. Unfortunately, some drivers do not respect these rules, and it is—again, unfortunately—sometimes up to the victims to protect themselves. Despite the lighting, urban areas are not the safest for pedestrians. The more lights there are, the more drivers will accelerate so as not to wait for red. The stress generated on the road by the proliferation of scooters, buses, bicycles, and scooters can also deteriorate the quality of their driving. In 2018, 475 pedestrians were killed on the roads. The proposed solution to use the drone as an intermediary between the driver itself and the infrastructure brings a safe solution to this observation, either by alerting the driver to modify ts behavior or by making the infrastructure to activating a barrier. Because the accidents’ gravity (number of dead persons by road accident) concerning the pedestrians is not only due to pedestrian crossing situation ( of collisions with pedestrians occur on the roadway, equally on or off pedestrian crossing), if only we could save half of 475 pedestrians per year, it could contribute to the decrease of more than of global road mortality on French roads, as an example. Even if the issue of our solution is to save a pedestrian, either without any other costs than the recourse to this solution itself or added to a material vehicle/infrastructure cost due to barrier collision, a drone assist system with only one drone seems to be a first step in the solution to another wider one that could combine the use of pedestrian alerts to our first solution.
6. Conclusions
In this paper, we tackled the problem of using drone signaling in a crosswalk scenario that is likely to happen in smart cities, as well as that involves a car and a vulnerable road user (a pedestrian). For this, we considered different types of car driver profiles and various trajectory configurations at the vicinity of the crosswalk. We emphasized that the UAV may help to improve both road safety and energy consumption. Indeed, after observing the driver behavior, the drone collects information about speed and acceleration and sends alerts to the driver in the case of potential harmful situation. This is repeated each perception and reaction distance to take into account possible driver reactions to this alert. We show that the earlier the driver reacts to the drone alert(s), the safer is the braking process. Moreover, we stated that the acceleration is the main parameter behind energy consumption. Hence, drone signaling is likely to help the driver to progressively reduce their speed by avoiding sudden braking. We recall that we assumed that Drone to Car communication delays are very low and that the drone has continuously access to both speed and acceleration values. Further work will be dedicated to studying the influence of these parameters on the drone signaling performance (namely depending on propagation conditions, communication channel modeling, and drone attitude), as well as taking into account a more complex scenario, considering models for both car arrivals (traffic models) and pedestrian presence at the crosswalk.
Author Contributions
Conceptualization, N.N., L.N., and J.N.; methodology, N.N., L.N., and J.N.; software, S.B. and N.N.; validation, L.N. and J.N.; formal analysis, S.B. and N.N.; investigation, S.B.and N.N.; writing—original draft preparation, S.B. and N.N.; writing—review and editing, L.N. and J.N.; supervision, L.N. and J.N. All authors have read and agreed to the published version of the manuscript.
Funding
This research received no external funding.
Institutional Review Board Statement
Not applicable.
Informed Consent Statement
Not applicable.
Acknowledgments
This work has been performed in collaboration with undergraduate students from Tunis Al Manar University (Jawhar Ayari and Farouk Ayadi). The authors thank them for their contributions in the software and simulation steps.
Conflicts of Interest
The authors declare no conflict of interest.
Abbreviations
The following abbreviations are used in this manuscript:
| U2V | UAV to Vehicle communication |
| U2I | UAV to Infrastructure communication |
| C-ITS | Cooperative Intelligent Transportation System |
| UAV | Unmanned Aerial Vehicle |
| V2X | Vehicle to Everything communication |
| X2V | Everything to Vehicle communication |
| VRU | Vulnerable Road Users |
| VLOS | Visual Line Of Sight |
References
- Fotouhi, A.; Qiang, H.; Ding, M.; Hassan, M.; Giordano, L.G.; Garcia-Rodriguez, A.; Yuan, J. Survey on UAV Cellular Communications: Practical Aspects, Standardization Advancements, Regulation, and Security Challenges. IEEE Commun. Surv. Tutor. 2019, 21, 3417–3442. [Google Scholar] [CrossRef] [Green Version]
- Khan, M.A.; Ectors, W.; Bellemans, T.; Janssens, D.; Wets, G. UAV-Based Traffic Analysis: A Universal Guiding Framework Based on Literature Survey. Transp. Res. Procedia 2017, 22, 541–550. [Google Scholar] [CrossRef]
- Chen, L.; Englund, C. Cooperative Intersection Management: A Survey. IEEE Trans. Intell. Transp. Syst. 2016, 17, 570–586. [Google Scholar] [CrossRef]
- Menouar, H.; Guvenc, I.; Akkaya, K.; Uluagac, A.S.; Kadri, A.; Tuncer, A. UAV-Enabled Intelligent Transportation Systems for the Smart City: Applications and Challenges. IEEE Commun. Mag. 2017, 55, 22–28. [Google Scholar] [CrossRef]
- Available online: https://droneregulations.info (accessed on 24 December 2020).
- Radio Regulation for Drones—How REVOsdr Untangles a Tangled World v.2. Available online: https://www.twevo.net/2017/11/27/radio-regulation-for-drones-how-revosdr-untangles-a-tangled-world/ (accessed on 27 November 2017).
- Zhu, J.; Chen, S.; Tu, W.; Sun, K. Tracking and Simulating Pedestrian Movements at Intersections Using Unmanned Aerial Vehicles. Remote Sens. 2019, 11, 925. [Google Scholar] [CrossRef] [Green Version]
- Chen, P.; Zeng, W.; Yu, G.; Wang, Y. Surrogate Safety Analysis of Pedestrian-Vehicle Conflict at Intersections Using Unmanned Aerial Vehicle Videos. J. Adv. Transp. 2017, 2017, 5202015. [Google Scholar] [CrossRef] [Green Version]
- Coifman, B.; McCord, M.; Mishalani, R.G.; Iswalt, M.; Ji, Y. Roadway traffic monitoring from an unmanned aerial vehicle. IEE Proc. Intell. Transp. Syst. 2006, 153, 11. [Google Scholar] [CrossRef] [Green Version]
- Salvo, G.; Caruso, L.; Scordo, A. Urban Traffic Analysis through an UAV. Procedia Soc. Behav. Sci. 2014, 111, 1083–1091. [Google Scholar] [CrossRef] [Green Version]
- Puri, A. A Survey of Unmanned Aerial Vehicles (UAVs) for Traffic Surveillance. In University of South Florida-Internal Report; University of South Florida: Tampa, FL, USA, 2005. [Google Scholar]
- Kanistras, K.; Martins, G.; Rutherford, M.J.; Valavanis, K.P. Survey of Unmanned Aerial Vehicles (UAVs) for Traffic Monitoring. In Handbook of Unmanned Aerial Vehicles; Springer: Dodlerk, The Netherlands, 2014; pp. 2643–2666. [Google Scholar] [CrossRef]
- Reshma, R.; Ramesh, T.; Sathishkumar, P. Security situational aware intelligent road traffic monitoring using UAVs. In Proceedings of the 2016 International Conference on VLSI Systems, Architectures, Technology and Applications (VLSI-SATA), Bangalore, India, 10–12 January 2016. [Google Scholar] [CrossRef]
- Millisher, M.; Lubetzki, M. Drone de signalisation et d’information—Demande de brevet FR1870604 A1. 2018. Available online: https://www.inpi.fr/fr/base-brevets (accessed on 24 December 2020).
- García-Castellano, M.; González-Romo, J.M.; Gómez-Galán, J.A.; García-Martín, J.P.; Torralba, A.; Pérez-Mira, V. ITERL: A Wireless Adaptive System for Efficient Road Lighting. Sensors 2019, 19, 5101. [Google Scholar] [CrossRef] [Green Version]
- Ghosal, A.; Conti, M. Security issues and challenges in V2X: A Survey. Comput. Netw. 2020, 169, 107093. [Google Scholar] [CrossRef]
- Shrestha, R.; Nam, S.Y.; Bajracharya, R.; Kim, S. Evolution of V2X Communication and Integration of Blockchain for Security Enhancements. Electronics 2020, 9, 1338. [Google Scholar] [CrossRef]
- Martinez-Heredia, J.M.; Garcia, Z.; Mora-Jimenez, J.L.; Esteban, S.; Gavilan, F. Development of an Emergency Radio Beacon for Small Unmanned Aerial Vehicles. IEEE Access 2018, 6, 21570–21581. [Google Scholar] [CrossRef]
- Mozaffari, M. Wireless Communications and Networking withUnmanned Aerial Vehicles: Fundamentals, Deployment, and Optimization. Ph.D. Thesis, Virginia Polytechnic Institute, Blacksburg, VA, USA, 2018. [Google Scholar]
- Zhou, Y.; Cheng, N.; Lu, N.; Shen, X.S. Multi-UAV-Aided Networks: Aerial-Ground Cooperative Vehicular Networking Architecture. IEEE Veh. Technol. Mag. 2015, 10, 36–44. [Google Scholar] [CrossRef]
- Jia, S.; Zhang, L. Modelling unmanned aerial vehicles base station in ground-to-air cooperative networks. IET Commun. 2017, 11, 1187–1194. [Google Scholar] [CrossRef]
- Oubbati, O.S.; Lakas, A.; Zhou, F.; Güneş, M.; Lagraa, N.; Yagoubi, M.B. Intelligent UAV-assisted routing protocol for urban VANETs. Comput. Commun. 2017, 107, 93–111. [Google Scholar] [CrossRef]
- Wang, X.; Fu, L.; Zhang, Y.; Gan, X.; Wang, X. VDNet: An infrastructure-less UAV-assisted sparse VANET system with vehicle location prediction. Wirel. Commun. Mob. Comput. 2016, 16, 2991–3003. [Google Scholar] [CrossRef]
- Radenkovic, M.; Huynh, V.S.H.; John, R.; Manzoni, P. Enabling Real-time Communications and Services in Heterogeneous Networks of Drones and Vehicles. In Proceedings of the 2019 International Conference on Wireless and Mobile Computing, Networking and Communications (WiMob), Barcelona, Spain, 21–23 October 2019. [Google Scholar] [CrossRef]
- Hadiwardoyo, S.A.; Hernández-Orallo, E.; Calafate, C.T.; Cano, J.C.; Manzoni, P. Experimental characterization of UAV-to-car communications. Comput. Netw. 2018, 136, 105–118. [Google Scholar] [CrossRef]
- Hadiwardoyo, S.A.; Calafate, C.T.; Cano, J.C.; Ji, Y.; Hernandez-Orallo, E.; Manzoni, P. 3D Simulation Modeling of UAV-to-Car Communications. IEEE Access 2019, 7, 8808–8823. [Google Scholar] [CrossRef]
- Hadiwardoyo, S.A.; Calafate, C.T.; Cano, J.C.; Krinkin, K.; Klionskiy, D.; Hernández-Orallo, E.; Manzoni, P. Three Dimensional UAV Positioning for Dynamic UAV-to-Car Communications. Sensors 2020, 20, 356. [Google Scholar] [CrossRef] [Green Version]
- Sharma, A.; Vanjani, P.; Paliwal, N.; Basnayaka, C.M.; Jayakody, D.N.K.; Wang, H.C.; Muthuchidambaranathan, P. Communication and networking technologies for UAVs: A survey. J. Netw. Comput. Appl. 2020, 168, 102739. [Google Scholar] [CrossRef]
- Sewalkar, P.; Seitz, J. Vehicle-to-Pedestrian Communication for Vulnerable Road Users: Survey, Design Considerations, and Challenges. Sensors 2019, 19, 358. [Google Scholar] [CrossRef] [PubMed] [Green Version]
- Sutheerakul, C.; Kronprasert, N.; Kaewmoracharoen, M.; Pichayapan, P. Application of Unmanned Aerial Vehicles to Pedestrian Traffic Monitoring and Management for Shopping Streets. Transp. Res. Procedia 2017, 25, 1717–1734. [Google Scholar] [CrossRef]
- Sha, D.; Guo, Y.; Ding, Y. Pedestrian Safety Diagnosis at Signalized Crosswalks Using Traffic Conflict Techniques. In Proceedings of the CICTP, Shanghai, China, 6–9 July 2016; American Society of Civil Engineers: Reston, VA, USA, 2016. [Google Scholar] [CrossRef]
- Zhang, X.; Chen, H.; Yang, W.; Jin, W.; Zhu, W. Pedestrian Path Prediction for Autonomous Driving at Un-Signalized Crosswalk Using W/CDM and MSFM. IEEE Trans. Intell. Transp. Syst. 2020, 1–13. [Google Scholar] [CrossRef]
- Kozak, F. Traffic Control System, Controller and Method for Directing Vehicle Behavior at a Defined Spatial Location. U.S. Patent Application No. 16/169,545, 30 April 2020. [Google Scholar]
- Gao, Y.; Cheng, Y.; Zhang, H.; Zou, N. Dynamic illuminance measurement and control used for smart lighting with LED. Measurement 2019, 139, 380–386. [Google Scholar] [CrossRef]
- Beckx, C.; Lefebvre, W.; Degraeuwe, B.; Vanhulsel, M.; Kochan, B.; Bellemans, T.; Dhondt, S.; Panis, L.I. Assessing the environmental impact associated with different trip purposes. Transp. Res. Part D Transp. Environ. 2013, 18, 110–116. [Google Scholar] [CrossRef]
- Almannaa, M.H.; Chen, H.; Rakha, H.A.; Loulizi, A.; El-Shawarby, I. Field implementation and testing of an automated eco-cooperative adaptive cruise control system in the vicinity of signalized intersections. Transp. Res. Part D Transp. Environ. 2019, 67, 244–262. [Google Scholar] [CrossRef]
- Akhegaonkar, S.; Nouveliere, L.; Glaser, S.; Holzmann, F. Smart and Green ACC: Energy and Safety Optimization Strategies for EVs. IEEE Trans. Syst. Man, Cybern. Syst. 2018, 48, 142–153. [Google Scholar] [CrossRef] [Green Version]
- Stillwater, T.; Kurani, K.S. Drivers discuss ecodriving feedback: Goal setting, framing, and anchoring motivate new behaviors. Transp. Res. Part F Traffic Psychol. Behav. 2013, 19, 85–96. [Google Scholar] [CrossRef]
- Liu, M.; Wang, M.; Hoogendoorn, S. Optimal Platoon Trajectory Planning Approach at Arterials. Transp. Res. Rec. J. Transp. Res. Board 2019, 2673, 214–226. [Google Scholar] [CrossRef]
- Kamalanathsharma, R.K. Eco-Driving in the Vicinity of Roadway Intersections—Algorithmic Development, Modeling, and Testing. Ph.D. Thesis, Virginia Polytechnic Institute, Blacksburg, VA, USA, 2014. [Google Scholar]
- Bento, L.C.; Parafita, R.; Rakha, H.A.; Nunes, U.J. A study of the environmental impacts of intelligent automated vehicle control at intersections via V2V and V2I communications. J. Intell. Transp. Syst. 2019, 23, 41–59. [Google Scholar] [CrossRef]
- Loulizi, A.; Rakha, H.; Bichiou, Y. Quantifying grade effects on vehicle fuel consumption for use in sustainable highway design. Int. J. Sustain. Transp. 2017, 12, 441–451. [Google Scholar] [CrossRef]
- Coiret, A.; Deljanin, E.; Vandanjon, P.O. Vehicle energy savings by optimizing road speed-sectioning. Eur. Transp. Res. Rev. 2020, 12, 1–15. [Google Scholar] [CrossRef]
- Fricke, L. Traffic Accident Reconstruction: Volume 2 of the Traffic Accident Investigation Manual; Northwestern University Traffic Institute: Evanston, IL, USA, 1990. [Google Scholar]
- AASHTO. A Policy on Geometric Design of Highways and Streets, 6th ed.; American Association of State Highway and Transportation Officials: Washington, DC, USA, 2011. [Google Scholar]
- Neji, J. Le Projet Routier; Centre de Publication Universitaire, Ecole Nationale d’Ingénieurs de Tunis: Tunis, Tunisia, 2005; ISBN 9973-51-547-1. [Google Scholar]
- Summala, H. Brake Reaction Times and Driver Behavior Analysis. Transp. Hum. Factors 2000, 2, 217–226. [Google Scholar] [CrossRef]
- Ghandour, R.; Victorino, A.; Doumiati, M.; Charara, A. Tire/road friction coefficient estimation applied to road safety. In Proceedings of the 18th Mediterranean Conference on Control and Automation, MED’10, Marrakech, Morocco, 23–25 June 2010. [Google Scholar] [CrossRef] [Green Version]
Figure 1.
Classical crosswalk: one pedestrian and one car coming through a straight line.

Figure 2.
Our considered scenario: crosswalk controlled by drone. (left) The car comes through a straight line. (right) The car comes through a curved trajectory.
Figure 2.
Our considered scenario: crosswalk controlled by drone. (left) The car comes through a straight line. (right) The car comes through a curved trajectory.

Figure 3.
Selected driver examples: type 1 (dash-dot), type 2 (solid), type 3 (dot), type 4 (dash). Speeds (a) and accelerations (b).
Figure 3.
Selected driver examples: type 1 (dash-dot), type 2 (solid), type 3 (dot), type 4 (dash). Speeds (a) and accelerations (b).

Figure 4.
Proposed algorithm consisting in three phases: phase 1 (determining the driver behavior), phase 2 (progressively adjusting the vehicle speed), and phase 3 (braking).
Figure 4.
Proposed algorithm consisting in three phases: phase 1 (determining the driver behavior), phase 2 (progressively adjusting the vehicle speed), and phase 3 (braking).

Figure 5.
Speed and acceleration reference profiles: in the case of dry straight line (solid), wet straight line (dash-dot), dry curved line (dash), and wet curved line (dot).
Figure 5.
Speed and acceleration reference profiles: in the case of dry straight line (solid), wet straight line (dash-dot), dry curved line (dash), and wet curved line (dot).

Figure 6.
Speeds and accelerations of driver type 1, case of dry straight line.

Figure 7.
Speeds and accelerations of driver type 2, case of dry straight line.

Figure 8.
Speeds and accelerations of driver type 1, case of wet straight line.

Figure 9.
Speeds and accelerations of driver type 2, case of wet straight line.

Figure 10.
Speeds and accelerations of driver type 1, case of dry curved line.

Figure 11.
Speeds and accelerations of driver type 2, case of dry curved line.

Figure 12.
Speeds and accelerations of driver type 1, case of wet curved line.

Figure 13.
Speeds and accelerations of driver type 2, case of wet curved line.

Figure 14.
Fuel consumption for 4 driver types for a distance of 500 m.

Figure 15.
Instantaneous fuel consumption during phase 1 for all driver types.

Figure 16.
Instantaneous fuel consumption during phases 2 and 3, for driver type 1.


Table 1.
Some values of vs used in this work.
| (km/h) | 40 | 60 | 80 | 100 | 120 | 140 |
|---|---|---|---|---|---|---|
| (straight dry line) | 0.46 | 0.46 | 0.42 | 0.38 | 0.34 | 0.31 |
| (straight wet line) | 0.23 | 0.23 | 0.21 | 0.19 | 0.17 | 0.155 |
| (curved dry line) | 0.37 | 0.37 | 0.34 | 0.30 | 0.27 | 0.25 |
| (curved wet line) | 0.19 | 0.19 | 0.17 | 0.15 | 0.14 | 0.13 |
Table 2.
Simulation parameters (road-related) used in this work.
| Parameter | Value | Unit |
|---|---|---|
| 50 | km·h | |
| 0.1 g | m·s | |
| 80 | % | |
| 500 | m | |
| 120 | m | |
| 5 | m | |
| 5 | km·h | |
| 0.00042581 | not applicable | |
| 0.000025331 | not applicable | |
| 0.000001 | not applicable |
Table 3.
Simulation parameters (vehicle-related) used in this work.
| Parameter | Value | Unit |
|---|---|---|
| m | 1224 | kg |
| 1.8 | s |
Table 4.
Results of phase 1 for the four driver types.
| Driver Profile | Algorithm Outputs |
|---|---|
| Type 1 | Normal driving |
| Type 2 | Unwise driving, speed higher than the limit |
| Type 3 | Uncomfortable driving, residual acceleration |
| Type 4 | Non-vigilant driving, sudden acceleration |
Publisher’s Note: MDPI stays neutral with regard to jurisdictional claims in published maps and institutional affiliations. |
© 2020 by the authors. Licensee MDPI, Basel, Switzerland. This article is an open access article distributed under the terms and conditions of the Creative Commons Attribution (CC BY) license (http://creativecommons.org/licenses/by/4.0/).
Share and Cite
MDPI and ACS Style
Bouassida, S.; Neji, N.; Nouvelière, L.; Neji, J. Evaluating the Impact of Drone Signaling in Crosswalk Scenario. Appl. Sci. 2021, 11, 157. https://0-doi-org.brum.beds.ac.uk/10.3390/app11010157
AMA Style
Bouassida S, Neji N, Nouvelière L, Neji J. Evaluating the Impact of Drone Signaling in Crosswalk Scenario. Applied Sciences. 2021; 11(1):157. https://0-doi-org.brum.beds.ac.uk/10.3390/app11010157
Chicago/Turabian StyleBouassida, Sana, Najett Neji, Lydie Nouvelière, and Jamel Neji. 2021. "Evaluating the Impact of Drone Signaling in Crosswalk Scenario" Applied Sciences 11, no. 1: 157. https://0-doi-org.brum.beds.ac.uk/10.3390/app11010157
Note that from the first issue of 2016, this journal uses article numbers instead of page numbers. See further details here.