1. Introduction
The halt in tourism activity caused by the COVID-19 crisis has highlighted the great value that the tourism sector brings to the world economy and the high dependence on tourism for many destinations [
1]. The fear of an unknown virus is seriously affecting all the world economies and major industries. The hotel sector is facing the worst financial, operational and commercial crisis, possibly since World War II [
2]. This situation will force the sector to significantly reorient the business, incorporating greater flexibility and less reliability of the forecasts. The range of segmentation will be extended and loyalty systems and sales techniques will be strengthened, reinforcing the direct channel and better projecting the brand image [
3]. In times of crisis, it is easier to increase sales to existing clients than to get new ones [
4]. Therefore, strengthening loyalty programs will attract more income to the direct channel [
3]. Furthermore, the reorientation towards domestic demand will be important since its crisis recovery is faster than international tourism [
5]. The habits and needs of clients will change, so it will become even more necessary to be able to quickly identify their characteristics and profile using internal and external data. Personalizing the service will be vital to adjust to a heterogeneous recovery speed in the different regions and markets. Having good systems for collecting and processing information will also be fundamental because decisions must be based on huge volumes of dispersed data [
6]. It will be essential for these systems to be supported by Artificial Intelligence (AI) with multiple and advanced algorithms that consider various data sources which not only are based on historical information but also have the ability to learn and to understand how the demand is changing in order to be quick to react [
3]. Digitization will become more important to respond faster to uncertain and volatile environments like the current one.
For the last years, CRM systems have been the instrument used by many hotels to manage and record clients’ preferences and information [
7]. A CRM system is a “firm tool that is technology-based for developing and leveraging consumer knowledge to nurture, to maintain, and to strengthen profitable relationships with consumers” [
8]. CRM systems facilitate retaining clients by identifying their behavioral patterns [
9,
10]. CRM has become an essential strategy by generating a great amount of valuable information about hotels’ clients [
11]. However, the management of the considerable amount of available information in CRM systems to reach efficient client profiling still needs to be further studied [
12].
In this setting, Big Data technologies can provide powerful tools to handle the big amount of information available in the hotel companies [
13]. Conventional methods are sometimes insufficient to deal with the current hospitality research problems that emerge from user-generated data exploitation [
14]. Statistical inference on massive analysis is being supported by Big Data technologies that, on the other hand, face new hurdles, especially when compared to analysis using smaller and carefully collected datasets [
12]. Big Data facilitate decision-making processes based on huge amounts of data by improving the relationship between businesses and clients and disruptively changing deeply the hospitality management [
15], which is especially necessary in the current crisis environment.
Many relevant information fields stored in CRMs correspond to or can be expressed as categorical features, which are compiled in the visit forms throughout the years. Simple statistical descriptions of these features are necessary and useful, but they could be missing relevant information on their nature and relationships. Big Data and Data Warehouse technologies often provide us with command panels with this kind of information, but to our best knowledge, a limited number of instruments have been proposed to give principled visualization of interacting categorical features, which are the most usual type in CRMs [
12,
16]. Therefore, our objective was to identify the profiles of clients from an international hotel chain using the overall data in its CRM system, in terms of its categorical features and their interactions. We aimed to build a method combining statistical robustness with the best interpretability for the managers. Our method is built on the basis of three processing blocks, previously existing in the literature, but harmoniously adapted to summarize large amounts of client records. On a first stage, Multiple Correspondence Analysis (MCA) is a well-known technique that provides us with statistical descriptions of the interactions among categorical features, hence it is the basic analysis unit for scrutinizing a set of fields in the forms and turning them into client profiles [
17,
18]. However, the interpretation of projected factors on MCA requires expert knowledge on the technique, so that, for making it more readily interpretable, we performed bootstrap resampling techniques to yield a cloud of resamples for each category [
19,
20]. As these represent a hard-to-plot entity, we built domain descriptors to characterize volumes including those resamples with a confidence level, thus providing confidence volumes that can be interpreted as conventional confidence intervals. These confidence volumes allow scrutinizing the existing relationships as present (based on probabilistic proximity in the projected spaces) or strongly present (when the confidence volumes of several categories overlap). For this last step, we benchmarked two different techniques, namely Parzen windows [
21,
22] and Support Vector Domain Description (SVDD) [
23,
24], in order to analyze the impact of the technique used in this processing block on the quality of the representations.
To guide hoteliers decision making in such a complex environment, we used the proposed approach to identify the profiles of clients from an international hotel chain using the overall data in its CRM system. For this purpose, we scrutinized the relevant groups of variables and we analyzed their practical meaning by using Big Data analytics from a twofold approach: by identifying the nationality general profile and paying attention to the repeater feature and its relationship to the other features under MCA description.
The paper is organized as follows.
Section 2 compiles a background on CRM and its elements in the context of its use by managers in hospitality, as well as an overview of the existing approaches to the field from Big Data or Data Science premises.
Section 3 provides the basic equations of the three processing blocks (MCA, bootstrap resampling on the projected features and domain description for confidence volumes).
Section 4 presents the experiments and results on the international chain database for providing the client profile and in particular the repeater profile. Finally,
Section 5 provides the discussion and the conclusions of the work.
2. Background on CRM and Big Data in Hospitality
The CRM focuses on the relationship with the client, implementing a client-centric process [
25]. It is a client-oriented culture [
26] that contributes to increase from guest satisfaction to loyalty and retention, by acting on the reduction of guest acquisition costs while focusing on increasing profits [
7,
27,
28,
29]. Therefore, the purpose of the CRM is the client knowledge (needs, preferences and emotions), focusing on a single view of him [
16], in order to develop an efficient relationship (commercial and experiential) in each interaction. This is increasingly possible thanks to the developments and advances in information technology (IT) applications [
26].
The synergistic relationship between Big Data and CRM is relatively new and so far little studied [
16,
30]. With regard to the hospitality industry, the scarcity of studies is even greater, and there are few works that have brought the two concepts together [
31,
32]. However, the CRM is a strategy that has been implemented for over thirty years in the hotel sector [
27], although its use and importance has increased in recent years [
7]. The main reasons are mainly due to the greater power of the client, the increase in competition [
33], the increase in client information due to the digital environments [
30] and the technological development [
34] that have caused the profitability of the hotel to be strongly linked to the capacity to satisfy clients in an effective and efficient way [
33]. The CRM, therefore, plays a major role since it comprises the organizational procedures and strategies to better understand its clients and to use this knowledge for the production and marketing of hotel services [
16].
On the other hand, the relationship between the hotel CRM and technology has been studied in several works [
27]—initially, to analyze what these systems consisted of and what technologies they used; later, with the arrival of the Internet, to find out how hotels used multimedia channels (e-mail, channels, etc.) to create relationships with their clients [
35,
36]; and, finally, to analyze their interaction with social media. Currently, in the hotel industry, digital technology has generated a vast amount of client data sources in very different formats, whose study represents a challenge due to their diversity. Specifically, we face structured data in conventional databases (from property management and CRM systems) as well as semi-structured and unstructured data (obtained from meta-search generated data, such as those given by Kayak, Trivago and Tripadvisor or extracted from social networks, such as Facebook, Twitter or LinkedIn) [
12,
37,
38]. Big Data tools and techniques facilitate access, storage and analysis of a wide variety of client data that are captured and processed at high velocity and are quite effective [
12,
30]. According to Sharma [
16], “Big Data brings a whole new inclusion of CRM strategies which can support customization of sales, personalization of services, and client interactions”.
For this reason, the application of Big data tools and technology in the context of hotel CRM strategies is now indispensable and it is therefore pertinent to deepen the knowledge and usefulness of these tools. Thus, big data technology facilitates segmentation and better knowledge of the client [
12] with the continuous updating of profiles, giving the hotel the possibility of interacting in real time with the client, as well as providing knowledge of the client’s value and life cycle [
31], adjusting the services to their needs, enabling the offer of personalized services and products and carrying out marketing campaigns aimed at each client segment, predicting client reaction to marketing messages and product offers or providing a higher quality of information [
32], among many others. Data mining facilities are being increasingly implemented in the hotel CRM to help managers find hidden client information from available data, thus aiming to serve towards more effective and personalized CRM strategies [
16]. On the other hand, online interaction with clients in CRM requires extensive support from Big Data analytic tools [
30]. Clustering can be used to classify clients into different types according to their value. Machine learning, for example, can predict client reaction to marketing messages and product offers, text analytics, helping to extract text-quality information, such as client opinions in distribution channels and social networks and achieve more effective online interaction [
39,
40].
Regarding the client profile, big data can help to know more about the client using tools that track the purchase histories and online conversations of the clients (text analysis and geolocalization analysis) [
30,
41]. In addition, it has been shown that other simpler tools such as known statistical descriptions [
12] can be very effective and we use them in this work to determine the profile of the repeat client. In this case, the study was carried out through multivariate analysis, which provides a better understanding of their mutual interactions.
3. Methods and Materials
In this section, we summarize the methods proposed and used in this paper. We start with a mathematical and matricial description of MCA, which also conveys the feature and categorical notation of vectors. Then, the fundamentals of Bootstrap resampling applied to MCA is given, which allows us to obtain resampled statistics of both the eigenvectors and the projected categories on them. Whereas the resampled eigenvectors can be readily characterized with confidence intervals, the resampled categories are not immediate to characterize in terms of their confidence and content. For this reason, two alternatives are presented, namely Parzen density estimators are described in this context and the basic equations of SVDD are included. Apart from that, we also describe the dataset used in the study.
3.1. MCA for Categorical Feature Description
MCA is a well-known method in multivariate statistical analysis which is being given increasing attention in Big Data applications using categorical variables. It can be seen as the counterpart of Principal Component Analysis (PCA) in metric features, since both are based on matrix eigendecompositions of the input data. The main difference between them is that the former represents a variance orthonormalization, whereas the later represents a probability-space orthonormalization. We follow some of the principles pointed out in previous works on MCA (see, e.g., [
42]), but with emphasis here on the behavior and adaptability of the method to summarize categorical features together with the description of a number of cases, as is usually the case of the client view in CRMs in hospitality. The identification of relations among features and samples is not straightforward, specially in datasets consisting of categorical variables. Correspondence analysis (CA) is a well-known exploratory bivariate technique for analyzing contingency or count tables both visually and numerically [
17]. In contrast, MCA can be seen as a generalization of CA, which allows us to study relationships among categorical variables [
18,
42].
The method first transforms the categorical variables in order to construct a binary matrix
, being
I and
J the total number of samples and categories in our dataset, respectively. Note that
J is not the number of categorical features, but the sum of all of the different categories related to the categorical features. Then, MCA decomposes this
matrix into two sets of projection matrices (also known as factor scores), one for the dimension of the samples (rows) and another for the dimension of the categories (columns), in order to be able to project the samples and features to points on a low-dimensional space, which allows us to establish relationships among them through distances in this projection space. In addition, let
where denote the corresponding relative frequency matrix, known as the Burt matrix, being
the number of elements of the
matrix. Furthermore, let us define
and
as the vectors of the horizontal and vertical sum of
, respectively, i.e.,
and
, where
is a column vector of ones. Lastly, let
and
represent diagonal matrices whose diagonal entries are the elements of
and
, respectively. The projection matrices can be obtained through the following singular value decomposition of the normalized Burt matrix:
where being
and
the left and right singular vector matrices, respectively, and
a diagonal matrix with the singular values organized in decreasing order, where
=
is the matrix of eigenvalues. Thus, the factor scores corresponding to the samples and categories dimensions can be calculated as follows
respectively. Note that, since
is a symmetric matrix,
and
are equal. Therefore,
and
are the same matrices, being
the eigenvector matrix, and thus
is also equal to
.
Using these eigenvector and eigenvalue matrices, MCA results can be analyzed [
42]. In this way, normalized eigenvalues can be used to represent the data dispersion surrounding the center of gravity, according to each category, and this yields a straightforward interpretation that is comparable to the variance criteria often used in PCA for metric vectors. The eigenvectors represent the different factors or projecting directions, and their coefficients indicate the relative relevance of each category for each factor. Lastly, we usually sort the directions in decreasing order according to their related eigenvalues. The objective of MCA is to provide an alternative description of the discrete observation matrix on a space of lower dimensionality. This new representation retains as much information as possible of the original data matrix, but considering a lower number of dimensions. The analysis of this graphical visualization can provide insights about the associations among categories, as well as a visual and interpretable projection of the original samples.
3.2. Bootstrap Resampling for MCA Projected Categories
To increase the interpretability of the MCA, the statistical distribution of the MCA projections for each category in the DB is analysed. For this purpose, the Bootstrap resampling techniques are used to obtain a point cloud that implicitly represents the empirical distribution of these projections in the projected space. The generation and compact representation of confidence regions on these projections are calculated using Parzen windows or Support Vector Domain Description (SVDD). The visualization of overlapping confidence regions allows the visual interpretation of the statistically significant relationship between the analyzed categories. In contrast, separate and distant regions indicate independent categories.
Bootstrapping [
19,
20] is a technique that allows the generation of a new list of statistical measurements from a sampling with replacement of a given list [
43]. To ease the notation, we first denote by
the operator that obtains the MCA eigenvector matrix, that is, the computations described in Equations (
1) and (
2), as follows,
Applying now Bootstrap resampling and using its habitual notation, where the asterisk (
) indicates the resampled statistical element coming from the plug-in principle. From this resampling process, to distinguish it from the empirical or theoretical statistical elements, we can define the resampled data matrix as
after sampling with replacement the
rows
I times. Thus, the
matrix is composed by rows of
, whose rows may appear once, several or zero times. If we resample
B times (typically,
or 500 times), denoting
as the resampled matrix in the
bth iteration bootstrap, where
, we can obtain a bootstrapped replication of the projection matrix over the resampled population,
, as follows
Thus, using these B repetitions, we can estimate the empirical distribution function of the statistical element [
19], in this case, of the projection vectors.
3.3. Parzen Confidence Volumes
The previously scheme of Bootstrap resampling can be extended not only to eigenvectors but also to all categories in our analysis, and it represents a suitable way of determining their empirical statistical distribution. Whereas it is immediate to construct confidence intervals for the eigenvectors by using ordered statistics we have that the multivariate distribution of the projected categories is expressed as several sets of point clouds (one cloud per category), and this statistically rich description is eventually hard to visualize and represent.
A previously proposed alternative can be established by using the non-parametric Parzen estimators for probability density functions [
21,
22]. For our particular case, we can consider that a subset of three eigenvectors corresponding to three categories (denoted compactly as
, being
the
jth column of
) is a set of independent and identically distributed observations, so that their empirical statistical distribution is
The use of a suitable kernel (or window) estimator provides us with a continuously supported estimation from the empirical probability density. The Gaussian kernel is a usual choice as it is assumed to be supported by the Central Limit Theorem [
44,
45]. In our present case, the Parzen estimate of the statistical distribution is given by
where ∗ stands for multidimensional convolution and
denotes the Gaussian kernel with a shared width
for all the dimensions. We need to choose a suitable value for the kernel width for each application, which depends on the data scale and on the number of available observations. After the Parzen estimator is built, we can calculate the ellipsoid whose volume contains 95% of the points in the cloud provided for each category by the Bootstrap resampling.
3.4. Support Vector Domain Description for Confidence Volumes
A method that has been proposed for determining the support of a set of points is Support Vector Domain Description (SVDD), which is different to the two-class Support Vector Classifier. SVDD is a one-class procedure which aims to separate one single class of objects from the subset different from them [
23,
24]. It has been widely used in anomaly detection, as well as to determine the support of a given distribution, which is the main use in the present work.
In our case, let us denote by a dataset from a class of interest. Our purpose is to build the hypersphere with the lowest possible volume in a high-dimensional feature space, denoted as , whose radius is , and it is centered at point , in such a way that this geometrical entity conveys inside most of said set of objects. A nonlinear mapping is used to map the original data to the space, given by . Note also that, in this case, we are interested in projecting vectors corresponding to indicator vectors for each category in the MCA decomposition.
Not only the set of interest can contain outliers, but also we are interested in leaving out of the domain region some portion of the data, so that we can interpret the result as a confidence domain, similar to the concept of confidence interval in statistics. The SVDD algorithm considers this according to the inclusion of
slack variables accounting for the distance to the hypersphere of some of the observations, and the problem statement is then
where constrained to
where parameter
C represents a trade-off between the hypersphere volume and the committed errors. It is common to use the so-called reject parameter, defined as
, which represents an upper bound of the number of outliers or samples outside the domain, so that it provides a convenient way to control for the confidence required to the volumes provided by the SVDD in our problem.
It can be shown [
23,
24] that the dual functional is a constrained quadratic form and it yields a set of Lagrange multipliers (
) in terms of the constraints represented by each observation. When we adjust
C properly, most of
are nulls and they give a sparse solution. The unbounded support vectors are those observations
fulfilling
, whereas the bounded support vectors exactly fulfill
, and they can be considered either outliers or tails of a multidimensional distribution. The utility of these Lagrange multipliers is to obtain the distance of a test point to the hypersphere center,
where to be compared with radius
R. We can calculate the boundary of the domain and represent projections of each separate feature on the MCA subspace, which provides as with a way to estimate the statistical uncertainty of our estimations in the MCA method. When using a Gaussian kernel method, the kernel width has to be preset in a similar way as in the case of Parzen windows.
3.5. Dataset and Some Descriptive Statistics
The database used in the present work was compiled from a CRM system commonly used by a major international hotel chain, which consists of more than 100 hotels located in more than 14 countries. The company Information Technology unit monitored the access to the data, and it allowed us to examine the stored features (variables) and to pre-filter the possibly useful ones. A Web Intelligence document was specifically created in the system to support this preliminary analysis. The data of 2,467,902 different clients analyzed (those who stayed overnight at the hotels in the chain) were recorded in the CRM system during years 2013 and 2014.
The information about clients was recorded in the CRM system during those years. Six features, as well as their corresponding categories, were selected to be analyzed, including demographic features such as gender (unknown, male and female), civil status (unknown, single or with partners) or country of residence (Spain, Germany, United Kingdom and others, accounting for 20.25%, 34.03%, 16.00% and 29.72%, respectively), motivational features (family or with partner) and value features such as the client’s expenditure. The criteria for the selection of these variables pursued a threefold objective: Firstly, the strategic interest of these variables was expressed by the management of the hotel chain. Secondly, these variables were often used in the literature from the point of view of analyzing the client profile in the sector [
46,
47,
48,
49,
50]. Thirdly, we considered the availability of reliable data in the database, as some problems were detected with the collection of information in the hotel chain CRM. Therefore, from a total of eleven variables available in the company CRM, six were finally selected. We chose the English and German nationalities, as nationality is a segmentation variable that explains much of the tourist expenditure [
51]. In addition, we took into account the structure of the Spanish market, in which the English and German clients are the nationalities spending the most nights in Spanish hotels, globally accounting for more than 44% of hotel nights in Spain. Furthermore, these two nationalities constitute strategic and priority segments for the multinational chain. The managerial goal of this work consisted of modeling the profile of first-timer clients within this population, as it was found usual that many clients only stayed in the chain hotel once. Towards that end, we analyzed first-timers vs. repeaters taking into account the above mentioned features.
4. Experiments and Results
This section describes the methodology followed as well as the experimental setup. We start by presenting a first set of experiments on one single nationality which allows the reader to understand the elements of the proposed analysis, the confidence intervals for the eigenvectors and the confidence volumes for the projected categories. The behavior of the two proposed alternatives for determining the confidence volumes is scrutinized in this section. Then, we show and discuss the obtained results with detail in terms of different nationalities, from a twofold view, namely which is the general profile for the scrutinized nationalities and which is the profile of the repeater client in each of them.
4.1. Methodology Description and Algorithm Tuning
We performed a first set of experiments to determine the impact of the possible settings of the algorithm, as explained next. The recordings from Spain clients were considered, and MCA was performed to generate an eigendecomposition, as described in the preceding section.
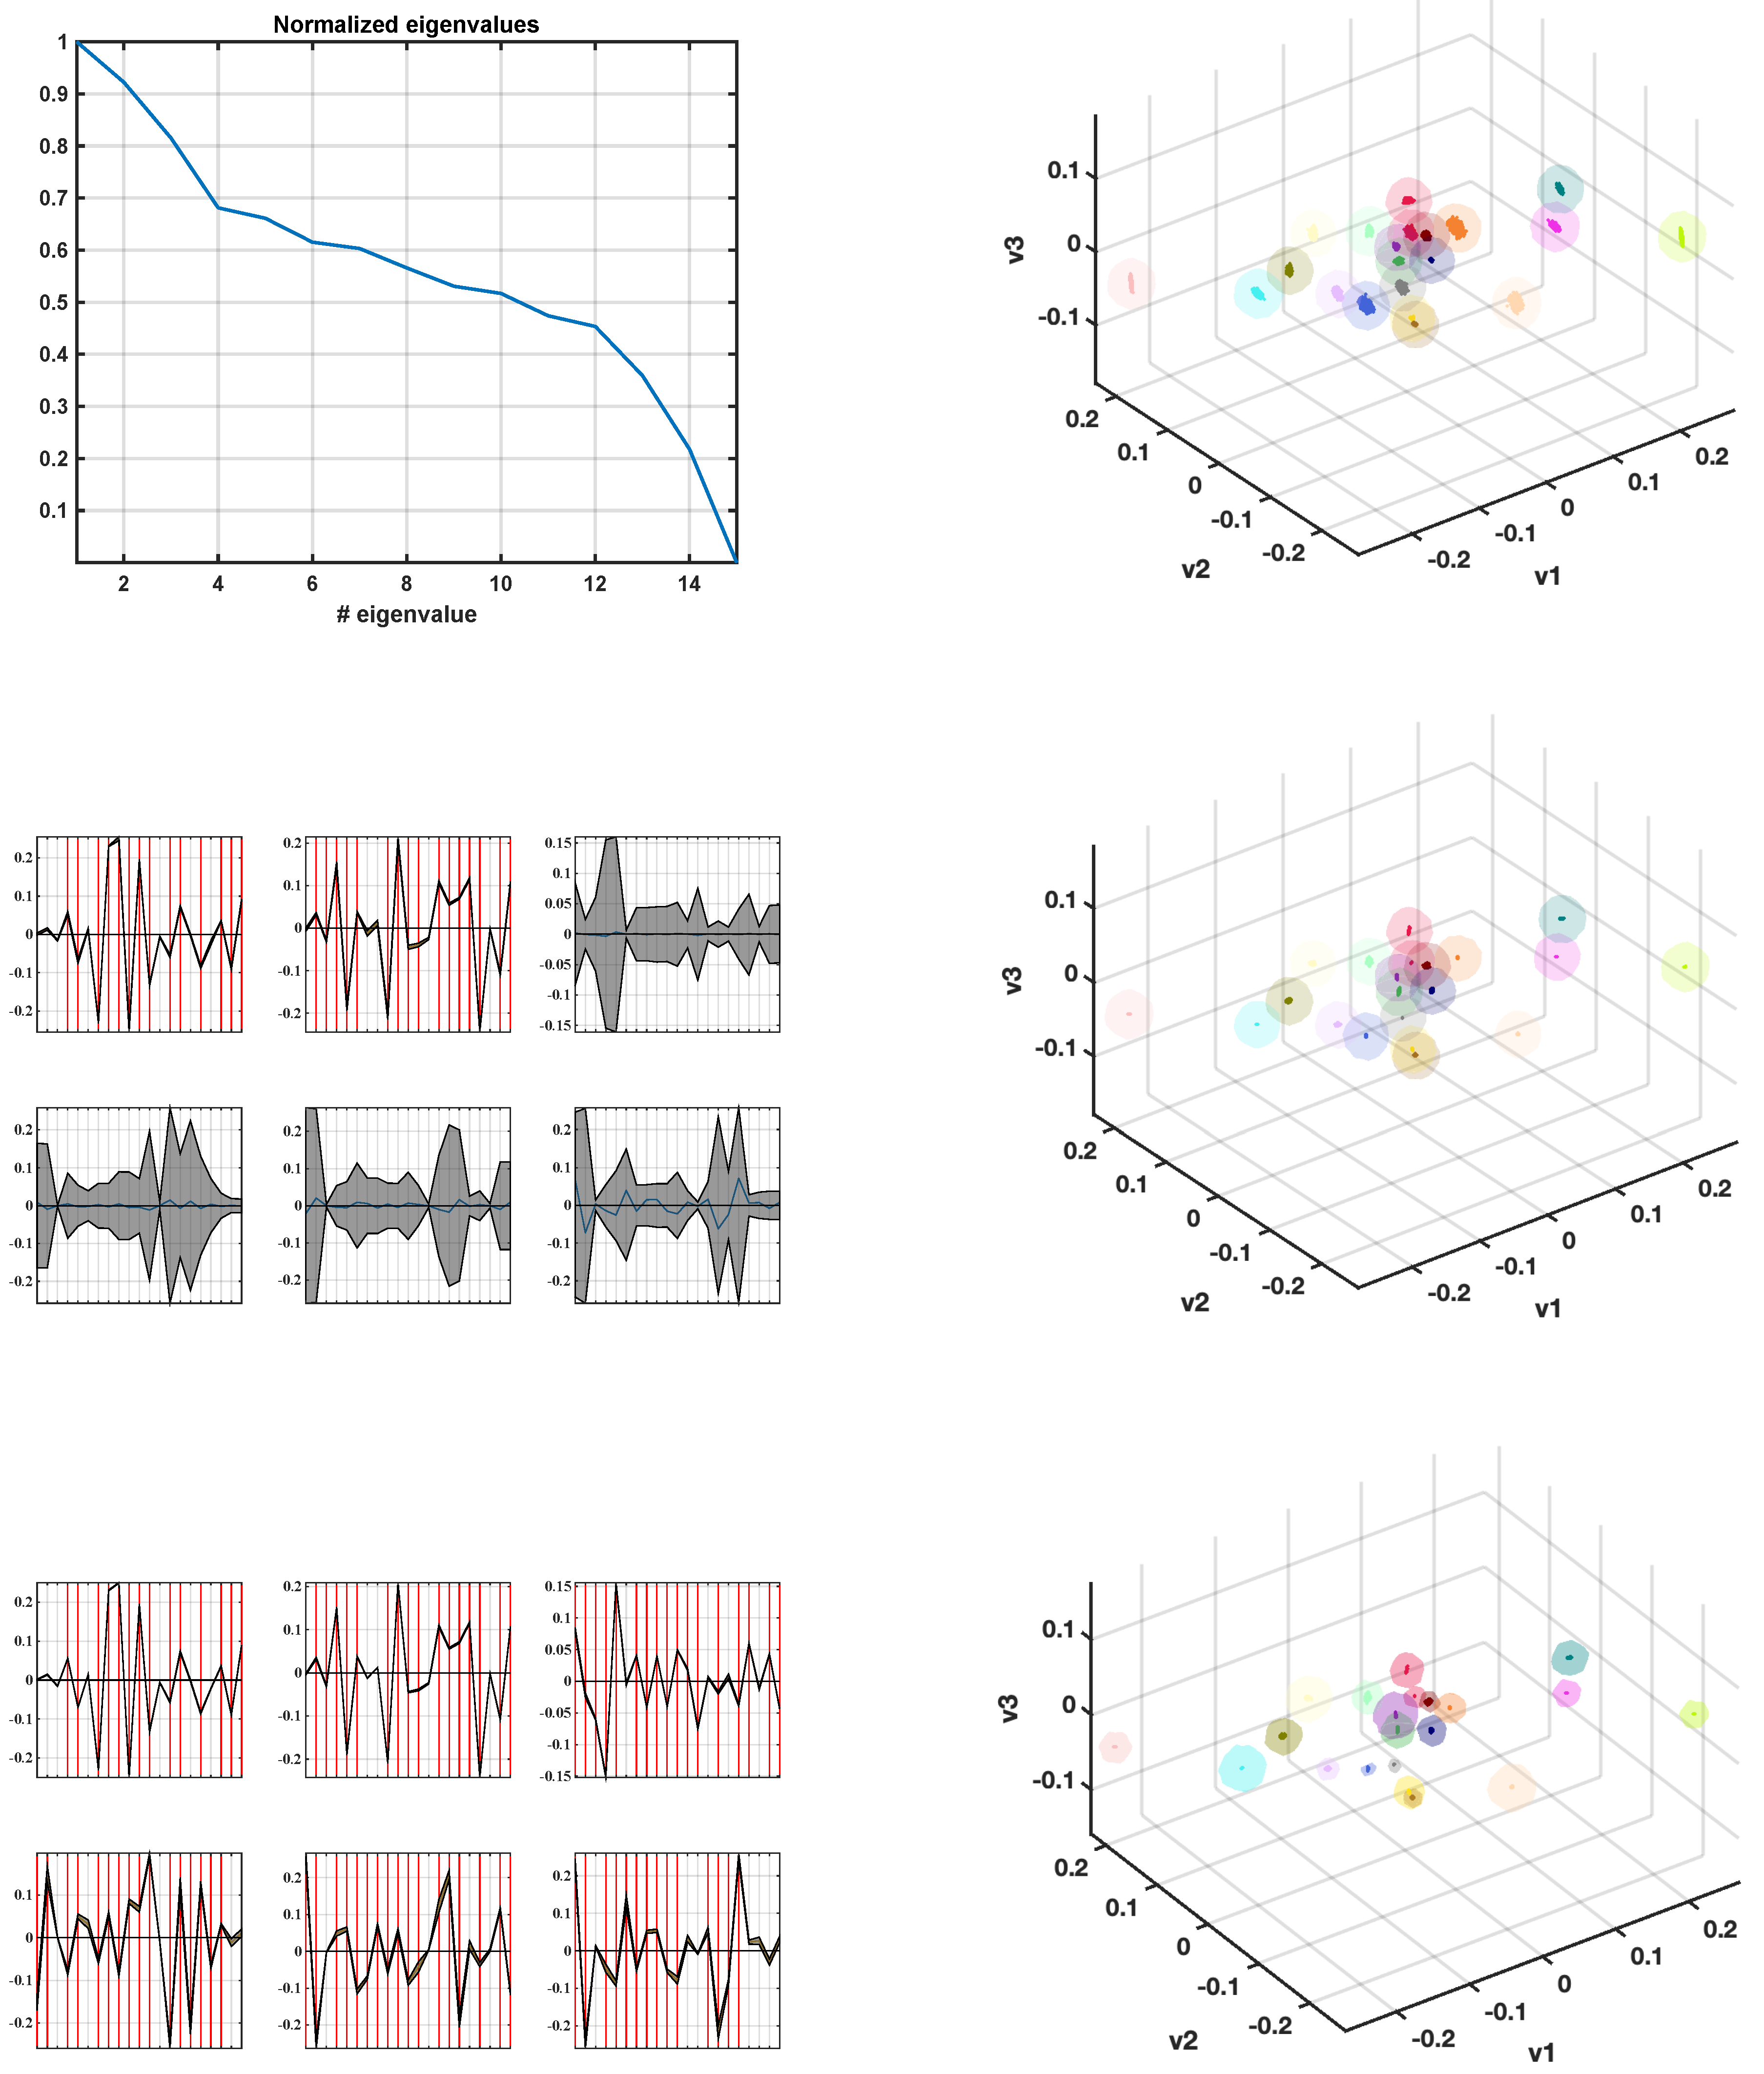
Figure 1 (top, left) shows the eigenvalue profile, where it can be noted that the first three components explain most of the statistical variability, but still relevant and slowly decreasing variability is present in Components 4–12. We decided to retain six eigenvectors for their representation and three directions for the projected space representations. Note that it is common to work with the two first eigendirections for interpretation simplicity, whereas we considered that plotting projections on the first three directions could be more informative. According to the eigenvalue profile, projections on Directions 4–6 could be used if we are willing to obtain additional information, with the advantage of showing more statistical relationships but with the disadvantage of complexity for interpretation. The eigenvector representations show Directions 1–6 in decreasing eigenvalue order, and in them (left, middle and bottom panels) we can see the bootstrap confidence intervals in gray band and the significant categories in each direction (non-overlapping zero with 95% confidence intervals) are identified with a red-dotted vertical line. In the left-middle panel we can see that the first and second direction of the direct bootstrapping are very well defined, with narrow confidence bands, as it could be expected due to the high amount of recordings (several hundred thousands). However, Eigendirections 4–6 turn out to be not defined and with extremely large confidence intervals. This effect is due to the flat region of the eigenvalue profile producing eigendirection rotations during the bootstrap resampling. A procrustes correction was then included in the process to avoid this effect [
52], yielding a noticeable improvement in stabilizing all these directions, as seen in the left-bottom panel, so that this option was left as the default for the analysis in the next subsection.
The differences between using Parzen windows and SVDD for confidence volumes was also scrutinized in this example. The projections of each category was analyzed on the three first eigendirections, and it is represented for all the B resamples (in this case, ), together with the confidence volumes given by each method in the same color. Panels to the right show that the direct bootstrap resampling gives more extended clouds of points (colored points in each bubble), whereas the use of procrustes moderates the scatter of those points. In both cases, Parzen windows were obtained to estimate the confidence volumes, and, despite the dispersion in the clouds, small differences were observed in those volumes. The right-bottom panel shows that the SVDD method provides more conservative confidence volumes compared with both precedent examples, so that they were chosen to use in the subsequent analyses.
4.2. Profile Analysis on Four Groups
We further analyzed in four separate groups the CRM recordings in a client view. Given that the three most present nationalities were Spain, Germany and United Kingdom, we created a fourth group with all the other nationalities (group Others) which was roughly balanced in the dataset.
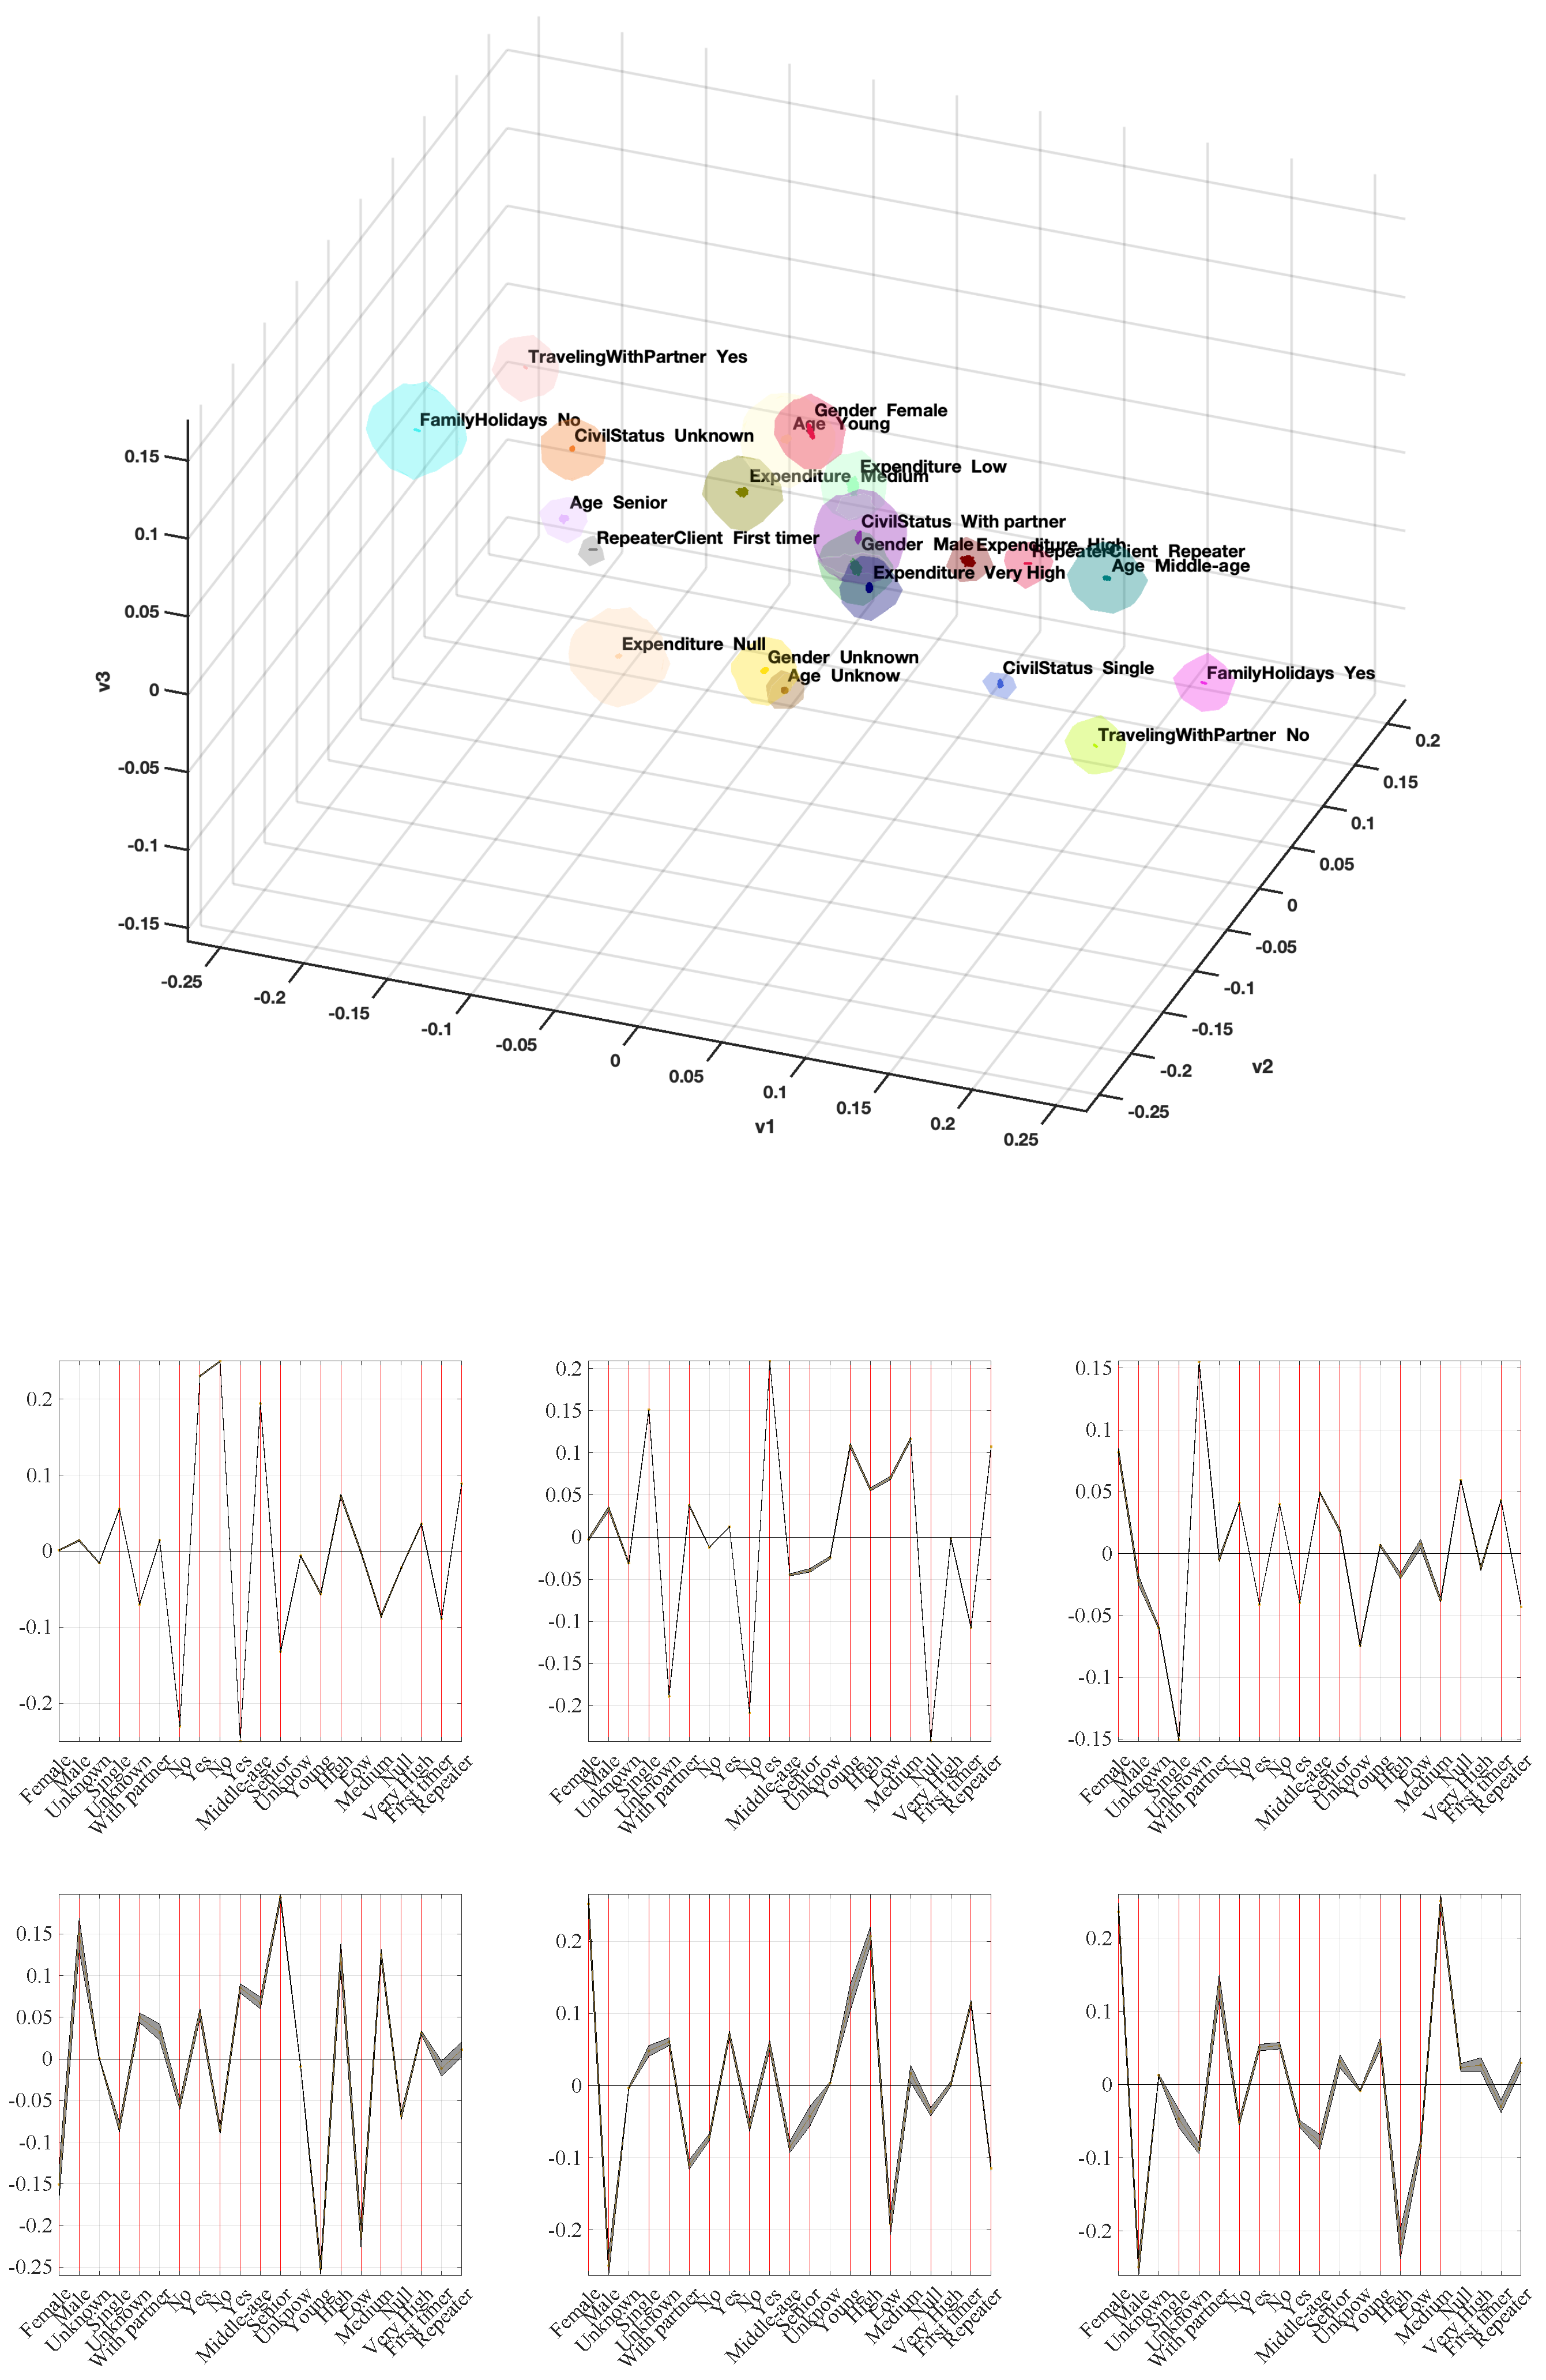
Figure 2,
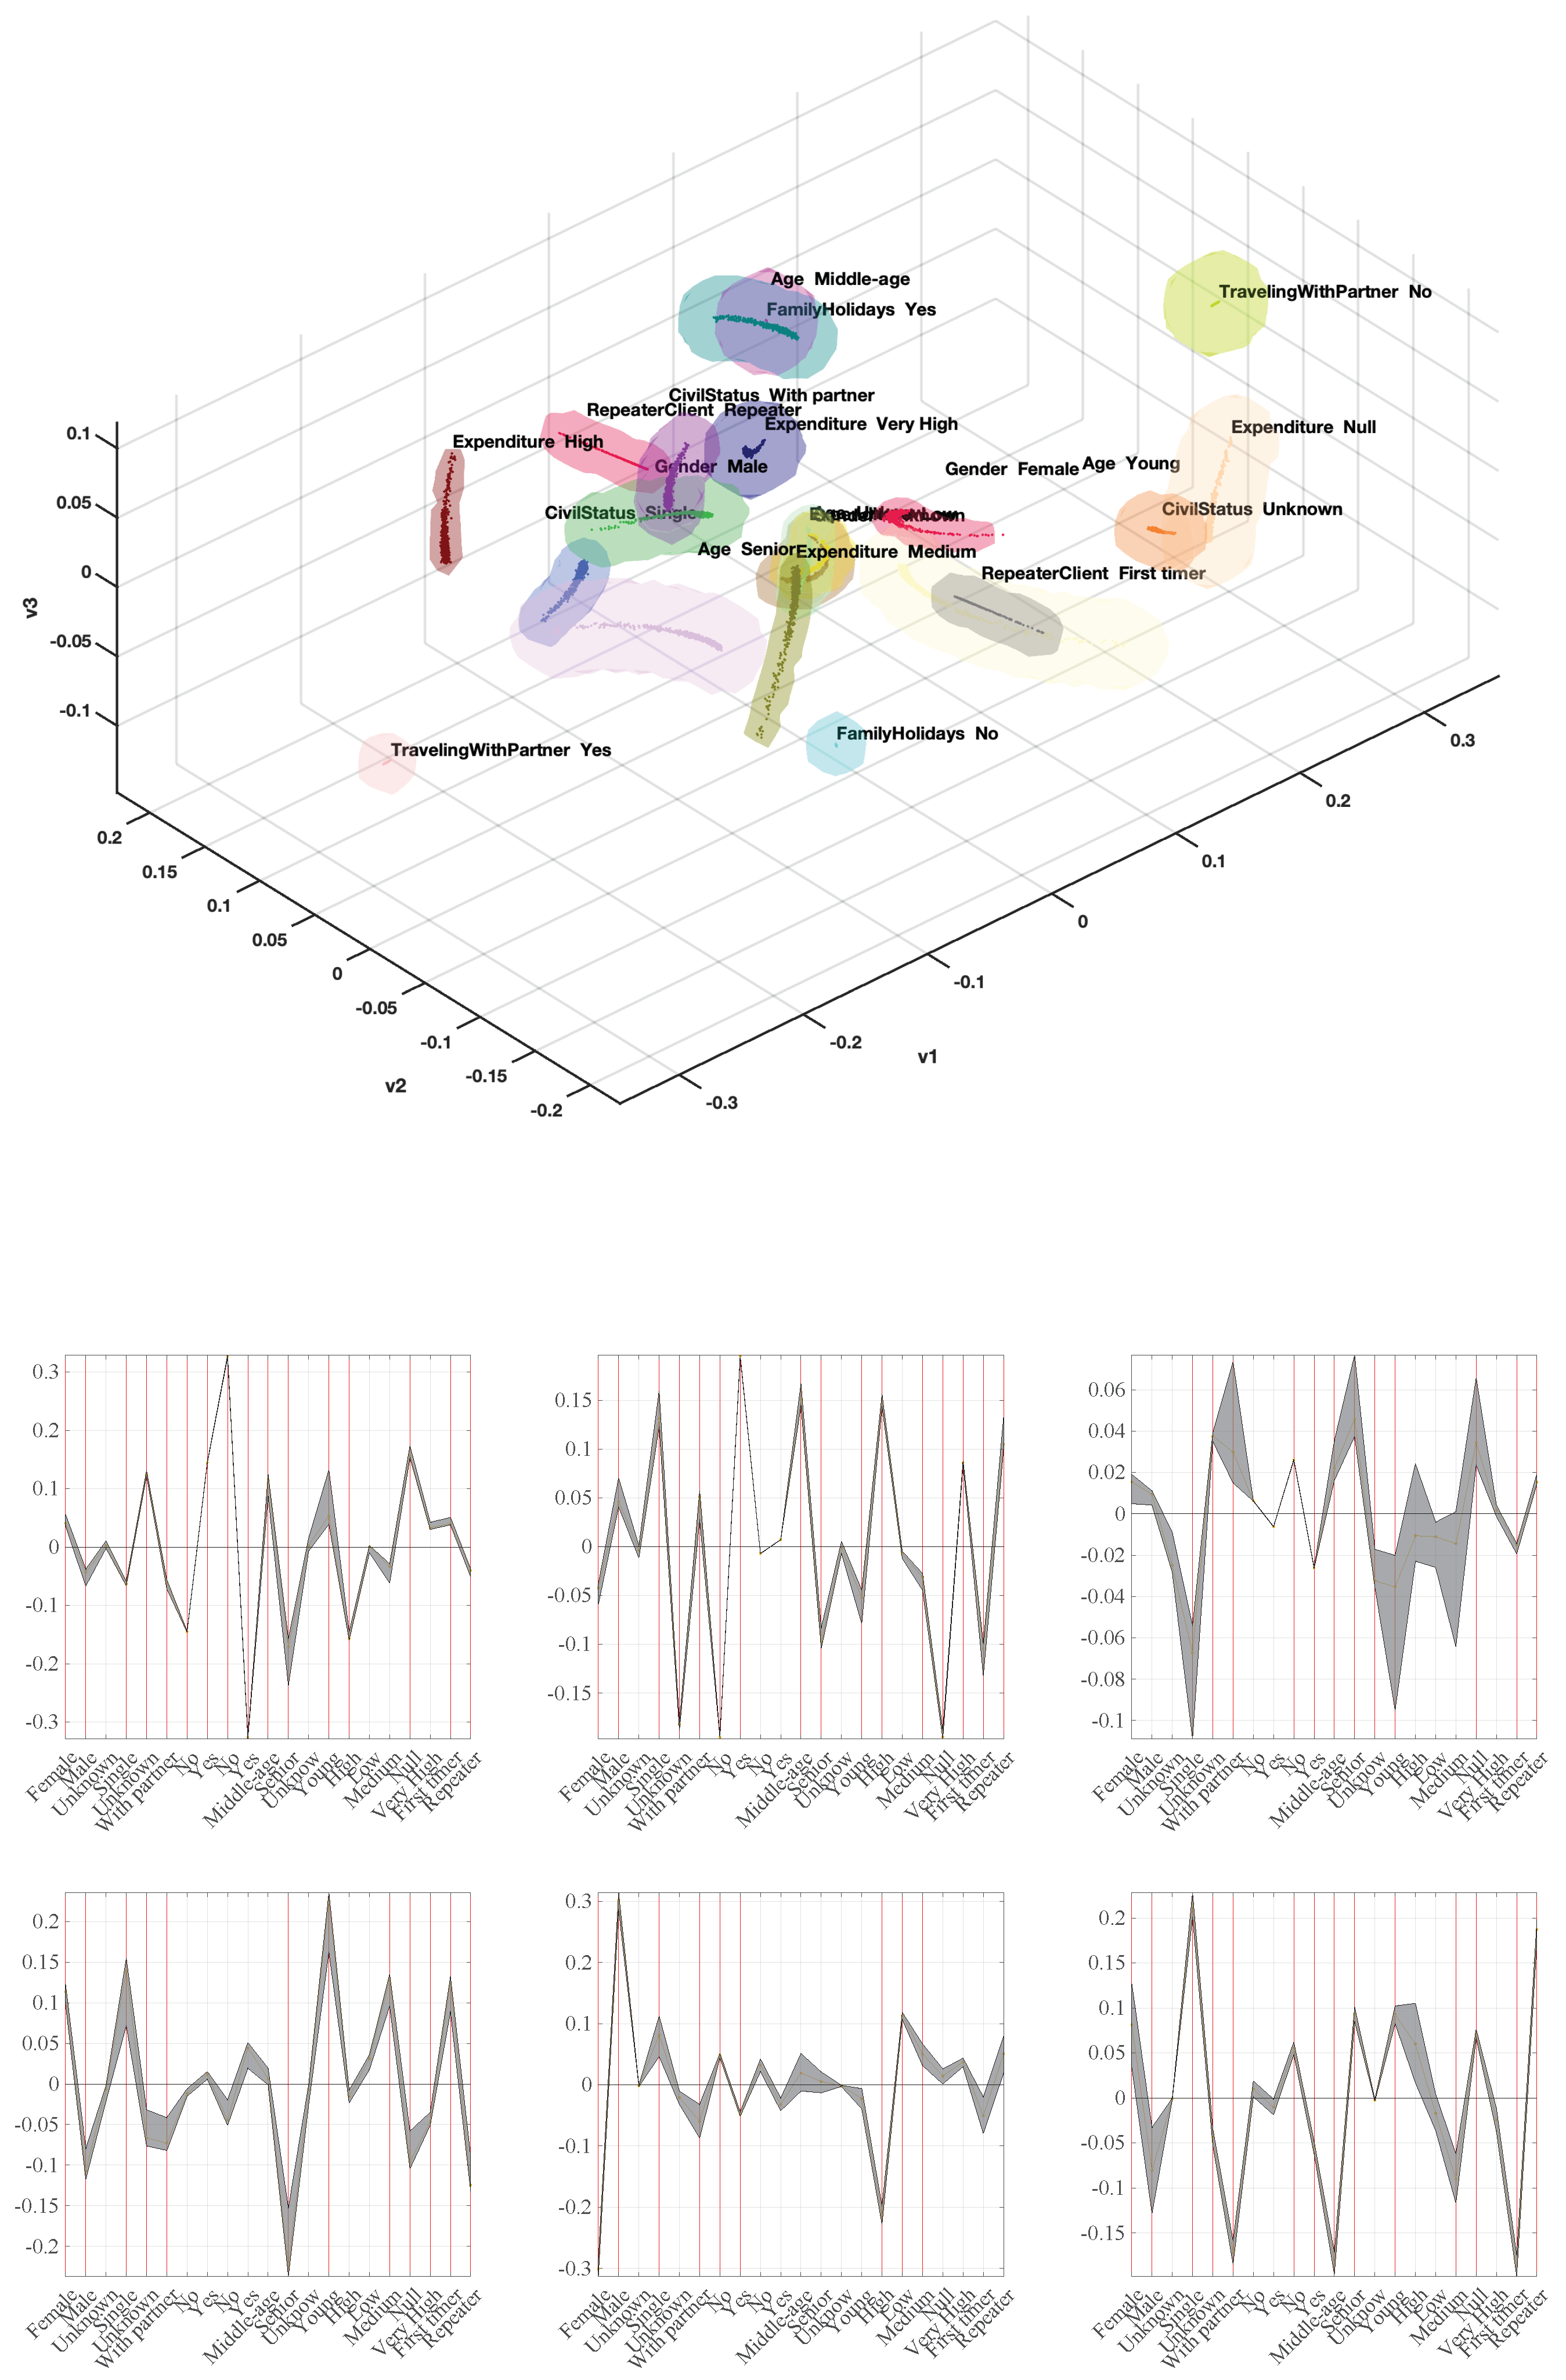
Figure 3,
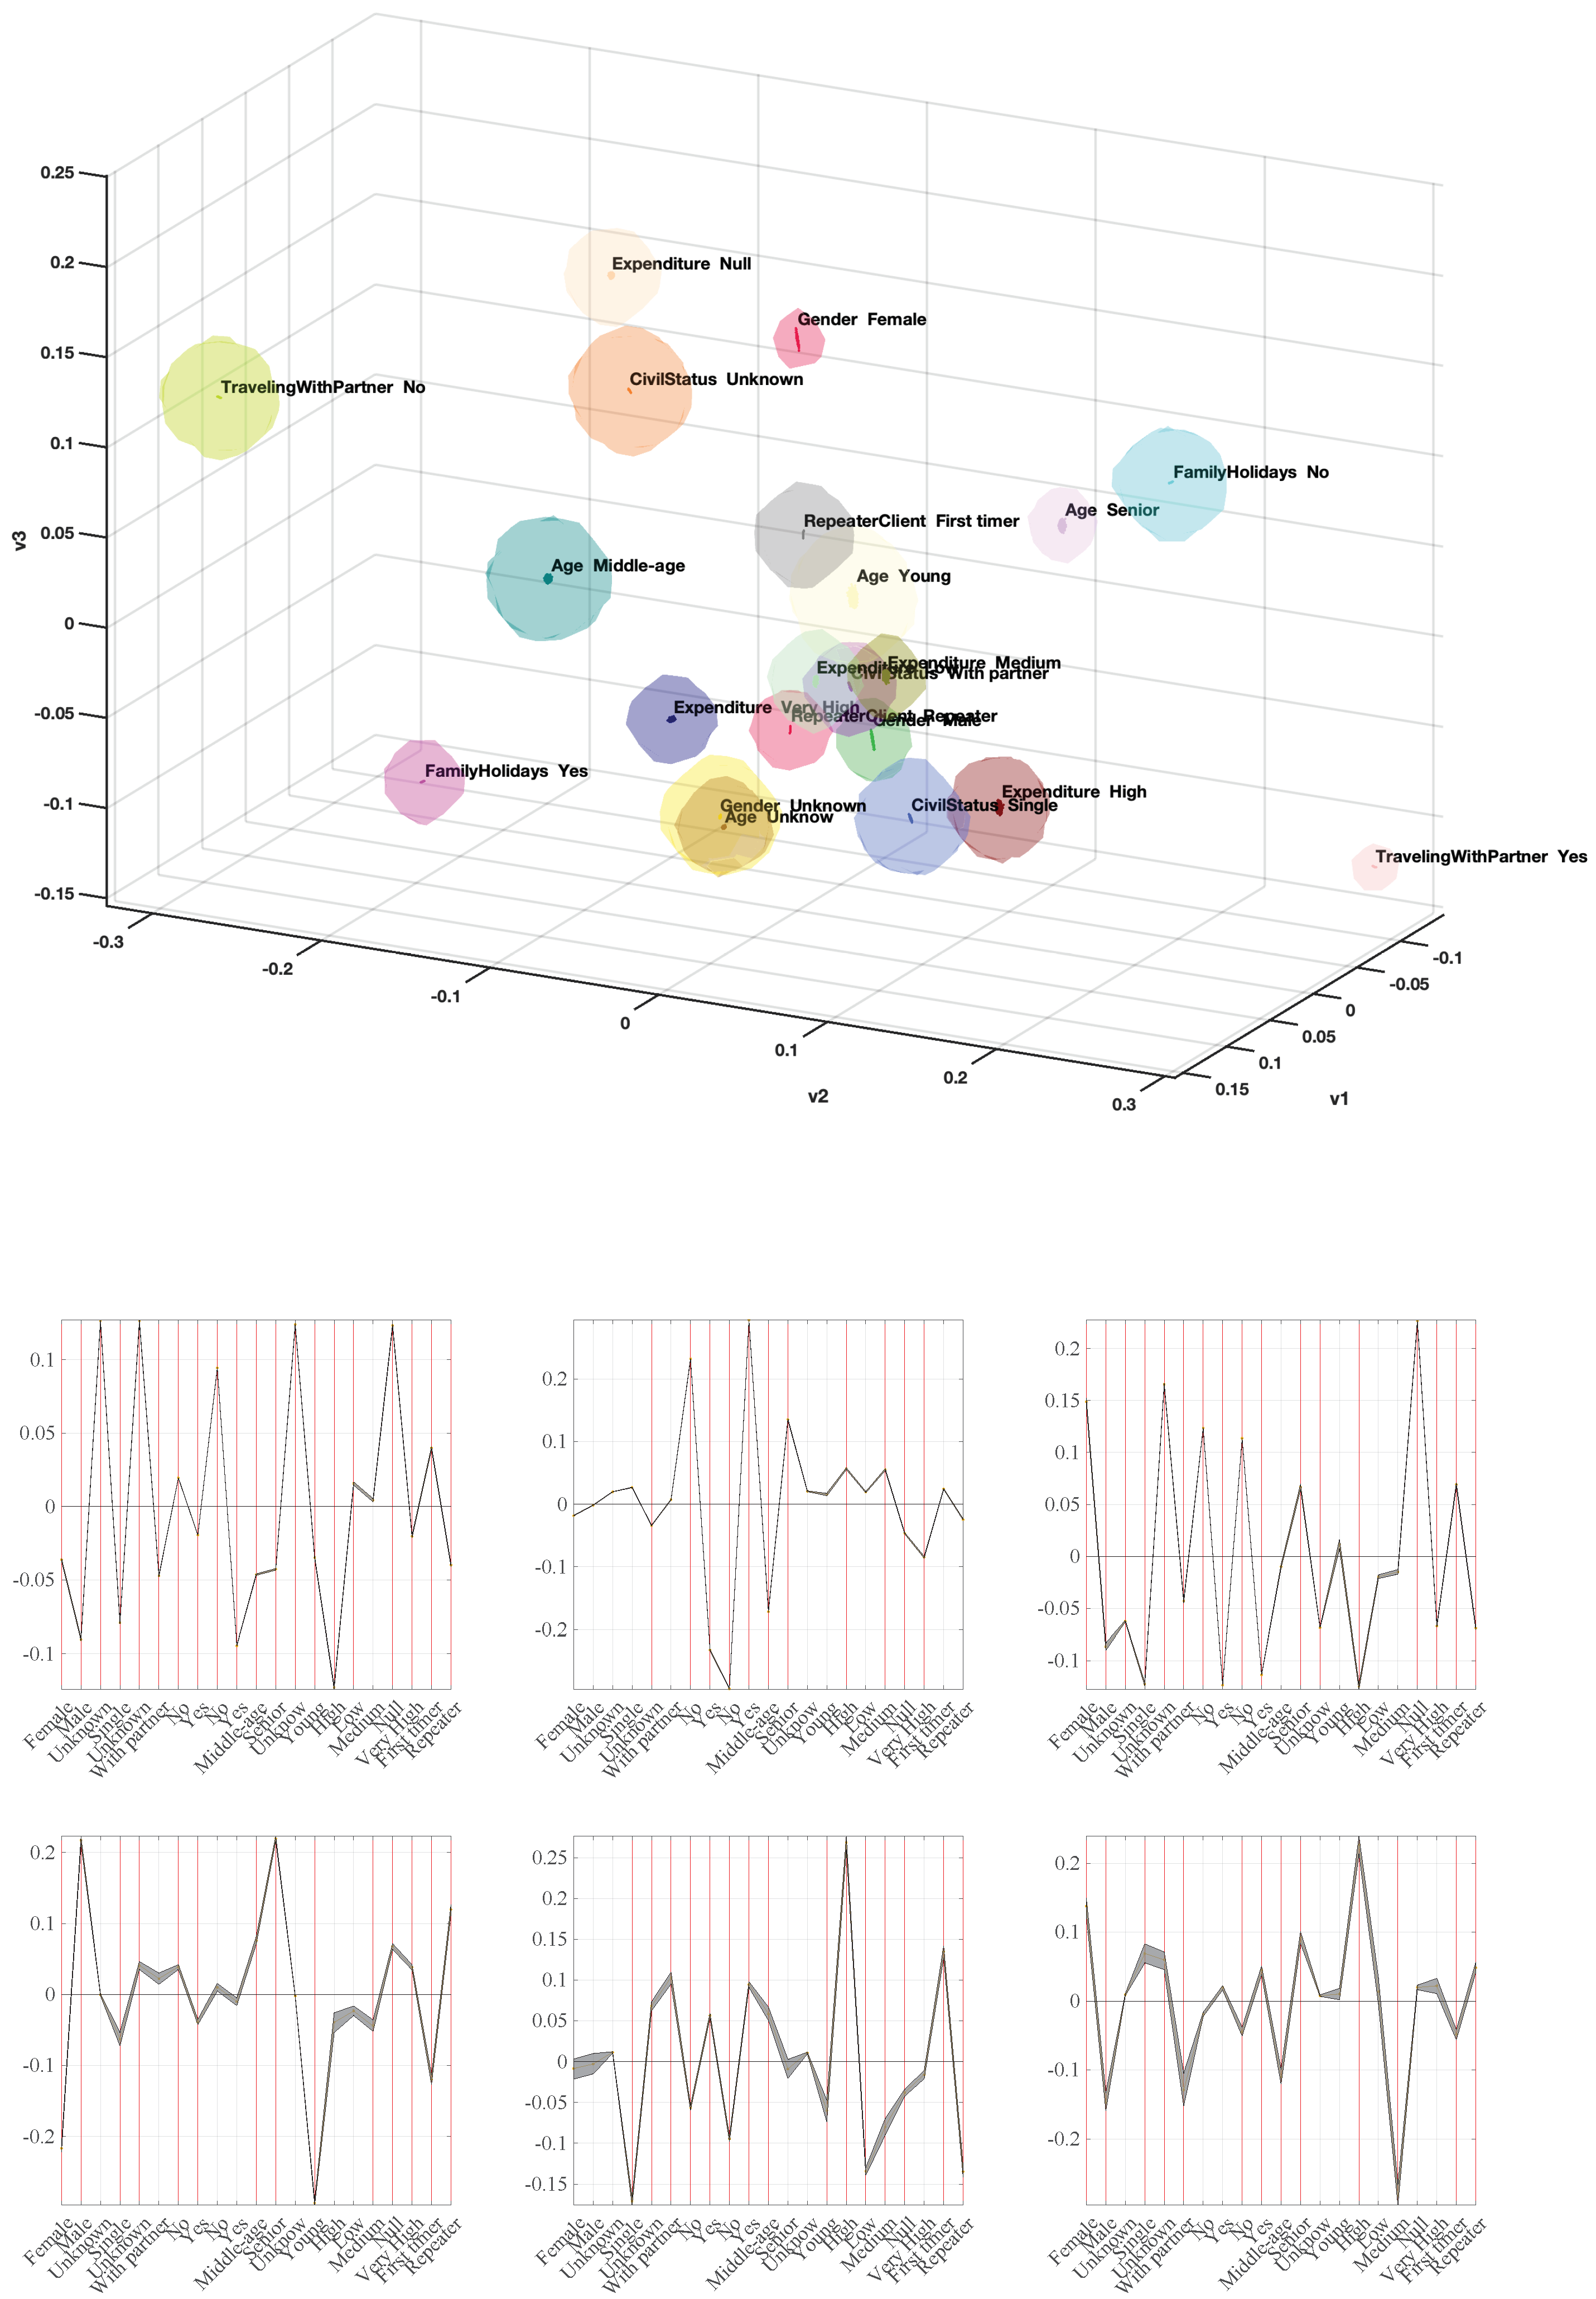
Figure 4 and
Figure 5, show the six eigenvectors (bottom) with their confidence intervals for each client group. Repeater and non-repeater categories are at the end of the vector, and in general they were significant most of these preponderant factors (though not in all of them) for any nationality. The eigenvalue profiles (not shown) were in general similar to the one shown in
Figure 1 for Spanish nationality, which means that about 3–4 first directions were predominant, followed by a smooth decay in the following ones, ending with about 3–6 faster-decaying categories. Despite this similarity in the eigenvalue profiles, the eigenvectors exhibited in general different profiles across nationalities. Eigenvectors for UK exhibited more variability than the other groups, whereas eigenvectors for Others also exhibited narrow confidence intervals, allowing us to analyze them and extract some set of conclusions as a fourth group with acceptable entity in terms of management.
The eigenvector profiles can be used as factors to analyze the groups and relationships in our categorical data. However, their interactions are not always easy to interpret, as in this case. An alternative and visual tool, which holds the statistical support of MCA principles, is commonly used by projecting each separate category to a coordinate system given by the first eigenvectors. Whereas these feature projections are usually addressed in pairs of eigenvectors, we decided here to present the projection onto the three first eigenvectors, as far as they are the most relevant ones in all cases. This allows us to extract client profiles in terms of their closeness in the projected space, and said closeness has the sense of probability of joint occurrence. We roughly distinguish among related (close projected features in the representation) and strongly related (confidence volumes overlapping in the representation). Although the projections onto Eigenvectors 4–6 are often discarded in MCA, they could be also used to extract further relationships and client profiles. Finally, we can distinguish between interpretation in terms of client profiles, given by groups of features which are close among them in the map, and repeater client profiles, which can be scrutinized by focusing on the projection of repeater categories and their closer features.
Figure 2 shows the projected categories for Spain clients. Categories of unknown types for different variables are closely related (overlapping confidence volumes), which can be due just to not being filled at the registration. The average profile is given by volumes overlapping the origin, in this case, male with partner (family) and distinguishing young (senior) clients associated with medium (very high) expenditure. Other groups with relevant associations are young with medium expenditure, and middle age with family holidays but not traveling with partner. The repeater client was close to high expenditure, and also similarly close to family holidays and to single status, whereas the first-timer client was moderately close to not family holidays and to age senior, as well as to unknown fields.
Figure 3 shows the same representation for Germany clients. It can be said that in general the features are more distributed through the projected space, pointing towards diversity of the profiles. If an average profile has to be chosen, it can be young with low and medium expenditure together with unknown age and unknown expenditure. Some other relevant profiles are middle-aged clients in family holidays, as well as senior-aged clients in non-family holidays. The repeater profile can be established as male with partner and married, with high or very high expenditure, whereas the first timer is closely related with young. Some similarities can be found on the average profile in the UK client (
Figure 4), corresponding to low and middle expenditure with unknown age and gender and partner civil status. The repeater client is close to high expenditure male with partner civil status, whereas the first-timer client is close to young, female and unknown civil status and expenditure. Finally,
Figure 5 shows that the projections for other locations are more concentrated on the average (see the narrower spread of the axis for the first eigenvector). The repeater client is closely associated with very high expenditure, male with middle age, both with civil status single (here closer to high expenditure) and with partner (very high expenditure). The first-timer client in this population is somehow close to senior and female with young age. Note that other relationships can be scrutinized by emphasizing the relevant feature that we want to check. The closeness among the unknown fields held across different nationalities.
5. Discussion and Conclusions
Previous studies have shown that simple Big Data tools such as Bootstrap resampling techniques for proportion and mean tests can be very effective to determine the client profile [
12]. However, these statistical description were not able to provide the managers with information about the cross-relationships among features and especially among categories. This study carried out a more in-depth analysis to provide a better understanding of the cross-relationships among the business-relevant variables, through the multivariate joint description provided by MCA, and we aimed at extending it through bootstrap resampling and two possibilities of their statistical grouping similarly to confidence intervals, called confidence volumes. These tools allow us to extend the usefulness of MCA and to give the managers an interpretable and statistically solid tool. In the current study, we used it to establish the analysis of average groups of clients in terms of nationality, as well as to scrutinize the specific features of repeater and first-timer clients, which is a key point in hospitality. Nevertheless, one should keep in mind that the use of different approaches to identify relevant features can often provide us with different results, even with the same data input [
53,
54], as they tend to rely on different optimization criteria. This issue represents a challenge for future works aiming to give stability to the proposal of sets of features in practical applications.
Apart from that, other end points can be analyzed through this approach. The importance of an in depth hotel client-profile knowledge in circumstances such as COVID-19 crisis has already been highlighted. The reorientation towards domestic demand, service customization and guest loyalty and retention increase (reducing guest acquisition costs) become key recovery drivers [
12,
55]. In this setting, understanding the differences in repeater profiles according to their nationality is crucial for the required reorientation of the business strategy.
The results on the specific analyzed dataset show that average German and English clients are often quite similar and differ from the average Spanish client as in [
12]. Thus, it can be said that young male Spanish clients traveling with partner are often associated with medium expenditure, whereas senior clients travel with family and their expenditure is often high. The average German client stands out for being young and low-medium expenditure but traveling with family when middle-aged. Finally, the average English client is low-middle expenditure traveling with partner. Therefore, expenditure and age seem to be linked throughout nationalities, al though Brida and Scuderi [
46] stated that the size and the reference categories vary from one study to another and do not allow generalizations as to whether a certain age class is significantly related to tourism expenditure. The profiles exhibit differences that can be scrutinized with the proposed method.
From a first-timers-vs.-repeaters point of view, repeater profiles are more similar to each other in the UK and Germany clients, whereas they are more differentiated from Spanish repeaters. For instance, gender appears as a differentiating variable since repeaters among German and UK clients are men. Young women are more likely to be first timers especially in UK clients. The literature supports the different preferences in men and women regarding to hotel characteristics [
56,
57,
58]. Age is also a relevant socio-demographic variable in the client profile [
47,
48] that influences motivation in purchasing patterns and client behavior. First timers are usually young (in German and UK clients), aligned with Henry [
49] who pointed out that older consumers have stronger brand loyalty than younger ones and Gitelson and Crompton [
50] who observed greater youthfulness among repeaters. Nonetheless, this differs from Spanish first timers who are seniors. Therefore, products and marketing strategies will have to be different for these segments.
Nationality explains, in some cases, more than 35% of the total variation in expenditure [
51], hence becoming one of the most important variables from expenditure point of view. In Spain, foreigners account for approximately 65.73% of overnight stays in hotels and their daily expenditure is 43% higher than those of Spaniards. English (25.22%) and German (20.73%) visitors generate the most overnights in Spanish hotels (INE, 2020). These results are consistent with this analysis because German and English repeaters are identified as high spenders. Similarly, Spanish repeaters are a high expenditure profile, and, for this reason, repeaters should be paid special attention as a high-value segment and as such of interest for current crisis recovery in the sector. Marital status is also a differentiating factor in the repeater profile. Thus, the German and English repeaters travel in pairs while the Spanish usually travel as a family. These results are consistent with Tasci [
59], who determined that married clients were more loyal clients, and with Talón-Ballestero et al. [
12], who pointed that approximately 60% of the Spanish holiday market is made up of families. Families represent higher incomes for hotels since their stay is longer than that of other segments and they contract more services (menus, activities, or many others). Finally, first-timers are in general less reported in the CRM systems in a wide number of categories of unknown types for different variables.The need for adequate data collection is obvious in order to improve customer profiling, offering more adapted services that boost their willingness to repeat [
60].
The reorientation of the hospitality strategy forced by COVID-19 crisis is going to advise in the short and medium term about the enhancement of the Spanish repeater segment characterized by high-expenditure family holidays. The reasons are that the repeater client is more likely to return to the hotel than a new one as well as be a Spanish client, because it is unlikely that in a short time the foreign air traffic will go back to normal. As mentioned above, the Spanish client in this chain is a middle-aged man traveling with his family. The actions derived from this strategy would focus on direct marketing and sales promotions that stimulate this target (e.g., a newsletter aimed at repeating families offering the possibility of children staying free). With regard to the product, it could promote facilities and services aimed at families such as children’s animations, babysitters, playgrounds or adaptation of children’s menus, to name some few possibilities. In the long term, with improved global situation, an effective strategy could be trying to attract an unexplored segment of lesser fidelity but with important future impact: young foreign women. From a business viewpoint, these results can help to focus the supply to the needs of those clients that are strategic for the company.
A balanced commitment to maintaining loyal clients and achieving new segments may be the key to overcoming one of the greatest challenges the hospitality industry has ever faced. The identification and effective management of those factors which create value and influence first-time client decisions and repeat-client loyalty are decisive [
61]. The current crisis is testing the survival of a large number of businesses whose ability to react will be the basis for success in a critical situation.
The proposed method aims to extend the basis of Big Data for hospitality established in [
12], which started from a univariate framework putting together statistical tests for numerical and for categorical data. It is evident that advancing from that point to multivariate tools is a necessary step to better understand large data stores. The idea of combining MCA with bootstrap resampling and Parzen windows was first proposed by Corral-De-Witt et al. [
42], in the context of emergency analysis from alert recordings in 911 units, and that methodology was extended here by stabilizing the resampling method and leveraging kernel methods and domain descriptions in order to give improved confidence volumes. From a Data Science point of view, two highly recommendable directions to cover in hospitality and CRM analysis are the inclusion of machine learning methods providing knowledge discovery in labeled data, such as the Information Variable Identifier method [
53] or the use of nonlinear mappings to embeddings, either to higher-dimensional feature spaces (in terms of kernel methods) or to lower-dimensional embedding spaces (in the context of autoencoders and deep learning) [
24,
62].
This work opens up interesting future lines of research. This analysis was carried out considering the profile differences of the two defined interest groups, namely repeaters and first-timers. However, some recent studies [
61,
63] have pointed the variability in a large majority of attributes in relation to the frequency of re-visitation. Future research should develop a more in-depth analysis of the potential heterogeneity in the repeater market. The availability of easy-to-handle analysis tools as Multiple Component Domain Description can be strategical and useful for managers in this scenario.

 ,
, 


