Article

Real-World Vehicle Emission Rate of Particle Size Distributions Based on Measurement of Tunnel Flow Coefficient

1
Department of Environmental Engineering, Mokpo National University, Muan 58554, Korea
2
Department of Environmental Science, Hankuk University of Foreign Studies, 81, Oedae-ro, Mohyun-eup, Yongin 17035, Korea
3
Transportation Pollution Research Center, National Institute of Environmental Research, 42, Hwangyong-ro, Seogu, Incheon 22689, Korea
*
Author to whom correspondence should be addressed.
Submission received: 14 November 2020 / Revised: 8 January 2021 / Accepted: 12 January 2021 / Published: 15 January 2021
(This article belongs to the Special Issue Air Pollution II)

Abstract

:
This study aims to analyze the seasonal number concentrations corresponding to each particle size derived from the measurements of exhausts from approximately seven million vehicles on real-world using a pair of the scanning mobility particle sizer to determine the vehicle emission rate. The actual tunnel flow coefficient was investigated for car emission rate based on the measurements of individual physical parameters (i.e., cross section area and length of the tunnel, tunnel wind speed and traffic volume). The mode of particle diameter according to temperatures in respective seasons exhibited a high correlation together with rapid changes at temperature above the breakthrough point. The temperature acted as major cause of determination of final condensation diameter, which is also dependent on diverse environmental effects comprising particle number concentration. The traffic volume of ordinary cars increased by more than twice as much in the period of Asian New Year, the traffic volume of buses/RVs/trucks decreased by more than 25% during weekdays. As a result, the particle number concentration discharged from a unit vehicle was 6.96 × 10¹² N/veh·km during weekdays, and the values of weekends appeared as 6.08 × 10¹² N/veh·km. The overall averaged particle number concentration based on the actual seasonal road measurements shows 5.82 × 10¹² N/veh·km.

1. Background

The studies, intended to identify the formation and sources of nano aerosol in the air, have been actively conducted so far by employing synthetic models enabling comprehensive measurement in terms of physical and chemical aspects [1,2,3]. In the chemical aspects, the aerosols in the air mainly consist of organic compounds, inorganic compounds, and trace elements [4,5,6]. The current level of technologies, enabled to analyze chemical substances less than approximately 10 nm to understand the formation thereof, is however quite limited yet [4,7]. Thus, the analysis of chemical components such as nitrate ions (NO3) of PM2.5 (less than 2.5 micrometer particulate matter), created from the oxidation of primary gaseous compounds, such as NO, are being carried out, together with analyses on physical characteristics in size distribution according to varied number concentration [8,9].
The studies associated with the source of particles, are in progress by measurement of the size distribution simultaneously conducted with analysis of mass fragments of particles evaporated at 70 eV by exploiting the real-time aerosol mass spectrometer (AMS) of a unit of second [10,11,12]. However, the studies inevitably exhibit limitations in identifying the sources of particles in terms of (1) the limitation in the analysis of thousands of organic compounds, and (2) rapid decrease of analytical sensitivity for particle size distributions less than 100 nm [13]. In regard to the number concentration, over 80% of particulate matters in the atmospheric environment are related with ultrafine (<0.1 μm) particles [14]. However, the hazardousness of ultrafine particles is difficult to identify since mass concentration of particulate maters in the atmospheric environment is determined by the particles of relatively bigger size based on PM2.5 components analysis, or particulate matters of PM10 (<10 μm), identified from chemical analyses. In general, it has been reported that smaller particles, residing in the atmospheric environment, tend to exhibit higher degree of hazardousness to human health [15]. According to previously conducted study, the smaller particles appeared with higher probability of deposition in the respiratory organs of human, and were estimated to have higher accessibility to human skin as well [16]. For example, the toxic equivalency quantities (TEQ) of poly aromatic hydrocarbon compounds (PAHs) in particulate matters, to be absorbed through respiratory organs of people in the office, appeared higher in accordance with smaller particle sizes of the 0.67, 2.04, and 2.64 corresponded to particle sizes of 200–2000 μm, 100–150 μm, and <43 μm, in the experiment [16,17].
The issues of traffic environment, resulting from exhausts from vehicles, emerge as common issues of international community, while the United Nations Framework Convention on Climate Change including major countries promote the development of diverse policies and projects pertinent to the resolution of traffic environment. In regard to the generation of particulate matters in metropolises, the vehicle exhaust has been reported with significant contributions [18]. Since over 90% of the number concentrations of vehicle exhaust are comprised of particulate matters less than 1 μm, the particulate maters in the exhaust are closely associated directly with the health of human body [19,20,21]. The relevance of hazardousness of vehicle exhaust to human health has been identified from several studies. According to previously conducted studies, approximately 50% of traffic volume was reduced to mitigate the effect of air pollution during the period of the 2008 Summer Olympics in Beijing. The health of adolescents in Beijing, before and after completion of the Olympics, was monitored wherefrom the negative effects of increased traffic volume were found [22]. The consumption of energy has increased in the past 30 years by more than twice as much because of the increase in population. The traffic volume is expected to be gradually increasing in accordance with the expected increasing rate of population by more than 70% to the 2050. Therefore, the studies on the exhausts and characteristics of discharged particle sizes, and the preparations intending for the reduction in discharge of exhaust, are necessitated [23].
To understand the contribution of PM2.5 generated from vehicles, the emission rates of the number concentration and size distribution from vehicle emissions need to be understood clearly. In general, the scanning mobility particle sizer (SMPS) has been broadly used to measure the number concentration of particle sizes of particulate matters for the analysis of the number concentration of each particle size [24,25]. The studies, based on exhausts from vehicles, are distinguished into the ones of measurement of “chassis dynamometer” in the very limited environment of laboratories, and the measurement of exhausts from actual vehicles on roads [26]. The measurement of the chassis dynamometer has an advantage enabling the direct analysis of exhausts from vehicles, however the measurement cannot represent all vehicles traveling in actual area, and in particular, the relationships with the real environmental conditions is highly limited. Therefore, it is necessary to investigate the particle number concentration under the real environment conditions.
In the present study, the number concentrations, corresponding to each particle size from exhausts of actual vehicles, were measured by the application of the number concentration of size distribution using the SMPS, based on the tunnel flow environmental coefficient [27], derived from the measurements of exhausts from approximately seven million vehicles on actual roads. In addition, the particle size distributions in the exhausts from vehicles, to be varying according to seasonal temperatures, were analyzed. The results, obtained from the present study, will provide us with valuable basic data, applicable to calculation of exhausts from all kinds of traveling vehicles in the future.

2. Methods

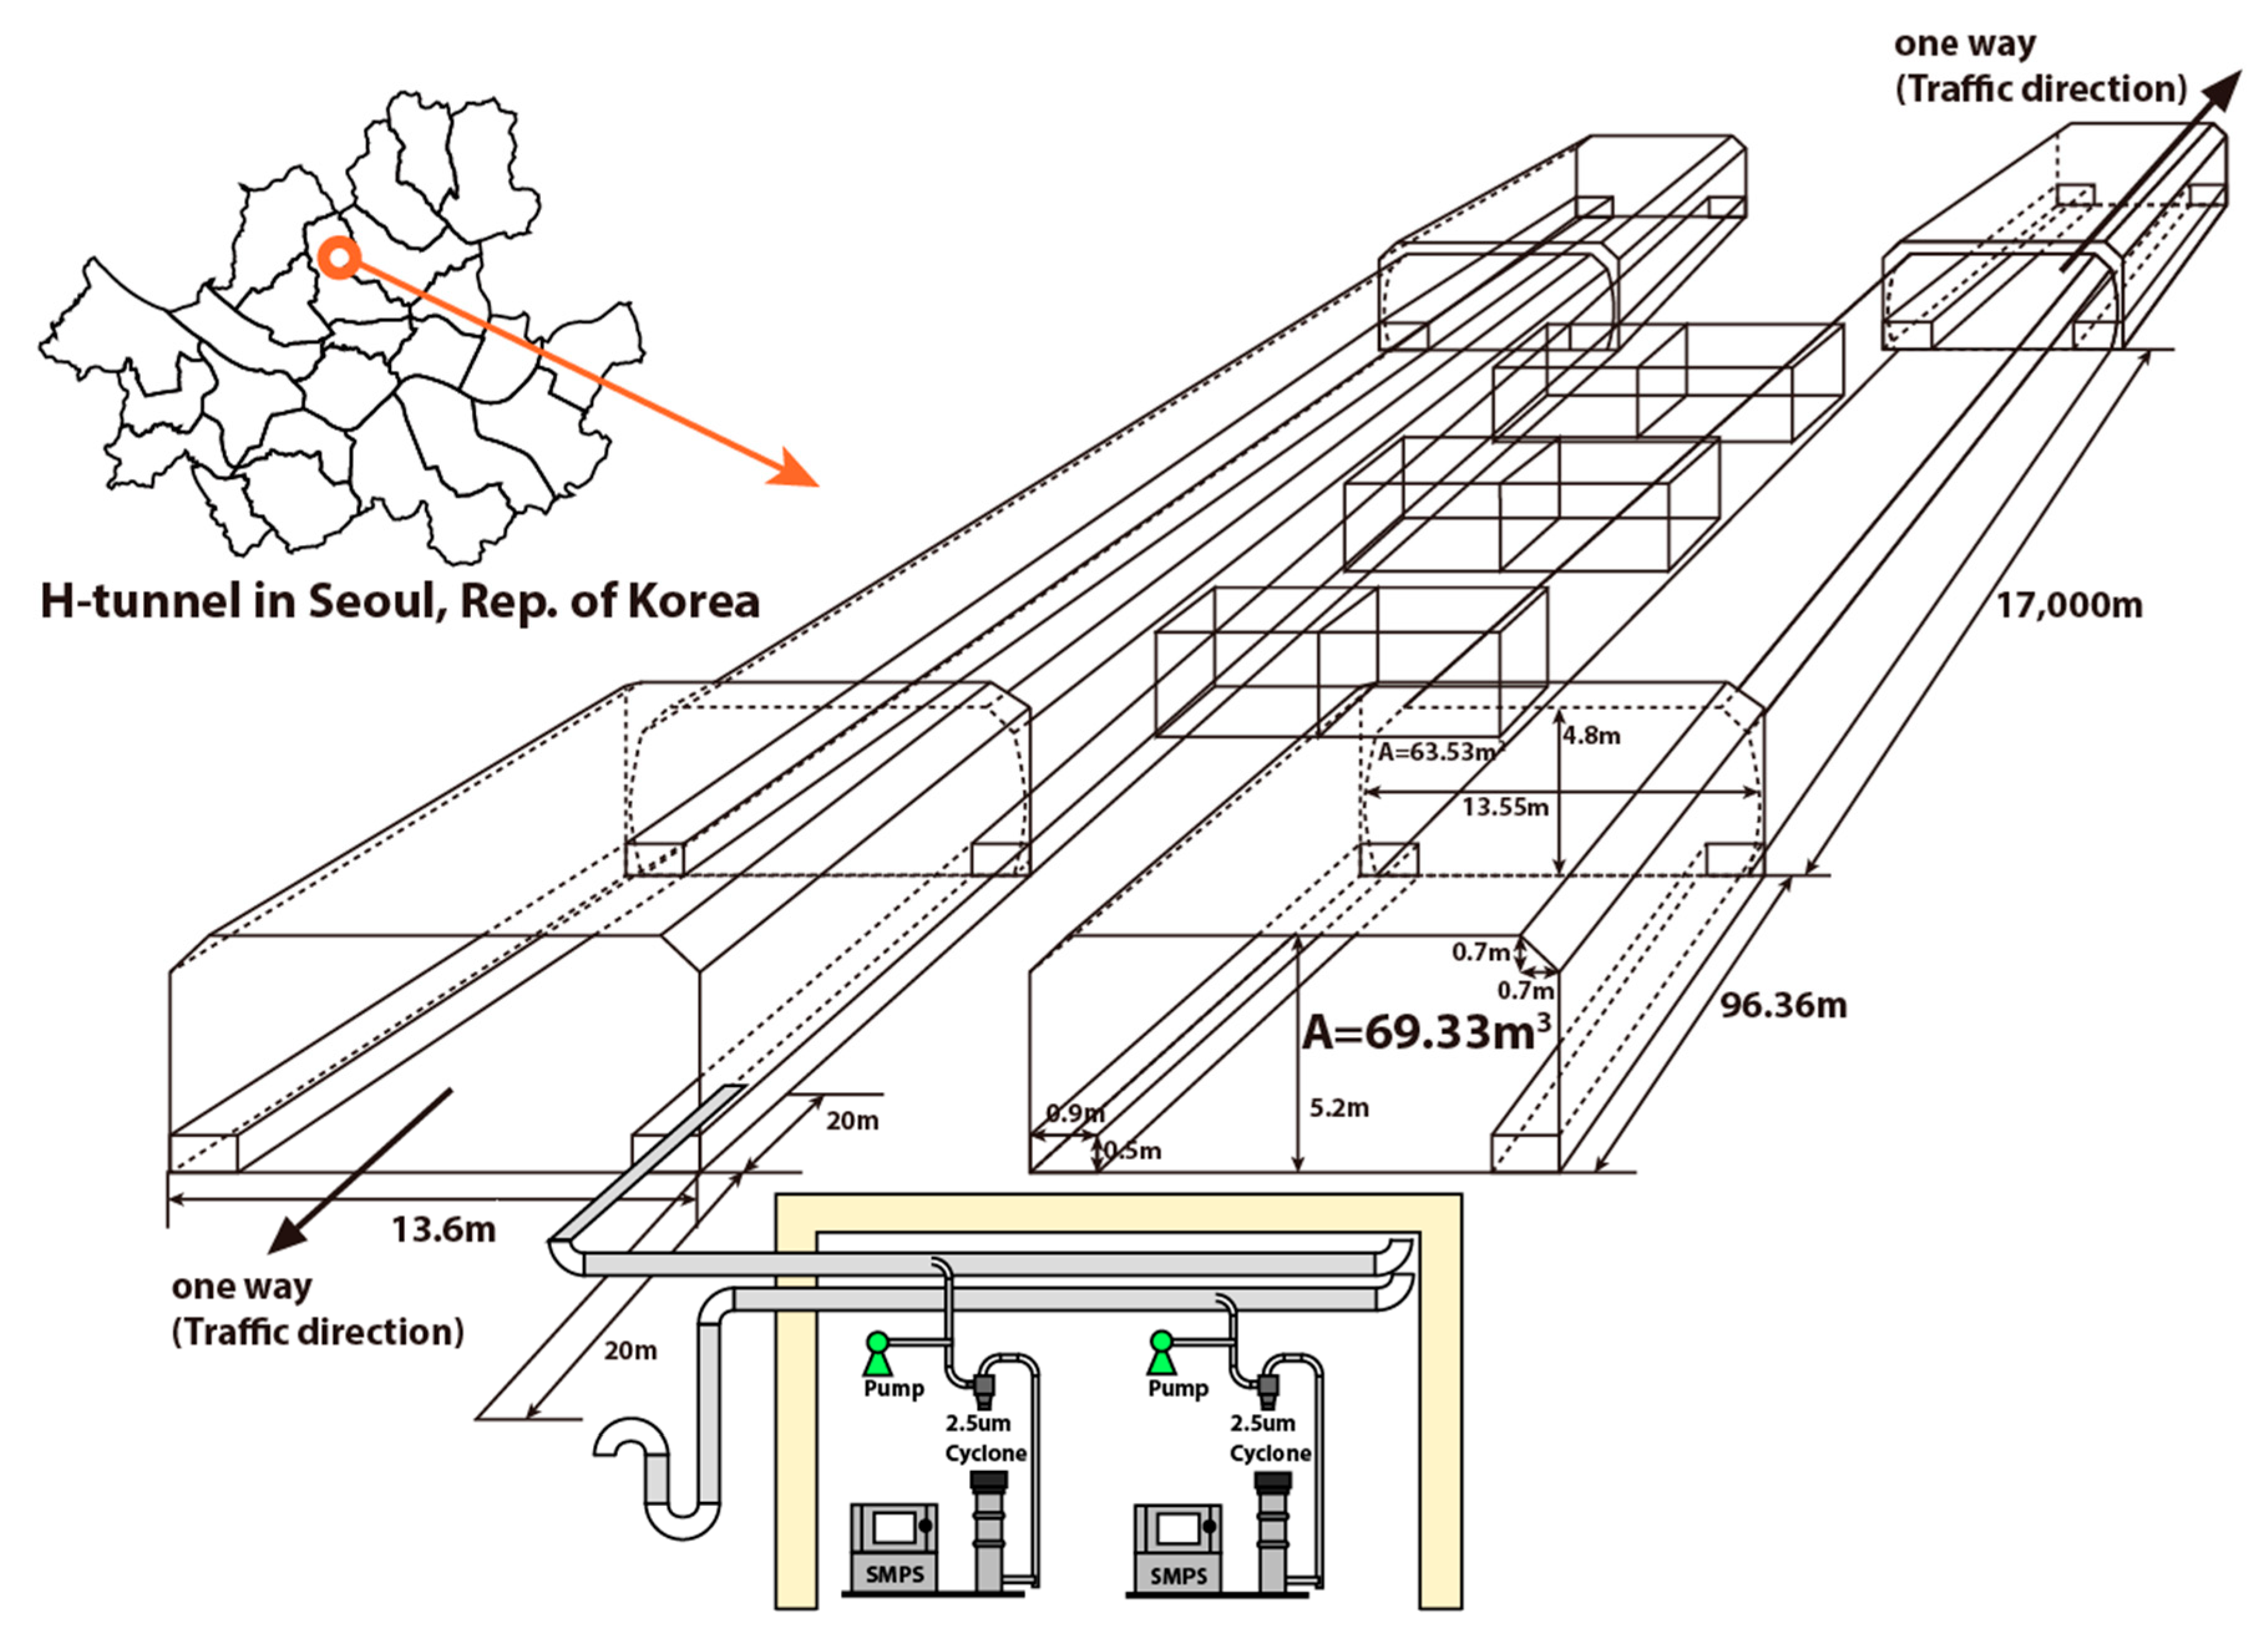
2.1. Sampling Location

The measurement of particle number concentration by using SMPS was carried out in the H tunnel (37°60′ N, 126°97′ E) located in Seoul, Republic of Korea. The tunnel is the second longest tunnel in Seoul, and is located on the internal-ring road. As presented in Figure 1, the H tunnel consists of the two one-way tunnels wherein the length of entire tunnel embraces approximately 96 m of approaching path and 17,000 m of the length of main tunnel; the width of tunnel is 13.6 m while the height thereof is 5.2 m at the approaching path. In the present study, the two pipe inlets are installed. The inlets, respectively started from the two reference points of common distance of each 20 m from the inside and outside of the tunnel exit, were penetrated into the measurement station with the flow rate of 18 m/sec. Thereafter, the exhausts, discharged from vehicles, were isokinetically sampled through the pipe inlet of the diameter of 1/4 inch.

2.2. Measurement of Particle Size Distribution

During the period starting from July 2018 to April 2019, the measurement of exhausts from traveling vehicles was carried out in four seasons for the analysis of the particle number concentration in the exhausts. The first measurement was carried out during the period from 28 July to 6 August 2018 (summer), while the second measurement was carried out in the period from 27 September to 7 October 2018 (fall). The third and fourth measurements were carried out in the intervals from 28 January to 8 February 2019 (winter) and from 14 April to 27 April 2019 (spring), with the employment of SMPS dedicated to the measurement of the particle number concentration for respectively 12 days and 14 days.
The particles of each size, isokinetically sampled from the air pipe, wherein particles of diameters of over 8 μm were removed through the cyclone installed at the front end of SMPS, were put into the analysis. Operating conditions of the two employed SMPSs are presented in Table S1 in the Supplemental Information. The particles, flowing into the electrostatic classifier via the nozzle of 0.071 cm, are separated into 110 channels of particle size distribution from 11.5 nm to 604.3 nm under a flow rate of 1.0 L/min. The Aerosol Instrument Manager (AIM) (ver. 9.0.0.0, TSI Inc., Shoreview, MN, USA) program was used for the calculation of final number concentration.

2.3. Vehicle Emission Rate of Particle Size Distributions

In the present study, the numbers of vehicles traveling in the tunnel, distinguished by the types of vehicles, were counted hourly for the analyses of number concentration, particle size distribution, and vehicle emission rate. The measurement of air pollutants obtained in the comparatively closed space of tunnel was expected to remove the effects of diffusion of exhaust from vehicles and ordinary atmosphere. The measurements of varied number concentration and particle size distribution at every hour, together with numbers and types of vehicles, enabled the analyses of the relationship of number concentration and particle size distribution with vehicles of each type. Equation (1) represents the calculation of vehicle emission rate based on the measurement of traveling vehicles in the tunnel [28].
Vehicle emission rate (N/veh·km) = Σ(Cin − Cout) × A × U × t/[#×L]
Vehicle emission rate (N/veh·km) = ΔC × δ
Here, Cin and Cout represent the number concentration (N/m3) measured inside and outside of the tunnel, while A represents the area of cross section of the tunnel (m2) (69.33 m2). U denotes the wind speed inside of the tunnel (m/s), and t, N, and L represent the reference time (second) for analysis, number of vehicles (#) passed through the tunnel while exhausts therefrom were collected, and the length of the tunnel (m) (17,000 m), respectively. From equations above, the number concentration from vehicles free from effects of other external sources of contamination were calculated, and then the vehicle emission rates were calculated from the number of vehicles passed through the unit length of the tunnel, to distinguish the difference between number concentrations discharged from vehicles inside and outside of the tunnel. Equation (1) can be simplified as the expression in Equation (2). Here, ΔC represents the difference in particle number concentration between inside and outside of the tunnel and the tunnel flow coefficient (TFC, δ) (m3/(veh·km)) can be defined as “A × U × t/[#×L].” TFC enables to calculate the vehicle emission rate of respective chemical compounds from the difference in concentration (ΔC) of other air pollutants, including the number concentration. Thus, the TFC can be explained as the volume of air that is polluted by one car driving one km. Besides, together with the TFC, the speed of vehicles passing through the tunnel, as well as characteristics of drivers of each vehicle, can be taken into account to analyze the relationship with vehicle emission rate.

3. Result and Discussion

3.1. Parameters for Tunnel Flow Coefficient

In the present study, the temperature, wind speed, number of vehicles, and types of vehicles inside of the tunnel, were analyzed to determine the seasonal value of tunnel flow coefficient. The temperature inside of the tunnel appeared as in the following order of “Summer (38.69 °C),” “Fall (25.33 °C),” “Spring (20.38 °C),” and “Winter (8.13 °C),” wherein the seasonal difference of temperature appeared exceeding 30 °C (Figure S1). With regard to the TFC, it is determined by variable parameters such as wind speed inside of the tunnel and number of vehicles passing through the tunnel rather than effects of fixed parameters, such as the area of cross section or length of the tunnel. Among the two kinds of variables, the traffic volume was counted accurately by using the HD Digital Wave Radar (Smart Sensor HD Model 126, Wavetronix, Provo, UT, USA). The measurements of wind speed inside of the tunnel may accompany uncertainties due to the measurements of hot wire anemometer (Digital Thermo Air Velocity Transmitter, FTS85, Eyc-tech Inc., New Taipei City, Taiwan). In the present study, the measurements of hot wire anemometer and pinwheel anemometer (Watchdog 2000 Series, Spectrum Technologies, Aurora, IL, USA) were compared to each other for the verification of measurements. The results revealed the uncertainty rate less than 2% from the comparison of wind speed of approximately 3.0 m/s, 4.8 m/s, and 5.8 m/s under the two temperature conditions of 19.8 °C and 36.8 °C. The wind speed inside of the tunnel appeared as in the following order of “Fall (6.15 m/s),” “Winter (4.96 m/s),” “Spring (3.80 m/s),” and “Summer (3.47 m/s),” wherein the difference of 2.68 m/s, between seasons of fall and summer, appeared. The traffic volume (#) in each season appeared as in the following order of “Winter (3183 #/h),” “Spring (3048 #/h),” “Fall (3009 #/h),” and “Summer (2926 #/h).” The speed of vehicles passing through the tunnel exhibited slight but insignificant seasonal differences to each other as in the following order, “Winter (70.6 km/h),” “Spring (68.88 km/h),” “Fall (68.39 km/h),” and “Summer (67.02 km/h).” In regard to the average number and speed of vehicles measured hourly (Figure S1), the number of traveling vehicles appeared decreasing from 2500 to 1000 vehicles from 00 to 04 AM, and thereafter, the number of traveling vehicles increased gradually to the 08 AM. Then, the number of traveling vehicles kept on the level of approximately 3500 vehicles constantly. On the contrary, the speed of vehicles manifested the aspects opposite to the number of vehicles. The speed of vehicles appeared gradually increasing from 00 to 04 AM and reached the peak speed of 92 km/h, and then it manifested the decreasing trend from 04 to 08 AM along with the increase in number of traveling vehicles. After 08 PM, the speed of vehicles was kept constant in the range 60~70 km/h.

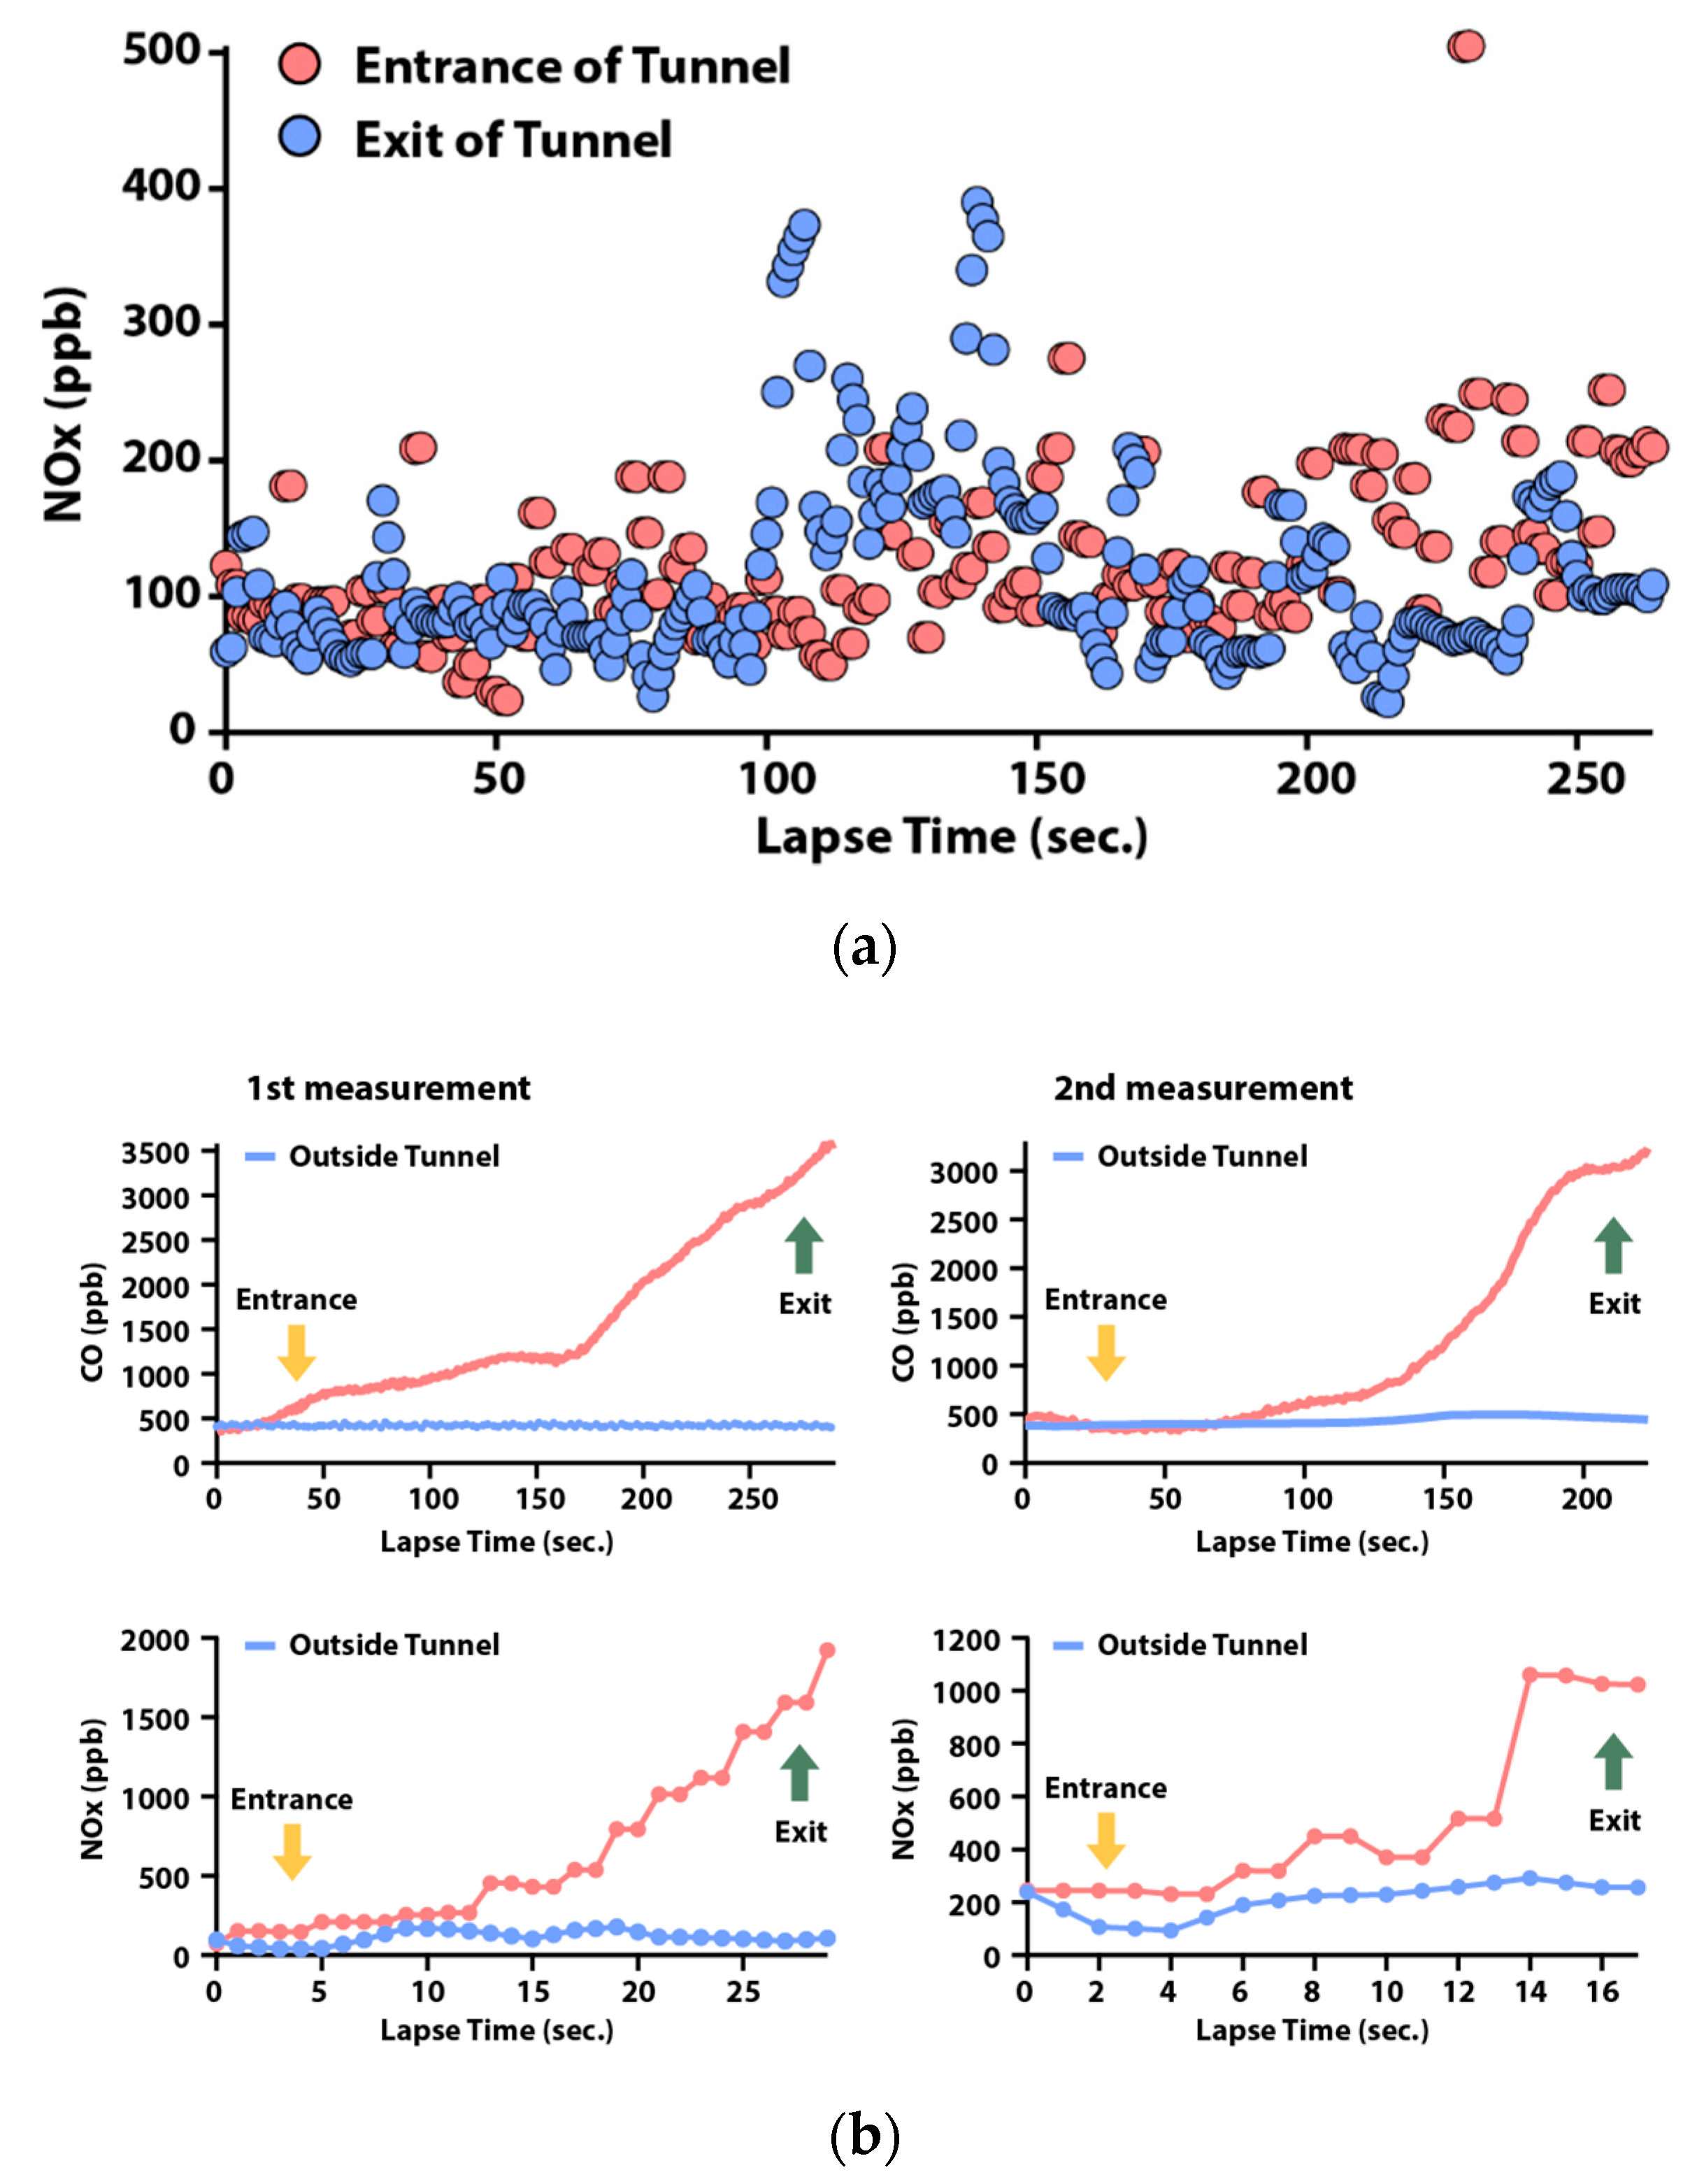
3.2. Validation of Representation of Tunnel Entrance

Among the observations of TFC (α), the difference in number concentration (△C) represents the strict difference in concentration of contaminants between entrance and exit of the tunnel. Thus, in the present study, the measurements of concentration of pollutants, obtained from the external point 20 m distant from the tunnel, were verified whether they could represent the concentration for entrance of the tunnel, by employing the “moving vehicle measurement.”
Figure 2a presents the results of measurement of CO (48iQ Thermofisher Scientific Inc., Waltham, MA, USA) and sum of NO and NO2 (NOx) (42iQ Thermofisher Scientific Inc., Waltham, MA, USA) at 2.3 m from the tunnel entrance and the 20 m from the tunnel exit as the sampling point at same time. In addition, Figure 2b shows the moving vehicle, loaded with instruments capable of measuring CO and NOx was traveled to collect corresponding measurements inside of the tunnel, and the measurements were compared with those collected from outside of the tunnel. As a result, both measurements collected by moving vehicle and collected at the measuring station corresponded to each other within the uncertainty of 8%. This indicates that the concentration from the external point 20 m distant from the tunnel can be verified as an indicator of the tunnel entrance.

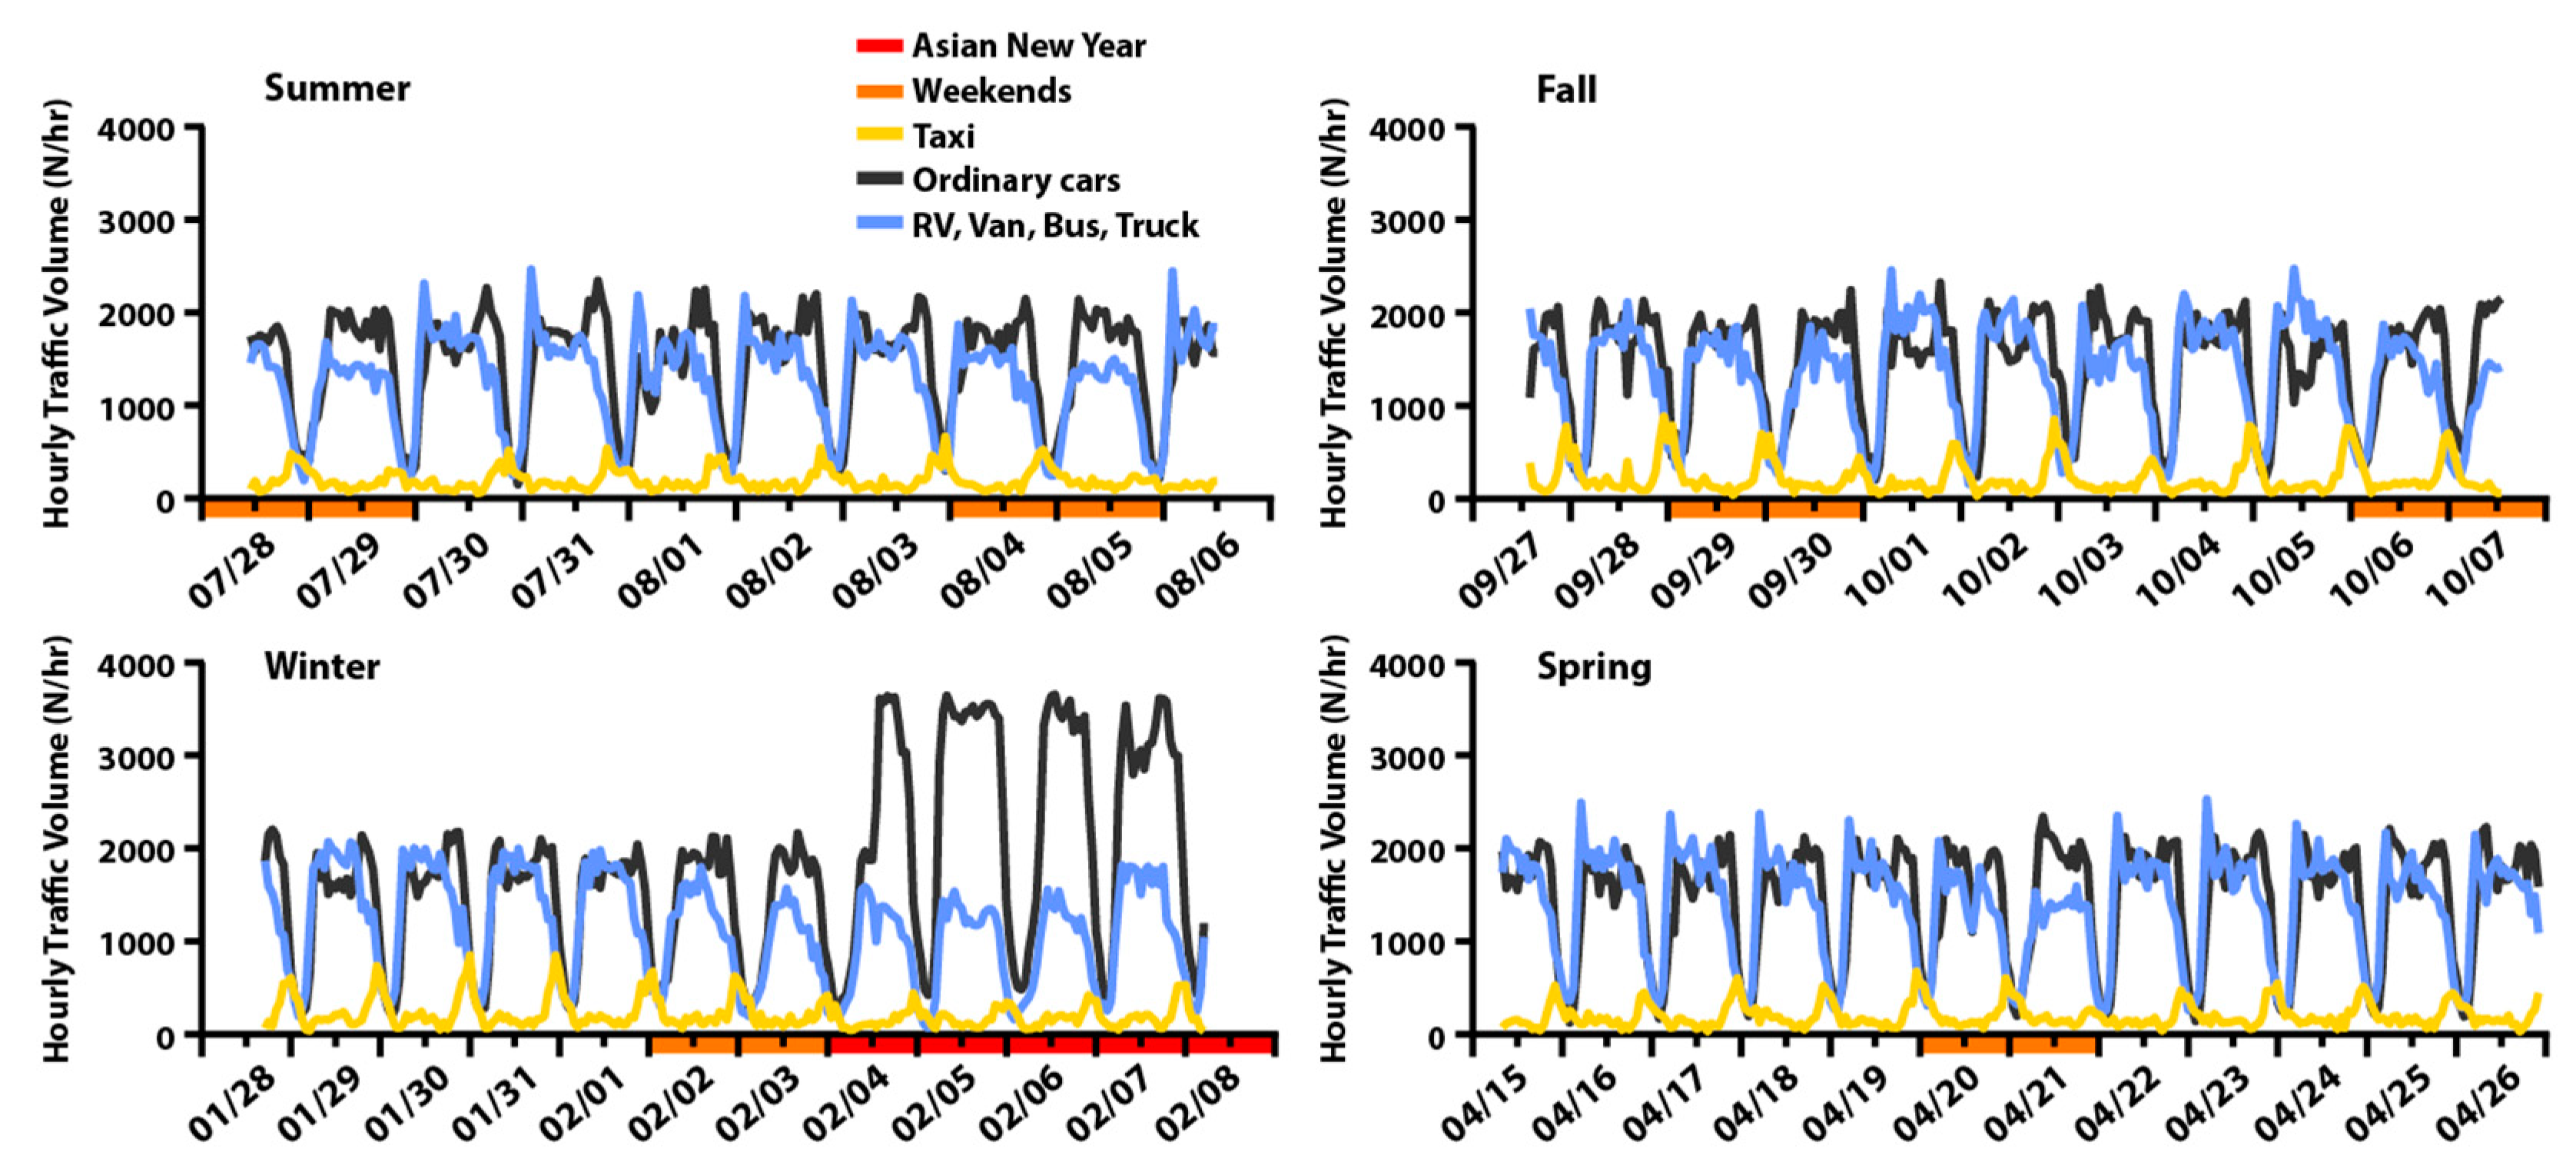
3.3. Traffic Volume Related to Types of Vehicle

During the present study, the traffic volume of each type of vehicles, obtained from approximately seven million vehicles, were analyzed by using the statistical sampling analysis (SSA). Above all, the traffic volume of each type of vehicle per hour was analyzed through video analysis. By taking the population of traffic volume comprising vehicles of each type passing through the tunnel in an hour, the cases of six minutes of traffic volume separated by an interval of 10 min were sampled by which a total of 10 cases sampled in an hour were used for the analyses of confidence interval and sampling uncertainty thereof. Results of the analyses identified the statistical reliability of 95% and 3.3% of uncertainty rate suggesting the significance thereof. In the present study, the video watch analysis was applied to 6 min in an hour by the interval of ten minutes, wherefrom the traffic volume of each type of vehicle was calculated.
The vehicles passing through the tunnel were classified into (1) ordinary cars, (2) taxi, and (3) bus/recreational vehicle (RV)/trucks, wherefrom the ordinary cars, taxi, and the bus, recreational vehicle (RV), and trucks were regarded as representing gasoline, liquefied petroleum gas (LPG), and diesel fuel, as a fuel of respective engines. The traffic volume in terms of each type of vehicles manifested no significant seasonal differences to each other, whereas it manifested hourly variations in a day, and variations in weekdays. With regard to the variation of traffic volume in weekdays, the traffic volume of ordinary cars on Sunday appeared similar to weekdays as illustrated in Figure 3, however the traffic volume of buses/RVs/trucks decreased by approximately over 25% compared (compared) to those of weekdays. In the case of the period of “Asian New Year (the Lunar Year),” the distinct variation in traffic volume appeared; the traffic volume of ordinary cars increased by approximately twice as much, whereas that of buses/RVs/trucks decreased by approximately 25%. Thus the varying particle number concentration was attributed to the differences in varied traffic volumes of ordinary cars and buses/RVs/trucks.

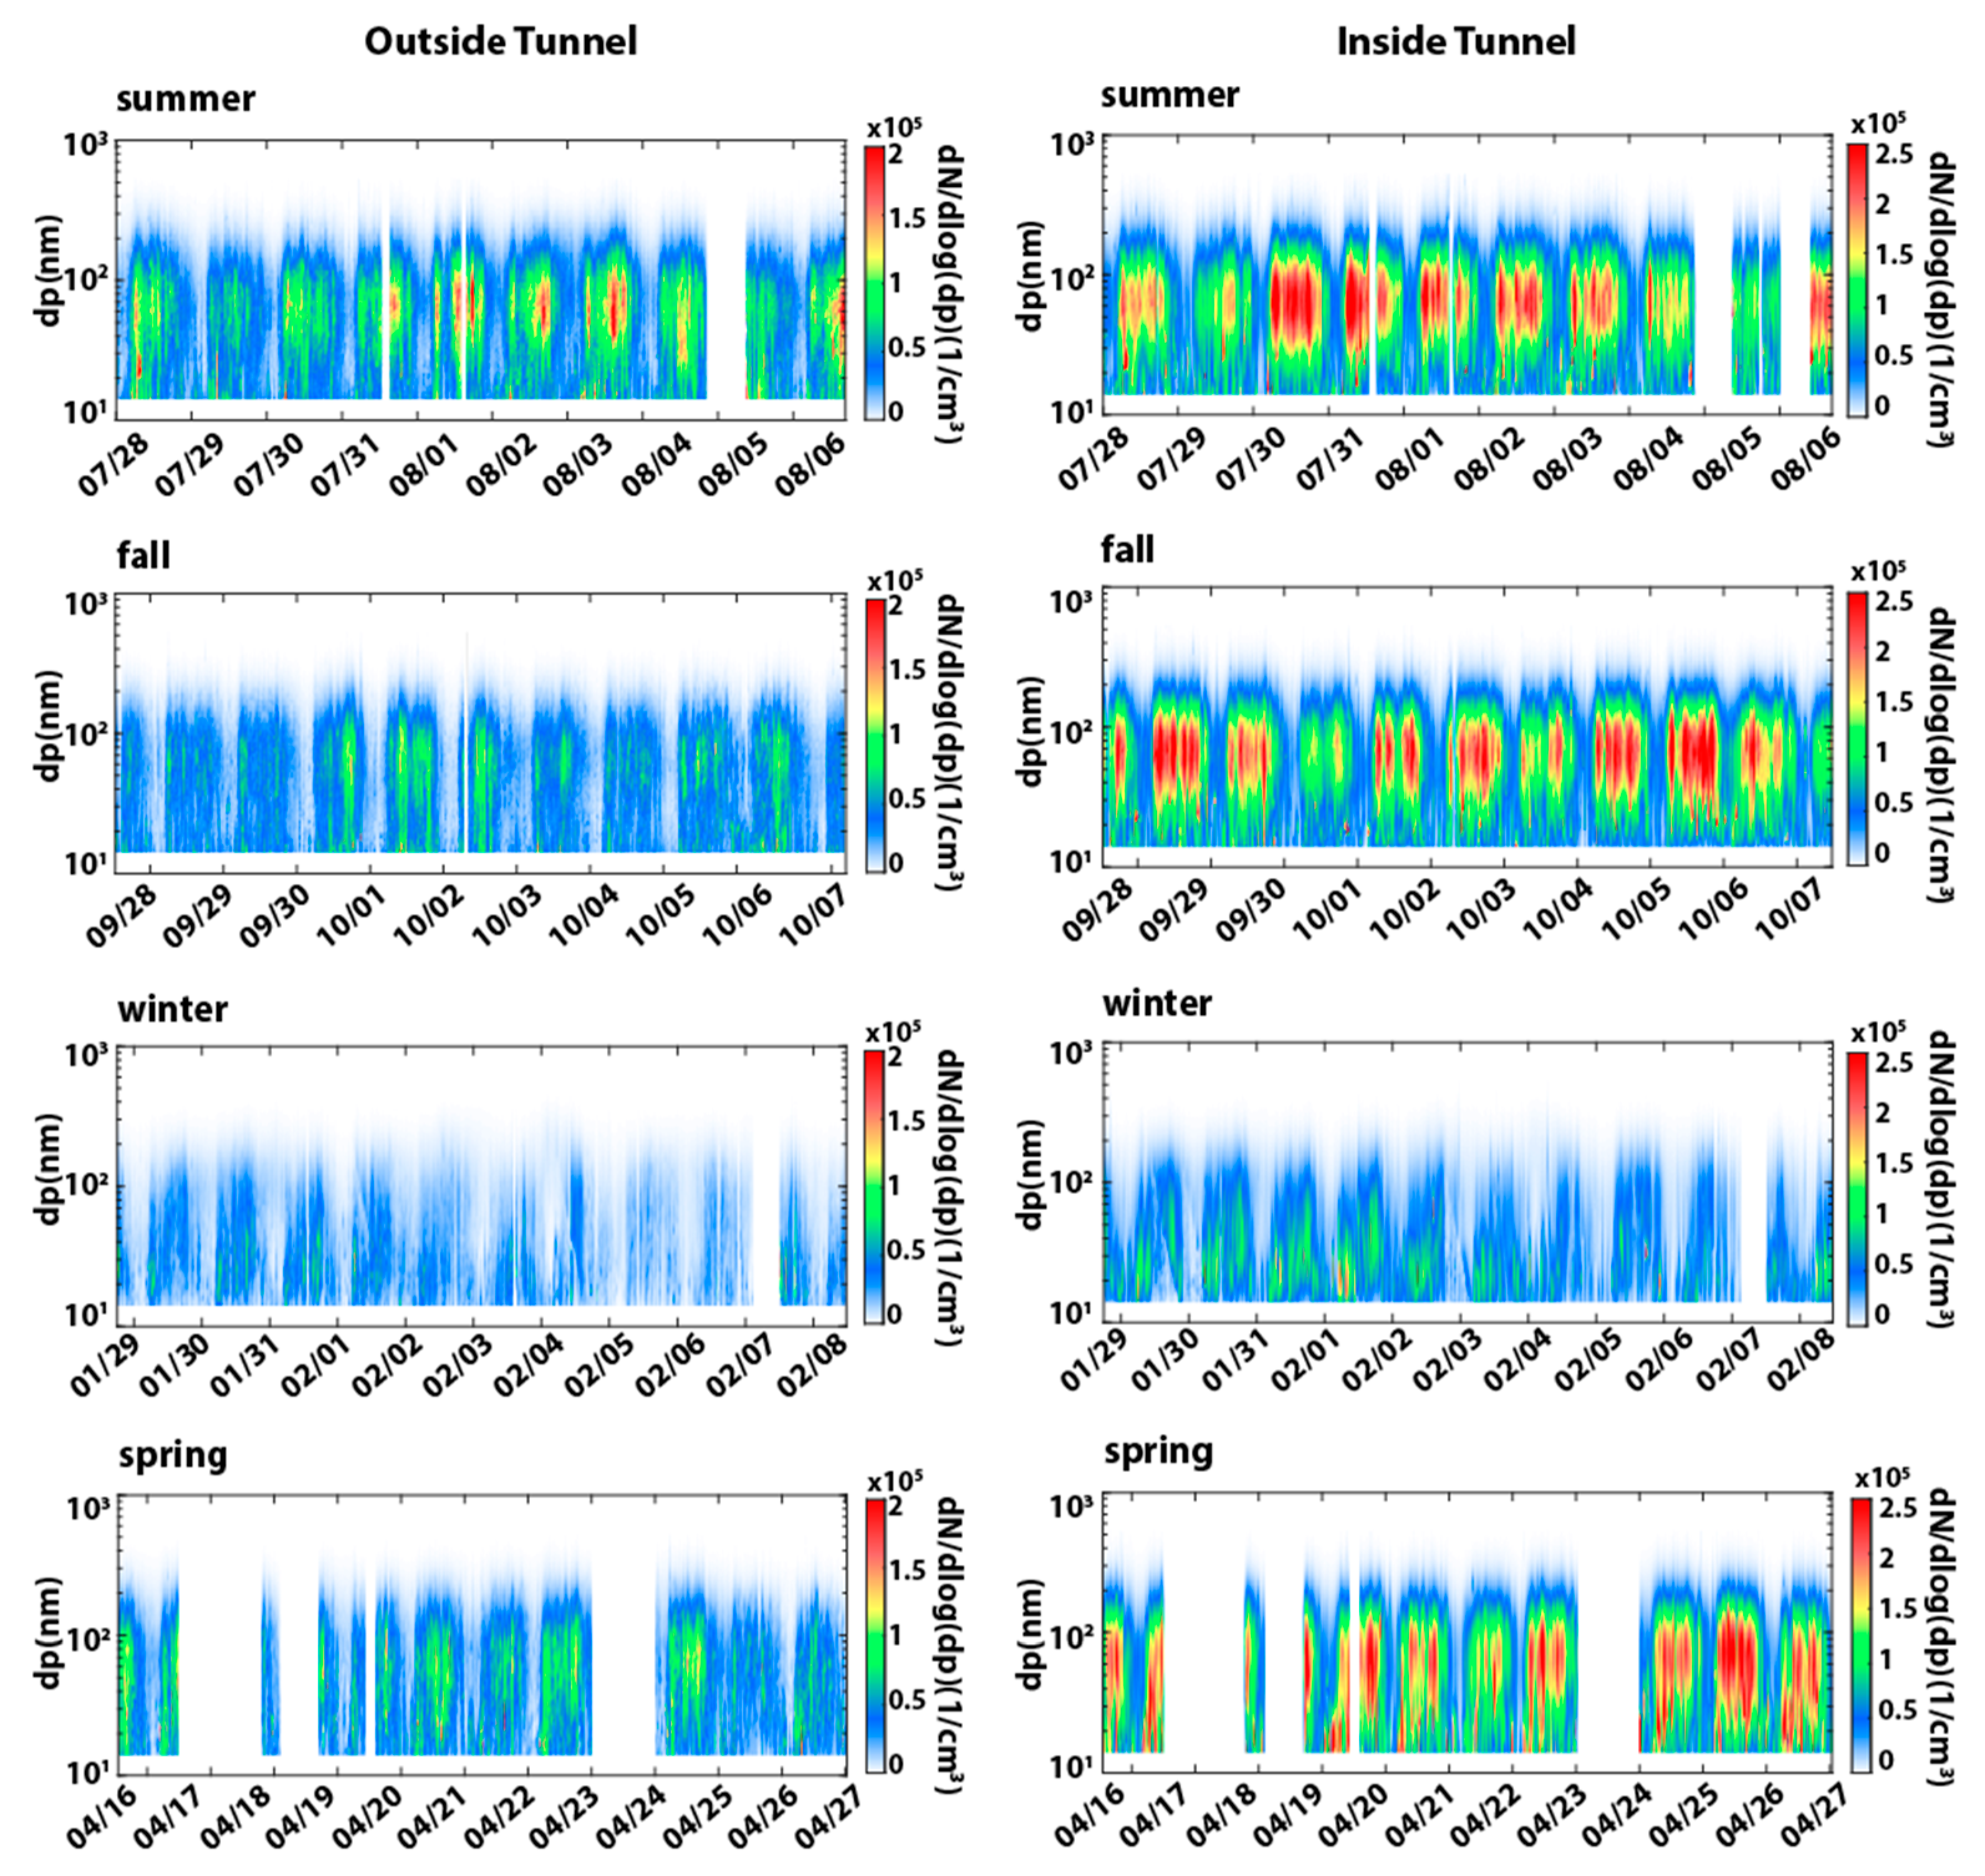
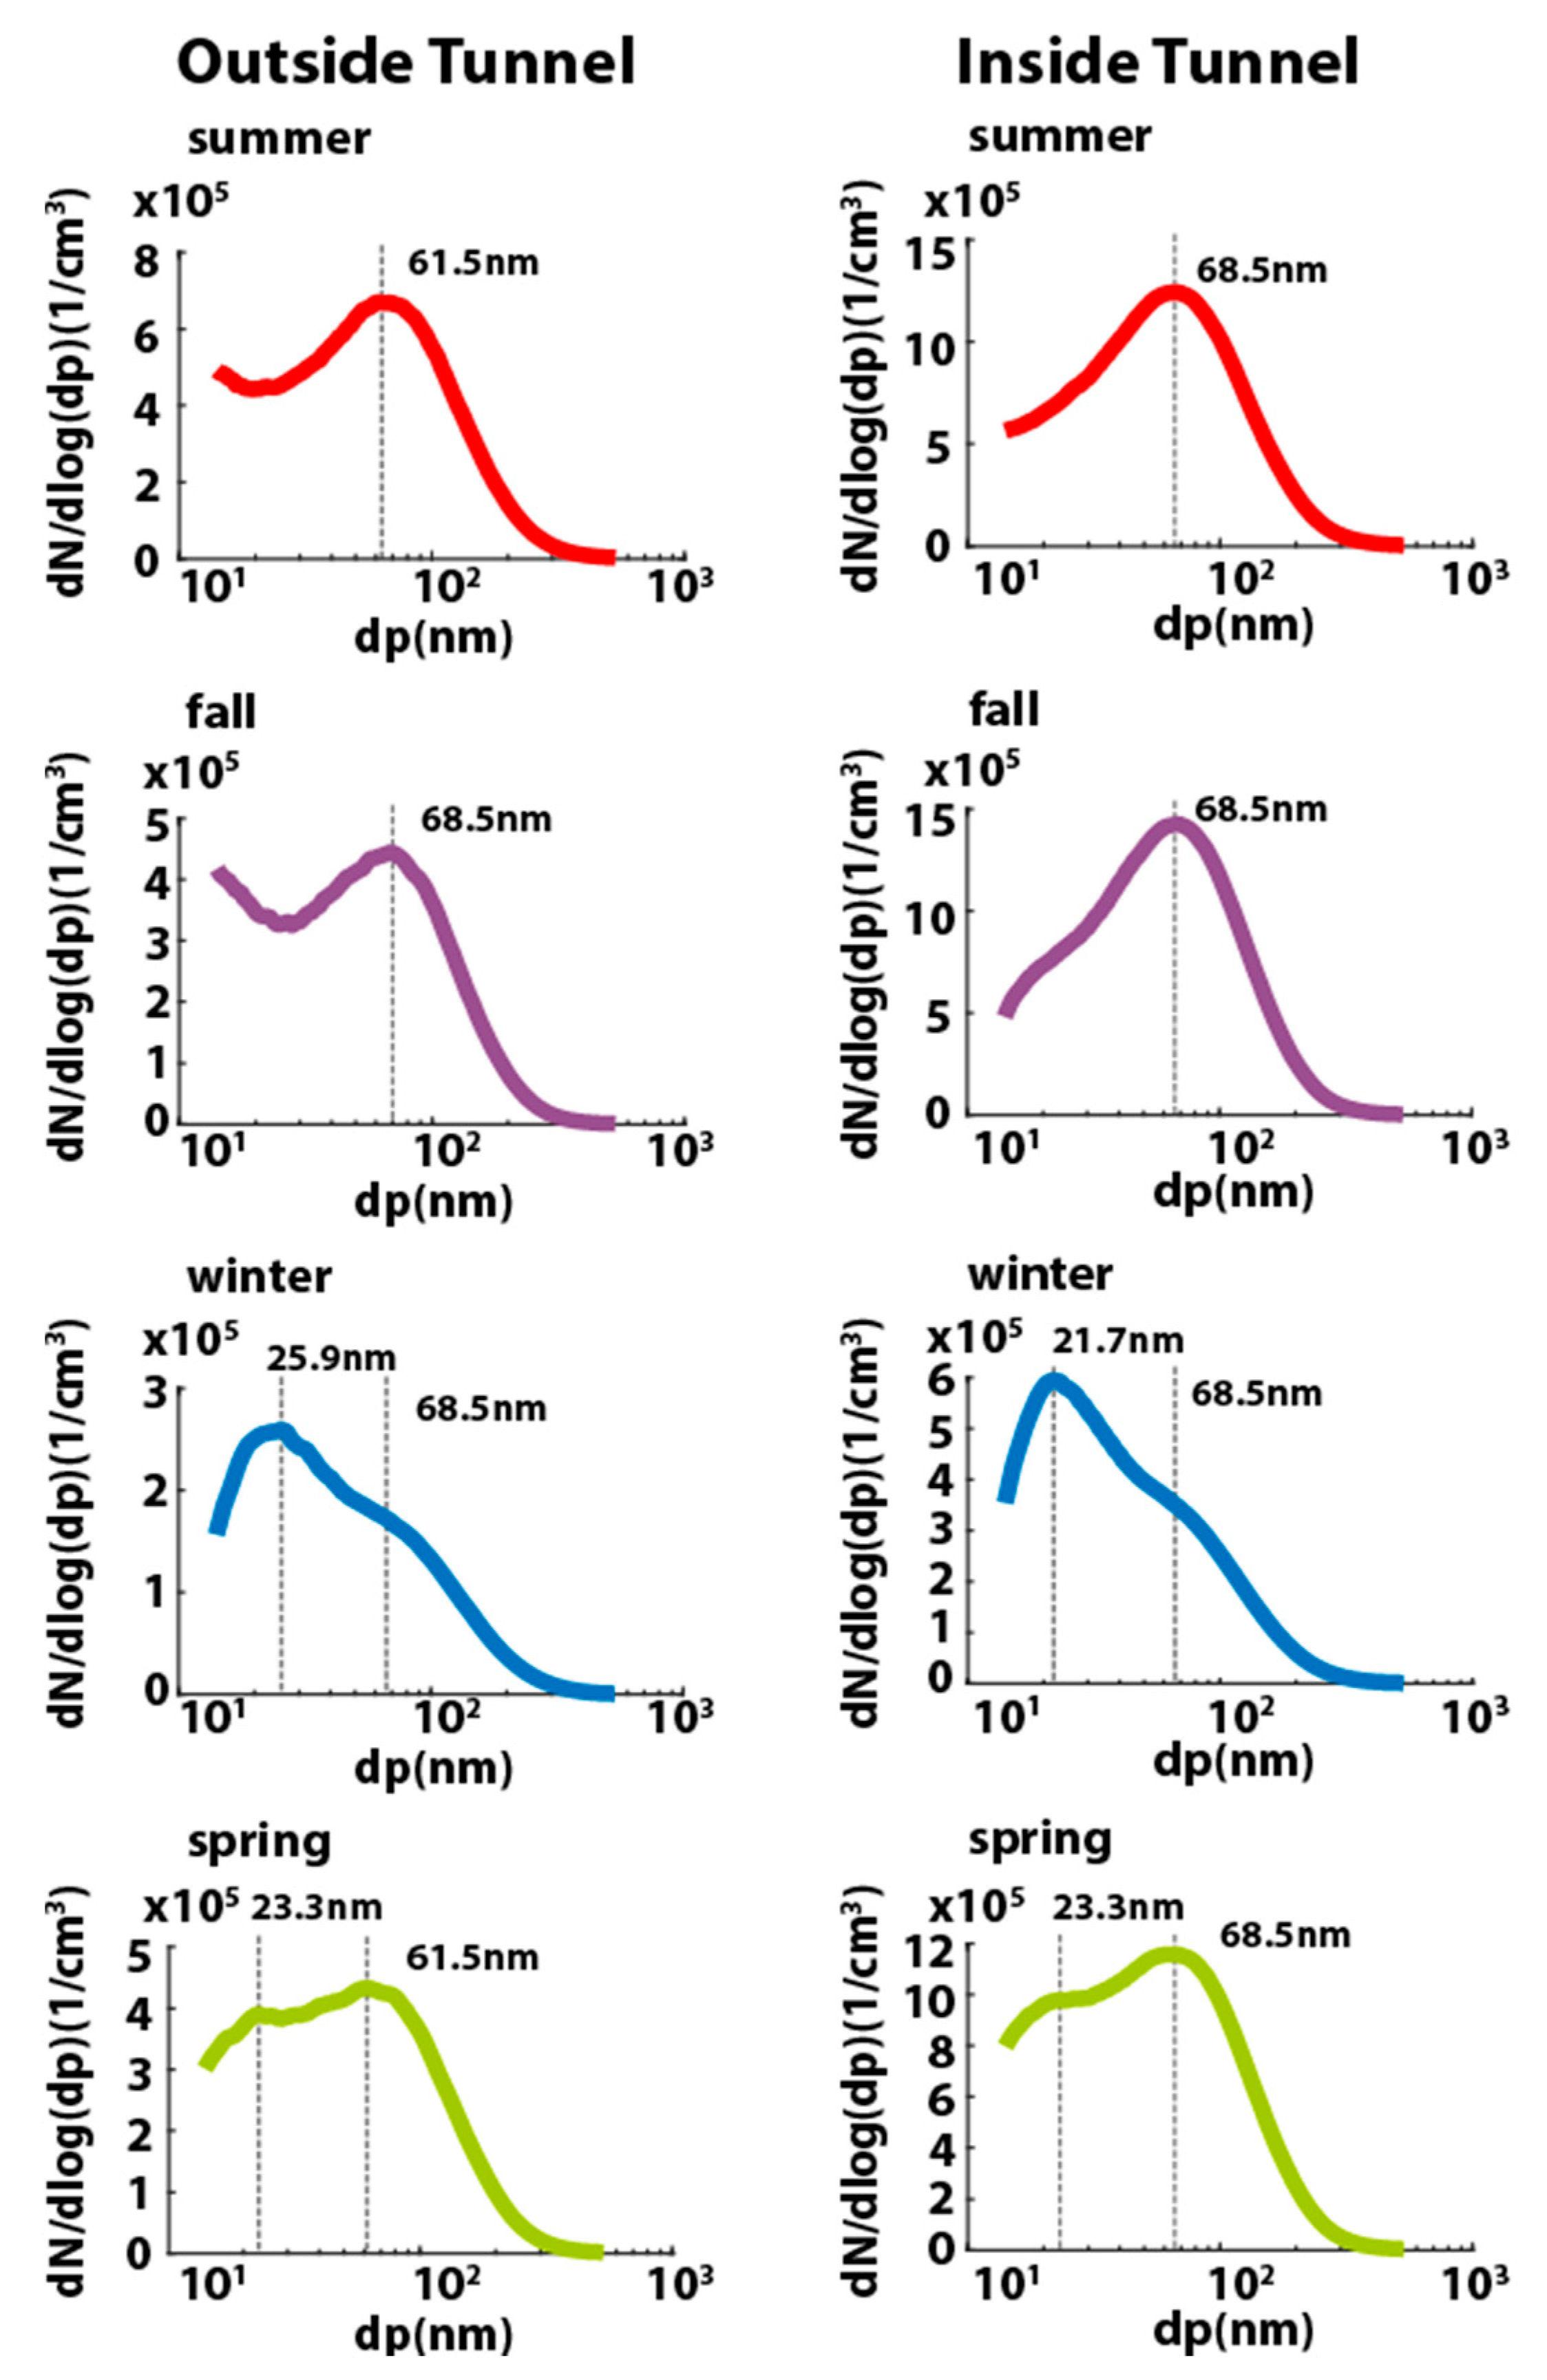
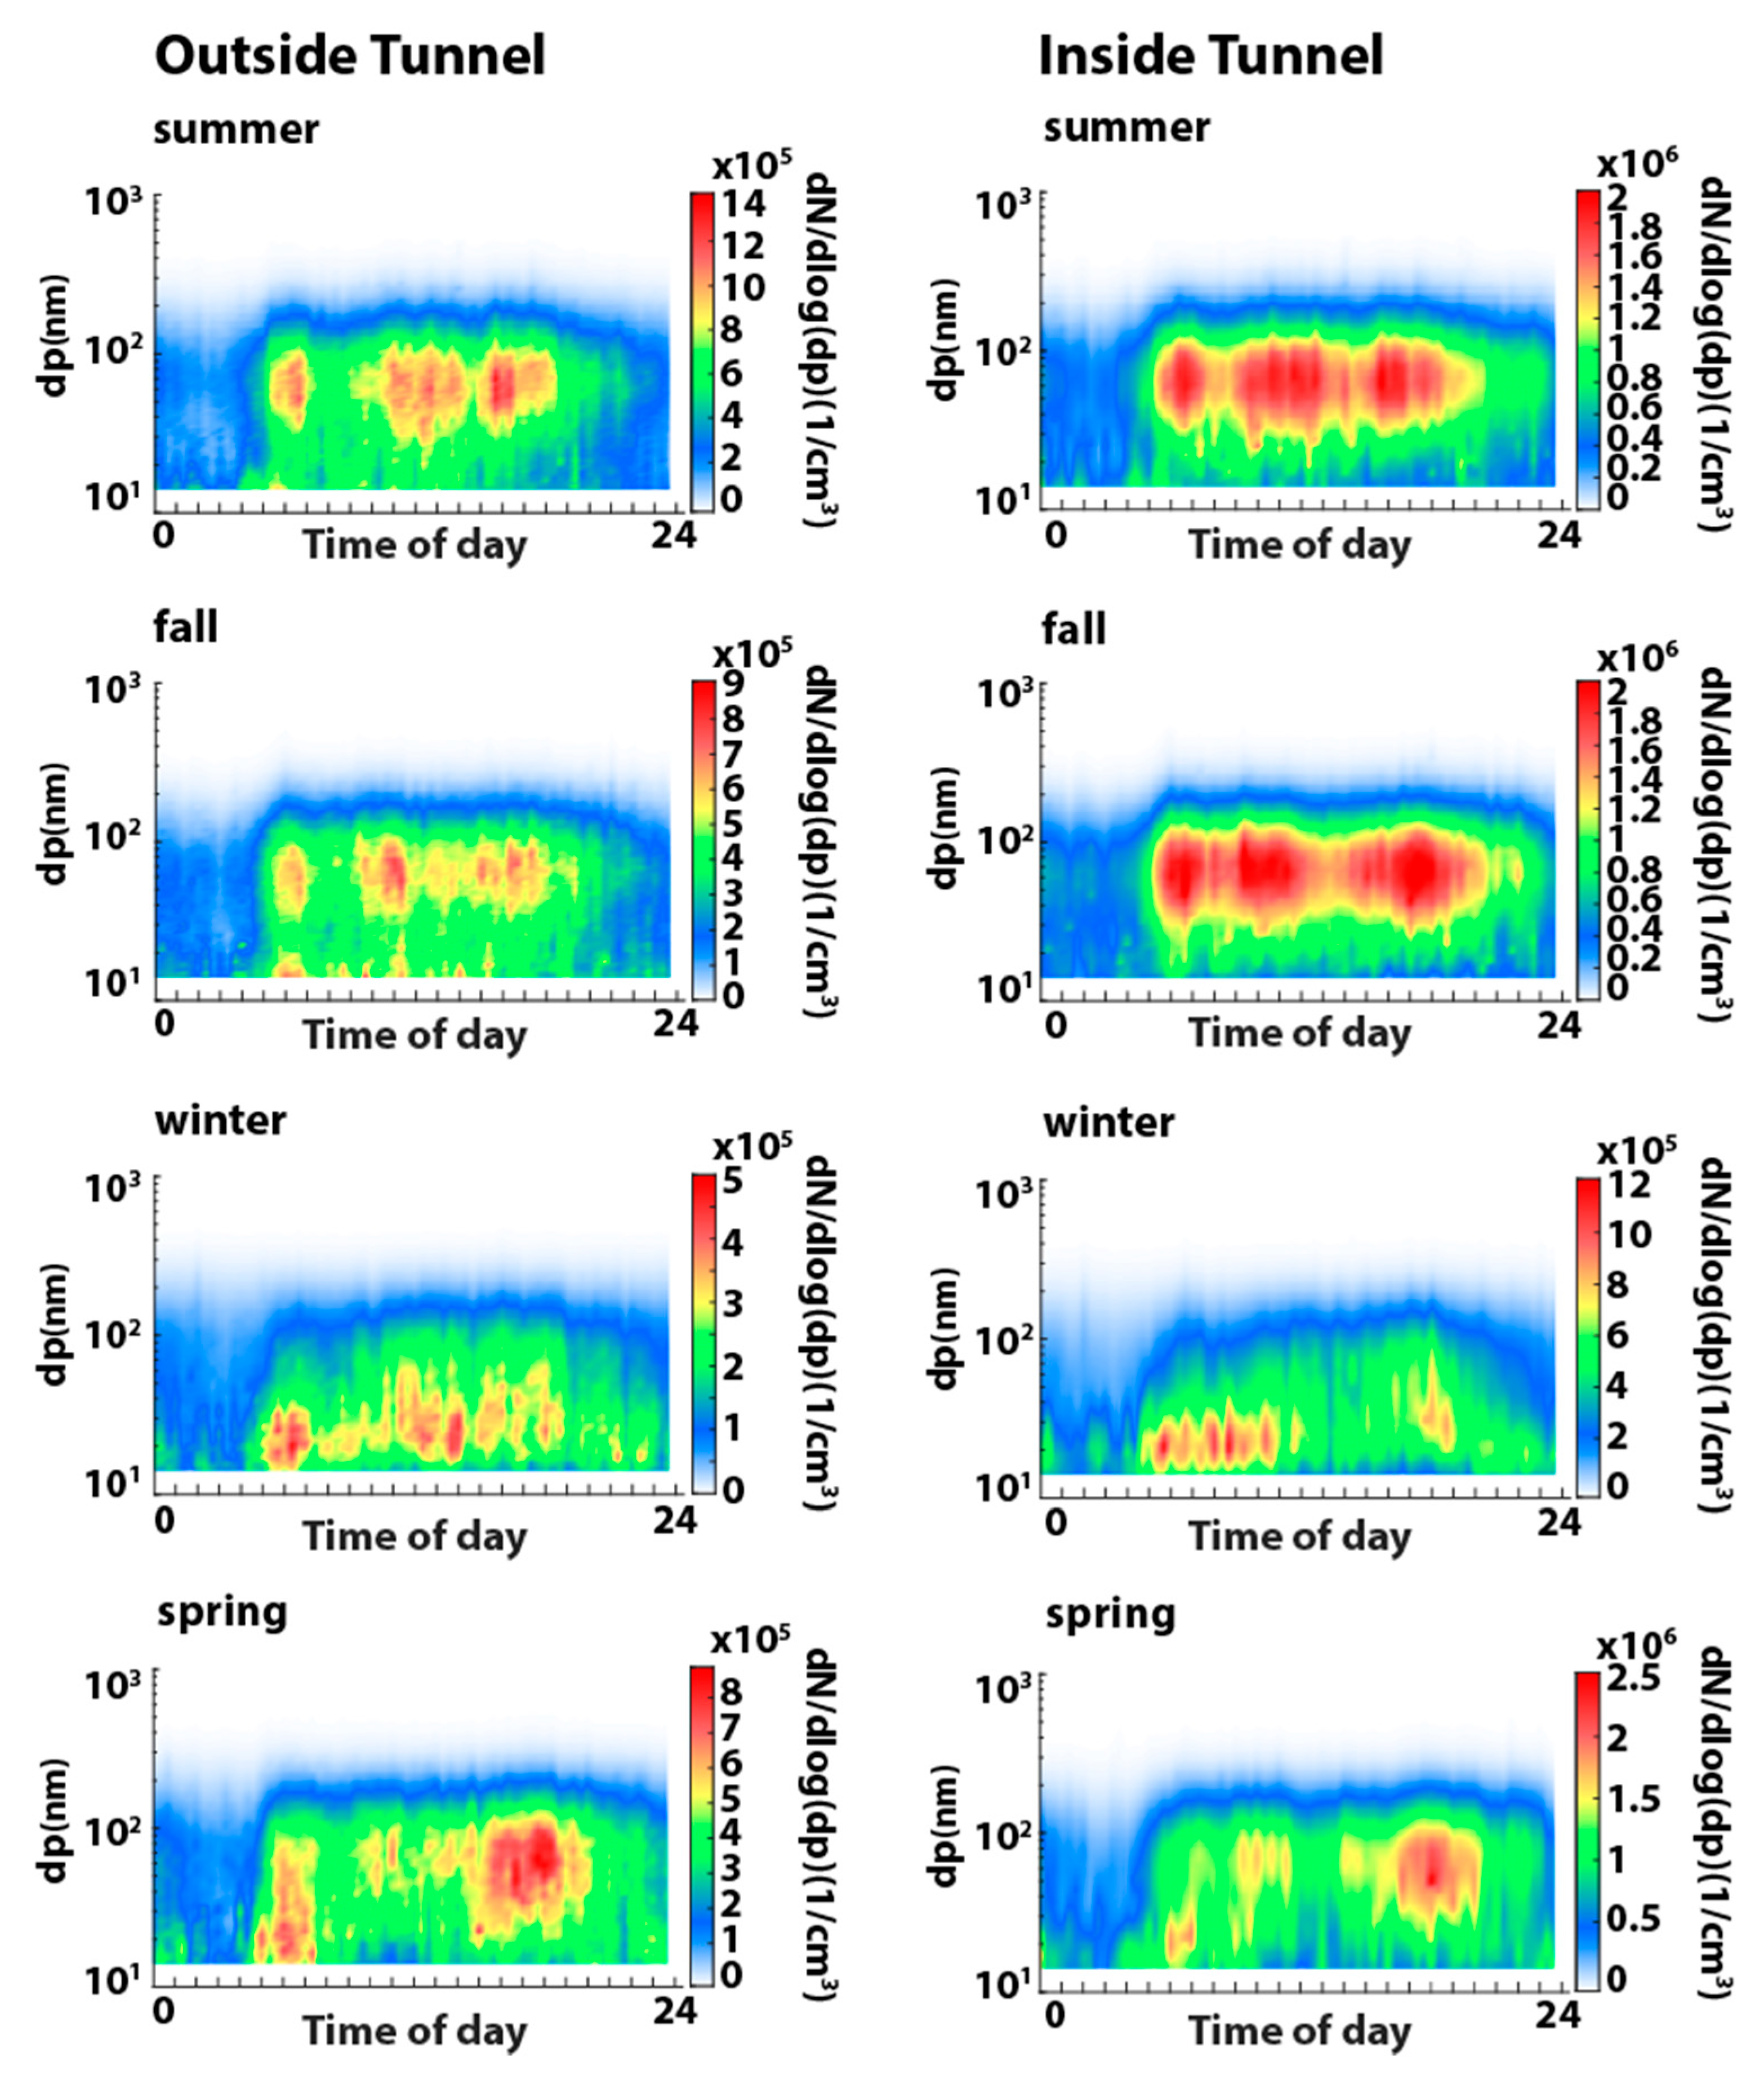
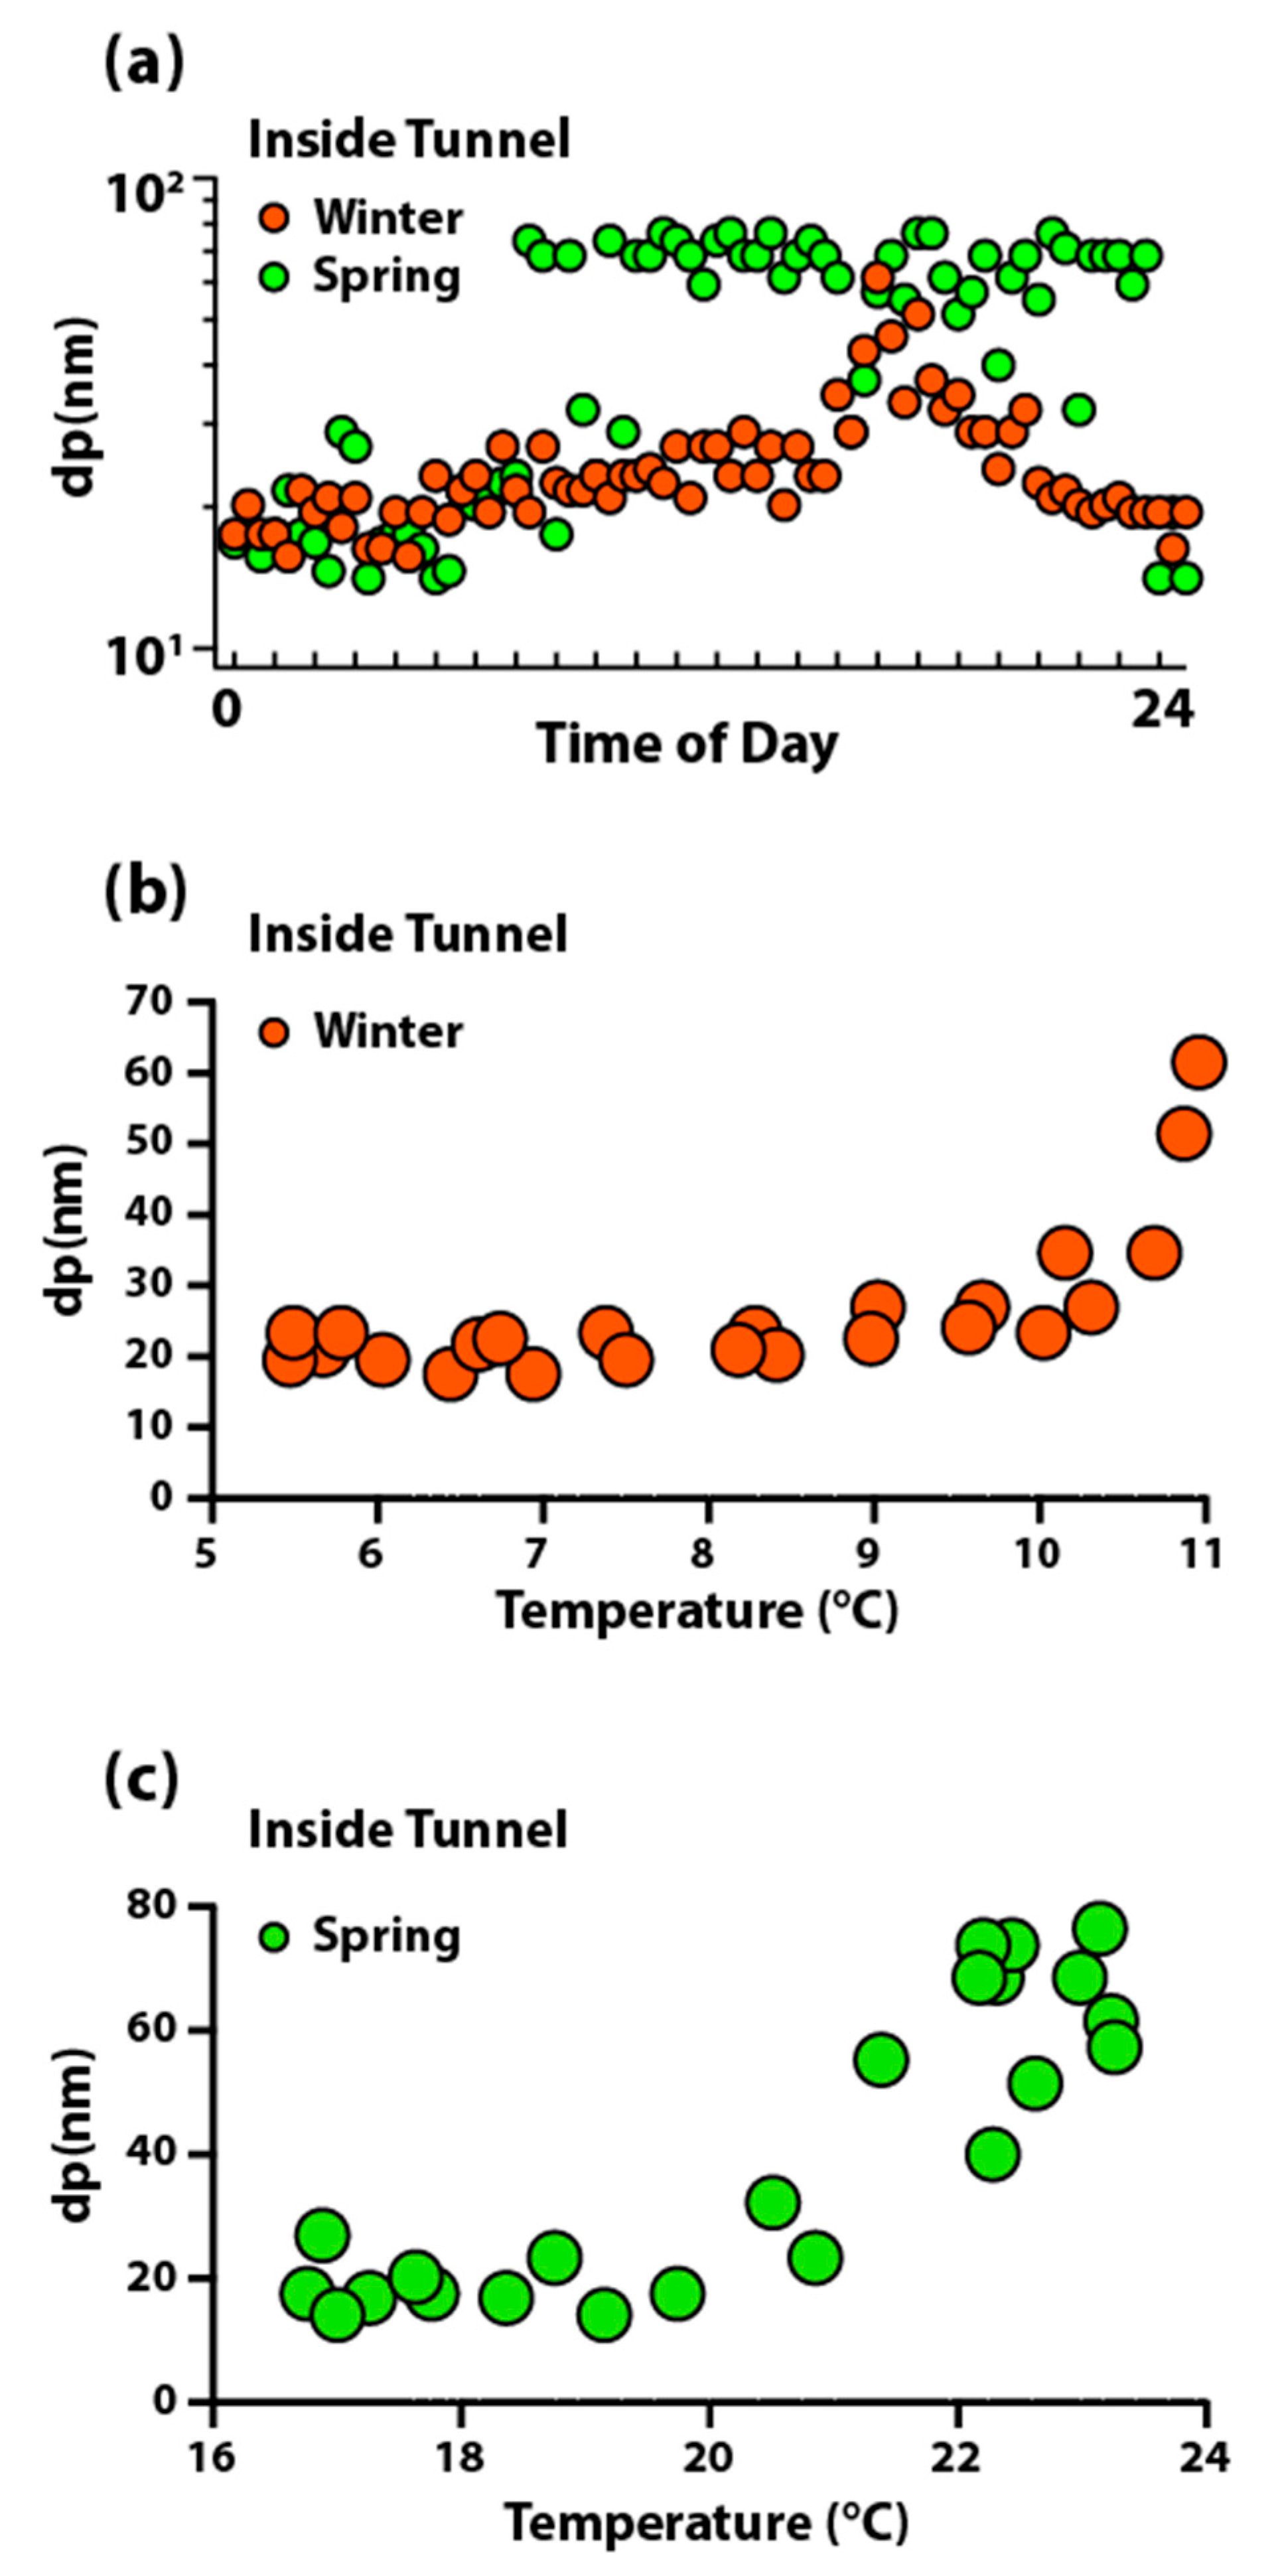
3.4. Particle Size Distribution Using SMPS

Figure 4 illustrates the seasonal variations in the particle number concentration. In the range of distribution of particle size from 14.1 nm to 532.8 nm, the number concentration in seasons in the inside of the tunnel appeared as in the following order: Spring (1.29 × 10¹¹ N/m3), Summer (1.18 × 10¹¹ N/m3), Fall (1.15 × 10¹¹ N/m3), and Winter (0.42 × 10¹¹ N/m3). Whereas in the outside of the tunnel, it appeared as in the following order: Summer (6.50 × 10¹⁰ N/m3), Spring (4.92 × 10¹⁰ N/m3), Fall (4.06 × 10¹⁰ N/m3), Winter (2.01 × 10¹⁰ N/m3). The seasonal number concentration in the inside of the tunnel appeared higher by more than twice as much as that of the outside of the tunnel. The inside of the tunnel is a semi-closed environment free from effects of external sources thereby the level of dilution of particles, discharged from vehicles, is relatively low, and is dependent upon the wind speed therein, number of traveling vehicles, and types of each vehicle. Thus, the difference in the number concentrations of particle size distribution, between the inside and outside of the tunnel, was employed for the analysis of the number concentration generated by the discharge from respective vehicles. The number concentration in the winter time, in the inside and outside of the tunnel, appeared approximately 34.9 ± 3% and 40.4 ± 10% lower, respectively, than those of spring, summer, and fall. It was concluded that it would be associated with final condensation diameter, particle number concentration, and the environment of discharge such as solar radiation, temperature, and humidity etc., [29,30]. Particle number concentration is related with the particle formation, which is dependent on the condensation nuclei; it is also dependent upon temperature and humidity in the atmospheric environment [31].
The particle size distributions of each season, obtained during the period of the present study, are presented in Figure 5. The mode of the particle number concentration in the inside and outside of the tunnel appeared in the range 61.5~68.5 nm in summer, fall, and spring, whereas it appeared with smaller value in winter distributing in the range 21.7~25.9 nm. This was attributed to the temperature and humidity in the atmosphere affecting the final condensation diameter. It was announced in results of the previously conducted studies that the growth of particulate matters is significantly associated with (1) temperature, (2) humidity, and (3) reaction time [32,33,34,35]. To analyze the daily variation in the diurnal pattern of the particle number concentration, the hourly average values thereof in a day were calculated and are presented in Figure 6. The values increased from 4 to 6 AM and remained constant until 9 PM. Thereafter, the values decreased. The number and speed of vehicles per hour were compared with the corresponding particle number concentration. The traffic volume of vehicles passing through the tunnel increased from 5 to 7 AM and then the traffic volume was kept constant to 0 AM; the variation corresponds to the variation in the particle number concentration observed each hour. The major cause of variation in the particle number concentration was attributed to the discharge of exhausts from vehicles passing through the tunnel.
Figure S2 represents the pattern of diurnal variation of the mode of number concentration of inside and outside of the tunnel employed for the analysis of effects of temperature on the final condensation diameter. The inside of the tunnel exhibited relatively constant mode of particle diameters (68.5 nm). The outside of the tunnel manifested the mode of particle diameter of 14 nm in the interval from 11 PM to 6 AM, while the mode of 68 nm appeared in the interval from 6 AM to 11 PM. Figure 7a represents the diurnal pattern of the variation of the mode of particle diameter in the inside of the tunnel in winter and spring. Figure 7b,c represents the correlation of the mode of particle diameter with temperature in winter and spring. The mode of particle diameter according to temperatures in respective seasons exhibited high correlation together with rapid changes thereof at temperature above the breakthrough point. Further, the mode of particle diameter increased rapidly to 62 nm at the level of temperature 10~11 °C, contrary to the slight increase from 20 nm to 28 nm at the level of temperature from 5 °C to 10 °C inside of the tunnel in winter. For the case of spring time, the mode of particle diameter of 10~30 nm appeared at higher level of temperature of 17~21 °C [32].
According to the previously conducted study, the condensation of particles reported that the growth of particle diameter would be limited by the formation of competitive relationship with moisture in the atmosphere [32,33,34,35]. In the present study, the temperature acted as a major cause of determination of final condensation diameter after emission, which is also dependent on diverse environmental effects comprising particle number concentration including humidity. The particles in the discharged exhausts in spring time, wherein the temperature are relatively higher than winter time, were estimated to be involved in the competitive reaction with potential moisture to reach the final condensation diameter after emission.

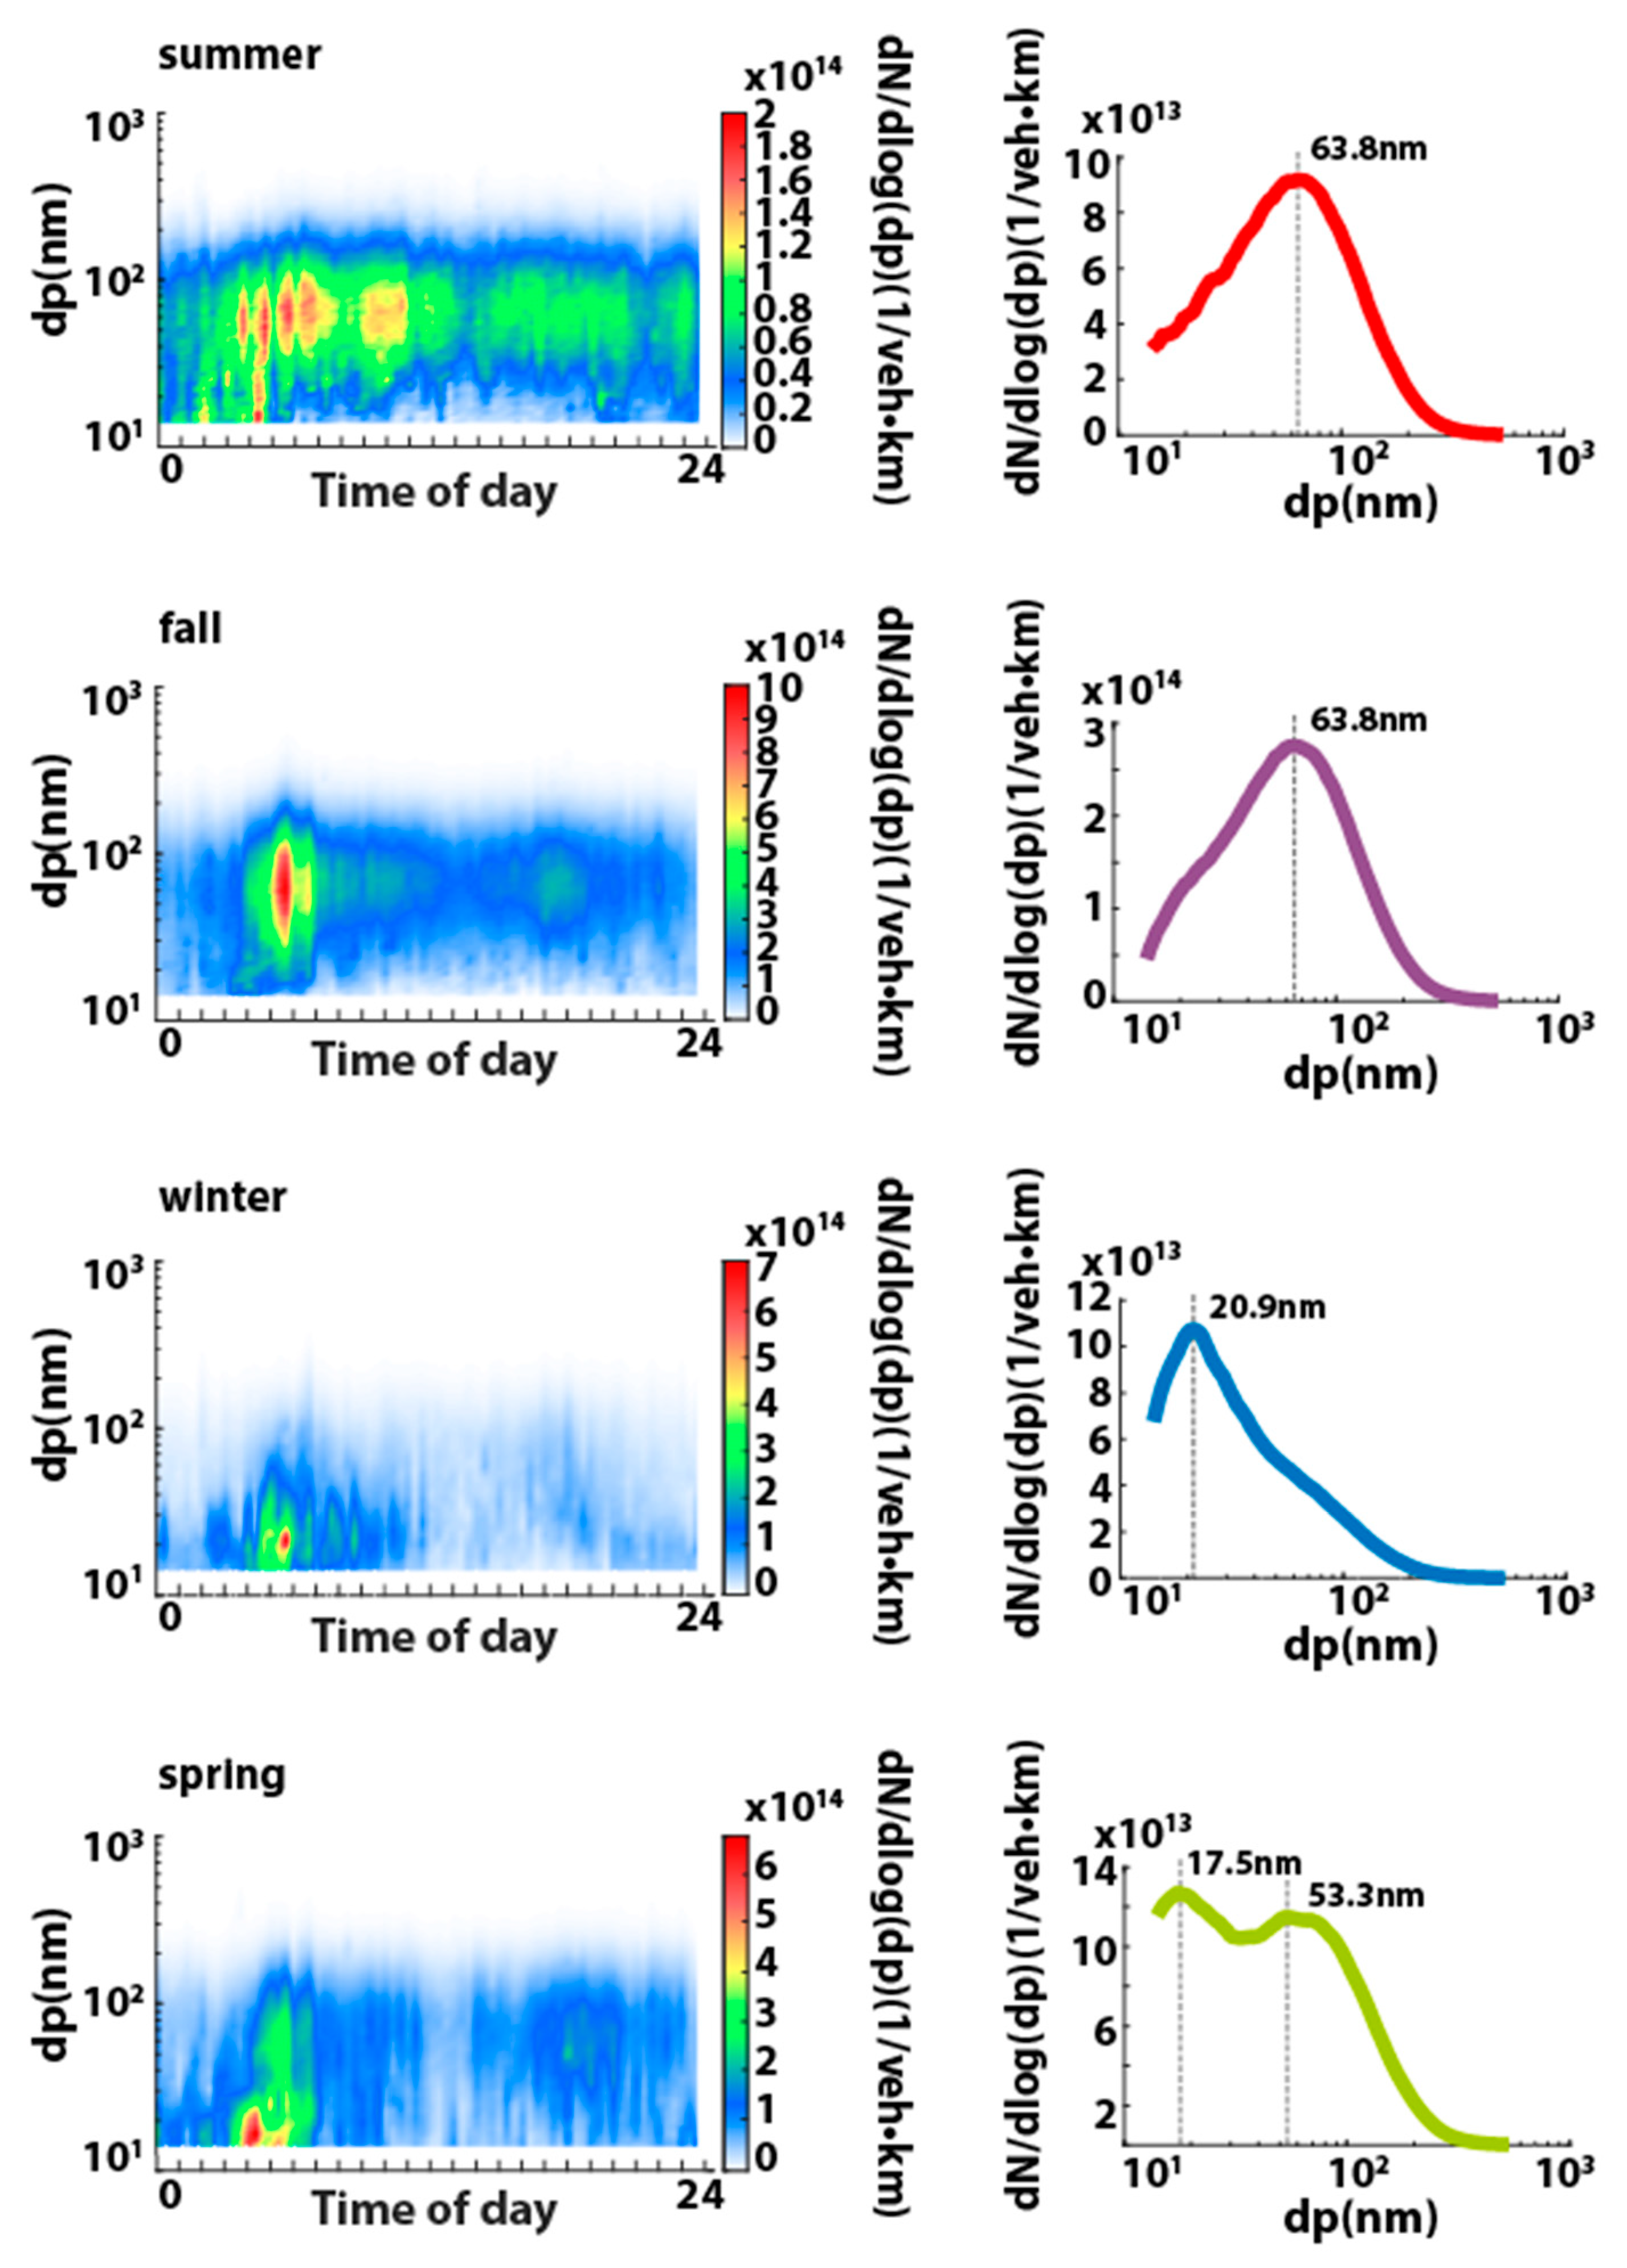
3.5. Vehicle Emission Rate

The hourly particle number concentration discharged from vehicles (ΣN/veh·km) was calculated by using the TFC (δ) (m3/veh·km) and hourly number concentrations of particle size distribution inside and outside of the tunnel (Table S2). The discharged number concentrations of particle size distribution appeared as average 5.82 × 10¹² N/veh·km of a day as shown in Table 1. The discharge of the number concentrations of particle size distribution increased in the interval from 00 to 07 AM, and decreased in the interval to 10 AM, thereafter, it exhibited comparatively constant discharge. The hourly traffic volume and corresponding traveling speed of vehicles were compared with the particle number concentration. The particle number concentration was found increasing at times of the start and close of business hours, while the hourly discharge of the particle number concentration reached its peak at the interval of time of the relatively faster speed of vehicles at daybreak.
The total amount of the particle number concentration is proportional to the traffic volume of vehicles. However, the discharge of the number concentration from a unit vehicle appeared more dependent upon the speed of vehicle than the time zone of higher flow rate of vehicles [36]. The number of particles, discharged from vehicles, was reported to be increasing in accordance with the increasing speed of vehicles. As presented in Figure 8, the seasonal particle number concentration appeared as in the following order of summer, fall, spring, and winter, wherein the great difference in seasonal value appeared in the interval from 05 to 06 AM. It was concluded that the results are reflecting the composite effects of speed of vehicles passing through the tunnel at daybreak and temperature affecting the final condensation diameter.
The number concentrations of particle size distribution, varied according to types of vehicles, are distinguished into values of weekends, weekdays, and period of Asian New Year, and presented in Figure 9 and Table S3. The traffic volume of ordinary cars and buses/RVs/trucks appeared similar to each other. However, contrary to the traffic volume of ordinary cars on Sunday appeared similar to weekdays, the traffic volume of buses/RVs/trucks in weekdays reduced by more than 25%.
In addition, contrary to the traffic volume of ordinary cars increased by more than twice as much in the period of Asian New Year, the traffic volume of buses/RVs/trucks decreased by more than 25% during weekdays. The particle number concentration discharged from a unit vehicle was 6.96 × 10¹² N/veh·km during weekdays, and the values of weekends and in the period of Asian New Year appeared as 6.08 × 10¹² N/veh·km and 4.43 × 10¹² N/veh·km, respectively; these values correspond to 70.88% of the level of value of weekdays. The overall averaged particle number concentration based on the actual seasonal road measurements shows 5.82 × 10¹² N/veh·km as shown in Table 1. The result value presents lower level of previous early studies [37,38,39,40]. The major reason can be the different measurements of chassis dynamometer and real environment analyses. The others could be different size range and improvement of exhaust control system.
The traffic volume of buses/RVs/trucks of the engines of light oil appeared closely correlated with the discharge of the particle number concentration. The discharge of the particle number concentration from approximately seven million vehicles was calculated in the present study. Based on the results of the present study, the quantitative contribution of the particle number concentration from each type of vehicle to atmospheric environment can be calculated based on the entire numbers of vehicles of each type in the urban area and traveling distances thereof.

4. Conclusions

During the period starting from July 2018 to April 2019, the measurement of exhausts from traveling vehicles was carried out in four seasons for the analysis of the particle number concentration in the exhausts using SMPS in the tunnel located in Seoul, Republic of Korea. The mode of the particle number concentration in the inside and outside of the tunnel appeared in the range 61.5~68.5 nm in summer, fall, and spring, whereas the value was small in winter distributing in the range 21.7~25.9 nm. The mode of particle diameter increased rapidly to 62 nm at a temperature 10~11 °C, contrary to the slight increase from 20 nm to 28 nm at temperature from 5 °C to 10 °C inside the tunnel in winter. The temperature acted as a major cause of determination of final condensation diameter, which is also dependent on diverse environmental effects comprising particle number concentration. The traffic volume of each type of vehicles, obtained from approximately seven million vehicles, were analyzed by using the statistical sampling analysis. The traffic volume of ordinary cars increased by more than twice as much in the period of Asian New Year, the traffic volume of buses/RVs/trucks decreased by more than 25% during weekdays. The particle number concentration discharged from a unit vehicle was 6.96 × 10¹² N/veh·km during weekdays, and the values of weekends and in the period of Asian New Year appeared as 6.08 × 10¹² N/veh·km and 4.43 × 10¹² N/veh·km, respectively. The overall averaged particle number concentration based on the actual seasonal road measurements shows 5.82 × 10¹² N/veh·km. Based on the results of the present study, the actual tunnel flow coefficient can be applied for the further investigation of seasonal chemical components from vehicle emissions. Finally, the quantitative contribution of the particle number concentration from each type of vehicle to atmospheric environment can be investigated on the entire numbers of vehicles of each type in the urban area.

Supplementary Materials

The following are available online at https://0-www-mdpi-com.brum.beds.ac.uk/2076-3417/11/2/794/s1, Figure S1: Diurnal patterns of (a) temperature, (b) wind speed, and (c) number of vehicles in season inside of the tunnel to determine the seasonal value of tunnel flow coefficient; Figure S2: Diurnal pattern of the mode of number concentration of particle size distribution inside and outside of the tunnel employed for the analysis of effects of temperature on the final condensation diameter; Table S1: Operating conditions of the two employed the Scanning Mobility Particle Sizers (SMPS); Table S2: Hourly number concentration discharged from vehicles (ΣN/veh·km) by using the TFC (δ) (m3/veh·km) and hourly number concentrations of particle size distribution inside and outside of the tunnel; Table S3: Number concentrations of particle size distribution distinguished into values of weekends, weekdays, and period of Asian New Year.

Author Contributions

Data curation, K.K.; Investigation, M.S. and G.P.; Project administration, J.L.; Resources, S.L.; Supervision, M.-S.B.; Validation, T.L.; Writing—original draft, C.P. All authors have read and agreed to the published version of the manuscript.

Funding

This work was supported by a grant from the National Institute of Environment Research (NIER), funded by the Ministry of Environment (MOE) of the Republic of Korea (NIER-2019-04-02-024) and the National Research Foundation of Korea (NRF) (NRF-2020R1I1A3054851).

Institutional Review Board Statement

Not applicable.

Informed Consent Statement

Not applicable.

Acknowledgments

We acknowledge the support provided by the Convergence Research Laboratory (established by the MNU Innovation Support Project in 2020) to conduct this research. We thank Eunyoung Kim and Yongmin Lee for Measurement of Tunnel Flow Coefficient.

Conflicts of Interest

The authors declare no conflict of interest.

References

  1. González-Castanedo, Y.; Moreno, T.; Fernández-Camacho, R.; De La Campa, A.S.; Alastuey, A.; Querol, X.; De La Rosa, J. Size distribution and chemical composition of particulate matter stack emissions in and around a copper smelter. Atmos. Environ. 2014, 98, 271–282. [Google Scholar] [CrossRef]
  2. Bae, M.-S.; Oh, J.-S. Comparison of Nano Particle Size Distributions by Different Measurement Techniques. J. Korean Soc. Atmos. Environ. 2010, 26, 219–233. [Google Scholar] [CrossRef] [Green Version]
  3. Bae, M.S.; Schwab, J.; Hogrefe, O.; Frank, B.; Lala, G.; Demerjian, K. Characteristics of size distributions at urban and rural locations in New York. Atmos. Chem. Phys. Discuss. 2010, 10. [Google Scholar] [CrossRef]
  4. Gentner, D.R.; Isaacman, G.; Worton, D.R.; Chan, A.W.H.; Dallmann, T.R.; Davis, L.; Liu, S.; Day, D.A.; Russell, L.M.; Wilson, K.R.; et al. Elucidating secondary organic aerosol from diesel and gasoline vehicles through detailed characterization of organic carbon emissions. Proc. Natl. Acad. Sci. USA 2012, 109, 18318–18323. [Google Scholar] [CrossRef] [PubMed] [Green Version]
  5. Wang, Y.; Zhuang, G.; Zhang, X.; Huang, K.; Xu, C.; Tang, A.; Chen, J.; An, Z. The ion chemistry, seasonal cycle, and sources of PM2.5 and TSP aerosol in Shanghai. Atmos. Environ. 2006, 40, 2935–2952. [Google Scholar] [CrossRef]
  6. Swietlicki, E.; Krejci, R. Source characterisation of the Central European atmospheric aerosol using multivariate statistical methods. Nucl. Instrum. Methods Phys. Res. Sect. B Beam Interact. Mater. Atoms 1996, 109, 519–525. [Google Scholar] [CrossRef]
  7. Zauli-Sajani, S.; Marchesi, S.; Trentini, A.; Bacco, D.; Zigola, C.; Rovelli, S.; Ricciardelli, I.; Maccone, C.; Lauriola, P.; Cavallo, D.M.; et al. Vertical variation of PM2.5 mass and chemical composition, particle size distribution, NO2, and BTEX at a high rise building. Environ. Pollut. 2018, 235, 339–349. [Google Scholar] [CrossRef]
  8. Sarangi, B.; Aggarwal, S.G.; Kunwar, B.; Kumar, S.; Kaur, R.; Sinha, D.; Tiwari, S.; Kawamura, K. Nighttime particle growth observed during spring in New Delhi: Evidences for the aqueous phase oxidation of SO2. Atmos. Environ. 2018, 188, 82–96. [Google Scholar] [CrossRef]
  9. Plaza, J.; Pujadas, M.; Gómez-Moreno, F.; Sánchez, M.; Artíñano, B. Mass size distributions of soluble sulfate, nitrate and ammonium in the Madrid urban aerosol. Atmos. Environ. 2011, 45, 4966–4976. [Google Scholar] [CrossRef]
  10. Bhattu, D.; Tripathi, S.; Chakraborty, A. Deriving aerosol hygroscopic mixing state from size-resolved CCN activity and HR-ToF-AMS measurements. Atmos. Environ. 2016, 142, 57–70. [Google Scholar] [CrossRef]
  11. Xu, J.; Li, M.; Shi, G.; Wang, H.; Ma, X.; Wu, J.; Shi, X.; Feng, Y. Mass spectra features of biomass burning boiler and coal burning boiler emitted particles by single particle aerosol mass spectrometer. Sci. Total. Environ. 2017, 598, 341–352. [Google Scholar] [CrossRef] [PubMed]
  12. Wang, S.; He, B.; Yuan, M.; Su, F.; Yin, S.; Yan, Q.; Jiang, N.; Zhang, R.; Tang, X. Characterization of individual particles and meteorological conditions during the cold season in Zhengzhou using a single particle aerosol mass spectrometer. Atmos. Res. 2019, 219, 13–23. [Google Scholar] [CrossRef]
  13. Bae, M.-S.; Schwab, J.J.; Zhang, Q.; Hogrefe, O.; Demerjian, K.L.; Weimer, S.; Rhoads, K.; Orsini, D.; Venkatachari, P.; Hopke, P.K. Interference of organic signals in highly time resolved nitrate measurements by low mass resolution aerosol mass spectrometry. J. Geophys. Res. Space Phys. 2007, 112. [Google Scholar] [CrossRef] [Green Version]
  14. Morawska, L.; Thomas, S.; Gilbert, D.; Greenaway, C.; Rijnders, E. A study of the horizontal and vertical profile of submicrometer particles in relation to a busy road. Atmos. Environ. 1999, 33, 1261–1274. [Google Scholar] [CrossRef]
  15. Morawska, L.; Thomas, S.; Bofinger, N.; Wainwright, D.; Neale, D. Comprehensive characterization of aerosols in a subtropical urban atmosphere. Atmos. Environ. 1998, 32, 2467–2478. [Google Scholar] [CrossRef] [Green Version]
  16. Wang, W.; Wu, F.-Y.; Huang, M.; Kang, Y.; Cheung, K.C.; Wong, M.H. Size fraction effect on phthalate esters accumulation, bioaccessibility and in vitro cytotoxicity of indoor/outdoor dust, and risk assessment of human exposure. J. Hazard. Mater. 2013, 261, 753–762. [Google Scholar] [CrossRef]
  17. Liu, R.; He, R.; Cui, X.; Ma, L.Q. Impact of particle size on distribution, bioaccessibility, and cytotoxicity of polycyclic aromatic hydrocarbons in indoor dust. J. Hazard. Mater. 2018, 357, 341–347. [Google Scholar] [CrossRef]
  18. Donaldson, K.; Tran, L.; Jimenez, L.A.; Duffin, R.; Newby, D.E.; Mills, N.L.; MacNee, W.; Stone, V. Combustion-derived nanoparticles: A review of their toxicology following inhalation exposure. Part. Fibre Toxicol. 2005, 2, 10. [Google Scholar] [CrossRef] [Green Version]
  19. Louis, C.; Liu, Y.; Martinet, S.; D’Anna, B.; Valiente, A.M.; Boreave, A.; R’Mili, B.; Tassel, P.; Perret, P.; André, M. Dilution effects on ultrafine particle emissions from Euro 5 and Euro 6 diesel and gasoline vehicles. Atmos. Environ. 2017, 169, 80–88. [Google Scholar] [CrossRef] [Green Version]
  20. Giechaskiel, B.; Chirico, R.; Decarlo, P.F.; Clairotte, M.; Adam, T.; Martini, G.; Heringa, M.; Richter, R.; Prevot, A.; Baltensperger, U.; et al. Evaluation of the particle measurement programme (PMP) protocol to remove the vehicles’ exhaust aerosol volatile phase. Sci. Total. Environ. 2010, 408, 5106–5116. [Google Scholar] [CrossRef]
  21. Kittelson, D.B. Engines and nanoparticles. J. Aerosol Sci. 1998, 29, 575–588. [Google Scholar] [CrossRef]
  22. Vreeland, H.; Weber, R.J.; Bergin, M.; Greenwald, R.; Golan, R.; Russell, A.G.; Verma, V.; A Sarnat, J. Oxidative potential of PM 2.5 during Atlanta rush hour: Measurements of in-vehicle dithiothreitol (DTT) activity. Atmos. Environ. 2017, 165, 169–178. [Google Scholar] [CrossRef]
  23. Pathak, S.K.; Sood, V.; Singh, Y.; Channiwala, S. Real world vehicle emissions: Their correlation with driving parameters. Transp. Res. Part D Transp. Environ. 2016, 44, 157–176. [Google Scholar] [CrossRef]
  24. Mariam, J.M.; Khandare, P.; Koli, A.; Khan, A.; Sapra, B. Influence of sheath air humidity on measurement of particle size distribution by scanning mobility particle sizer. J. Aerosol Sci. 2017, 111, 18–25. [Google Scholar] [CrossRef]
  25. Lee, H.; Chen, S.-C.; Kim, C.; Westenburg, E.; Moon, S.I.; Pui, D.Y. Evaluation of concentration measurement techniques of colloidal nanoparticles for microfiltration and ultrafiltration applications: Inductively coupled plasma-mass spectrometry, nanoparticle tracking analysis and electrospray-scanning mobility particle sizer. Sep. Purif. Technol. 2017, 184, 34–42. [Google Scholar] [CrossRef] [Green Version]
  26. Chang, Y.; Zou, Z.; Deng, C.; Huang, K.; Collett, J.L.; Lin, J.; Zhuang, G. The importance of vehicle emissions as a source of atmospheric ammonia in the megacity of Shanghai. Atmos. Chem. Phys. Discuss. 2016, 16, 3577–3594. [Google Scholar] [CrossRef] [Green Version]
  27. Kim, E.; Chung, T.; Seo, S.; Jung, S.; Kim, S.; Lee, S.; Kim, J.; Lee, J.; Lee, Y.; Song, M.; et al. Determination of Tunnel Flow Coefficient for Car Emission Rate. J. Korean Soc. Atmos. Environ. 2020, 36, 139–148. [Google Scholar] [CrossRef]
  28. Pierson, W.R.; Gertler, A.W.; Robinson, N.F.; Sagebiel, J.C.; Zielinska, B.; Bishop, G.A.; Stedman, D.H.; Zweidinger, R.B.; Ray, W.D. Real-world automotive emissions—Summary of studies in the Fort McHenry and Tuscarora mountain tunnels. Atmos. Environ. 1996, 30, 2233–2256. [Google Scholar] [CrossRef]
  29. Pirjola, L.; Paasonen, P.; Pfeiffer, D.U.; Hussein, T.; Hameri, K.; Koskentalo, T.; Virtanen, A.; Ronkko, T.; Keskinen, J.; A Pakkanen, T. Dispersion of particles and trace gases nearby a city highway: Mobile laboratory measurements in Finland. Atmos. Environ. 2006, 40, 867–879. [Google Scholar] [CrossRef]
  30. Stanier, C.O.; Khlystov, A.Y.; Pandis, S.N. Ambient aerosol size distributions and number concentrations measured during the Pittsburgh Air Quality Study (PAQS). Atmos. Environ. 2004, 38, 3275–3284. [Google Scholar] [CrossRef]
  31. Gómez-Moreno, F.; Pujadas, M.; Plaza, J.; Rodríguez-Maroto, J.; Martínez-Lozano, P.; Artíñano, B. Influence of seasonal factors on the atmospheric particle number concentration and size distribution in Madrid. Atmos. Environ. 2011, 45, 3169–3180. [Google Scholar] [CrossRef]
  32. Fan, F.; Zhang, S.; Wang, W.; Yan, J.; Su, M. Numerical investigation of PM2.5 size enlargement by heterogeneous condensation for particulate abatement. Process. Saf. Environ. Prot. 2019, 125, 197–206. [Google Scholar] [CrossRef]
  33. Sowden, M.; Blake, D.; Cohen, D.; Atanacio, A.; Mueller, U. Development of an infrared pollution index to identify ground-level compositional, particle size, and humidity changes using Himawari-8. Atmos. Environ. 2020, 229, 117435. [Google Scholar] [CrossRef]
  34. Font, A.; Baker, T.; Mudway, I.S.; Purdie, E.; Dunster, C.; Fuller, G.W. Degradation in urban air quality from construction activity and increased traffic arising from a road widening scheme. Sci. Total. Environ. 2014, 497, 123–132. [Google Scholar] [CrossRef] [PubMed] [Green Version]
  35. Kumar, P.; Morawska, L.; Birmili, W.; Paasonen, P.; Hu, M.; Kulmala, M.; Harrison, R.M.; Norford, L.K.; Britter, R. Ultrafine particles in cities. Environ. Int. 2014, 66, 1–10. [Google Scholar] [CrossRef] [PubMed] [Green Version]
  36. Kim, W.-G.; Kim, C.-K.; Lee, J.-T.; Kim, J.-S.; Yun, C.-W.; Yook, S.-J. Fine particle emission characteristics of a light-duty diesel vehicle according to vehicle acceleration and road grade. Transp. Res. Part D Transp. Environ. 2017, 53, 428–439. [Google Scholar] [CrossRef]
  37. Abu-Allaban, M.; Coulomb, W.; Gertler, A.W.; Gillies, J.; Pierson, W.R.; Rogers, C.F.; Sagebiel, J.C.; Tarnay, L. Exhaust Particle Size Distribution Measurements at the Tuscarora Mountain Tunnel. Aerosol Sci. Technol. 2002, 36, 771–789. [Google Scholar] [CrossRef]
  38. Morawska, L.; Jamriska, M.; Thomas, S.; Ferreira, L.; Mengersen, K.; Wraith, D.; McGregor, F. Quantification of Particle Number Emission Factors for Motor Vehicles from On-Road Measurements. Environ. Sci. Technol. 2005, 39, 9130–9139. [Google Scholar] [CrossRef]
  39. Jones, A.M.; Harrison, R.M. Estimation of the emission factors of particle number and mass fractions from traffic at a site where mean vehicle speeds vary over short distances. Atmos. Environ. 2006, 40, 7125–7137. [Google Scholar] [CrossRef]
  40. Beddows, D.; Harrison, R.M. Comparison of average particle number emission factors for heavy and light duty vehicles derived from rolling chassis dynamometer and field studies. Atmos. Environ. 2008, 42, 7954–7966. [Google Scholar] [CrossRef]
Figure 1. Diagram of H Tunnel located in Seoul, Republic of Korea.
Applsci 11 00794 g001
Figure 2. (a) Concentration of CO and NOx at 2.3 m from the tunnel entrance and the 20 m from the tunnel exit as the sampling point at same time, (b) concentration of CO and NOx by the moving vehicle.
Applsci 11 00794 g002
Figure 3. Traffic volume related to types of vehicles in each season [27].
Applsci 11 00794 g003
Figure 4. Evolution of seasonal particle size distribution in the inside- and outside of the tunnel estimated by using SMPS.
Applsci 11 00794 g004
Figure 5. Overall averaged seasonal particle size distribution in the inside and outside of the tunnel estimated by using SMPS.
Applsci 11 00794 g005
Figure 6. Diurnal patterns of seasonal particle size distribution in the inside- and outside of the tunnel estimated by using SMPS.
Applsci 11 00794 g006
Figure 7. (a) Diurnal patterns of particle mode in the tunnel in winter and spring seasons and scatter plots between particle mode and tunnel temperature in (b) winter and (c) spring.
Applsci 11 00794 g007
Figure 8. Time of daily evolution and overall average of vehicle emission rate of particle size distributions in each season.
Applsci 11 00794 g008
Figure 9. Diurnal patterns of vehicle emission rate for weekdays, weekends, and in period of Asian New Year.
Applsci 11 00794 g009
Table 1. Vehicle emission rate of particle number concentration.
ReferenceType of VehicleEmission Factor
(N/veh·km)
Abu-Allaban et al. (2002) [36]mixture 1.57 × 10¹⁴
Morawska et al. (2005) [37]diesel4.61 × 1014
Jones and Harrison (2006) [38]heavy-duty diesel6.36 × 1014
light-duty1.22 × 1013
Beddows and Harrison (2008) [39]heavy-duty diesel70.6 × 1013
light-duty6.31 × 1013
This studymixture 5.82 × 10¹²
minimum (14:00)(3.24 × 10¹²)
maximum (6:00)(1.44 × 10¹³)
Publisher’s Note: MDPI stays neutral with regard to jurisdictional claims in published maps and institutional affiliations.

