
Thermal Hydrolysis of Sewage Sludge: A Case Study of a WWTP in Burgos, Spain


1
Department of Electrical, Systems and Automatic Engineering, University of León, Campus de Vegazana, 24071 León, Spain
2
Chemical and Environmental Bioprocess Engineering Group, Natural Resources Institute (IRENA), University of Leon, Av. de Portugal 41, 24009 Leon, Spain
*
Author to whom correspondence should be addressed.
Appl. Sci. 2021, 11(3), 964; https://0-doi-org.brum.beds.ac.uk/10.3390/app11030964
Submission received: 21 December 2020
/
Revised: 15 January 2021
/
Accepted: 18 January 2021
/
Published: 21 January 2021
(This article belongs to the Special Issue Intensified Conversion of Organic Waste into Biogas)
Abstract
:An evaluation of the energy and economic performance of thermal hydrolysis technologies is carried out on a theoretical basis. The wastewater treatment plant (WWTP) of Burgos (Spain) was the base scenario of this evaluation. Energy and mass balances were established considering the registered data of primary and secondary thickened sludge in the WWTP for 2011 to 2016. These balances were analysed considering five different scenarios, taking as Scenario 1, the plant operating with conventional mesophilic digestion. The scenarios considered commercially available technologies. The best results were obtained when hydrolysis was applied to digested sludge and sludge from the Solidstream® process. These two scenarios showed the best performance regarding volatile solid removal and lower demand for live steam, achieving a higher amount of biogas available for valorisation using combined heat and power (CHP) units. The main advantage of the hydrolysis process is the decrease in the volume of digesters and the amount of dewatered sludge needing final disposal. The Solidstream® process allowed a 35% increase in biogas available for engines and a 23% increase in electricity production.
1. Introduction
Mesophilic anaerobic digestion is considered the most widely applied technology for the treatment of organic wastes, and it is an essential component of modern wastewater treatment plants (WWTPs). Digestion is considered a useful process for generating renewable energy and provides a means to alleviate problems associated with low access to energy [1]. This technology transforms sewage sludge into biogas and reduces the total amount of biosolids needing final disposal.
Another important benefit of this process relies on the destruction of most pathogens present in sludge and the stabilisation of organic matter [2]. The stabilisation of sludge by anaerobic digestion significantly reduces transport costs thanks to the decrease in sludge volume, which positively impacts greenhouse gas emissions. Some other environmental benefits worth mentioning include odour reduction, nutrient recycling and soil conservation if land disposal is selected as the final management option [3].
There exist several treatments for improving the partial degradation of organics to facilitate the hydrolysis stage. The conventional thermal hydrolysis process (THP) has been widely used in WWTP to enhance digestion performance, resulting in higher methane yields thanks to the disruption of microbial cell walls. THP consists of heating the sludge to high temperatures, generally in the range of 140 to 180 °C, with a treatment time span of about 30 to 60 min, applying high pressure (between 6 and 11 bars). There are more than 82 full-scale, THP-operating WWTPs [4]. During the thermal degradation of sludge, proteins are partially degraded, giving rise to the production of ammonia (NH4+) and, thus, reaching high concentrations of this compound in the pretreated sludge and the digestate [5]. The higher volatile solid (VS) content of sludge fed into the digestion system and the higher degradation rate attained cause a further increase in the ammonia content (total ammonia nitrogen and free ammonia nitrogen) of the reactor liqueur [6]. Digesters treating thermal-hydrolysed sludge can reach values in the range of 2400 to 3500 mg N-NH4+/L [7,8]. The increase in the temperature of sludge during thermal pretreatment guarantees that biosolids obtained will be free of pathogens, with a stabilisation degree of about 60% (measured as COD conversion into biogas) [9].
Table 1 shows the results reported by different authors regarding the enhancement obtained when thermal pretreatment is applied to sewage sludge. About 40% more biogas can be obtained with half the residence time in the reactor when compared with conventional digestion [10]. The addition of chemical compounds aids in the removal of organic matter and sludge solubilisation. At laboratory-scale, several studies have reported on different ways for performing hydrolysis. However, on a commercial scale, this process is usually performed by the addition of direct live steam injection.
In THP, thermal energy is typically provided by direct injection of saturated steam until it reaches the desired temperature and pressure. Afterwards, sludge is submitted to a sudden decrease in pressure (expansion), thus reducing its temperature, although some configurations use standard heat exchangers for decreasing temperature to operating digestion conditions [14]. The application of THP at low temperatures (between 60–90 °C) has also been reported in the literature. Ruffino and coworkers [15] indicated that biogas production was not significantly increased unless alkaline conditions were also established during the pretreatment assay. Thus, the addition of chemical substances (alkaline or acid solutions) has been reported to effectively enhance the thermal hydrolysis of waste activated sludge (WAS) [13].
On the contrary, when the severity of treatment is increased over a certain range, as it would be by increasing the temperature above 190 °C or increasing treatment time, Maillard reactions may occur, which cause the formation of toxic materials [16,17]. Soluble recalcitrant compounds associated with these reactions are produced from the polymerisation of carbonyl groups from the reducing sugars with amino acids [18,19]. These dark coloured compounds can compromise the stability of downstream biological processes and water discharge limits. The presence of these compounds was studied by Svennevik et al. [20], who reported that a small increase in water effluent COD concentration may be associated with the presence of recalcitrant substances derived from THP.
Table 2 presents a list of technologies that are commercially available. Some of these processes operate under batch mode; recent developments allow operation under continuous conditions.
The intermediate thermal hydrolysis process (ITHP) consists of a THP unit installed between two digestion stages. The first reactor treats thickened sludge, which, after digestion, is subsequently submitted to thermal hydrolysis and then sent to a second digestion stage. Greater production of biogas is thus expected, thanks to the higher rate of volatile solid removal (VSR) attained [9]. The advantage of ITHP over THP is that the easily biodegradable components of the substrate are firstly converted into biogas during the first digestion stage, thus greatly reducing the volume of sludge to be submitted to hydrolysis and treating only recalcitrant compounds by ITHP. This saves on capital investment costs [28,29] since much smaller hydrolysis reactors and boilers are needed [30]. A Cambi ITHP pilot plant was installed in Basingstoke (United Kingdom) [31]. Veolia (ExelysTM) has four plants of ITHP technology in operation (in this case, known as digestion lysis digestion (DLD)) in France (Marquette-lez-Lille and Bonneuil-en-France), one in Slovenia (Ljubljana) and another one in Denmark (Billund) [32].
Cambi Solidstream® is a completely different technology based on the hydrolysis of digested sludge, but unlike ITHP, the hydrolysed sludge is sent to a barometric egg to maintain the temperature and pressure of sludge until dewatering. The dewatered sludge is then cooled down with air using a heat exchanger and sent to a scrubber to eliminate odours [33]. Centrates from the centrifugal dewatering pumps are sent back to digesters because of their high content in chemical oxygen demand (COD) [34], recovering a significant amount of biogas. The soluble chemical oxygen demand (SCOD) originates from the disintegration of sludge (e.g., extracellular polymeric substances (EPS)). The consumption of polyelectrolytes in dewatering is practically zero due to the high operating temperature. A Cambi Solidstream® demonstration plant was installed in Amperverband (Germany), and its operation started in 2016 [35,36].
In this study, different thermal hydrolysis technologies are analysed using data from the WWTP of Burgos as the base scenario when operating with conventional mesophilic anaerobic digestion. The novelty of this case evaluation is the analysis of the expected performance of a WWTP using the electricity obtained from the different processes instead of just digestion improvement as the main comparison parameter. This study considers the additional energy demand associated with the introduction of a whole set of new equipment that is necessary for the implementation of THP in an operating WWTP. The novelty of this study also focuses on evaluating the overall efficiency of the process in addition to biogas enhancement.
2. Materials and Methods
2.1. Description of the Burgos WWTP
The WWTP collects domestic wastewater from the surrounding area through the general and industrial collectors. After treatment, the wastewater is returned to the Arlanzón river once the discharge parameters are within the stipulated values. The treatment capacity is 118,000 m3/d, which serves a total of 833,000 equivalent inhabitants (e.i.). There are two treatment lines called General and Villalonquéjar collectors, which are completely independent, having two well-differentiated discharge points.
The plant is composed of the following treatment stages: (1) pretreatment, which is intended for the removal of bigger-sized objects, small particles, sand and grease (using prefilter wells, screeners, sieves, grit and oil removal traps), (2) primary treatment, where the removal of settable and floating matter is carried out using primary decanters, and (3) secondary treatment for the removal of dissolved and colloidal organic matter by microbial degradation and subsequent settlement of biomass material, which is purged as excess sludge, a fraction of which is recycled back to the aerobic basins.
The primary sludge from primary decanters has an independent treatment line for each collector, with each having its own gravity thickener, summing up to two units for the whole treatment plant. By contrast, the treatment line for WAS has two common air flotation thickeners. The sludge treatment lines are composed of thickening, digestion, conditioning and dewatering sections.
The digestion section has three digesters equipped with nine sludge recirculation pumps with a flow of 75 m3/h each. Conditioning is performed using three polyelectrolyte dosing compact plants with a throughout flow capacity of 3200 L/h each. The dewatering section has three centrifugal pumps with a flow capacity of 35 m3/h each, providing 30% solid content as the maximum dewatering value. Dewatered sludge is transported to the drying area and then to a composting plant adjacent to the WWTP.
The biogas line contains all elements associated with gasometers for biogas storage and engines. There are three rotary vane biogas compressors for digester mixing, with a flow capacity of 448 m3/h each (measured at standard temperature and pressure conditions), six sludge recirculation exchangers (power of 400 kW/each, two units per digester), one common torch of 2000 m3/h, three gasometers with a capacity of 703 m3/each and four biogas engines.
2.2. Description of Scenarios
Five different scenarios were analysed based on electric power generation from biogas, self-consumption of electricity, production of dewatered sludge and polyelectrolyte consumption. Scenario 1 is the reference plant, consisting of conventional mesophilic digestion. Scenarios 2 to 5 evaluate the operation of the thermal hydrolysis reactors.
Scenario 2 evaluates the WWTP operating with a conventional batch THP (THP-B6.2 Cambi batch cycle), treating primary and secondary sludge. Scenario 3 evaluates hydrolysis exclusively applied to secondary sludge. Scenario 4 studies the performance of the ITHP unit, whereas Scenario 5 analyses the Solidstream® process. Figure 1 shows a schematic representation of the five scenarios. The hydrolysis process requires the installation of a post-thickening centrifuge pump before introducing the sludge into hydrolysis reactors. All scenarios included a final dewatering unit for water removal for digested sludge.
Dewatering centrifuges produce centrates with high organic content that need this liquid stream for further treatment. Centrates from digested sludge are sent back to the WWTP headline in the case of Scenario 1, where they are treated by nitrification–denitrification via nitrate in the biological reactors. In the case of Scenarios 2, 3 and 4, the centrates are sent to the nitrification–denitrification (via nitrite) section of the plant. In the case of the Solidstream® process, the centrates are sent back to the digestion section. This process also requires a barometric egg to control the pressure and temperature of hydrolysed sludge, a heat exchanger and an air scrubber for cooling down the sludge stream, and the treatment of the gaseous stream to remove offensive odours.
2.3. Parameters for the Different Scenarios
The average characteristics of the thickened sludge obtained by gravity and dissolved air flotation thickeners were used in the calculations. The evaluation period covers the years between 2011 and 2016. Mean values were weighted arithmetic average values based on the ratio of primary and WAS production. The mean flow of primary sludge was 19.804 ± 3530 kg/d, with a total solid (TS) content of 4.7 ± 0.5% and a VS content of 72.3 ± 3.4%. The mean flow of WAS was 16.167 ± 2417 kg/d, with 6.7 ± 0.8% of TS and 81.0 ± 1.4% of VS. Table 3 shows the thermal hydrolysis parameters assumed for calculating mass and energy balances. Appendix B contains Table A1, with assumptions for the different parameters considered for the WWTP. The specific parameters of Scenario 1 are those of the operating conditions of the WWTP of Burgos. Table 4 shows the specific parameters used for evaluating the different scenarios.
2.4. Mass and Energy Balance of the Thermal Hydrolysis Unit
The use of live steam is needed in THP for increasing the temperature of sludge to the desired conditions. Live steam is generated in a recovery mixed boiler that obtains heat from engine exhaust gases; biogas used as fuel whenever necessary. The boiler feeding water is preheated using the energy from the main engine’s cooling circuit. Estimation of live steam demand was performed for the average batch cycle. The Cambi process operates using a batch configuration, making it difficult to compare with continuous processes. The mass balance for the batch cycle leads to similar results when an average cycle is assumed; this significantly simplifies calculations and allows for easier comparison between different technologies.
The total mass of treated sludge from the THP-B6.2 reactor was 6300 kg/batch with a concentration of 12.7% TS (data obtained from the WWTP of Burgos). The reactor is the only element operating under batch mode, whereas the pulper and flash-tank operate under continuous mode. Process gases produced in the hydrolysis reactor were considered in the mass balance of the pulper unit. These gases are sent to digesters for further treatment. The flash steam from the reactor (30 kg/batch) was assumed to have been sent to the pulper instantaneously. This stream contains organic material derived from the release of process gases of up to 8 kg VS/batch. Figure 2 presents the process scheme and nomenclature of each of the variables involved in the calculation stage of the mass and energy balance of a CambiTM hydrolysis thermal unit for the average cycle. Only one reactor is represented in this figure. The mass and energy balances are described in Appendix A.
2.5. Consumption of Biogas by the Recovery Boiler and Engines
Figure 3a shows the operating scheme of the biogas valorisation section of the batch cycle, where live steam injections take place. The contribution of the thermal power from engine exhaust gases to the recovery boiler is also represented. Biogas is consumed by the boiler and engines. Thermal power from the exhaust gases of engines is recovered in the boiler. Figure 3b shows the period of no live steam injection; Figure 3c shows the average cycle. The heat recovery zone has a three-way valve that operates with a set-point defined by steam pressure. When live steam approaches the set-point pressure during the no-injection stage, this valve is closed and all gases are sent to the atmosphere. In these figures, the continuous lines indicate “operation” and dashed lines “no operation” of the equipment at the moment represented. The system, which is composed of digester and biogas engines, always operates continuously, whereas the gasometer–boiler system operates under batch mode.
Estimating the thermal power of the recovery mixed boiler (TPrb, kW) is done using Equation (1), considering the demand for biogas and the heat recovered from engine exhaust gases. Equation (2) calculates the consumption of biogas by the engines and the recovery mixed boiler. Both equations consider the period of steam injection. The symbols < > are used to represent the average cycle for a specific variable. Any variable (X) of the batch cycle can be transformed into the average cycle by applying Equation (3), with this only being valid for boiler parameters, as the biogas produced by digesters and consumed by the engines is constant, whereas the conditions for the operation of gasometers is based on the stored amount of available biogas. Thus the net result is zero for each complete cycle.
where ηburner is the efficiency of the burner (%). TPbiogas-rb is the thermal power associated with the consumption of biogas by the recovery boiler (kW). ηrb is the efficiency of the recovery boiler (%). TPeg-useful is the useful power recovered from the engine exhaust gases (kW), and TPfw is the thermal power contained within the boiler feeding water (kW). The thermal power of the recovery boiler and engines (TPbiogas-rb and TPbiogas-eng, kW) must be adjusted with the thermal power of the biogas produced by the digester (TPbiogas, kW). When additional heat is necessary, this heat should be supplied by gasometers (TPbiogas-su-gasom, kW).
The period of no steam injection is considered only in Equation (4) since all the equivalent terms in Equation (1) are null.
where (TPbiogas-st-gasom, kW) is the thermal power of the gas stored in the gasometers.
The energy balance of gasometers for the whole operating cycle is presented in Equation (5). The thermal power, which should be stored in the gasometers, corresponds with the periods of no steam injection.
Equations (6) and (7) allow the estimation of the thermal output of the recovery boiler and the consumption of biogas for the average cycle. These equations are equivalent to Equations (1) and (2). Equation (7) allows the estimation of the thermal power of the biogas supplied by the gasometers during the steam injection period.
Cp values for air were estimated using the NASA polynomial equation that is valid for temperatures between 200–1000 K [42]. Table 5 shows the Cp values obtained for the individual components of exhaust gases and the whole gas stream. These values were also estimated from this approximation when operating under lean conditions, assuming an air factor of 1.57 [43].
Enthalpy was calculated by subtracting the reference temperature (25 °C).
Equations (9) and (10) are the specific enthalpies of inlet and outlet gases as a function of the gas boiler inlet temperature, which is expressed in Equation (11). The outlet temperature was considered constant [44]. Equation (12) estimates the degree of loading for the engine, and Equation (14) is used to calculate the mass flow of exhaust gases [45]. Finally, by applying Equation (14), usable thermal power, available with exhaust gases and used in the boiler, is calculated for the batch cycle.
where Cp-eg is the specific heat of engine gases (kJ/kg K). Rg is the ideal gas constant (0287 kJ/kg K). T is the gas temperature (K). hrb-in, hrb-out, Trb-in and Trb-out are the specific enthalpies and temperatures of the engine gases at the inlet and outlet ports of the boiler (kJ/kg, °C). Cp-eg-in and Cp-eg-out are the specific heat values of inlet and outlet gases for the boiler (kJ/kg, °C). DL is the degree of loading of the engine (%). TPeg-useful is the useful thermal power of the recovery boiler exhaust gas for the batch cycle (kW). The available energy is the energy transferred by these gases, considering an outlet temperature of 142 °C.
The thermal power of the main circuit of the engines (TPmain-circuit, kW) is used to supply thermal energy to digesters in Scenarios 1 and 3–5 and also to boiler feed water in Scenarios 2–5. Equation (15) allows the calculation of this total thermal power [45]. Equation (16) represents the average thermal power of the feed water of the boiler’s main circuit, (<TP>fw, kW).
where Tfw is the temperature of boiler feeding water (°C).
2.6. Electric Power Generation
Equation (17) is used to express the electric power generated from the alternators at a set degree of loading.
where EPeng-gross and EPeng-nom are the gross energy values generated by the engines and the rated electrical power at full load per engine (kW). The operation of the engines was assumed to be under continuous mode, with loading levels below 90% regarding the nominal value. This criterion was selected based on reliability considerations as a warrant for long term performance and maintenance costs [46].
The operation of THP within the WWTP brings, as a consequence, the installation of a series of new additional equipment and an increase in electricity demand. This additional demand is denoted as “additional self-consumption”, and it penalises the gross production of electric power. This extra demand is associated with the post-thickening section, the thermal hydrolysis unit, the boiler, and nitrification–denitrification via nitrite. In contrast, the modifications in operating conditions experienced by the digesters and the dewatering section result in a decrease in energy requirements, and this reduction is denoted as “consumption savings”. These savings positively affect the gross production of electricity due to the decrease in the number of digesters needed and the lower volume of digestate being dewatered. The electrical energy consumption associated with the treatment of centrates has also been considered. This treatment is performed via nitrite for Scenarios 2–4 (when THP is considered) and via nitrate when conventional digestion is evaluated (Scenario 1). The higher energy demand is explained by the presence of air blowers and all accessory equipment for nitrification–denitrification via nitrite, with electricity demand being directly linked to the NH4+ content in the centrates.
Net electric power generation (EPeng-net, kW) is calculated using Equation (18); this value is used to estimate the percentage of self-consumption (%SC, %), using Equation (19).
where EPadditional (kW) is the additional self-consumption based on the new equipment needed, and EPsaved (kW) is the consumption savings based on specific modifications in the operating conditions of the plant.
2.7. Energy Balance of the Total Process
The scenarios are compared using thermal and electrical efficiency. The whole sludge line and dewatering operations, along with the biogas valorisation section, are considered. Equation (20) allows the estimation of the thermal power of the global process.
where TPdigester and TPtotal-losses are the thermal power required for the digesters (kW) and the thermal losses of the complete process (kW), respectively. Equation (21) calculates the thermal efficiency of the process (ηthermal-process, %). This efficiency is evaluated by considering the equipment set of hydrolysis units, digesters, engines and boiler. Equation (22) estimates the efficiency of electricity production (ηelectric-process, %), and Equation (23) estimates the total energy efficiency of the process (ηenergy-process, %).
All parameters used to evaluate the efficiencies are calculated per unit of TS of incoming sludge, using as reference the value of TS flow in the sludge stream (MTS-thick, t/h). This way, the specific biogas production (SBP, m3/t TS), the specific thermal power (TPbiogas-specific MWh/t ST), the gross specific electric power (EPgross-specific, MWh/t ST) and the net specific electric power (EPnet-specific, MWh/t ST) are calculated in terms of ton of TS of sludge. The specific production of biogas per unit of VS removed in the digestion process is also calculated. For this calculation, the mass flow of VS at the inlet and outlet of the digesters is used (SBPVS, m3/t VS; see Equation (24)).
where Vbiogas is the volumetric flow of biogas (m3/h); MVS-digester-in and MVS-digester-out are the inlet and outlet VS mass flows (t TS/h).
2.8. Economic Balance and Feasibility Analysis
The economic balance and feasibility analysis considers capital investment, net annual cash flow, payback and net present value at 25 years. Scenario 1 is taken as a reference for estimating the effect exerted when inserting different THP units. The capital investment calculation takes into account the equipment of the post-thickening section, THP, digestion section, steam production by the recovery mixed boiler, dewatering and nitrification–denitrification of sludge via nitrite. Scenario 1 does not contemplate the costs associated with the installation of the facility and the cost of equipment because this scenario corresponds to the WWTP operating under conventional mesophilic digestion. The price of electric power supply in Spain for consumers using 2000–20,000 MWh/year is considered as 92 €/MWh [47]. It is assumed that the total amount of biogas is consumed in the boiler and engines. The use of natural gas as supplementary fuel for the boiler is not considered.
Biogas is assumed to be fully valorised in the engines once the thermal demand of THP is completely covered. The cost of transport and treatment of dewatered sludge to the drying area and composting plant was 11.51 €/t [48]. The cost of polyelectrolyte was 2300 €/t (indicated by the WWTP). Annual plant operating costs were estimated at 2.6% of the initial capital investment [49]. For the calculation of payback and net present value (NPV, €) parameters, a discount rate of 3% was adopted [50] and a depreciation period of 20 years was assumed using the exponential line method [51]. The calculation of the NPV was done using Equation (25), with constant net annual cash flows [52]. The internal rate of return (IRR) was obtained from this same equation by setting the NPV to zero. The payback period was calculated as the time necessary for the recovery of the investment outlay.
where F is the net annual cash flow (€), n is the total number of periods evaluated (years), r is the discount rate (%), t is the period (years), and I0 is the initial capital investment (€). Two different economic analyses were performed to compare scenarios (Scenarios 2–5) under the same conditions, using Scenario 1 as a reference. The first case (Case I) considers the WWTP of Burgos operating with mesophilic anaerobic digestion and evaluates the costs associated with the installation of a THP. Thus, different hydrolysis technologies were evaluated under this configuration. The second case (Case II) contemplates the different scenarios with the construction of a completely new sludge line, with this new section starting at the thickening zone (gravity thickening and air flotation thickening).
The assumptions made for evaluating the installation of a THP into the WWTP for economic balance (Case II) were the following: Scenario 4 requires a boiler of 2000 kg/h, Scenarios 3 and 5 require a THP-B2.4 unit of 19.7 t TS/d [53] and a recovery boiler of 1200 kg/h [54]. Likewise, the volume of the first and second digester of Scenario 4 was calculated using a hydraulic retention time (HRT) of 16 days [40], resulting in volumes of 5300 and 4000 m3, respectively. The THP-B6.2 plant was considered for ITHP because its treatment capacity was the closest to that required in Scenario 4.
3. Results and Discussion
3.1. Mass and Energy Balances for the Sludge and Biogas Line
Table 6 presents the values of different parameters calculated from Scenarios 1–5 for the sludge line (the bases of the economic balance (Case I) calculation): values for post-thickening, THP, dilution water, HSE, digesters and dewatering. These parameters were derived by assuming a volume of 6000 m3 for each digester. The maximum value of TS attained for dewatered sludge was 30%. This value was assumed from the use of centrifugal dewatering sludge pumps, which is valid for Scenarios 1 to 3. However, Scenarios 4 and 5 require the installation of different dewatering equipment since the values adopted were 41% and 45%, respectively.
Table 7 shows the biogas line parameters for Case I: digesters, gasometers, engines, recovery mixed boiler and total process. The nominal and maximum capacity of hydrolysis unit THP-B6.2 is 35 and 42 t TS/d. The recovery mixed boiler has a steam flow of 4200 kg/h. The number of engines is constant for all five scenarios. In this study, the biogas production was estimated based on the removal of VS, with this value being higher because of the pretreatment. The increase in biogas production based on the different characteristics of the scenarios evaluated is 31% when primary and secondary sludge are submitted to thermal hydrolysis. This value is further increased under assumptions of Scenario 4 and 5, where a 40–56% increase in biogas production is assumed because of the hydrolysis of the recalcitrant fraction of sludge, in one case, and the recovery of soluble organic material from Scenario 5, where centrates are sent back to digesters.
There are several studies available in the literature that have reported a wide range of values regarding the biogas enhancement of hydrolysed sludge. Ferrentino et al. [11] reported low biogas increments of 17% to 24% when evaluating sludge under two different temperatures, 150 and 170 °C. However, other reports have indicated biogas increments between 57–70% [12,13] for standard thermal hydrolysis. Values that are five times higher were reported by Wacławek et al. [55] when compared with the mesophilic digestion of WAS. On the other hand, Yang et al. [56] evaluated post-thermal hydrolysis with centrate recirculation and reported an enhancement in methane yield of 62%. Based on the great variety of these results, in the present study, the criterion of considering the conversion of destroyed VS into biogas gives a value for biogas enhancement that is in the middle range of the reported values.
The resulting cycle time of reactors for Scenarios 3–5 is relatively high, negatively affecting the injection coefficient and, therefore, the thermal power recoverable from exhaust gases. This fact results in greater consumption of biogas by the boiler. It was also found that the thermal power available from the engine’s main cooling circuits is insufficient to satisfy the heat demand of digesters in Scenarios 4 and 5; thus, additional thermal power must be provided from different elements (i.e., heat from the use of auxiliary biogas by the boiler, increasing the concentration of thickened sludge in the flotation thickeners). Scenario 4 needs an additional amount of 326 kW (thermal power), whereas Scenario 5 requires 211 kW. Under the conventional configuration of the WWTP, the mesophilic digestion process obtains additional thermal power whenever needed from the heat recovery systems of the engines’ exhaust gases and the main cooling circuit of the engines.
The decrease in the mass flow of dewatered sludge under all scenarios is noteworthy when compared with the values obtained from Scenario 1. However, the consumption of polyelectrolytes is significantly increased in Scenarios 2–4. Scenario 5 requires null polyelectrolyte addition because dewatering in this scenario is performed at high temperatures, eliminating the need for a coagulating agent.
For the sake of simplicity, the inlet temperature of digested sludge to the THP in Scenarios 3 and 4 was assumed as 15 °C instead of 37 °C due to the implications it would have on the flash-tank steam (temperature and pressure), the pulper temperature and the sudden depressurisation stage between the reactor and the flash-tank. The energy performance of Scenario 1 is the best of all since it takes advantage of engine exhaust gases and the main cooling circuit, thereby presenting the lowest thermal losses because there are no losses associated with the heat exchanger of hydrolysed sludge. Tables S1 and S2 contain the parameters of economic balance, derived from the sludge and biogas line under the assumptions of Case II.
3.2. Total Self-Consumption, Electric Power Balance and Specific Energy Parameters
Table 8 represents the total self-consumption (details are provided in Tables S3–S5), the electric power balance and the values for energy-specific parameters. For the calculation of these parameters, the inlet of TS and VS are those values set at the incoming section of the control volume established, which, in this case, takes the mixing ring as the starting point where primary and secondary sludge are homogenised.
Scenarios 2 and 3 report a value of 64 kW as electricity self-consumption, whilst Scenarios 4 and 5 report a value of 102 kW, 59.4% higher. However, the demand for electricity expressed in terms of percentage is about the same (6%, with this value being calculated using the total electrical energy consumed by the plant and that globally produced as a base) for all scenarios; however, for Scenario 4, a value of 8.7% was reached.
The gross production of biogas in Scenario 2 is 31% higher than that of Scenario 1, reporting a higher production thanks to the sludge pretreatment. However, the use of biogas by the recovery mixed boiler leads to a decrease in biogas available for the engines. Thus, the gas available for valorisation is 0.8% lower, reducing, in this same value, the net electrical energy produced and decreasing the thermal energy by a value of 6.9%. Conversely, the amount of available biogas to be used as fuel by the engines is 8.6% higher in Scenario 3 (due to the lower demand of live steam because a less amount of sludge is pretreated).
The increment in the biogas available for the engines causes the start-up of a third engine, which represents a significant decrease in the efficiency of these units. As a result, only a 0.2% increase is obtained in gross electricity production. This effect also results in a 6% decrease when considering the net electricity produced. In a similar way, Scenario 4 presents an increase in the biogas available for valorisation of about 19.2%, but the increment is a gross value, and net electrical energy is 12.9 and 3.1%, respectively. Finally, Scenario 5 reports the highest values for the analysed parameters, showing an increment in available biogas for the engines of 42.5%, thus proving to be the best option.
The majority of reports found in bibliographies usually focus on the parameters associated with biogas increase, sludge solubilisation and centrate characteristics [33]. However, when considering the installation of a hydrolysis unit, other parameters become relevant as it involves the use of biogas for the boiler and engines. Batch processes are highly penalised due to the amount of biogas that is diverted for steam production; this, therefore, reduces the production of electricity. Another additional factor that highly influences the outcome of the different scenarios is the efficiency of engines based on fuel loading. Thus, increasing the amount of biogas available to the engines may not always translate into a direct increase in electricity production due to the lower efficiency of the engines if an additional one needs to be started up.
3.3. Economic Balance and Feasibility Analysis
Table 9 shows the results for a yearly analysis of cash flow components when calculating the economic balance under the assumptions of Case I and the increase observed, using Scenario 1 as a reference.
Table 10 shows the results from the economic balance and feasibility analysis, considering Cases I and II in the different scenarios. The estimation of initial investment for economic balance for Cases I and II is detailed in Table S6–S8.
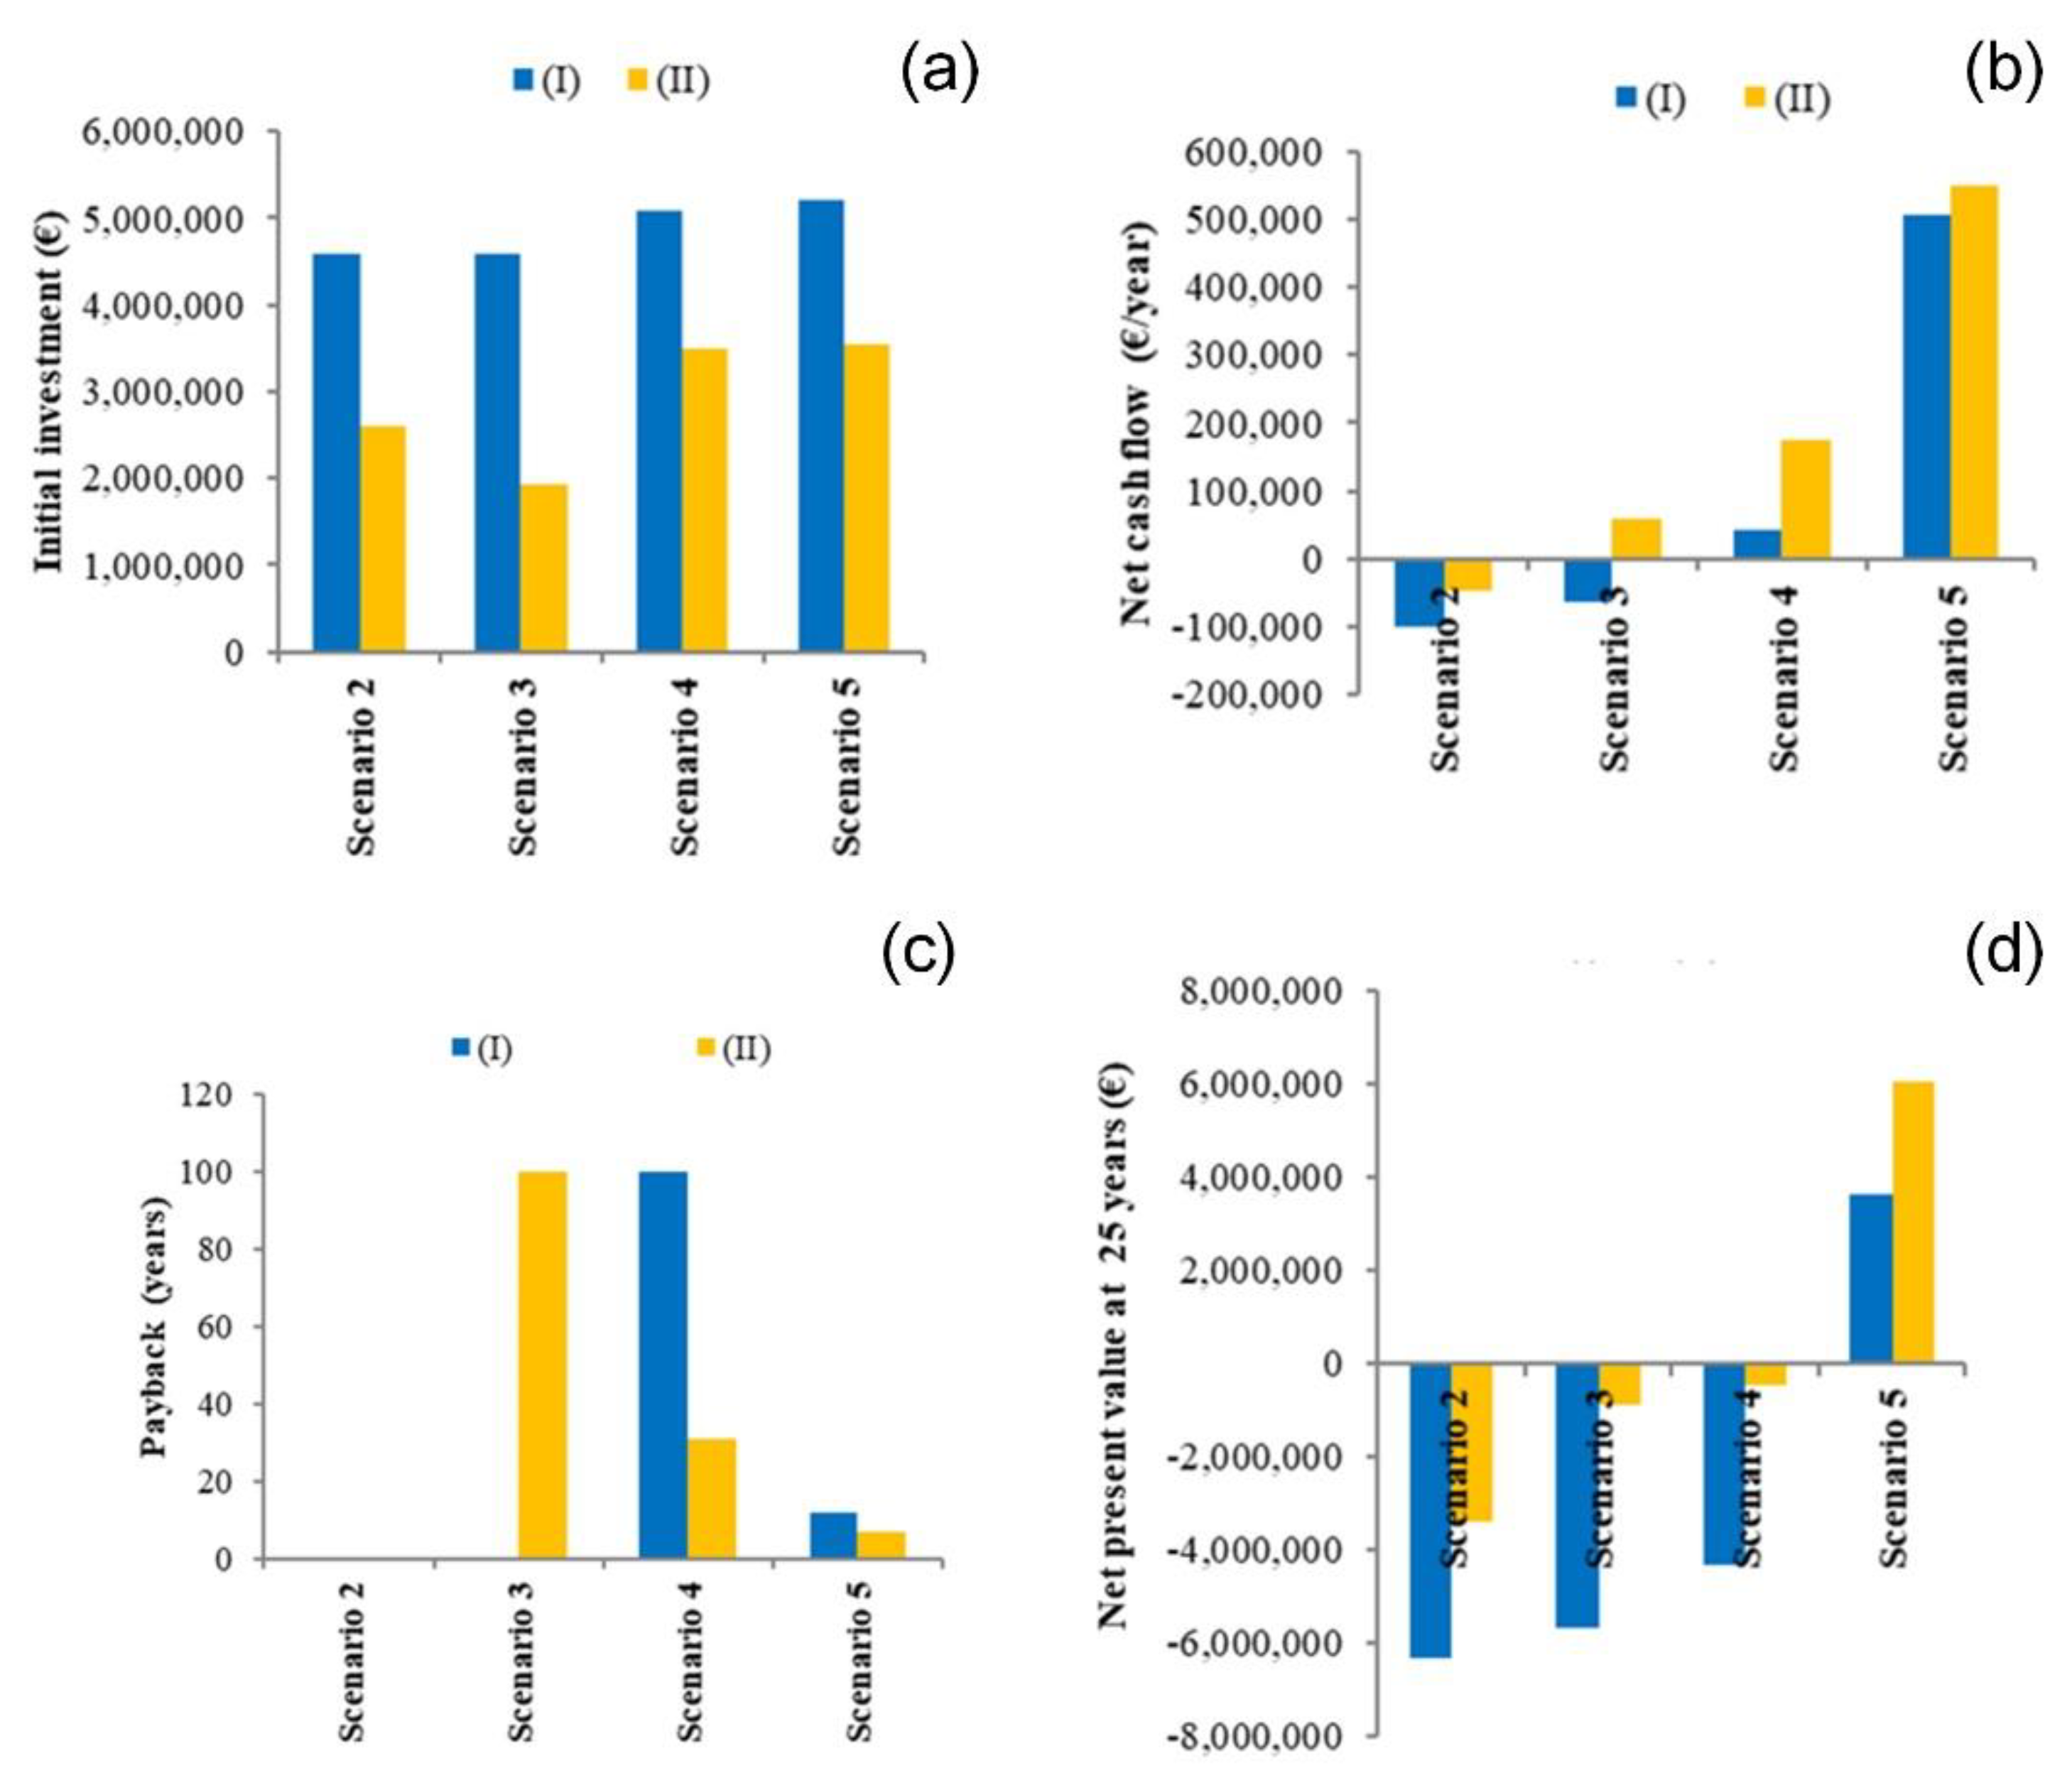
Figure 4a shows the values of the capital investment for the two economic cases (Cases I and II) considered. Evaluating a time horizon of 25 years, Figure 4b shows the net annual cash flow in euros, Figure 4c represents the payback time expressed in years, and Figure 4d shows the net present value in euros. When obtaining payback values higher than 100 years, it is represented as 100 years in the graph. If the net annual cash flow is negative, then the payback is not represented in the figure.
Figure 4b shows that the net annual cash flow from Scenario 2 is negative. This scenario considers the installation of a batch THP. The two cases give negative values for net annual cash flow, resulting in an NPV of −6,310,937 EUR for Case I at a time horizon of 25 years and a value of −3,405,279 EUR for Case II. Treating only WAS by thermal hydrolysis (Scenario 3) improves the economic balance, but the NPV is still negative when evaluated under the assumptions of Case I, whereas benefits are obtained in Case II. However, even in this latter case, the benefits are not high enough to consider this technical option as economically feasible. The payback period is 106 years.
Scenario 4 considers the performance of an ITHP system. This scenario, along with Scenario 5, has a higher initial investment; thus, it is penalised by this factor when evaluating the payback period. Therefore, it is only under the assumptions of Case II that this option gives a payback period of 31 years, which may be improved if fiscal incentives are available; otherwise, this option, just as in Scenario 2, cannot be considered economically feasible. Conversely, Scenario 5, although having a similar initial investment to that of an ITHP system, presents much higher value for the parameter net annual cash flow and, thus, results in a better economic balance, with payback periods of 12 and 7 years for Cases I and II in terms of economic balance.
In the present case study, costs regarding operation and sludge disposal are fixed. These factors have a great impact on the economic balance. Future work will be performed to evaluate how sludge disposal costs, fiscal incentives (regarding electricity production) and the addition of cosubstrates will impact the economic balance. Final sludge disposal costs are highly varied among different countries, and the outcome of economic balance will be greatly affected by the selection of different disposal routes (e.g., landfill, land application, composting, incineration). In fact, one of the main benefits of installing a thermal hydrolysis unit in a WWTP is associated with the enhanced degradation of organic matter and improved cake solid content, from 25.2% to 32.7% of TSS (total suspended solids), as reported by Phothilangka et al. [57], who also indicated that this improvement translates into a 25% reduction in sludge disposal costs. Similarly, Lie and Smith (2020) studied the performance of several industrial hydrolysis plants. They also reported that the increase obtained in biogas yield does not necessarily lead to better overall performance in terms of energy balance. Other parameters are of great relevance. Among these, Lie and Smith [58] made special reference to the adjustment of the solid content of the feed, digester retention time, and digestion temperature to optimise the overall energy balance of the digestion process.
The Solidstream® process achieved the best results of the five proposed scenarios after evaluating efficiency performance parameters, also considering the evaluation of both Case I and Case II in terms of the economic balance. Solidstream® reported excellent results regarding parameters such as gross and specific consumption of live steam, thermal, electrical and energy performance of the process, average thermal power used from the exhaust gases and percentage of biogas consumption in the mixed recovery boiler. Furthermore, centrates from the dehydration section are sent back to digesters and not directly to the nitrification–denitrification process via nitrite like in the case of the other scenarios. Regarding the four components that make up annual net cash flow, Solidstream® obtained the highest production of electricity, the lowest amount of dewatered sludge and the lowest consumption of polyelectrolytes. However, this process presents a higher capital investment.
4. Conclusions
The analysis of four different thermal hydrolysis processes that are assumed to operate in the WWTP of the city of Burgos (Spain) indicates that Solidstream® technology reports better results regarding economic and energy balance. Factors such as biogas production, net energy generation, polyelectrolyte consumption, dewatered sludge production and operating costs were evaluated. The main advantage of thermal hydrolysis is the significant decrease in the total amount of sludge that needs final disposal. The operating conditions of the different technologies reported great variations regarding NPV. When a newly constructed WWTP was considered, the main advantage obtained was the significant decrease in capital investment due to the construction of smaller digestion units. However, in the two cases evaluated, Solidstream® reported the best economic parameters and energy performance among the different technical options studied.
The exclusive treatment of secondary sludge instead of the whole sludge stream significantly improves the energy balance because of the lower energy demand of this configuration. This leads to reasonably good results for plants of new construction. Intermediate thermal hydrolysis has reported results that make this technology unfeasible for direct application to a currently operating WWTP. However, performance parameters for plants of new constructions are better.
The increments in energy demand associated with the additional operating equipment of the thermal hydrolysis process offset the benefits obtained from better reactor performance. Therefore, the main advantage of any of these hydrolysis processes is more closely related to the decrease in the volume of sludge needing final disposal rather than an increase in energy production.
Supplementary Materials
The following are available online at https://0-www-mdpi-com.brum.beds.ac.uk/2076-3417/11/3/964/s1. Table S1: Parameters obtained from the sludge line of the economic balance (Case II); scenarios are abbreviated as S1 to S5 to stand for Scenario 1 to Scenario 5. Table S2: Parameters obtained from the biogas line of the economic balance (Case II). Table S3: Breakdown of total self-consumption of the economic balance (Case I). Table S4: Breakdown of total self-consumption of the economic balance (Case II). Table S5: Total self-consumption, electric power balance and specific energy parameters used in the economic balance (Case II). Table S6: Main results from the economic balance under Case II assumptions; second row for each category contains the difference in the corresponding values with regard to Scenario 1. Table S7: Breakdown of initial investment of the economic balance under Case I. Table S8: Breakdown of the capital investment associated with the economic balance under Case II assumptions.
Author Contributions
Conceptualization, X.G.B. and E.J.M.; methodology, J.G.-C.; software, J.G.-C.; validation, X.G.B.; formal analysis, X.G.B.; investigation and resources, J.G.-C.; data curation, X.G.B. and E.J.M.; writing—original draft preparation, J.G.-C.; writing—review and editing, X.G.B. and E.J.M.; visualization, X.G.B.; supervision, X.G.B. and E.J.M; project administration, X.G.B.; funding acquisition, X.G.B. All authors have read and agreed to the published version of the manuscript.
Funding
This research was possible thanks to financial support from the Ministry of Economy and Competitiveness and European Regional Development Funds (ERDF) through project UNLE15-EE-3070.
Institutional Review Board Statement
Not applicable.
Informed Consent Statement
Not applicable.
Data Availability Statement
Not applicable.
Conflicts of Interest
The authors declare no conflict of interest.
Abbreviations
| < > | average value |
| %SC | percentage of self-consumption |
| η | efficiency (%) |
| Cp | specific heat (kJ/kg K) |
| COD | chemical oxygen demand (g/L) |
| DL | degree of loading (%) |
| EP | electric power (kW) |
| F | net annual cash flow (€) |
| h | specific enthalpy (kJ/kg) |
| HRT | hydraulic retention time (h) |
| HSE | hydrolysed sludge exchanger |
| ki | injection coefficient |
| Io | initial capital investment (€) |
| IRR | internal rate of return (%) |
| ITHP | intermediate thermal hydrolysis process |
| m | mass amount in batch cycle (kg) |
| M | mass (kg) |
| n | number of periods in economic analysis |
| N | number |
| NPV | net present value (€) |
| r | discount rate (%) |
| Rg | gas universal constant (J/mol k) |
| SBP | specific biogas production (m3/t) |
| SCOD | soluble chemical oxygen demand (mg/L) |
| SRE | sludge recirculation exchanger |
| t | time (h) |
| T | temperature (°C, K) |
| T0 | ambient temperature |
| THP | thermal hydrolysis process |
| TP | thermal power |
| TS | total solid (kg) |
| V | volume (m3) |
| VS | volatile solid (kg) |
| VSR | volatile solid removal (%) |
| WWTP | wastewater treatment plant |
| Subscript | |
| biogas-eng | biogas consumption of engines |
| biogas-rb | biogas consumption of the recovery boiler |
| biogas-st-gasom | biogas stored by gasometers |
| biogas-st | biogas stored |
| biogas-su-gasom | biogas supplied from gasometers |
| eg-useful | exhaust gases useful power recovered |
| eng | engine |
| eng-gross | gross energy |
| eng-net | engine net energy |
| fs | flash steam |
| eng-nom | engine at full load |
| fw | feeding water |
| in | inlet stream |
| inj | injection |
| ls | live steam |
| pg | process gases |
| pt | post-thickening section |
| rb | recovery boiler |
| out | outlet stream |
| thick | thickened sludge |
| total-losses | total losses of energy |
Appendix A. Mass and Energy Balance of the Thermal Hydrolysis Unit
The mass and energy balances are represented in Equations (A1) and (A2) for the THP. These equations correspond to the “external equations” of the THP, associated with the control volume denoted by dotted lines in Figure 2. These equations were used to calculate values from the average cycle. THP was considered a single entity and only those streams interacting with the control surface were indicated in these equations.
The inlet stream to the THP corresponds to thickened sludge coming from the post-thickening section. Streams were assumed to be composed of total solids (TSs) and water, using this nomenclature as a suffix. For the mass balance M represents mass flow, MTS-pt is, therefore, TS mass flow of sludge stream entering the pulper (which comes from the post-thickening section (suffix pt used)) and MTS-flash-tank is the outlet sludge stream from the flash-tank (kg/h). Similarly, for the water contents of these streams (Mwater-pt and Mwater-flash-tank), Mls is the mass flow of the live steam injected into the reactor (kg/h), and Mpg is the mass flow of process gases (kg/h).
T0 and Tflash-tank are the temperatures of the sludge stream entering the pulper (ambient temperature) and that of the flash-tank outlet stream (°C). hls and hpg are the specific enthalpies of live steam and process gases, respectively (kJ/kg). These equations allow the calculation of Mls and Mwater-flash-tank, given that the other variables are known parameters associated with the hydrolysis process. Specific heat of water and biosolids are represented by Cp-water and Cp-TS (kJ/kg°C). Equations (A3) and (A4) are the mass and energy balances for the flash-tank.
Nomenclature is similar to that of the previous balance, using MTS and Mwater to represent TS and water mass flows. Suffix represents either the equipment evaluated or the origin of the incoming stream. Suffix fs denotes flash steam. The unknown variables to be calculated are, in this case, Mwater-reactor and Mfs-flash-tank.
Mass and energy balances for the reactor are presented in Equations (A5) and (A6). Variables are denoted using a similar nomenclature to that of previous balances. The unknown variables are Mwater-pulper and Tpulper; thus, it is necessary to consider the effect of process gases based on Equations (A10) and (A11) to estimate values for Mfs-reactor. This last stream contains VS and water as main components.
Equations (A7) and (A8) indicate the mass balance of the reactor under the batch cycle and the TS content of sludge entering the reactor (TSreactor-in, %). This value coincides with the content of TS inside the pulper unit (TSpulper, %). By circular permutation of the same equation, it is also possible to calculate the TS content of the sludge stream exiting the flash-tank (TSflash-tank, %). Lowercase letters are used to differentiate these calculations from those of the average cycle, which uses capital letters as nomenclature. The total mass of sludge entering the reactor (msludge-reactor in) is obtained from the summation of the mass flow of total solids and water contained in the sludge exiting the pulper (mTS-pulper and mwater-pulper) and the mass of live steam injected into the reactor (mls).
Equations (A9) to (A11) express the mass balance of TS and water for the reactor and the TS concentration of sludge in the outlet stream of the reactor (TSreactor-out, %). The batch cycle is represented in these equations, thus the use of lowercase letter m. The process gases were assumed to be composed of VS derived from sludge. These gases are sent to the pulper along with flash steam from the reactor.
The unknowns are mwater-pulper and Tpulper. From Equations (A9) and (A10), it is possible to obtain the values of variables mTS-pulper and mwater-pulper because mfs-reactor, msludge-reactor-in and TSreactor-in are values derived from the performance of the hydrolysis process.
Mass and energy balance for the pulper unit are presented in Equations (A12) and (A13).
In this case, all variables and parameters are already known since these two equations correspond to linear combinations of the previous ones. Equation (A14) is used to transform any of the mass flow parameters from the average cycle to batch cycle, whereas Equation (A15) calculates the operating cycle time of the reactor.
where Mcycle-average and mcycle-batch denote mass flow of the average cycle stream (kg/h) and total mass of the batch cycle (kg/batch), mTS-pulper is the TS mass flow introduced per batch into the reactor (kg/batch), Nreactor is the number of reactors in operation and tcycle is the cycle duration of the reactor (min).
The time of live steam supply to each reactor (tinj, min) is calculated by Equation (A16). The injection coefficient (ki, %) is the ratio between the supply time and the total cycle time of each reactor (see Equation (A17)). The average consumption of live steam for the reactors (Mls, kg/h) can also be obtained from Equation (A18).
where mls (kg/batch) is the mass of live steam injected into the reactor per batch, and Mls-nominal (kg/batch) is the nominal mass flow rate of live steam produced by the boiler.
The amount of TS and VS released from the reactor with process gases is calculated using Equations (A19) and (A20), with efficiency factors ηTS-pg and ηVS-pg, expressed in % units. Equation (A21) represents the average mass flow of process gases (Mpg, kg/h) and is calculated using the mass of process gases produced per batch.
Equation (A22) represents the average consumption of a specific live steam (Mls-specific, kg/t TS).
Water is added to adjust the solid content of the hydrolysed sludge at the end of the pretreatment to achieve the required solid concentration before feeding the digester. The mass flow of dilution water added (Mdilution water, kg/h) is calculated using Equation (A23). The mass of TS in the stream exiting the flash tank is assumed to remain constant after the addition of dilution water (TSdiluted sludge, %).
Equations (A24) and (A25) represent the mass and energy balances associated with the addition of dilution water.
where MTS-diluted sludge, Mwater-diluted sludge are the mass flow (kg/h) and water contained in the stream denoted as diluted sludge (kg/h). Tdiluted sludge is the temperature of the sludge after adding dilution water (°C). The unknowns to be calculated are Mdilution water, Mwater-diluted sludge and Twater-diluted sludge.
The mass and energy balances of the hydrolysed sludge exchanger (HSE) are expressed in Equations (A26) and (A27). There is no direct contact between the sludge stream and cooling water; thus, the inlet and outlet mass flows are not modified. The heat exchanger evaluated here is a water–sludge type, with a counter-flow circulation of fluids. The flow of sludge represented here as Msludge-feed will become the feeding stream of the digester. This stream is composed of sludge after adding water to set the TS content of the feeding digester stream.
where THSE is the outlet sludge temperature of the exchanger (°C), and TPHSE is the thermal power extracted to decrease the temperature to the digester feeding temperature. This temperature is high enough to compensate heat losses due to the reactor wall heat transfer, pipe heat losses and biogas heat losses (kW). The unknown variables to be calculated are THSE and TPHSE, but this latter quantity cannot be calculated unless digester thermal losses have been previously established. These losses occur in pipes and exchangers, and a value of 10% of total thermal power entering the digester was assumed (WWTP, 2017). Heat losses due to transmission through walls, ceiling and floor were 0.0105 kW/m3 for Scenario 1, 0.0122 kW/m3 for Scenarios 2 and 3, 0.0105 and 0.0122 kW/m3 for Scenario 4 and 0.0182 kW/m3 for Scenario 5 [59].
Appendix B. Technical Characteristics of the Different Units Considered in the WWTP

Table A1.
Parameters of the WWTP. Technical characteristic of units operating in the different WWTP sections that are common to all scenarios evaluated.
Table A1.
Parameters of the WWTP. Technical characteristic of units operating in the different WWTP sections that are common to all scenarios evaluated.
| Parameter | Units | References |
|---|---|---|
| Post-thickening | ||
| TS concentration (%) | 16.5 | |
| Polyelectrolyte (kg/t TS) | 4 | |
| Dilution water (m3/kg polyelectrolyte) | 0.200 | |
| Efficiency of centrifugal pumps (%) | 97 | |
| Raw sludge temperature (˚C) | 15 | |
| Digesters * | ||
| Digesters (m3) | 3 × 6000 | |
| Biogas agitation electric power (kW/m3) | 0.005 | [37] |
| Low heating value of biogas (kJ/m3) | 21,240 | |
| Biogas specific heat capacity (kJ/kg°C) | 1.56 | |
| Density of biogas (kg/m3) | 1.11 | |
| Concentration of CH4 in biogas (%) | 62.4 | |
| Average outside temperature of Burgos city (°C) | 10.7 | |
| Engines | ||
| Number of engines installed (unit) | 4 | |
| Nominal electric power (kW/unit) | 598 | |
| Recovery mixed boiler | ||
| Number of recovery mixed boiler (unit) | 1 | |
| Thermal power (kW) | 2867 | |
| Steam nominal flow (kg/h) | 4200 | |
| Feed water temperature (°C) | 80 | |
| Live steam temperature (°C) | 190.2 | |
| Live steam pressure (kPa) | 1260 | |
| Outlet exhaust gases temperature (°C) | 142 | |
| Burner efficiency (%) | 88.5 | [60] |
| Recovery mixed boiler efficiency (%) | 85, maximum Efficiency 98% | [44] |
| Dewatering | ||
| Dilution water (m3/kg polyelectrolyte) | 0.200 | |
| Efficiency of centrifugal pumps (%) | 97 | |
* Data provided by Burgos WWTP.
References
- Anukam, A.; Mohammadi, A.; Naqvi, M.; Granström, K. A Review of the Chemistry of Anaerobic Digestion: Methods of Accelerating and Optimizing Process Efficiency. Processes 2019, 7, 504. [Google Scholar] [CrossRef] [Green Version]
- Abelleira, J.; Pérez-Elvira, S.I.; Sánchez-Oneto, J.; Portela, J.R.; Nebot, E. Advanced Thermal Hydrolysis of Secondary Sewage Sludge: A Novel Process Combining Thermal Hydrolysis and Hydrogen Peroxide Addition. Resour. Conserv. Recycl. 2012, 59, 52–57. [Google Scholar] [CrossRef]
- Peña Muñoz, K.; Steinmetz, H. Evaluation of Pre-Treatment on the First Stage of an Anaerobic Digester for Enhancing Bio-Hydrogen Production and Its Associated Energy Balance. Energy Procedia 2012, 29, 469–479. [Google Scholar] [CrossRef] [Green Version]
- Devos, P.; Haddad, M.; Carrère, H. Thermal Hydrolysis of Municipal Sludge: Finding the Temperature Sweet Spot: A Review. Waste Biomass Valorization 2020, 1–19. [Google Scholar] [CrossRef]
- Martínez, E.J.; Gil, M.V.; Rosas, J.G.; Moreno, R.; Mateos, R.; Morán, A.; Gómez, X. Application of Thermal Analysis for Evaluating the Digestion of Microwave Pre-Treated Sewage Sludge. J. Therm. Anal. Calorim. 2017, 127, 1209–1219. [Google Scholar] [CrossRef]
- Li, B.; Romero, A.; Wadhawan, T.; Tobin, M.; Manning, E.; Higgins, M.; Al-Omari, A.; Murthy, S.; Riffat, R.; De Clippeleir, H. Recuperative Thickening for Sludge Retention Time and Throughput Management in Anaerobic Digestion with Thermal Hydrolysis Pretreatment. Water Environ. Res. 2020, 92, 465–477. [Google Scholar] [CrossRef]
- Barber, W.P.F. Thermal Hydrolysis for Sewage Treatment: A Critical Review. Water Res. 2016, 104, 53–71. [Google Scholar] [CrossRef]
- Li, X.; Xiong, N.; Wang, X.; Dai, X.; Guo, Y.; Dong, B. New Insight into Volatile Sulfur Compounds Conversion in Anaerobic Digestion of Excess Sludge: Influence of Free Ammonia Nitrogen and Thermal Hydrolysis Pretreatment. J. Clean. Prod. 2020, 277, 123366. [Google Scholar] [CrossRef]
- Kepp, U.; Machenbach, I.; Weisz, N.; Solheim, O.E. Enhanced Stabilisation of Sewage Sludge through Thermal Hydrolysis—Three Years of Experience with Full Scale Plant. Water Sci. Technol. 2000, 42, 89–96. [Google Scholar] [CrossRef]
- Pérez-Elvira, S.I.; Fernández-Polanco, F.; Fernández-Polanco, M.; Rodríguez, P.; Rouge, P. Hydrothermal Multivariable Approach. Full-Scale Feasibility Study. Electron. J. Biotechnol. 2008, 11, 7–8. [Google Scholar] [CrossRef]
- Hong, E.H.; Park, J.G.; Lee, B.; Shi, W.Q.; Jun, H.B. Improvement of Waste Dehydrated Sludge for Anaerobic Digestion through High-Temperature and High-Pressure Solubilization. Energies 2019, 13, 88. [Google Scholar] [CrossRef] [Green Version]
- Xue, Y.; Liu, H.; Chen, S.; Dichtl, N.; Dai, X.; Li, N. Effects of Thermal Hydrolysis on Organic Matter Solubilization and Anaerobic Digestion of High Solid Sludge. Chem. Eng. J. 2015, 264, 174–180. [Google Scholar] [CrossRef]
- Valo, A.; Carrère, H.; Delgenès, J.P. Thermal, Chemical and Thermo-Chemical Pre-Treatment of Waste Activated Sludge for Anaerobic Digestion. J. Chem. Technol. Biotechnol. 2004, 79, 1197–1203. [Google Scholar] [CrossRef]
- Barber, W.P.F. Cambi Thermal Hydrolysis. Theory, Market and the Future. Available online: https://www.wef.org/globalassets/assets-wef/3---resources/online-education/eshowcases/handouts/presentation-handouts---cambi-eshowcase-2.pdf (accessed on 18 December 2020).
- Ruffino, B.; Campo, G.; Cerutti, A.; Zanetti, M.; Lorenzi, E.; Scibilia, G.; Genon, G. Preliminary Technical and Economic Analysis of Alkali and Low Temperature Thermo-Alkali Pretreatments for the Anaerobic Digestion of Waste Activated Sludge. Waste Biomass Valorization 2016, 7, 667–675. [Google Scholar] [CrossRef]
- Li, C.; Liu, F.; Gong, Y.; Wang, Y.; Xu, H.; Yuan, F.; Gao, Y. Investigation into the Maillard Reaction between ε-Polylysine and Dextran in Subcritical Water and Evaluation of the Functional Properties of the Conjugates. Lwt Food Sci. Technol. 2014, 57, 612–617. [Google Scholar] [CrossRef]
- Kakar, F.L.; Koupaie, E.H.; Razavi, A.S.; Hafez, H.; Elbeshbishy, E. Effect of Hydrothermal Pretreatment on Volatile Fatty Acids Production from Thickened Waste Activated Sludge. Bioenergy Res. 2020, 13, 591–604. [Google Scholar] [CrossRef]
- Li, N.; Etzel, M.R. Hydrolysis of Whey Protein-Dextran Glycates Made Using the Maillard Reaction. Foods 2019, 8, 686. [Google Scholar] [CrossRef] [Green Version]
- Kakar, F.L.; El Sayed, A.; Purohit, N.; Elbeshbishy, E. Volatile Fatty Acids and Biomethane Recovery from Thickened Waste Activated Sludge: Hydrothermal Pretreatment’s Retention Time Impact. Processes 2020, 8, 1580. [Google Scholar] [CrossRef]
- Svennevik, O.K.; Nilsen, P.J.; Solheim, O.E.; Westereng, B.; Horn, S.J. Quantification of Soluble Recalcitrant Compounds in Commercial Thermal Hydrolysis Digestates. Water Environ. Res. 2020. [Google Scholar] [CrossRef]
- How Does Thermal Hydrolysis Work?—Cambi—World Leader in Thermal Hydrolysis. Available online: https://www.cambi.com/what-we-do/thermal-hydrolysis/how-does-thermal-hydrolysis-work/ (accessed on 18 December 2020).
- Thermal Hydrolysis Process. Available online: https://haarslev.com/industries/environmental/municipal/thermal-hydrolysis-process/ (accessed on 18 December 2020).
- TeCH4+|Thermal Hydrolysis. Available online: http://tech4plus.com/ (accessed on 18 December 2020).
- Available online: http://technomaps.veoliawatertechnologies.com/processes/lib/municipal/3472-EN_Brochure_Exelys_0516.pdf (accessed on 18 December 2020).
- Available online: https://sustec.nl/wp-content/uploads/2017/02/16086_TurbotecTHP_LeafletA4_GB_lr.pdf (accessed on 18 December 2020).
- DMT|TurboTec Thermal Hydrolosis|DMT Environmental Technology. Available online: https://www.dmt-et.com/products/turbotec/ (accessed on 18 December 2020).
- Geraats, B. Lysotherm ® Sludge Hydrolysis Five Year Experience with a Novel Approach for Operational Savings. In Proceedings of the 19th European Biosolids & Organic Resources Conference & Exhibition, Manchester, UK, 17–19 November 2014. [Google Scholar]
- Chang, S.; Filer, J. Thermal Hydrolysis to Enhance Anaerobic Digestion Performance of Wastewater Sludge. Curr. Pollut. Rep. 2020, 6, 1–16. [Google Scholar] [CrossRef]
- Rus, E.; Mills, N.; Shana, A.; Perrault, A.; Fountain, P.; Thorpe, R.B.; Ouki, S.; Nilsen, P.J. The Intermediate Thermal Hydrolysis Process: Results from Pilot Testing and Techno-Economic Assessment. Water Pract. Technol. 2017, 12, 406–422. [Google Scholar] [CrossRef]
- Svensson, K.; Kjørlaug, O.; Higgins, M.J.; Linjordet, R.; Horn, S.J. Post-Anaerobic Digestion Thermal Hydrolysis of Sewage Sludge and Food Waste: Effect on Methane Yields, Dewaterability and Solids Reduction. Water Res. 2018, 132, 158–166. [Google Scholar] [CrossRef] [PubMed]
- Thorpe, R.; Farrow, J.; Pearce, P. Unlocking the Full Energy Potential of Sewage Sludge. Ph.D. Thesis, University of Surrey, Guildford, UK, 2016. [Google Scholar]
- Veolia-Water ExelysTM Package|Veolia. Available online: https://www.veoliawatertechnologies.com/en/solutions/technologies/exelys-package (accessed on 18 December 2020).
- Barber, B.; Nilsen, P.J.; Christy, P. Cambi SolidStream®: Thermal Hydrolysis as a Pre-Treatment for Dewatering to Further Reduce Operating Costs. In Proceedings of the Water Environment Federation, Chicago, IL, USA, 30 September–4 October 2017. [Google Scholar]
- Kjorlaug, O.; Janka, E.; Bakke, R.; Nielsen, P.J. Methane Production From The Cambi SolidStream Centrate In An Upflow Anaerobic Sludge Blanket Reactor. In Proceedings of the IWA Specialist Conference on Sludge Management Sludge Tech, London, UK, 10–11 May 2017. [Google Scholar]
- Kjorlaug, O.; Nilsen, P.J.; Solheim, O.E.; Petter Traa, L.; Kruchen, H. Cambi SolidStream® High Dry Solids Technology Development of Test Procedures and Report from the First Full-Scale Installation in Germany; Water Environmental Federation: Virginia, VA, USA, 2015. [Google Scholar]
- Cambi SolidStream—High Dry Solids Technology the Versatile Solution to Cake Reduction Pål Jahre Nilsen—PDF Free Download. Available online: https://docplayer.net/74782065-Cambi-solidstream-high-dry-solids-technology-the-versatile-solution-to-cake-reduction-pal-jahre-nilsen.html (accessed on 18 December 2020).
- Metcalf, L.; Eddy, H.P.; Tchobanoglous, G. Wastewater Engineering: Treatment, Disposal, and Reuse; McGraw-Hill: New York, NY, USA, 1979; Volume 4. [Google Scholar]
- Panter, K.; Holte, H.; Walley, P. Challenges of Developing Small Scale Thermal Hydrolysis and Digestion Projects. In Proceedings of the 18th European Biosolids & Organic Resources Conference & Exhibition, Manchester, UK, 18–20 November 2013. [Google Scholar]
- Kleiven, H.; Soler, L.; Sanz, M. Thermal Hydrolysis as a Pre-Treatment of Sewage Sludge Digestion. A Mature Alternative; III Technical Conferences on the Management of Wastewater Treatment Systems. Available online: https://aca-web.gencat.cat/aca/documents/.../jornadatecnica003/volum_ponencies_es.p (accessed on 20 May 2020).
- Shana, A.; Ouki, S.; Asaadi, M.; Pearce, P.; Mancini, G. The Impact of Intermediate Thermal Hydrolysis on the Degradation Kinetics of Carbohydrates in Sewage Sludge. Bioresour. Technol. 2013, 137, 239–244. [Google Scholar] [CrossRef] [PubMed]
- Astbury, B. Cambi, Because It Matters, Since 1969. Available online: http://nesowea.org/wp-content/uploads/2015/08/09a-Astbury-OWEA-Cambi-Presentation.pdf (accessed on 21 December 2020).
- Abu-Nada, E.; Al-Hinti, I.; Al-Sarkhi, A.; Akash, B. Thermodynamic Modeling of Spark-Ignition Engine: Effect of Temperature Dependent Specific Heats. Int. Commun. Heat Mass Transf. 2006, 33, 1264–1272. [Google Scholar] [CrossRef]
- Roubaud, A.; Favrat, D. Improving Performances of a Lean Burn Cogeneration Biogas Engine Equipped with Combustion Prechambers. Fuel 2005, 84, 2001–2007. [Google Scholar] [CrossRef]
- UMISA Mixed Type Steam Boiler CMS-CR. Available online: https://valtec-umisa.es/en/mixed-type-steam-boiler-cms-cr/ (accessed on 18 December 2020).
- García-Cascallana, J.; Borge-Díez, D.; Gómez, X. Enhancing the Efficiency of Thermal Hydrolysis Process in Wastewater Treatment Plants by the Use of Steam Accumulation. Int. J. Environ. Sci. Technol. 2019, 16, 3403–3418. [Google Scholar] [CrossRef]
- García-Garrido, S. Common Failures in Cogeneration Plants and in Alternative Gas Engines. Available online: http://plantasdecogeneracion.com/editorial/averiasmotoresgas.pdf (accessed on 21 December 2020).
- EUROSTAT Electricity Prices for Non-Household Consumers—Bi-Annual Data (from 2007 Onwards)—Datasets. Available online: https://data.europa.eu/euodp/es/data/dataset/XXs4NqKaSM5cMhhCuozwA (accessed on 21 December 2020).
- Aguas de Burgos Tender to Contract the Service for the Removal and Treatment of Sludge from and/or Collected from the WWTP and the DWTP of Burgos.- Servicio de Retirada y Tratamientos de Lodos Procedentes y/o Recogidos En La EDAR y En La ETAP de Burgos|Aguas de Burgos. Available online: https://aguasdeburgos.com/-servicio-de-retirada-y-tratamientos-de-lodos-procedentes-yo-recogidos-en-la-edar-y-en-la-etap-de-burgos/ (accessed on 21 December 2020).
- Jafarinejad, S. Cost Estimation and Economical Evaluation of Three Configurations of Activated Sludge Process for a Wastewater Treatment Plant (WWTP) Using Simulation. Appl. Water Sci. 2017, 7, 2513–2521. [Google Scholar] [CrossRef] [Green Version]
- Bank of Spain Interest Rate Table. Available online: https://clientebancario.bde.es/pcb/es/menu-horizontal/productosservici/relacionados/tiposinteres/ (accessed on 21 December 2020).
- Molinos-Senante, M.; Hernández-Sancho, F.; Sala-Garrido, R. Cost-Benefit Analysis of Water-Reuse Projects for Environmental Purposes: A Case Study for Spanish Wastewater Treatment Plants. J. Environ. Manag. 2011, 92, 3091–3097. [Google Scholar] [CrossRef]
- Hadidi, L.A.; Omer, M.M. A Financial Feasibility Model of Gasification and Anaerobic Digestion Waste-to-Energy (WTE) Plants in Saudi Arabia. Waste Manag. 2017, 59, 90–101. [Google Scholar] [CrossRef]
- Kleiven, H. Presentation to Delegation from Poland. Available online: https://docplayer.net/20745602-Presentation-to-delegation-from-poland.html (accessed on 21 December 2020).
- Salgado-Somoza, J. EDAR de Ourense: Mejora Del Saneamiento de Ourense—FuturENVIRO—Revista Técnica Bilingüe de Medio Ambiente. Available online: https://futurenviro.es/edar-de-ourense-mejora-del-saneamiento-de-ourense/ (accessed on 20 January 2021).
- Wacławek, S.; Grübel, K.; Silvestri, D.; Padil, V.V.; Wacławek, M.; Černík, M.; Varma, S.R. Disintegration of Wastewater Activated Sludge (WAS) for Improved Biogas Production. Energies 2018, 12, 21. [Google Scholar] [CrossRef] [Green Version]
- Yang, D.; Hu, C.; Dai, L.; Liu, Z.; Dong, B.; Dai, X. Post-Thermal Hydrolysis and Centrate Recirculation for Enhancing Anaerobic Digestion of Sewage Sludge. Waste Manag. 2019, 92, 39–48. [Google Scholar] [CrossRef] [PubMed]
- Phothilangka, P.; Schoen, M.A.; Wett, B. Benefits and Drawbacks of Thermal Pre-Hydrolysis for Operational Performance of Wastewater Treatment Plants. Water Sci. Technol. 2008, 58, 1547–1553. [Google Scholar] [CrossRef] [PubMed]
- Liu, J.; Smith, S.R. A Multi-Level Biogas Model to Optimise the Energy Balance of Full-Scale Sewage Sludge Conventional and THP Anaerobic Digestion. Renew. Energy 2020. [Google Scholar] [CrossRef]
- García Cascallana, J. Evaluación Energética Del Pretratamiento Térmico de Fangos de Una EDAR = Energy Evaluation of the Sludge Thermal Pretreatment of a WWTP. Univ. León 2019. [Google Scholar] [CrossRef]
- Tekener Tekener, S.A. Customized Combustion Systems-Fabricación de Quemadores de Combustión. Available online: http://www.tekener.es/ (accessed on 18 December 2020).
Figure 1.
Scheme of the different scenarios. (a) Scenario 1: conventional mesophilic digestion process. (b) Scenario 2: thermal hydrolysis process (THP) for primary sludge and waste activated sludge (WAS); Scenario 3: THP for WAS. (c) Scenario 4: intermediate thermal hydrolysis process (ITHP). (d) Scenario 5: the Solidstream® process.

Figure 2.
Cambi THP diagram, representing the nomenclature used for performing the calculations. The average cycle is represented.
Figure 2.
Cambi THP diagram, representing the nomenclature used for performing the calculations. The average cycle is represented.

Figure 3.
Representation of the operating point of the engines’ boiler system. (a) Steam injection. (b) No steam injection. (c) Average cycle. <TP>gasom is the average thermal power of the gasometer.
Figure 3.
Representation of the operating point of the engines’ boiler system. (a) Steam injection. (b) No steam injection. (c) Average cycle. <TP>gasom is the average thermal power of the gasometer.

Figure 4.
Economic balance and feasibility analysis for Cases I and II. (a) Initial investment. (b) Net annual cash flow. (c) Payback. (d) Net present value (NPV) at 25 years. The payback period for Scenarios 2 and 3 is not represented because the net annual cash flow was negative for these scenarios.

Table 1.
Results reported in the literature regarding the application of thermal hydrolysis processes for enhancing anaerobic digestion.
Table 1.
Results reported in the literature regarding the application of thermal hydrolysis processes for enhancing anaerobic digestion.
| Process | Characteristics | Results | References |
|---|---|---|---|
| Advanced thermal hydrolysis process | Secondary sludge Direct live steam injection Temperature range: 86–164 °C Maximum pressure: 8.3 bar Time: 21–34 min H2O2 | Better dewaterability when H2O2 is added to the thermal hydrolysis process Sludge solubilisation: 10–70% Organic removal: 40–60% | [2] |
| Thermal hydrolysis | Mixed sludge (33% primary–67% secondary) Temperature range: 110–187 °C Time: 20–40 min | Increase in methane yield: 70% Increase in biodegradability: 70% | [11] |
| Thermal hydrolysis (review of several studies) | Sewage sludge Temperature range: 100–200 °C | VS removal: 38–49.5% Increase in methane production: 29–57% | [4] |
| Low and high temperature hydrolysis | Secondary sludge Low temperature: 60–90 °C Time: 1–72 h High temperature: 120–180 °C Time: 15–180 min | COD solubilisation: 9 times increase Ammonia: 2–3 times increase Biogas: 0–16.5% increase | [12] |
| Thermal hydrolysis (microwave pretreatment) | Sewage sludge Energy applied: 488–2700 kJ/L | Methane yield: 43% increase | [5] |
| Thermal hydrolysis with recuperative thickening | Sewage sludge Temperature: 165 °C Pressure: 6 bar Time: 30 min Thickening of digested sludge and recycling solids back to digestion | Reported no increase in methane yield 100% increase in throughput rates HRT: reduced to a half | [13] |
Table 2.
Thermal hydrolysis processes at the commercial stage and close-to-commercialisation prototypes.
Table 2.
Thermal hydrolysis processes at the commercial stage and close-to-commercialisation prototypes.
| Characteristics | Commercial Name and Company | Heating System | References |
|---|---|---|---|
| Batch process | Cambi™—Cambi | Steam injection | [21] |
| BioThelys™—Veolia Water Technologies | [21] | ||
| Continuous process | HaarslevTM—Haarslev | [22] | |
| tH4+ (Prototype scale)—teCH4+ | [23] | ||
| Exelys™—Veolia Water Technologies | Heat exchangers and steam injection | [24] | |
| Turbotec®—DMT Environmental Technology, Sustec | [25,26] | ||
| Lysotherm®—Eliquo Water and Energy BV | Heat exchangers with thermal oil | [27] |
Table 3.
Parameters of the modern wastewater treatment plant (WWTP). Technical characteristics of units operating in the different WWTP sections that are common to all scenarios evaluated.
Table 3.
Parameters of the modern wastewater treatment plant (WWTP). Technical characteristics of units operating in the different WWTP sections that are common to all scenarios evaluated.
| Thermal Hydrolysis Parameters | Units | References |
|---|---|---|
| Nominal treatment capacity of THP-B6.2 (t TS/d) | 35 | |
| Maximum treatment capacity of THP-B6.2 (t TS/d) | 42 | |
| Outlet sludge stream from the hydrolysis reactor (kg/batch) | 6300 | |
| Outlet flash steam from the hydrolysis reactor (kg/batch) | 30 | |
| Outlet process gases from the hydrolysis reactor (kg/batch) | 8 | |
| TS concentration in inlet sludge stream in the hydrolysis reactor (%) | 12.7 | |
| Relative density of dry sludge (w.u) | 1.4 | [37] |
| Specific heat capacity (kJ/kg °C) | 1.5 | [38] |
| Volume of pulper (m3) | 1 × 15.2 | |
| Volume of reactor (m3) | 2 × 6.9 | |
| Volume of flash-tank (m3) | 1 × 15.2 | |
| Emptying time of reactor to the flash-tank (min) | 10 | |
| Reaction time (min) | 20–30 | |
| Reactor temperature (°C) | 165 | |
| Reactor pressure (kPa) | 700 | |
| Flash-tank temperature (°C) | 107 | |
| Flash-tank pressure (kPa) | 128 | |
| TS concentration of inlet sludge stream to the digester (%) | 10 | [39] |
Table 4.
Specific parameters of the WWTP for each scenario considered.
| Parameter | Scenario 1 | Scenario 2 | Scenario 3 | Scenario 4 | Scenario 5 |
|---|---|---|---|---|---|
| Digestion | |||||
| Temperature (°C) | 37 | 41 | 41 | 37/41a | 37 a |
| VSR of primary sludge (%) | 50 | 50 | … | … | … |
| VSR of WAS (%) | 40 | … | … | … | … |
| VSR of primary hydrolysed sludge (%) | … | … | 60 | … | … |
| VSR of WAS hydrolysed sludge (%) | … | 64 a | 64 a | 68b | 70 a |
| Dewatering | |||||
| Concentration (%) | 20.3 | 30 | 30 | 41 a | 45a |
| Polyelectrolyte (kg/t TS) | 7.5 | 9 | 9 | 11c | 0 a |
| Temperature (°C) | 37 | 41 | 41 | 41a | 100 a |
Table 5.
Specific enthalpies and Cp values calculated for inlet and outlet streams of the recovery boiler. Cp values of exhaust gases were assumed to be equivalent to air.
Table 5.
Specific enthalpies and Cp values calculated for inlet and outlet streams of the recovery boiler. Cp values of exhaust gases were assumed to be equivalent to air.
| Temperature (°C) | Cp (kJ/kg K) | h (kJ/kg) |
|---|---|---|
| Recovery boiler oulet stream | ||
| 142 | 1.016 | 118.1 |
| Recovery boiler intlet stream | ||
| Scenario 1, 482.7 | 1.087 | 478.6 |
| Scenario 2, 483.3 | 1.087 | 479.2 |
| Scenario 3, 504.2 | 1.092 | 502.2 |
| Scenario 4, 498.8 | 1.091 | 496.2 |
| Scenario 5, 486.6 | 1.088 | 482.8 |
Table 6.
Parameters obtained from the sludge line for the economic balance (Case I) calculation.
| Parameter | Scenario 1 | Scenario 2 | Scenario 3 | Scenario 4 | Scenario 5 |
|---|---|---|---|---|---|
| Post-thickening | |||||
| Concentration of mixed sludge (%) | … | 5.4 | 6.7 | 3.8 | 2.3 |
| Mass flow of mixed sludge TS (kg/h) | … | 1499 | 674 | 1042 | 713 |
| Mass flow of mixed sludge (kg/h) | … | 28,138 | 10,305 | 27,682 | 30,690 |
| Mass flow of post-thickening polyelectrolyte (kg/h) | … | 6 | 2.7 | 4.2 | 2.9 |
| Mass flow of post-thickening sludge TS (kg/h) | … | 1454 | 653 | 1012 | 692 |
| Mass flow of post-thickening sludge (kg/h) | … | 9247 | 4156 | 6429 | 4399 |
| Concentration of post-thickening centrates (%) | … | 0.22 | 0.30 | 0.14 | 0.09 |
| Mass flow of post-thickening centrates (kg/h) | … | 20,096 | 6690 | 22,090 | 23,527 |
| * Thermal hydrolysis | |||||
| mTS-reactor, mass of TS outlet reactor (kg/batch) | … | 768 | 768 | 768 | 768 |
| Mpg, flow mass of process gases of pulper outlet (kg/h) | 15 | 6 | 10 | 7 | |
| Mfs-reactor, flow mass of reactor flash steam (kg/h) | … | 56 | 25 | 39 | 27 |
| MTS-reactor, flow mass of reactor TS (kg/h) | … | 1439 | 647 | 1002 | 685 |
| Msludge-pt, flow mass of reactor sludge (kg/h) | … | 11,796 | 5302 | 8203 | 5612 |
| Mls, average consumption of live steam (kg/h) | … | 1385 | 623 | 964 | 660 |
| Mls-specific, average specific consumption of live steam (kg/t TS) | … | 952 | 952 | 952 | 952 |
| Dilution water | |||||
| Msludge-dilution water, mass flow of sludge dilution water (kg/h) | … | 14,813 | 6659 | 10,301 | … |
| TPdiluted-sludge, thermal power of diluted sludge (kW) | … | 1279 | 575 | 890 | … |
| HSE | |||||
| THSE, temperature of HSE sludge (°C) | … | 50 | 51 | 50 | … |
| TPHSE, thermal power of HSE sludge (kW) | … | 807 | 575 | 559 | … |
| Cooling thermal power of HSE (kW) | … | -472 | 0 | -331 | … |
| Mixing ring | |||||
| Temperature of the sludge ring (°C) | 15 | 50 | 32 | 28/50 | 25 |
| Mass flow of sludge ring (kg/h) | 28,138 | 14,813 | 24,493 | 28,138/10,301 | 31,496 |
| Thermal power of the sludge ring (kW) | 474 | 807 | 882 | 474/559 | 889 |
| Solid concentration in sludge ring (%) | 5.4 | 10.0 | 6.1 | 5.4/10 | 4.9 |
| Digesters | |||||
| Number of digesters operating (unit) | 3 | 1 | 2 | 2/1 | 3 |
| Volume of digesters operating (m3) | 18,000 | 6000 | 12,000 | 12,000/6000 | 18,000 |
| Total VSR (%) | 45.2 | 61.9 | 56.5 | 68 | 70 |
| HRT, hydraulic retention time (d) | 27.1 | 17.4 | 20.8 | 18/25 | 27.1 |
| OLR, organic loading rate (kg VS/d m3) | 1.5 | 4.4 | 2.2 | 2.3/2.6 | 1.5 |
| Concentration of digested sludge (%) | 3.6 | 5.5 | 3.6 | 3.8/7.5 | 2.3 |
| Thermal power of digested sludge (kW) | 1161 | 651 | 1112 | 1162/456 | 1441 |
| Dewatering | |||||
| Concentration of dewatered sludge (%) | 20.3 | 30 | 30 | 41 | 45 |
| Mass flow of dewatered sludge (kg/h) | 4977 | 2696 | 2970 | 1968 | 1694 |
| Reduction rate of dewatered sludge (%) | … | −45.8 | −40.3 | −60.5 | −66.0 |
| Mass flow of polyelectrolyte (kg/h) | 7.4 | 6.9 | 7.6 | 8.1 | 2.9 |
| Balance of NH4+ | |||||
| Mass flow of NH4+ (kg/h) | 19.3 | 35.3 | 33.9 | 44.4 | 41.7 |
| Total increment rate of NH4+ (%) | … | 82.9 | 75.6 | 30.1 | 116 |
| Total polyelectrolyte | |||||
| Total mass flow of polyelectrolyte (kg/h) | 7.4 | 12.9 | 10.3 | 12.3 | 2.9 |
| Total increment rate of polyelectrolyte (%) | … | 74.3 | 39.2 | 66.2 | −60.8 |
* Thermal hydrolisis operating with one reactor.
Table 7.
Parameters obtained for the biogas line under assumptions of the economic balance case (Case I).
Table 7.
Parameters obtained for the biogas line under assumptions of the economic balance case (Case I).
| Parameter | Scenario 1 | Scenario 2 | Scenario 3 | Scenario 4 | Scenario 5 |
|---|---|---|---|---|---|
| Digesters | |||||
| Production of biogas (kg/h) | 516 | 677 | 632 | 457/266 | 806 |
| Vbiogas, production of biogas (m3/h) | 465 | 609 | 569 | 411/240 | 726 |
| TPbiogas, thermal power of biogas (kW) | 2741 | 3590 | 3355 | 3837 | 4279 |
| Thermal power of SRE (kW) | 1037 | 0 | 528 | 966 | 970 |
| Thermal power of biogas flow (kW) | 9 | 12 | 11 | 7/5 | 13 |
| Transmission losses (kW) | 190 | 73 | 146 | 127/73 | 219 |
| Pipes and exchangers losses (kW) | 151 | 82 | 141 | 144/59 | 186 |
| Engines | |||||
| TPbiogas-eng, biogas consumption (kW) | 2741 | 2720 | 2977 | 3266 | 3907 |
| TPeg-useful, useful thermal power from exhaust gases (kW) | 526 | 523 | 603 | 653 | 758 |
| Neng, number of engines operating (units) | 2 | 2 | 3 | 3 | 3 |
| DL, degree of loading (%) | 87.7 | 86.9 | 58.5 | 65.9 | 82.4 |
| TPmain-circuit-fw, thermal power of the main circuit (kW) | 531 | 528 | 577 | 640 | 759 |
| <TP>main-circuit-fw, average thermal power of the boiler’s main circuit (kW) | … | 105 | 47 | 73 | 50 |
| Recovery mixed boiler | |||||
| <TP>biogas-rb, biogas consumption (kW) | … | 870 | 378 | 571 | 372 |
| Useful average thermal power of exhaust gases (kW) | … | 173 | 89 | 150 | 119 |
| ki, injection coefficient of live steam (%) | … | 33 | 14.8 | 23 | 15.7 |
| Gasometers | |||||
| TPbiogas-su, thermal power supplied (kW) | … | 1767 | 2170 | 1919 | 2000 |
| TPbiogas-st, thermal power stored (kW) | … | 870 | 378 | 571 | 372 |
| Total process | |||||
| TPdigester, thermal power required for digesters (kW) | 1037 | 576 | 999 | 392 | 999 |
| TPtotal-losses, total losses of thermal power (kW) | 656 | 1912 | 1242 | 2159 | 1700 |
| ηthermal-process, thermal efficiency (%) | 37.8 | 16 | 29.8 | 10.2 | 23.3 |
| ηelectric-process, electric efficiency (%) | 38.2 | 27.1 | 29.4 | 27.6 | 31.9 |
| ηenergy-process, energy efficiency (%) | 76 | 43.1 | 59.2 | 37.8 | 55.2 |
SRE: sludge recirculation exchanger.
Table 8.
Total self-consumption, electric power and specific energy parameters obtained from the economic balance under the assumptions of Case I.
Table 8.
Total self-consumption, electric power and specific energy parameters obtained from the economic balance under the assumptions of Case I.
| Parameter | Scenario 1 | Scenario 2 | Scenario 3 | Scenario 4 | Scenario 5 |
|---|---|---|---|---|---|
| Total self-consumption of electric power | |||||
| EPadditional, additional self-consumption (kW) | … | 197.3 | 139.4 | 189.2 | 177.2 |
| EPsaved, consumption saving (kW) | … | 129.8 | 75.1 | 72.2 | 66.1 |
| Total self-consumption (kW) | … | 67.5 | 64.3 | 125 | 111.1 |
| Electric power balance | |||||
| Electric efficiency of engines (%) | 38.3 | 38.2 | 35.3 | 36.2 | 37.8 |
| EPeng-gross, gross electric power (kW) | 1048 | 1039 | 1050 | 1183 | 1478 |
| %SC, percentage of self-consumption (%) | 0 | 6.5 | 6.1 | 10.6 | 7.5 |
| EPeng-net, net electric power (kW) | 1048.0 | 971.5 | 985.7 | 1058.0 | 1366.9 |
| Specific energy parameters | |||||
| SBP, specific production of biogas (m3/t ST) a | 310 | 406 | 380 | 434 | 484 |
| TPbiogas-specific, specific biogas production (MWh/t ST) | 1829 | 2395 | 2238 | 2560 | 2855 |
| EPgross-specific, gross specific electric power (MWh/t ST) | 699 | 693 | 700 | 766 | 986 |
| EPnet-specific, net specific electric power (MWh/t ST) | 699 | 648 | 657 | 705 | 911 |
| SPVVS, specific production of biogas by VS removed (m3/t VS) | 900 | 900 | 900 | 900 | 900 |
| Increment of gross biogas production (%) | .. | 31 | 22.4 | 40 | 56.1 |
| Increment of net biogas production (%) | … | −0.8 | 8.6 | 19.2 | 42.5 |
| Increment of gross electric power production (%) | … | −0.9 | 0.2 | 12.9 | 41 |
| Increment of net electric power production (%) | … | −7.3 | −6 | 0.9 | 30.3 |
Table 9.
Results obtained annually and used for the calculation of cash-flow parameters under Case I. The second row corresponds to the increment obtained when compared with Scenario 1. A negative sign represents a decrease.
Table 9.
Results obtained annually and used for the calculation of cash-flow parameters under Case I. The second row corresponds to the increment obtained when compared with Scenario 1. A negative sign represents a decrease.
| Parameter | Scenario 1 | Scenario 2 | Scenario 3 | Scenario 4 | Scenario 5 |
|---|---|---|---|---|---|
| Biogas production (MWh/year) | 24,020 | 31,458 | 29,443 | 35,022 | 37,192 |
| … | 7438 | 5423 | 11,002 | 13,172 | |
| Net electric power (MWh/year) | 9180 | 8510 | 8635 | 9268 | 11,974 |
| … | −670 | −545 | 88 | 2794 | |
| Dewatered sludge (t/year) | 40,445 | 23,617 | 26,026 | 16,250 | 14,550 |
| … | −16,828 | −14,419 | −24,195 | −25,895 | |
| Polyelectrolyte (t/year) | 64.8 | 113 | 90.2 | 100.7 | 24.5 |
| … | 48.2 | 25.4 | 35.9 | −40.3 |
Table 10.
Economic balance and feasibility analysis for Cases I and II. The second row corresponds to the increment obtained when compared with Scenario 1. A negative sign represents a decrease.
Table 10.
Economic balance and feasibility analysis for Cases I and II. The second row corresponds to the increment obtained when compared with Scenario 1. A negative sign represents a decrease.
| Parameter | Scenario 1 | Scenario 2 | Scenario 3 | Scenario 4 | Scenario 5 |
|---|---|---|---|---|---|
| Economic balance and feasibility analysis (Case I) | |||||
| Electric power (€/year) | 844,604 | 782,920 | 794,420 | 852,656 | 1,101,608 |
| … | −61,684 | −50,184 | 8052 | 257,004 | |
| Dewatered sludge (€/year) | 465,622 | 271,831 | 299,458 | 198,429 | 170,802 |
| … | 193,791 | 166,164 | 267,193 | 294,820 | |
| Polyelectrolyte (€/year) | 149,095 | 259,009 | 207,524 | 247,820 | 58,429 |
| … | −110,814 | −58,429 | −98,725 | 90,666 | |
| Operation costs (€/year) | … | 119,584 | 119,584 | 132,267 | 135,321 |
| … | −119,584 | −119,584 | −132,267 | −135,321 | |
| Economic balance and feasibility analysis ( Case II) | |||||
| Electric power (€/year) | 844,604 | 782,920 | 905,280 | 942,172 | 1160,488 |
| … | −61,684 | 60,676 | 97,568 | 315,884 | |
| Dewatered sludge (€/year) | 465,622 | 271,831 | 299,458 | 198,429 | 170,802 |
| … | 193,791 | 166,164 | 267,193 | 294,820 | |
| Polyelectrolyte (€/year) | 149,095 | 259,909 | 207,524 | 247,820 | 116,858 |
| … | −110,804 | −58,429 | −98,725 | 32,237 | |
| Operation costs (€/year) | … | 67,584 | 50,371 | 90,915 | 91,978 |
| … | −67,584 | −50,371 | −90,915 | −91,978 | |
Publisher’s Note: MDPI stays neutral with regard to jurisdictional claims in published maps and institutional affiliations. |
© 2021 by the authors. Licensee MDPI, Basel, Switzerland. This article is an open access article distributed under the terms and conditions of the Creative Commons Attribution (CC BY) license (http://creativecommons.org/licenses/by/4.0/).
Share and Cite
MDPI and ACS Style
García-Cascallana, J.; Barrios, X.G.; Martinez, E.J. Thermal Hydrolysis of Sewage Sludge: A Case Study of a WWTP in Burgos, Spain. Appl. Sci. 2021, 11, 964. https://0-doi-org.brum.beds.ac.uk/10.3390/app11030964
AMA Style
García-Cascallana J, Barrios XG, Martinez EJ. Thermal Hydrolysis of Sewage Sludge: A Case Study of a WWTP in Burgos, Spain. Applied Sciences. 2021; 11(3):964. https://0-doi-org.brum.beds.ac.uk/10.3390/app11030964
Chicago/Turabian StyleGarcía-Cascallana, José, Xiomar Gómez Barrios, and E. Judith Martinez. 2021. "Thermal Hydrolysis of Sewage Sludge: A Case Study of a WWTP in Burgos, Spain" Applied Sciences 11, no. 3: 964. https://0-doi-org.brum.beds.ac.uk/10.3390/app11030964
Note that from the first issue of 2016, this journal uses article numbers instead of page numbers. See further details here.