Article

Diauxie Studies in Biogas Production from Gelatin and Adaptation of the Modified Gompertz Model: Two-Phase Gompertz Model

by
Carolina Scaraffuni Gomes
*,
Martin Strangfeld
and
Michael Meyer
Forschungsinstitut für Leder und Kunststoffbahnen (FILK) gGmbH, Freiberg, 09599 Saxony, Germany
*
Author to whom correspondence should be addressed.
Submission received: 18 December 2020 / Revised: 15 January 2021 / Accepted: 22 January 2021 / Published: 25 January 2021

Abstract

:
The anaerobic degradation of gelatin results in a two-phase cumulative biogas production curve, i.e., diauxie behaviour. The modified Gompertz model is normally used to fit these curves but due to the diauxie it would result in a less accurate representation. Furthermore, this inhibition slows down the production of biogas in batch reactors. This study adapted the modified Gompertz model to fit cumulative biogas production curves with diauxie behaviour and to investigate the inhibition that leads to this diauxie. Results show that the two-phase Gompertz model can fit diauxie curves with high accuracy and that diauxie curves are not a direct consequence of the accumulation of volatile fatty acids produced in the process of anaerobic digestion.

1. Introduction

Kinetic studies are used in batch trials to determine the biogas formation potential of a substrate. The Gompertz model is one of the most frequently used sigmoidal models to fit growth data [1]. In cases where the process shows a delay in biogas production, other equations may not represent the process adequately, so the cumulative biogas production can be described by the Gompertz equation [2]. Furthermore, one of the advantages of the Gompertz model is that it can be used to fit growth with or without a lag-phase.
Zwietering et al. [3] suggested a re-parameterisation of the equation to turn the mathematical parameters of the equation into parameters with a biological meaning. This re-parameterisation is now known as the modified Gompertz model (MGM) and is typically applied to bacterial growth data. Equation (1) and Figure 1 show the sigmoidal function of Gompertz, modified as described by Zwietering et al. [3].
The three phases of the growth curve are represented in the modified Gompertz model by three parameters. The maximum specific growth rate (µm) is the tangent in the inflection point, the asymptote (A) is the maximum value reached in the y-axis, and the lag time (λ) is the x-axis intercept of this tangent [3].
y = A   exp exp µ m e A λ t + 1
where y is the relative population size, t is the time, and e is Euler’s number.
In the field of biogas production through anaerobic digestion, MGM has been used assuming that the biogas production rate is proportional to the bacterial growth and metabolic activity. The cumulative biogas production curve has the shape of a sigmoidal curve with three phases—lag, growth, and asymptotic phases. At the beginning of anaerobic digestion bacteria have to adapt to the new conditions and there is no production of biogas. In this initial step enzymes are produced, and the hydrolysis phase starts. This lag-phase depends on the type of substrate and presence of ready nutrients. The presence of volatile fatty acids is discussed to extend the lag-phase [4]. Furthermore, certain pollutants present in the system have been reported to prolong the lag-phase [5]. During the growth phase there is an exponential growth of the microbial population and exponential production of biogas. All nutrients needed for growth are present in excess and the population increases with a maximum specific growth rate. This rate depends on the microbial genetic potential, culture medium and conditions in the bioreactors (temperature, pH, substrate load, volatile fatty acids concentration, agitation, etc.). During the asymptotic phase the depletion of nutrients and the accumulation of inhibitory products lead to interruption of the microorganism growth and the end of the production of biogas [4].
The MGM has already been used to fit the cumulative biogas or methane production curves of anaerobic digestion of several substrates in batch studies. Good fit was verified for gelatin and leather waste [6], plants [7], municipal solid wastes [2,8,9], food and kitchen waste [10,11], agricultural waste [12,13], industrial waste [14,15,16], biochar (by-product of the pyrolysis of a plant material) [4], and manure [17,18] in mono- or co-digestion with other substrates.
Some substrates can show a two-phase cumulative biogas production curve when digested. There is initial biogas production, which ceases temporarily, and after a plateau-phase, biogas production resumes. This behaviour is also named diauxie. This is the case when using denatured collagen-based materials, such as gelatin, and pre-denatured leather waste as substrate to produce biogas with a substrate to inoculum ratio of 1.5 or higher, which was demonstrated in a previous work [19].
As previously discussed [19], many reasons were attributed in literature to the diauxie behaviour. These are for instance the separate degradation of low and high complexity substrates [20,21,22,23], adaptation of microorganisms [24], or excessive production of volatile fatty acids [25]. Furthermore, the presence of certain pollutants and its metabolites in the system could be the cause of inhibition [26]. The same work [19] studied the hypothesis of inhibition by volatile fatty acids to cause diauxie. Results led to the conclusion that the production of high quantities of volatile fatty acids in the process of acidogenesis overloaded the methanogenic system leading to accumulation of these acids, which caused a plateau-phase characteristic for diauxie. However, it is necessary to consider the possibility that the inhibition of the methanogenesis has a different reason. In this case, the accumulation of volatile fatty acids would only be a consequence of this inhibition.
The MGM has long been used to fit cumulative biogas and methane production curves. However, without any modification a one growth phase model is incapable of accurately representing the diauxie behaviour. If the first phase of diauxie is represented by the lag-phase or if both phases are represented as one and the plateau-phase is ignored by the model, this will lead to a lower coefficient of determination. For instance, El-Mashad [27] verified methane production during the estimated lag-phase and did not consider the MGM with sufficient precision to predict the lag-phase. Kim and Kim [25] considered the first phase of diauxie as the lag-phase of the model and tested different mixtures of substrates to reduce the first phase of the diauxie. Kafle and Kim [28] showed both cases. For some substrates the first phase of diauxie is represented in the lag-phase and for others both phases are represented as one.
The aim of the present study was to adapt the well-known MGM to fit cumulative biogas production with diauxie behaviour. Subsequently, the efficacy of the two-phase Gompertz model was tested for cumulative biogas production curves using gelatine as a substrate to produce biogas. The second aim was to determine whether or not the observed diauxie behaviour is caused by accumulation of volatile fatty acids. Results show that an adapted model can fit diauxie curves with high R2 and diauxie behaviour was not caused by the accumulation of volatile fatty acids.

2. Materials and Methods

Gelatin was used as substrate to produce biogas. The modified Gompertz model was adapted as the two-phase Gompertz model and tested to fit the resulting cumulative biogas production curves with diauxie behaviour. Furthermore, biogas production trials with the injection of volatile fatty acids were performed and different chemical analyses were used to determine the inhibitory effect of these acids on the anaerobic digestion.

2.1. Materials

Bovine hide gelatin (260 g Bloom, type B) from Gelita AG (Eberbach, Germany) was used as a substrate in the biogas trials. Gelatin is denatured collagen and chemically the same as collagen only differing by its structure. It is known that this substrate is soluble and can easily be degraded by enzymes. Mesophilic anaerobic sludge from a local sewage treatment plant with a hydraulic retention time of 30 days and an organic loading rate of 1.1 kg m−3 d−1 (mass in organic dry matter) was used as inoculum. Substrate and inoculum were analysed regarding water content [29] and organic matter [30] (Table 1).

2.2. Biogas Production Trials

Biogas batch trials were performed under mesophilic conditions (37 °C ± 2 °C) according to the guideline VDI (Verein Deutscher Ingenieure e.V.) 4630 [31] in duplicate or triplicate. Tightly sealed glass flasks (65 mL) were used as bioreactors. A digital manometer (Leo 3 Keller) was used to measure the biogas production. The use of different substrate quantities was compared using substrate to inoculum ratios (S/I) of 0.4, 1.4, 1.8, and 2.3 to investigate the effect of the substrate load using gelatin as a substrate. The mass of the substrate and inoculum was considered in organic dry matter. The bioreactors were agitated in a shaking device Julabo SW-20C (Seelbach, Germany) at 150 rpm. To ensure that the biological activity of the inoculum was in order, microcrystalline cellulose was used as reference substrate.
The cumulative biogas production (quantity of generated biogas per quantity of substrate fed) and the biogas formation potential (maximum biogas generated from a defined quantity of substrate) are given in norm litres (273 K and 1013 hPa) per kg of organic dry matter of the added substrate (L kg−1).
The accumulation of volatile fatty acids could be the cause of the diauxie behaviour [25] and a high concentration of these acids was already verified for the anaerobic digestion of gelatin in a previous work [19]. In order to verify the inhibitory effect of accumulation of volatile fatty acids during anaerobic digestion, trials using gelatin as substrate were injected with volatile fatty acids. The chosen S/I ratio was 0.4 (exact values were between 0.43 and 0.46), which is known to cause no diauxie [19]. Injection was done when the biogas production was expected to increase. The evaluated volatile fatty acids were: Acetic acid (Carl Roth, Karlsruhe, Germany, 100% p.a.), propionic acid (Sigma-Aldrich, Munich, Germany, 99.5% ACS), and isobutyric acid (Sigma-Aldrich, Munich, Germany, 99.5% p.a.). The acid concentrations tested were 4, 3 and 2 g L−1 for acetic acids, 2, 1, 0.3, and 0.2 g L−1 for propionic acid, and 1, 0.5, and 0.3 g L−1 for isobutyric acid. Acids were injected into the bioreactors on the second day of digestion. The same quantity of acid was injected again on the fifth day of digestion.

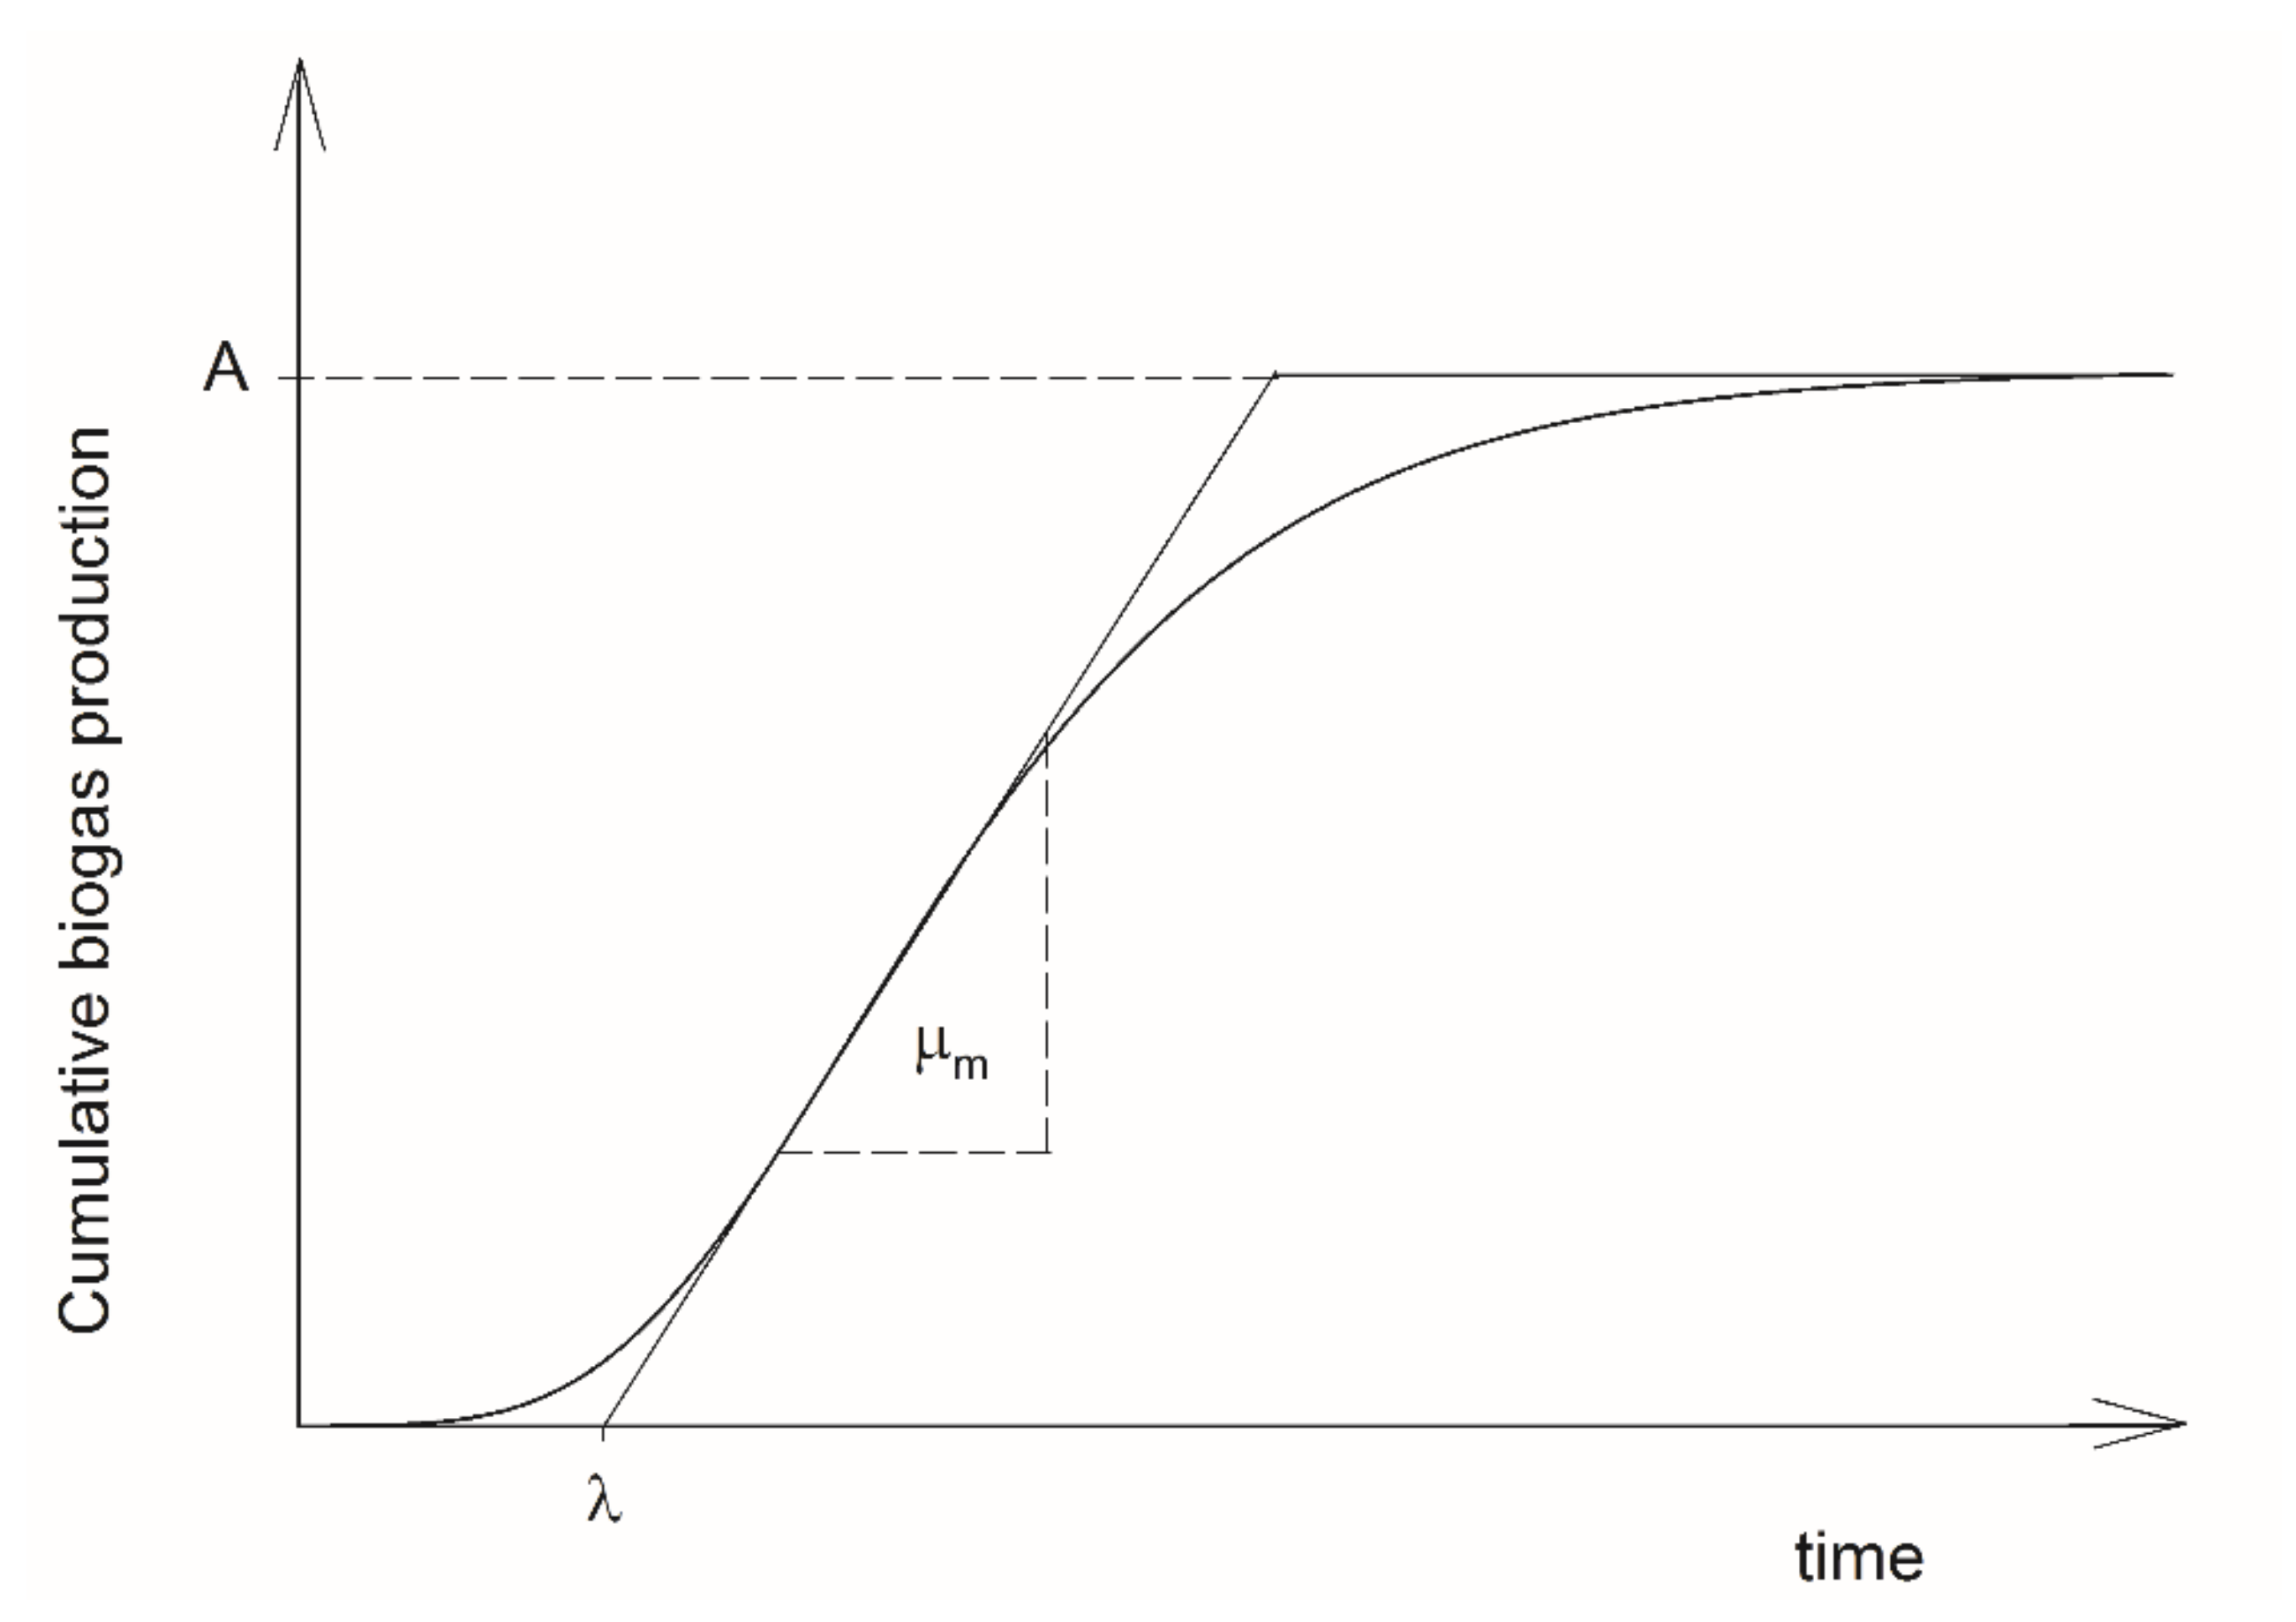
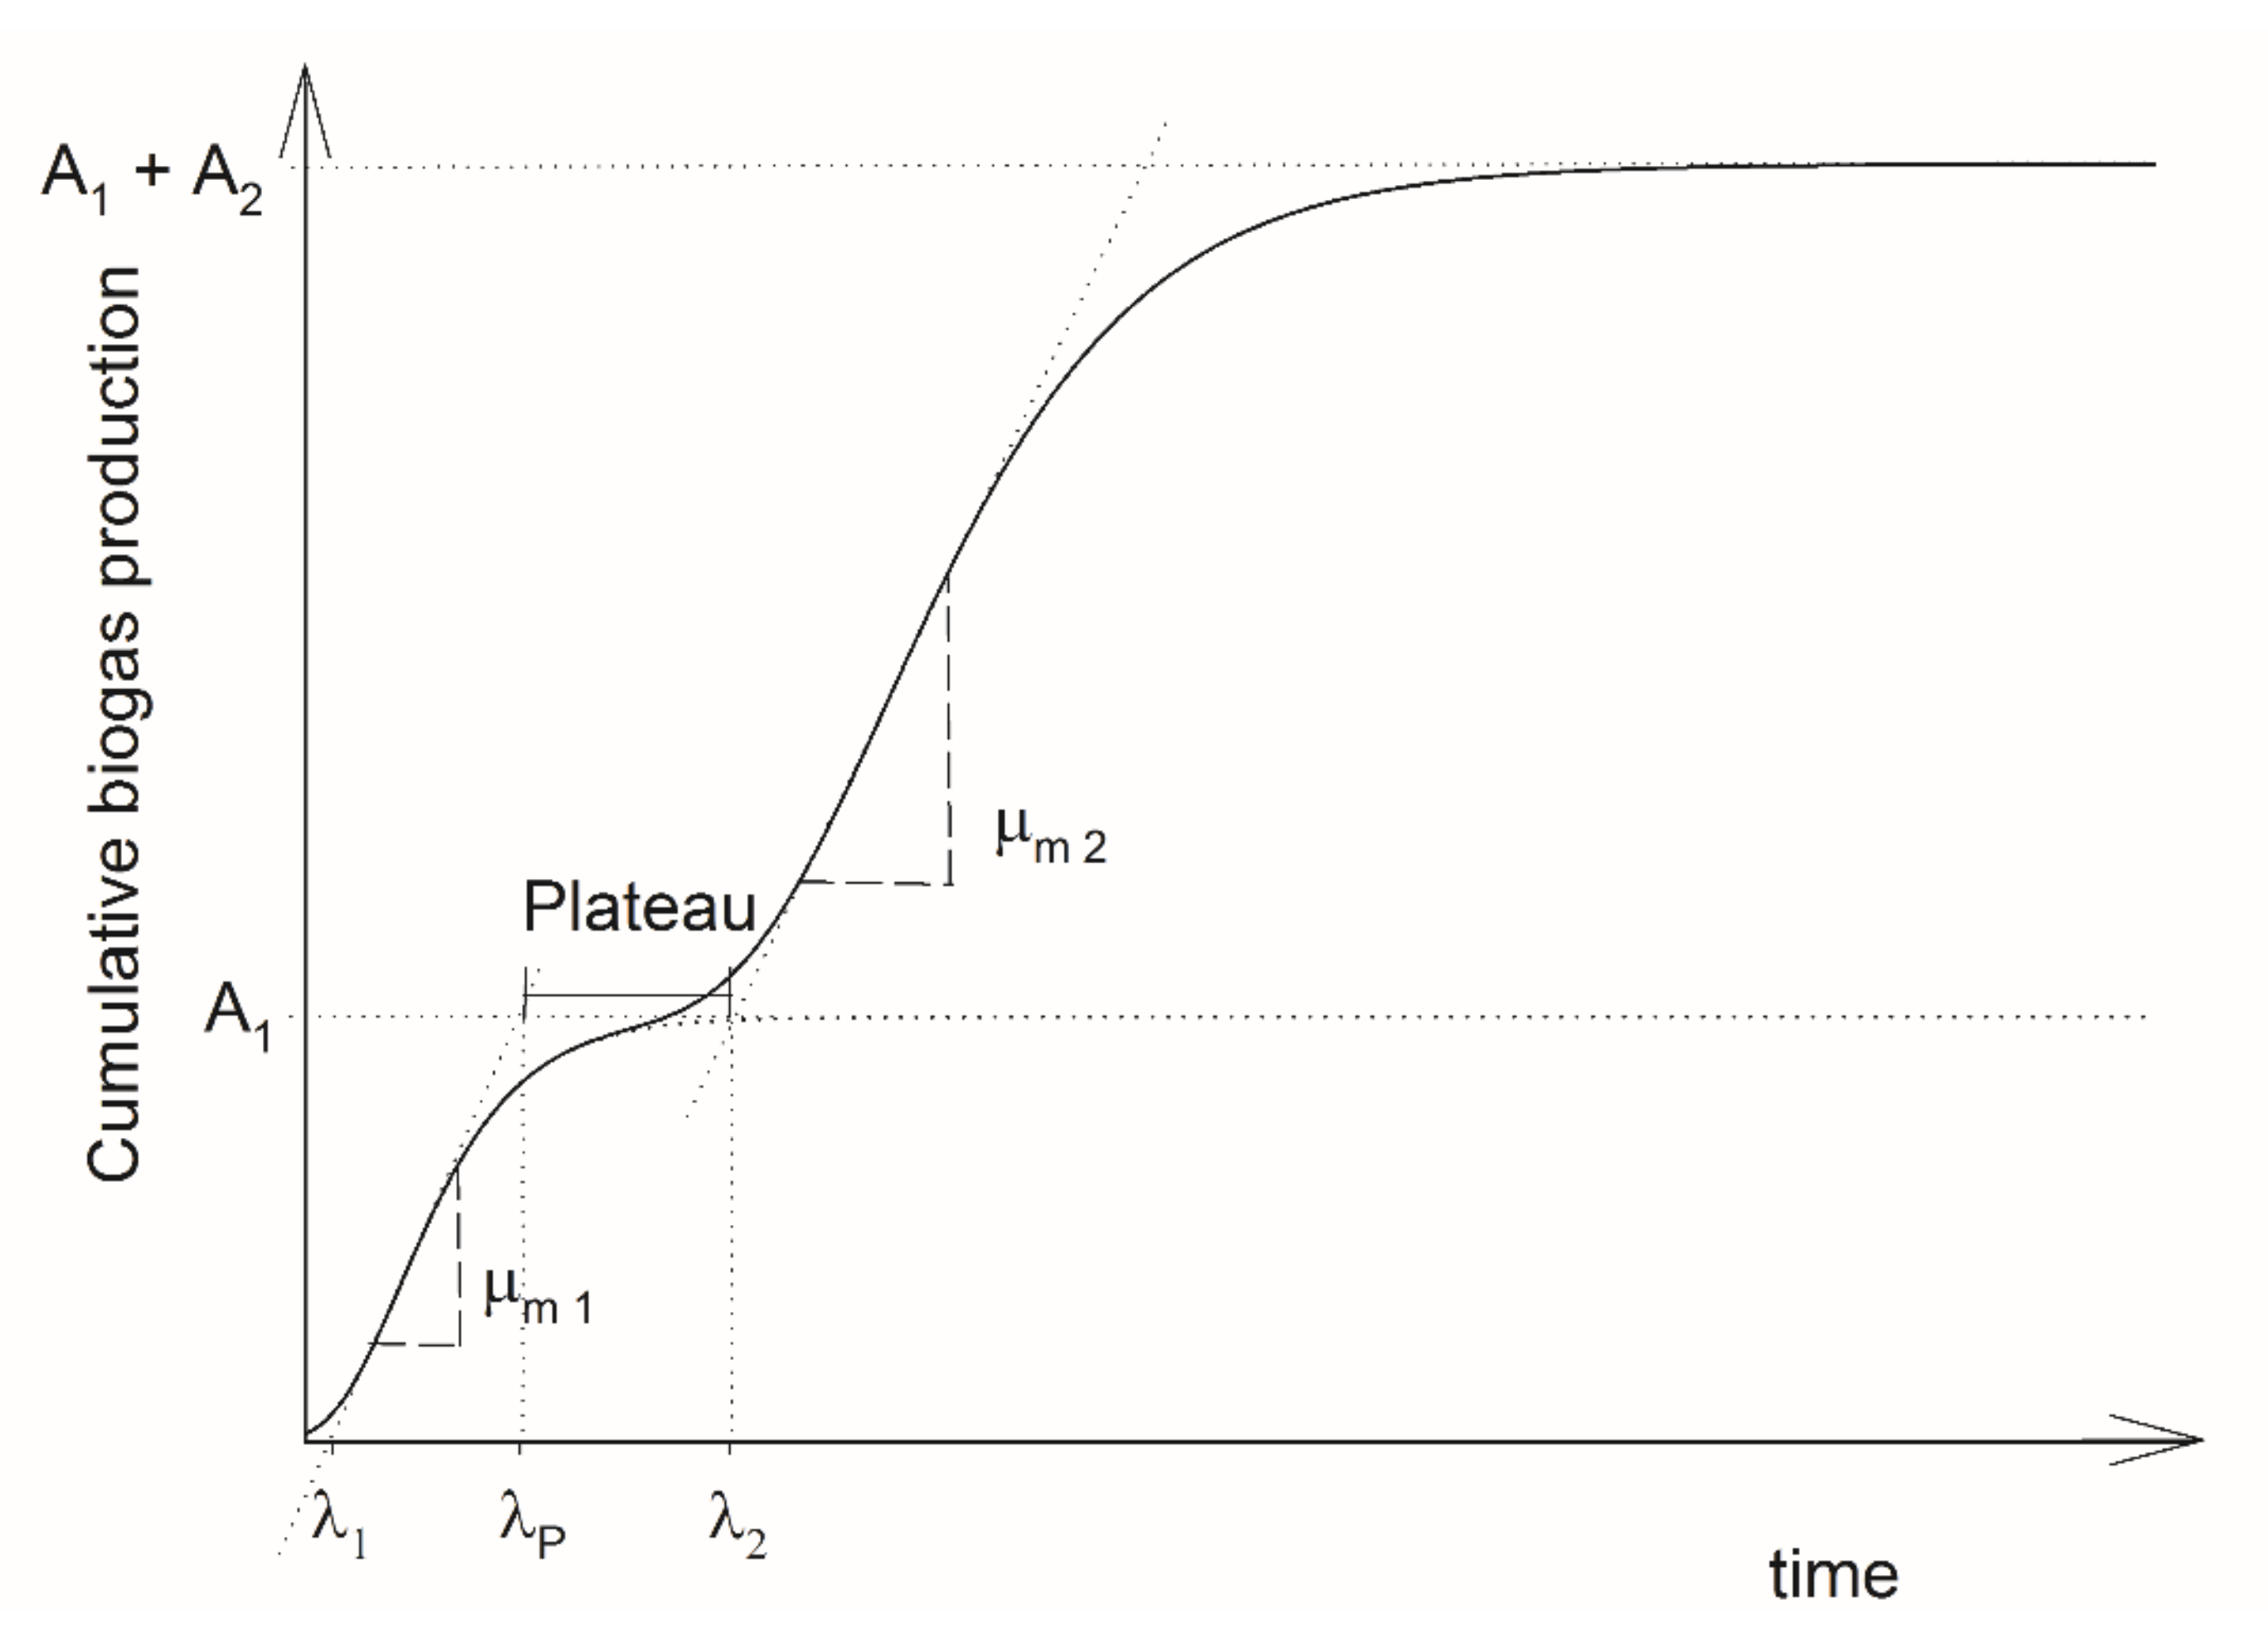
2.3. Two-Phase Gompertz Model

The MGM was adapted to sum up the two-phase cumulative biogas production present in the diauxie. The modified model named two-phase Gompertz model (TGM) is shown in Figure 2 and Equation (2). The two-phase Gompertz model was used to fit the experimental data obtained in this study. It is also possible to use this equation to fit a cumulative biogas production with only one phase or presumably more than two phases.
For the TGM, the duration of the lag-phase at the beginning of digestion (λ1, d), the switch to the second phase of digestion (λ2, d), the biogas formation of both phases (Ai, L kg−1), and the maximum biogas production rate of each phase of digestion (µmi, L kg−1 d−1) are represented with Equation (2).
y = i = 1 n A i   exp exp µ mi e A i λ i t + 1
where y is the cumulative biogas production (L Kg−1), e is the Euler’s number, and t is the time (d).
The biogas formation potential of the substrate can be found adding the biogas formation of both phases (A1 + A2). The duration of the plateau-phase of diauxie is the difference between the beginning of the second phase (λ2) and the beginning of the plateau (λP, d). The beginning of the plateau-phase is the intersection between the line y = A1 with the line that crosses the x-axis at λ1 and the inflection point ( d 2 y d t 2 = 0 ) of the first phase of the cumulative biogas production curve. SigmaPlot version 13.0 was used to fit the model. The regression is determined by a least-square approach using the Marquardt-Levenberg algorithm.

2.4. Statistical Methods

The hypothesis on distribution of the biogas formation potential of the substrate (A1 + A2) in dependence of the added volatile fatty acid and its concentration was verified with Shapiro–Wilk tests. Furthermore, Pearson correlations were used to test if there is a relationship between A1 + A2 and the added volatile fatty acid concentration. Finally, linear regression analyses were performed to examine whether the added volatile fatty acid concentration variable significantly predicted the value of A1 + A2.

2.5. Analyses of the Final Biomass

At the end of the biogas production process, the final biomass was analysed regarding pH, water content [29] and organic matter [30]. In order to identify the gelatin content of the biomass samples, the content of the amino acid hydroxyproline was determined [32]. This amino acid is known to be almost exclusively present in collagen-based materials [33]. Photometric analyses were performed using a Spectroquant® Cell Test Kits (Merck, Darmstadt, Germany) for quantitative investigation of the biomass of the bioreactors. The ammonium content (Number 1.14739.0001) and the volatile fatty acids (Number 1.01749.0001) were measured on the basis of the biomass samples.

3. Results

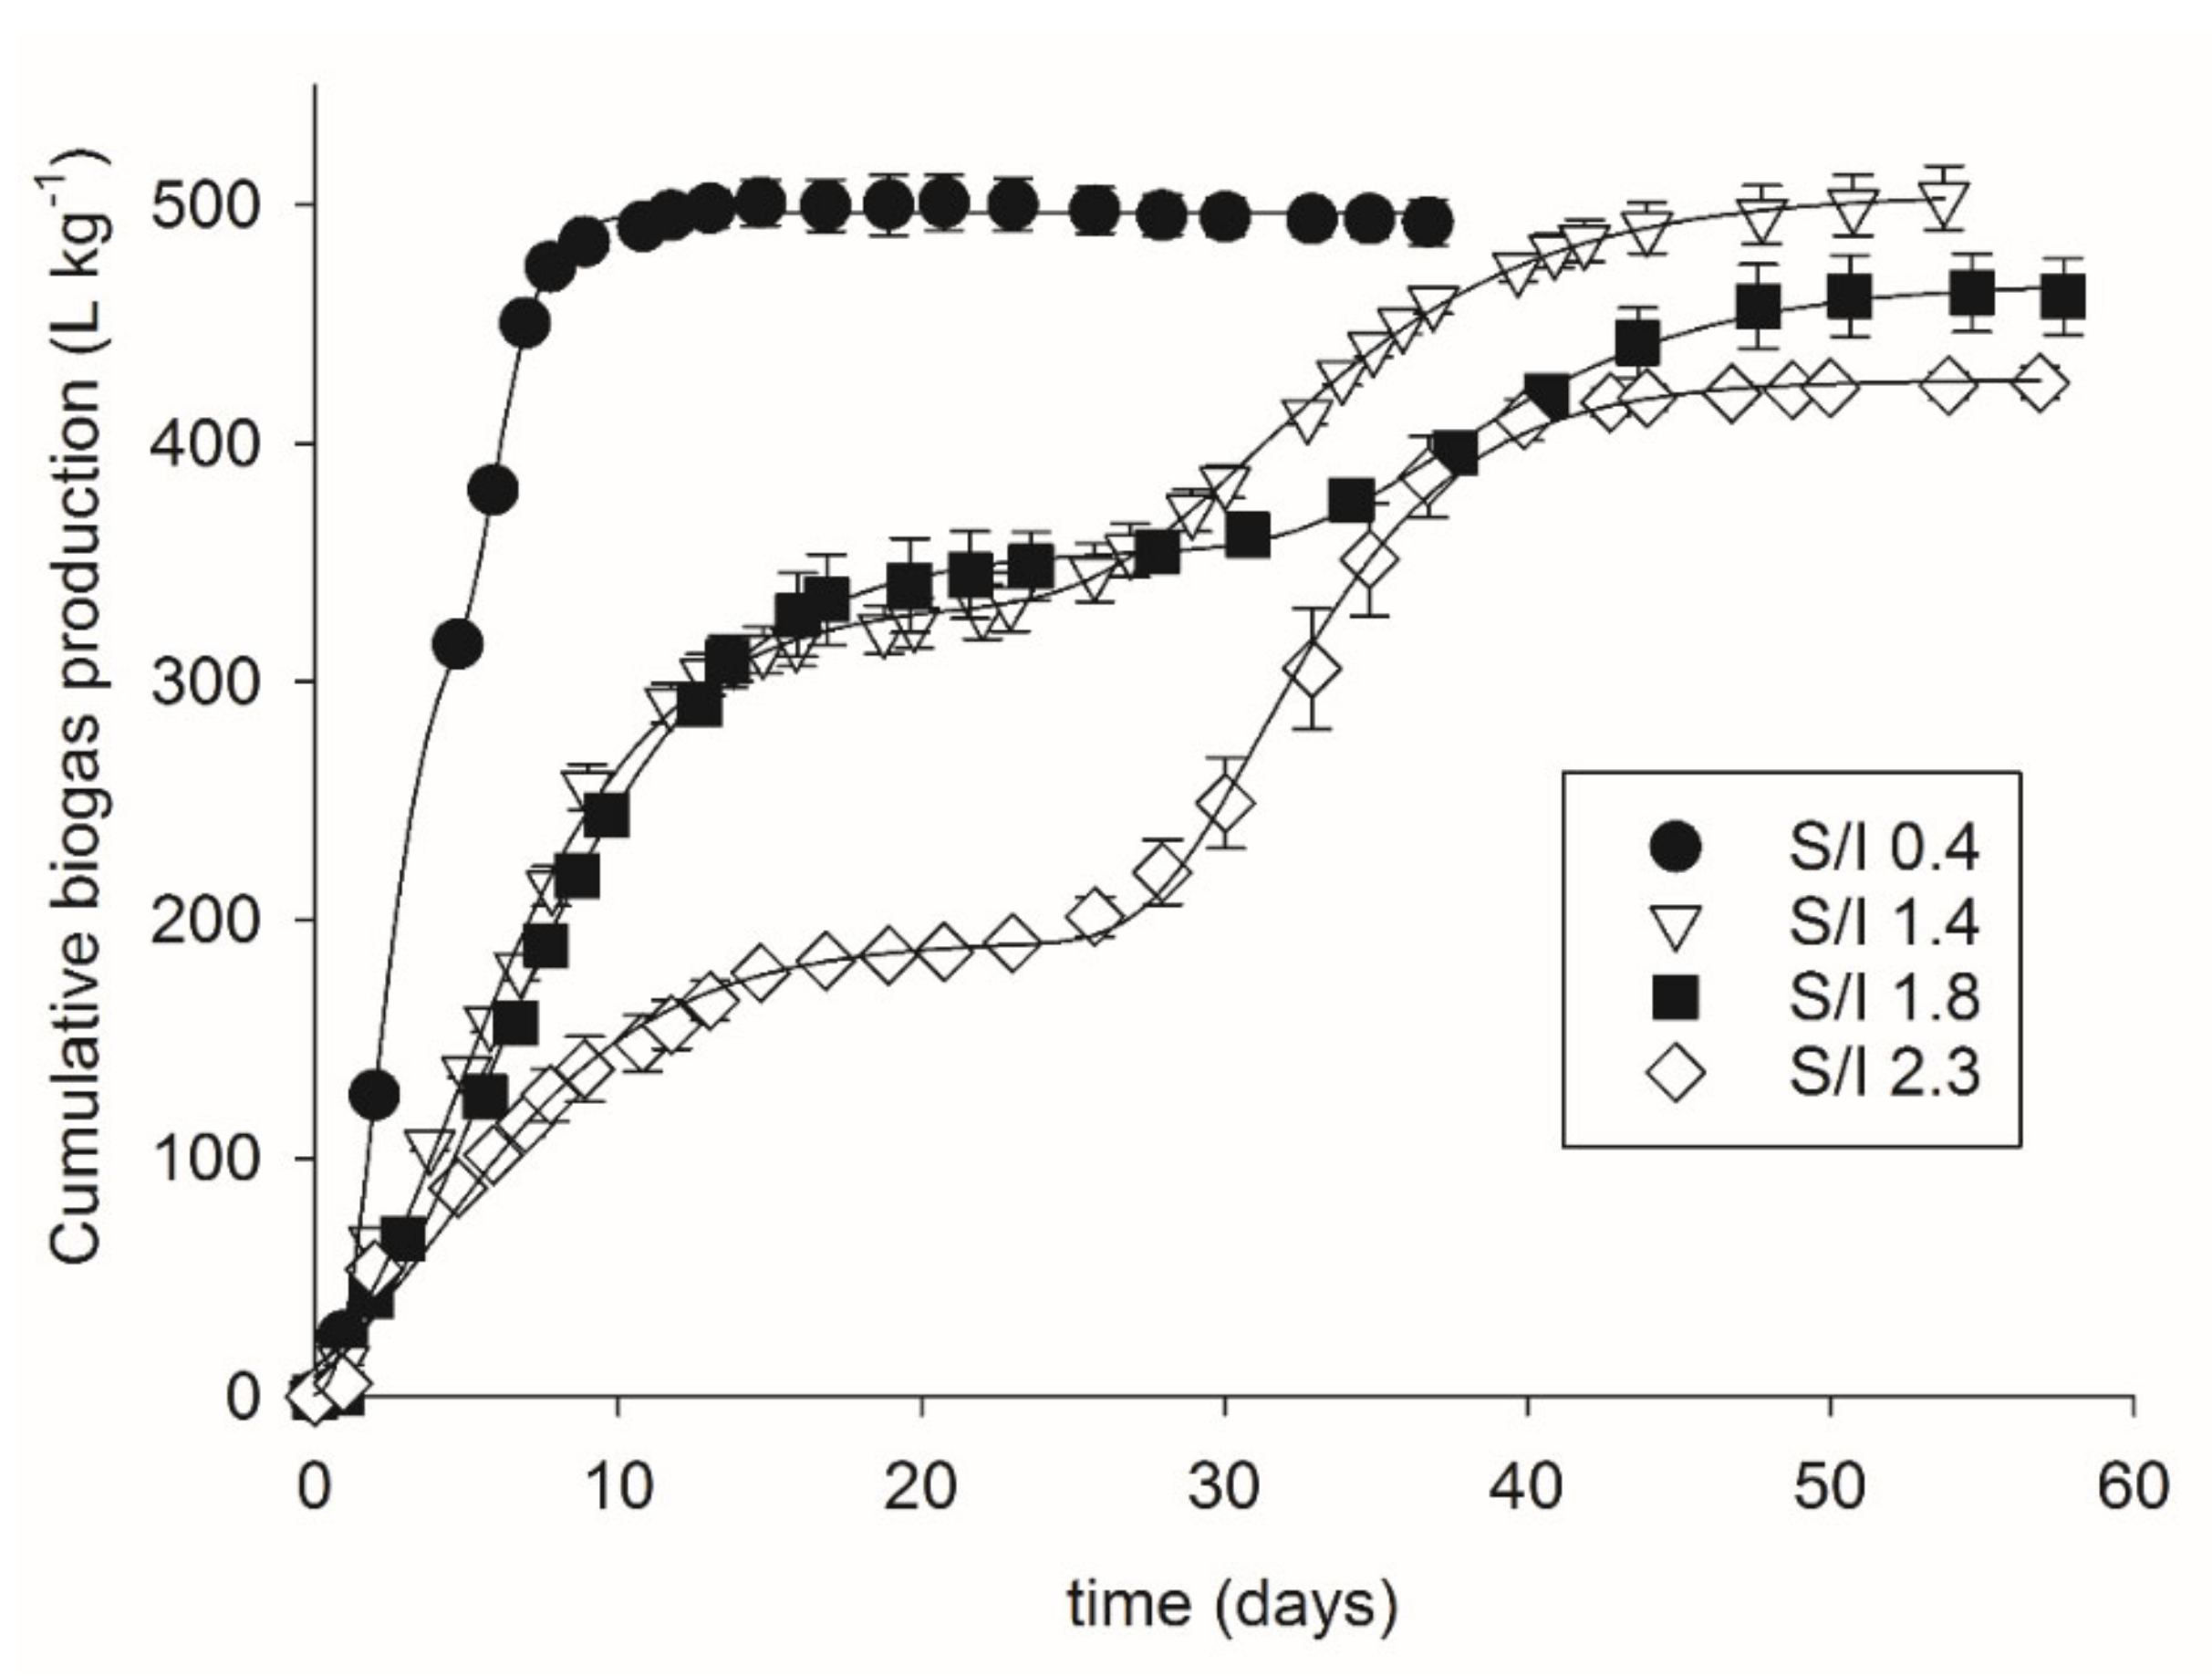
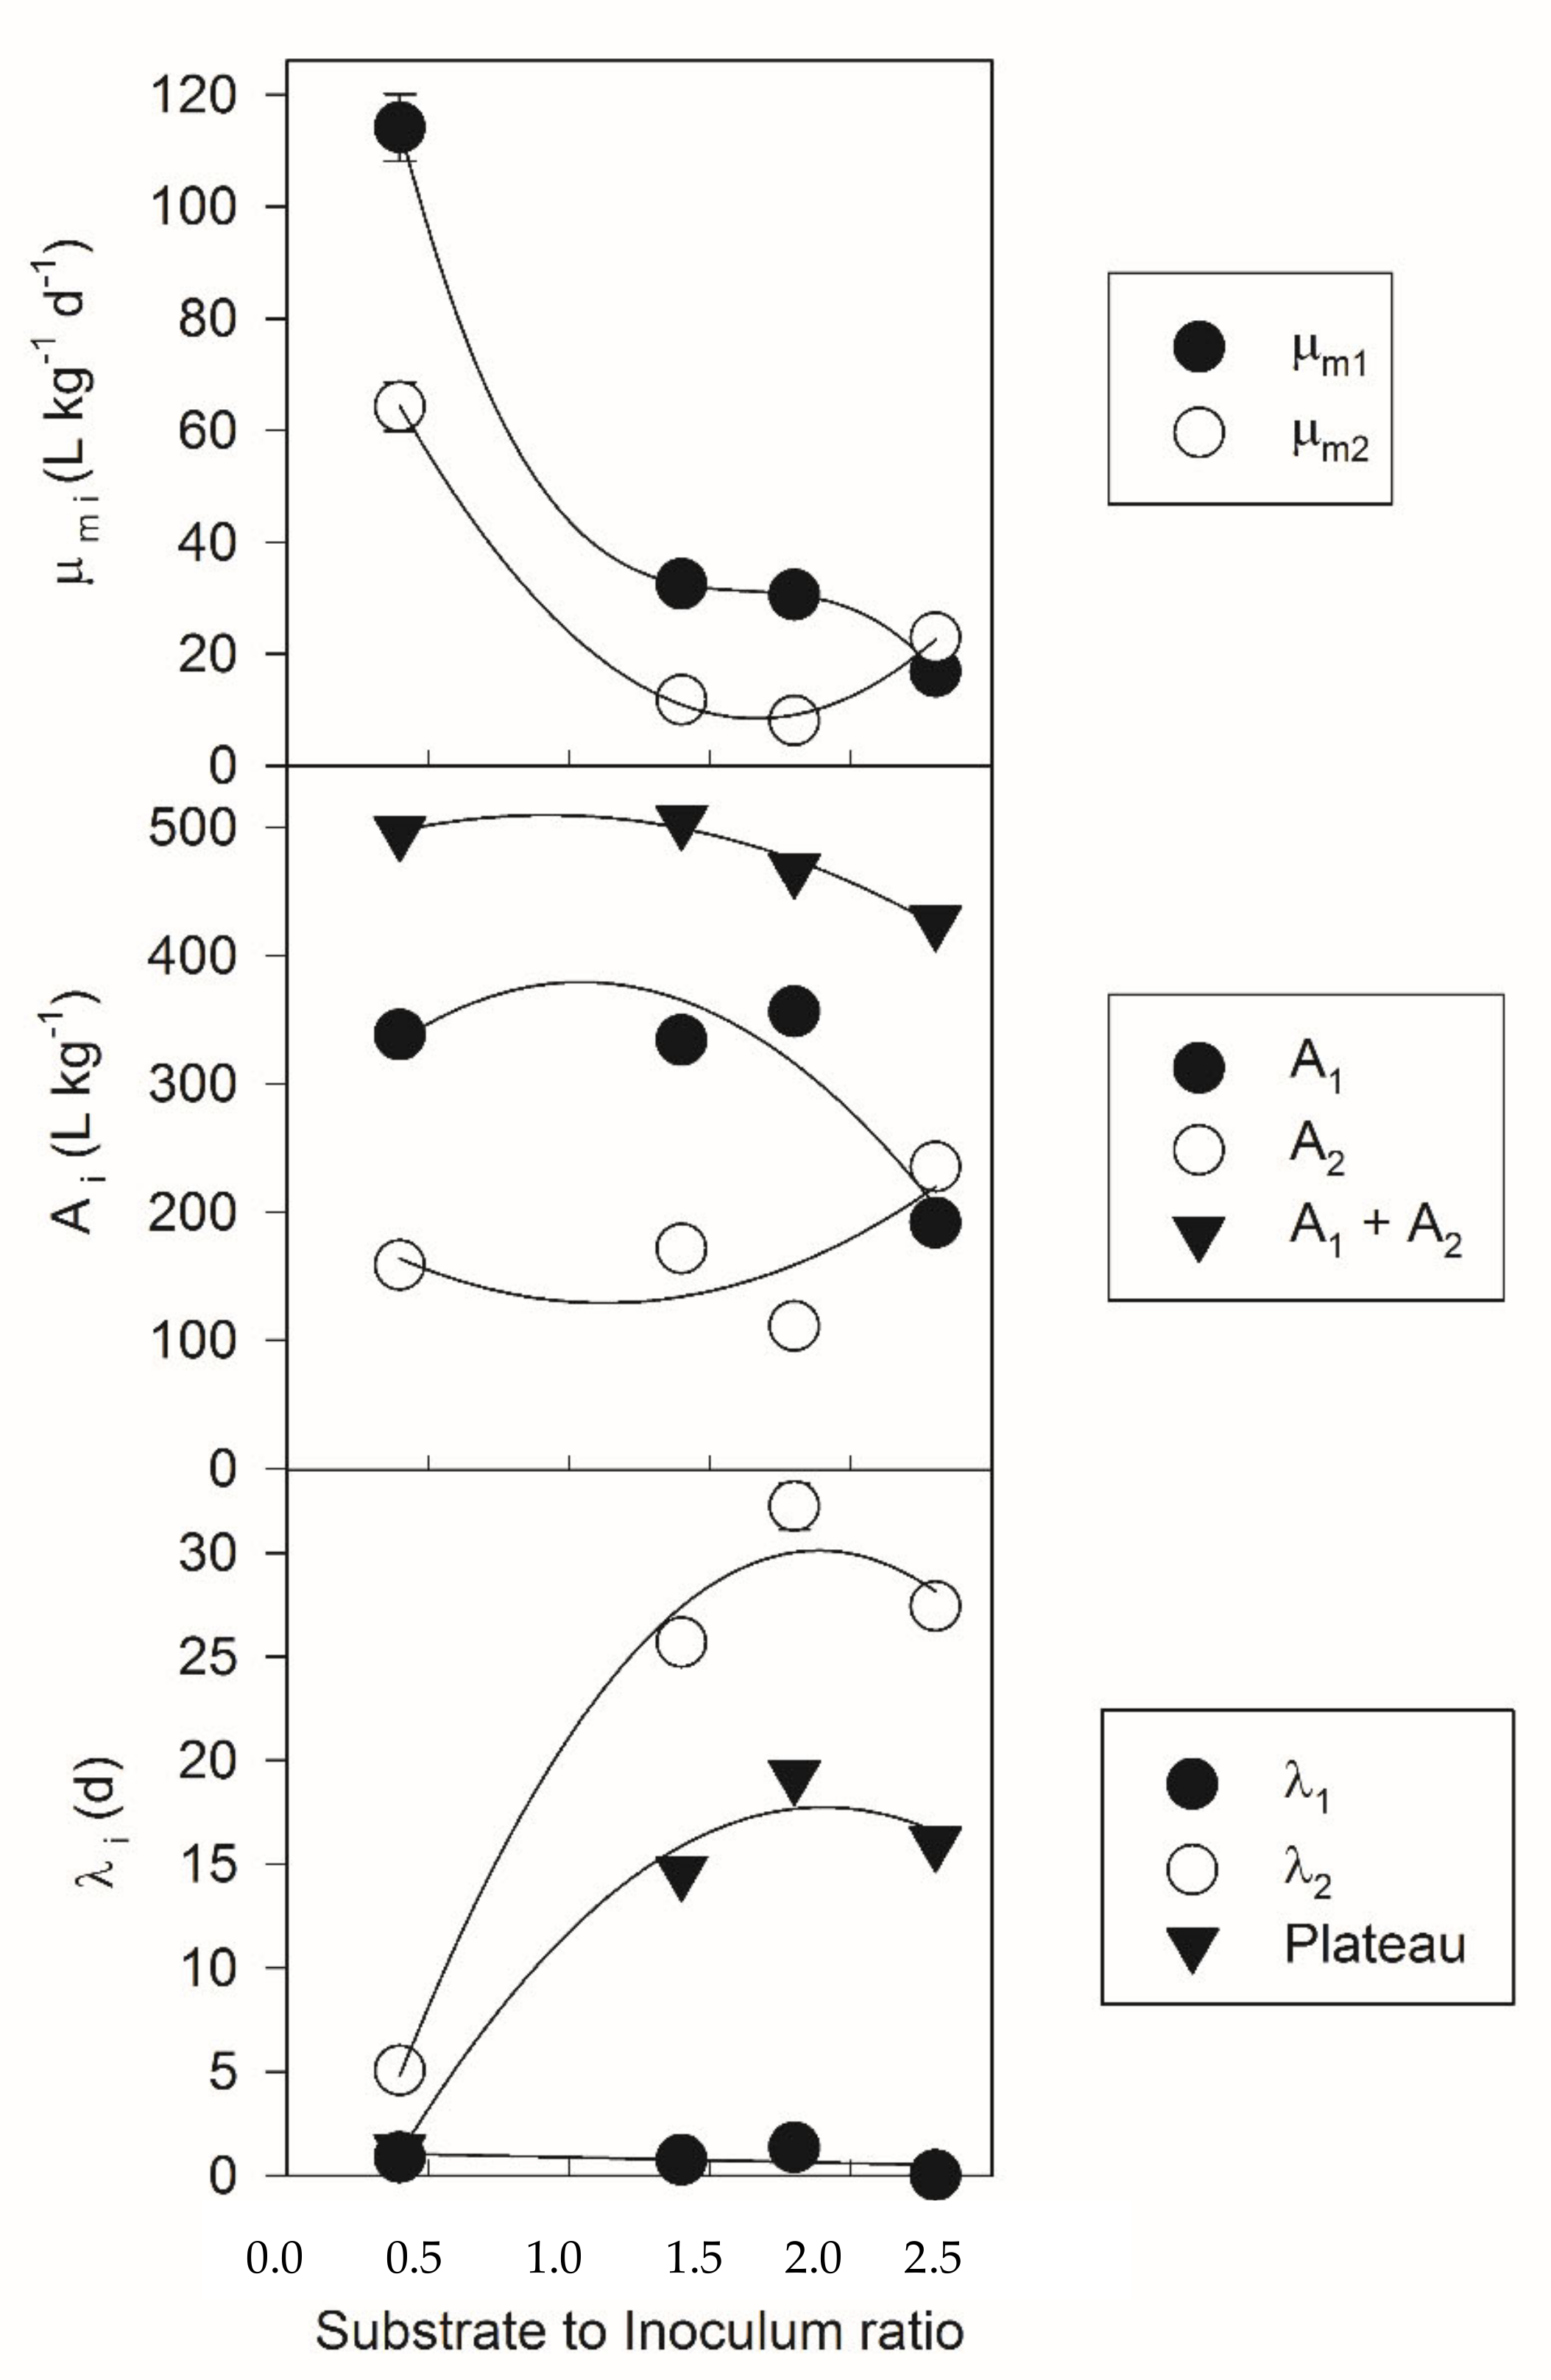
3.1. Two-Phase Gompertz Model

The two-phase Gompertz model was used to fit results from the trials using different substrate to inoculum ratios (S/I). Figure 3 compares cumulative biogas production curves obtained for these biogas trials and Figure 4 shows the parameters found with the TGM. The error bars in Figure 3 represent the standard deviation for the experimental data.
The cumulative biogas production curves with diauxie behaviour could be fitted by the adapted equation. For all tested S/I ratios the coefficient of determination (R2) was higher than 0.998 indicating that the model fitted the experimental data very well. As shown in Figure 3, a clear plateau during biogas production, characteristic of diauxie, was verified for the S/I ratios of 1.4 or higher. For the S/I ratio of 0.4, a slight diauxie was verified with a short plateau starting on the 4th day of digestion.
Figure 4 shows the parameters of the two-phase Gompertz model. In all trials a lag-phase was found at the beginning of anaerobic digestion (λ1) of 1.3 days or shorter. All trials with an S/I ratio of 1.4 or higher switched to the second phase between days 25.7 and 32.2 (λ2) and the duration of the diauxie plateau was found to be between 14.6 and 19.3 days, while the trial with an S/I ratio of 0.4 shows a plateau of only 1.2 days.
The maximum biogas production rate of the first phase decreased with an increase in the substrate to inoculum ratio. The S/I ratio of 0.4 showed the highest µm1 value of 114.2 L kg−1 d−1, which dropped to 32.5 L kg−1 d−1 for an S/I ratio of 1.4. After that, µm1 appears to be constant and decreases again for an S/I ratio of 2.3 to the lowest value of 16.8 L kg−1 d−1. The parameter µm1 shows similar values only for the S/I ratios 1.4 and 1.8. The maximum biogas production rate of the second phase showed different behaviour only for the highest tested S/I ratio. For the S/I ratio of 2.3, µm2 increased and the values of µm1 and µm2 were almost the same.
The biogas formation of the first phase was found to be very similar for the S/I ratios up to 1.8. However, the S/I ratio of 1.8 showed a slightly higher A1 but this is compensated by A2, which was the lowest among the tested S/I ratios. The trial with the highest S/I ratio was the only trial with A2 higher than A1. The sum of both phases, the biogas formation potential, shows a slow decline with the increase of the S/I ratio.
Table 2 shows the ratios of the parameters of both phases of diauxie to evaluate the contributions of each phase. If the first phase has a higher contribution than the second phase of diauxie A1/A2 and µm1m2 ratios will have a value higher than 1.
The trials using S/I ratios of 0.4, 1.4 and 1.8 showed A1/A2 and µm1m2 ratios higher than 1, meaning they have a strong first phase and a weak second phase. The trial with an S/I ratio of 0.4 needs a very short period of time to reach its biogas formation potential, reaching A1 + A2 before the other trials could switch to the second phase. Furthermore, the plateau-phase is very short, meaning that diauxie inhibition is very low and could be ignored. The first phase of the biogas production for the trials with an S/I ratio of 1.4 and 1.8 shows almost identical values of µm1 and λ1, and similar biogas formation. However, the trial with an S/I ratio of 1.8 showed a weaker second phase with lower values of A2 and µm2, resulting in higher ratios. Furthermore, the trial with an S/I ratio of 1.8 showed a longer plateau (almost three days longer) and a higher value of λ2 than the trial with an S/I ratio of 1.4. On the other hand, the trial with an S/I ratio of 2.3 showed A1/A2 and µm1m2 ratios lower than 1. This trial had the weakest first phase and the strongest second phase of the S/I ratios tested.
Table 3 shows the results of characterization of the final biomass and the degradation degree of hydroxyproline for each S/I ratio. The hydroxyproline degradation was estimated considering that gelatin prior to digestion has a hydroxyproline content of 13.1 ± 0.2% and the inoculum has no hydroxyproline content.
Degradation of hydroxyproline at the end of anaerobic digestion was almost complete for all S/I ratios tested indicating that the substrate was efficiently degraded. However, the final biomass shows 45.5 to 49.1% of organic matter. The pH values of the biomass at the end of anaerobic digestion were found to be between 8.3 and 8.5, which is slightly above the pH value considered as optimum for acetogenic bacteria and methanogenic archaea [34].
The ammonia content in the bioreactors using an S/I ratio of 1.4 was measured at the end of anaerobic digestion. Ammonia is present in the final biomass at a concentration of 0.04 g NH4 N L−1, which is below the inhibition level of 1.5 to 3.0 g NH4 N L−1 [35], and causes no problem to anaerobic digestion.

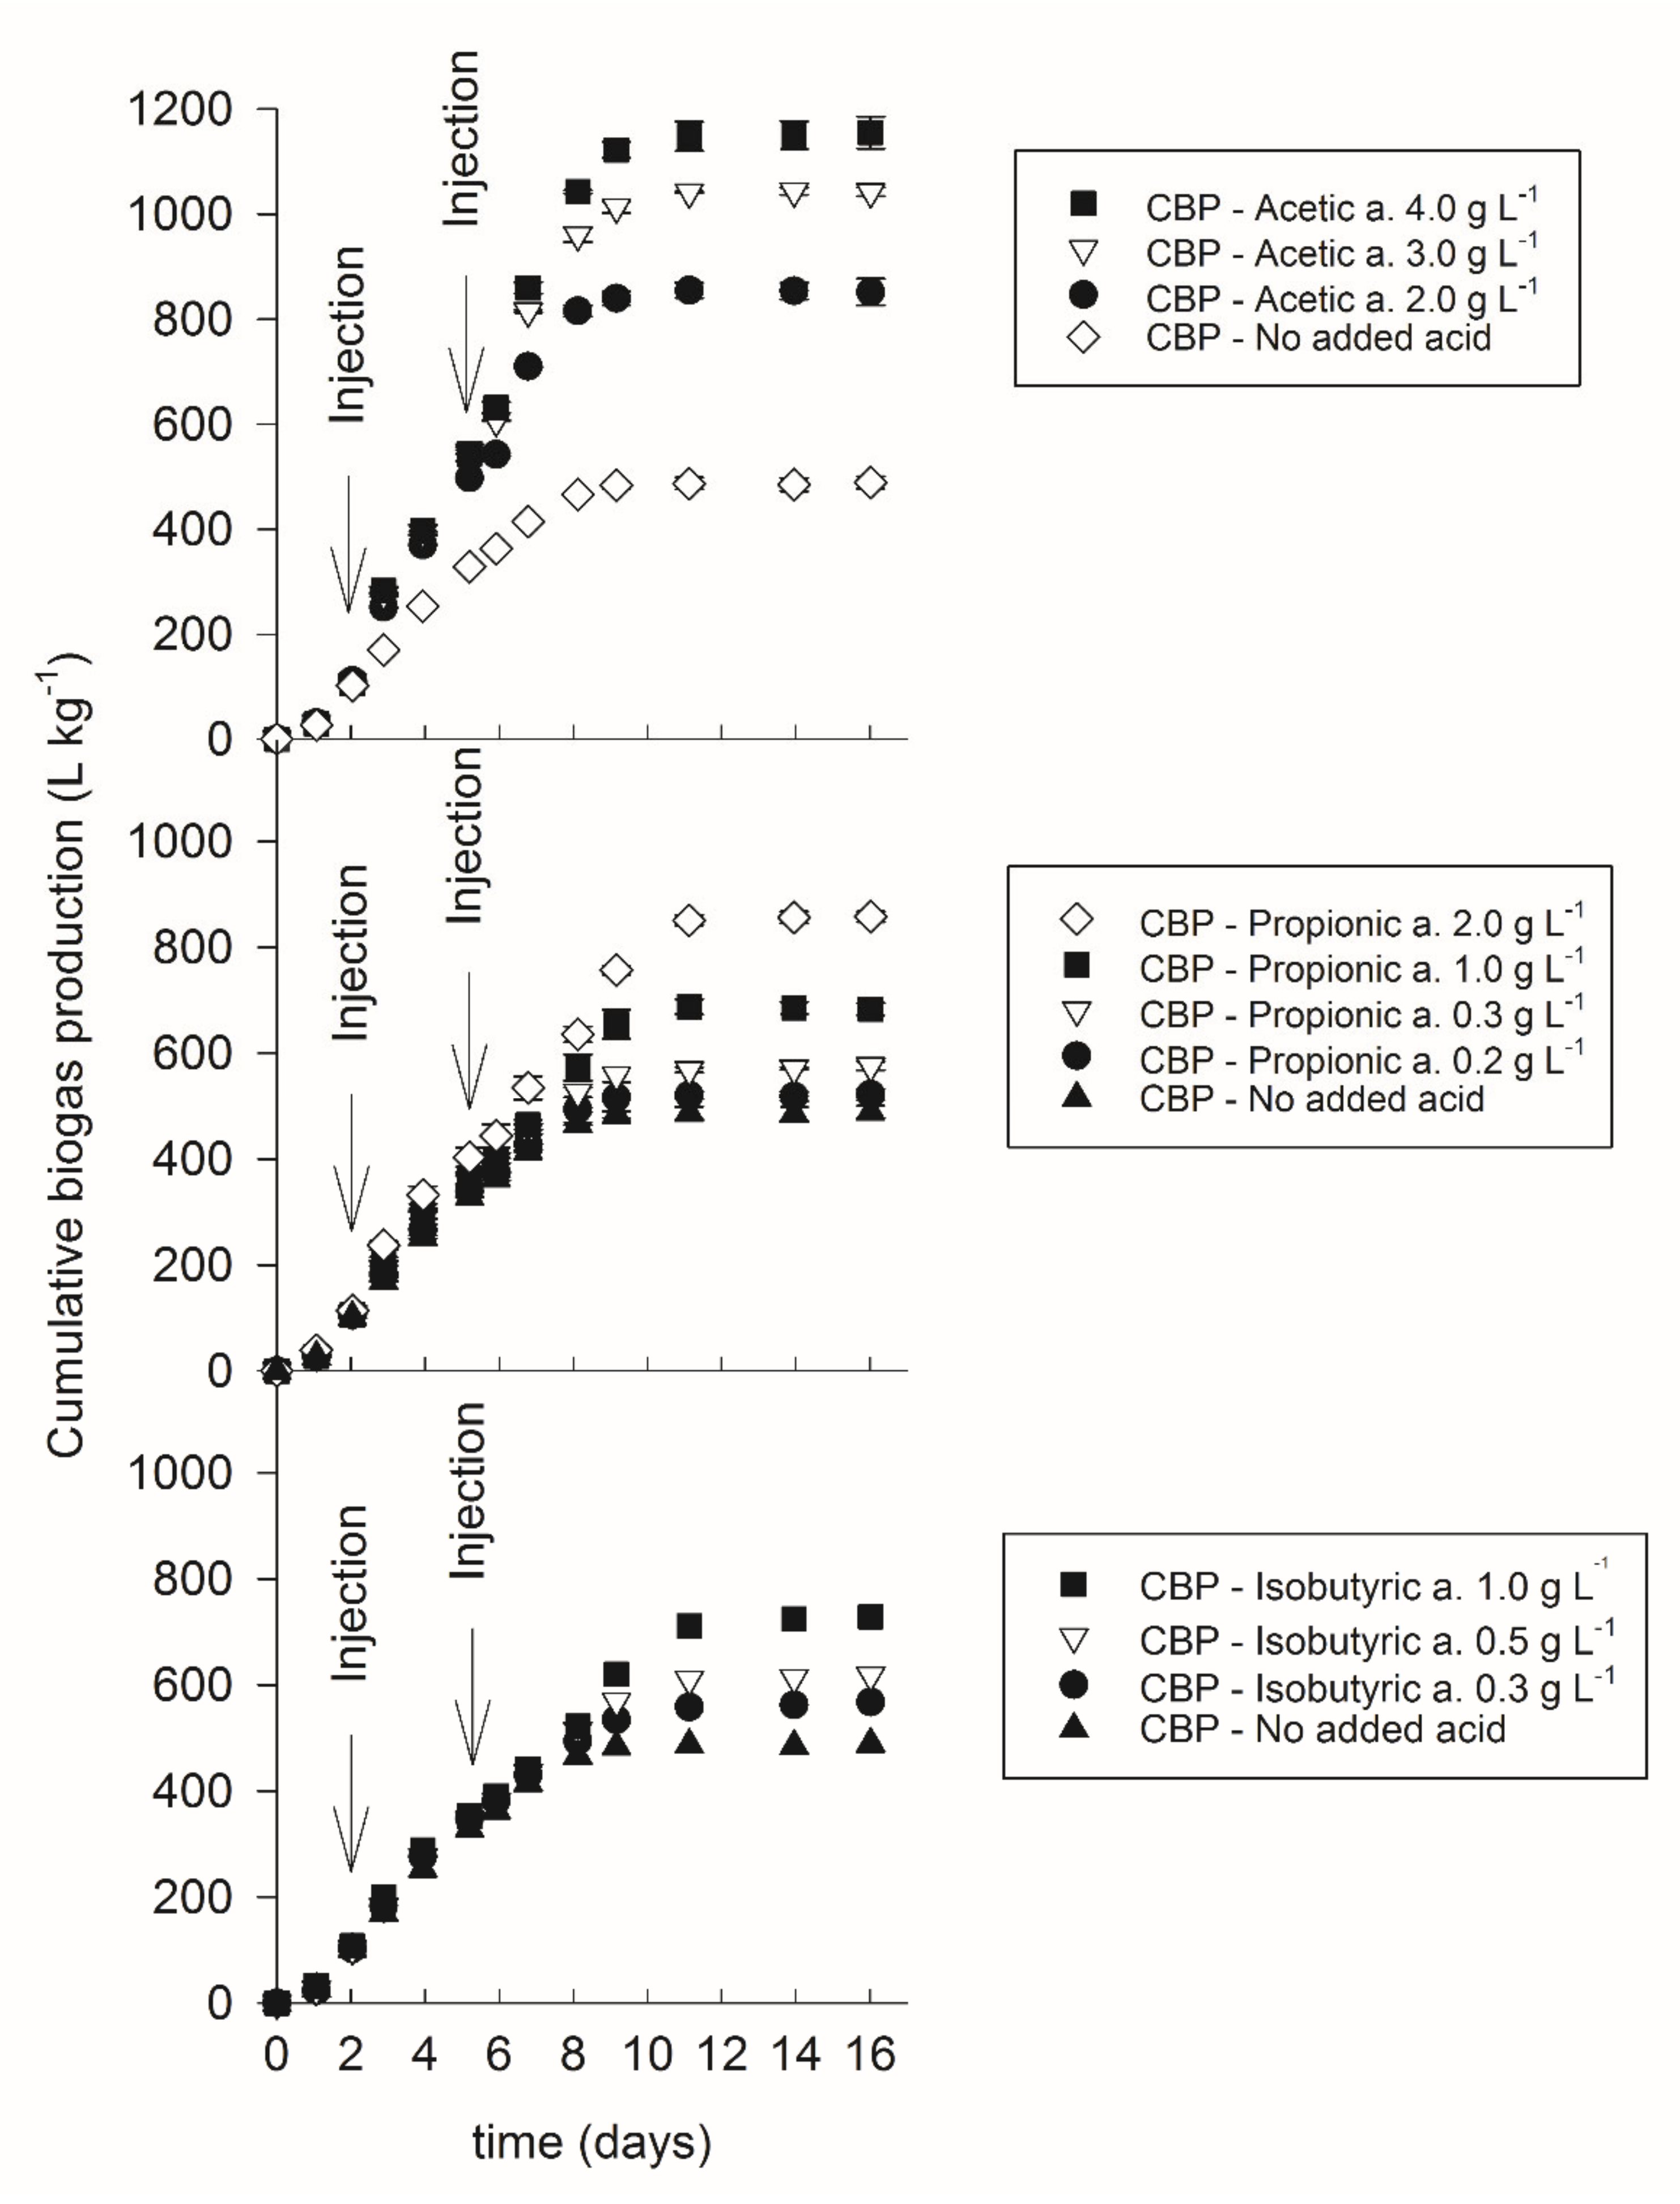
3.2. Inhibition by Volatile Fatty Acids

To investigate the inhibitory influence of volatile fatty acids, acetic acid, propionic acid, and isobutyric acid were injected into the bioreactors. The acid concentrations used in the experiments were based on inhibitory concentrations found in literature for these acids [36,37].
Figure 5 shows the cumulative biogas production curves resulting from the biogas trials with injection of acids. The injection time, the injected acid, and its expected concentration in the bioreactor are also represented. The error bars represent the standard deviation for the experimental data.
All trials with injected volatile fatty acids showed a higher biogas production than the reference reactor in which no volatile fatty acids were injected. The higher the injected acids concentration the higher the biogas formation potential.
The Shapiro–Wilk test was performed to test the underlying distribution of the experimental data, the Pearson correlation was used to test the relationship between the two variables and the linear regression analysis to establish this relationship in an equation. Results found for the statistical methods are shown in Table 4.
Results of the Shapiro–Wilk test show that the population of the sample for all the tested acids is normally distributed (p > 0.05). The Pearson correlation indicated that there was a significant positive association between the biogas formation potential of the substrate and the concentration of the added volatile fatty acid for all the tested acids (r value of almost 1). The regression model indicated that the predictors explained 99.1 to 99.8% of the variance and collective significant effect was found for all the tested acids.
The pH values of the final biomass collected at the end of anaerobic digestion were between 7.8 and 7.9, apparently causing no problems to the biogas production process. However, pH measurements during anaerobic digestion and at the moment of volatile fatty acids injection to verify a temporary effect on the pH were not possible. This would cause ingress of oxygen and consequently the anaerobic digestion would be interrupted.
Photometric analyses revealed a volatile fatty acids concentration below the measuring range (<100 mg L−1). Furthermore, ammonia was below the measuring range (<0.01 mg L−1) in the final biomass of all bioreactors probably not causing any inhibition during anaerobic digestion.
Table 5 shows the characterization of the biomass at the end of digestion. Biomass was analysed regarding its hydroxyproline content and organic matter content. The hydroxyproline degradation was estimated.
Organic matter, hydroxyproline content, and degradation degree of hydroxyproline results are very similar for the bioreactors with acids added and the reference trial, even though the bioreactors with acids added showed a substantial increase in the biogas formation potential. Only a slight increase in organic matter and hydroxyproline content can be seen for the bioreactors with a high concentration of acids added.
Therefore, it was proved that accumulation of volatile fatty acids is a consequence of inhibition of methanogenesis rather than its cause. Further investigations must be performed to determine the exact inhibitor or inhibitors of the methanogenic archaea.

4. Discussion

Results showed a clear diauxie for the anaerobic digestion trials with S/I ratios of 1.4 or higher. Lalitha et al. [38] studied the collagenolysis and classified the anaerobic digestion of collagen as biphasic. They performed a trial with substrate overload and concluded that there were two peaks of biogas production. The first peak, at the beginning of digestion, probably represented the hydrolysis of collagen and the start of acidogenesis. The overload with substrate resulted in an instability and a consequent rapid increase in the volatile fatty acid concentration, which was argued to be detrimental to the methanogens. The second peak, when the volatile fatty acid concentration dropped, probably represented the beginning of methanogenesis. The two-phase degradation of a substrate was previously related to an increase in the S/I ratio by Córdoba et al. [39] for the anaerobic digestion of swine wastewater. In their study, diauxie was only clearly verified increasing the S/I ratio to 14. According to the guideline VDI 4630 [31], an S/I ratio equal or lower than 0.5 should be aimed at considering that the substrate should not be overlarge in proportion to the inoculum. This prevents inhibition in batch tests. This inhibition could lead to a more accentuated diauxie behaviour and consequently, longer digestion time.
The diauxie behaviour could be adapted in mathematical terms using segmented regression or the sum of two functions. Attempts of modelling diauxie curves have already been performed by segmenting the data in the composting process of dog food [40], or as a sum for the growth of animals [41] and coffee berries [42]. The sum of two functions has already shown to yield better results using the logistic model to fit eucalyptus growth data [43]. Regarding cumulative production of biogas or methane in two-phases, the use of the MGM could only be found in segments of two MGMs for anaerobic digestion of swine wastewater [39] or one MGM and other models for anaerobic digestion of solid agroindustrial waste [44]. The adaptation of the modified Gompertz model proposed in this study, the two-phase Gompertz model, sums up the two-phase cumulative biogas production present in the diauxie. The TGM was able to fit the curves with a high coefficient of determination. Other authors, who obtained diauxie behaviour in their cumulative biogas production curves, could benefit from the use of the TGM. They could prevent the model from representing the two phases of the diauxie as one [28] or ignoring the first phase of the diauxie [25,28], consequently increasing the accuracy of their fit.
All trials in this study showed a short lag-phase. This is characteristic for a short hydrolysis phase which is expected for low complexity substrates. Gelatin is considered to be a low complexity substrate because the collagen molecules that form the gelatin are already denatured and partially hydrolysed and this substrate is almost ready to start acidogenesis. All trials with an S/I ratio of 1.4 or higher showed a long diauxie plateau, meaning two to almost three weeks of no biogas production in the bioreactors during anaerobic digestion. The trial with an S/I ratio of 0.4 shows a short plateau of only 1.2 days, which could easily be ignored probably because the substrate load is too low to cause strong inhibition. The λ1/Plateau ratio for all trials was very low because of the very short lag-phase at the beginning of digestion. This is also a consequence of a very short hydrolysis phase necessary to start biogas production when using gelatin as a substrate.
The maximum biogas production rate of the first phase decreases with increasing substrate to inoculum ratio. The maximum biogas production rate of the second phase showed similar behaviour, except for the highest tested S/I ratio in which µm1 and µm2 were almost the same. The biogas formation potential of the first phase showed a decline with the increase of S/I ratio while the biogas formation potential of the second phase increased. This resulted in a very similar biogas formation potential (sum of both phases) for all trials.
The trial with an S/I ratio of 0.4 had a strong first phase, a weak second phase and a very short plateau-phase. The trials with an S/I ratio of 1.4 and 1.8 show a very similar first phase. However, the trial with an S/I ratio of 1.8 showed a weaker second phase and a longer plateau. The trial with an S/I ratio of 2.3 was the only trial with a weak first phase and strong second phase among the substrate loads tested. It appears that a small increase in the substrate feeding does not affect the beginning of anaerobic digestion which is only noticed after an adaptation period in the plateau-phase, whereas a large increase in the substrate feeding affects anaerobic digestion at its beginning and the system only recovers after the plateau-phase.
Even though degradation of hydroxyproline at the end of the anaerobic digestion was almost complete, almost the half of the biomass consisted of organic matter. In a previous work [45], data were presented for an anaerobic digestion of inoculum from the same source without adding substrate. The characterization of the final biomass after more than 90 days of digestion showed an organic matter content of about 40%. This leads to the conclusion that most of the organics that remain in the biomass after digestion come from the inoculum.
The pH value was considered appropriate for anaerobic digestion and a low concentration of ammonia was found in the biomass. Gelatin is often made of bovine hide collagen, which is a nitrogen-rich substrate with a C/N ratio of 3.1. This value was calculated with the basic elementary formula found with protein sequence of gelatin [46]. Therefore, there is production of ammonia, which is a product from the fermentation of amino acids, and there is the possibility of inhibition by ammonia [47]. However, ammonia did not accumulate in the bioreactors. These results are in accordance with results found by Lalitha et al. [38], who also verified low levels of ammonia during anaerobic digestion of collagen-based material.
Volatile fatty acids are important intermediate products produced in the acidogenesis phase of the anaerobic digestion but in excess, they could cause inhibition and failure of the digester. Kaiser et al. [36] determined limits to the concentration of these acids in fermenters. Acetic acid alone should have a concentration lower than 3 g L−1, propionic acid lower than 1 g L−1, and isobutyric acid lower than 0.5 g L−1. However, it is known that a concentration of propionic acid of 0.3 g L−1 is enough to disturb anaerobic digestion [37].
Two injections of volatile fatty acids over the experimental period showed that these acids did not cause any inhibition in the tested concentrations. This contradicts the theory that accumulation of volatile fatty acids inhibits the biogas production forming diauxie [19,25]. It was verified that the acids are quickly metabolized by the anaerobic bacteria and transformed into biogas. Statistical methods proved the correlation between the biogas formation potential of the substrate and the concentration of each added volatile fatty acid. Furthermore, the linear regression analysis revealed that the addition of acetic acid and propionic acid had a very similar effect on the biogas formation potential of the substrate but the addition of isobutyric acid appears to yield a higher biogas formation. The volatile fatty acids did not disturb anaerobic digestion. Consequently, it can be concluded that the high concentration of volatile fatty acids verified in a previous work [19] is a consequence of inhibition of the methanogenic archaea, not its cause. Therefore, accumulation of volatile fatty acids is not the cause of the diauxie curves verified for gelatin and other denatured collagen-based substrates [19].
Furthermore, volatile fatty acids were not detected in the final biomass of the bioreactors indicating that the injected acid was completely transformed into biogas. This also supports the findings previously obtained by other authors. The addition of volatile fatty acids in bioreactors using gelatin as substrate was previously studied by Breure et al. [48] and they concluded that the acids added were not inhibitory to the degradation of gelatin. Other investigation about the effect of different levels of volatile fatty acids in anaerobic digesters on the methanogenic archaea [49] concluded that a high concentration of these acids had no significant effect on methanogenic archaea.
Even though the reference trial and trials with added acids showed a similar final biomass composition, a slight increase in organic matter and hydroxyproline content was verified in bioreactors with a high concentration of acids added. This could indicate that anaerobic bacteria would preferably use the injected volatile fatty acids rather than degrade the substrate. However, the increase was very small indicating that the injection of acids did not affect the degradation of gelatin.

5. Conclusions

The modified Gompertz model is the best model to fit cumulative biogas production curves which show a lag-phase. However, adaptation to the TGM is possible to increase accuracy of the fit if the cumulative curve shows diauxie behaviour.
Different theories can be found in literature about the reasons for diauxie. Results shown in this study lead to the conclusion that diauxie in the biogas production using gelatin as substrate is not a direct consequence of volatile fatty acids accumulation and that to avert diauxie behaviour a high substrate to inoculum ratio should be avoided. It is known that the diauxie is related to a substrate load in the batch reactor, which causes the inhibition of the methanogenesis. The diauxie could be caused by an intermediate product formed during the anaerobic digestion. In future, studies should be carried out to determine amino acids and oligo-peptides along the digestion and verify if they could be the inhibitors of methanogenesis and the cause of diauxie behaviour for this substrate. In this case, it would be possible to reach a one phase digestion for denatured substrates using higher substrate to inoculum ratios.

Author Contributions

Conceptualization, C.S.G. and M.M.; methodology, C.S.G. and M.M.; software, C.S.G. and M.S.; validation, C.S.G., M.M., and M.S.; formal analysis, C.S.G., M.M., and M.S.; investigation, C.S.G.; resources, M.M.; data curation, C.S.G.; writing—original draft preparation, C.S.G.; writing—review and editing, C.S.G., M.M., and M.S.; visualization, C.S.G.; supervision, M.M.; project administration, C.S.G. and M.M. All authors have read and agreed to the published version of the manuscript.

Funding

This research received no external funding.

Informed Consent Statement

Not applicable.

Acknowledgments

This study was financed by the German Academic Exchange Service (DAAD) and the Coordenação de Aperfeiçoamento de Pessoal de Nível Superior—Brasil (CAPES)—Finance Code 001.

Conflicts of Interest

The authors declare no conflict of interest.

References

  1. Tjørve, K.M.C.; Tjørve, E. The Use of Gompertz Models in Growth Analyses, and New Gompertz-Model Approach: An Addition to the Unified-Richards Family. PLoS ONE 2017, 12, e0178691. [Google Scholar] [CrossRef] [PubMed]
  2. Lay, J.-J.; Li, Y.-Y.; Noike, T. Effect of Moisture Content and Chemical Nature on Methane Fermentation Characteristics of Municipal Solid Wastes. Doboku Gakkai Ronbunshu 1996, 1996, 101–108. [Google Scholar] [CrossRef] [Green Version]
  3. Zwietering, M.H.; Jongenburger, I.; Rombouts, F.M.; van’t Riet, K. Modeling of the Bacterial Growth Curve. Appl. Environ. Microbiol. 1990, 56, 1875–1881. [Google Scholar] [CrossRef] [PubMed] [Green Version]
  4. Luz, F.C.; Cordiner, S.; Manni, A.; Mulone, V.; Rocco, V.; Braglia, R.; Canini, A. Ampelodesmos Mauritanicus Pyrolysis Biochar in Anaerobic Digestion Process: Evaluation of the Biogas Yield. Energy 2018, 161, 663–669. [Google Scholar] [CrossRef]
  5. Wang, D.; Liu, X.; Zeng, G.; Zhao, J.; Liu, Y.; Wang, Q.; Chen, F.; Li, X.; Yang, Q. Understanding the Impact of Cationic Polyacrylamide on Anaerobic Digestion of Waste Activated Sludge. Water Res. 2018, 130, 281–290. [Google Scholar] [CrossRef] [Green Version]
  6. Gomes, C.S.; Repke, J.-U.; Meyer, M. Investigation of Different Pre-Treatments of Chromium Leather Shavings to Improve Biogas Production. J. Leather Sci. Eng. 2020, 2, 14. [Google Scholar] [CrossRef]
  7. Barua, V.B.; Kalamdhad, A.S. Anaerobic Biodegradability Test of Water Hyacinth after Microbial Pretreatment to Optimise the Ideal F/M Ratio. Fuel 2018, 217, 91–97. [Google Scholar] [CrossRef]
  8. Lo, H.M.; Kurniawan, T.A.; Sillanpää, M.E.T.; Pai, T.Y.; Chiang, C.F.; Chao, K.P.; Liu, M.H.; Chuang, S.H.; Banks, C.J.; Wang, S.C.; et al. Modeling Biogas Production from Organic Fraction of MSW Co-Digested with MSWI Ashes in Anaerobic Bioreactors. Bioresour. Technol. 2010, 101, 6329–6335. [Google Scholar] [CrossRef]
  9. Shahbaz, M.; Ammar, M.; Zou, D.; Korai, R.M.; Li, X. An Insight into the Anaerobic Co-Digestion of Municipal Solid Waste and Food Waste: Influence of Co-Substrate Mixture Ratio and Substrate to Inoculum Ratio on Biogas Production. Appl. Biochem. Biotechnol. 2019, 187, 1356–1370. [Google Scholar] [CrossRef]
  10. Lü, F.; Hao, L.; Zhu, M.; Shao, L.; He, P. Initiating Methanogenesis of Vegetable Waste at Low Inoculum-to-Substrate Ratio: Importance of Spatial Separation. Bioresour. Technol. 2012, 105, 169–173. [Google Scholar] [CrossRef]
  11. Wang, X.; Zhang, L.; Xi, B.; Sun, W.; Xia, X.; Zhu, C.; He, X.; Li, M.; Yang, T.; Wang, P.; et al. Biogas Production Improvement and C/N Control by Natural Clinoptilolite Addition into Anaerobic Co-Digestion of Phragmites Australis, Feces and Kitchen Waste. Bioresour. Technol. 2015, 180, 192–199. [Google Scholar] [CrossRef] [PubMed]
  12. Li, Y.; Zhang, R.; He, Y.; Liu, X.; Chen, C.; Liu, G. Thermophilic Solid-State Anaerobic Digestion of Alkaline-Pretreated Corn Stover. Energy Fuels 2014, 28, 3759–3765. [Google Scholar] [CrossRef]
  13. Ziemiński, K.; Kowalska-Wentel, M. Effect of Enzymatic Pretreatment on Anaerobic Co-Digestion of Sugar Beet Pulp Silage and Vinasse. Bioresour. Technol. 2015, 180, 274–280. [Google Scholar] [CrossRef]
  14. Ismail, Z.Z.; Talib, A.R. Recycled Medical Cotton Industry Waste as a Source of Biogas Recovery. J. Clean. Prod. 2016, 112, 4413–4418. [Google Scholar] [CrossRef]
  15. Ma, H.; Li, Z.; Yin, F.; Kao, W.; Yin, Y.; Bai, X. Study on Anaerobic Treatment of Hazardous Steel-Mill Waste Rolling Oil (SmWRO) for Multi-Benefit Disposal Route. Bioresour. Technol. 2014, 151, 106–112. [Google Scholar] [CrossRef] [PubMed]
  16. Moraes, B.S.; Triolo, J.M.; Lecona, V.P.; Zaiat, M.; Sommer, S.G. Biogas Production within the Bioethanol Production Chain: Use of Co-Substrates for Anaerobic Digestion of Sugar Beet Vinasse. Bioresour. Technol. 2015, 190, 227–234. [Google Scholar] [CrossRef] [PubMed]
  17. Li, Y.; Zhang, R.; Liu, X.; Chen, C.; Xiao, X.; Feng, L.; He, Y.; Liu, G. Evaluating Methane Production from Anaerobic Mono- and Co-Digestion of Kitchen Waste, Corn Stover, and Chicken Manure. Energy Fuels 2013, 27, 2085–2091. [Google Scholar] [CrossRef]
  18. Takeuchi, Y.; Andriamanohiarisoamanana, F.J.; Yasui, S.; Iwasaki, M.; Nishida, T.; Ihara, I.; Umetsu, K. Feasibility Study of a Centralized Biogas Plant Performance in a Dairy Farming Area. J. Mater. Cycles Waste Manag. 2018, 20, 314–322. [Google Scholar] [CrossRef]
  19. Gomes, C.S.; Repke, J.-U.; Meyer, M. Diauxie during Biogas Production from Collagen-Based Substrates. Renew. Energy 2019, 141, 20–27. [Google Scholar] [CrossRef]
  20. Lee, C.; Kim, J.; Shin, S.G.; O’Flaherty, V.; Hwang, S. Quantitative and Qualitative Transitions of Methanogen Community Structure during the Batch Anaerobic Digestion of Cheese-Processing Wastewater. Appl. Microbiol. Biotechnol. 2010, 87, 1963–1973. [Google Scholar] [CrossRef]
  21. Marin, J.; Kennedy, K.J.; Eskicioglu, C. Effect of Microwave Irradiation on Anaerobic Degradability of Model Kitchen Waste. Anaerob. Dig. AD Solid Waste 2010, 30, 1772–1779. [Google Scholar] [CrossRef] [PubMed]
  22. Misi, S.N.; Forster, C.F. Batch Co-Digestion of Multi-Component Agro-Wastes. Bioresour. Technol. 2001, 80, 19–28. [Google Scholar] [CrossRef]
  23. Walter, A.; Silberberger, S.; Juárez, M.F.-D.; Insam, H.; Franke-Whittle, I.H. Biomethane Potential of Industrial Paper Wastes and Investigation of the Methanogenic Communities Involved. Biotechnol. Biofuels 2016, 9, 21. [Google Scholar] [CrossRef] [PubMed] [Green Version]
  24. Ashekuzzaman, S.M.; Poulsen, T.G. Optimizing Feed Composition for Improved Methane Yield during Anaerobic Digestion of Cow Manure Based Waste Mixtures. Bioresour. Technol. 2011, 102, 2213–2218. [Google Scholar] [CrossRef] [PubMed]
  25. Kim, M.J.; Kim, S.H. Minimization of Diauxic Growth Lag-Phase for High-Efficiency Biogas Production. J. Environ. Manag. 2017, 187, 456–463. [Google Scholar] [CrossRef] [PubMed]
  26. Liu, X.; Xu, Q.; Wang, D.; Wu, Y.; Yang, Q.; Liu, Y.; Wang, Q.; Li, X.; Li, H.; Zeng, G.; et al. Unveiling the Mechanisms of How Cationic Polyacrylamide Affects Short-Chain Fatty Acids Accumulation during Long-Term Anaerobic Fermentation of Waste Activated Sludge. Water Res. 2019, 155, 142–151. [Google Scholar] [CrossRef] [PubMed]
  27. El-Mashad, H.M. Kinetics of Methane Production from the Codigestion of Switchgrass and Spirulina Platensis Algae. Bioresour. Technol. 2013, 132, 305–312. [Google Scholar] [CrossRef] [PubMed]
  28. Kafle, G.K.; Kim, S.H. Effects of Chemical Compositions and Ensiling on the Biogas Productivity and Degradation Rates of Agricultural and Food Processing By-Products. Bioresour. Technol. 2013, 142, 553–561. [Google Scholar] [CrossRef]
  29. DIN EN ISO 4684. Leather–Chemical Tests–Determination of Volatile Matter; German Institute for Standardization: Berlin, Germany, 2005. [Google Scholar]
  30. DIN EN ISO 4047. Leather-Determination of Sulphated Total Ash and sulphated Water-Insoluble Ash; German Institute for Standardization: Berlin, Germany, 1998. [Google Scholar]
  31. VDI 4630. Fermentation of Organic Materials, Characterization of the Substrate, Sampling, Collection of Material Data, Fermentation Tests; The Association of German Engineers: Düsseldorf, Germany, 2006. [Google Scholar]
  32. Stegemann, H. Microdetermination of hydroxyproline with chloramine-T and p-dimethylaminobenzaldehyde. Hoppe. Seylers Z. Physiol. Chem. 1958, 311, 41–45. [Google Scholar] [CrossRef]
  33. Reich, G. From Collagen to Leather-the Theoretical Background; BASF: Ludwigshafen, Germany, 2007. [Google Scholar]
  34. FNR. Guide to Biogas from Production to Use; Fachagentur Nachwachsende Rohstoffe e. V. (FNR): Gülzow-Prüzen, Germany, 2012. [Google Scholar]
  35. Drosg, B.; Braun, R.; Bochmann, G. Analysis and characterisation of biogas feedstocks. In The Biogas Handbook: Science, Production and Applications; Wellinger, A., Murphy, J.D., Baxter, D., Eds.; Woodhead Publishing Limited: Cambridge, UK, 2013; pp. 52–84. ISBN 978-0-85709-498-8. [Google Scholar]
  36. Kaiser, F.; Metzner, T.; Effenberger, M.; Gronauer, A. Sicherung Der Prozessstabilität in Landwirtschaftlichen Biogasanlagen; LfL-Information; Bayerische Landesanstalt für Landwirtschaft: Freising-Weihenstephan, Germany, 2008. [Google Scholar]
  37. Deublein, D.; Steinhauser, A. Biogas from Waste and Renewable Resources: An Introduction; John Wiley & Sons, Ltd.: Weinheim, Germany, 2008; ISBN 978-3-527-62170-5. [Google Scholar]
  38. Lalitha, K.; Swaminathan, K.R.; Padma Bai, R. Kinetics of Biomethanation of Solid Tannery Waste and the Concept of Interactive Metabolic Control. Appl. Biochem. Biotechnol. 1994, 47, 73–87. [Google Scholar] [CrossRef]
  39. Córdoba, V.; Fernández, M.; Santalla, E. The Effect of Substrate/Inoculum Ratio on the Kinetics of Methane Production in Swine Wastewater Anaerobic Digestion. Environ. Sci. Pollut. Res. 2018, 25, 21308–21317. [Google Scholar] [CrossRef] [PubMed]
  40. Chang, J.I.; Tsai, J.J.; Wu, K.H. Mathematical Model for Carbon Dioxide Evolution from the Thermophilic Composting of Synthetic Food Wastes Made of Dog Food. Waste Manag. 2005, 25, 1037–1045. [Google Scholar] [CrossRef] [PubMed]
  41. Vázquez, J.A.; Lorenzo, J.M.; Fuciños, P.; Franco, D. Evaluation of Non-Linear Equations to Model Different Animal Growths with Mono and Bisigmoid Profiles. J. Theor. Biol. 2012, 314, 95–105. [Google Scholar] [CrossRef] [PubMed]
  42. Fernandes, T.J.; Pereira, A.A.; Muniz, J.A. Double Sigmoidal Models Describing the Growth of Coffee Berries. Ciênc. Rural 2017, 47. [Google Scholar] [CrossRef] [Green Version]
  43. Mischan, M.M.; Passos, J.R.d.S.; Pinho, S.Z.d.; Carvalho, L.R.d. Inflection and Stability Points of Diphasic Logistic Analysis of Growth. Sci. Agric. 2015, 72, 215–220. [Google Scholar] [CrossRef] [Green Version]
  44. Pellera, F.-M.; Gidarakos, E. Effect of Substrate to Inoculum Ratio and Inoculum Type on the Biochemical Methane Potential of Solid Agroindustrial Waste. J. Environ. Chem. Eng. 2016, 4, 3217–3229. [Google Scholar] [CrossRef]
  45. Gomes, C.S.; Repke, J.-U.; Meyer, M. Different Pre-Treatments of Chrome Tanned Leather Waste and Their Use in the Biogas Production. In Proceedings of the XXXIV IULTCS Congress, Chennai, India, 7 February 2017; Universal Publishing: Chennai, India, 2017; p. 62. [Google Scholar]
  46. The UniProt Consortium. Available online: https://www.uniprot.org (accessed on 26 November 2020).
  47. Nisman, B. The Stickland Reaction. Bacteriol. Rev. 1954, 18, 16–42. [Google Scholar] [CrossRef]
  48. Breure, A.M.; Mooijman, K.A.; van Andel, J.G. Protein Degradation in Anaerobic Digestion: Influence of Volatile Fatty Acids and Carbohydrates on Hydrolysis and Acidogenic Fermentation of Gelatin. Appl. Microbiol. Biotechnol. 1986, 24, 426–431. [Google Scholar] [CrossRef]
  49. Franke-Whittle, I.H.; Walter, A.; Ebner, C.; Insam, H. Investigation into the Effect of High Concentrations of Volatile Fatty Acids in Anaerobic Digestion on Methanogenic Communities. Waste Manag. 2014, 34, 2080–2089. [Google Scholar] [CrossRef] [Green Version]
Figure 1. A growth curve. Adapted from Zwietering et al. [3].
Applsci 11 01067 g001
Figure 2. Two-phase Gompertz model.
Applsci 11 01067 g002
Figure 3. Cumulative biogas production and two-phase Gompertz simulation (line) using gelatin as substrate with different substrate to inoculum ratios (S/I) in agitated bioreactors.
Applsci 11 01067 g003
Figure 4. Parameters of biogas production from the two-phase Gompertz model.
Applsci 11 01067 g004
Figure 5. Cumulative biogas production (CBP) using gelatin as substrate in bioreactors with added acetic acid, pro-pionic acid, and isobutyric acid.
Applsci 11 01067 g005
Table 1. Substrate and inoculum characterization.
Water Content (%) 1Organic Matter (%) 1
Substrate—Gelatin90.5 ± 0.099.0 ± 0.0
Inoculum—Mesophilic anaerobic sludge96.6 ± 0.051.0 ± 2.5
1 Dry basis; mean ± standard deviation, n = 3.
Table 2. Ratios of the parameters of the two-phase Gompertz model for trials with diauxie behaviour.
S/IA1/A2λ1/Plateauµm1m2
0.410.70.62.0
1.42.00.12.8
1.83.20.13.8
2.30.80.00.7
Table 3. Biomass characterization after digestion and degradation degree of hydroxyproline.
S/IOrganic Matter (%) 1Hydroxyproline (%) 2Degradation Degree (%)pH
0.446.0 ± 1.10.04 ± 0.0198.88.3
1.448.8 ± 0.20.05 ± 0.0199.68.4
1.845.5 ± 0.2n.d.n.d.8.5
2.349.1 ± 0.40.06 ± 0.0099.68.4
1 Dry basis; mean ± standard deviation, n = 2, 2 Dry basis; mean ± standard deviation, n = 3, n.d.—not determined.
Table 4. Statistical methods.
Shapiro–Wilk TestPearson CorrelationLinear Regression Analysis
WprpEquationR2
Injection of acetic acid0.9380.640.9960.004y = 170.42 x + 501.210.993
Injection of propionic acid0.9050.4390.9950y = 181.48 x + 498.310.991
Injection of isobutyric acid0.9910.960.9990.001y = 238.79 x + 493.390.998
x—Concentration of the added volatile fatty acid. y—Biogas formation potential of the substrate.
Table 5. Characterization of the final biomass, degradation degree of hydroxyproline, and biogas formation potential for bioreactors investigating diauxie.
Injection of Acetic Acid
Acid Conc. (g L−1)Organic Matter (%) 1Hydroxyproline(%) 1Degradation Degree (%)Biogas Formation Potential (L kg−1)
450.7 ± 0.70.05 ± 0.0198.21156 ± 30
350.1 ± 0.20.05 ± 0.0098.21042 ± 8
250.4 ± 0.20.06 ± 0.0097.8852 ± 25
Injection of Propionic Acid
250.6 ± 0.30.05 ± 0.0098.2858 ± 10
150.4 ± 0.20.05 ± 0.0198.2683 ± 12
0.349.9 ± 0.30.06 ± 0.0198.3576 ± 8
0.249.3 ± 0.30.02 ± 0.0099.6522 ± 10
Injection of Isobutyric Acid
149.5 ± 0.00.04 ± 0.0098.7729 ± 49
0.549.6 ± 0.50.02 ± 0.0199.2618 ± 20
0.349.9 ± 0.20.03 ± 0.0199.1568 ± 34
No Added Acid
049.8 ± 0.30.01 ± 0.0099.6489 ± 12
1 Dry basis; mean ± standard deviation, n = 2.
Publisher’s Note: MDPI stays neutral with regard to jurisdictional claims in published maps and institutional affiliations.

