Article

An Automatic Approach for Individual HU-Based Characterization of Lungs in COVID-19 Patients

by
Aldo Mazzilli
1,2,
Claudio Fiorino
1,
Alessandro Loria
1,
Martina Mori
1,3,
Pier Giorgio Esposito
1,2,
Diego Palumbo
3,4,
Francesco de Cobelli
3,4 and
Antonella del Vecchio
1,*
1
Department of Medical Physics, San Raffaele Scientific Institute, 20132 Milan, Italy
2
Department of Physics, Università degli Studi di Milano, 20122 Milan, Italy
3
Department of Medicine, Università Vita-Salute San Raffaele, 20132 Milan, Italy
4
Department of Radiology, San Raffaele Scientific Institute, 20132 Milan, Italy
*
Author to whom correspondence should be addressed.
Submission received: 20 November 2020 / Revised: 15 January 2021 / Accepted: 22 January 2021 / Published: 29 January 2021
(This article belongs to the Special Issue Applications of Medical Physics)

Abstract

:
The ongoing COVID-19 pandemic currently involves millions of people worldwide. Radiology plays an important role in the diagnosis and management of patients, and chest computed tomography (CT) is the most widely used imaging modality. An automatic method to characterize the lungs of COVID-19 patients based on individually optimized Hounsfield unit (HU) thresholds was developed and implemented. Lungs were considered as composed of three components—aerated, intermediate, and consolidated. Three methods based on analytic fit (Gaussian) and maximum gradient search (using polynomial and original data fits) were implemented. The methods were applied to a population of 166 patients scanned during the first wave of the pandemic. Preliminarily, the impact of the inter-scanner variability of the HU-density calibration curve was investigated. Results showed that inter-scanner variability was negligible. The median values of individual thresholds th1 (between aerated and intermediate components) were −768, −780, and −798 HU for the three methods, respectively. A significantly lower median value for th2 (between intermediate and consolidated components) was found for the maximum gradient on the data (−34 HU) compared to the other two methods (−114 and −87 HU). The maximum gradient on the data method was applied to quantify the three components in our population—the aerated, intermediate, and consolidation components showed median values of 793 ± 499 cc, 914 ± 291 cc, and 126 ± 111 cc, respectively, while the median value of the first peak was −853 ± 56 HU.

1. Introduction

Severe acute respiratory syndrome coronavirus (SARS-CoV-2), a novel RNA coronavirus from the same family as SARS-CoV and Middle East respiratory syndrome coronavirus (MERS-CoV), was identified in early January 2020 as the cause of a pneumonia epidemic initially striking China, from where it spread very rapidly around the world. The World Health Organization named the syndrome coronavirus disease 2019 (COVID-19) and subsequently declared it a pandemic, given its widespread infectivity and high rate of contagion. To date, many millions of cases have been confirmed worldwide [1]. Human coronaviruses typically cause respiratory and enteric infections. SARS-CoV-2 infection mainly presents flu-like symptoms such as fever, cough, and fatigue, similar to other coronaviruses. In severe cases, the virus can cause severe interstitial pneumonia, acute respiratory distress syndrome (ARDS), and subsequent multi-organ failure, responsible for severe acute respiratory failure and high mortality rates.
Chest CT plays an important role in diagnosing COVID-19 [2]. Recent studies have reported the sensitivity and specificity of CT in COVID-19 pneumonia to be 60–98% and 25–53%, respectively [3,4]. A recent study reported positive and negative predictive values of chest CT in COVID-19 pneumonia of 92% and 42%, respectively [3]. The low negative predictive value suggests that CT may not be suitable as a screening method in COVID-19 pneumonia, at least in the early stages of the disease. CT sensitivity depends on the time elapsed after the onset of symptoms [5], and CT findings vary widely for this disease, depending on clinical severity and the time from symptom onset [6,7]. The disease most commonly affects the lower and peripheral areas of both lungs, with a prevalent multifocal pattern [8]. The posterior areas are affected in about 80% of cases, and the disease is generally quite extensive, with all five lobes affected in a large proportion of patients [9]. Although irregular multifocal distribution is more common than diffuse disease [8], both unilateral and unifocal involvement may occur.
Ground glass opacity (GGO) is defined as a hyper-attenuated area of the lung without darkening of the underlying vessels, and is typically caused by partial filling of the air spaces or interstitial thickening [10]. GGO appears to be the most common CT finding, observed in up to 98% of patients, and is usually the first manifestation [11,12]. It may or may not be accompanied by other findings, in particular consolidation and reticulation [9]. Consolidation is defined as a hyper-attenuated area with darkening of the underlying vessels, caused by the complete filling of the alveolar air spaces [10]. Consolidations are generally irregular, while round-shaped lesions have been reported in 11–54% of patients [13], and are considered to be relatively more specific for this disease [14]. Consolidation usually appears later than GGO and peaks in days 10 to 12 after the onset of the disease [6]. Reticulation is defined as thickened interlobular septa and intralobular lines that appear as linear opacities on CT [10], and was the third most common CT feature, after GGO and consolidation, with a rate of 48.5–59% [8]. Crazy paving pattern (CPP) is defined as thickened interlobular septa or intralobular lines superimposed on GGO, resembling paving stones [12]. This finding may refer to alveolar edema and acute interstitial inflammation, also present in severe acute respiratory syndrome (SARS). It has been reported in 5–36% of patients with COVID-19 pneumonia [12].
Several recent works have evaluated the correlation between quantitative features extracted from CT and the clinical outcome of patients with COVID-19 pneumonia. Few articles have dealt with the prediction of disease severity and short-term disease progression [15,16,17]. Other authors have developed predictive models of diagnosis and prognosis [18,19,20,21,22]. Artificial-intelligence-based approaches have been shown to significantly improve sensitivity and specificity in diagnosing COVID-19 pneumonia; machine learning approaches using convolutional network models have found promising results in distinguishing COVID-19 from other types of pneumonia [23,24,25]. This volumetric calculation reflects disease extension, and can be used in predicting disease severity, progression, and response to treatment [26,27,28].
Within this context, the reliability and repeatability of lung sub-volumes according to their density is a significant issue. The need for operator-independent approaches, possibly defining sub-regions with a clear link to functional meaning, is urgent. Thus, the principles aims of our study were:
  • To develop an automated, operator-independent quantitative method to identify the different lung regions for COVID-19 patients, based on individually optimized Hounsfield unit (HU) thresholds; the proposed method is based on an intuitive, interpretable phenomenological characterization of lungs, with clear functional meaning;
  • To achieve a feasible implementation of the proposed method in such a way as to be potentially usable by other institutions;
  • To demonstrate the robustness of the method with respect to inter-scanner variability within a single institute;
  • To report inter-patient distribution of the HU-based parameters extracted by our approach over a large single-center population of 166 patients during the first wave of the pandemic.

2. Materials and Methods

2.1. Patient Database

The data used in this work are part of an internal database of the San Raffaele Scientific Institute (Milan, Italy). The database consists of more than 250 COVID-19 patients who underwent chest CT scan between 28 February 2020 and 21 May 2020. CTs were performed at maximum inspiration. Demographic data (age, sex) and clinical data (e.g., comorbidities) are available for each patient. Patients who presented an acquisition made with parenchyma reconstruction in non-contrast mode were selected from the database. The database thus obtained consisted of 166 COVID-19 patients. The number was in fact limited by the availability of observers in contouring lungs, which is a quite cumbersome procedure. The significant, temporary reduction of radiotherapy clinical activities during the first phase of the lockdown afforded more time to planners for this activity. Patients were randomly chosen from the largest available set. After a return to full activity, the time available was greatly reduced, and it was thus decided to stop the contouring phase, resulting in a more than sufficient number of patients to test our approach and from whom to derive reliable population data. The equipment used for chest CT scans was as follows:
  • Lightspeed VCT (64sl), General Electric Medical System(Boston, MA, USA);
  • Brilliance (64sl), Philips (Amsterdam, Netherlands);
  • Incisive (64sl), Philips (Amsterdam, Netherlands).
88% percent of the exams were performed with Lightspeed, 7% with Brilliance and 5% with Incisive. All scans were performed with an X-ray tube voltage of 120 kV and automatic current modulation of 149 to 549 mA, slice thickness 1 to 1.25 mm, and matrix 512 × 512. CT images were retrieved from the hospital picture archiving and communication system (PACS).

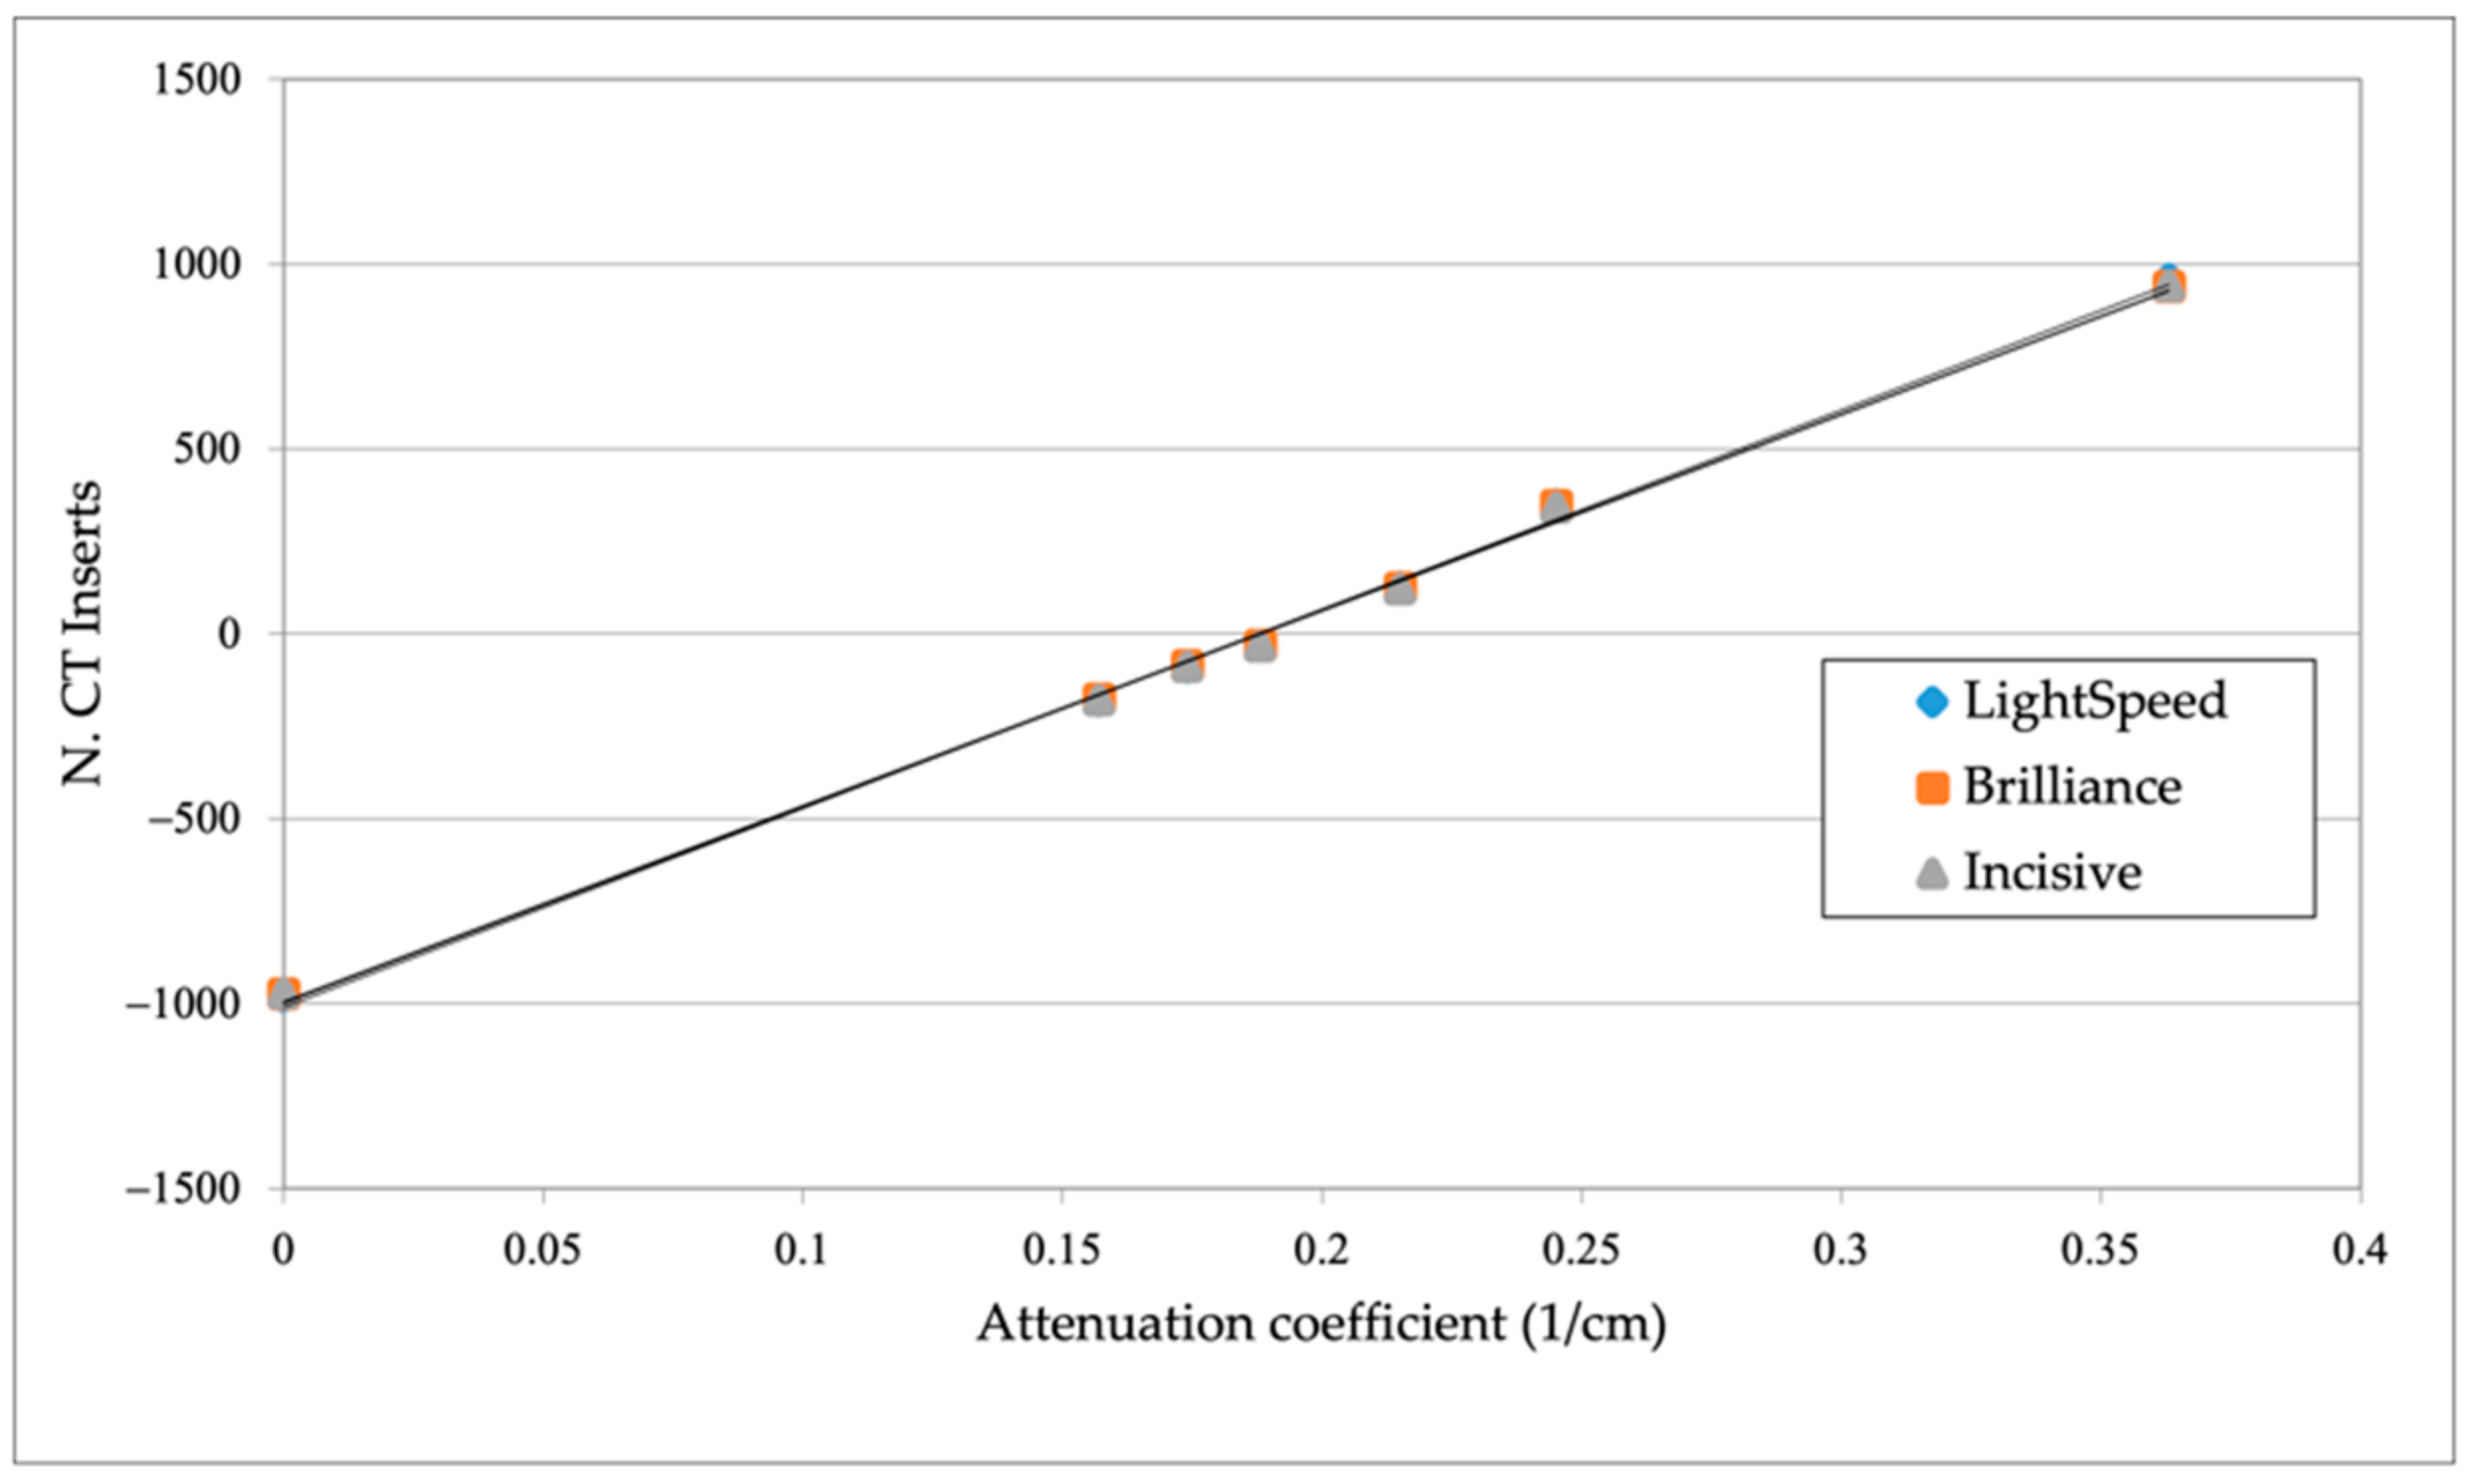
2.2. Assessing Inter-Scanner Variations of HU-Density Calibration Curves

Accurate and reproducible assessment of Hounsfield unit (HU) [29] distribution within the lungs is of paramount importance. The values of the HU of the CT images depends on the calibration curve internal to each equipment (HU as a function of the attenuation coefficient of the materials). For verification, we investigated the impact of the HU-density calibration curves obtained with the parameters used in the image acquisition phase of the CT equipment utilized. To assess the impact of the calibration curves, the acquisition parameters of COVID-19 patients we analyzed, and the specific protocol calibration curves reconstructed for all CT scanners used. For the study description, tube voltage and X-ray current were collected from the header DICOM (Digital Imaging and COmmunications in Medicine) of the CT image in the available database. Tube voltage was set at 120 kV for all CT scans, while the X-ray current was modulated according to patient size. The data were divided for each piece of equipment—the median values of the X-ray current for each device were calculated; regarding GE LightSpeed (used for 88% of patients), the values of the minimum, the maximum, and the first and the third quartile were also calculated, as shown in Table 1.
These parameters were used to perform acquisitions with the calibrated CT image quality phantom, Catphan 600—The Phantom Laboratory, Battenville, NY, USA, in the entire HU range (−1000 to +1000). A tube voltage of 120 kV and the median value of X-ray current for each piece of equipment was used for the exposition of the Catphan phantom. Moreover, for the General Electric equipment, the first and third quartiles were also used as exposure parameters. The Catphan consists of an inner layer containing several inserts of different materials corresponding to different attenuation coefficients. Knowing the attenuation coefficients of these materials, and measuring the average HU values inside each insert, it was possible to obtain the characteristic linearity curve of the equipment at the exposure parameters selected in the acquisition phase.
Five repeated measurements were carried out for each scanner, and each X-ray current value considered. The average HU value was used to calculate the linearity curve for each insert.
Consequently, for Philips Brilliance and Philips Incisive, a single calibration curve was obtained, relative to the median value of the current used for the patient scans carried out on each. For the GE LightSpeed, five calibration curves were obtained, corresponding to the minimum, maximum, 25th quartile, 50th quartile (median), and 75th quartile values. A region of interest (ROI) was selected within each Catphan insert. Using the ImageJ image processing software, the mean value and standard deviation of the HU values within the ROI were evaluated. The variation in the average HU values within each ROI was then calculated between the various acquisitions taken.

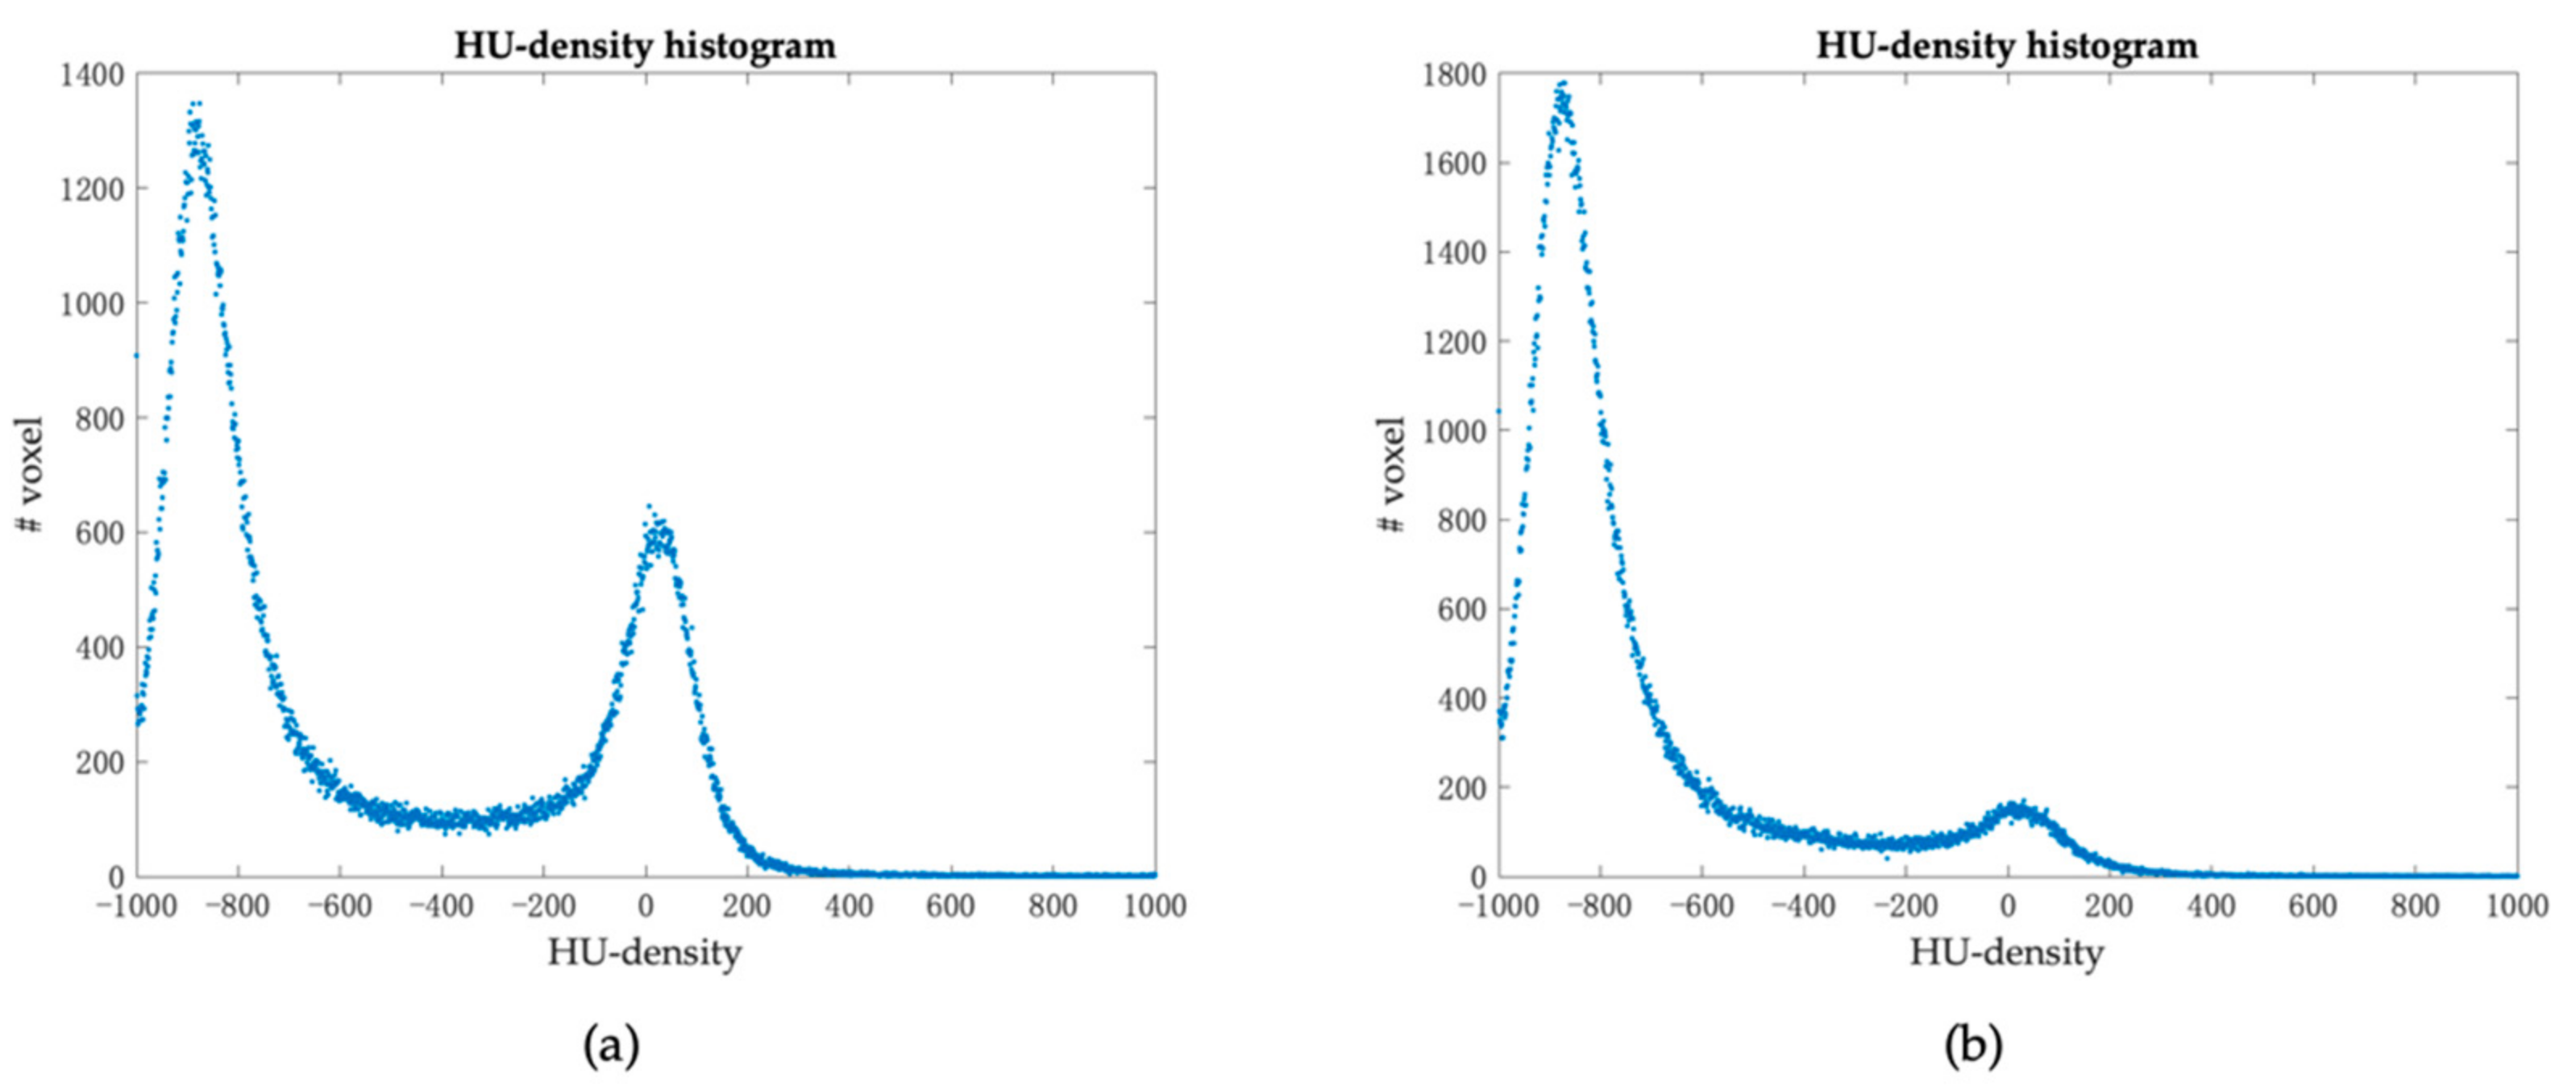
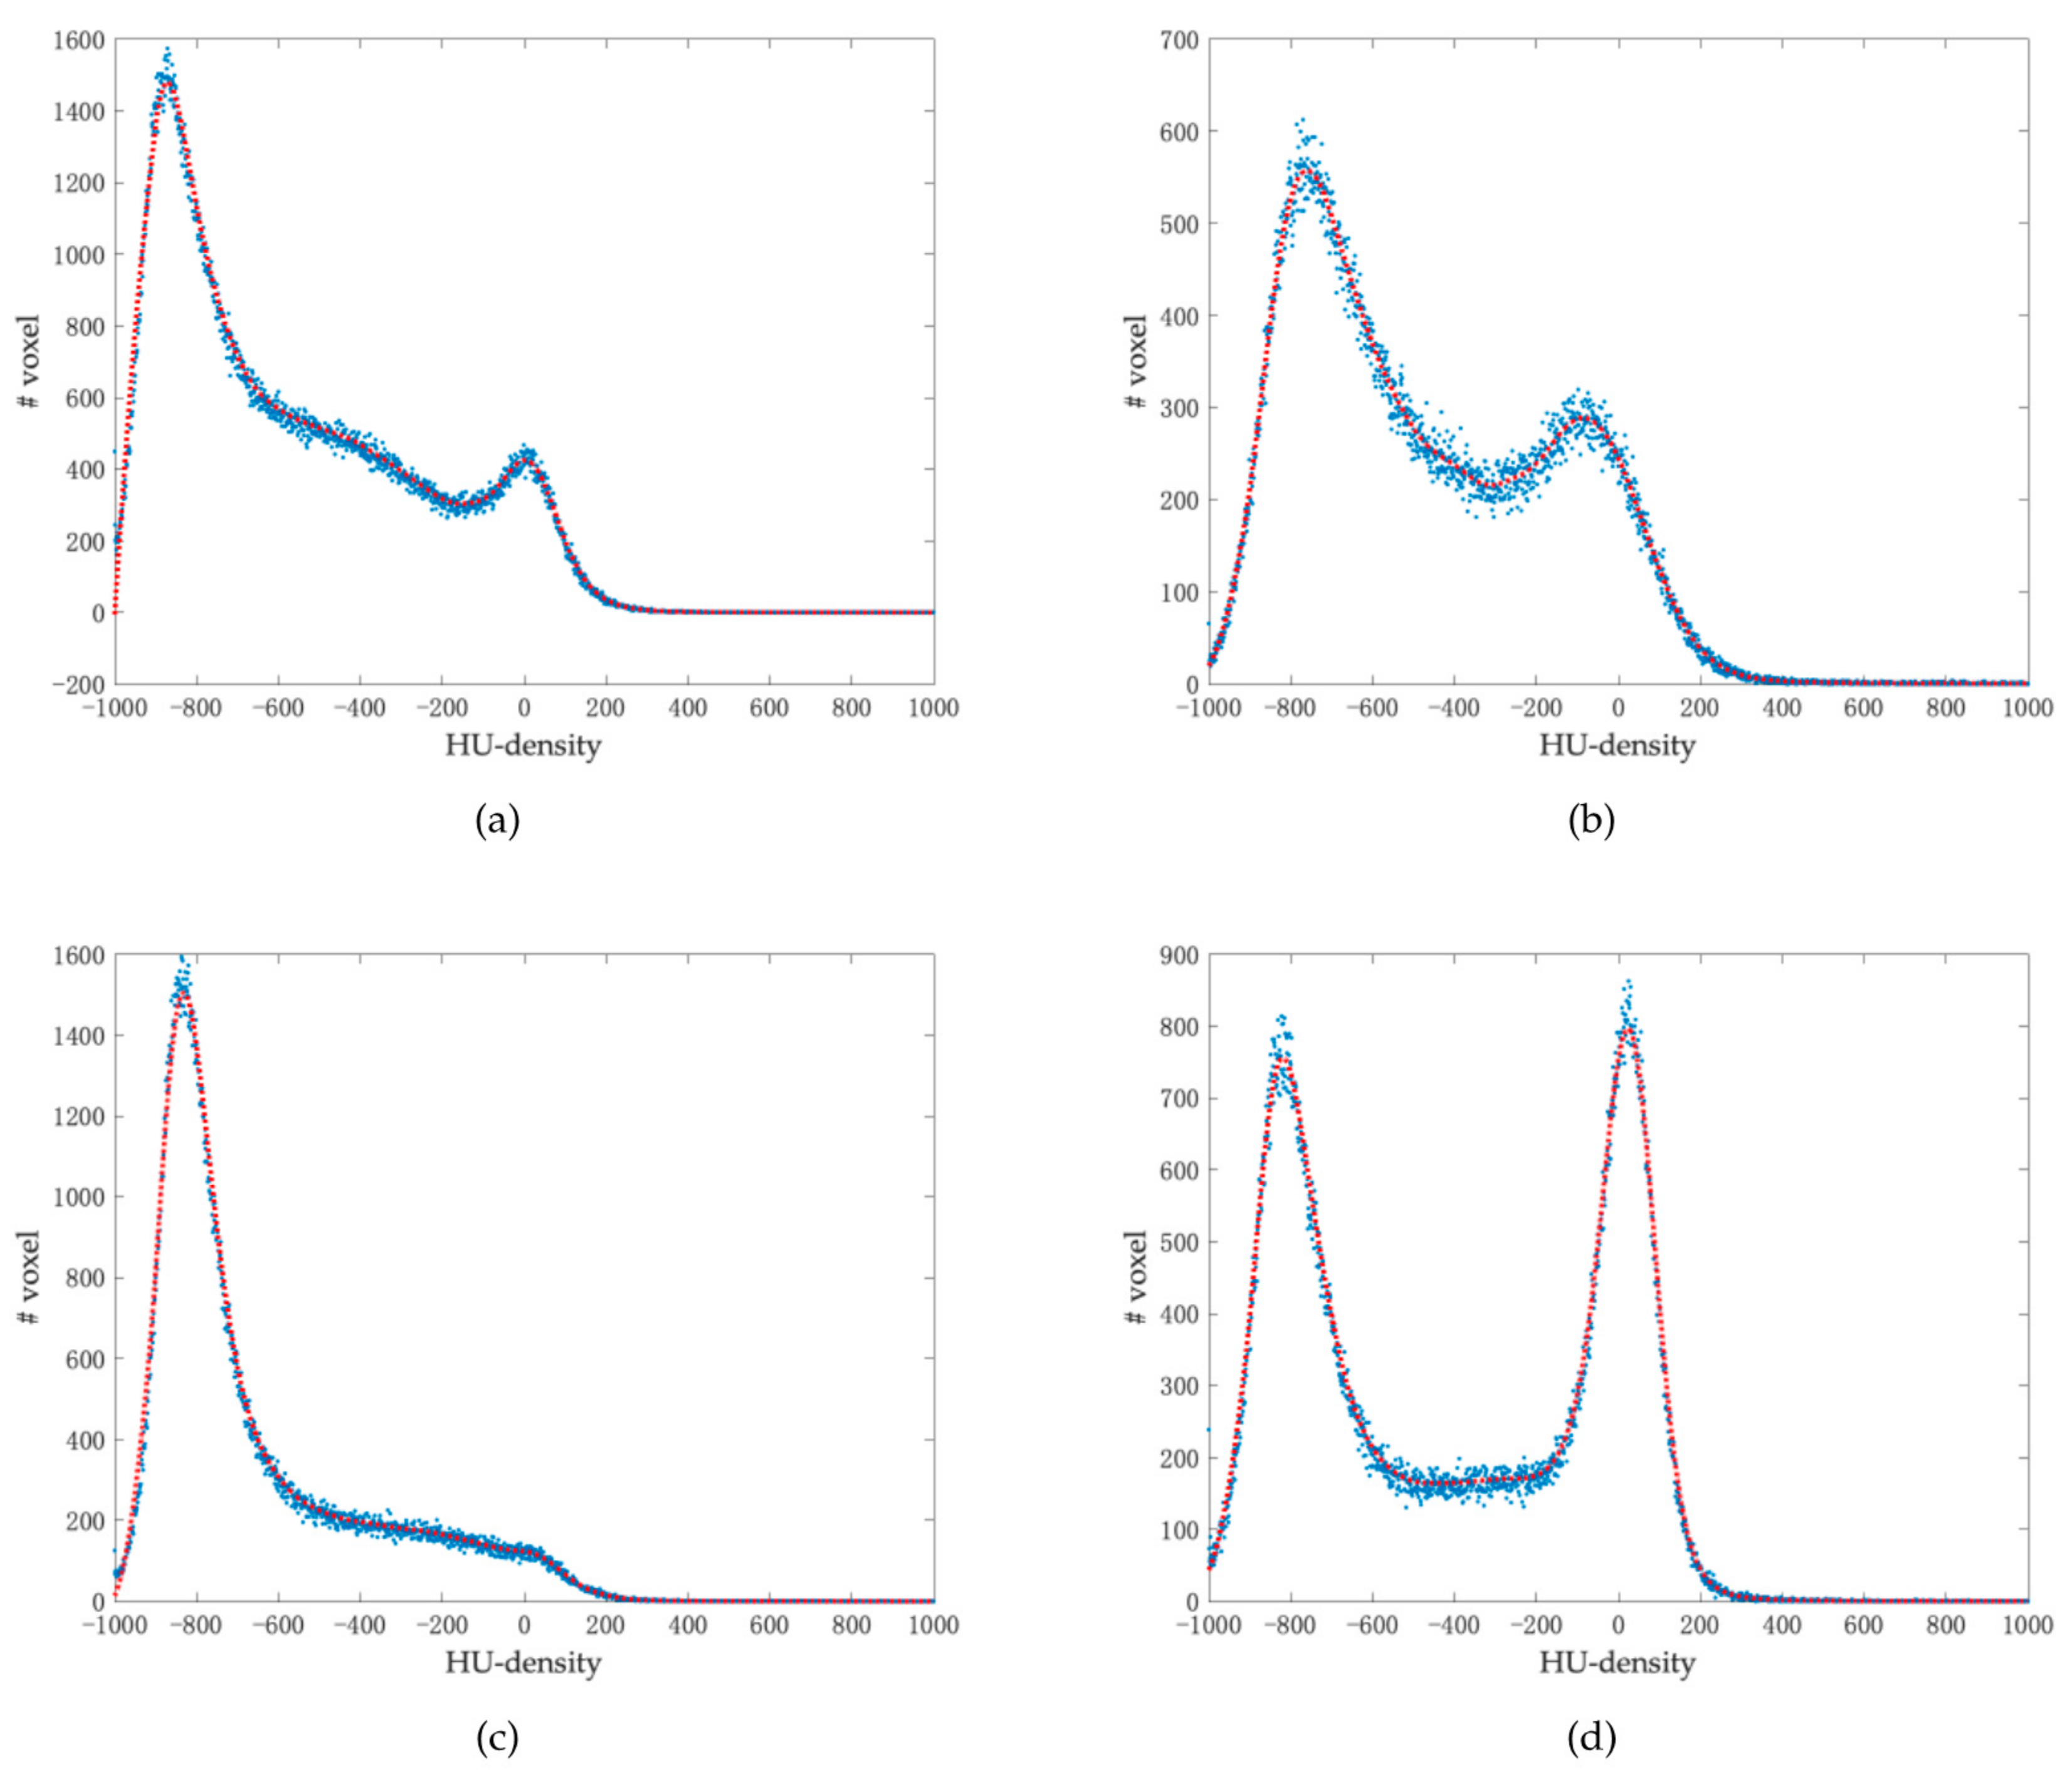
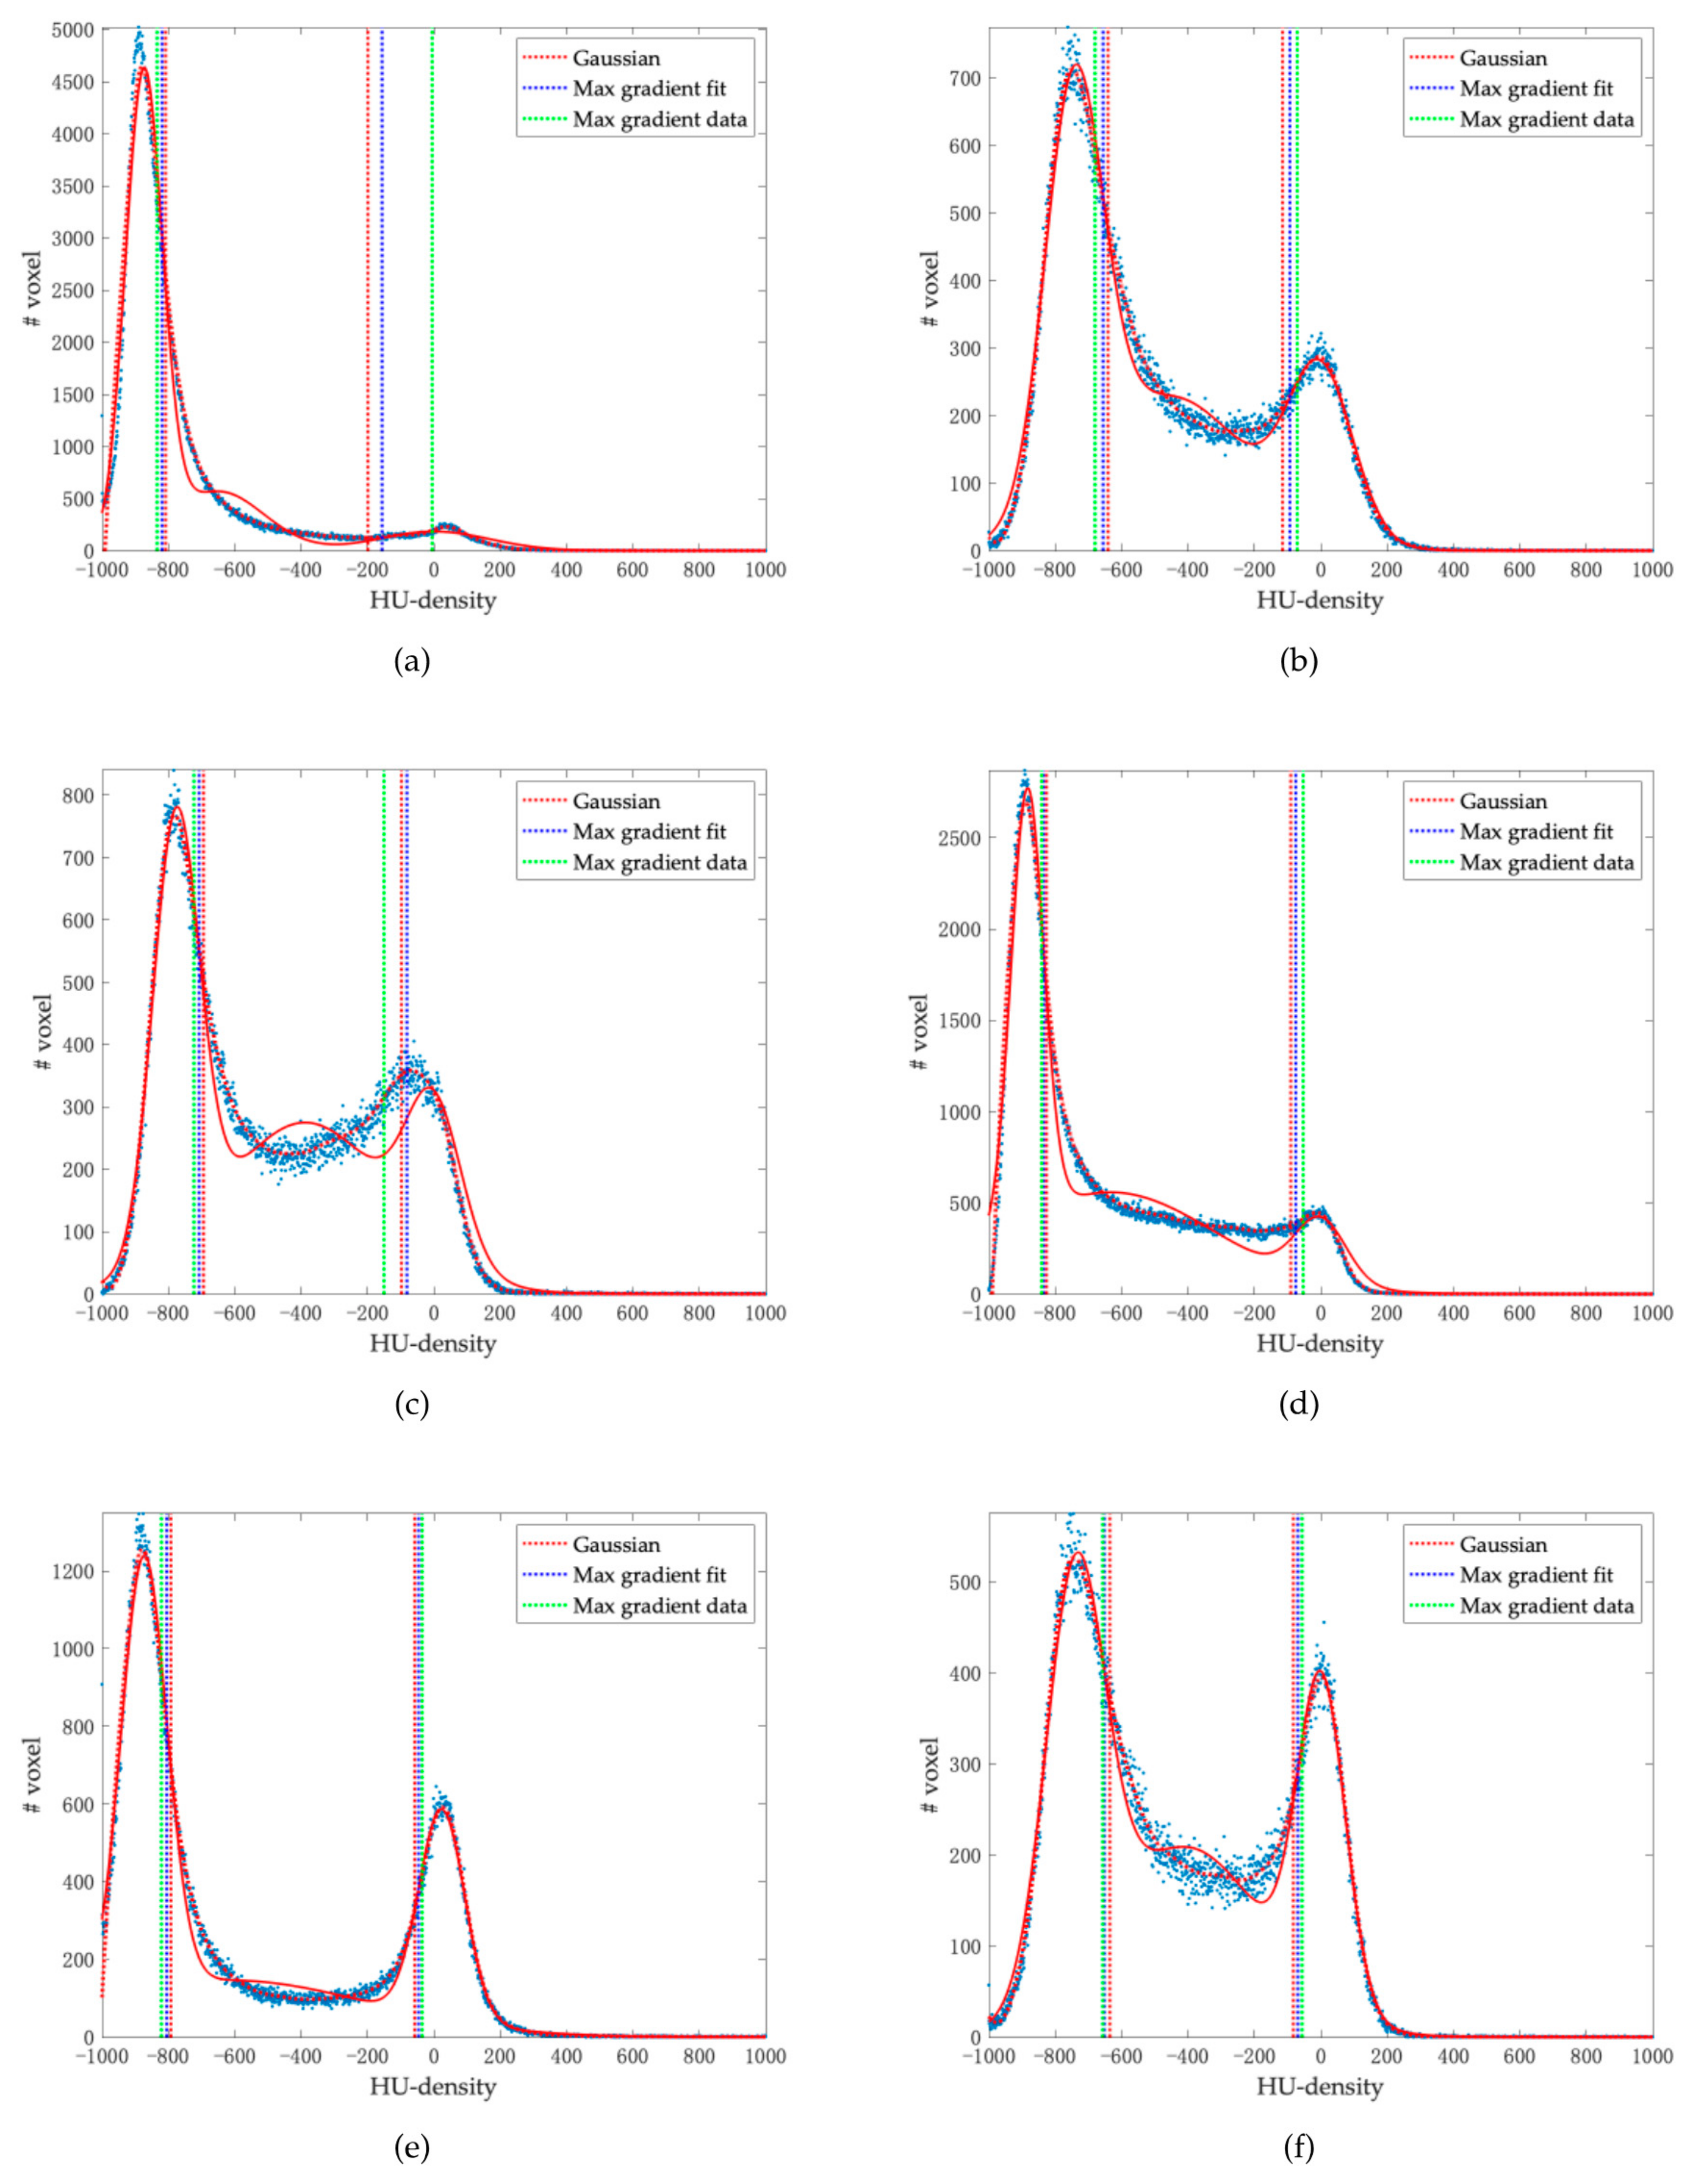
2.3. HU-Density Histograms

The first step in the implementation of a method for lung characterization in COVID patients is the accurate identification of the entire lung area. CT acquisitions of the 166 COVID-19 patients considered were initially analyzed, and the 332 lungs were manually segmented by a team of planners from the San Raffaele Scientific Institute (Milan, Italy) skilled in the manual segmentation of CT images for radiotherapy planning purposes. The contouring tool of the Eclipse software (Varian Medical System, Inc. Palo Alto, CA, USA) was used for the manual segmentation of the lungs. Both the aerated component and the component affected by COVID pneumonia were included within the contours thus identified. Right and left lungs were delineated separately for each patient. Since the original dimensions of CT voxels vary depending on the equipment used, CT images were resampled with an isotropic 1.5 × 1.5 × 1.5 mm3 voxel size, in order to reduce the impact of the different CT voxel dimension used during the acquisition. The original lung contours were overlaid on the resampled images, without any significative differences. The consistency of the contours was checked on a sample of patients by two skilled radiologists. On the other hand, “little” inter-observer variations in lung contouring are not expected to significantly influence our approach, as the threshold values were well away from the inferior and superior HU limits and identifying internal volumes. All procedures regarding the resampling at cubic voxel and the analysis of the resampled images to extract lung HU-density histograms were performed with a specific workflow designed with the MIM software [30]. Each HU-density unit was associated with the number of voxels having that HU-density value; this was performed for each individual lung.

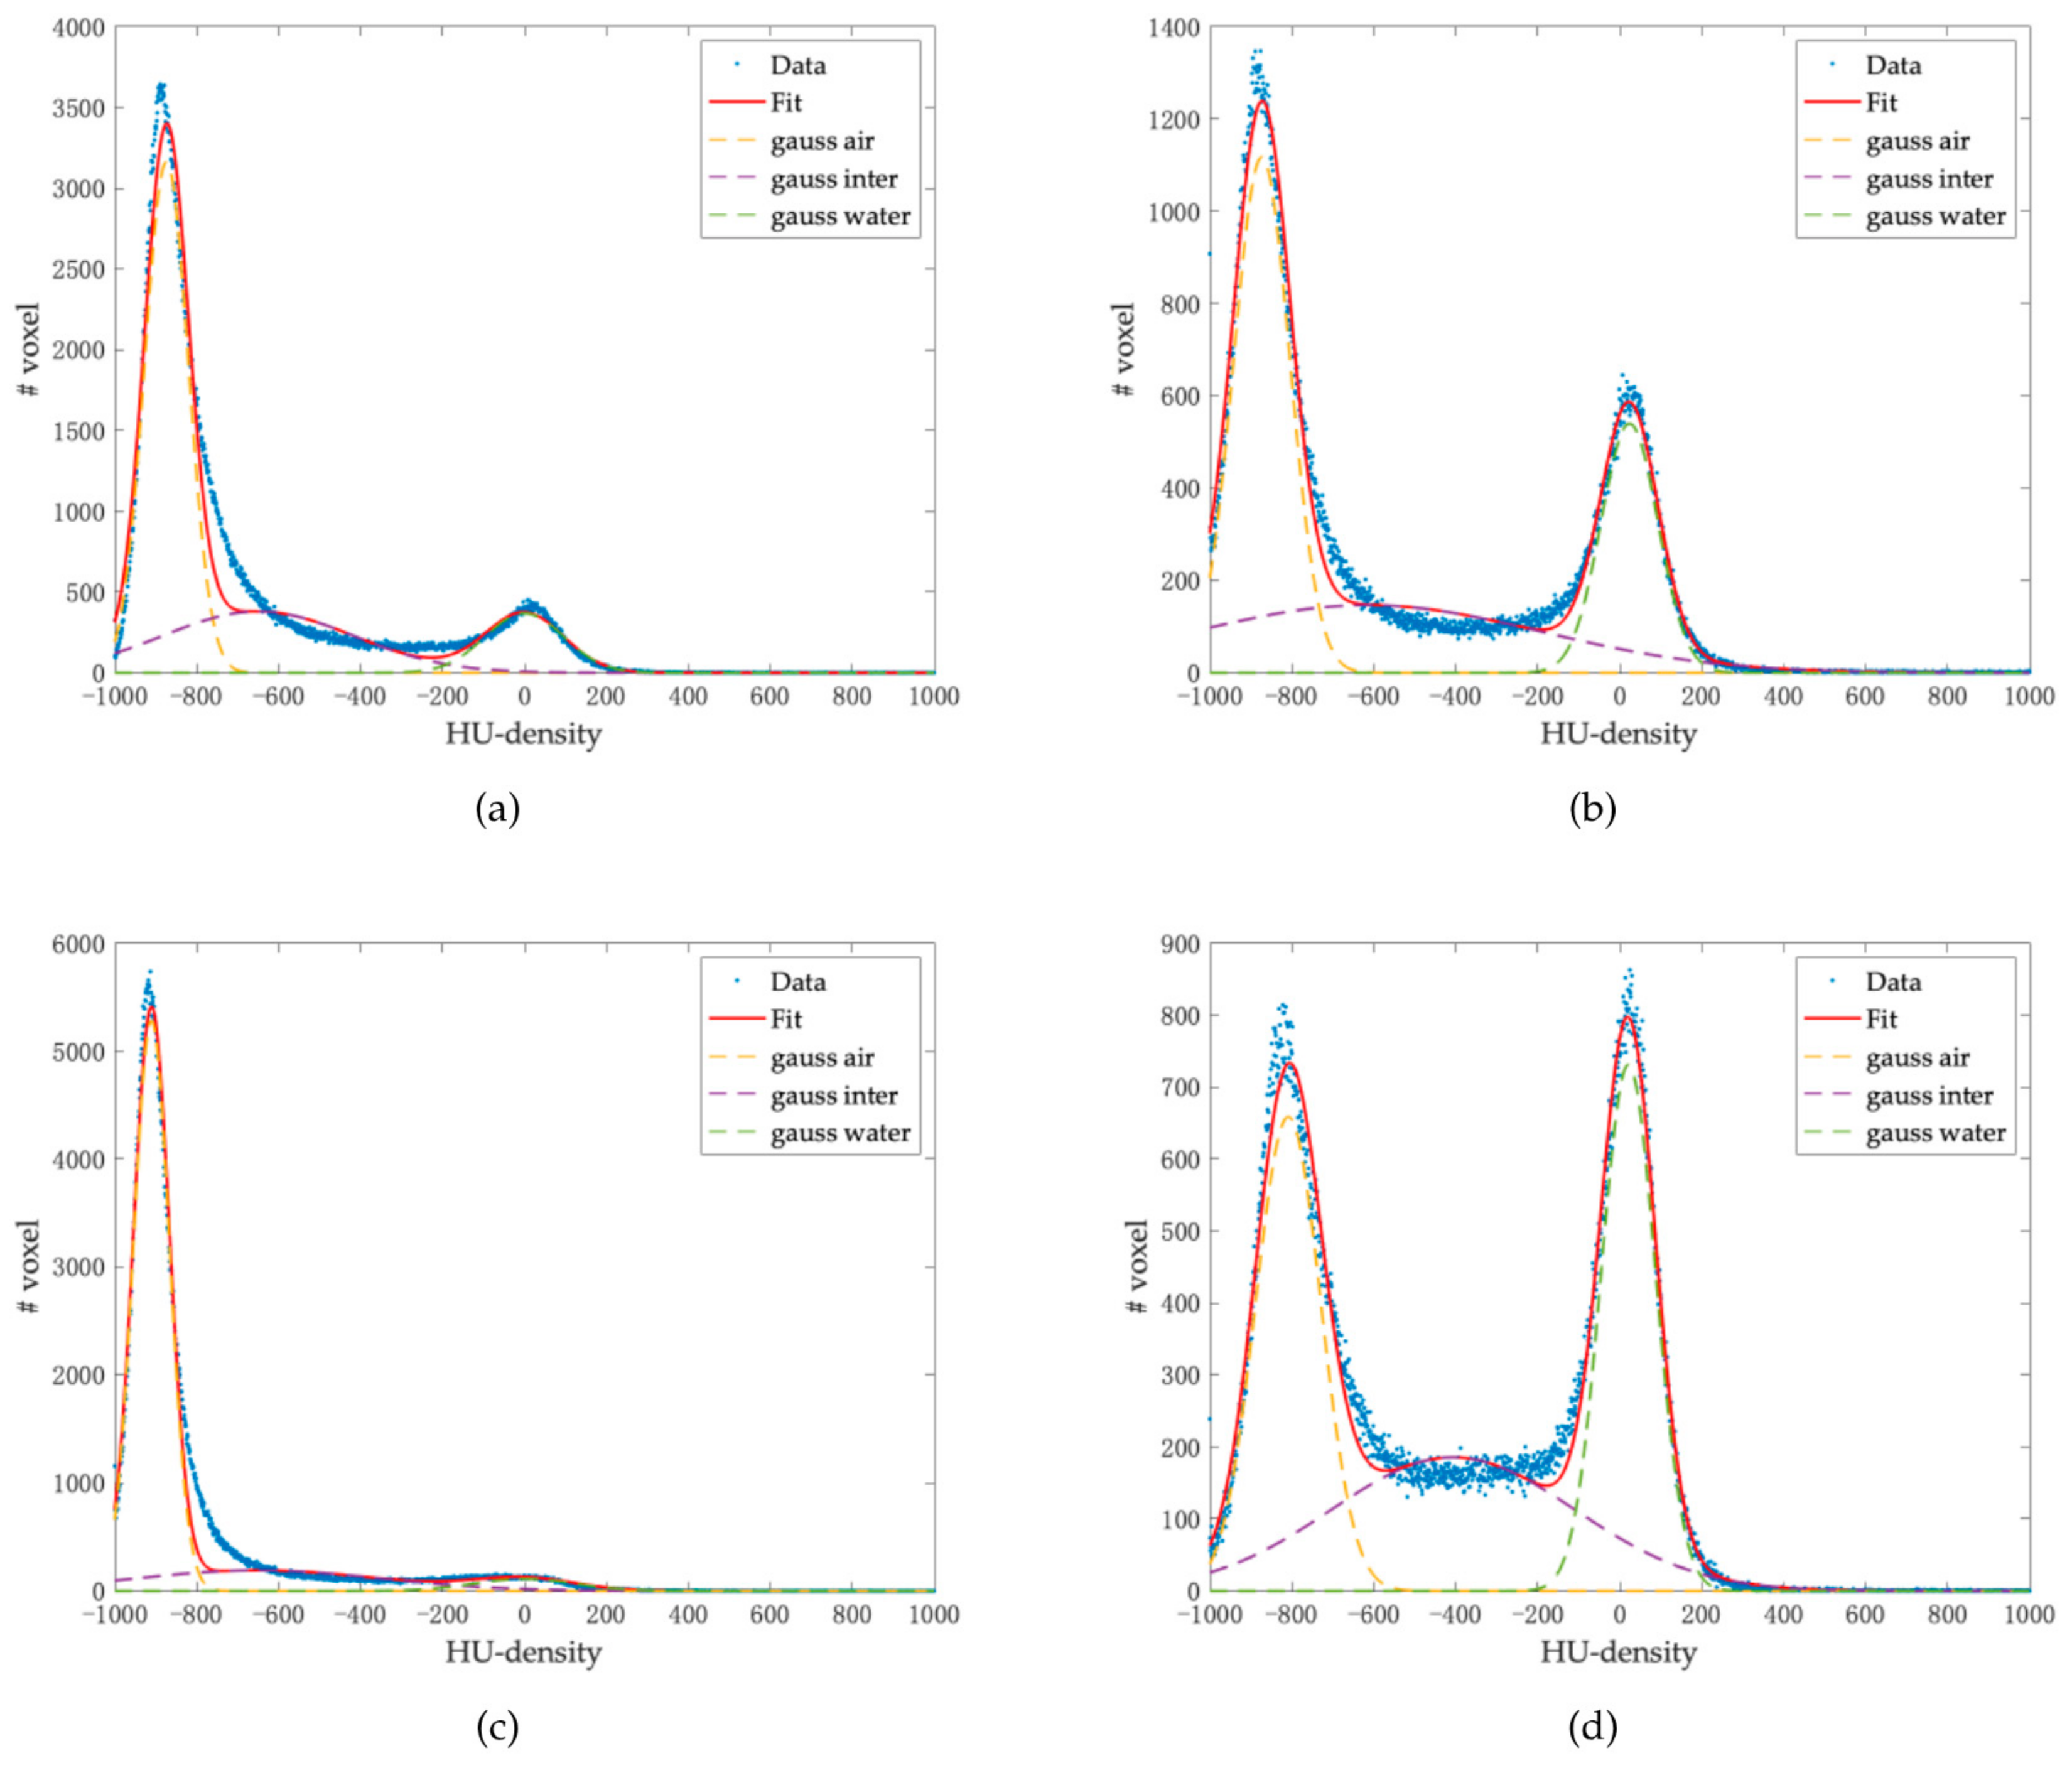
2.4. Threshold Definition Methods

Considering the typical HU-distribution, lungs may be divided into three regions: the aerated component, the consolidated component and an intermediate component. The HU density of the lungs of COVID-19 patients is generally characterized by the presence of two peaks with a shape similar to that of a Gaussian curve, as shown in Figure 1, one next to the air HU (−1000 HU) which defines the aerated, and therefore “properly” functioning, lung; and one next to the water HU (0 HU) [29] corresponding to the lung component with consolidated disease. Between these two peaks there is a quite evident and pronounced region with highly variable patterns from patient to patient. This region corresponds to the component of the lung affected by the disease, but not yet scarred, and mostly includes ground glass opacities (GGO) and crazy-paving regions. The corresponding region in the HU distribution plot often has a plateau-like trend, while in most cases it is characterized by a bell shape. Taking into account the shape of the HU-density distributions, different strategies were followed to individually define the best threshold values for distinguishing the different lung components.
The first method consisted of parameterizing the distribution of the HU densities of the individual lungs with a curve given by the linear combination of three Gaussian curves, and considering the half-width half-maximum of the curves to assess the thresholds. This method was named the “Gaussian method”. The three Gaussians used in the fit corresponded to the three lung components (see Figure 2). The resulting function used for the fit was as follows:
f i t x = a 1 × exp x b 1 c 1 2 + a 2 × exp x b 2 c 2 2 + a 3 × exp x b 3 c 3 2
where:
  • x are the values of the densities HU;
  • a1, a2, and a3 are the multiplicative coefficients of the Gaussians;
  • b1, b2, and b3 represent the mean values of the Gaussians;
  • c1, c2, and c3 are related to the standard deviation from the relation c2 = 2σ2;
  • Subscript 1 refers to the Gaussian related to the aerated component;
  • Subscript 2 refers to the Gaussian related to the intermediate component;
  • Subscript 3 to the Gaussian related to the consolidated component.
Concerning the fit, it was imposed that the search for peaks corresponding to the aerated and consolidated components would start from the HU-density values typical of air (−1000 HU) and water (0 HU), respectively. The standard deviation σ of the individual Gaussians was obtained from the fit and used to determine the thresholds. The thresholds were given by the following relations:
th 1 = b 1 + σ 1
th 2 = b 3 σ 3
where:
  • th1 is the value of HU that separates the aerated component from the intermediate one;
  • th2 is the value of HU that separates the intermediate component from the consolidated one;
  • b1 and b3 are the mean values of the Gaussians and σ1 and σ3 are the relative standard deviations.
All fits were realized with a Matlab script using the cftool for the curve fitting. The fitting method used was the non-linear least squares with the least absolute residual method.
The second method was the maximum gradient “on the fit”. With this approach the proper inflection points of the curve were found by looking at the points where the second derivative of the curves was 0.
The third method used was similar to the previous one, without considering the Gaussian fit but directly using the original data. This method was identified as maximum gradient “on the data”. The frequency values of the individual HU densities were jagged, and thus had many inflection points. Therefore, in order to apply the maximum gradient method, it was necessary to post-process the distributions of the HU densities. First, a rebinning of the data to 25 HU was performed; the values obtained were then interpolated, and a smooth function applied (see Figure 3). At this point it was possible to apply the maximum gradient method, as in the case of the fit function, and find the threshold values.
For each of the three methods, the individual thresholds for each lung and the median values over the whole population were extracted.
The threshold values individually obtained with the three methods were then compared by means of Kuskall–Wallis tests. Summary statistics of the different lung components and their relative ratios were also reported focusing on the third method, which was found to be the most stable in defining th2 (including visual inspection by two expert radiologists of 30 sample patients).

3. Results

3.1. Impact of the HU-Density Calibration Curve

The variation of the HU values among the different acquisitions (range 0 to 4 HU) was much smaller than the standard deviation of the HU values within each ROI for the single acquisition (range 38 to 69 HU). For this reason, a single HU calibration curve can be considered given by the average of all the measurements made at the different currents also for GE LightSpeed. The values of the calibration curves for the different types of equipment were then compared. It was found that the standard deviation of the HU values of the inserts was considerably smaller than the average of the standard deviations (SD) relating to the measurement on the inserts. Results are shown in detail in Table 2 and Figure 4.
In summary, we can assume that inter-scanner variability did not significantly affect the HU values of the CT images, regardless of the current used during scanning. The resulting HU-density histograms can therefore be considered reasonably consistent.

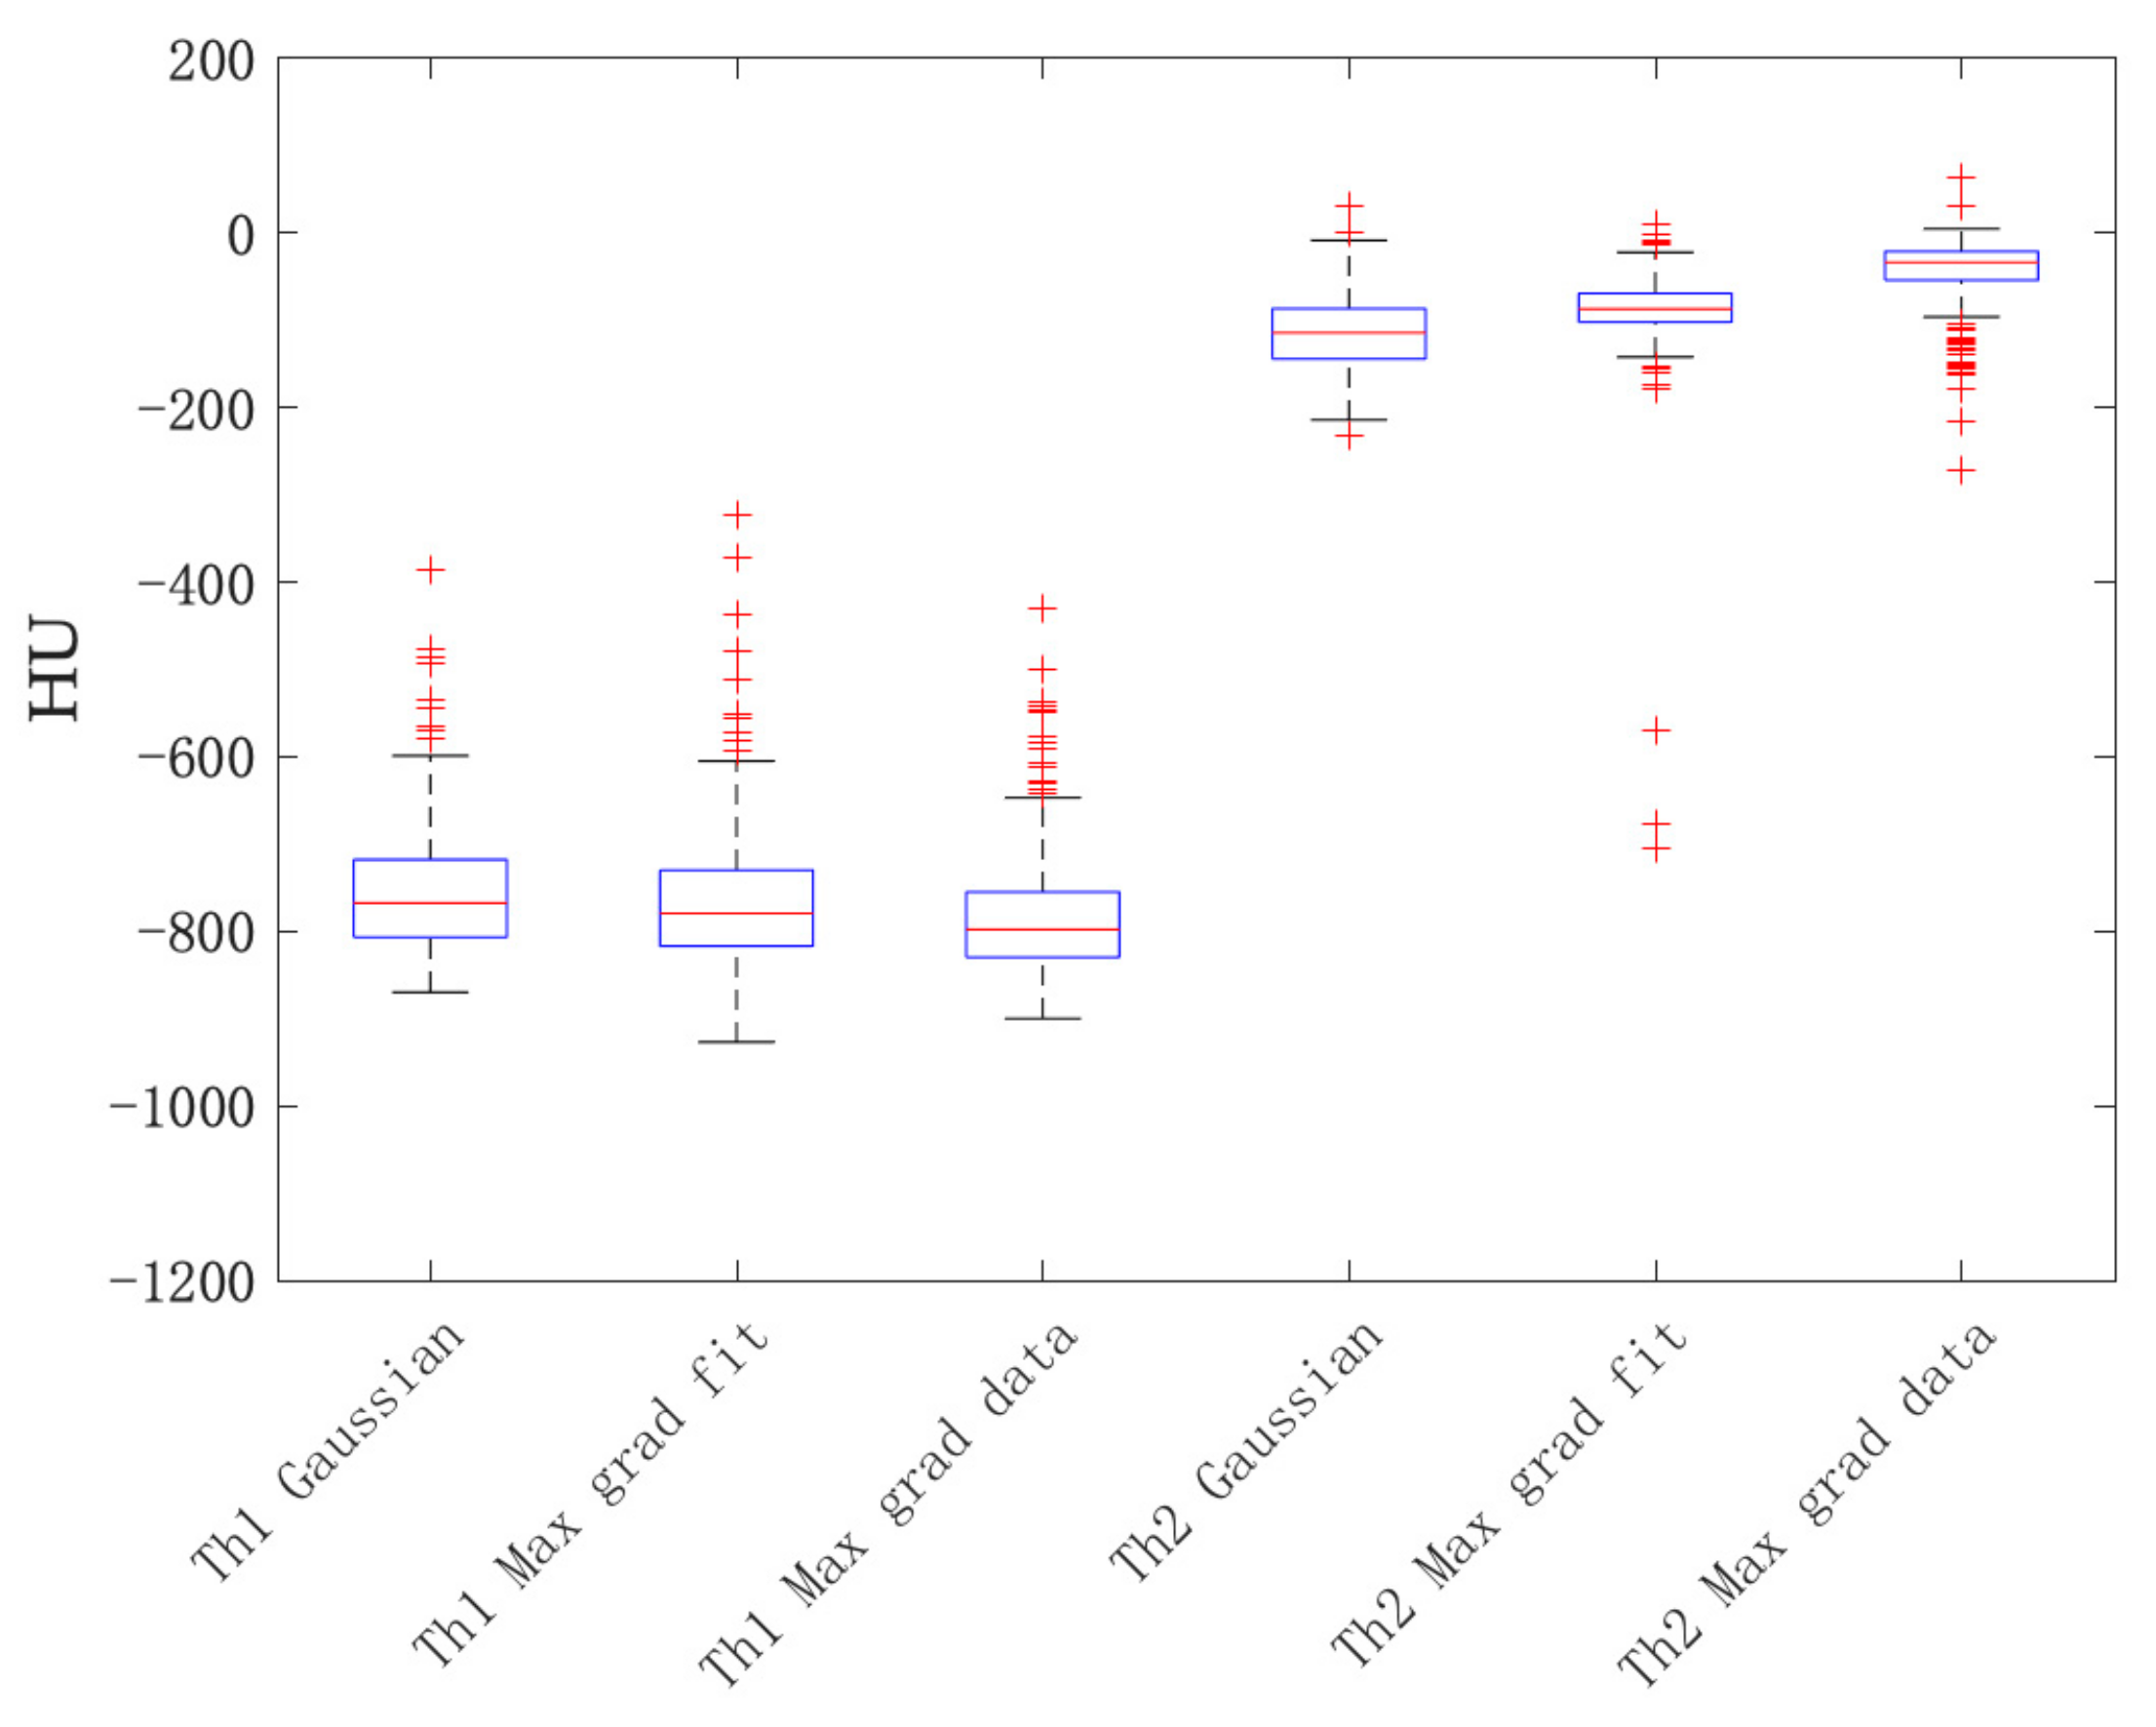
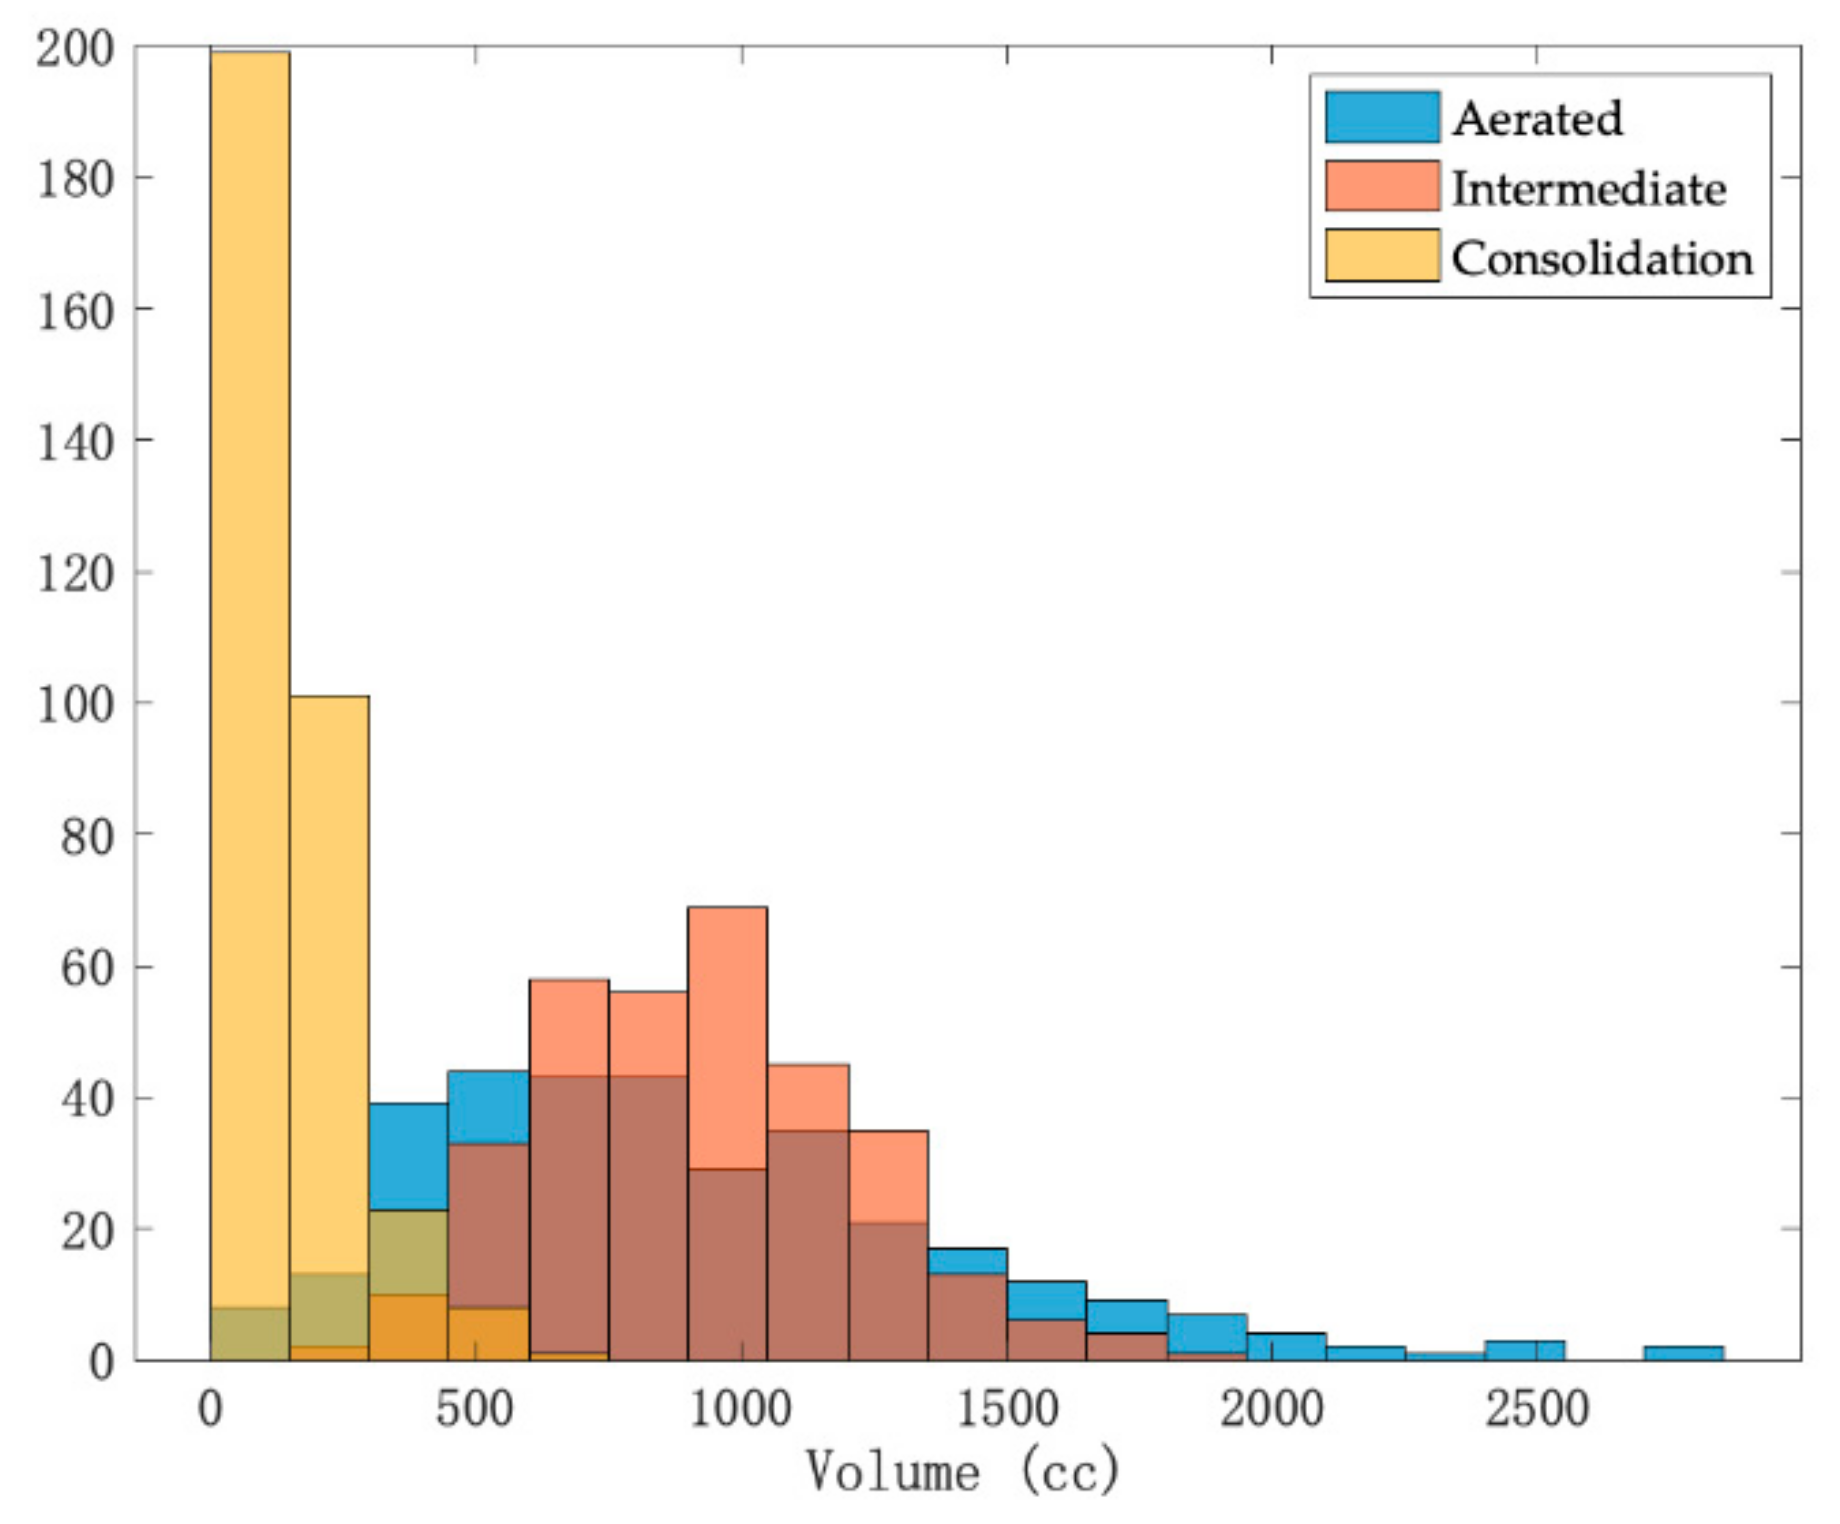
3.2. HU-Density Histogram Parameters—Extraction and Analysis of 166 COVID-19 Patients

Through the script created in the Matlab environment, all the histograms were succesfully fitted; for each of them, the values of the HU thresholds between the aerated and intermediate components (th1) and between the intermediate and consolidated (th2) were calculated for each of the individual lungs using the methods described:
  • Gaussian;
  • Maximum gradient on the fit;
  • Maximum gradient on the data.
Examples of several histograms of representative lungs are shown in Figure 5 as results of the application of the three methods. Overall (see Table 3), the th1 threshold values using the Gaussian method were in the range of −870 to −386 HU, with a median and standard deviation of −768 and 73 HU, respectively; values obtained with the th2 threshold were between−232 and 32 HU with median and standard deviation of −114 and 41 HU, respectively. Using the method of the maximum gradient on the fit, the HU range was −927 to −322 HU with median and standard deviation of −780 and 77 HU for the threshold th1, and −706 to 10 HU with median and standard deviation of −87 and 61 HU, respectively, for the th2 threshold. Lastly, the values obtained with the maximum gradient method on the data were, for the threshold th1, a range of −900 to −430 HU and median and standard deviation of −798 and 71 HU, and a range of −271 to 64 HU with −34 ± 41 HU for the median and standard deviation of the th2 threshold.
The Kruskal–Wallis non-parametric statistical significance test demonstrates that the distributions of the values of the thresholds th1 and th2 calculated with the three methods described were statistically different, with a significance level p-value <0.001 for both thresholds. While inter-patient variability was low for the th2 threshold, th1 threshold values were far more variable, as they concerned the fibrotic component of the consolidated lung.
This is likely because the aerated component of the lung obtained from CT images, taken in conditions of maximum inspirium, is an extremely patient-dependent measure of lung function.
As can be seen from the boxplots in Figure 6, the method with the least dispersion was the maximum gradient on the data. Also from the qualitative point of view, it was clear that the method that visually best identified the separation of the components of the lungs of COVID-19 patients was that of maximum gradient on the data. Of note, the approach of using a plot that follows the trend of real data, rather than a fit made on these data, removes the intrinsic uncertainty linked to the fit, obtaining values that better represent the true condition of the lungs. Consequently, in the remaining part of this work, sub-segmentation will always refer to this method.
After identifying the threshold values that separate the components of the lungs in COVID-19 patients, information characterizing each of the regions of the lungs was extracted from the histograms. The first relevant parameter extracted was the volume (in cc) of the aerated, intermediate, and consolidation regions. To calculate the volume in cc starting from the CT images, the area under the curve of the HU-density histograms was considered. Each voxel had a known size of 1.5 × 1.5 × 1.5 mm3; thus the area under the curve was linked to the volume of the lung considered with a normalization factor taking voxel size into account.
Figure 7 shows the histogram of the volume distributions of the lung components within the entire patient population. The bin size used was 150 cc. It can be seen that the consolidated component had the smallest volume, with a median value of 126 cc ± 111 cc. The intermediate component had a median volume of 914 cc with a standard deviation of 291 cc, while the aerated component had a median volume of 793 ± 499 cc. In addition to the volumes of the lung regions, their ratio was also calculated. The absolute measurement of volumes, in fact, may not provide full information on the residual functionality of the lung. The values found for the consolidated over aerated component ratio and the ratio between intermediate and aerated components are shown in Figure 8 and were 0.16 ± 0.89 and 1.09 ± 2.56, respectively. Other extracted features that characterized the HU-density histogram were:
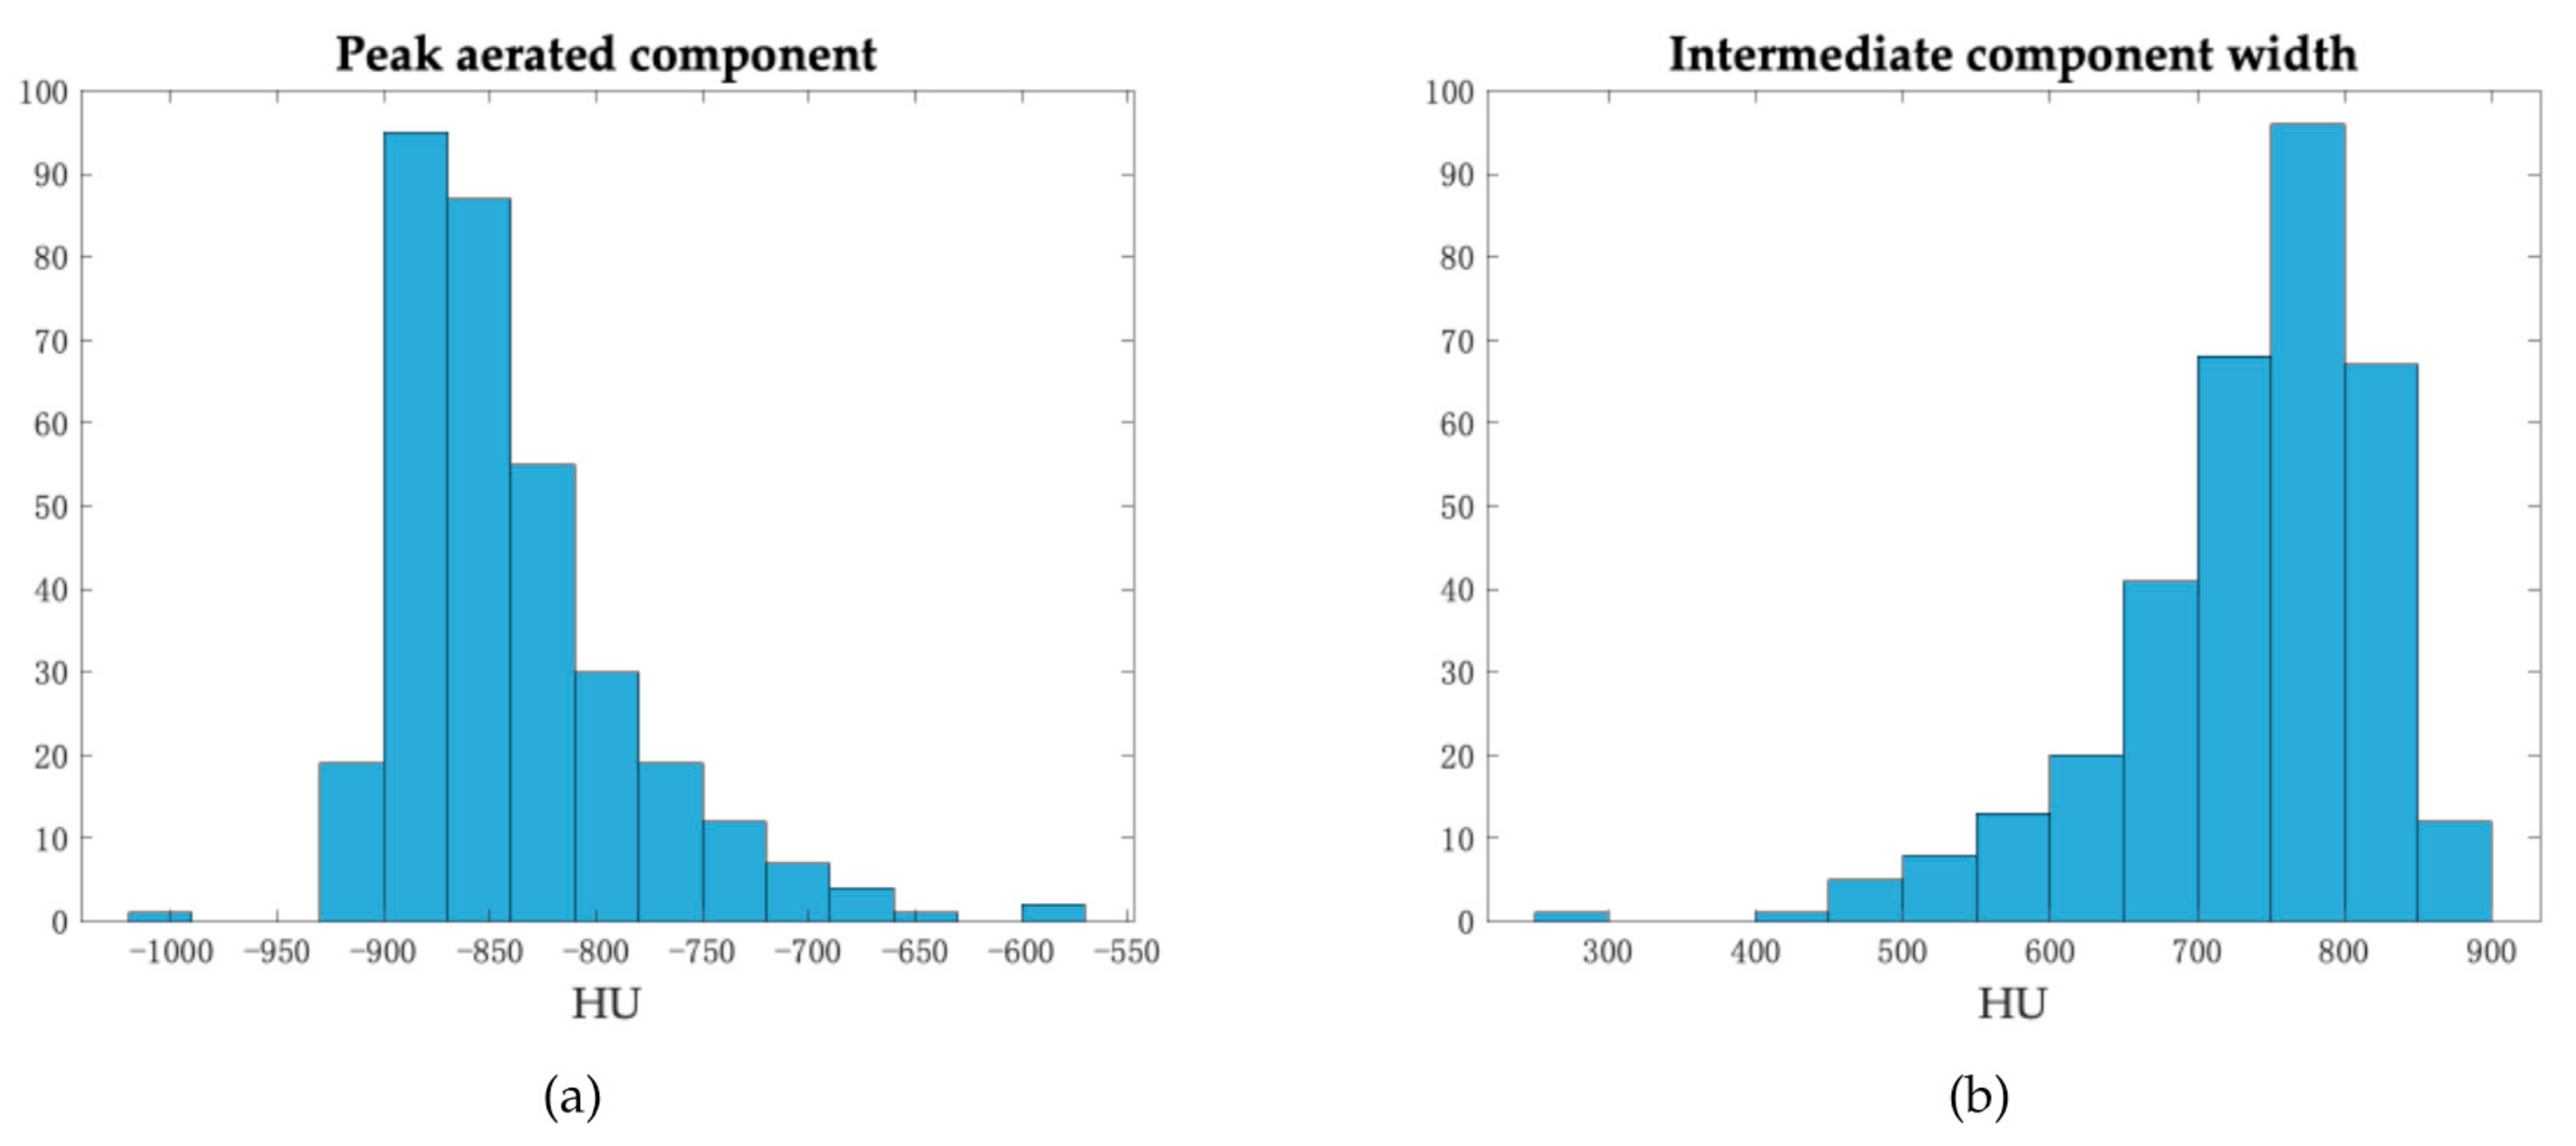
  • HU value corresponding to the peak of the curve for the aerated regions;
  • Shift with respect to −1000 HU, a characteristic value of the aerated component under normal conditions;
  • Width in HU of the intermediate region.
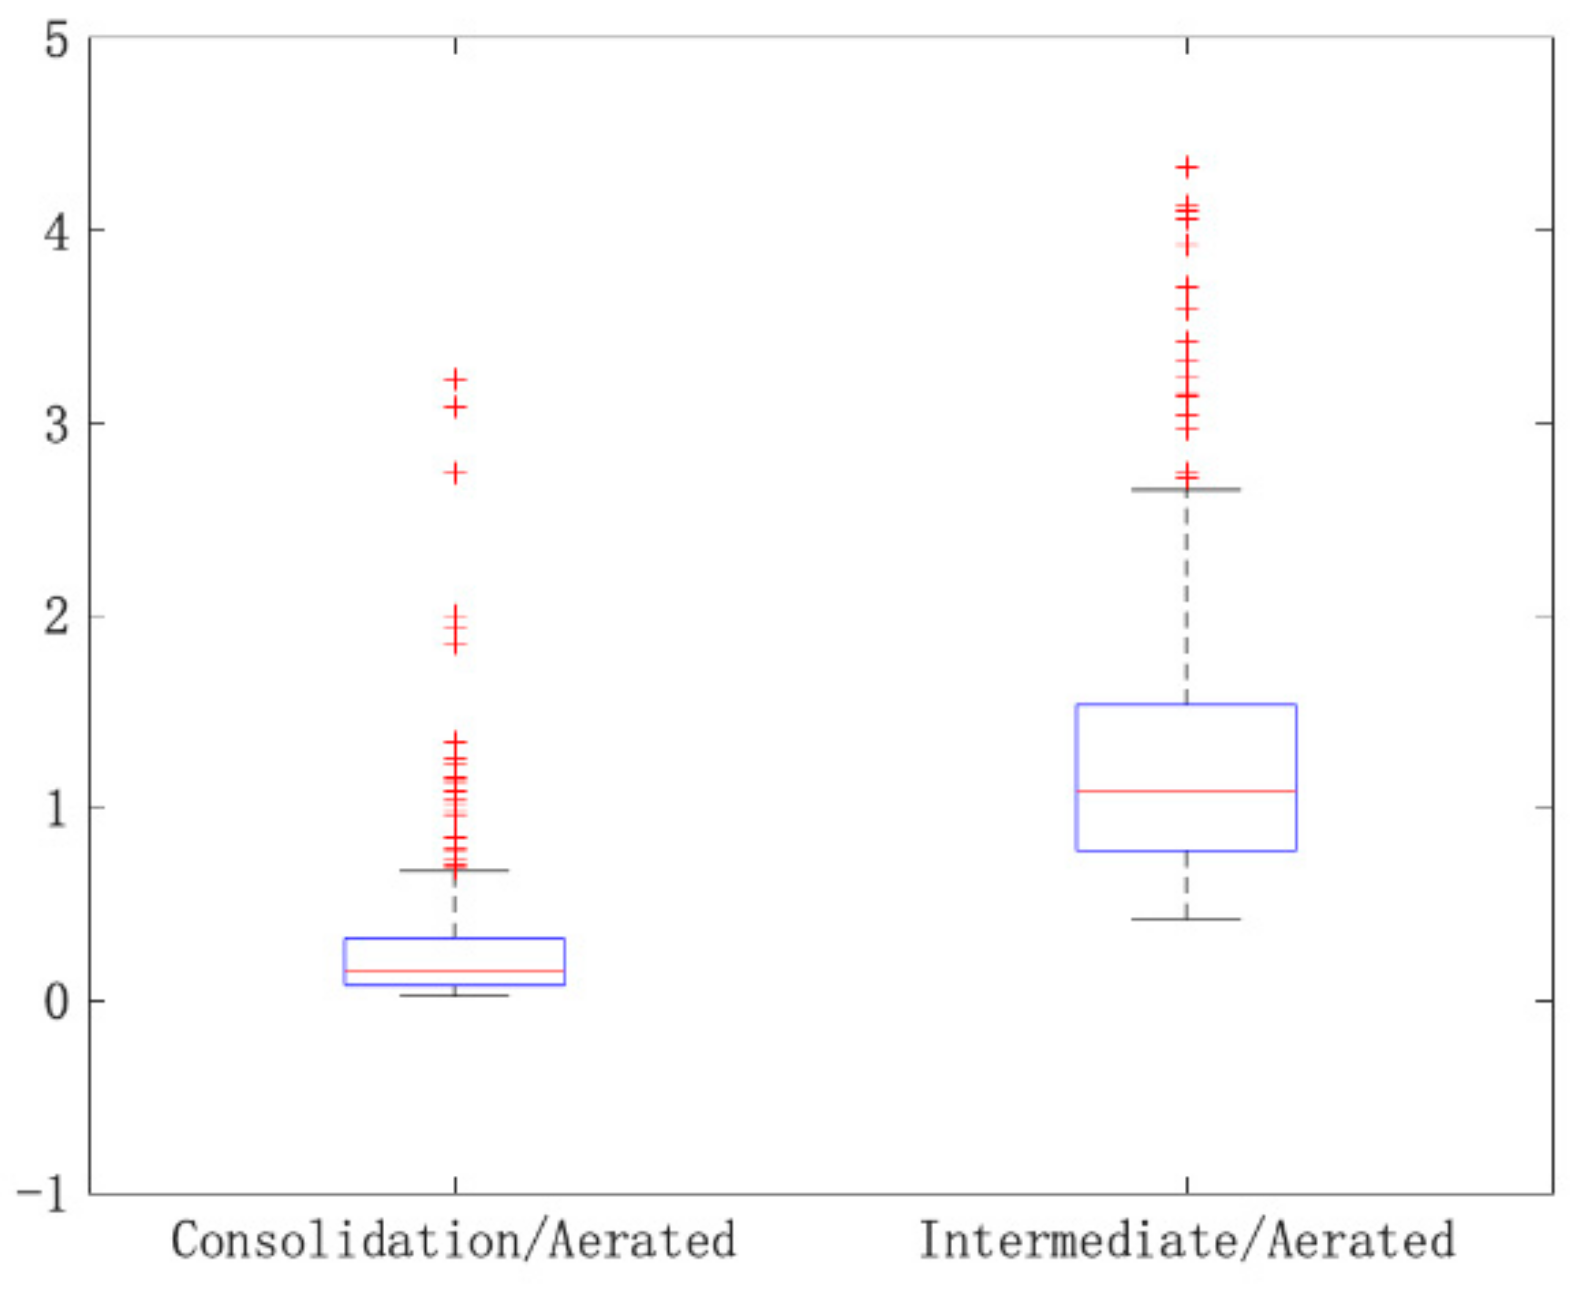
The median of the values of the peak position of the aerated region curve was −853 ± 56 HU in a range of −1000 to −583 HU. Consequently, the median value of the peak shift of the aerated region with respect to −1000 HU was 147 HU. The width of the intermediate region was calculated as the difference between the th2-th1 threshold values. The width values found were in the range of 282 to 878 HU, with a median and standard deviation of 754 and 88 HU, respectively. As shown in Figure 9, the inter-patient distribution of these values was very large and did not follow a Gaussian shape.

4. Discussion

The proposed method was based on the robust, operator-independent identification of threshold HU values that identified three regions here referred to as aerated, intermediate and consolidated, with intuitively clear functional meaning. It follows a phenomenological approach starting from the manual segmentation of the lung and then analyzing the shape of the HU histogram. Contrary to other approaches, the thresholds that define and differentiate the lung components were identified on the basis of the shape of the HU histograms, rather than second-order features and classifiers or radiologist preferences, thus maintaining a solid link with the residual lung functionality and eliminating, a priori, any operator dependence.
Prior to the quantitative analysis of the images, it was verified that the image database was consistent against inter-scanner variability, although 88% of patients were scanned on one (of the three) scanner. For this purpose, calibrated CT image quality phantom acquisitions at different X-ray currents were performed on each scanner. Importantly, inter-scanner variability was not found to significantly influence the HU value of CT images, and the database can thus be considered consistent.
The lung contours were initially segmented manually. Subsequently, through the implementation of an automatic procedure implemented in a workflow on the MIM software, histograms of the HU values inside the contours were extracted. The histograms obtained were analyzed by means of three different analytical methods.
The maximum gradient on the data method, likely to fit better with visual consistency in lung component separation, was applied in order to quantify the three components in our population. The consolidated component was found to have the smallest volume (126 ± 111 cc) and the intermediate and aerated components showed a volume of 914 ± 291 cc and 793 ± 499 cc, respectively. A number of parameters were also extracted:
  • Ratio between the consolidated component and the aerated component (0.16 ± 0.89);
  • Ratio between the intermediate component and the aerated component (1.09 ± 2.56);
  • HU value corresponding to the peak of the curve for the aerated regions (−853 ± 56 HU);
  • Width in HU of the intermediate region (754 ± 88 HU).
Some considerations may be made when comparing the findings of the current work with other reported results. Colombi et al. [18], for instance, reported a median value of 2900 cc for the aerated component of both lungs in a large population of patients hospitalized in a center in a neighboring city in the same period as our study; this value was significantly higher than ours (considering paired lungs, by about 1600 cc). This difference could be explained by the different segmentation methods used; in fact, Colombi et al. used fixed threshold values of −950 to −700 HU, while we adopted individual thresholds optimized for the distinction between the aerated component and the intermediate component, with a far lower th1 value compared to those found by our individually assessed method. Leonardi et al. [16] reported that the percentage of the lung involved in the disease varied from 6%, for non-critically ill patients, to 38%, for critically ill patients. Their definition of the lung component involved in the disease, manually segmented, seemed to include parts of what we identified as an intermediate component, and this could explain the higher mean values relative to our consolidation estimates (by about 6.4%). Matos et al. [17] reported a median volume of disease of 295 cc on the two lungs, quite consistent with our results. Their method of segmentation of the consolidated component was semi-automatic; the radiologist identified areas of the disease and a region-growing algorithm was then applied, likely resulting in the identification of individual thresholds based on maximum contrast with the tissue surrounding the consolidated component. Liu et al. [15], by applying thresholds to CT values, extracted three quantitative features corresponding to the percentage of GGO volume, semi-consolidation volume and consolidation volume. The percentages of GGO and semi-consolidation volumes were part of what we defined as intermediate component, and were therefore not directly comparable. The consolidation volume percentage obtained in this study was 5.8%, comparable to our estimate (6.4%). Lyu et al. [28] found a volume percentage for the aerated component, using fixed threshold values of −950 to −800 HU, of 43% of the entire segmented lung. This value was in line with that found with our segmentation method, as could be expected, as their fixed threshold value was similar to the median value of our population.
More generally, concerning the choice of threshold to define the aerated component, our findings suggest that for COVID-19 patients the quantity of air inflated during a deep inspiration before the CT scan is highly variable among patients, reflecting the variable residual functionality of the aerated lung. Thus, the individual choice of a “best threshold “ seems to be a more reasonable option, able to adapt the “aerated lung” definition to each individual patient/lung. In addition, the relatively large variability of the peak position of the aerated component is also a clear measurement of the change of lung perfusion compared to healthy patients, typically presenting their peak at much lower values.
In conclusion, this work allowed the development of a semi-automatic, operator independent segmentation method identifying the main lung components of COVID-19 patients with respiratory syndrome. Our approach intrinsically gives clear functional meaning to the different sub-volumes identified and overcame the approximation due to the choice of fixed thresholds, taking individual lung functionality carefully into account; this is especially true for th1. Very importantly, due to its simplicity and to the clear, reproducible and interpretable features that can be extracted, the suggested approach can easily be transferred from our institute.
Work is currently underway to make the segmentation method fully automatic; as a matter of fact, manual segmentation is cumbersome and this is a limit of our current approach. An atlas, based on CT images of COVID-19 patients, has been developed to automate the initial identification of the lungs, and is currently being validated. Combining this atlas with the method suggested here should allow an automatic sub-segmentation of the lung components to be obtained in no more than a few minutes. In addition, the quantitative analysis carried out on the HU histograms is being applied to develop predictive models of early clinical outcome. On the other hand, atlas-based approaches for automatic segmentation of the whole lungs do not represent the only way to solve the issue; further research regarding AI/deep learning approaches may be warranted.

Author Contributions

Conceptualization, A.M., C.F. and A.d.V.; Data curation, A.M., A.L., M.M. and D.P.; Formal analysis, A.M., A.L., M.M. and P.G.E.; Investigation, C.F. and A.d.V.; Methodology, A.M., C.F., A.L. and M.M.; Software, A.M. and P.G.E.; Supervision, C.F., F.d.C. and A.d.V.; Writing—original draft, A.M.; Writing—review & editing, C.F., A.L., M.M., P.G.E., D.P., F.d.C. and A.d.V. All authors have read and agreed to the published version of the manuscript. All authors have read and agreed to the published version of the manuscript.

Funding

M. Mori is funded by an AIRC grant (IG 23015).

Institutional Review Board Statement

This study was conducted within the COVID-19 Institutional study (COVID-BioB, Clinical trials govNCT04318366), San Raffaele Scientific Institute, Milano, Italy.

Informed Consent Statement

Informed consent was obtained from all subjects involved in the study.

Data Availability Statement

Due to the study property design, data are not publicly available.

Acknowledgments

The authors thank Davide Raspanti (TEMA Sinergie) for his valued support in the development and implementation of MIM workflows.

Conflicts of Interest

The authors declare no conflict of interest.

References

  1. Coronavirus Disease (COVID-19) n.d. Available online: https://www.who.int/emergencies/diseases/novel-coronavirus-2019 (accessed on 9 November 2020).
  2. Agricola, E.; Beneduce, A.; Esposito, A.; Ingallina, G.; Palumbo, D.; Palmisano, A.; Ancona, F.; Baldetti, L.; Pagnesi, M.; Melisurgo, G.; et al. Heart and Lung Multimodality Imaging in COVID-19. JACC: Cardiovasc. Imaging 2020, 13, 1792–1808. [Google Scholar] [CrossRef]
  3. Wen, Z.; Chi, Y.; Zhang, L.; Liu, H.; Du, K.; Li, Z.; Chen, J.; Cheng, L.; Wang, D. Coronavirus Disease 2019: Initial Detection on Chest CT in a Retrospective Multicenter Study of 103 Chinese Patients. Radiol. Cardiothorac. Imaging 2020, 2, e200092. [Google Scholar] [CrossRef] [Green Version]
  4. Ai, T.; Yang, Z.; Hou, H.; Zhan, C.; Chen, C.; Lv, W.; Tao, Q.; Sun, Z.; Xia, L. Correlation of Chest CT and RT-PCR Testing for Coronavirus Disease 2019 (COVID-19) in China: A Report of 1014 Cases. Radiology 2020, 296, E32–E40. [Google Scholar] [CrossRef] [Green Version]
  5. Bernheim, A.; Mei, X.; Huang, M.; Yang, Y.; Fayad, Z.A.; Zhang, N.; Diao, K.; Lin, B.; Zhu, X.; Li, K.; et al. Chest CT findings in coronavirus disease 2019 (COVID-19): Relationship to duration of infection. Radiology 2020, 295, 685–691. [Google Scholar] [CrossRef] [Green Version]
  6. Pan, F.; Ye, T.; Sun, P.; Gui, S.; Liang, B.; Li, L.; Zheng, D.; Wang, J.; Hesketh, R.L.; Yang, L.; et al. Time course of lung changes at chest CT during recovery from coronavirus disease 2019 (COVID-19). Radiology 2020, 295, 715–721. [Google Scholar] [CrossRef] [PubMed] [Green Version]
  7. Shi, H.; Han, X.; Jiang, N.; Cao, Y.; Alwalid, O.; Gu, J.; Fan, Y.; Zheng, C. Radiological findings from 81 patients with COVID-19 pneumonia in Wuhan, China: A descriptive study. Lancet Infect. Dis. 2020, 20, 425–434. [Google Scholar] [CrossRef]
  8. Zhao, W.; Zhong, Z.; Xie, X.; Yu, Q.; Liu, J. Relation between chest CT findings and clinical conditions of coronavirus disease (COVID-19) pneumonia: A multicenter study. Am. J. Roentgenol. 2020, 214, 1072–1077. [Google Scholar] [CrossRef] [PubMed]
  9. Song, F.; Shi, N.; Shan, F.; Zhang, Z.; Shen, J.; Lu, H.; Ling, Y.; Jiang, Y.; Shi, Y. Emerging 2019 novel coronavirus (2019-NCoV) pneumonia. Radiology 2020, 295, 210–217. [Google Scholar] [CrossRef] [Green Version]
  10. Hansell, D.M.; Bankier, A.A.; MacMahon, H.; McLoud, T.C.; Müller, N.L.; Remy, J. Fleischner Society: Glossary of terms for thoracic imaging. Radiology 2008, 246, 697–722. [Google Scholar] [CrossRef] [Green Version]
  11. Hamer, O.W.; Salzberger, B.; Gebauer, J.; Stroszczynski, C.; Pfeifer, M. CT morphology of COVID-19: Case report and review of literature. RöFo 2020, 192, 386–392. [Google Scholar] [CrossRef] [Green Version]
  12. Li, K.; Wu, J.; Wu, F.; Guo, D.; Chen, L.; Fang, Z.; Li, C. The Clinical and Chest CT Features Associated with Severe and Critical COVID-19 Pneumonia. Investig. Radiol. 2020, 55, 327–331. [Google Scholar] [CrossRef] [PubMed]
  13. Han, R.; Huang, L.; Jiang, H.; Dong, J.; Peng, H.; Zhang, D. Early Clinical and CT Manifestations of Coronavirus Disease 2019 (COVID-19) Pneumonia. Am. J. Roentgenol. 2020, 215, 338–343. [Google Scholar] [CrossRef] [PubMed]
  14. Simpson, S.; Kay, F.U.; Abbara, S.; Bhalla, S.; Chung, J.H.; Chung, M.; Henry, T.S.; Kanne, J.P.; Kligerman, S.; Ko, J.P.; et al. Radiological Society of North America Expert Consensus Statement on Reporting Chest CT Findings Related to COVID-Endorsed by the Society of Thoracic Radiology, the American College of Radiology, and RSNA—Secondary Publication. J. Thorac. Imaging 2020, 35, 219–227. [Google Scholar] [CrossRef] [PubMed]
  15. Liu, F.; Zhang, Q.; Huang, C.; Shi, C.; Wang, L.; Shi, N.; Fang, C.; Shan, F.; Mei, X.; Shi, J.; et al. CT quantification of pneumonia lesions in early days predicts progression to severe illness in a cohort of COVID-19 patients. Theranostics 2020, 10, 5613–5622. [Google Scholar] [CrossRef] [PubMed]
  16. Leonardi, A.; Scipione, R.; Alfieri, G.; Petrillo, R.; Dolciami, M.; Ciccarelli, F.; Perotti, S.; Cartocci, G.; Scala, A.; Imperiale, C.; et al. Role of computed tomography in predicting critical disease in patients with covid-19 pneumonia: A retrospective study using a semiautomatic quantitative method. Eur. J. Radiol. 2020, 130, 109202. [Google Scholar] [CrossRef] [PubMed]
  17. Matos, J.; Paparo, F.; Mussetto, I.; Bacigalupo, L.; Veneziano, A.; Bernardi, S.P.; Biscaldi, E.; Melani, E.; Antonucci, G.; Cremonesi, P.; et al. Evaluation of novel coronavirus disease (COVID-19) using quantitative lung CT and clinical data: Prediction of short-term outcome. Eur. Radiol. Exp. 2020, 4, 1–10. [Google Scholar] [CrossRef]
  18. Colombi, D.; Bodini, F.C.; Petrini, M.; Maffi, G.; Morelli, N.; Milanese, G.; Silva, M.; Sverzellati, N.; Michieletti, E. Well-aerated Lung on Admitting Chest CT to Predict Adverse Outcome in COVID-19 Pneumonia. Radiology 2020, 296, E86–E96. [Google Scholar] [CrossRef] [Green Version]
  19. Sperrin, M.; Grant, S.W.; Peek, N. Prediction models for diagnosis and prognosis in Covid-19. BMJ 2020, 369, m1464. [Google Scholar] [CrossRef] [Green Version]
  20. Wynants, L.; Van Calster, B.; Collins, G.S.; Riley, R.D.; Heinze, G.; Schuit, E.; Bonten, M.J.M.; Dahly, D.L.; Damen, J.A.A.G.; Debray, T.P.; et al. Prediction models for diagnosis and prognosis of covid-19: Systematic review and critical appraisal. BMJ 2020, 369, m1328. [Google Scholar] [CrossRef] [Green Version]
  21. Zheng, Y.; Xiao, A.; Yu, X.; Zhao, Y.; Lu, Y.; Li, X.; Mei, N.; She, D.; Wang, D.; Geng, D.; et al. Development and validation of a prognostic nomogram based on clinical and CT features for adverse outcome prediction in patients with COVID-19. Korean J. Radiol. 2020, 21, 1007–1017. [Google Scholar] [CrossRef]
  22. Li, Y.; Yang, Z.; Ai, T.; Wu, S.; Xia, L. Association of “initial CT” findings with mortality in older patients with coronavirus disease 2019 (COVID-19). Eur. Radiol. 2020, 30, 6186–6193. [Google Scholar] [CrossRef] [PubMed]
  23. Li, L.; Qin, L.; Xu, Z.; Yin, Y.; Wang, X.; Kong, B.; Bai, J.; Lu, Y.; Fang, Z.; Song, Q.; et al. Using Artificial Intelligence to Detect COVID-19 and Community-acquired Pneumonia Based on Pulmonary CT: Evaluation of the Diagnostic Accuracy. Radiology 2020, 296, E65–E71. [Google Scholar] [CrossRef] [PubMed]
  24. Fang, M.; He, B.; Li, L.; Dong, D.; Yang, X.; Li, C.; Meng, L.; Zhong, L.; Li, H.; Li, H.; et al. CT radiomics can help screen the Coronavirus disease 2019 (COVID-19): A preliminary study. Sci. China Inf. Sci. 2020, 63, 1–8. [Google Scholar] [CrossRef]
  25. Harmon, S.A.; Sanford, T.H.; Xu, S.; Turkbey, E.B.; Roth, H.; Xu, Z.; Yang, D.; Myronenko, A.; Anderson, V.; Amalou, A.; et al. Artificial intelligence for the detection of COVID-19 pneumonia on chest CT using multinational datasets. Nat. Commun. 2020, 11, 1–7. [Google Scholar] [CrossRef] [PubMed]
  26. Long, J.B.; Ehrenfeld, J.M. The Role of Augmented Intelligence (AI) in Detecting and Preventing the Spread of Novel Coronavirus. J. Med Syst. 2020, 44, 1–2. [Google Scholar] [CrossRef] [PubMed] [Green Version]
  27. Lessmann, N.; Sánchez, C.I.; Beenen, L.; Boulogne, L.H.; Brink, M.; Calli, E.; Charbonnier, J.-P.; Dofferhoff, T.; Van Everdingen, W.M.; Gerke, P.K.; et al. Automated Assessment of COVID-19 Reporting and Data System and Chest CT Severity Scores in Patients Suspected of Having COVID-19 Using Artificial Intelligence. Radiology 2021, 298, E18–E28. [Google Scholar] [CrossRef] [PubMed]
  28. Lyu, P.; Liu, X.; Zhang, R.; Shi, L.; Gao, J. The performance of chest CT in evaluating the clinical severity of COVID-19 pneumonia. Investig. Radiol. 2020, 55, 412–421. [Google Scholar] [CrossRef]
  29. Kramme, R.; Hoffmann, K.-P.; Pozos, R. Springer Handbook of Medical Technology; Springer: Berlin/Heidelberg, Germany, 2011. [Google Scholar]
  30. MIM Maestro®, 6.9; MIM Software Inc: Cleveland, OH, USA, 2019.
Figure 1. Examples of Hounsfield unit (HU)-density histograms. The histograms shown correspond to the lungs of the same patient; in particular, (a) is the histogram relating to the right lung and (b) is the histogram relating to the left lung.
Applsci 11 01238 g001
Figure 2. (ad) Examples of HU-density histogram fit. Each plot shows the overall fit and the three Gaussians that compose it.
Applsci 11 01238 g002
Figure 3. (ad) Examples of post-processed HU-density histograms.
Applsci 11 01238 g003
Figure 4. Plot of the number of CT inserts as a function of the attenuation coefficient for the equipment used. The trend line for each of the data sets is also represented.
Applsci 11 01238 g004
Figure 5. (af) Examples of graphical representation of the threshold values found by analyzing the HU-density histograms with the methods described.
Applsci 11 01238 g005
Figure 6. Boxplot of the distributions of threshold values Th1 and Th2 according to method used: Gaussian, maximum gradient on the fit (Max grad fit) and maximum gradient on the data (Max grad data).
Applsci 11 01238 g006
Figure 7. Histogram of the volume distributions of the aerated, intermediate, and consolidated components. The bin size used was 150 cc. The number on the y-axis represents the number of patients per bin.
Applsci 11 01238 g007
Figure 8. Boxplot of the volume ratios of the consolidated component compared to the aerated component and of the intermediate component compared to the aerated one.
Applsci 11 01238 g008
Figure 9. Histograms of the distributions of (a) position of the peak of the aerated component and (b) width of the intermediate component.
Applsci 11 01238 g009
Table 1. Schematic of the CT chest present in the database based on the equipment used, the number of patients, and the voltage and current range.
EquipmentNumber of PatientsVoltage (kV)Current (mA)
RangeMedian1st Quartile3rd Quartile
Lightspeed146120149–549352.5219.5451.5
Brilliance12120240–500458.5--
Incisive8120189–368334--
Table 2. Average CT values for the three types of equipment.
InsertAttenuation Coefficient @70 keV (1/cm)Light SpeedBrillianceIncisive
N. CT ROISD N. CT ROISD N. CT ROISD
Air0−981.2338.35−972.1242.43−972.5749.64
PMP0.157−181.5548.03−175.4854.13−181.0766.68
LDPE0.174−90.6046.14−85.4353.53−90.1767.73
Polystyrene0.188−35.3046.56−30.1952.44−34.5969.33
Acrylic0.215126.9947.75125.7157.40121.0866.92
Delrin0.245350.2252.85347.3356.96341.8570.77
Teflon0.363960.2468.70940.1859.92940.0974.29
Table 3. Summary table of the threshold values found with the methods used.
MethodThresholdMinimunMaximumMedianStandard Deviation
GaussianTh1−870−386−76873
Th2−23232−11441
Maximum gradient fitTh1−927−322−78077
Th2−70610−8761
Maximum gradient dataTh1−900−430−79871
Th2−27164−3441
Publisher’s Note: MDPI stays neutral with regard to jurisdictional claims in published maps and institutional affiliations.

