
Source-Based Size-Resolved Optical Properties of Carbonaceous Aerosols


1
Department of Health Management, Kyungin Women’s University, 101 Gesan-gil, Gyeyang-gu, Incheon 21041, Korea
2
Department of Environmental Engineering Science, University of Florida, Gainesville, FL 32611, USA
3
Department of Environmental Engineering and Science, Ewha Womans University, 52 Ewhayeodae-gil, Seodaemun-gu, Seoul 03760, Korea
4
Department of Chemical Engineering and Materials Science, Ewha Womans University, 52 Ewhayeodae-gil, Seodaemun-gu, Seoul 03760, Korea
*
Author to whom correspondence should be addressed.
Appl. Sci. 2021, 11(4), 1434; https://0-doi-org.brum.beds.ac.uk/10.3390/app11041434
Submission received: 26 December 2020
/
Revised: 25 January 2021
/
Accepted: 1 February 2021
/
Published: 5 February 2021
(This article belongs to the Special Issue Air Pollution II)
Abstract
:In this study, the source-based optical properties of polydisperse carbonaceous aerosols were determined from PM2.5 concentrations measured at a Global Atmospheric Watch station in South Korea. The extinction and absorption coefficients of carbonaceous aerosols were calculated using the Mie theory and assuming a lognormal size distribution. Based on the mass concentration from the EPA’s Positive Matrix Factorization (PMF) receptor model, which considers five source identification and apportionment factors (biogenic source, local biomass burning, secondary organic aerosol, transported biomass burning, and mixed sources), the source-based size-resolved mass extinction and absorption efficiencies were estimated for each source using a multilinear regression model. The results show that the source-based optical properties depend on the aerosol size and physicochemical characteristics of the chemical compounds. The long-range transport of biomass burning (LBB) aerosol, which has a mass concentration of 20%, holds a 12.1–23.1% total extinction efficiency—depending on the size and refractive index—in the range of 0.1–0.5 μm in geometric mean diameter and humic-like substances (HULIS) imaginary refractive index of 0.006–0.3. Biogenic sources of aerosols with small diameters have higher mass absorption efficiencies (MAE) than other sources, depending on the size and refractive index.
1. Introduction
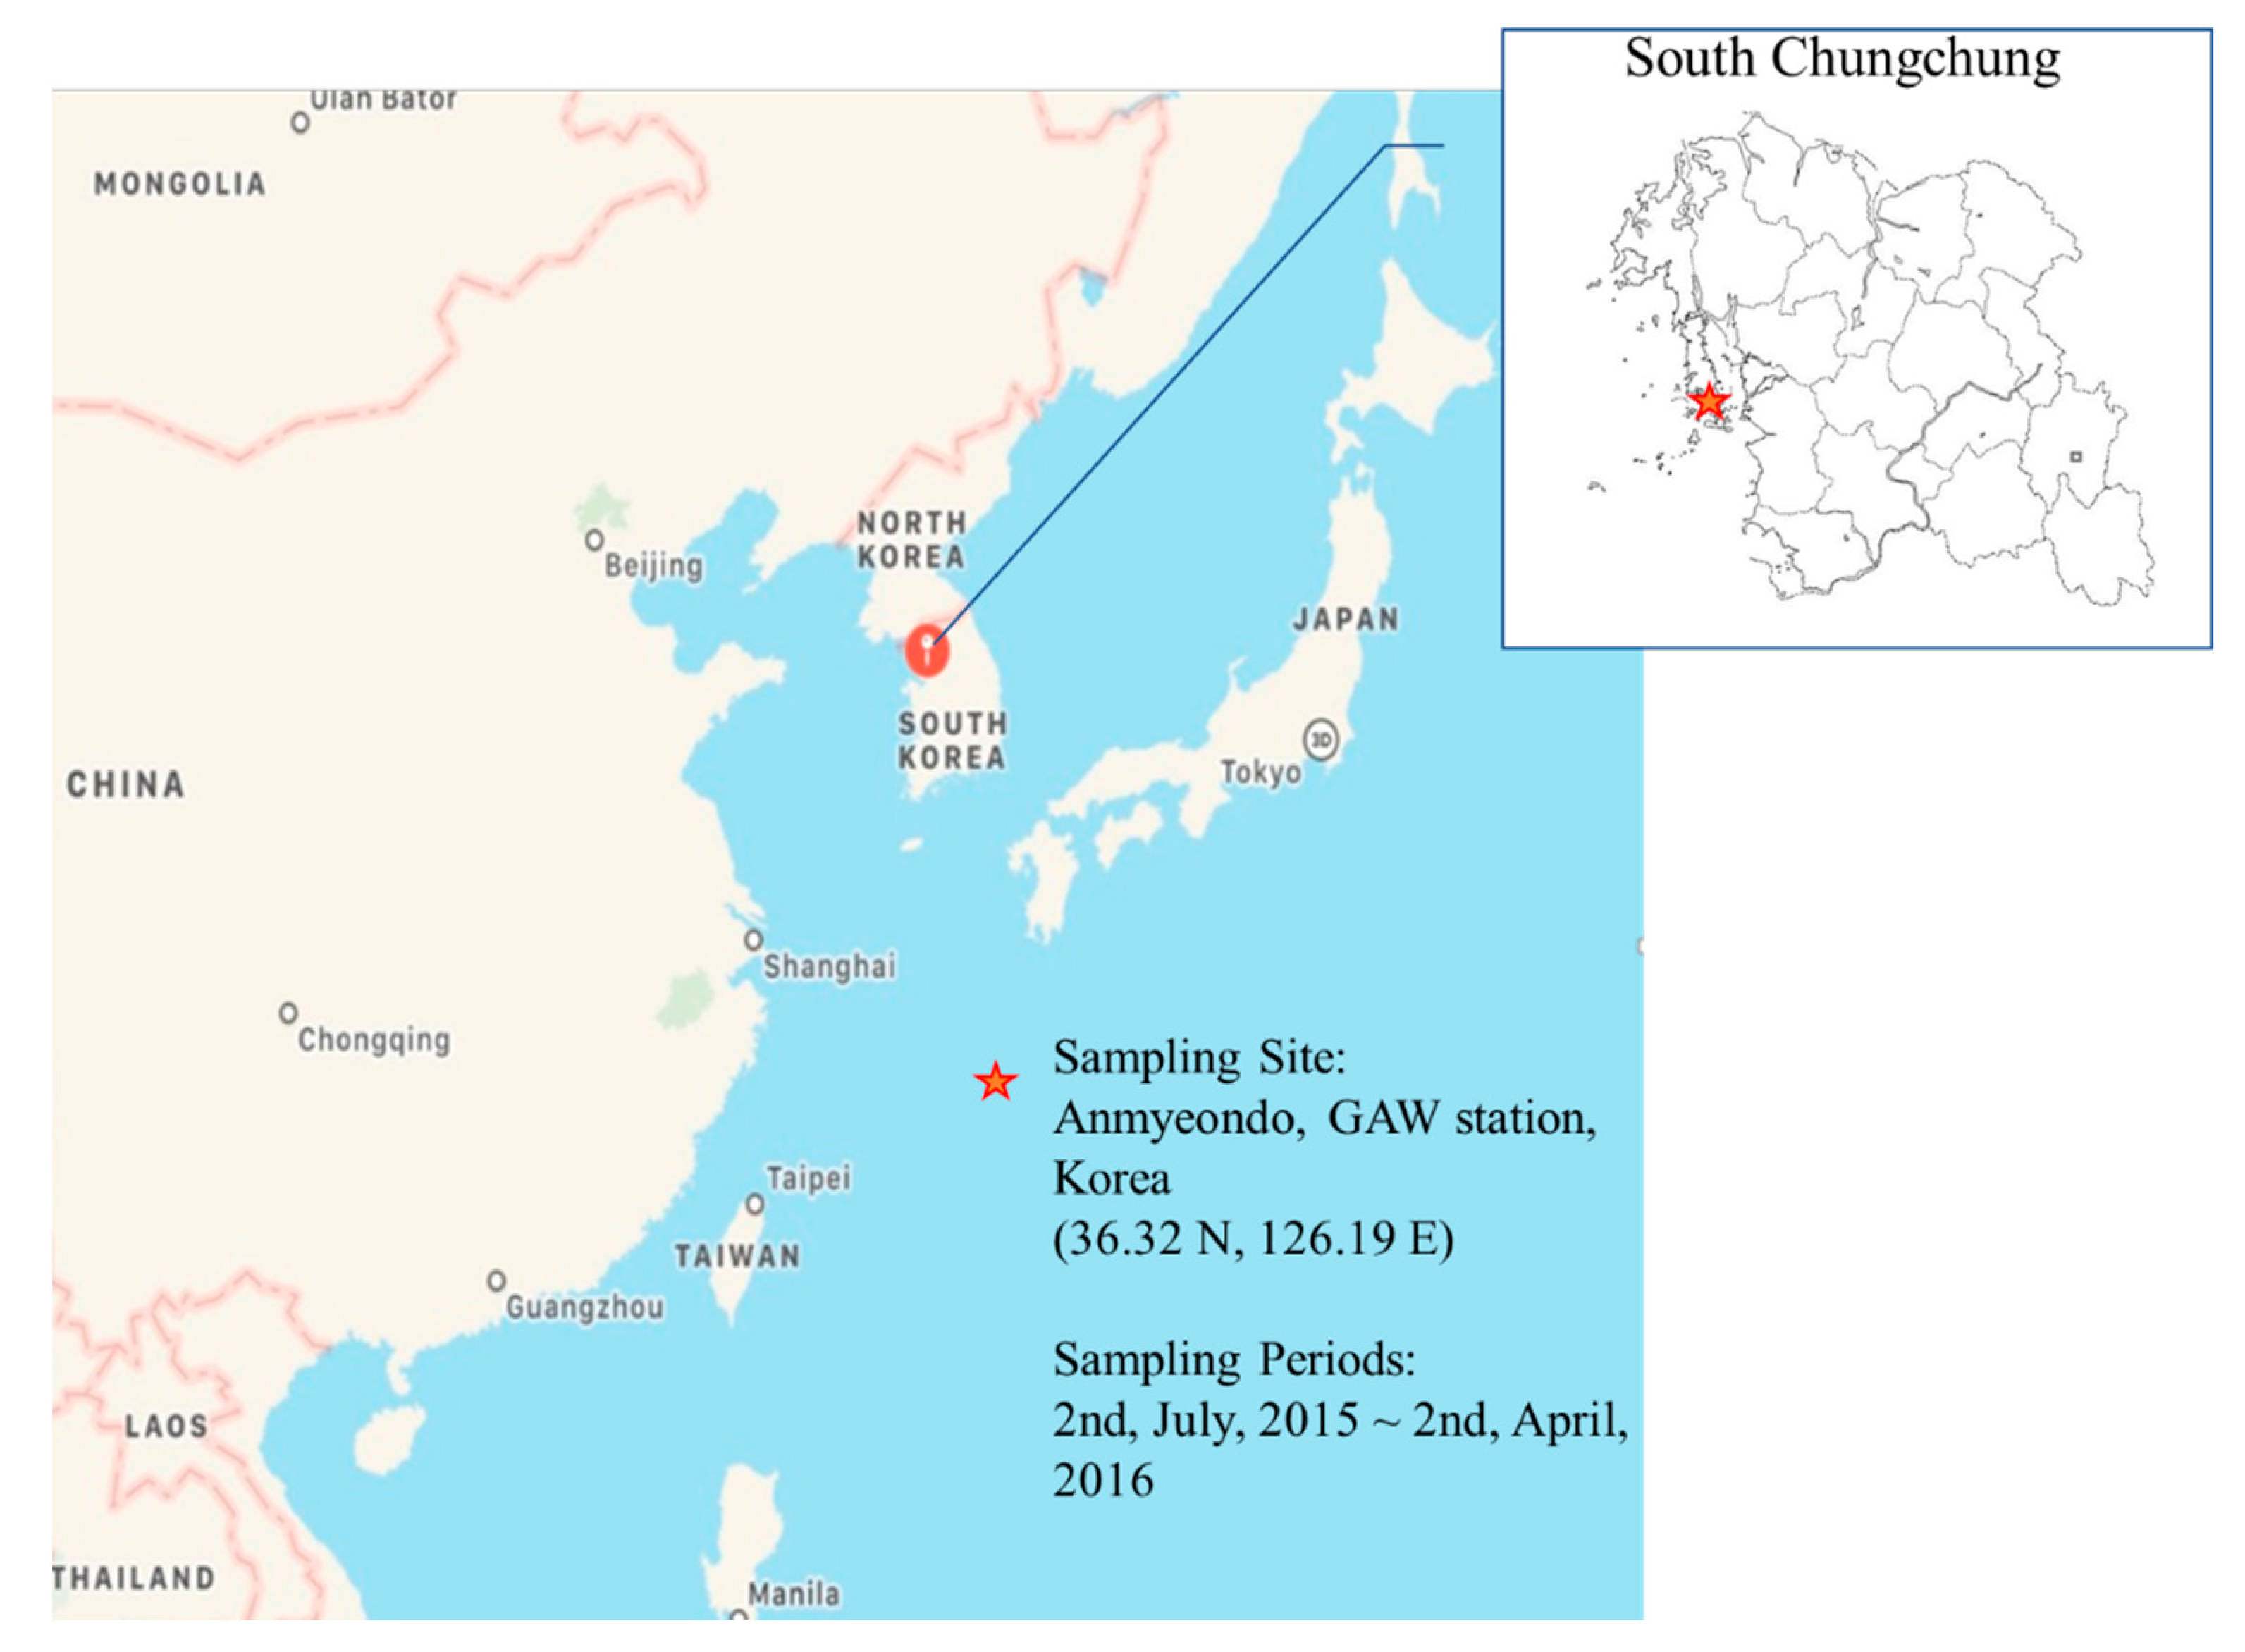
Carbonaceous aerosols are composed of organic aerosols and refractory light-absorbing components, generally referred to as elemental carbon or black carbon [1]. Organic aerosols contain thousands of organic compounds and account for 20–50% of the total fine aerosol mass at mid-latitudes [2,3]. The organic aerosols originate from both anthropogenic sources, such as fossil fuel combustion, and biogenic sources. In addition, an organic aerosol is either directly emitted in particulate form (primary organic aerosol) or generated in the air (secondary organic aerosol) [4]. Organic aerosols can be divided into water-soluble organic carbon and water-insoluble organic carbon. Humic-like substances account for a substantial fraction of the water-soluble organic carbon. In general, humic-like substances are weak absorbers. However, the results of several studies have showed that the imaginary refractive index of absorbing aerosols, such as humic-like substances and brown carbon, is much higher and its contribution to absorption may therefore be important [5,6,7,8,9,10]. Receptor models are used to infer source contributions by determining the linear combination of emission source chemical compositions that best fits the chemical composition of ambient samples [11]. A regional Global Atmospheric Watch (GAW, 36°32′ N; 126°19′ E, 45.7 m above sea level) station was established by the Korean Meteorological Administration on Anmyeon Island on the midwestern coast of South Korea. One of the goals of the GAW station is to monitor the variations in components that might affect climate change.
Many studies have been conducted to understand the effects of aerosols on the climate. For example, optical properties, such as radiative forcing, have been characterized using direct measurements [12,13]. Chemical composition-based optical properties are also important for understanding the contribution of aerosol species and their effects on climate [7,14,15]. In addition, source-based aerosol optical properties can provide information about their effects on the climate [16]. Han et al. [17] measured the carbonaceous aerosol compounds in PM2.5 samples and determined the major factors affecting the carbonaceous organic compounds at the Anmyeon GAW station using a receptor model. In this study, the source-based mass extinction efficiency of polydisperse aerosols was estimated from source apportionment-based chemical species-resolved mass contribution results [17]. The size-resolved extinction and absorption coefficients of carbonaceous aerosols were calculated using the Mie theory and the mass extinction and absorption efficiencies of each of the five sources of the EPA’s Positive Matrix Factorization (PMF) model were estimated using a multilinear regression model.
2. Materials and Methods
2.1. Data
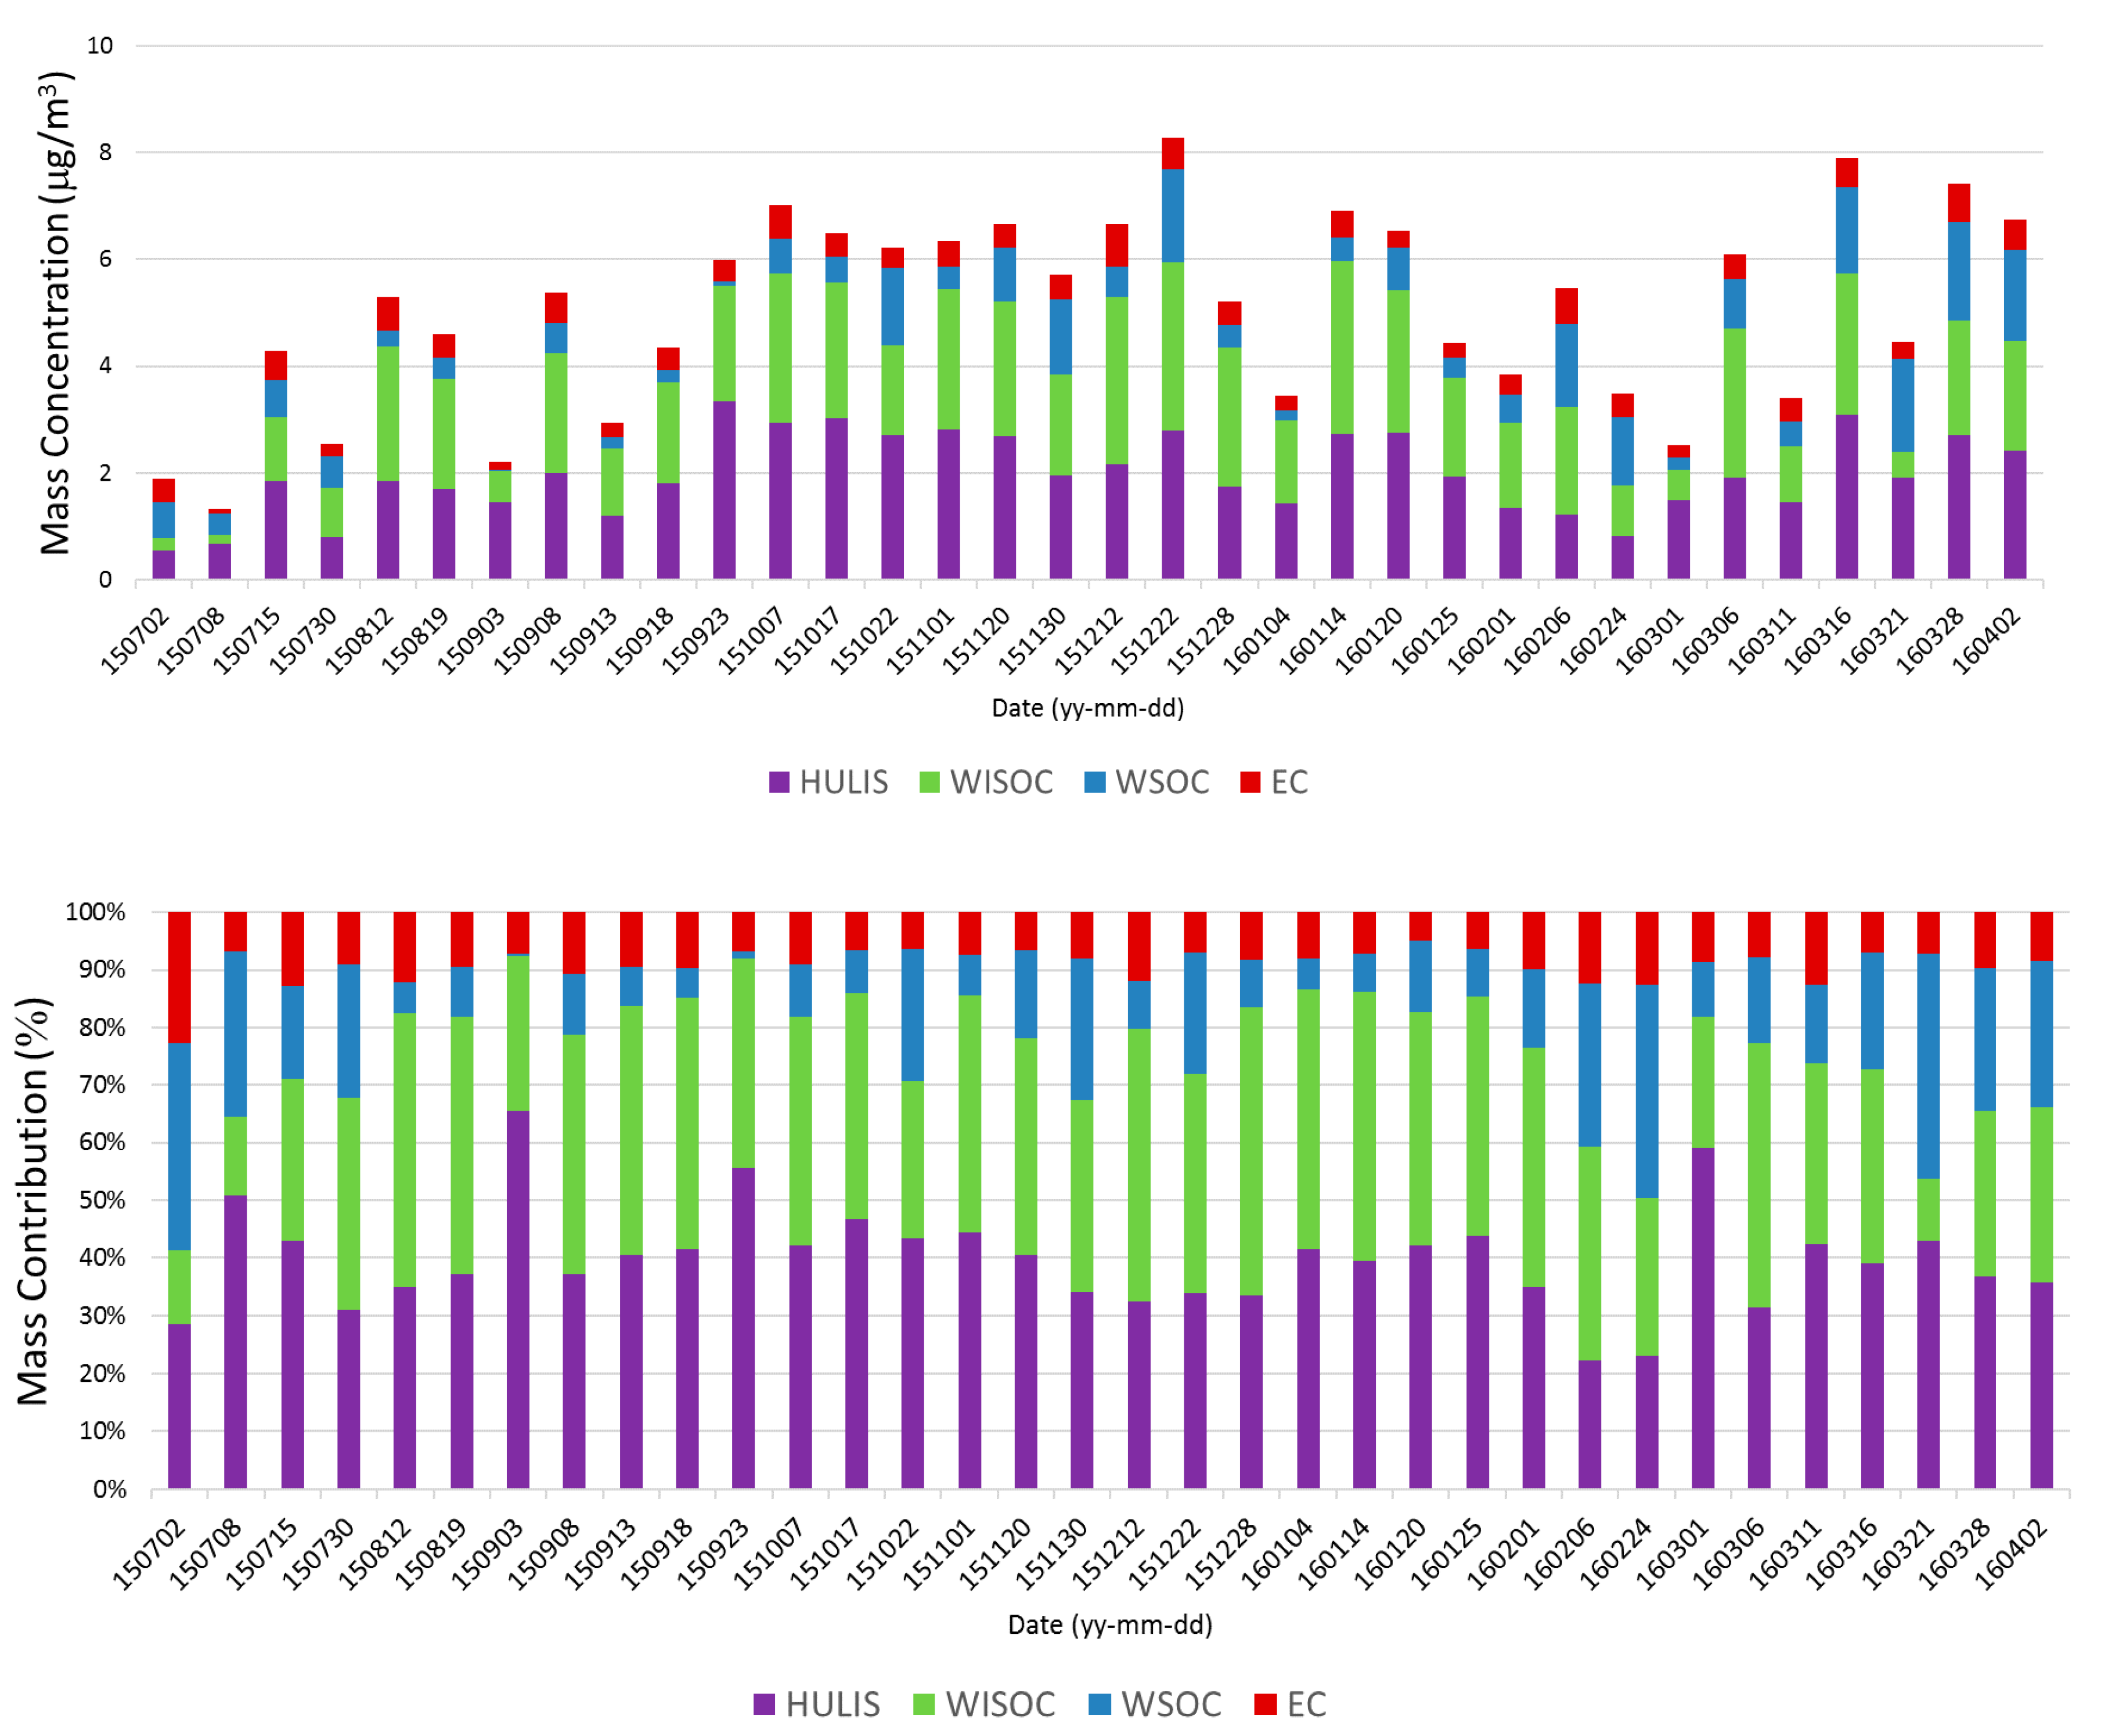
The study site was the GAW station on Anmyeon Island (36.32° N, 126.19° E, altitude: 45.7 m) on the western coast of Korea (Figure 1). A total of 34 Samples from Anmyeon Island were measured every 6 days from 2 July 2015, to 2 April 2016, on the rooftop of the GAW station. A total of 34 samples were analyzed after quality control. A high-volume air sampler with a flow rate of 1000 L min−1 was used. The PM2.5 samples were collected using quartz fiber filters (203 mm × 254 mm, Whatman Inc., Maidstone, UK). The organic carbon, elemental carbon (EC), water-soluble organic carbon (WSOC), and humic-like substances (HULIS) concentrations were measured. A detailed description of the data and sampling methodology can be found in previous studies [14,17]. Figure A1 shows the composition-based mass concentrations and contributions of carbonaceous aerosols.
2.2. Receptor Modeling
The source-based mass concentrations were obtained from a receptor model (US EPA PMF v5.0) [18]. The PMF is a multivariate factor analysis tool that decomposes a matrix of speciated sample data into two matrices: source profile and source contribution [18,19].
The concentrations were used as measured data, and the error fractions and 1/2 of the method detection limit values were used as the overall uncertainty assigned to each observation [17].
Based on the study by Han et al. [17], the profiles and relative contributions of five factors were used: (1) secondary organic aerosols (SOA); (2) biogenic sources, identified based on the characteristics of the profile and seasonal trend of the relative contribution; (3) long-range transport of biomass burning (LBB); (4) local biomass burning (local BB); and (5) various sources, including vehicular and other combustion sources, such as biomass burning, based on the mixed characteristics.
2.3. Size-Resolved Aerosol Optical Properties
Aerosol optical properties play important roles in regulating the Earth’s radiation budget.
The light scattering and absorption properties of atmospheric aerosols depend on the aerosol size distribution, chemical composition, and refractive index, which means that the contribution of aerosol optical properties differs from the mass contribution.
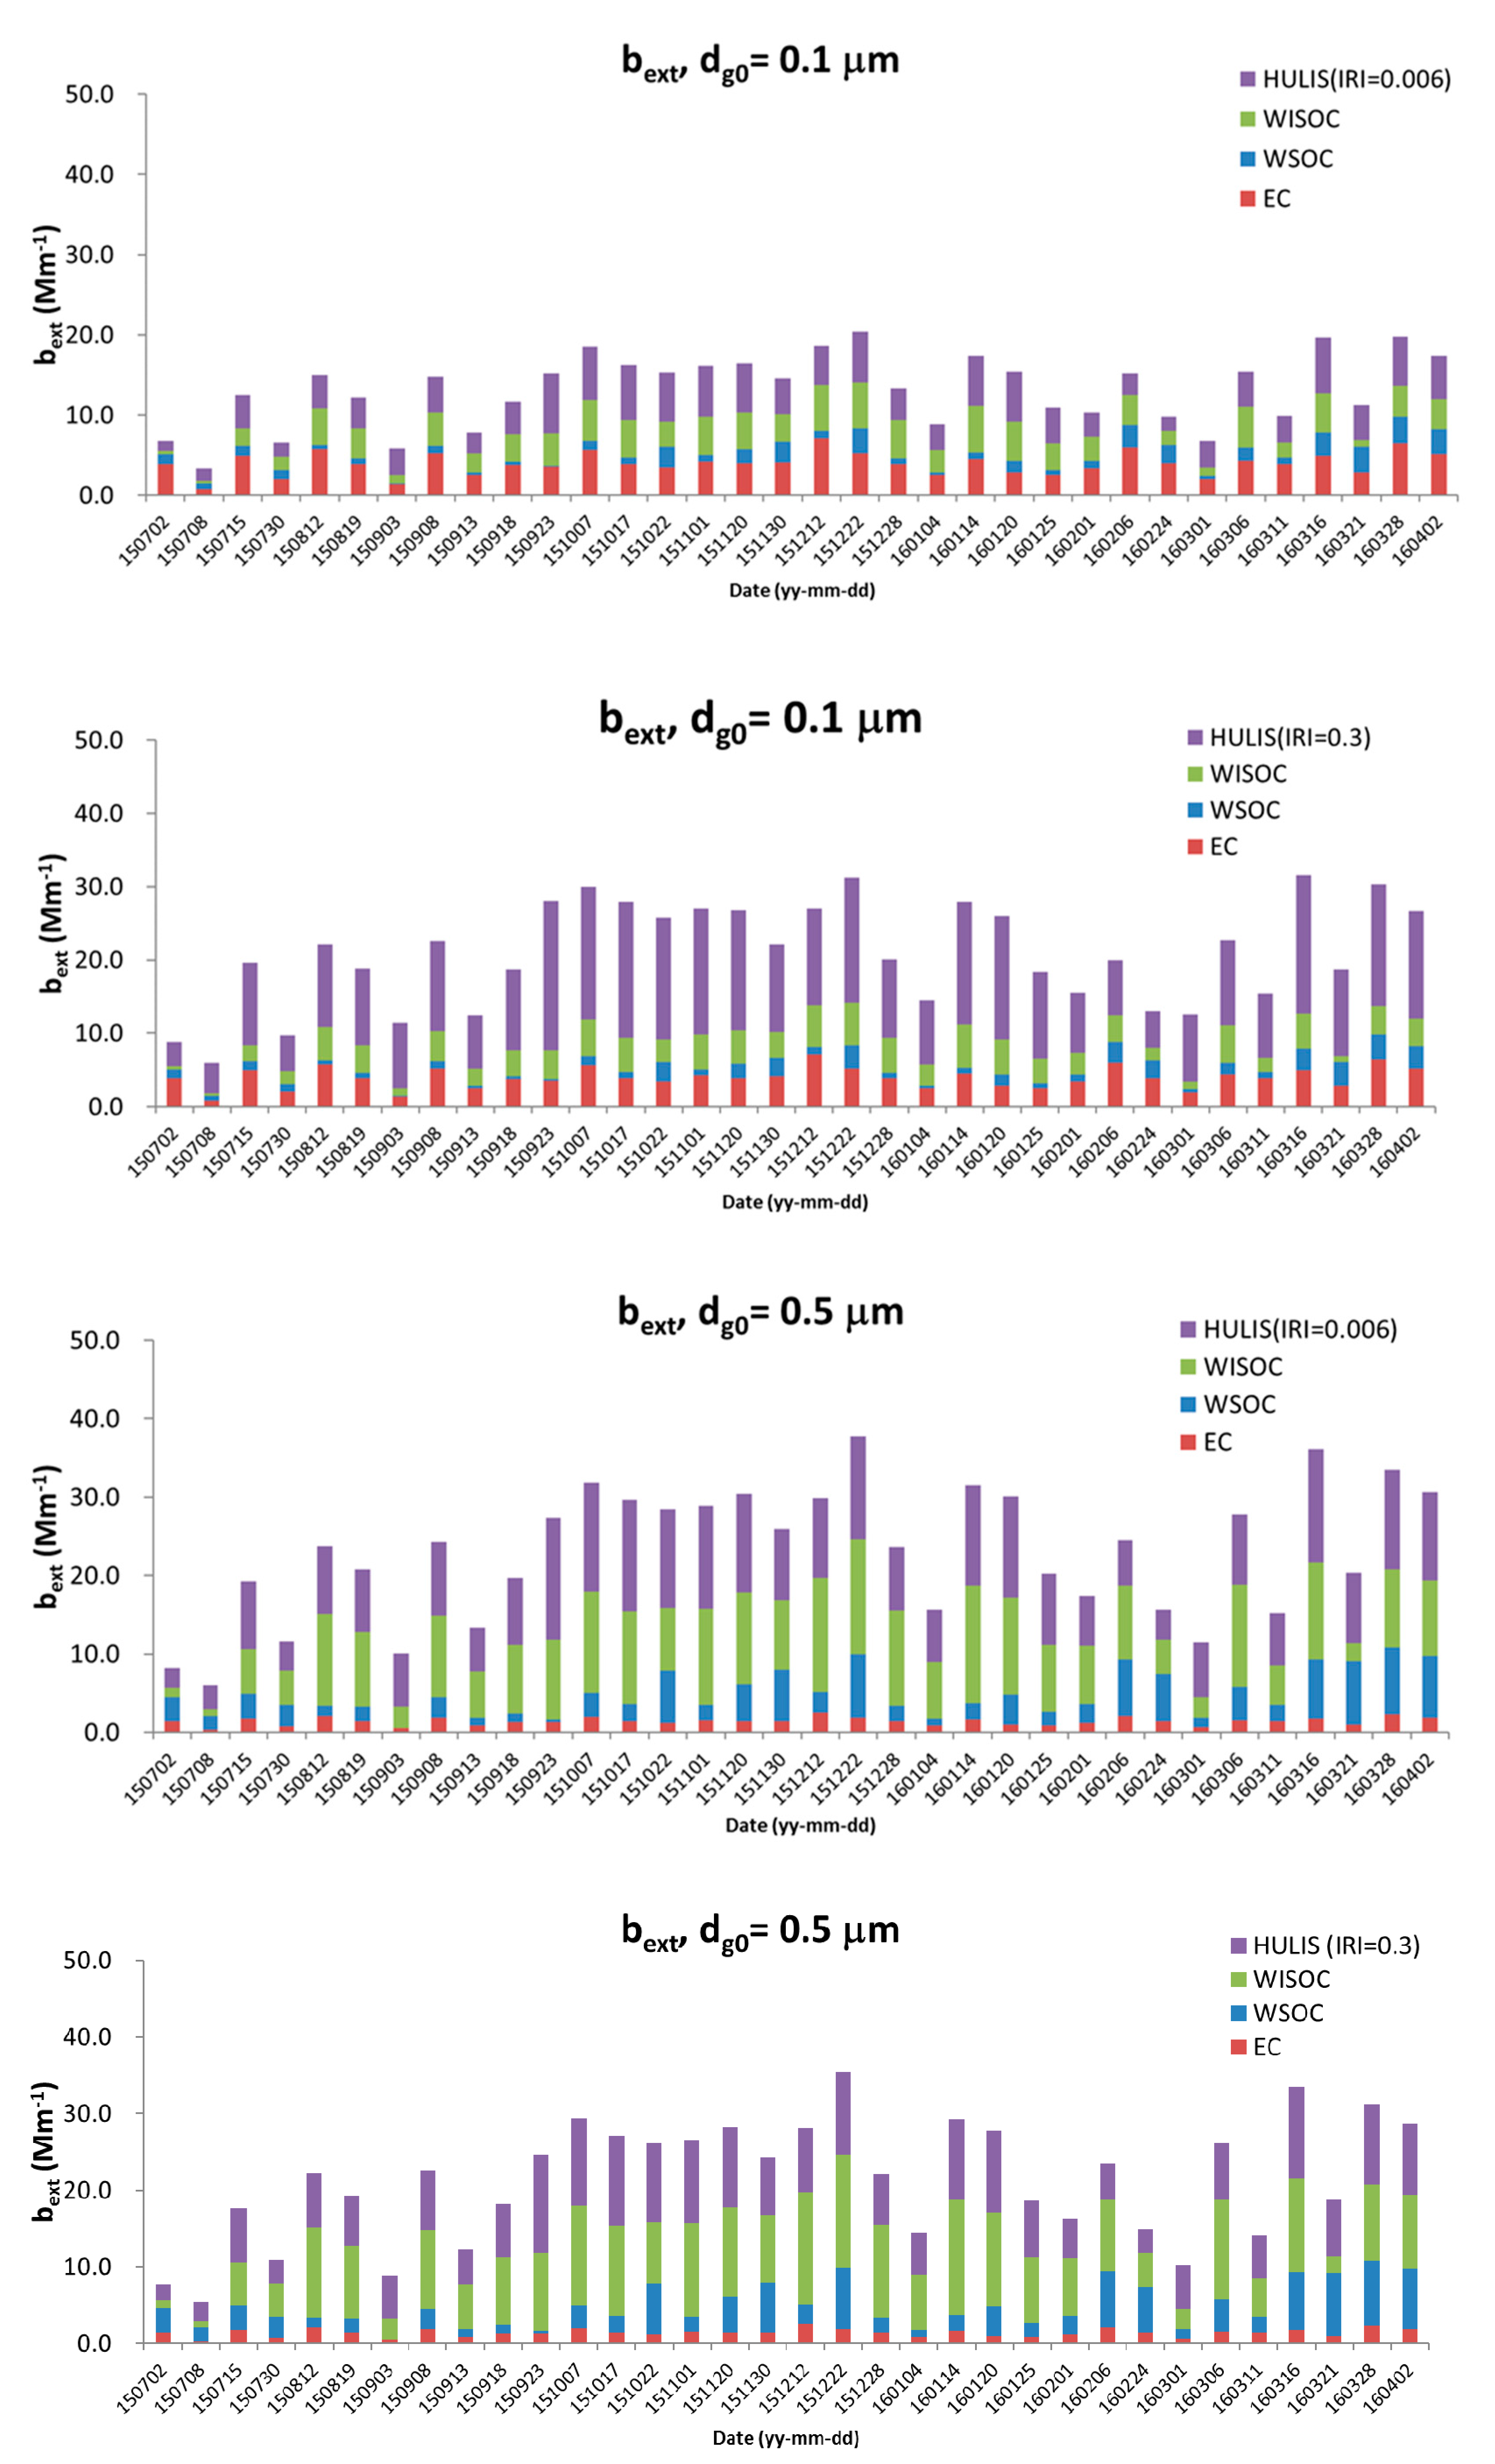
The aerosol extinction coefficient (bext) can be calculated using the Mie theory based on the mass concentration, chemical composition, and size distribution [7,14]. Figure A2 shows the composition-based extinction coefficients (bext) of carbonaceous aerosols with different geometric mean diameters (dg0) and imaginary refractive indices (IRIs) of HULIS of 0.006 and 0.3. The refractive indices are 1.9-0.66i for EC, 1.595-IRIi (i.e., 1.595-0.006i and 1.595-0.3i) for HULIS and 1.53-0.006i for WSOC and WISOC (water-insoluble organic carbon) [14]. It should be noted that there uncertainty exists in calculating aerosol optical properties by the Mie theory. The Mie theory assumes aerosols are spherical particles, and so does not consider the morphology of non-spherical aerosols, or their aggregation. The model of homogeneous compact particles results in a systematic underestimation of the scattering phase function for almost all angles, but most typically, in the backscatter zone [20]. The impact of material mixing on the absorption efficiency of carbonaceous particles increases with the particle size and for particles with high carbon content [21]. More rigorous studies should be conducted that consider the non-spherical shape and aggregation of particles in order to accurately estimate aerosol optical properties.
2.4. Source-Based Aerosol Optical Properties of Polydisperse Carbonaceous Aerosols
The source-based receptor model provides information about the aerosol sources. The receptor model can be used to estimate the contribution of each source to the composition-based mass concentration.
In this study, source-based optical properties were obtained from the source-based mass concentration, size distribution, and refractive index.
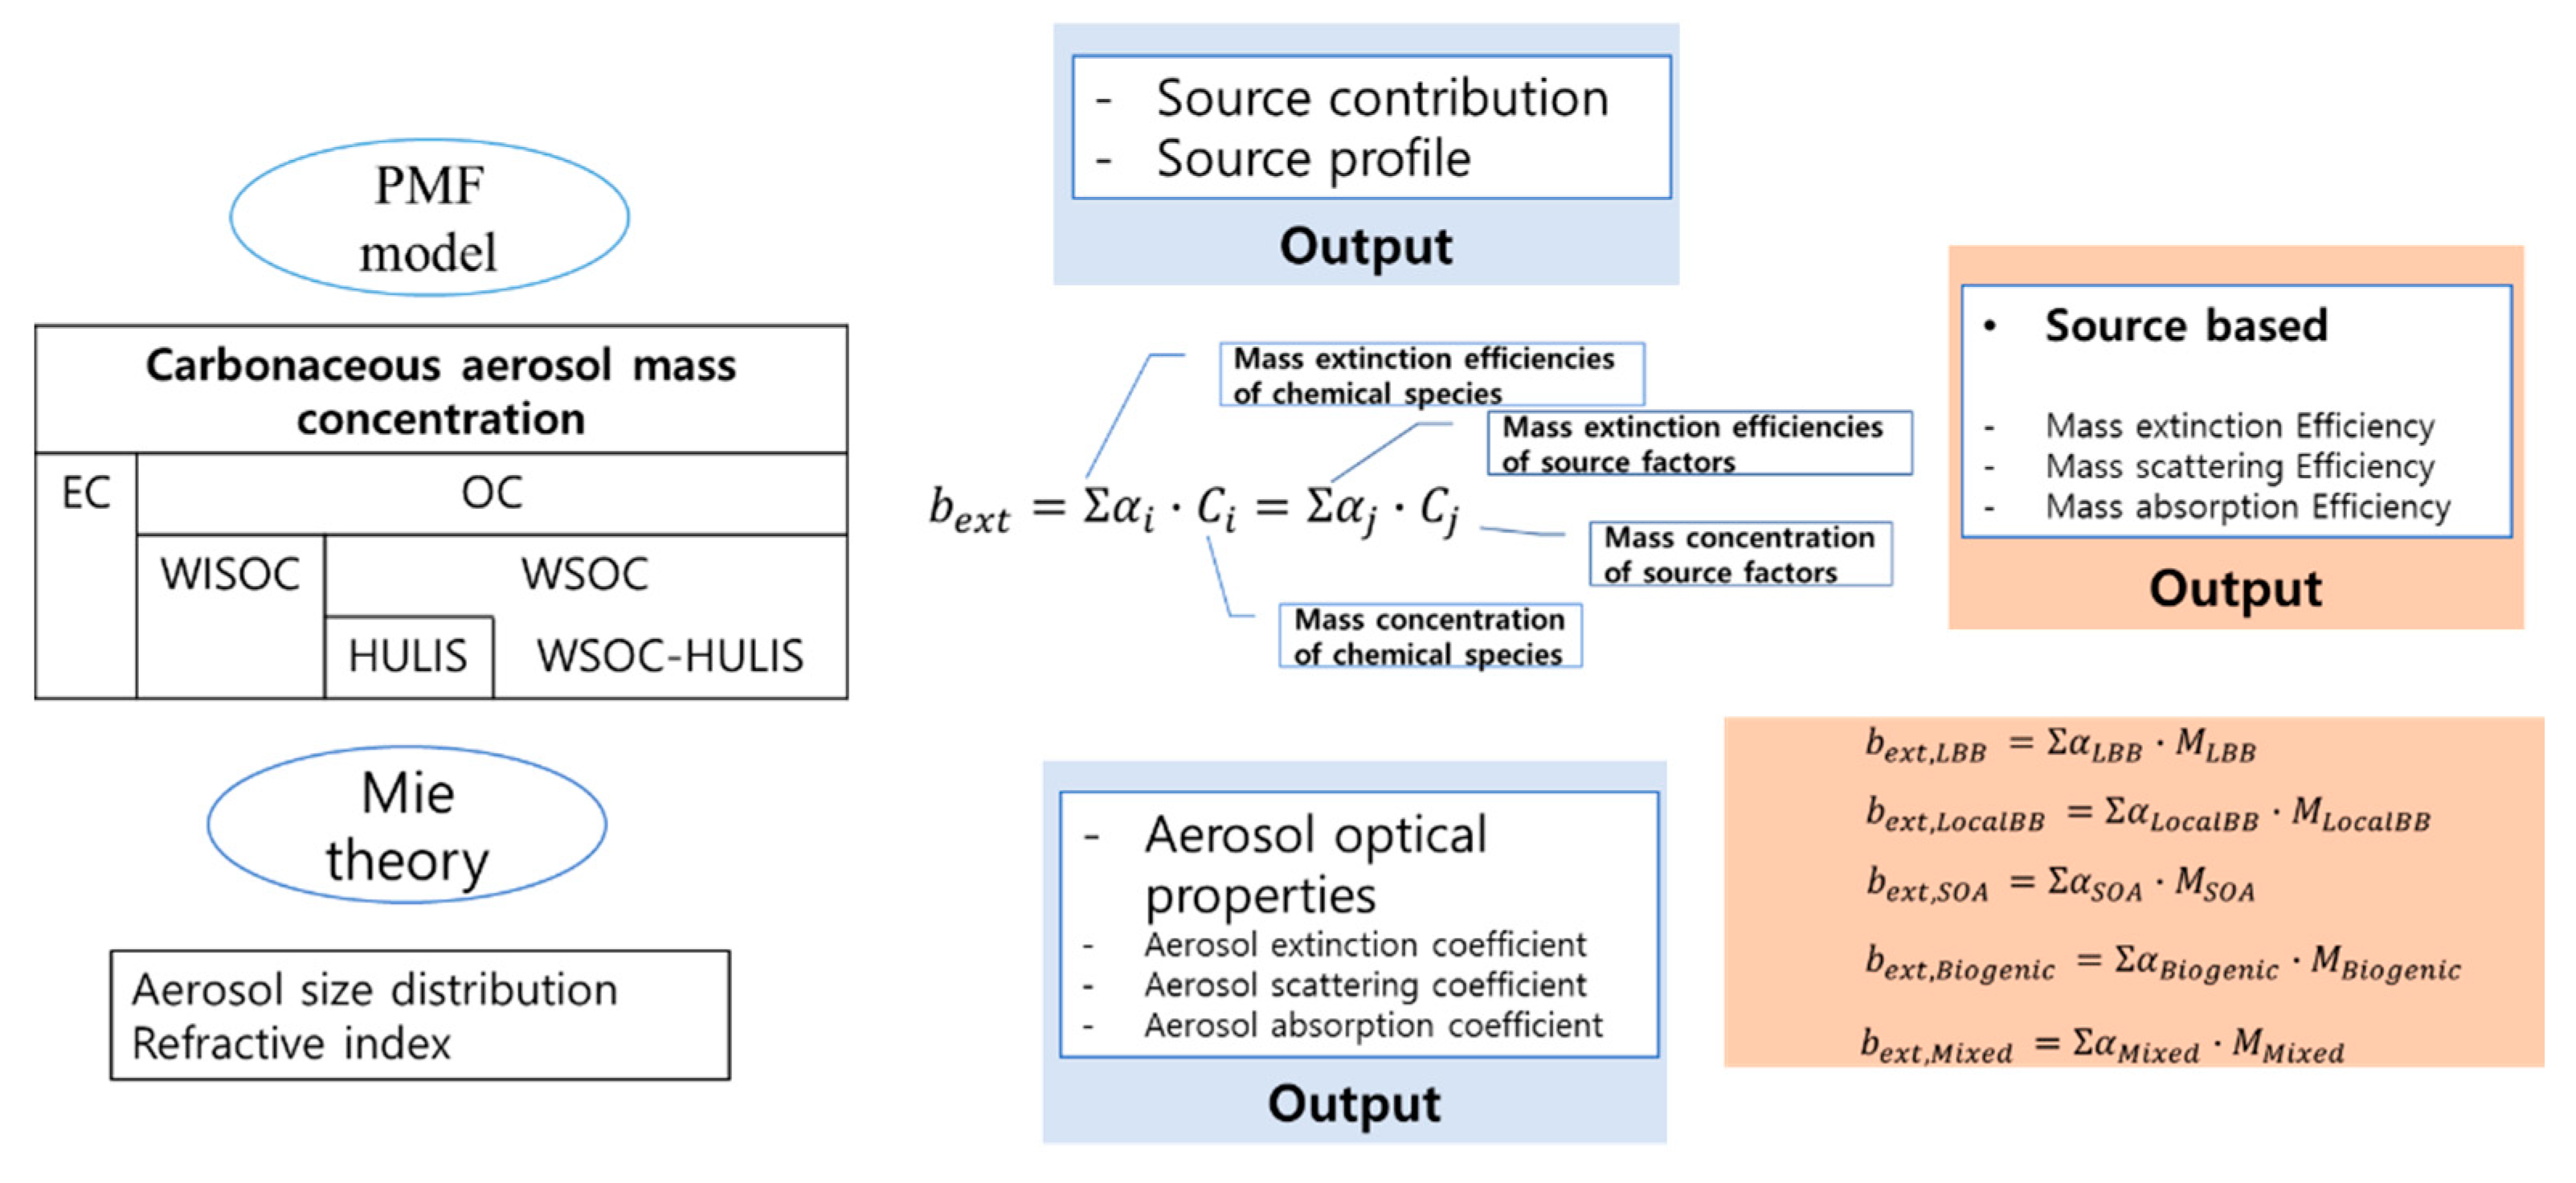
Figure 2 shows the schematic diagram for calculating the source-based optical properties of polydisperse carbonaceous aerosols.
For the mass concentration of a given species, the extinction coefficient (bext,i) and mass extinction efficiency of carbonaceous aerosols can be simplified as follows [16,22,23]:
where MEEi is the mass extinction efficiency in m2/g and Ci is the mass concentration of the ith carbonaceous composition (μg/m3).
The bext value can be calculated using the Mie theory based on the refractive index and size distribution of the carbonaceous aerosol. A lognormal size distribution was assumed in this study. The lognormal size distribution for mass concentration () can be expressed as a function of the dg0 and geometric standard deviation () as follows.
where, is the geometric standard deviation and is particle diameter.
From bext and the mass concentration, the mass extinction efficiency (MEE) can be obtained using Equation (1). Table A1 shows the MEE, mass absorption efficiency (MAE), and refractive index of the carbonaceous species based on different size distributions and refractive indices of HULISs.
Based on the bext value and source-based mass concentration from the receptor model (Cs), the source-resolved optical properties can be obtained. The total mass concentration of the carbonaceous aerosol comprises each carbonaceous aerosol species. In addition, the receptor model can be used to express the mass concentration as a combination of each source (Jung et al., 2018). In this study, we used source-based mass concentrations (Cs) from the PMF receptor model. Subsequently, the source-based MEEs and MAEs were obtained from the source-based mass concentration from the PMF receptor model and bext values calculated using the Mie theory [16,22,23,24]:
where MEEs and MAEs are the mass extinction and absorption efficiencies in m2/g, respectively, and Cs is the mass concentration of the sth source-based on the PMF model (μg/m3). In this study, the MEEs of each source were obtained using multilinear regression, where the mass concentration of each source from the PMF model is the dependent variable and the aerosol extinction coefficient is the independent variable.
Subsequently, source-based mass extinction coefficients for source s were calculated as follows:
The obtained extinction coefficient is statistically significant at the 99% confidence level. A more detailed methodological description for obtaining the source-based size-dependent optical properties can be found in a previous publication [16].
3. Results and Discussion
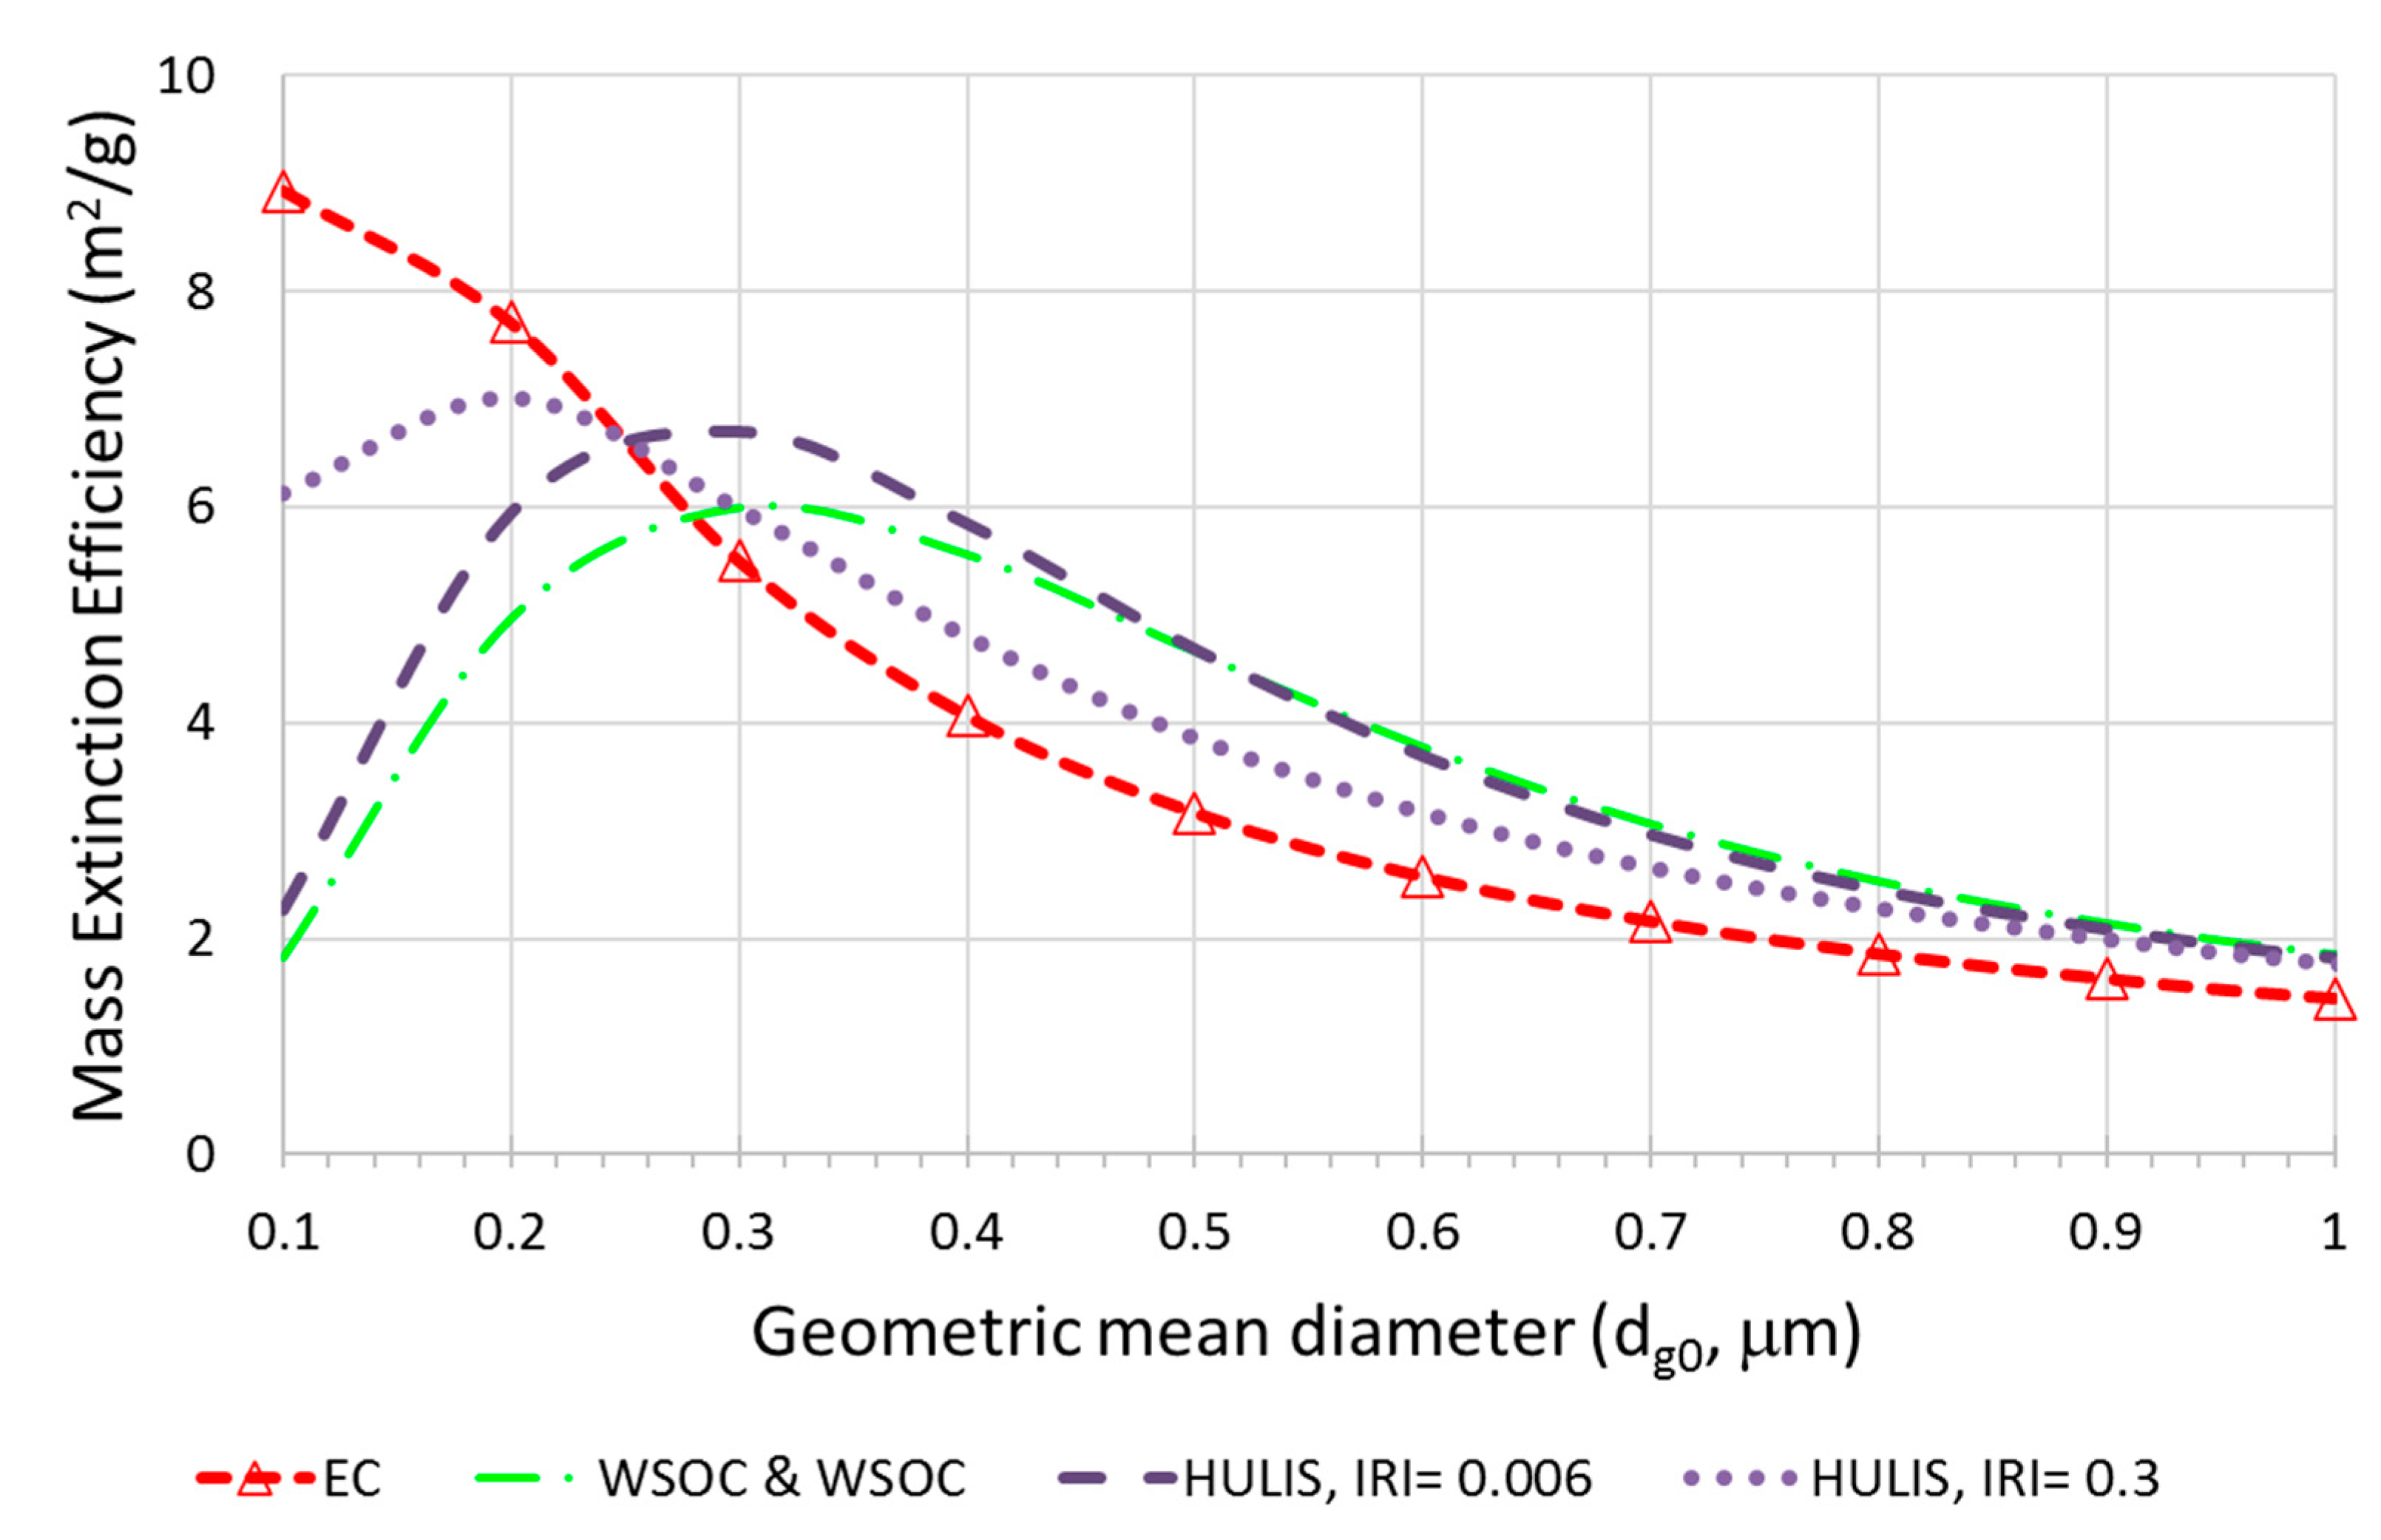
Table 1 shows the source-based MAEs and MEEs for different dg0 and IRIs of HULIS. The is assumed to be 1.5. The dg0 of 0.1 and 0.5 μm and IRIs of 0.006 and 0.3 are compared. Table 1 shows that the MEEs of biogenic sources are relatively higher than that of other sources at a dg0 of 0.1 compared with that at 0.5 μm. This means that the biogenic source is closely related to EC. Figure A3 shows the size-resolved MEE of each carbonaceous aerosol. As shown in Figure A3, the 0.3 for MEE of EC and for HULIS for IRI is higher for small particles and decreases as dg0 increases. Because of the size dependency of source aerosol, the MEEs of LBB and local BB are higher at a dg0 of 0.5 μm compared with those at a dg0 of 0.1 μm. The MAE of the biogenic source is higher at a dg0 of 0.1 μm compared with that at a dg0 of 0.5 μm. The MAEs become higher for all sources as the IRI of HULIS increases. Table 1 also shows that the single scattering albedo (SSA) differs depending on the dg0. The SSA for smaller biogenic source particles was lower than other sources. The influence of the HULIS imaginary refractive index on SSA is greater at smaller particle sizes. This is because the MEE and MAE is more sensitive to small particles than large particles.
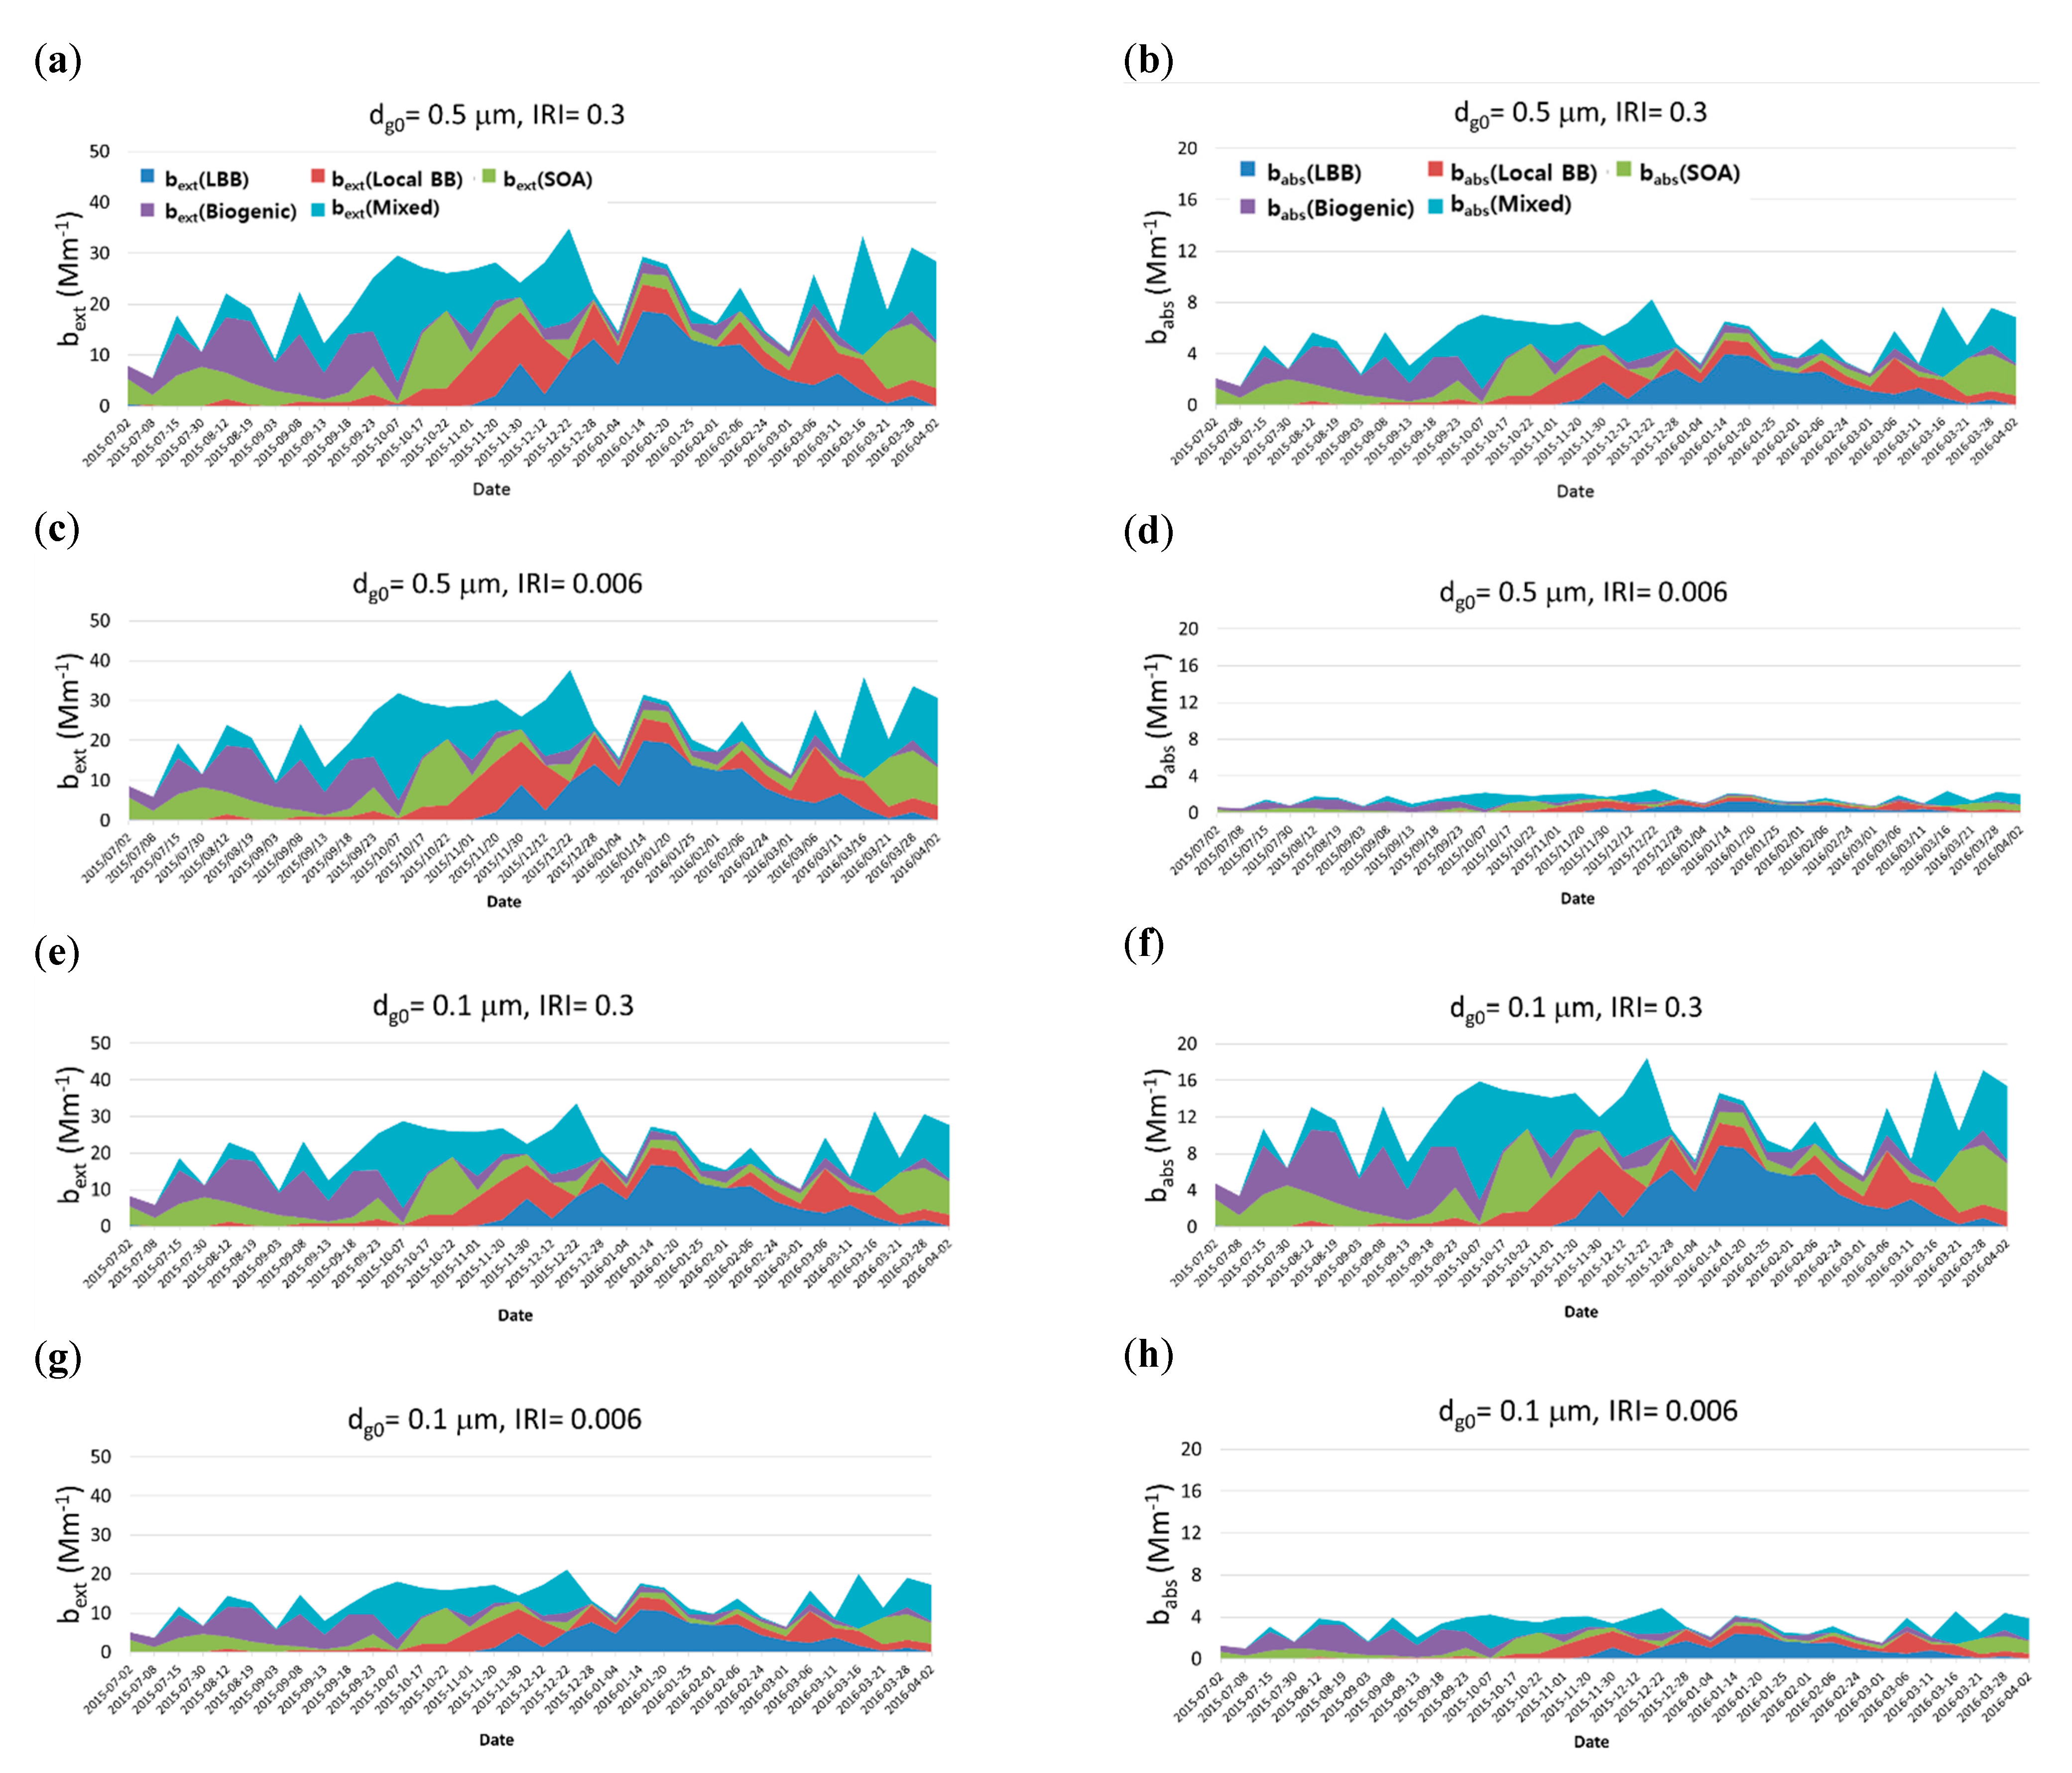
Figure 3 shows the source-based extinction (bext,s) and absorption coefficient (babs,s) of carbonaceous aerosols with different dg0 and IRIs of HULISs. In this study, dg0 values of 0.1 and 0.5 μm and IRIs of 0.006 and 0.3 were considered. The source-based extinction (bext,s) and absorption (babs,s) coefficients can be calculated from the source-based MEEs and MAEs using Equation (4) and the source-based mass concentration from the PMF model. Figure 3 shows that the source-based extinction (bext,s) and absorption coefficient (babs,s) depend on dg and IRI. Overall bext is larger at a dg0 of 0.5 μm than at 0.1 μm for IRIs of 0.006. On the contrary, babs is larger at a dg0 value of 0.1 μm than at 0.5 μm. The IRI of the HULIS significantly affects babs, which means that babs at an IRI of 0.3 is larger than at 0.006.
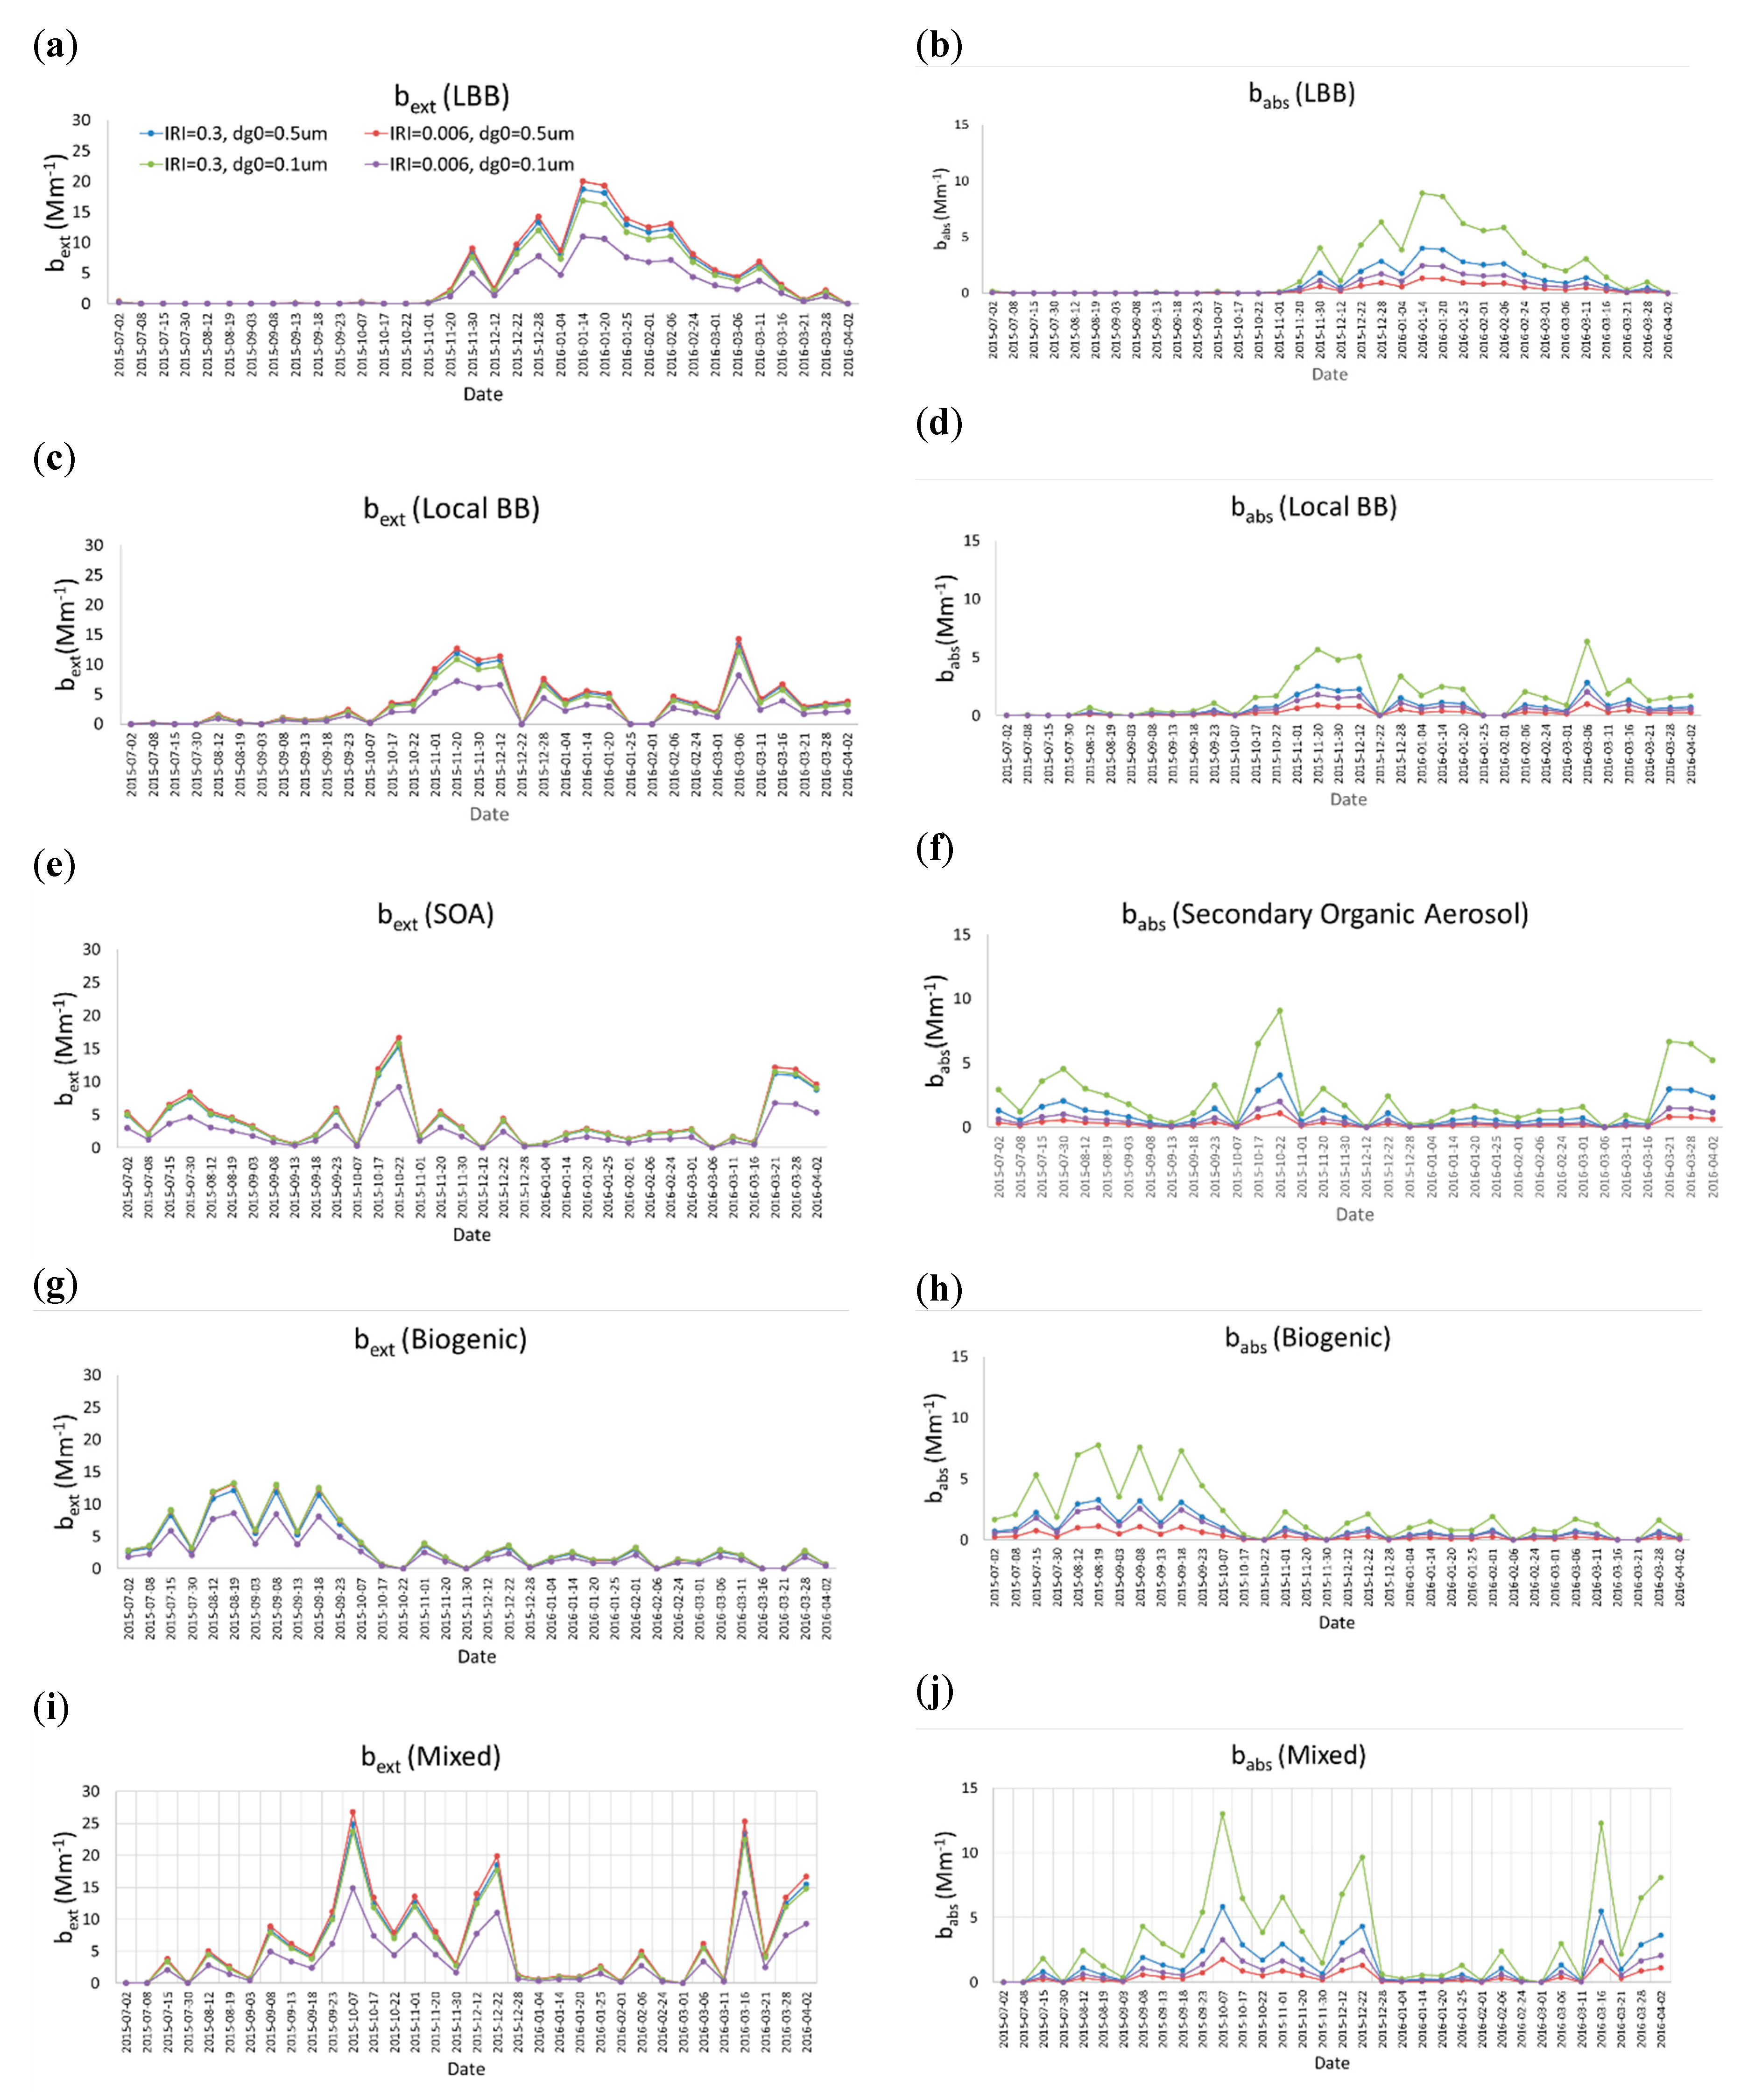
Figure 4 shows the aerosol extinction and absorption coefficients of carbonaceous aerosols for each of the five sources with different dg0 and IRIs of HULISs. Figure 4 shows that each source has a distinct episodic peak at a different time. For example, during biogenic source-dominant periods, LBB does not contribute to emissions. During LBB source-dominant periods, SOAs as well as biogenic and mixed sources insignificantly contribute. Figure 3 also shows that the source-based bext and babs depend on the sizes and IRIs of HULISs. The bext at a dg0 of 0.1 μm and IRI of 0.006 is the lowest compared with other sizes and IRIs. With respect to the absorption properties, babs at a dg0 value of 0.1 μm and IRI of 0.3 is the highest compared with other sizes and IRIs.
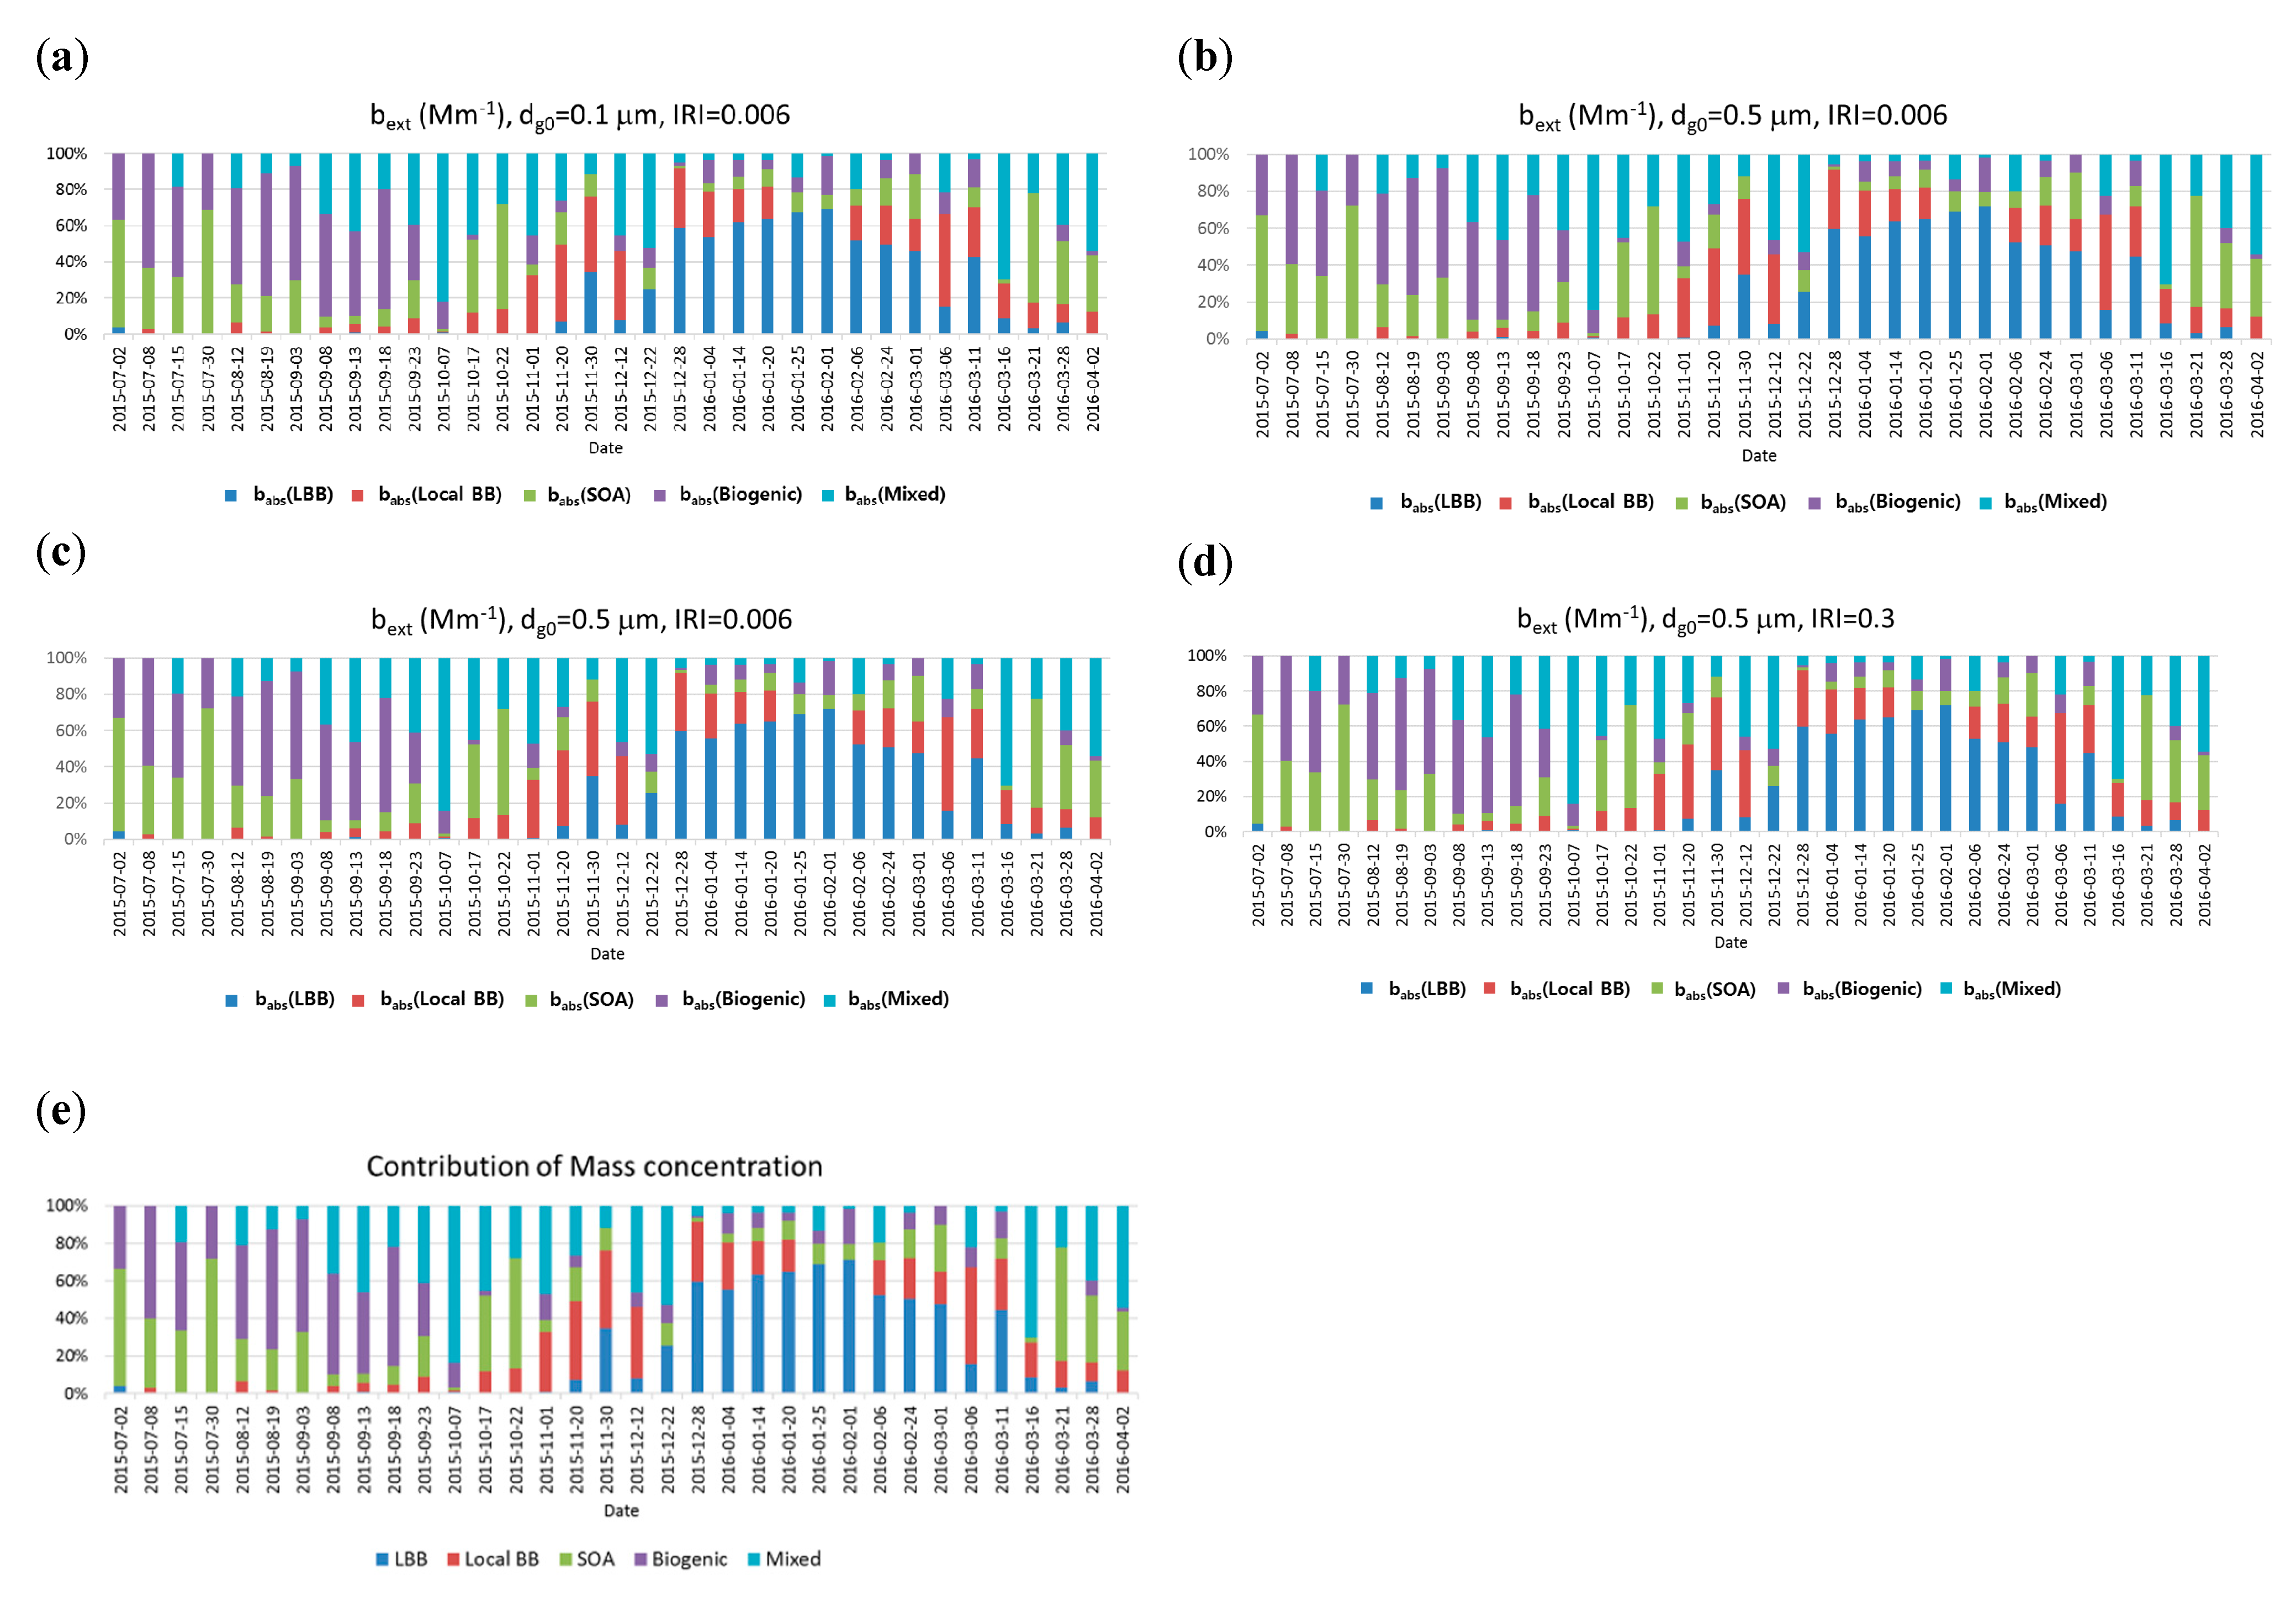
Figure 5 shows the change of the source-based extinction coefficient contribution for each sample. The sample data have different fractional contributions from different species as an input and the obtained total extinction coefficients as an output. As Figure 5 shows, the mass contribution and total extinction coefficient of each source shows similar tendencies although the detailed contribution depends on the size and refractive index of each source.
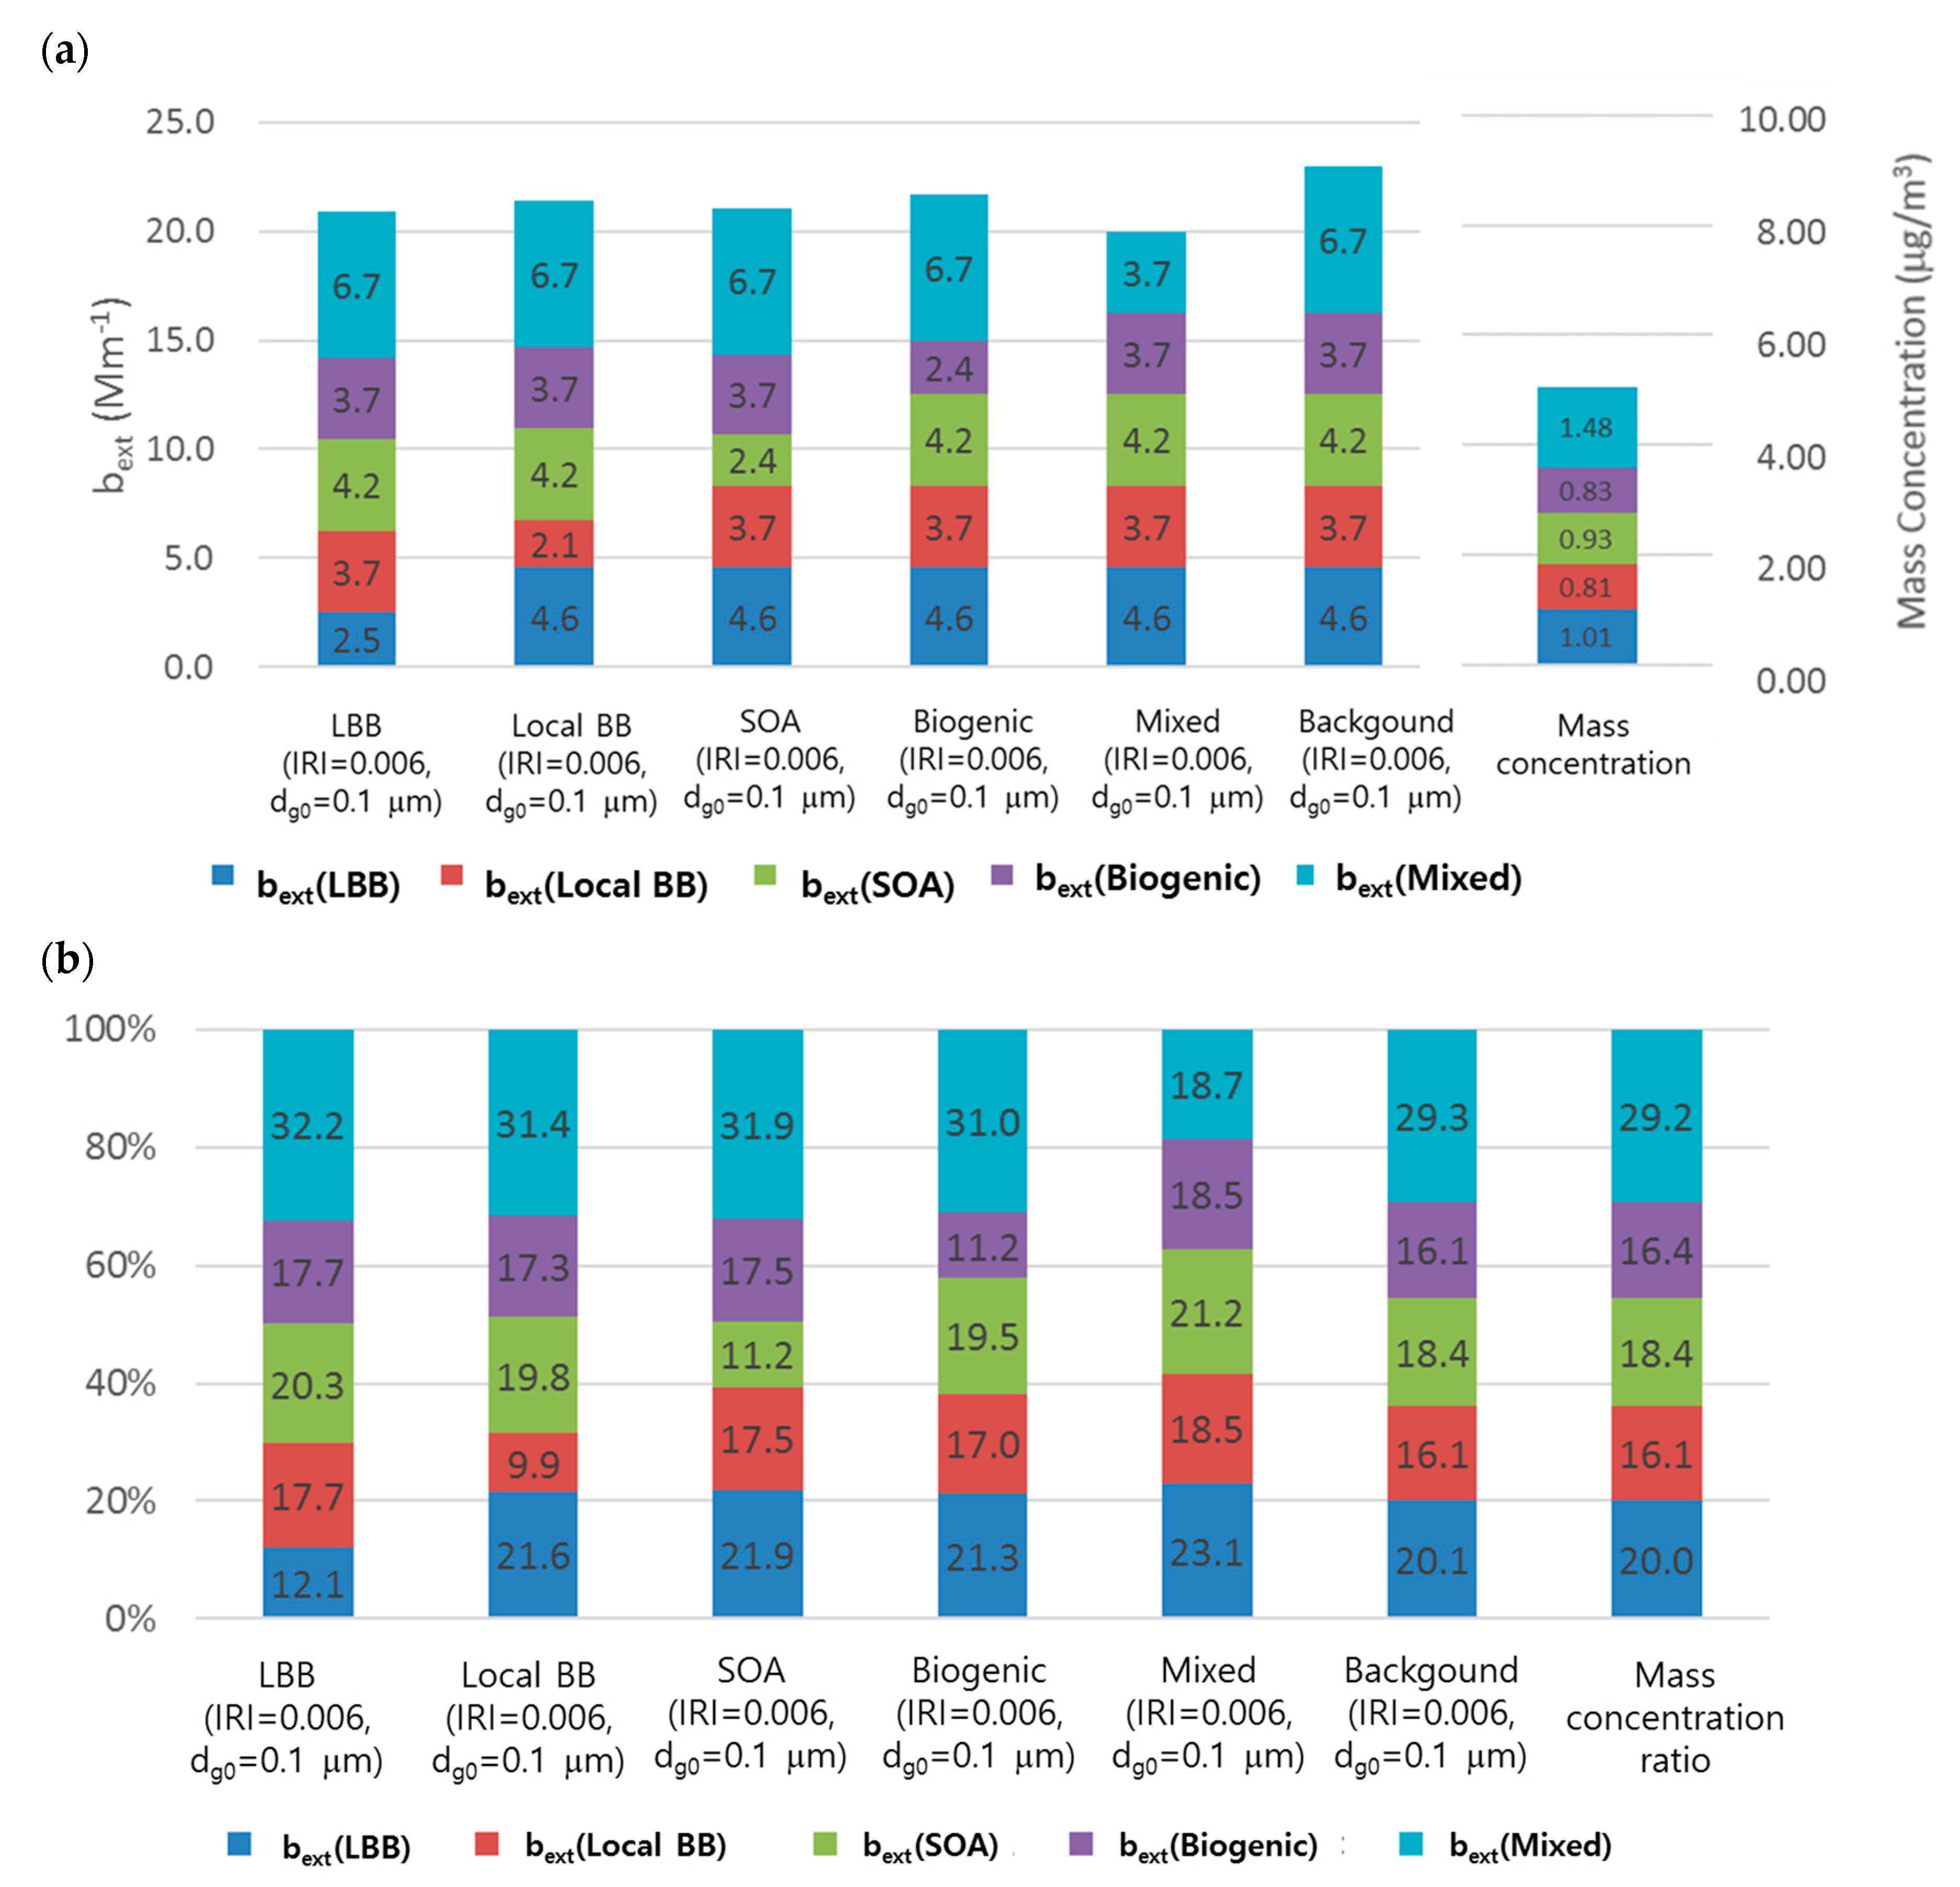
Because of the lack of information regarding the source-based size distribution, we evaluated the contribution of extinction coefficients with different size. Figure 6 shows the comparison of the average source-based extinction coefficients for different dg0. A dg0 value of 0.5 μm and IRI of 0.006 represent the background condition. The sources with different dg0 (0.1 μm) were compared with the background conditions of other sources. Note that the mass concentration of each source did not change with dg0. Figure 6 shows that the contribution of bext differs depending on the dg0 value of the source. Generally, the contribution of sources decreases with decreasing dg0 value (dg0 of 0.1 μm in this study). However, the magnitude of the decrease depends on the source. Based on the source-based mass concentration, the contributions can be ordered as follows: LBB > mixed > SOA > biogenic > local BB. However, Figure 6 shows that the contributions of the source-based extinction coefficients differ depending on the size distribution of the sources. Although Figure 6 shows the size dependency of source-based aerosol optical properties, this study assumed that the size distribution of each species was conserved without aggregation and this assumption may lead to potential errors as discussed in Section 2 and conclusions [20,21].
4. Summary and Discussions
In this study, the source-based optical properties of polydisperse carbonaceous aerosols were investigated based on the measurements of PM2.5 concentrations at the GAW station, Anmyeon Island, on the western coast of Korea. The PM2.5 samples were collected every six days from July 2015 to April 2016. The optical properties, such as the extinction and absorption coefficient, of carbonaceous aerosols were calculated using the WSOC, WISOC, HULIS, and EC contents. The source-identified mass extinction and absorption efficiencies and optical properties were obtained based on the source-based mass concentration from the PMF model.
The results show that the source-based aerosol optical properties (MEE, MAE and SSA) depend on the size distribution and the refractive index of the absorbing aerosol, which is related to the chemical composition. Compared to MEE, MAE was higher for aerosols with small diameters because of the absorption properties of EC and HULIS. The biogenic source of aerosols with small diameters has a higher MAE than other sources. The MAE for biogenic sources at a of 0.01 is 0.89 m2/g, which is higher than 0.38 m2/g at a of 0.5 μm ( of 1.5, HULIS IRI of 0.006). On the contrary, MAE for large particles was relatively consistent regardless of the source. This study also shows that the source-based SSA (single scattering albedo) depends on the source-based size distribution and refractive index of HULIS under the condition of the same mass special concentration. The SSA for smaller biogenic source particles was lower than for other sources. The influence of the HULIS imaginary refractive index on SSA is greater at smaller particle sizes. This is because the MEE and MAE is more sensitive to small particles than large particles. Consequently, the source-based contribution of total extinction coefficient depends on the source-based mass concentration and corresponding MEE and size distribution. LBB aerosol, which has a mass concentration of 20%, for example, holds a 12.1~23.1% total extinction efficiency—depending on the size and refractive index—in the range of 0.1~0.5 μm in and a HULIS IRI of 0.006~0.3. In conclusion, the aerosol optical properties depend on the physico-chemical characteristics of the aerosol source. These characteristics are important for estimating source-based optical properties and the related climate effects of aerosols. More combinations of different aerosol sources with different sizes and refractive indices for absorbing aerosols may result in a wider range of optical properties and related climate effects.
In this study, we made the simple polydisperse aerosol assumption, which assumes that aerosols retain a lognormal size distribution. This assumption does not consider the aggregation of individual particles which can lead to discrepancies and error. Thus, alternative methods, such as the Rayleigh–Debye–Gans theory for aggregates [25] and the T-matrix method for non-spherical particles [26], should be utilized. However, most aerosol retrieval algorithms are based on the Mie theory, although there is sufficient theoretical evidence that the non-sphericity of dust particles can cause scattering properties different from those predicted by the Mie theory [27]. It should be also noted that, despite these deficiencies, the Mie theory usually calculates MEE with high accuracy based on the known mass-size distribution of chemical components [28,29]. The relation between the mass concentration of the sampled chemical species and their source-based mass concentration with individual particles behavior is complex and should be considered under the simple assumption when detailed experimental data are unavailable. This absence of detailed measurement data for the validation of accurate simulations is one of the main reasons that many studies, including our study, assume simple physico-chemical characteristics despite the limitations. By considering all these points of view, in this study, the Mie theory was used under confined conditions. More rigorous methods are required for further study to overcome the limitations of the Mie theory.
Author Contributions
Conceptualization, C.H.J.; validation, J.Y.L. and S.H.H.; investigation, Y.P.K.; writing—original draft preparation, C.H.J. and J.Y.L. All authors have read and agreed to the published version of the manuscript.
Funding
This research was supported by the Technology Development Program to Solve Climate Changes through the National Research Foundation of Korea (NRF) funded by the Ministry of Science, ICT (2019M1A2A2103953) and by Korea Meteorological Administration Research and Development Program (CATER 2014-3190). This study was also supported by National Research Foundation of Korea (NRF) (2018R1D1A1A09083227) and by the FRIEND (Fine Particle Research Initiative in East Asia Considering National Differences) Project through the National Research Foundation of Korea (NRF) funded by the Ministry of Science and ICT (2020M3G1A1114617).
Conflicts of Interest
The authors declare no conflict of interest.
Appendix A

Table A1.
Composition-based MEEs, MAEs, and SSAs for different geometric mean diameters (dg0: 0.1 and 0.5 μm) and imaginary refractive indices of the HULISs (0.006 and 0.3) ( = 1.5).
Table A1.
Composition-based MEEs, MAEs, and SSAs for different geometric mean diameters (dg0: 0.1 and 0.5 μm) and imaginary refractive indices of the HULISs (0.006 and 0.3) ( = 1.5).
| dg (Geometric Mean Diameter, μm) | Composition | MEE (m2/g) | MAE (m2/g) | SSA |
|---|---|---|---|---|
| dg0 = 0.1 | EC | 8.93 | 6.14 | 0.31 |
| WSOC | 1.82 | 0.11 | 0.94 | |
| WISOC | 1.82 | 0.11 | 0.94 | |
| HULIS (IRI = 0.006) | 2.26 | 0.11 | 0.95 | |
| HULIS (IRI = 0.3) | 6.12 | 4.33 | 0.29 | |
| dg0 = 0.5 | EC | 3.17 | 1.64 | 0.48 |
| WSOC | 4.66 | 0.19 | 0.96 | |
| WISOC | 4.66 | 0.19 | 0.96 | |
| HULIS (IRI = 0.006) | 4.68 | 0.20 | 0.96 | |
| HULIS (IRI = 0.3) | 3.85 | 1.96 | 0.49 |
Figure A1.
Composition-based mass concentrations and contributions of carbonaceous aerosols.

Figure A2.
Composition-based extinction coefficients (bext) of carbonaceous aerosols with different geometric mean diameters (dg0: 0.1 and 0.5 μm) and imaginary refractive indices of HULISs (0.006 and 0.3; = 1.5).
Figure A2.
Composition-based extinction coefficients (bext) of carbonaceous aerosols with different geometric mean diameters (dg0: 0.1 and 0.5 μm) and imaginary refractive indices of HULISs (0.006 and 0.3; = 1.5).

Figure A3.
Size-resolved mass extinction efficiency (MEE) for each carbonaceous aerosol (EC, WSOC, and HULIS; = 1.5).
Figure A3.
Size-resolved mass extinction efficiency (MEE) for each carbonaceous aerosol (EC, WSOC, and HULIS; = 1.5).

References
- Contini, D.; Vecchi, R.; Viana, M. Carbonaceous aerosols in the atmosphere. Atmosphere 2018, 9, 181. [Google Scholar] [CrossRef] [Green Version]
- Saxena, P.; Hildemann, L.M. Water-Soluble organics in atmospheric particles: A critical review of the literature and application of thermodynamics to identify candidate compounds. J. Atmos. Chem. 1996, 24, 57–109. [Google Scholar] [CrossRef]
- Putaud, J.-P.; Raes, F.; Van Dingenen, R.; Brüggemann, E.; Facchini, M.-C.; Decesari, S.; Fuzzi, S.; Gehrig, R.; Hüglin, C.; Laj, P. A European aerosol phenomenology—2: Chemical characteristics of particulate matter at kerbside, urban, rural and background sites in Europe. Atmos. Environ. 2004, 38, 2579–2595. [Google Scholar] [CrossRef]
- Kanakidou, M.; Seinfeld, J.; Pandis, S.; Barnes, I.; Dentener, F.; Facchini, M.; Dingenen, R.V.; Ervens, B.; Nenes, A.; Nielsen, C. Organic aerosol and global climate modelling: A review. Atmos. Chem. Phys. 2005, 5, 1053–1123. [Google Scholar] [CrossRef] [Green Version]
- Bond, T.C. Spectral dependence of visible light absorption by carbonaceous particles emitted from coal combustion. Geophys. Res. Lett. 2001, 28, 4075–4078. [Google Scholar] [CrossRef] [Green Version]
- Jung, C.H.; Lee, J.Y.; Kim, Y.P. Estimation of aerosol optical properties considering hygroscopicity and light absorption. Atmos. Environ. 2015, 105, 191–201. [Google Scholar] [CrossRef]
- Jung, C.H.; Shin, H.J.; Lee, J.Y.; Kim, Y.P. Sensitivity and contribution of organic aerosols to aerosol optical properties based on their refractive index and hygroscopicity. Atmosphere 2016, 7, 65. [Google Scholar] [CrossRef] [Green Version]
- Graber, E.R.; Rudich, Y. Atmospheric HULIS: How humic like are they? A comprehensive and critical review. Atmos. Chem. Phys. 2006, 6, 729–753. [Google Scholar] [CrossRef] [Green Version]
- Limbeck, A.; Kulmala, M.; Puxbaum, H. Secondary organic aerosol formation in the atmosphere via heterogeneous reaction of gaseous isoprene on acidic particles. Geophys. Res. Lett. 2003, 30, 1996–1999. [Google Scholar] [CrossRef]
- Andreae, M.O.; Gelencser, A. Black carbon or brown carbon? The nature of light-absorbing carbonaceous aerosols. Atmos. Chem. Phys. 2006, 6, 3131–3148. [Google Scholar] [CrossRef] [Green Version]
- Watson, J.G. Overview of receptor model principles. J. Air Pollut. Control Assoc. 1984, 34, 619–623. [Google Scholar] [CrossRef] [Green Version]
- Holben, B.N.; Tanré, D.; Smirnov, A.; Eck, T.; Slutsker, I.; Abuhassan, N.; Newcomb, W.; Schafer, J.; Chatenet, B.; Lavenu, F.; et al. An emerging ground-based aerosol climatology: Aerosol optical depth from AERONET. J. Geophys. Res. 2001, 106, 12067–12097. [Google Scholar] [CrossRef]
- Subba, T.; Gogoi, M.M.; Pathak, B.; Bhuyan, P.; Babu, S. Recent trend in the global distribution of aerosol direct radiative forcing from satellite measurements. Atmos. Sci. Lett. 2020, 21, e975. [Google Scholar] [CrossRef]
- Lee, J.Y.; Jung, C.H.; Kim, Y.P. Estimation of optical properties for HULIS aerosols at Anmyeon Island, Korea. Atmosphere 2017, 8, 120. [Google Scholar] [CrossRef] [Green Version]
- Yu, X.; Shen, L.; Xiao, S.; Ma, J.; Lü, R.; Zhu, B.; Hu, J.; Chen, K.; Zhu, J. Chemical and optical properties of atmospheric aerosols during the polluted periods in a megacity in the Yangtze River Delta, China. Aerosol Air Qual. Res. 2019, 19, 103–117. [Google Scholar] [CrossRef] [Green Version]
- Jung, C.H.; Lee, J.Y.; Um, J.; Lee, S.S.; Yoon, Y.J.; Kim, Y.P. Estimation of source-based aerosol optical properties for polydisperse aerosols from receptor models. Appl. Sci. 2019, 9, 1443. [Google Scholar] [CrossRef] [Green Version]
- Han, S.; Lee, J.Y.; Lee, J.; Heo, J.; Jung, C.H.; Kim, E.S.; Kim, Y.P. Estimation of the source contributions for carbonaceous aerosols at a background site in Korea. Asian J. Atmos. Environ. 2018, 12, 311–325. [Google Scholar] [CrossRef]
- Norris, G.; Duvall, R.; Brown, S.; Bai, S. EPA Positive Matrix Factorization (PMF) 5.0 Fundamentals and User Guide Prepared for the US Environmental Protection Agency Office of Research and Development; EPA/600/R-14/108; United States Environmental Protection Agency (EPA): Washington, DC, USA, 2014.
- Paatero, P.; Tapper, U. Positive matrix factorization: A non-negative factor model with optimal utilization of error estimates of data values. Environmetrics 1994, 5, 111–126. [Google Scholar] [CrossRef]
- Kocifaj, M.; Gangl, M.; Kundracik, F.; Horvath, H.; Videen, G. Simulation of the optical properties of single composite aerosols. J. Aerosol Sci. 2006, 37, 1683–1695. [Google Scholar] [CrossRef]
- Kocifaj, M.; Videen, G. Optical behavior of composite carbonaceous aerosols: DDA and EMT approaches. J. Quant. Spectrosc. Radiat. Transf. 2008, 109, 1404–1416. [Google Scholar] [CrossRef]
- Malm, W.C.; Day, D.; Kreidenweis, S. Light scattering characteristics of aerosols as a function of relative humidity: Part I—A comparison of measured scattering and aerosol concentrations using the theoretical models. J. Air Waste Manag. Assoc. 2000, 50, 686–700. [Google Scholar] [CrossRef] [Green Version]
- Hand, J.L.; Malm, W.C. Review of aerosol mass scattering efficiencies from ground-based measurements since 1990. J. Geophys. Res. 2007, 112, D16203. [Google Scholar] [CrossRef]
- Fox, J. Applied Regression Analysis, Linear Models and Related Methods; Sage Publication, Inc.: Thousand Oaks, CA, USA, 1997. [Google Scholar]
- Farias, T.L.; Köylü, Ü.Ö.; Carvalho, M.G. Range of validity of the Rayleigh-Debye-Gans theory for optics of fractal aggregates. Appl. Opt. 1996, 35, 6560–6567. [Google Scholar] [CrossRef]
- Mishchenko, M.I. Electromagnetic scattering by nonspherical particles: A tutorial review. J. Quant. Spectrosc. Radiat. Transf. 2009, 110, 808–832. [Google Scholar] [CrossRef]
- Olmo, F.; Quirantes, A.; Alcántara, A.; Lyamani, H.; Arboledas, L. Preliminary results of a non-spherical aerosol method for the retrieval of the atmospheric aerosol optical properties. J. Quant. Spectrosc. Radiat. Transf. 2006, 100, 305–314. [Google Scholar] [CrossRef]
- Cheng, Y.F.; Wiedensohler, A.; Eichler, H.; Su, H.; Gnauk, T.; Brüggemann, E.; Herrmann, H.; Heintzenberg, J.; Slanina, J.; Tuch, T. Aerosol optical properties and related chemical apportionment at Xinken in Pearl River Delta of China. Atmos. Environ. 2008, 42, 6351–6372. [Google Scholar] [CrossRef]
- Zhu, W.; Cheng, Z.; Lou, S.; Hu, W.; Zheng, J.; Qiao, L.; Yan, N. Reconstructed algorithm for scattering coefficient of ambient submicron particles. Environ. Pollut. 2019, 253, 439–448. [Google Scholar] [CrossRef]
Figure 1.
Location of sampling site.

Figure 2.
Schematic diagram showing the calculation of the source-based optical properties of polydisperse carbonaceous aerosols. HULIS: humic-like substances; WSOC: water-soluble organic carbon; WISOC: water-insoluble organic carbon; EC: elemental carbon; OC: organic carbon; PMF: Positive Matrix Factorization.

Figure 3.
Source-based extinction coefficient (bext) and absorption coefficient (babs) of carbonaceous aerosols with different geometric mean diameters (dg0 of 0.1 and 0.5 μm) and imaginary refractive indices (IRIs) of HULISs (0.006 and 0.3; = 1.5) (a) bext, dg0 = 0.5 μm, IRI = 0.3, (b) babs, dg0 = 0.5 μm, IRI = 0.3, (c) bext, dg0 = 0.5 μm, IRI = 0.006, (d) babs, dg0 = 0.5 μm, IRI = 0.006, (e) bext, dg0 = 0.1 μm, IRI = 0.3, (f) babs, dg0 = 0.1 μm, IRI = 0.3, (g) bext, dg0 = 0.1 μm, IRI = 0.006, (h) babs, dg0 = 0.1 μm, IRI = 0.006).

Figure 4.
Aerosol extinction and absorption coefficients of carbonaceous aerosols for each source with different geometric mean diameters (dg0: 0.1 and 0.5 μm) and imaginary refractive indices (IRIs) of HULISs (IRI of 0.006 and 0.3; = 1.5) (a) bext, long-range biomass burning (LBB), IRI = 0.3, (b) babs, LBB, (c) bext, Local BB, (d) babs, Local BB, (e) bext, secondary organic aerosol, SOA), (f) babs, SOA, (g) bext, Biogenic, (h) babs, Biogenic, (i) bext, Mixed, (j) babs, Mixed.

Figure 5.
Contributions of source-based extinction coefficient and mass concentration with different geometric mean diameters (dg0 of 0.1 and 0.5 μm) and imaginary refractive indices (IRIs) of HULISs (0.006 and 0.3; = 1.5) (a) bext, dg0 = 0.1 μm, IRI = 0.006, (b) bext, dg0 = 0.5 μm, IRI = 0.006, (c) bext, dg0 = 0.5 μm, IRI = 0.006, (d) bext, dg0 = 0.5 μm, IRI = 0.3, (e) source-based mass concentration).

Figure 6.
Comparison of the average source-based extinction coefficient for different geometric mean diameters. The background condition (dg0 of 0.5 μm, IRI of 0.006) is compared with sources with different dg0 values ( = 1.5) (a) bext and mass concentration, (b) Contribution of bext and the mass (%).

Table 1.
Source-based mass extinction efficiencies (MEEs), mass absorption efficiencies (MAEs) and single scattering albedo (SSA) for different size distributions and imaginary refractive indices (IRIs) of HULIS ( = 1.5). (LBB: long range transported biomass burning; Local BB: local biomass burnig; SOA: secondary organic aerosol).
| dg0 (Geometric Mean Diameter, μm) | Sources | MEE | MAE | SSA |
|---|---|---|---|---|
| dg0 = 0.1, IRI(HULIS) = 0.006 | LBB | 2.50 | 0.56 | 0.78 |
| Local BB | 2.60 | 0.65 | 0.75 | |
| SOA | 2.53 | 0.55 | 0.78 | |
| Biogenic | 2.93 | 0.89 | 0.69 | |
| Mixed | 2.53 | 0.56 | 0.78 | |
| dg0 = 0.5, IRI(HULIS) = 0.00 | LBB | 4.56 | 0.30 | 0.93 |
| Local BB | 4.55 | 0.32 | 0.93 | |
| SOA | 4.56 | 0.30 | 0.93 | |
| Biogenic | 4.47 | 0.38 | 0.91 | |
| Mixed | 4.56 | 0.30 | 0.93 | |
| dg0 = 0.1, IRI(HULIS) = 0.3 | LBB | 3.85 | 2.03 | 0.47 |
| Local BB | 3.88 | 2.03 | 0.48 | |
| SOA | 4.31 | 2.48 | 0.43 | |
| Biogenic | 4.53 | 2.64 | 0.42 | |
| Mixed | 4.03 | 2.21 | 0.45 | |
| dg0 = 0.5, IRI(HULIS) = 0.3 | LBB | 4.27 | 0.91 | 0.79 |
| Local BB | 4.27 | 0.90 | 0.79 | |
| SOA | 4.19 | 1.11 | 0.74 | |
| Biogenic | 4.13 | 1.11 | 0.73 | |
| Mixed | 4.23 | 0.99 | 0.77 |
Publisher’s Note: MDPI stays neutral with regard to jurisdictional claims in published maps and institutional affiliations. |
© 2021 by the authors. Licensee MDPI, Basel, Switzerland. This article is an open access article distributed under the terms and conditions of the Creative Commons Attribution (CC BY) license (http://creativecommons.org/licenses/by/4.0/).
Share and Cite
MDPI and ACS Style
Jung, C.H.; Han, S.H.; Lee, J.Y.; Kim, Y.P. Source-Based Size-Resolved Optical Properties of Carbonaceous Aerosols. Appl. Sci. 2021, 11, 1434. https://0-doi-org.brum.beds.ac.uk/10.3390/app11041434
AMA Style
Jung CH, Han SH, Lee JY, Kim YP. Source-Based Size-Resolved Optical Properties of Carbonaceous Aerosols. Applied Sciences. 2021; 11(4):1434. https://0-doi-org.brum.beds.ac.uk/10.3390/app11041434
Chicago/Turabian StyleJung, Chang Hoon, Sang Hee Han, Ji Yi Lee, and Yong Pyo Kim. 2021. "Source-Based Size-Resolved Optical Properties of Carbonaceous Aerosols" Applied Sciences 11, no. 4: 1434. https://0-doi-org.brum.beds.ac.uk/10.3390/app11041434
Note that from the first issue of 2016, this journal uses article numbers instead of page numbers. See further details here.