Article

Estimation of the Optimum Energy Received by Solar Energy Flat-Plate Convertors in Greece Using Typical Meteorological Years. Part I: South-Oriented Tilt Angles

by
Harry D. Kambezidis
and
Basil E. Psiloglou
*,‡
Atmospheric Research Team, Institute of Environmental Research and Sustainable Development, National Observatory of Athens, P. Penteli, GR 15236 Athens, Greece
*
Author to whom correspondence should be addressed.
Emeritus Researcher.
Senior Researcher.
Submission received: 21 December 2020 / Revised: 28 January 2021 / Accepted: 3 February 2021 / Published: 8 February 2021

Abstract

:
The optimal solar radiation received on an inclined surface is always critical for energy purposes at a location or in an area. Therefore, many attempts have been made worldwide to calculate the optimum tilt angle for this purpose. The present study gives an answer about the south-oriented inclination or inclinations of solar panels in Greece for maximum efficiency. The analysis shows that an angle of 25° (and 30° in some cases) facing south is the most appropriate. To calculate this, the energy sums received on surfaces with inclination angles of 0–60° with a step of 5°, including φ° (φ being the geographical latitude) facing south at 33 locations in Greece were analyzed monthly, seasonally, and annually. The solar radiation data used in this work comes from corresponding typical meteorological years (TMYs) generated for the above locations. TMYs are used for the first time worldwide for the study of the optimum energy received by solar panels tilted south. Four new energy zones are defined to cover the whole of Greece.

1. Introduction

Solar flat-plate panels are widely used for converting solar energy into electricity. They are classified into two big groups: stationary (fixed) and dynamic (moving along one axis or dual axes) modules [1]. The stationary systems consist of solar panels that operate (receive solar energy) at fixed tilt angles with a southern orientation in the northern hemisphere. The dynamic group includes solar installations comprised of moving solar panels, which follow (track) the Sun. They are divided into one-axis and dual-axis systems. It is self-evident that the best performance of a solar system is from a dynamic one with dual-axis operation. This way, the solar panels are always normal to the solar rays throughout the day, receiving the maximum possible solar energy. Nevertheless, dynamic solar systems have higher costs than stationary ones due to their moving parts.
In practice, solar radiation measurements on a horizontal plane are infrequent worldwide due to the purchase and maintenance costs of the required radiometers [2]. On the other hand, solar radiation measurements on inclined surfaces are indeed rare [3] and, if they exist, they are performed for a limited time period. Therefore, solar radiation models for this purpose have been developed since the 1950s and are now numerous in the international literature. A good survey of most existing solar radiation models is given in [4].
Internationally, there have been many studies carried out in order to assess the best performance of either stationary (fixed tilt angle and constant orientation) or dynamic (solar tracking) systems. Efforts from researchers to give answers about the most suitable tilt angle or angles and southerly orientations throughout the year at various locations in the northern hemisphere for the best performance of solar energy flat-plate convertors are numerous. Most of them deal with the estimation of the most appropriate tilt and azimuth angles for static flat-plate convectors to receive the maximum solar energy in a year [1,5,6,7,8,9,10,11,12,13,14,15,16,17,18,19,20,21,22,23,24,25,26,27], within seasons [28], or for static photovoltaic (PV) flat-plate collectors in a year [29,30,31,32,33,34,35,36,37,38,39,40,41,42,43,44].
Such studies mostly used solar radiation models or statistical methods [16,17,27] to derive the optimum tilt angle and orientation for the maximum solar energy received on a solar flat-plate convector. Others used a combination of ground-based solar data and modeling [1], the retrieval of solar data from international data bases [45], or even satellite-derived solar data [46] with the purpose of deriving the maximum solar energy. Fewer studies, however, used solar radiation data from ground stations, because such stations are sparse. The present study aims to investigate the optimal tilt angle with a southern orientation over Greece, but it confronts this matter in a different and mostly innovative way. It focuses on stationary solar flat-plate convectors (as Part I of the study), while two future studies intend to investigate the energy gain from dynamic solar flat-plate convectors (single-axis systems in Part II and dual-axis systems in Part III).
As far as Greece is concerned, several works have appeared in the literature in the context of the aim of the present study. Tsalides and Thanailakis [43] found that for south-facing PV arrays, the optimum tilt angles for azimuths of ±30° (0° due south) receive solar power about 30% greater than those at tilt angles equal to the latitude of the site. On the contrary, Koronakis [47] estimated the optimum tilt angles with southern orientations for Athens to be 25° S in the case of solar flat-plate panels and 30° S for concentrated solar cells (CPC) all year round. Synodinou and Katsoulis [48] repeated their calculations for Athens and found that a tilt angle equal to the latitude of the site collected the maximum energy all year round. Darhmaoudi et al. [49], upon analyzing the solar radiation data bases of 35 sites along the Mediterranean region, found optimum tilt angles with southern orientations for Irakleio, Athens, and Mikra of 35.1°, 36.8°, and 38.7°, respectively. Jacobson and Jadhav [50] gave a review of the optimum tilt angles for solar applications around the world by using the PVWatts algorithm [51]; for Athens, they estimated it to be 29°. Raptis et al. [52] found an optimum tilt angle of 30° S in Athens. Lastly, the work by Weissenbacher [53] must be mentioned here as it gave a new definition for the optimal tilt angle of solar flat-plate convectors for energy policy makers.
The present work provides two innovations. First, none of the studies, either in Greece or internationally, have examined the importance of the deficiency (or surplus) of the energy received between a solar flat-plate collector having a fixed tilt angle equal to the geographical latitude of its location and one with an optimum angle of inclination for maximum solar energy reception. This is served in this work for the first time. Another innovation of this work is the use of the recently derived typical meteorological years (TMYs) in Greece for PV applications at 33 sites [54]. “A TMY is a set of meteorological and solar radiation parameters usually consisting of hourly values in a year for a given geographical location” [54,55]. “More specifically, a TMY consists of a set of months selected from individual years integrated into a complete year” [54]. Therefore, “a TMY reflects all the climatic information of the location for a period as long as the mean life of the system” [54]. That study derived for 33 locations in Greece TMYs for 5 different applications: TMY-meteorology-climatology, TMY-bio-meteorology, TMY-agro-meteorology-hydrology, TMY-PV, and the TMY energy design of buildings. TMYs-PV include hourly solar radiation values on a horizontal surface. These data can be transposed to solar radiation data on various tilts with southern orientations. The latter data can be used for the investigation of the positive (surplus) or negative (deficiency) difference of the energy received by solar panels having a south-facing tilt angle equal to the geographical latitude of each of the 33 locations, in respect to the energy received by solar panels tilted at angles of 25° or 30° to the south, as these angles are found to be optimal inclinations for solar flat-plate convectors in the country. In addition, the energy received by a horizontal plane (classical reference case) is included.
The structure of the paper is as follows. Section 2 describes the data collection and data analysis. Section 3 deploys the results of the study, while Section 4 discusses them from a practical point of view. Section 5 presents the conclusions and main achievements of the work, and the acknowledgements and references follow.

2. Materials and Methods

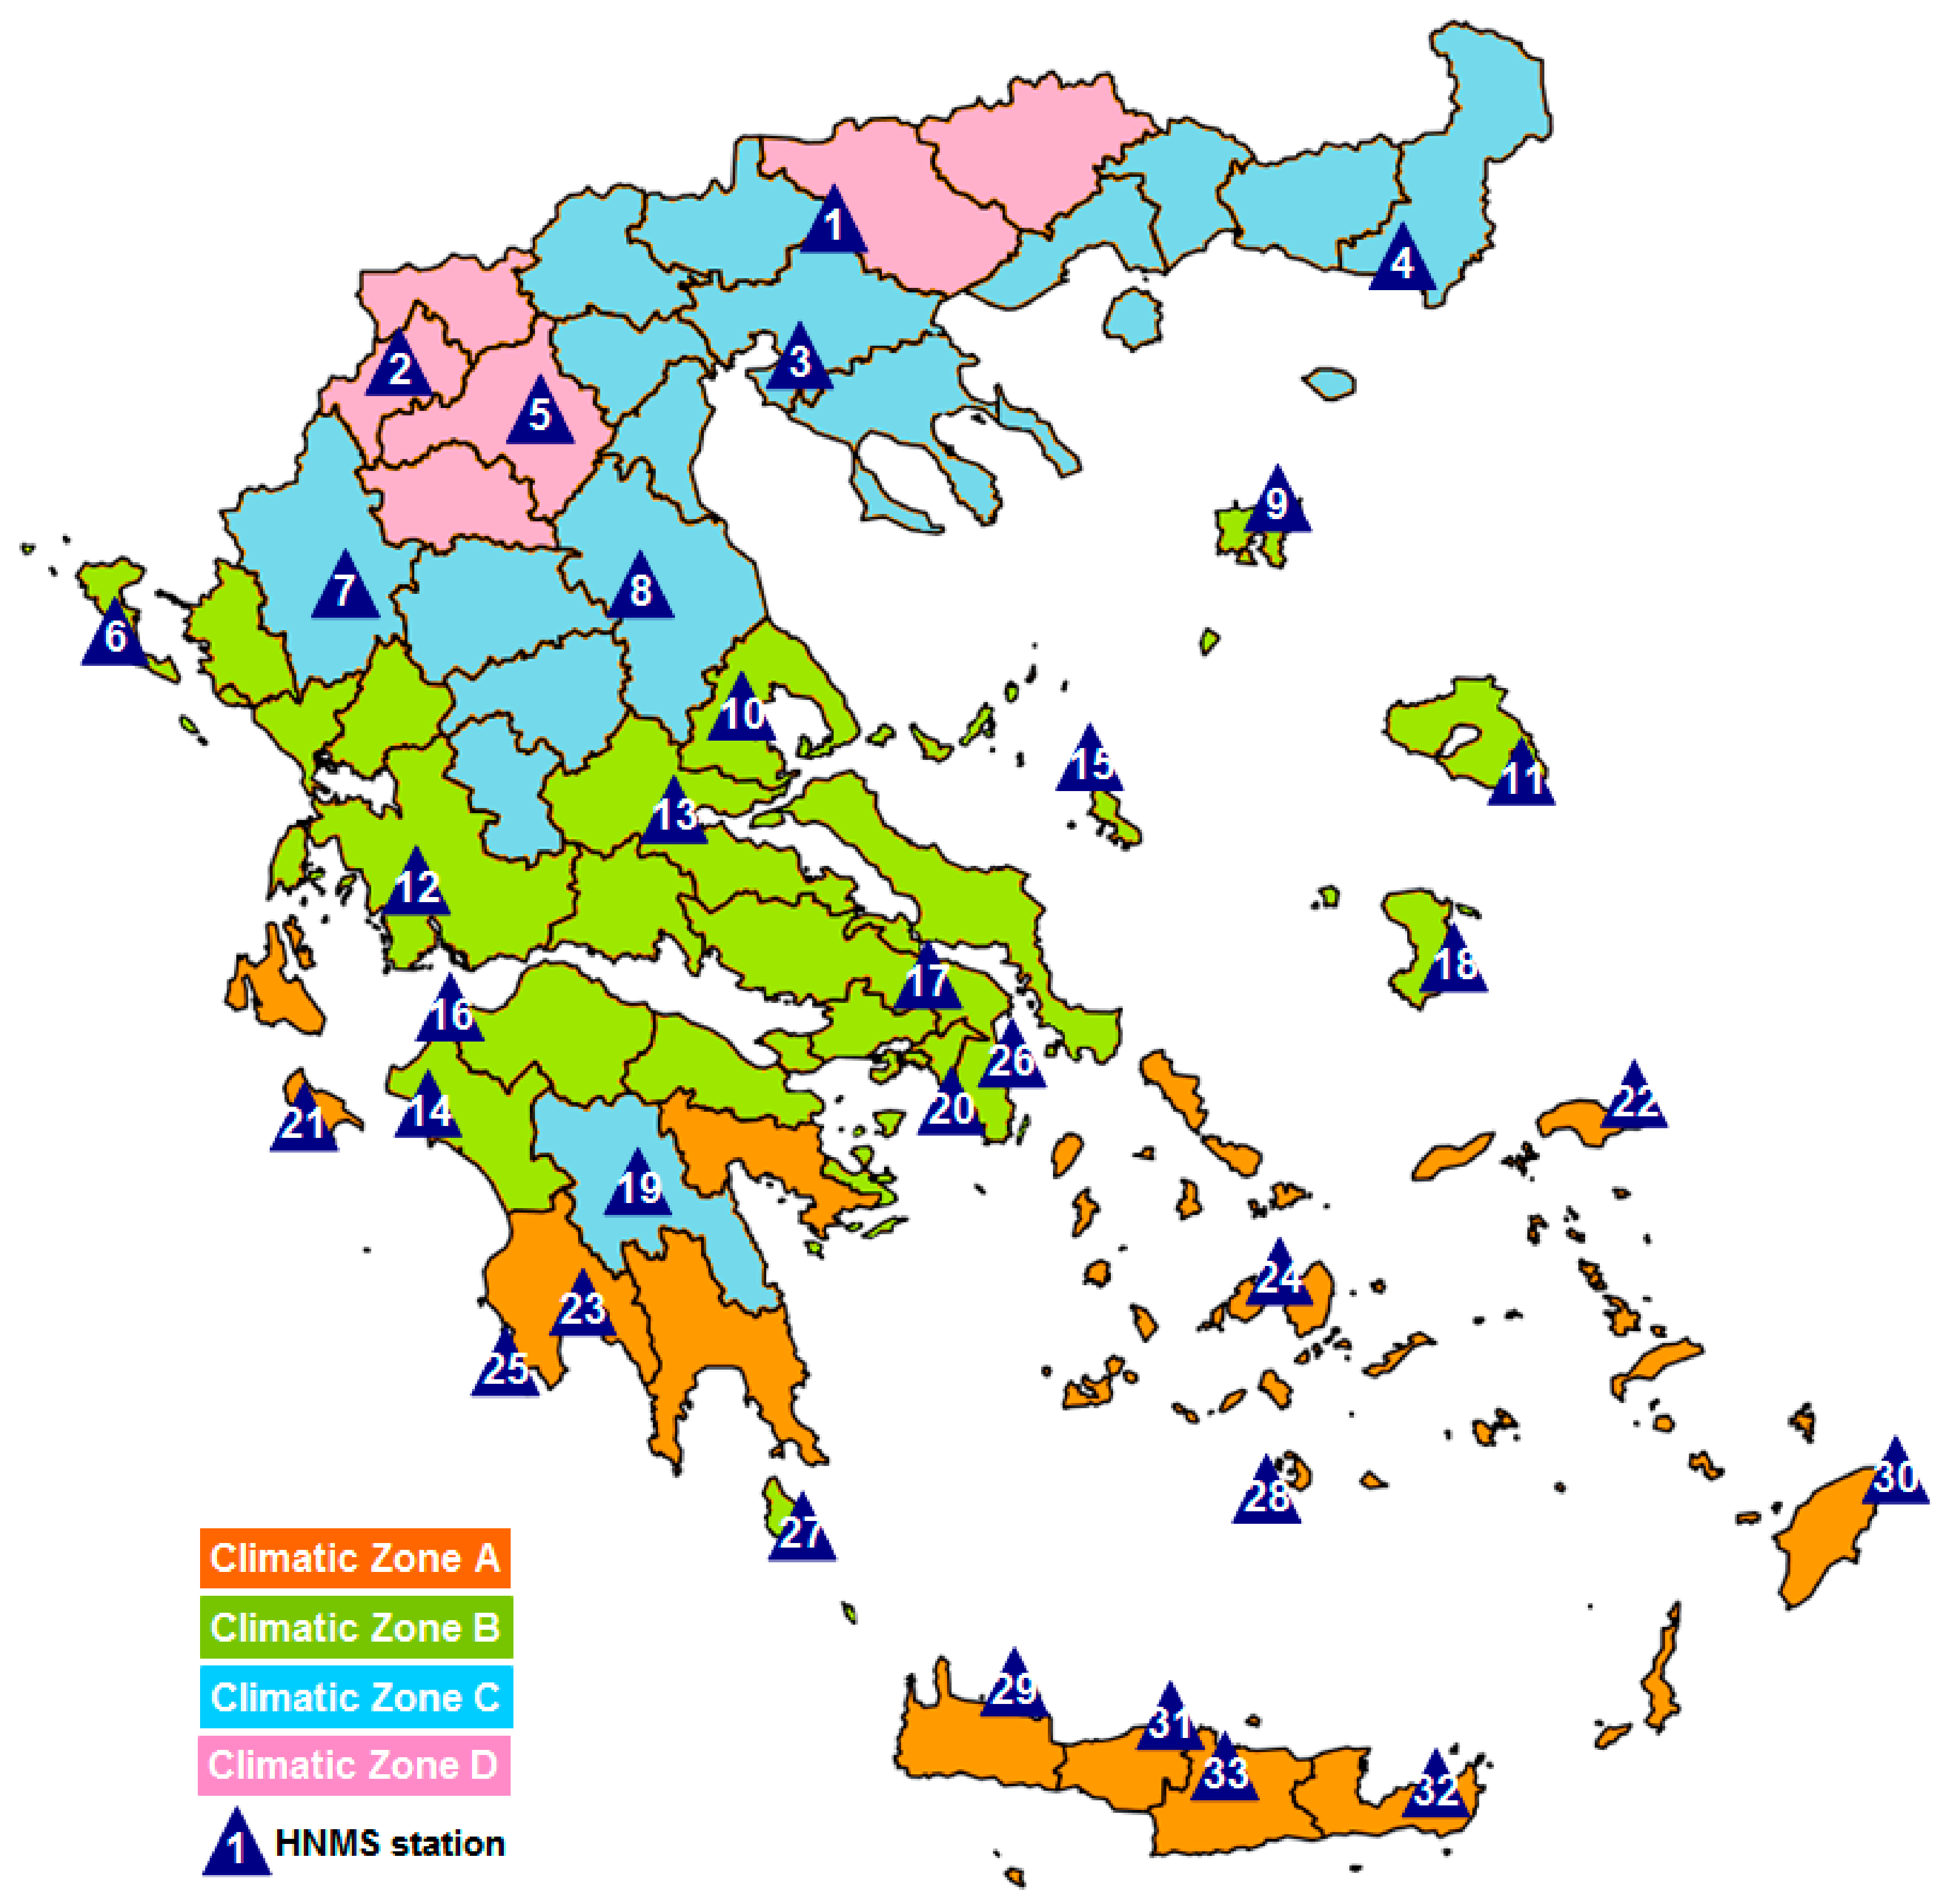
2.1. Data Collection
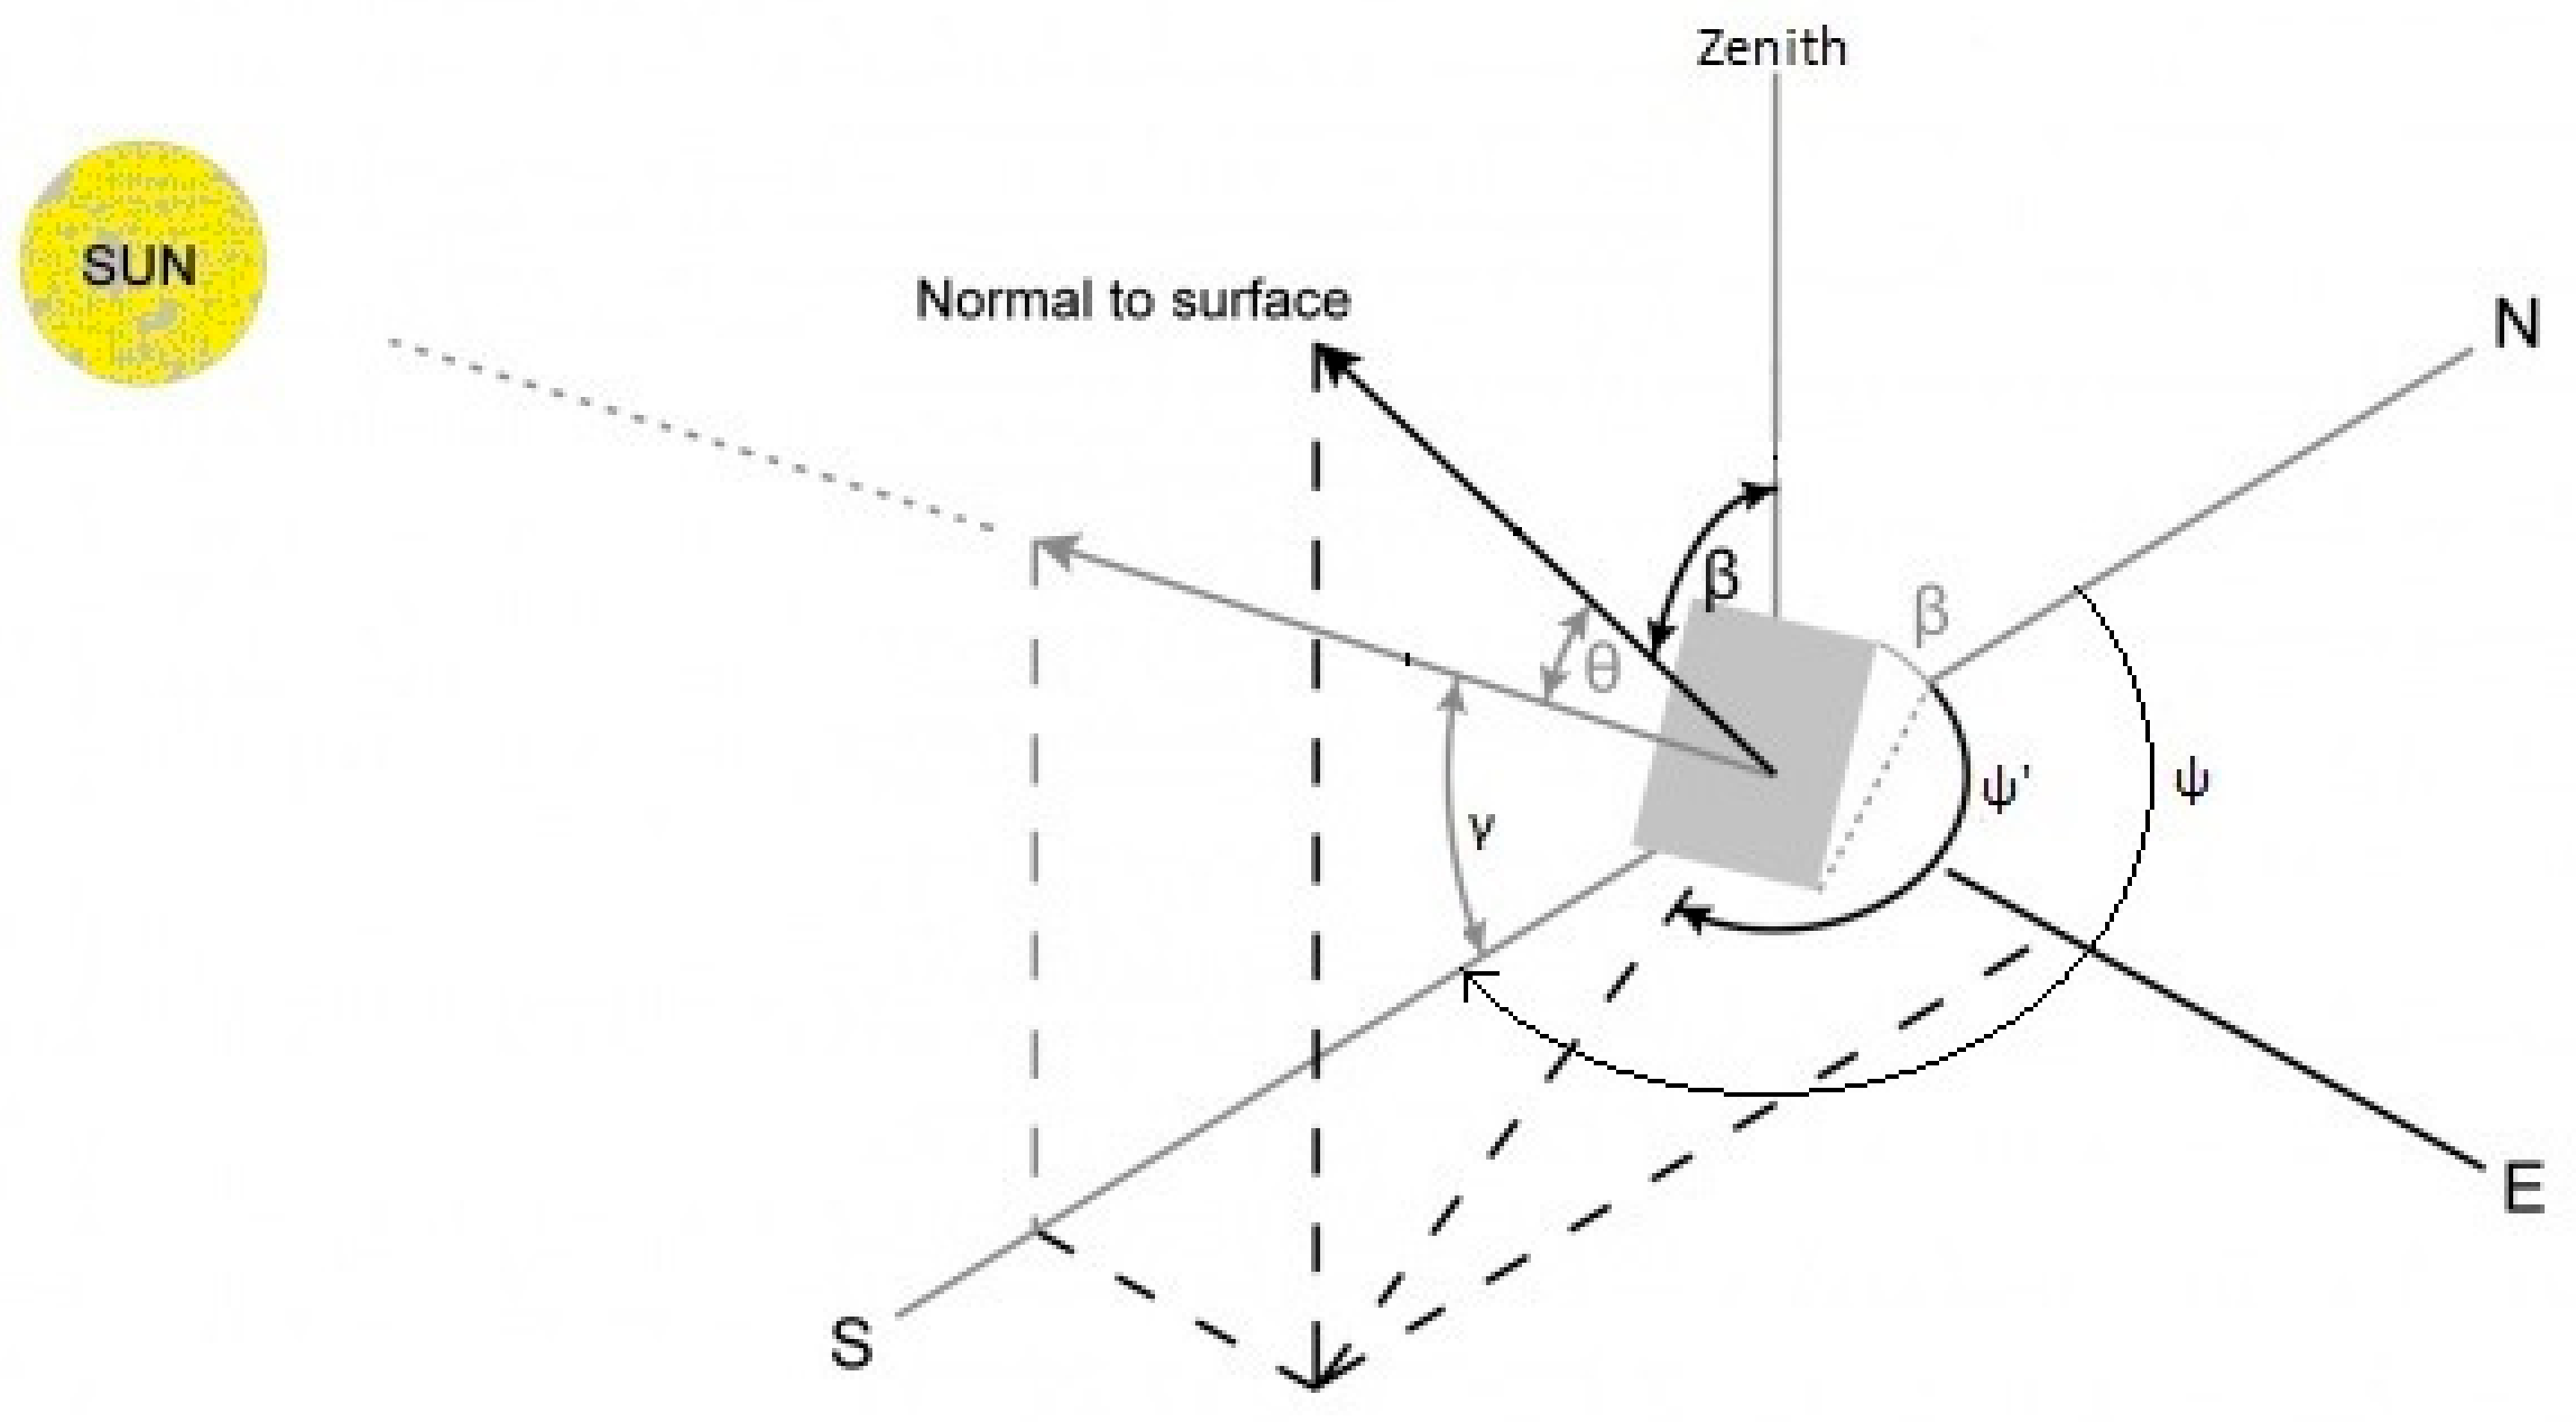
As mentioned in Section 1, the hourly values of the meteorological and radiometric data included in the 33 TMYs-PV were used. Each TMY file contained 12 typical meteorological months (TMMs), which were selected through an appropriate statistical procedure from a database covering the time period of 1985–2014 (30 years). The meteorological data (ambient temperature in degrees Celsius and relative humidity as a percentage) were measurements from an equivalent number of meteorological stations operated by the Hellenic National Meteorological Service (HNMS), showed in Figure 1. The radiometric data (global and direct horizontal irradiances in Wm−2) were simulations performed by the Meteorological Radiation Model (MRM) [56,57], since the HNMS network does not include solar radiation measurements. More details about the generation of the 33 TMYs across Greece can be found in [54]. It should be mentioned here that each TMY-PV consisted of TMMs belonging to different years in the 30 year period. Each TMM was selected through an appropriate statistical procedure [54], being the most representative month climatologically in the examined period. Table 1 shows the years from which the 12 TMMs at 4 HNMS stations were selected.
The definitions of the four climatic zones of Greece are given in Table 2, according to the technical guidelines (TOTEE) established by the Technical Chamber of Greece [58], where HDD stands for heating degrees days, CDH stands for cooling degree hours, and SSR stands for surface solar radiation.

2.2. Data Analysis

The data sets mentioned in the previous section were obtained from the HNMS in the frame of the “Development of synergistic and integrated methods and tools for monitoring, management and forecasting of environmental parameters and pressures” (KRIPIS-THESPIA-II) project, during which the atmospheric research team of the National Observatory of Athens derived the TMYs-PV (as well as TMYs for four other applications; see the end of Section 1) for 33 sites in Greece.
Each TMY-PV at any of the 33 locations in Greece consisted of hourly values of the ambient temperature (in °C), relative humidity (in %), and global horizontal and direct horizontal solar irradiances (in Wm−2). All mentioned parameters referred to the station’s altitude and went through quality control tests during the generation process of the TMYs (see [54]).
The original Sun’s azimuth and elevation (SUNAE) routine, first introduced by Walraven [59], together with its modifications [59,60,61,62,63] ran with the geographical coordinates of the 33 stations in local standard time (LST = UTC + 2 h) to estimate the solar altitude γ. The SUNAE algorithm computed γ every 30 min prior to the hour, and this value was assigned to the next hour afterward (e.g., computation of γ at 08:30 LST means accommodation of the value at 09:00 LST). The SUNAE algorithm was applied to each TMM of the site’s TMY and for the specific year the TMM belonged to (see the example in Table 1). Only values of γ greater than or equal to 5 degrees were considered (to avoid the cosine effect). This criterion affected all subsequent calculations.
The diffuse horizontal irradiance De was estimated by the difference GeBe, where Be is the direct horizontal irradiance and Ge the global horizontal one, both provided in the TMYs-PV. For estimating the global irradiance on an inclined plane facing south, the isotropic model of Liu and Jordan [64] was adopted for estimating the reflected radiation component from the surrounding surface Re,βS (in Wm−2) received by the solar collector. This model proved to be as efficient at providing the tilted total radiation in Greece as other more sophisticated ones [44]. For a south-facing surface inclined at β degrees with respect to the local horizon, the received total solar radiation Ge,βS is given by the following equation [65]:
G e , β S = B e , β S + D e , β S + R e , β S
where the subscript S denotes the southern orientation of the solar collector at an inclination of β degrees with respect to the local horizon. According to Liu and Jordan [64], the following are true:
D e , β S = D e R d i
R e , β S = G e R r ρ g
R d i = 0.5 1 + cos β
R r = 0.5 1 cos β
B e , β S = B e cos θ sin γ
cos θ = sin β cos γ cos ψ ψ + cos β sin γ
where θ is the incidence angle and ψ and ψ’ are the solar azimuths of the Sun and the inclined plane, respectively (see Figure 2 for definition). The former two solar parameters were estimated through the SUNAE algorithm, while ψ’ was always equal to 180 degrees. Rdi is called the isotropic sky configuration factor, Rr is the configuration factor between the ground and the receiver plane, and ρg = 0.2 (isotropic albedo). In the present study, the angle β varied in the range of 0–60° in steps of 5°, and φ° (0° implies a horizontal plane, for which Re,0S = 0) is the latitude of the location. Be,0S values were included in the TMYs-PV, while the rest of them (Be,iS, i ϵ [5–60, φ]) were calculated after Equation (6). In a similar way, De,0S = De was calculated as the difference GeBe, where Be = Be,0S. All other values of De,iS, i ϵ [5–60, φ] were calculated after Equations (2) and (4). Similarly, Re,iS, i ϵ [5–60, φ] values were computed after Equations (3) and (5). All above calculations were performed through a FORmula TRANslation (FORTRAN) programming code specifically developed for the purpose of this study.
All analyses deployed in Section 3 refer to annual, seasonal, or monthly mean sums of received solar energy (in kWhm−2) under all-sky conditions.

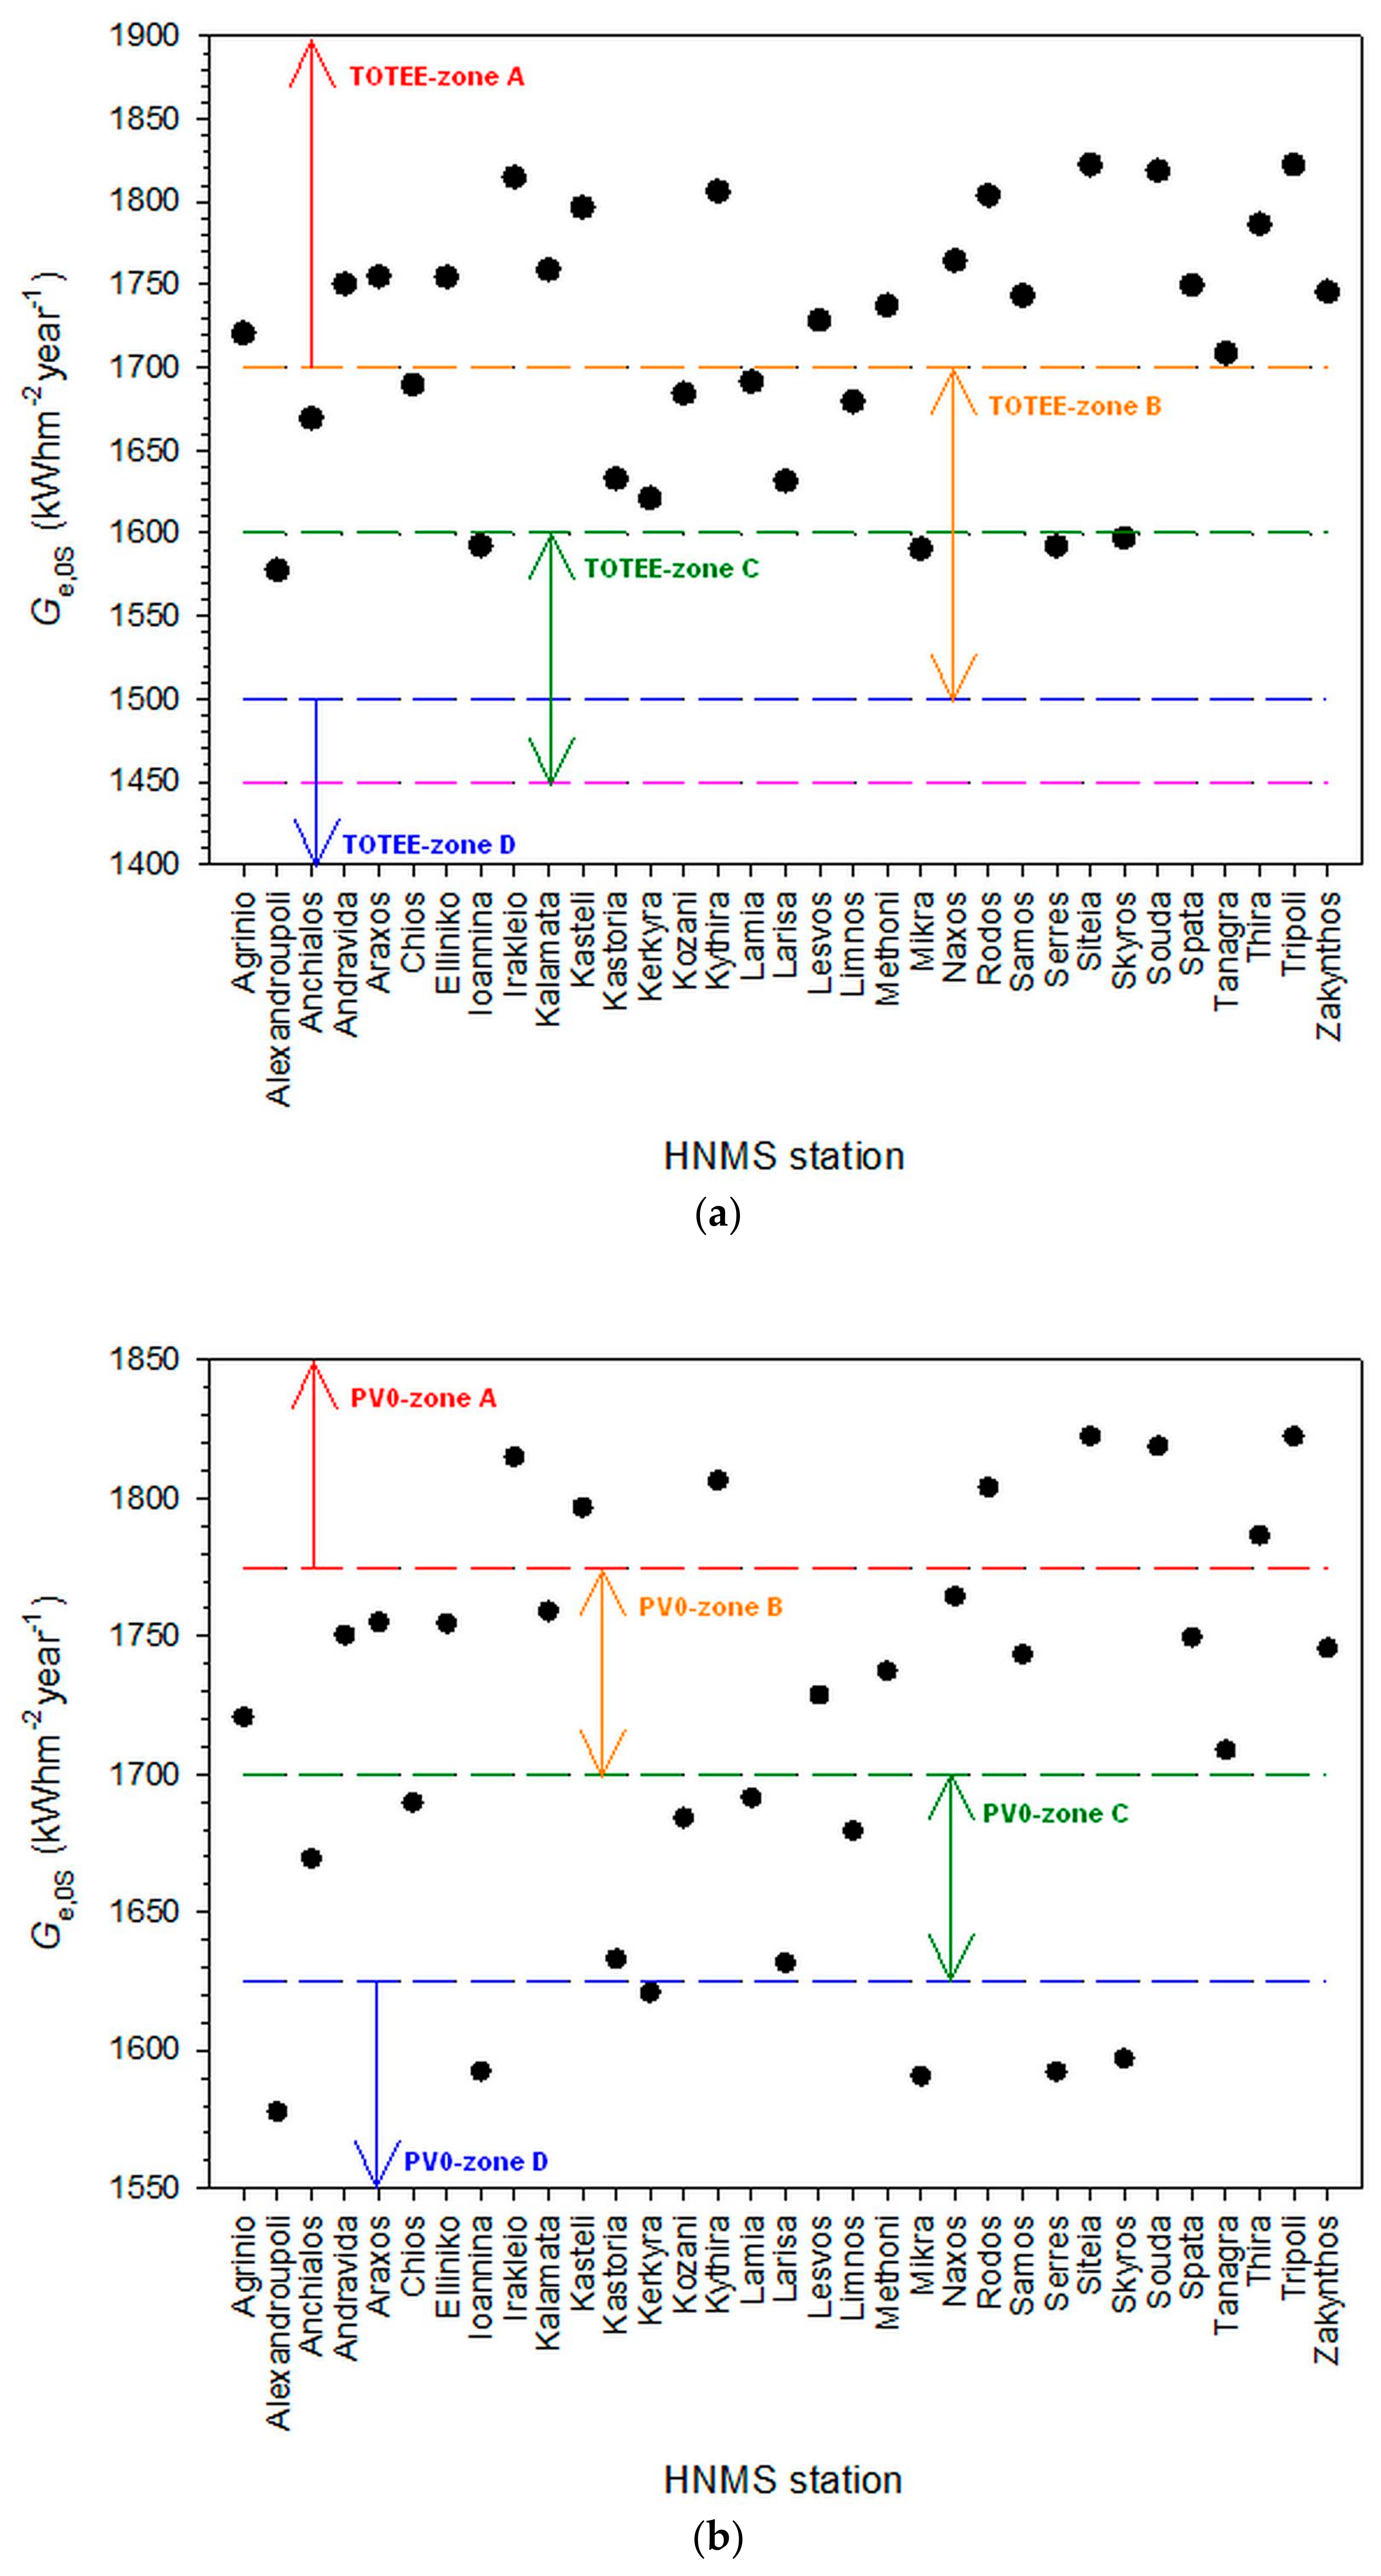
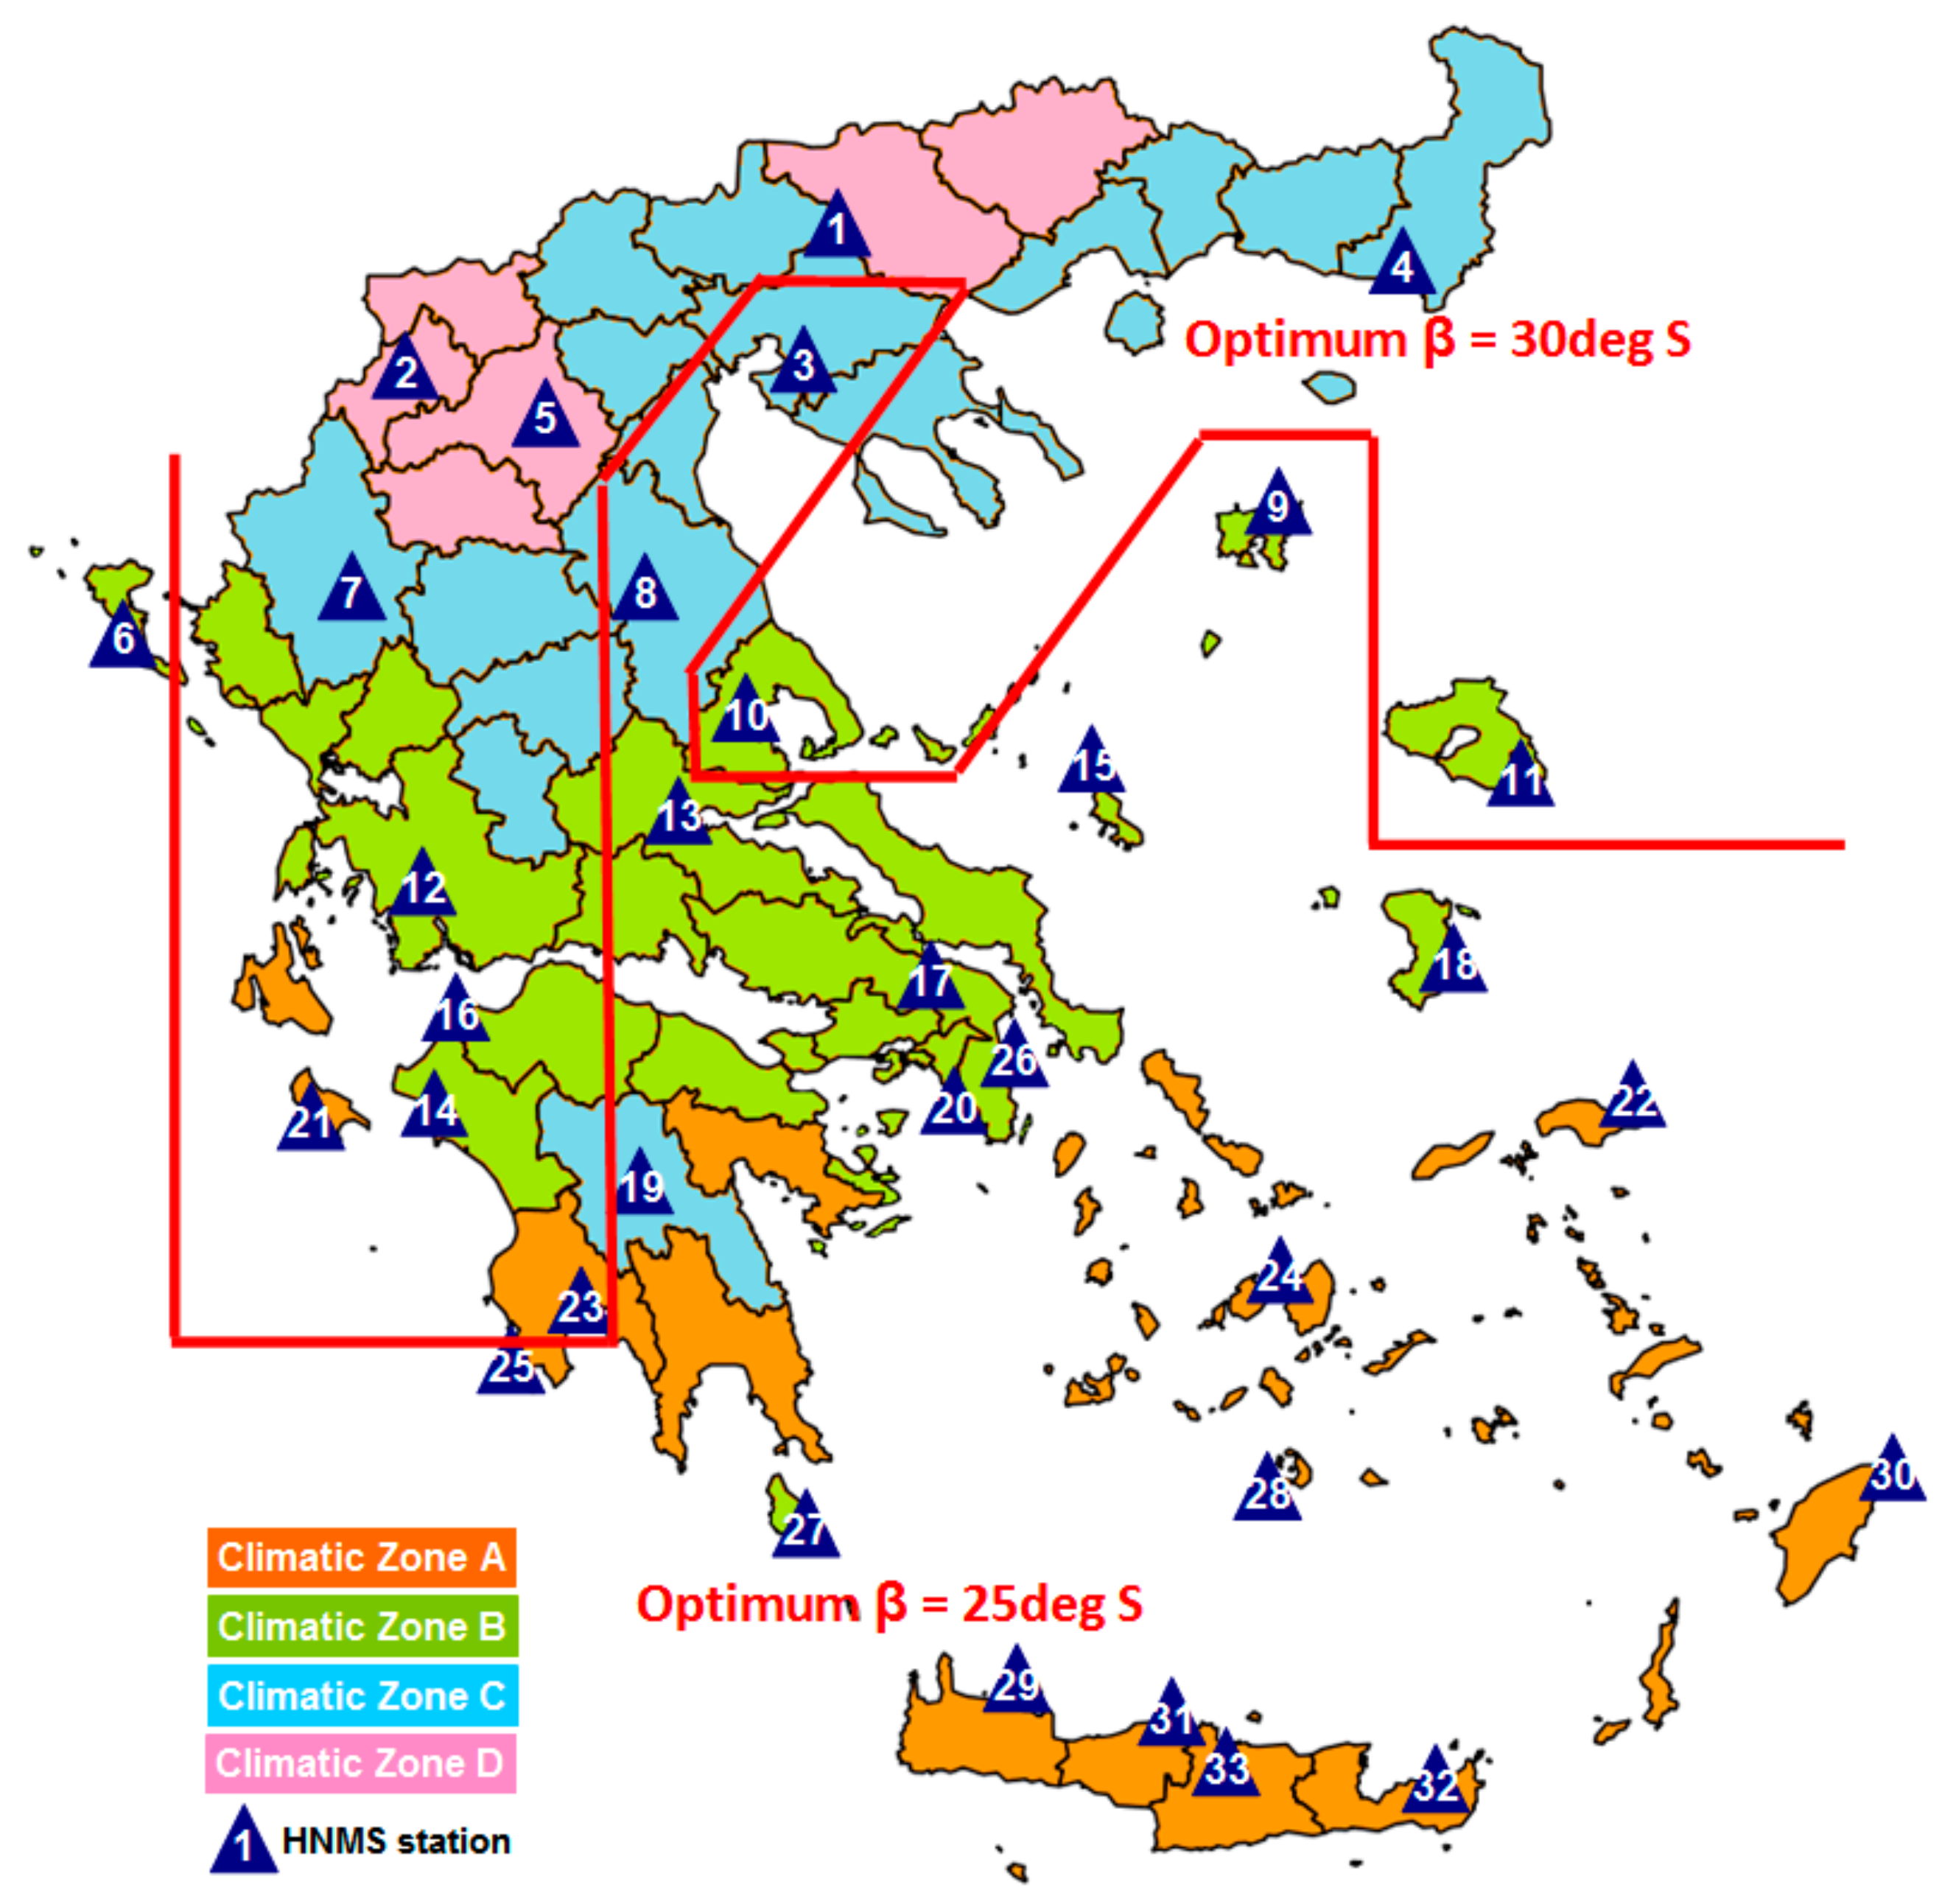
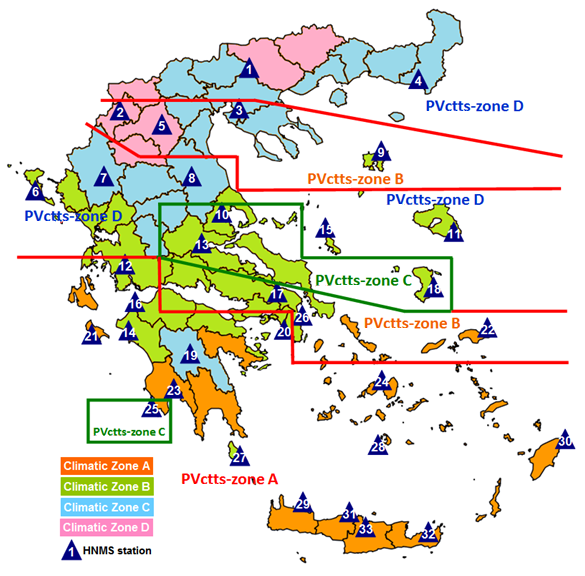
2.3. Definition of Energy Zones

The previous section showed that Greece is divided into four climatic regions (zones), as far as energy purposed for buildings is concerned. This division is based on the criteria of Table 2. The map in Figure 1 deploys the selected 33 sites into regions, which obtain a different color according to these criteria. Furthermore, by isolating the SSR limits of Table 2 (column 4), the notion of energy zones in Greece is introduced for solar applications. The definition relies on the annual solar energy received on a horizontal flat plane all over Greece. For this purpose, the annual energy yield for every HNMS station of the 33 mentioned in Table 3 was estimated. Figure 3a shows these annual energy yields together with the SSR limits of Table 2. Again, four zones are identified, which are named TOTEE zones. It is important to observe that there are no data points in the TOTEE zone C (i.e., below 1550 kWhm−2·year−1) or above 1850 kWhm−2·year−1. In addition, zones B and C overlap, while zone D is not used at all in accommodating the annual energy yield from any site. To overcome these problems, the span of 1550–1850 kWhm−2·year−1 was divided into 4 equal shares, which are shown in Figure 3b. Each band is called a PV0 zone; the subscript 0 implies the solar global irradiation received by a horizontal plane (inclination of 0° to the local horizon). A comparison of these thresholds defining the TOTEE and PV0 zones is shown in Table 4. Nevertheless, there is a discrepancy in the categorization of the sites according to the climatic zones (colors in the map of Figure 1) and the TOTEE ones (Figure 3a). To realize the problem, Table 3 shows the various categorization schemes according to the above and highlights the mentioned discrepancies. The present work adopted the PV0 categorization for global horizontal irradiation as a more appropriate and crystal-clear classification scheme and used it in the analysis that follows.

3. Results

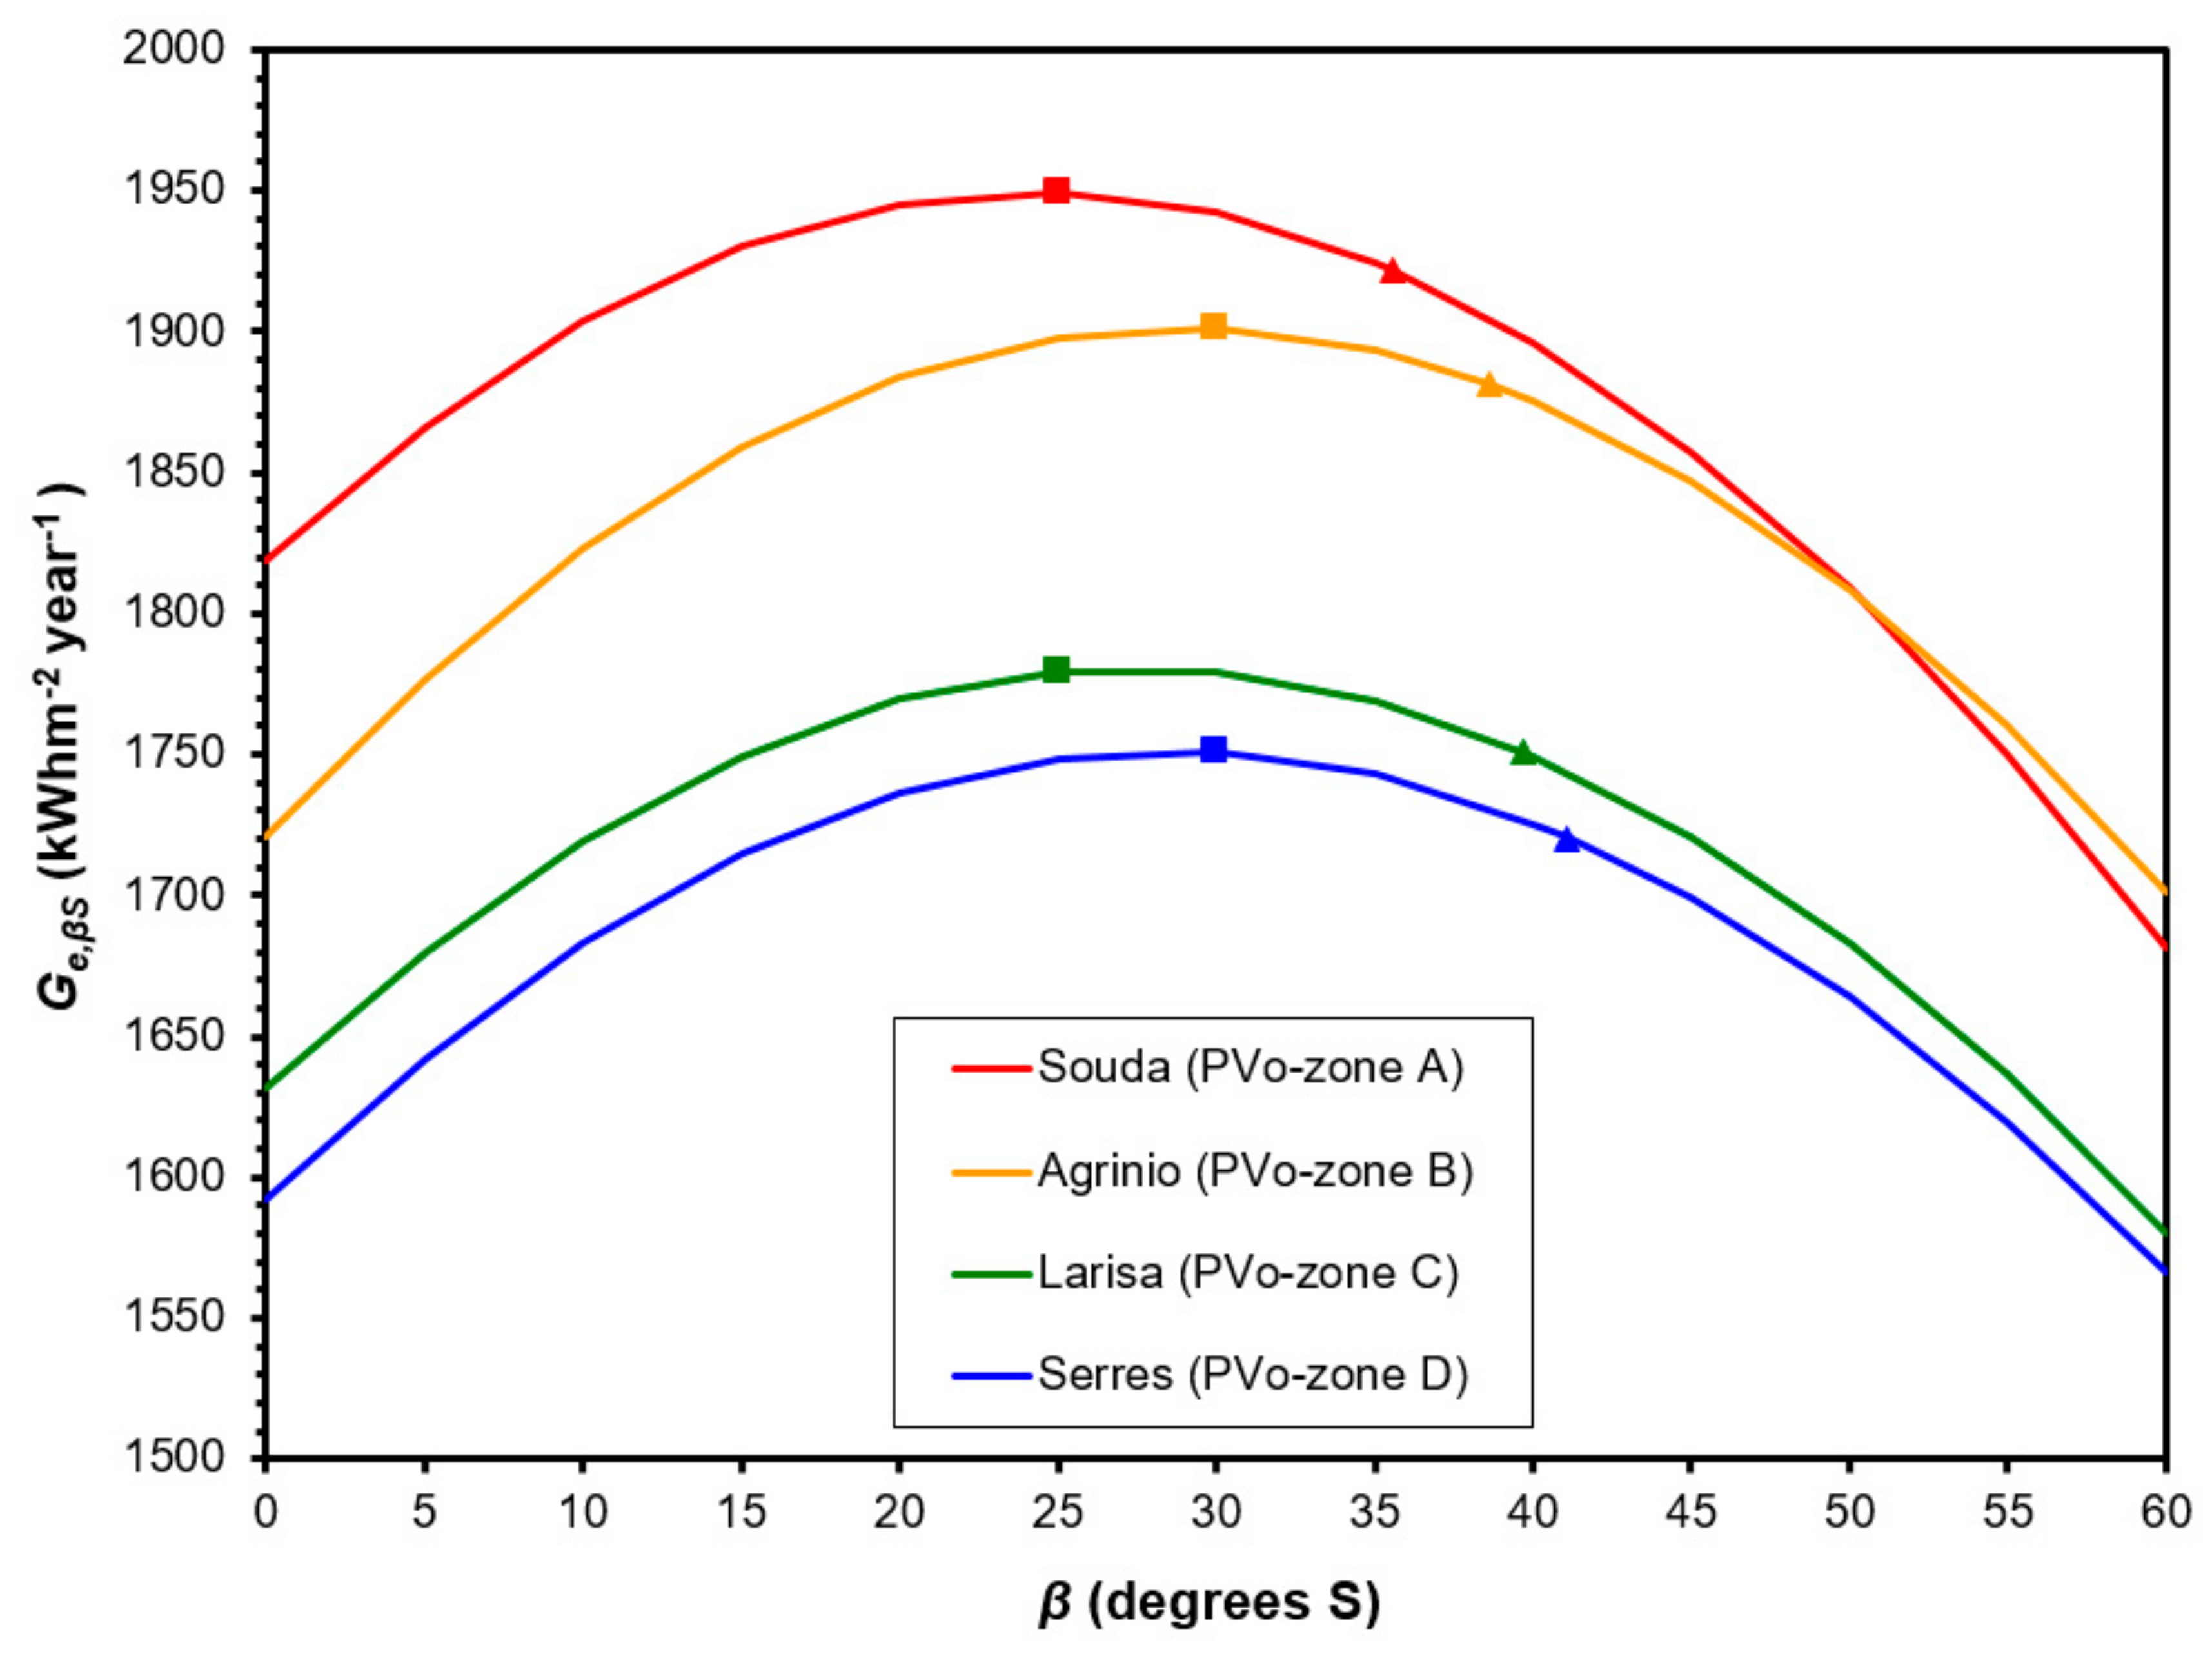
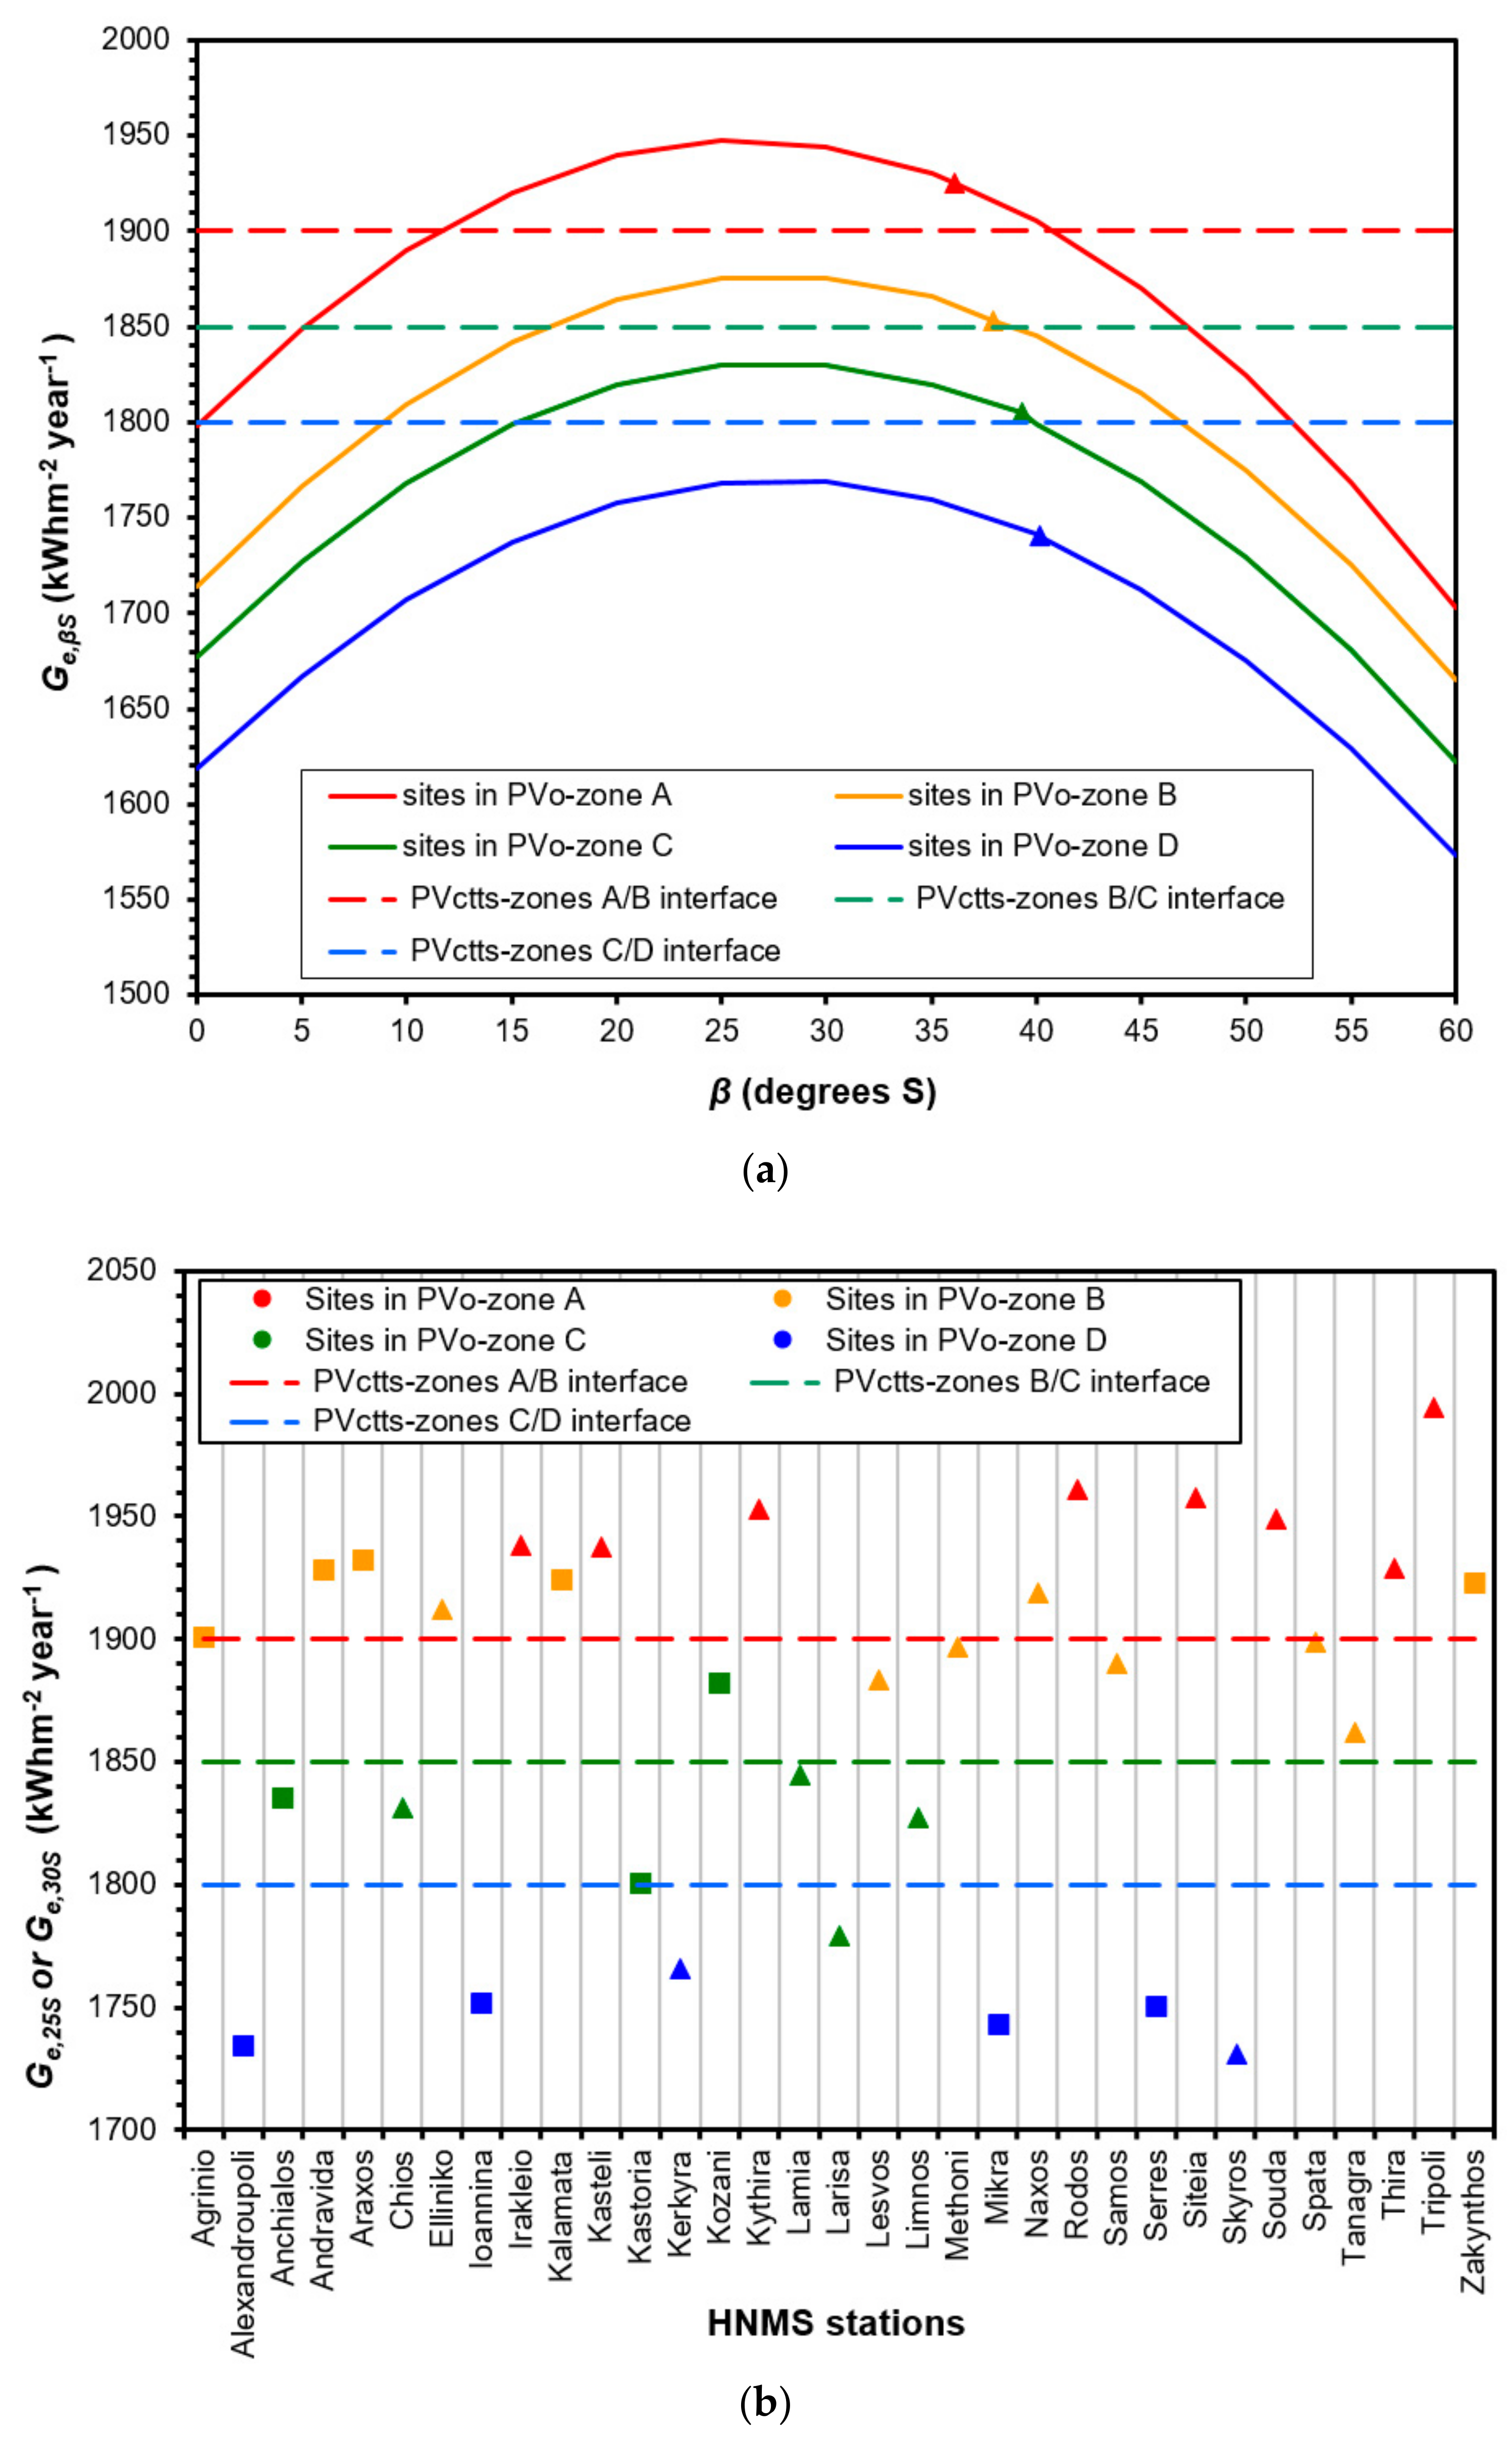
3.1. Annual Energy Yields

Figure 4 shows the annual sums of the energy received on the horizontal plane and inclined surfaces with southern orientations at four sites in Greece. The sites were selected to represent each of the four PV0 zones. It is seen that maximum energy was received by a solar collector inclined to the south at an angle of either β = 25° (Larisa, Souda) or β = 30° (Agrinio, Serres). Following this example, Figure 5a presents the annual energy sum, averaged over all sites corresponding to the same PV0 zone and received on flat planes inclined to the south at angles from 0° to 60° in steps of 5°. It is seen from Figure 5a that the energy received per tilt angle was at its maximum at 25° or 30° in all PV0 zones, as demonstrated in Figure 4; the energy received on the horizontal plane is shown at β = 0°.
In order to discriminate the sites according to the energy received on a south-facing flat-plate solar convertor in Greece tilted at either 25° or 30°, three thresholds were introduced for this purpose: 1900 kWhm−2·year−1, 1850 kWhm−2·year−1, and 1800 kWhm−2·year−1). These diving lines formed four new zones, which are called PVctts zones (ctts = constant tilt to the south). By picking the optimal tilt angle for each site for the maximum annual energy received on a solar panel with an inclination to the south, Figure 5b was drawn. It shows all 33 sites, with the annual energy received on a sloped surface with an inclination of either 25° or 30°. The color of each data point in Figure 5a,b refers to the PV0 zone it belongs to (red for PV0-zone A, orange for PV0-zone B, green for PV0-zone C, and blue for PV0-zone D). Table 4 summarizes the thresholds for the PVctts (inclined surfaces), PV0, and TOTEE (horizontal plane) classification schemes.
Because of the above findings, Table 3 can be modified to Table 5 to include the optimal tilt angle per site.

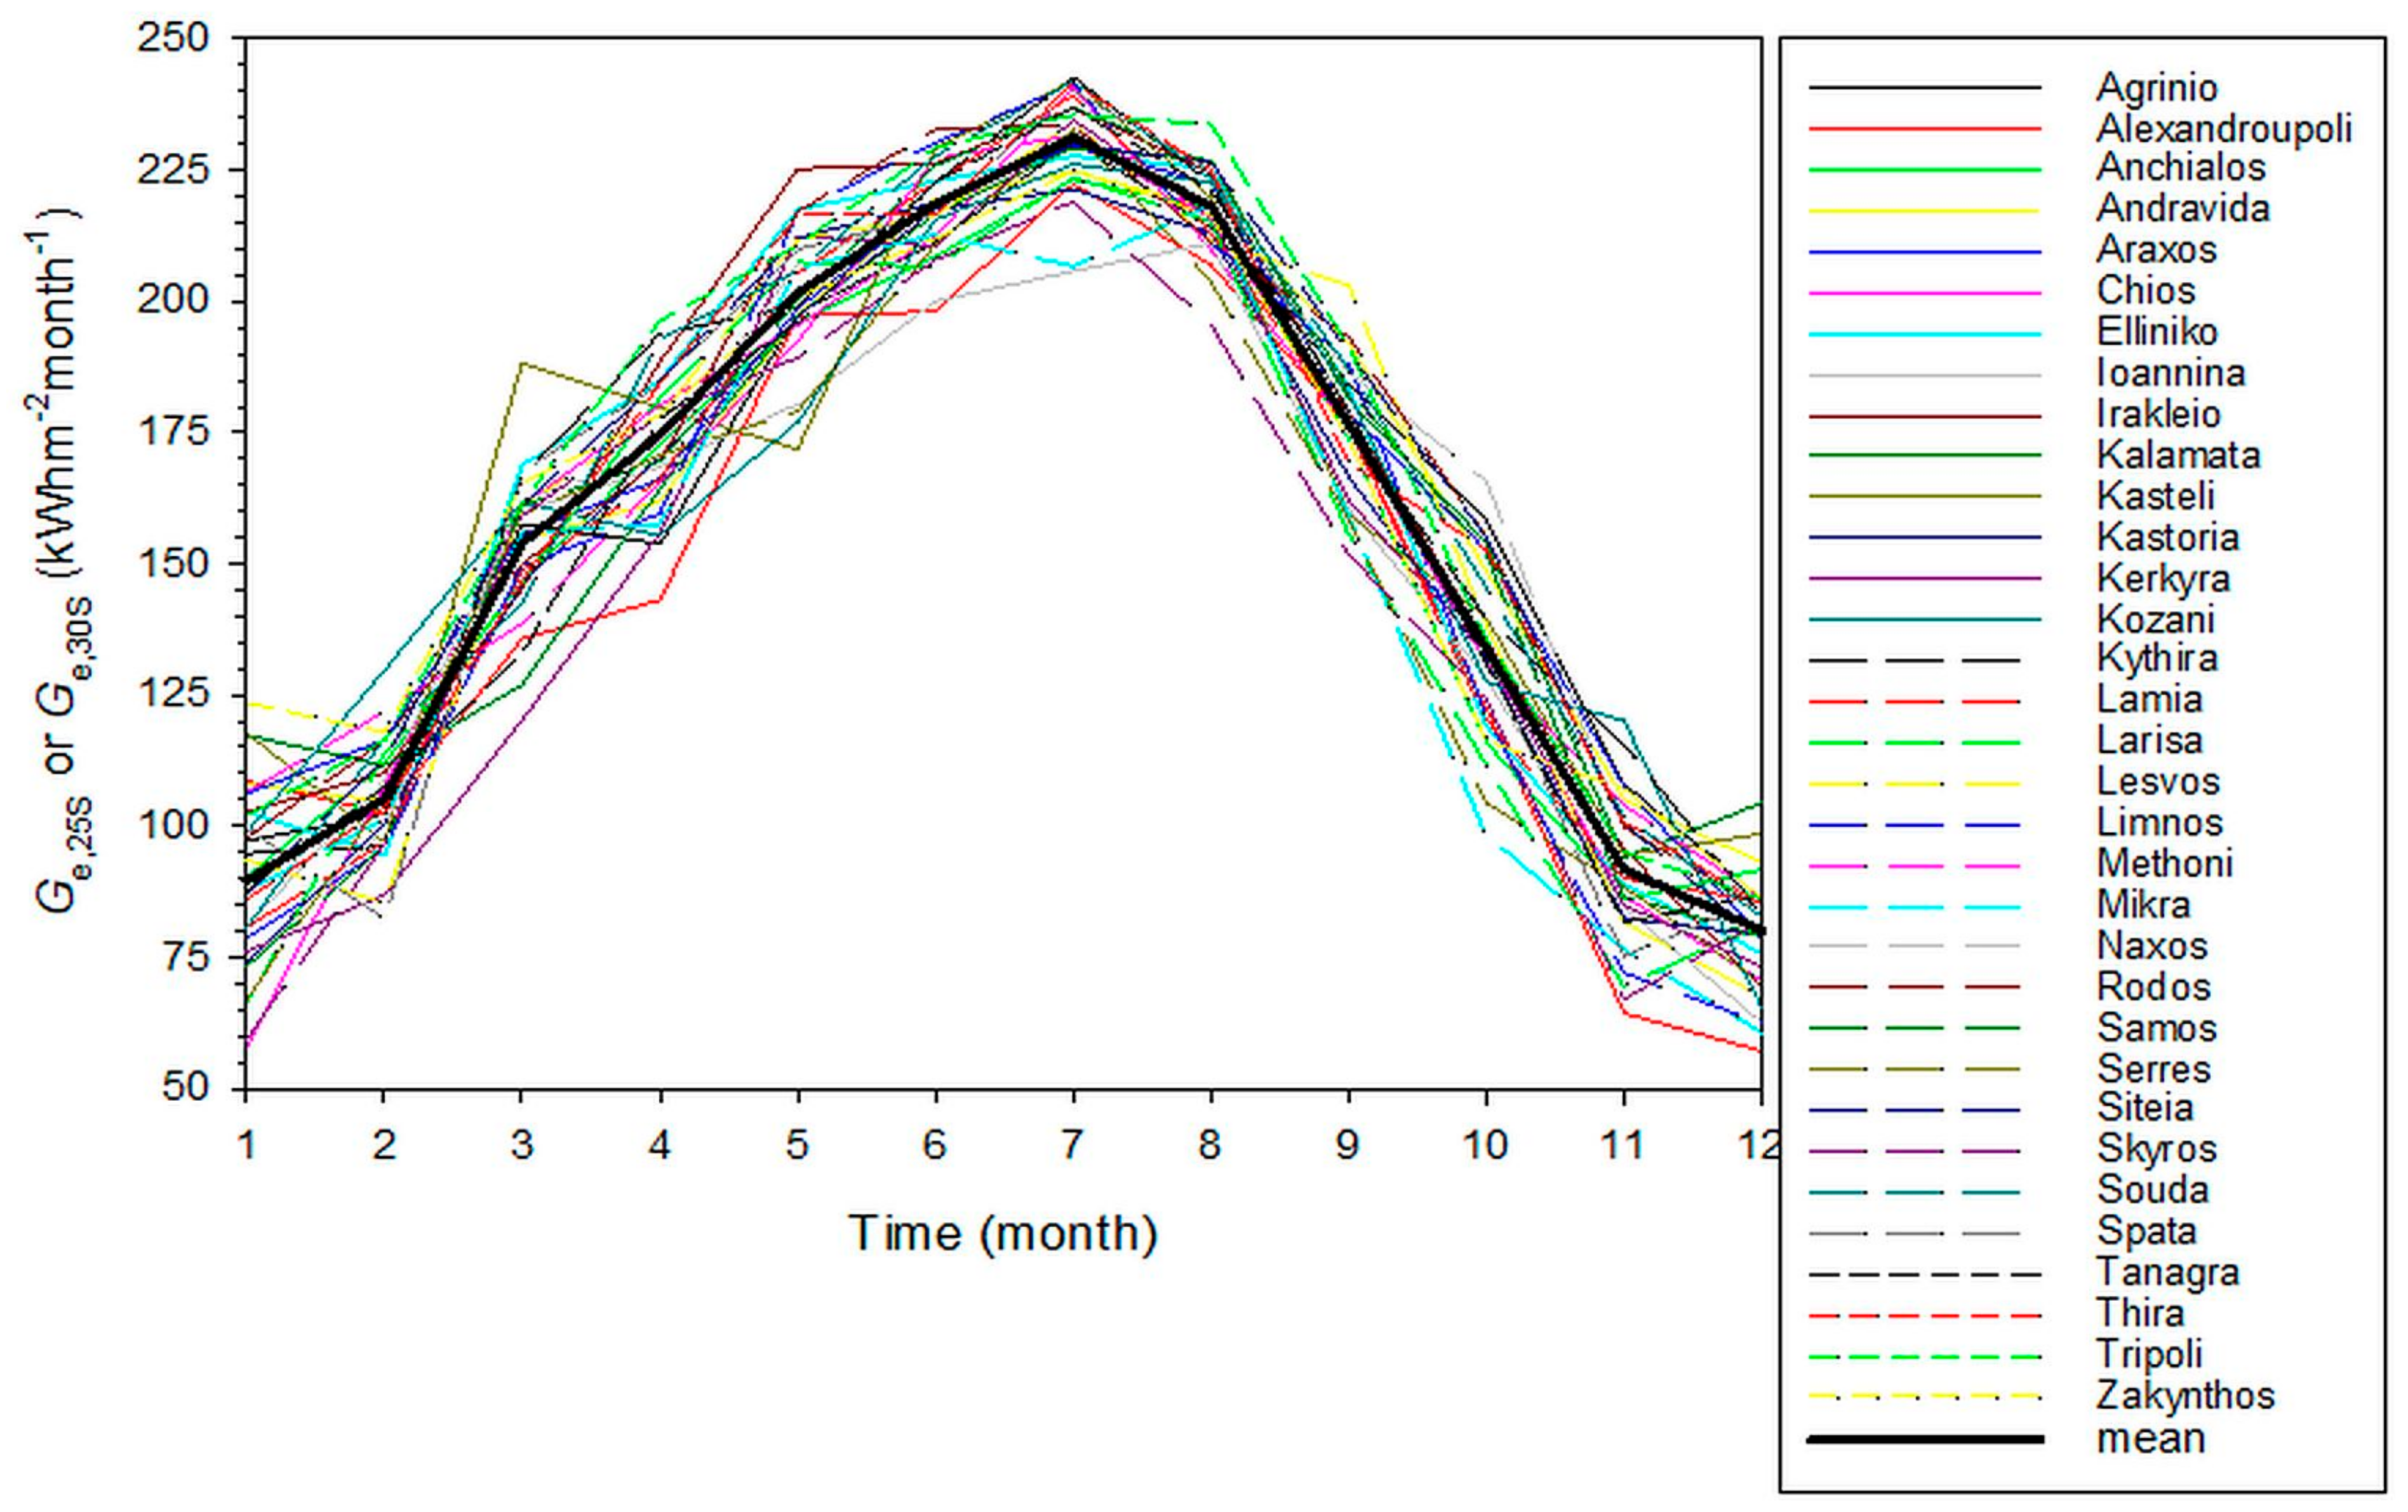
3.2. Intra-Annual Energy Yields

Section 3.1 demonstrated that the optimum tilt angle for the maximum annual solar energy received on an inclined plane in Greece is either 25° or 30° to the south. Apart from the annual energy yield, a solar energy investor is also concerned about the monthly solar energy availability at the site of interest. Therefore, the analysis in the present section is concentrated on the monthly energy received by flat planes with inclinations of 25° S or 30° S without discrimination. For this reason, Figure 6 has been prepared to show the intra-annual variation of the total energy yield from solar convertors inclined at 25° or 30° to the south at all 33 sites. It is seen that the variation was limited between a low of 50 kWhm−2·month−1 and a high of 250 kWhm−2·month−1. The graph is not intended to show the intra-annual variation of individual sites, but rather its variation as an ensemble.
To demonstrate the intra-annual variation of Ge,25S or Ge,30S in each specific PVctts zone, Figure 7 was produced. It shows the monthly solar energy sum averaged over all sites belonging to the same PVctts zone together with the ±1σ (standard deviation) from the mean (Figure 7a–d) and the monthly solar energy sum averaged over all sites (without discrimination of the PVctts zone) together with the ±1σ (standard deviation) from the mean (Figure 7e). The graphs also contain the best-fit curve to the monthly means together with their sixth-order polynomial equation and R2, which are repeated in Table 6 for clarity. It is interesting to observe that the best-fit curves vary between the ±1σ band and are accompanied by high R2 values, which are greater than 0.99. These equations are useful to solar engineers and solar entrepreneurs to estimate the expected energy received by inclined solar convertors inclined 25° S or 30° S per month in almost any location in Greece. These estimations provided high accuracy because of the high R2 values.
One might wonder why a tilt angle of φ° has not been shown to be optimal in the analysis. To clarify this question, Figure 8 presents the variation of the monthly mean Ge,25S–30S and Ge,φS sum values together with their difference ΔGe. This graph unambiguously confirms the main conclusion of the present work: the choice of the optimum tilt angles of 25° S or 30° S for the maximum solar energy availability on inclined solar convertors in Greece provided a higher yield than the believed yield at a tilt angle of β = φ°. Further proof of that are the insignificant monthly ΔGe values, which were negative for most of the year. The algebraic summation of all these differences gives the amount of ΔGe = −813.73 kWhm−2·year−1. This means that by using solar convertors in Greece with tilt angles of 25° S or 30° S, the annual mean solar energy gain is 813.73 kWhm−2·year−1, in respect to a tilt angle of φ°. This amount is almost half of the annual solar energy production at any of the 33 sites in Greece (compare the values in Figure 5). This further implies that the use of solar panels inclined at the above tilt angles to the south in Greece resulted in gaining solar energy of an extra half-year in a whole year, so it was as if the year consisted of 18 months. The above factors lead to the conclusion that the adoption of solar panels with a tilt angle equal to either 25° or 30° oriented to the south gives the best results in terms of received solar energy in Greece.

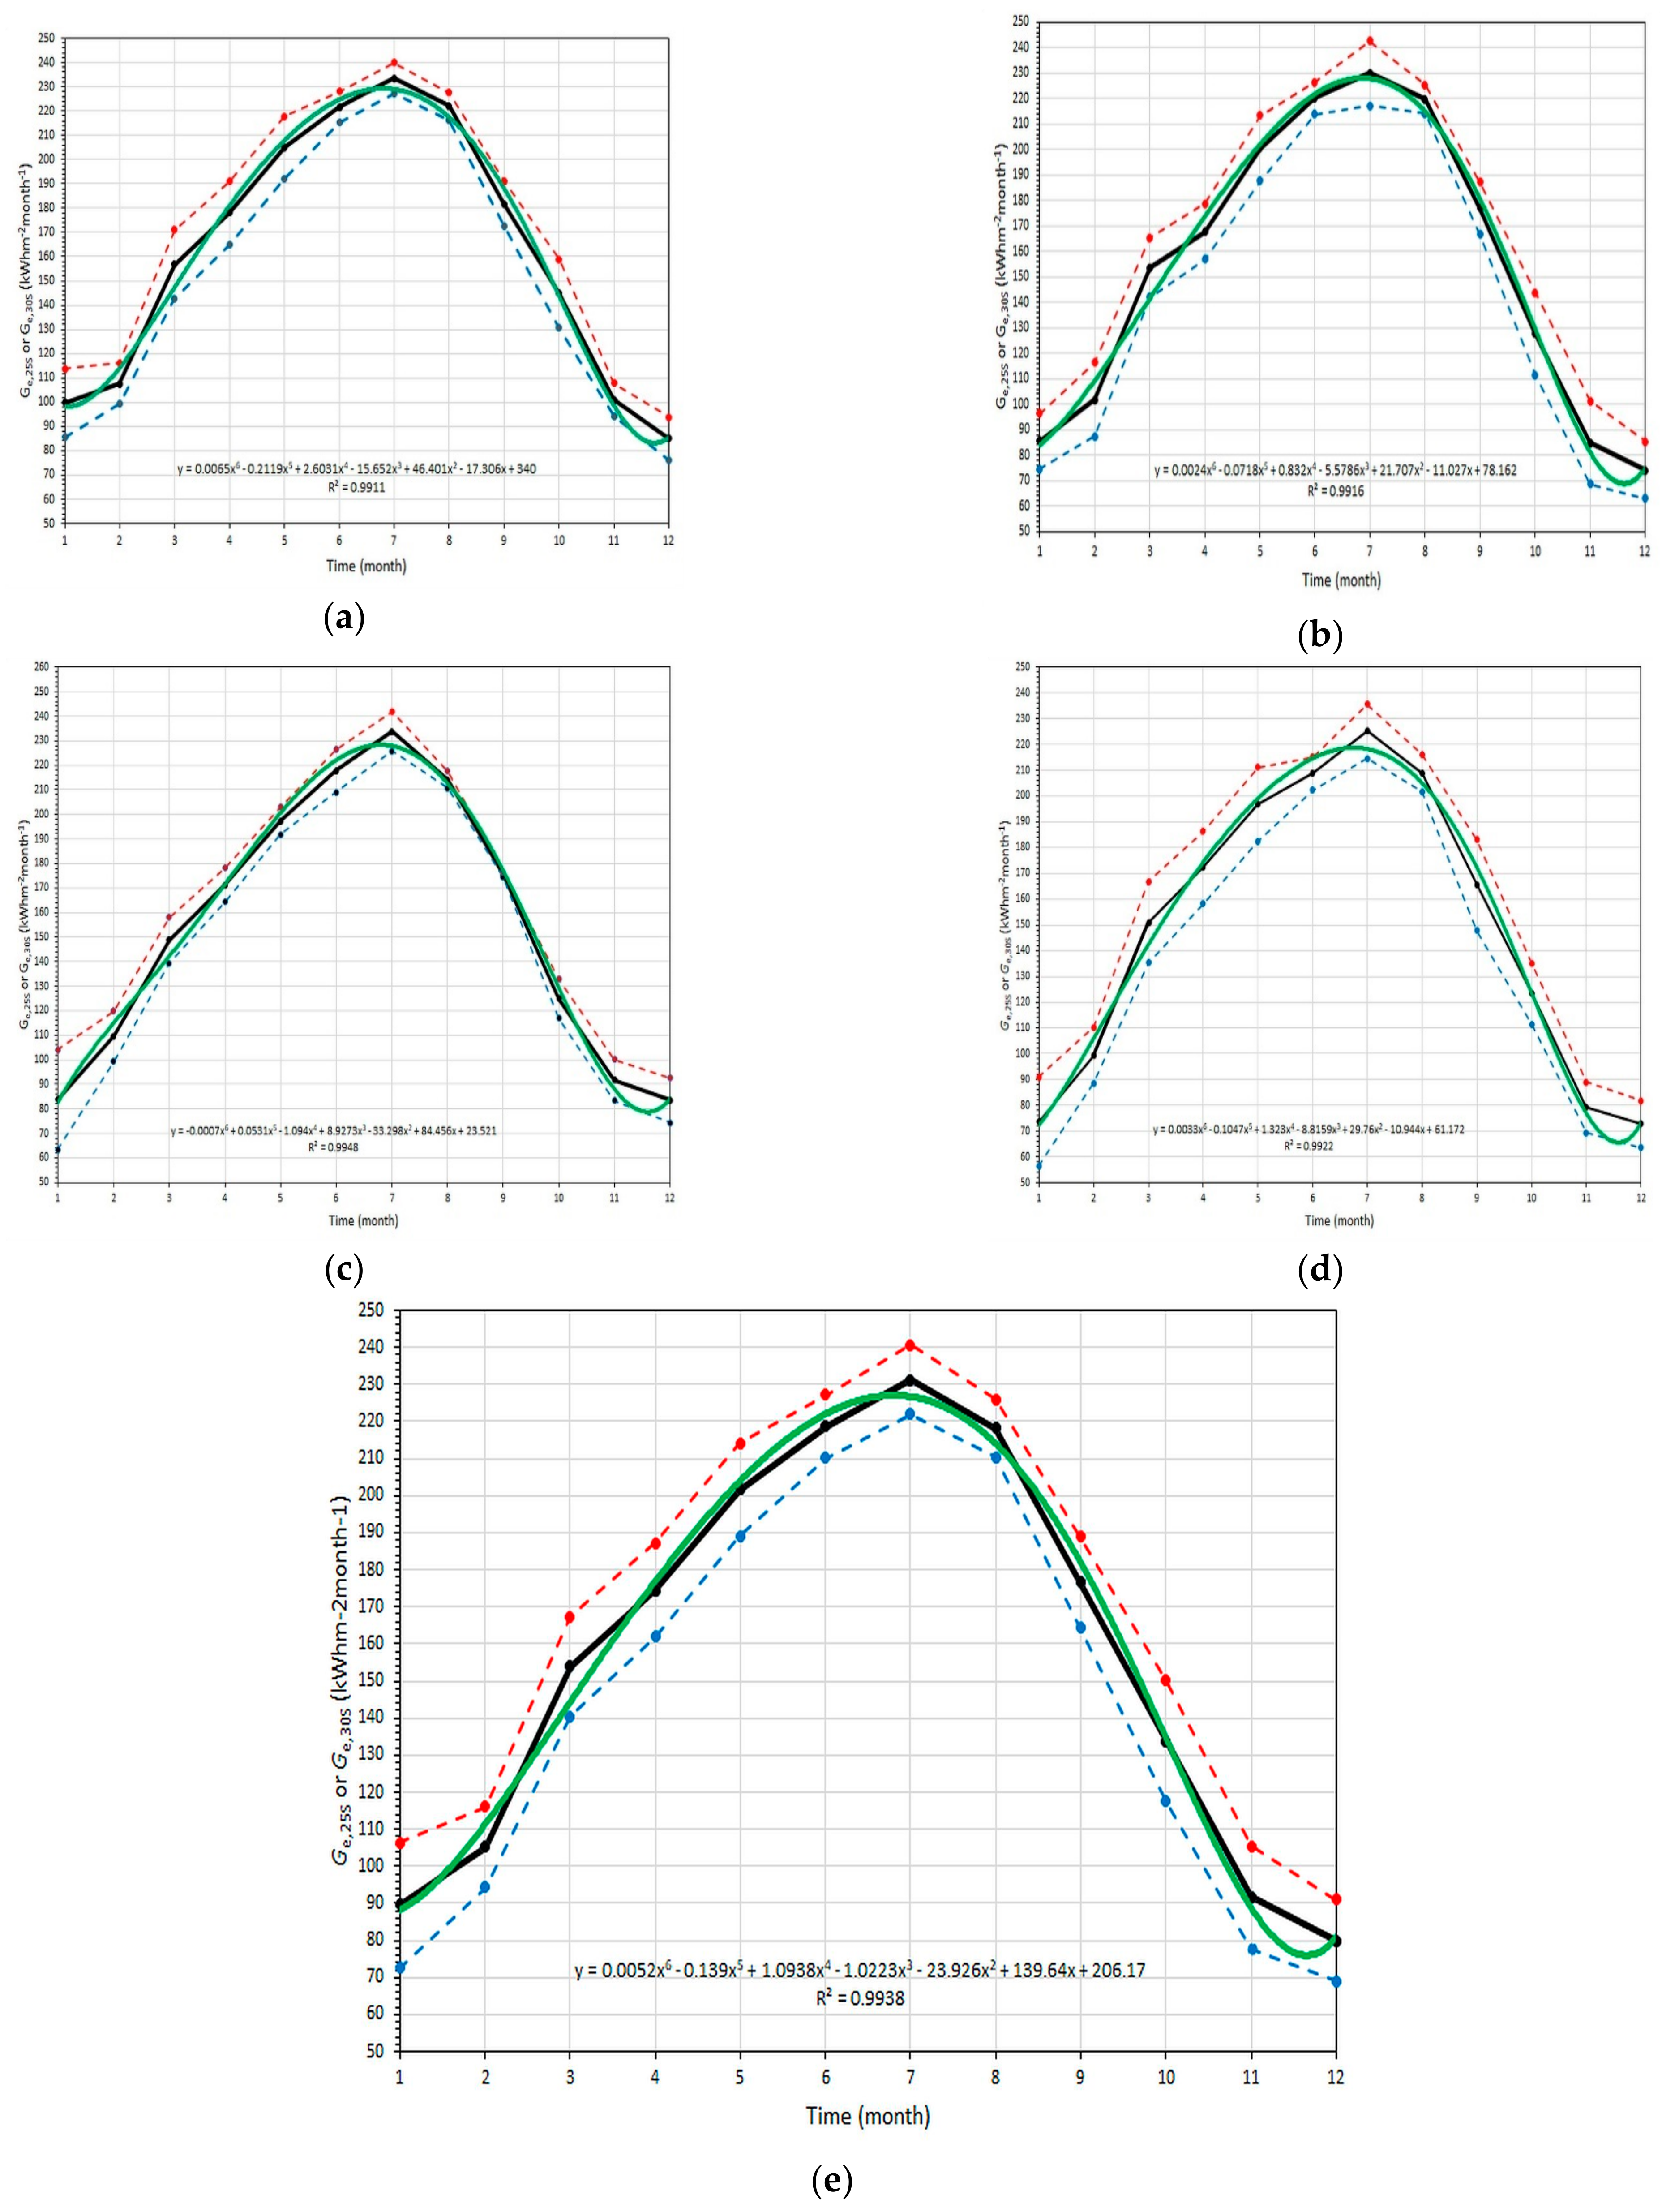
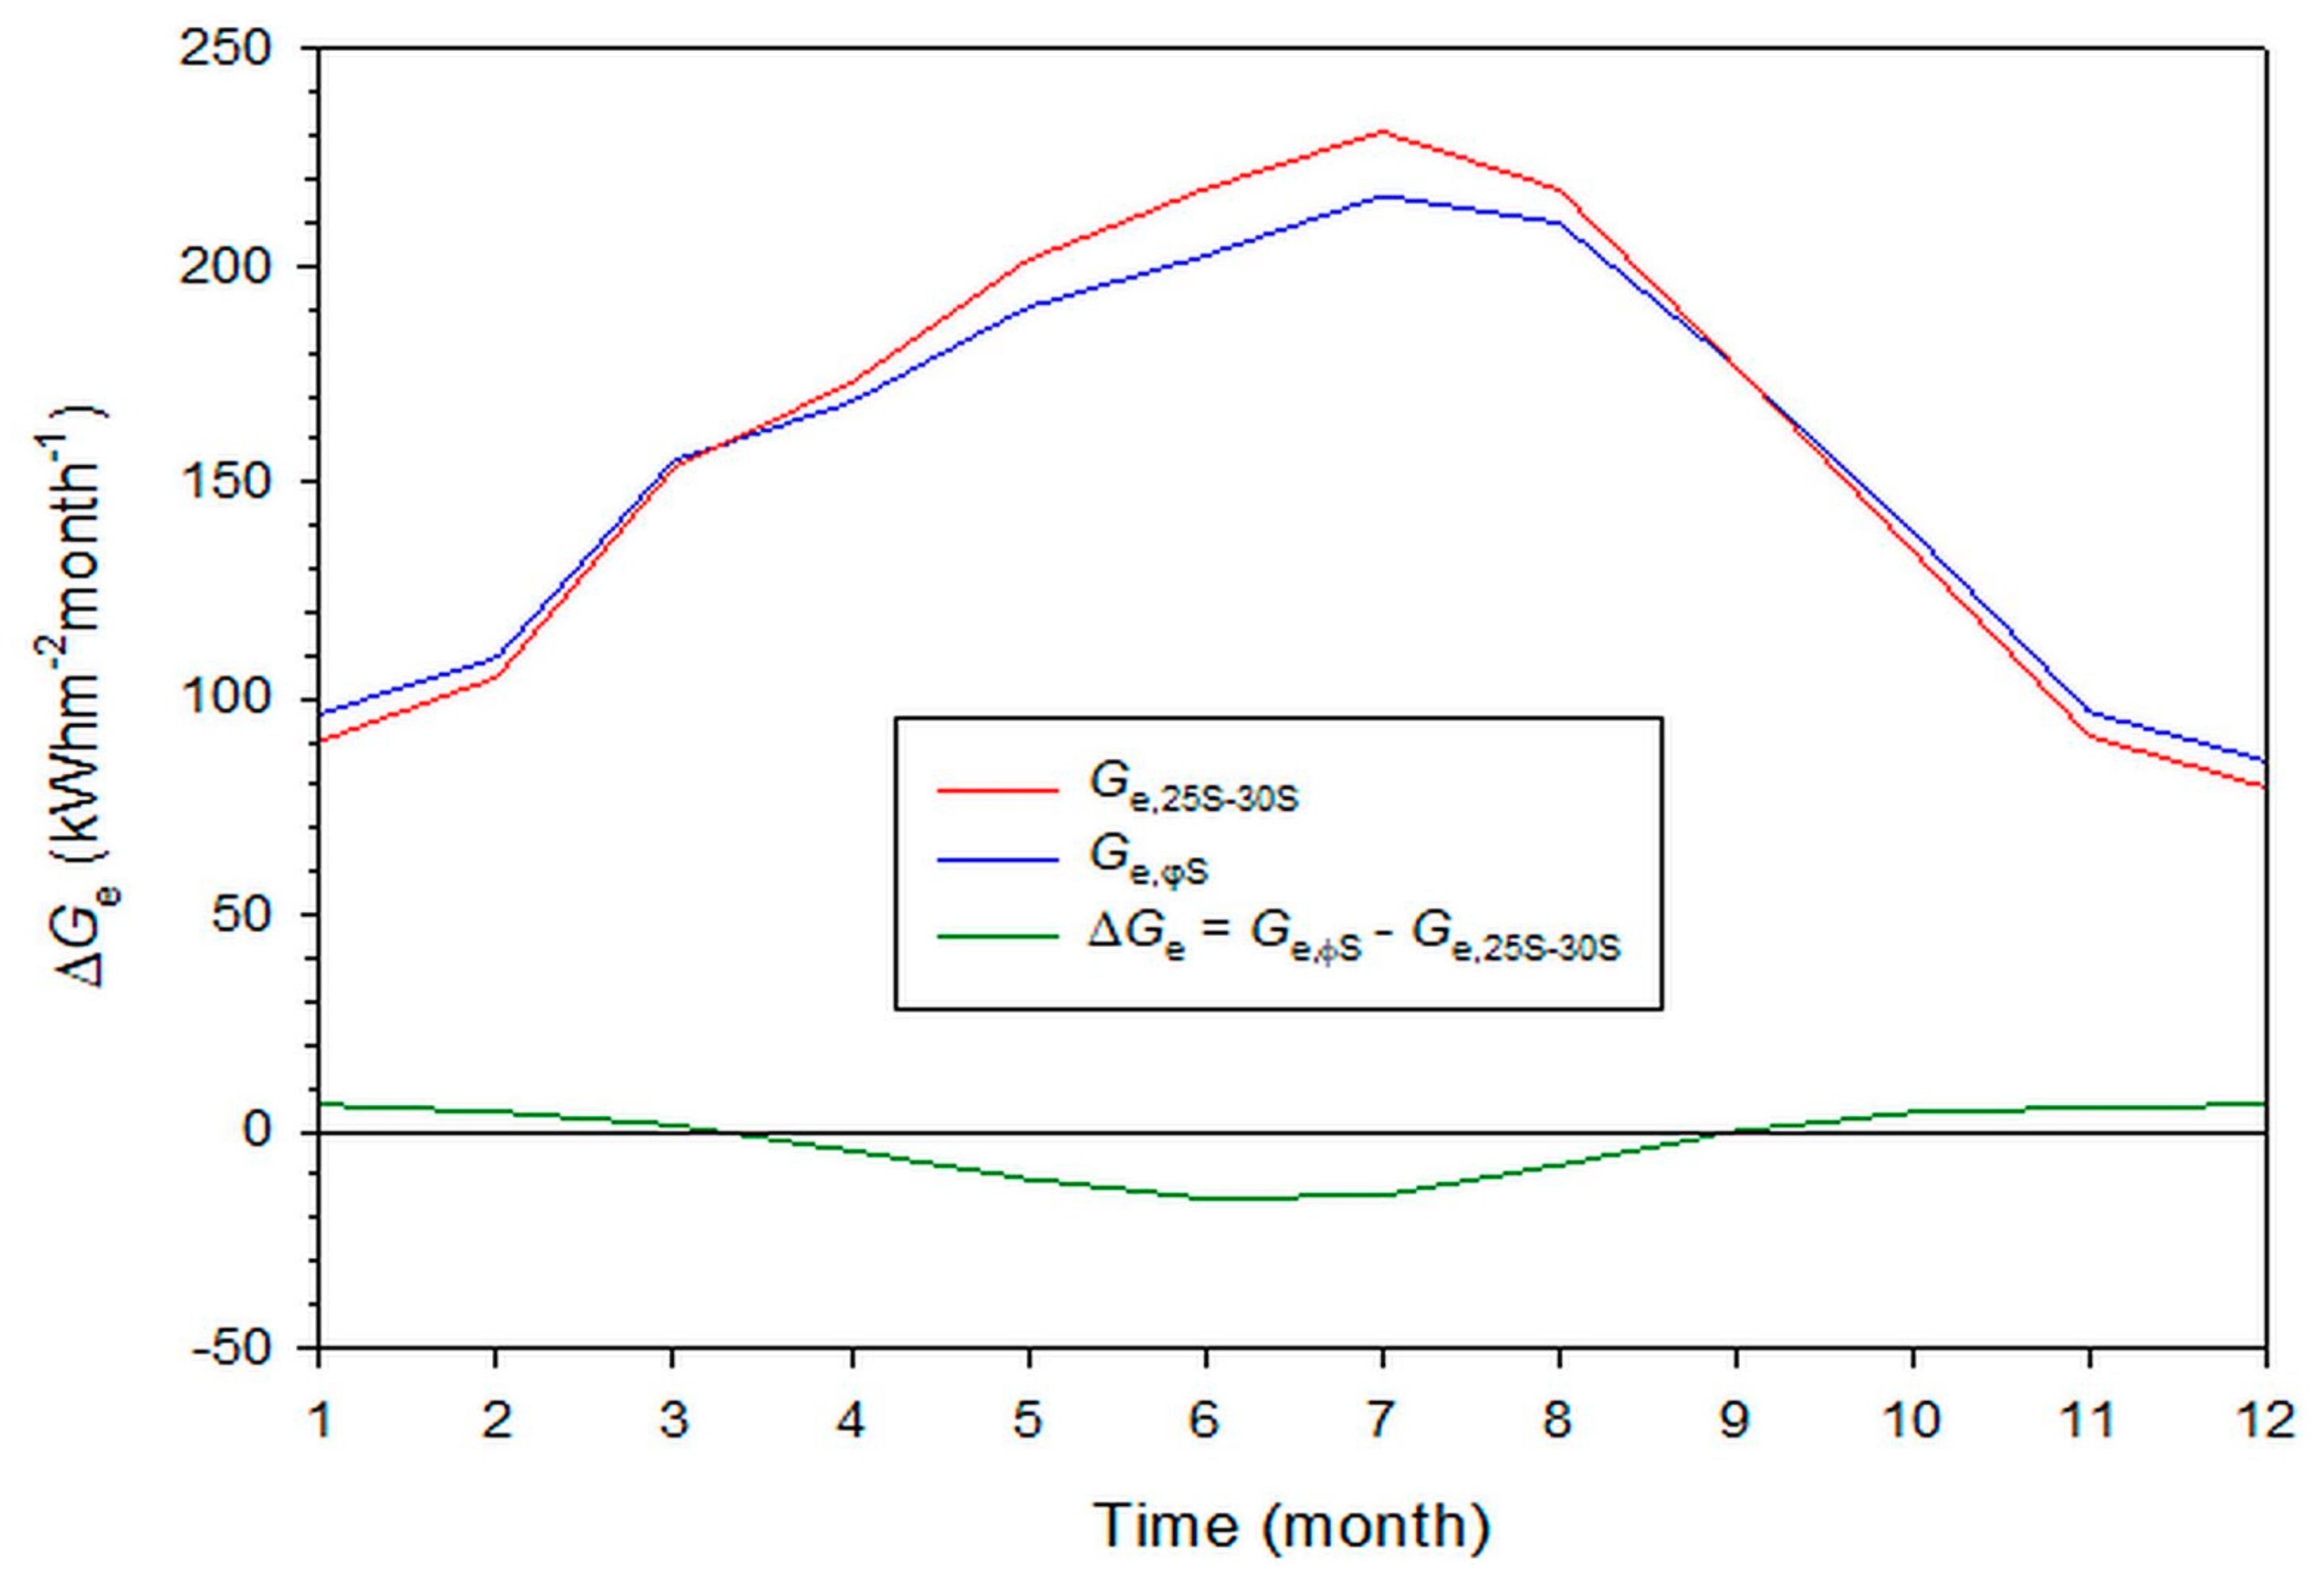
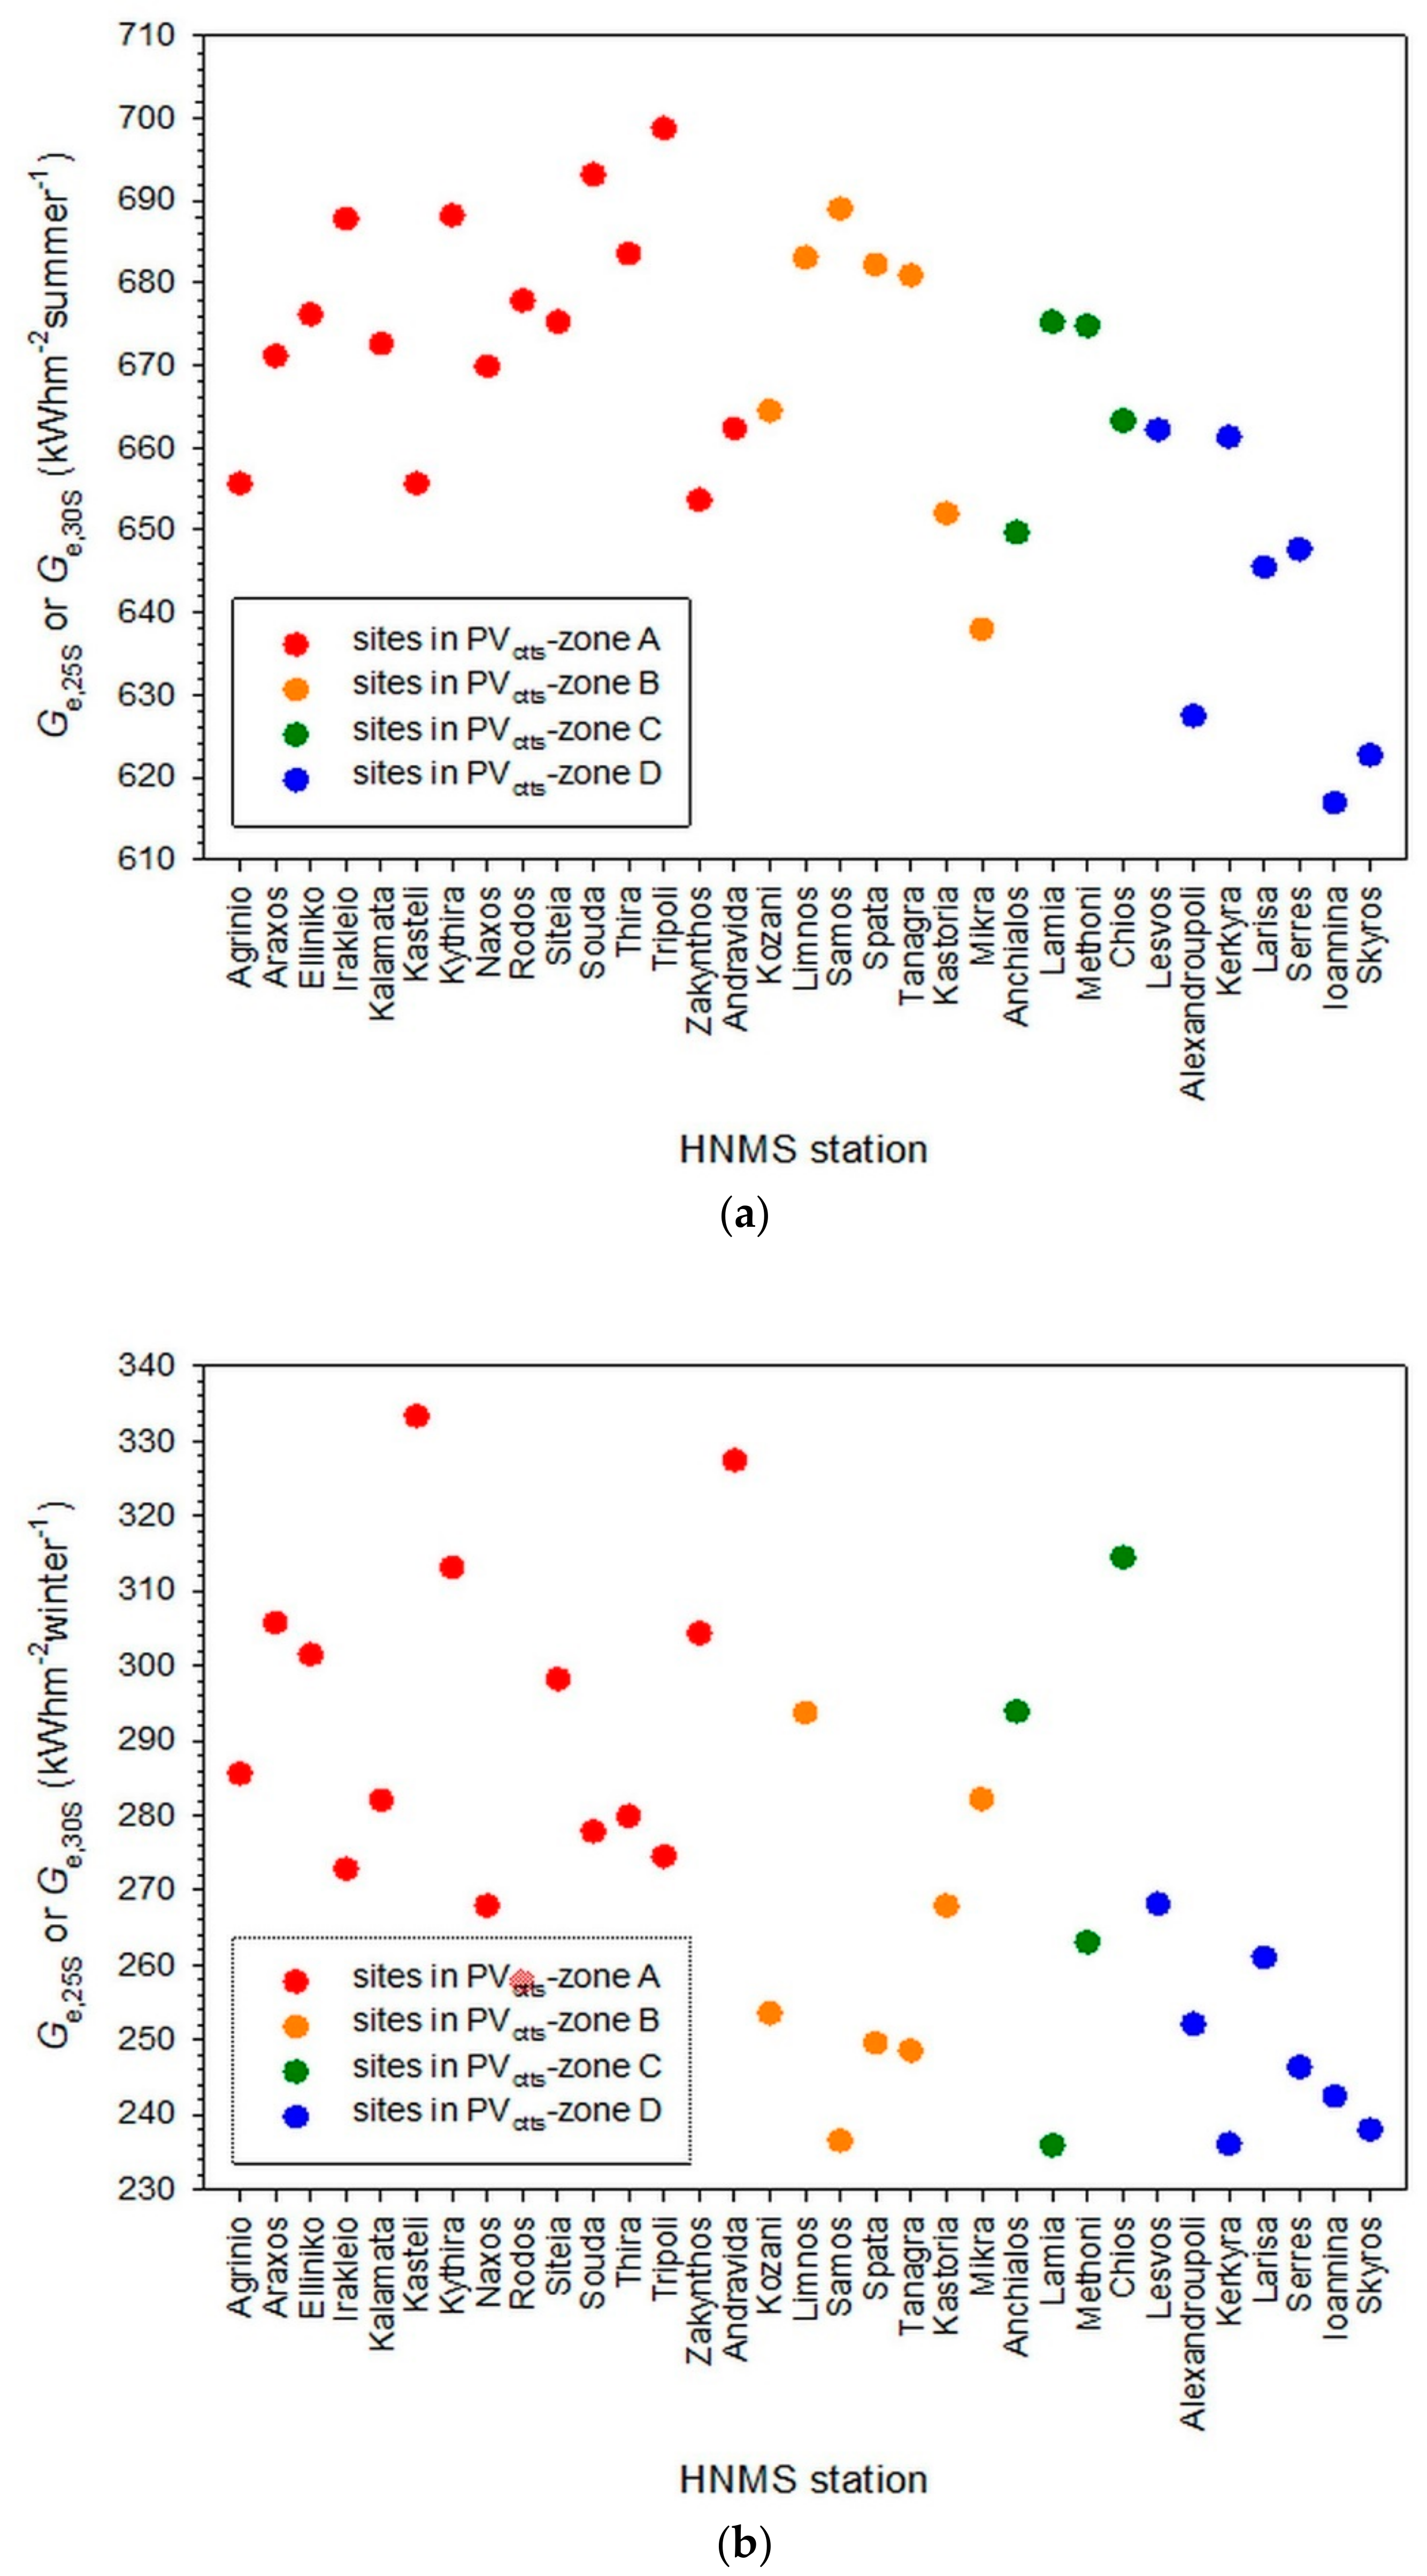
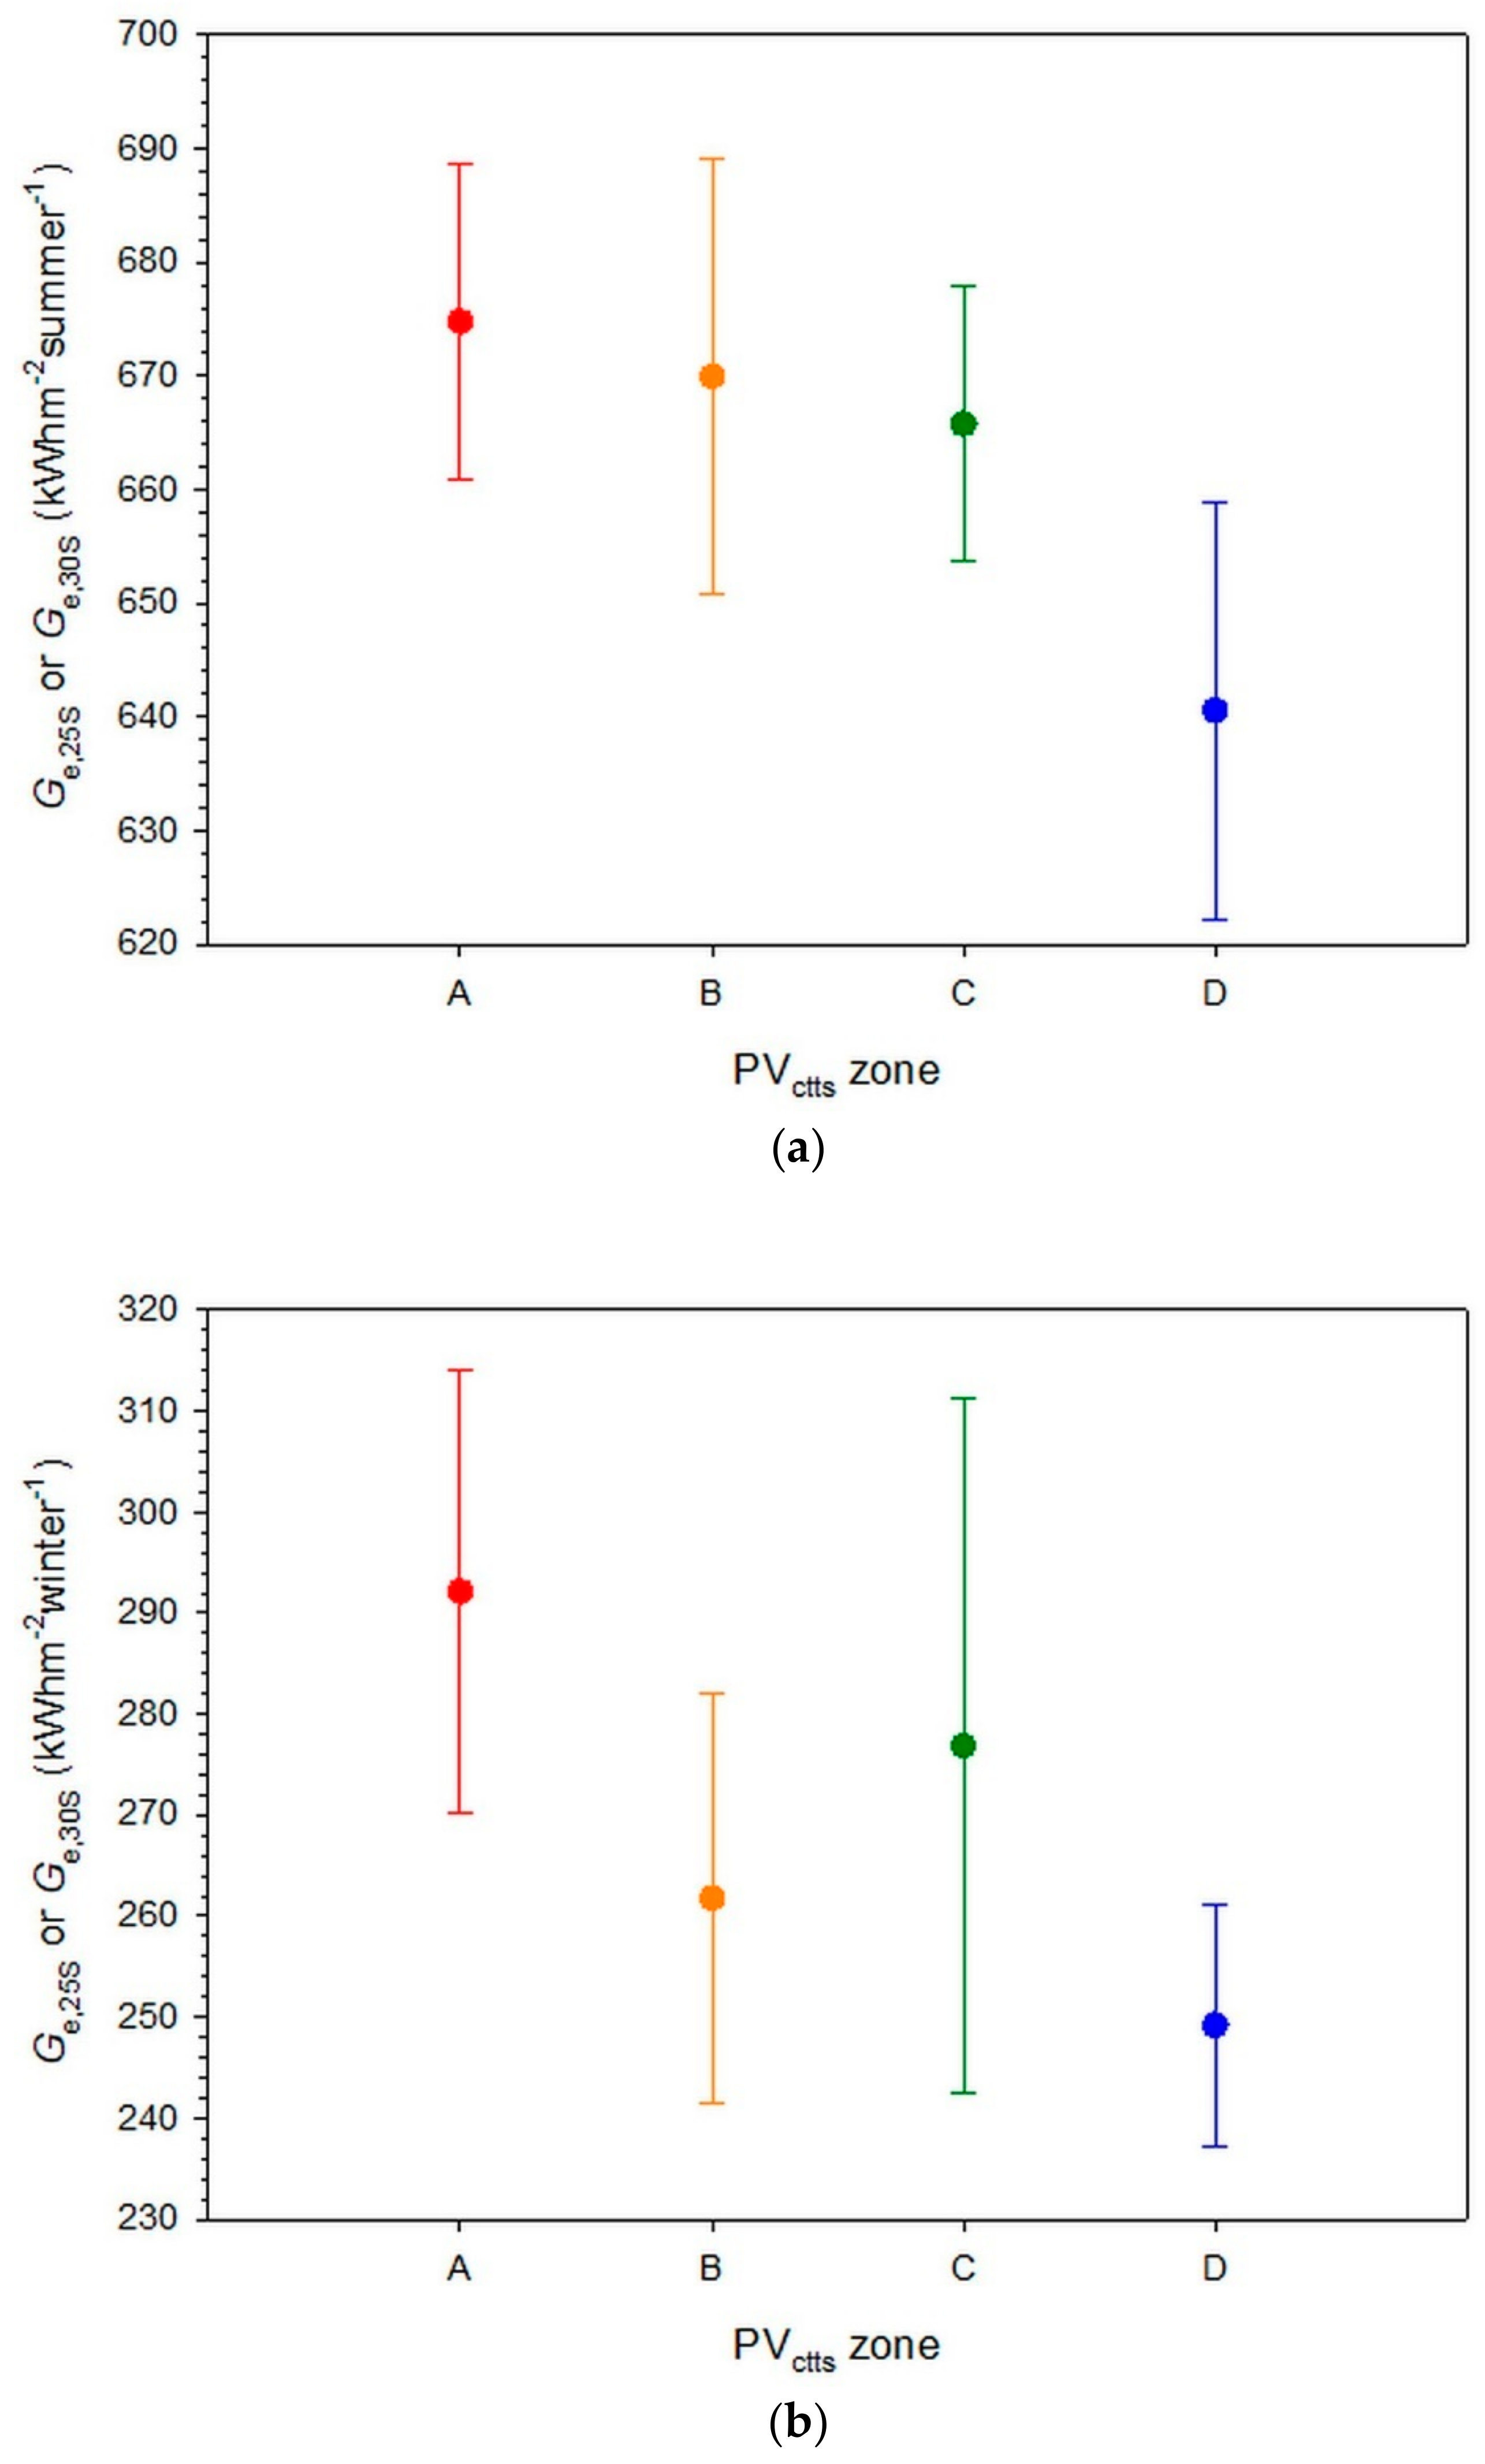
3.3. Seasonal Energy Yields

Investors in solar energy installations are mostly interested in knowing the minimum and maximum possible energy received by their energy systems. This is interpreted as the solar potential during the winter (December–January–February, hereafter DJF) and summer (June–July–August, hereafter JJA) months. Therefore, this section is devoted to analyzing the energy yields during these two seasons at all 33 locations in Greece. The analysis was concentrated on the energy received on a surface tilted to the south at the selected angles of 25° or 30°.
Figure 9a,b presents the total solar energy received on a flat solar convector inclined at 25° or 30° to the south under all-sky conditions during summer and winter, respectively. The energy values are the sums for each season (summer (JJA) and winter (DJF)) in every site. It is interesting to see that the dispersion of the seasonal energy sums among the 33 locations was great. Moreover, there were sites that belonged to a lower PVctts zone but showed solar availability corresponding to a higher PVctts zone. Nevertheless, in both cases, a decreasing trend was observed from PVctts zone A to PVctts zone D sites. Because of this great dispersion, no specific thresholds could be applied to the summer and winter seasons, as was done with the annual energy sums.
Figure 10a,b shows the seasonal sum values of Ge,25S or Ge,30S for every PVctts zone averaged over all sites that belonged to the same zone. It is easy to conclude that the hierarchy of higher to lower seasonal energy yields was fulfilled in the summer, but this was not the case in winter. Here, the energy totals in zones B and C were interchanged (i.e., the winter mean Ge value in zone C was higher than that in zone B). Besides this discrepancy, this winter abnormality between zones B and C seemed to not have an effect on the annual solar availability at the sites belonging to these two zones, as far as the decreasing trend from B to C is concerned. Additionally, the spring and autumn mean Ge values (not shown here) followed a decreasing trend from zone A to zone D.
Contrary to the above conclusions, Kaldellis and Zafirakis [42] showed that the optimum summer tilt angle of PV panels to the south is much lower than ours (i.e., 15° ± 2.5°). The discrepancy focused on the PV (hardware) efficiency considered by the authors, while the present study did not make such an assumption.

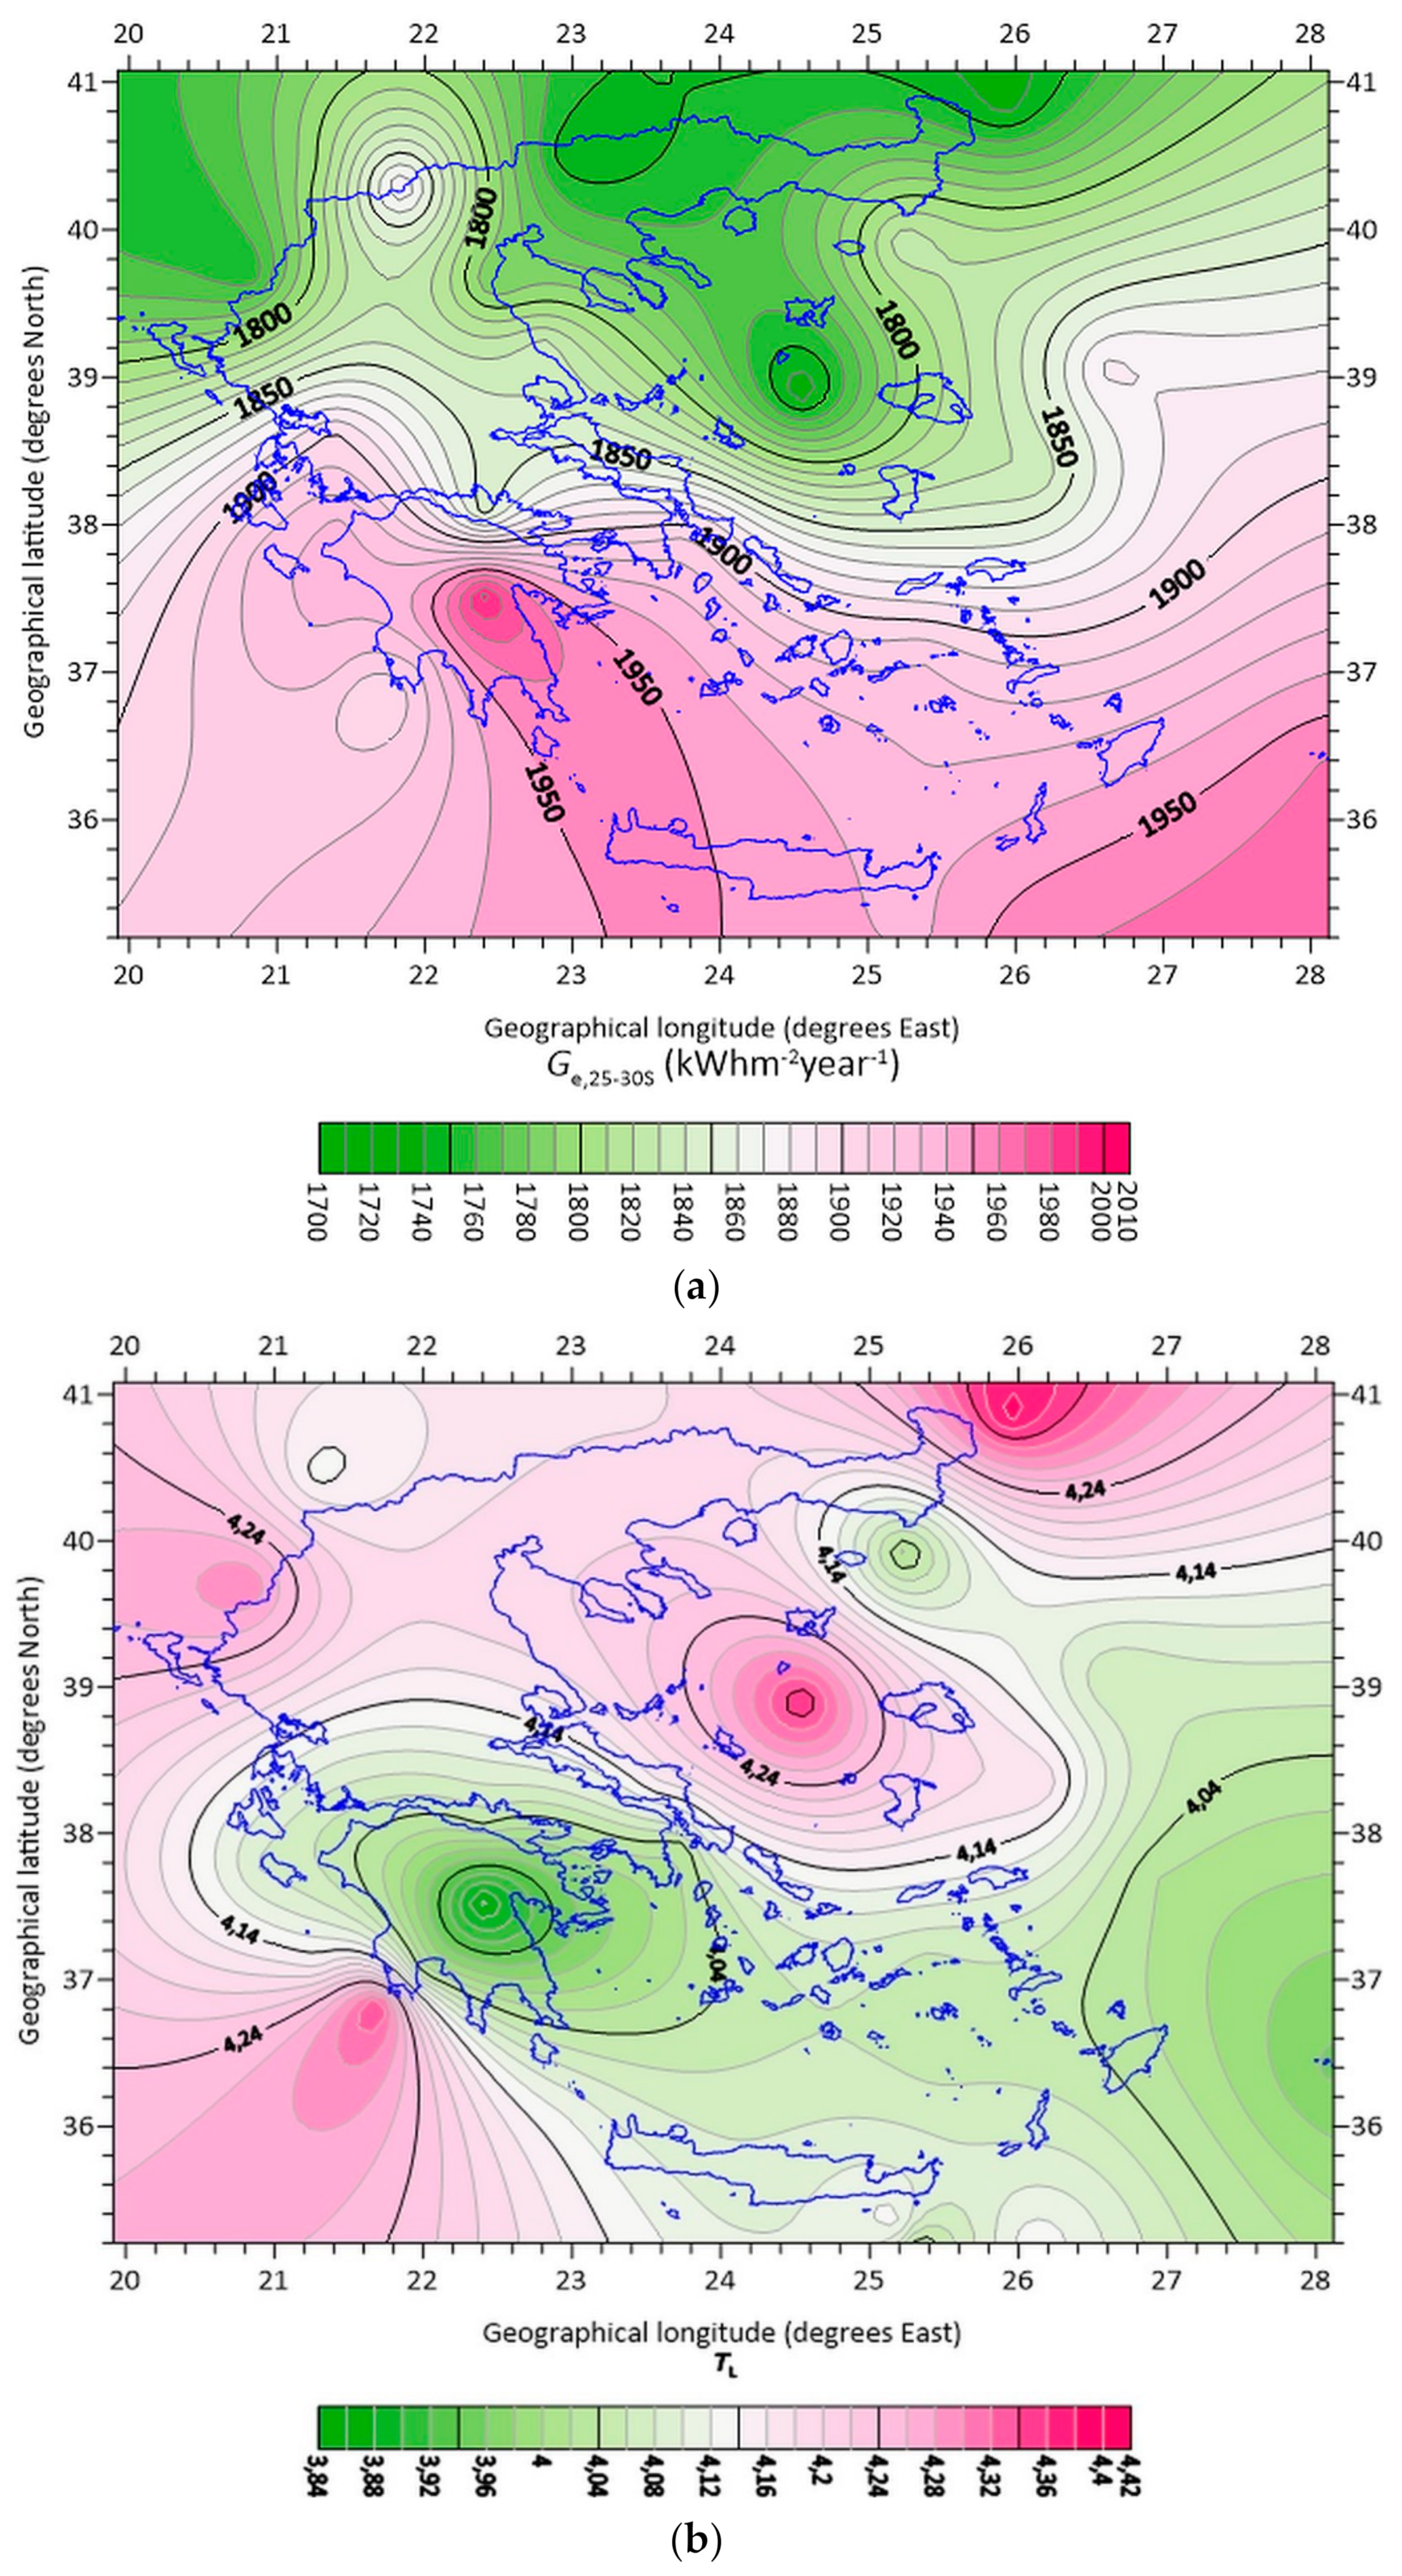
3.4. Maps of Annual Energy Yields

Figure 11a shows the spatial distribution of the annual mean Ge,25S-30S sums over Greece, while Figure 11b (adopted from Kambezidis and Psiloglou [66]) gives the distribution of the annual mean Linke turbidity factor TL over Greece. From both figures, it is interesting to observe that where the maximum Ge values occurred, the minimum TL values existed. This is obvious, since TL expresses the clarity of the atmosphere in terms of the aerosol loading in the atmosphere. From Figure 11a, the lines dividing the four PVctts zones can be identified (see the legend).

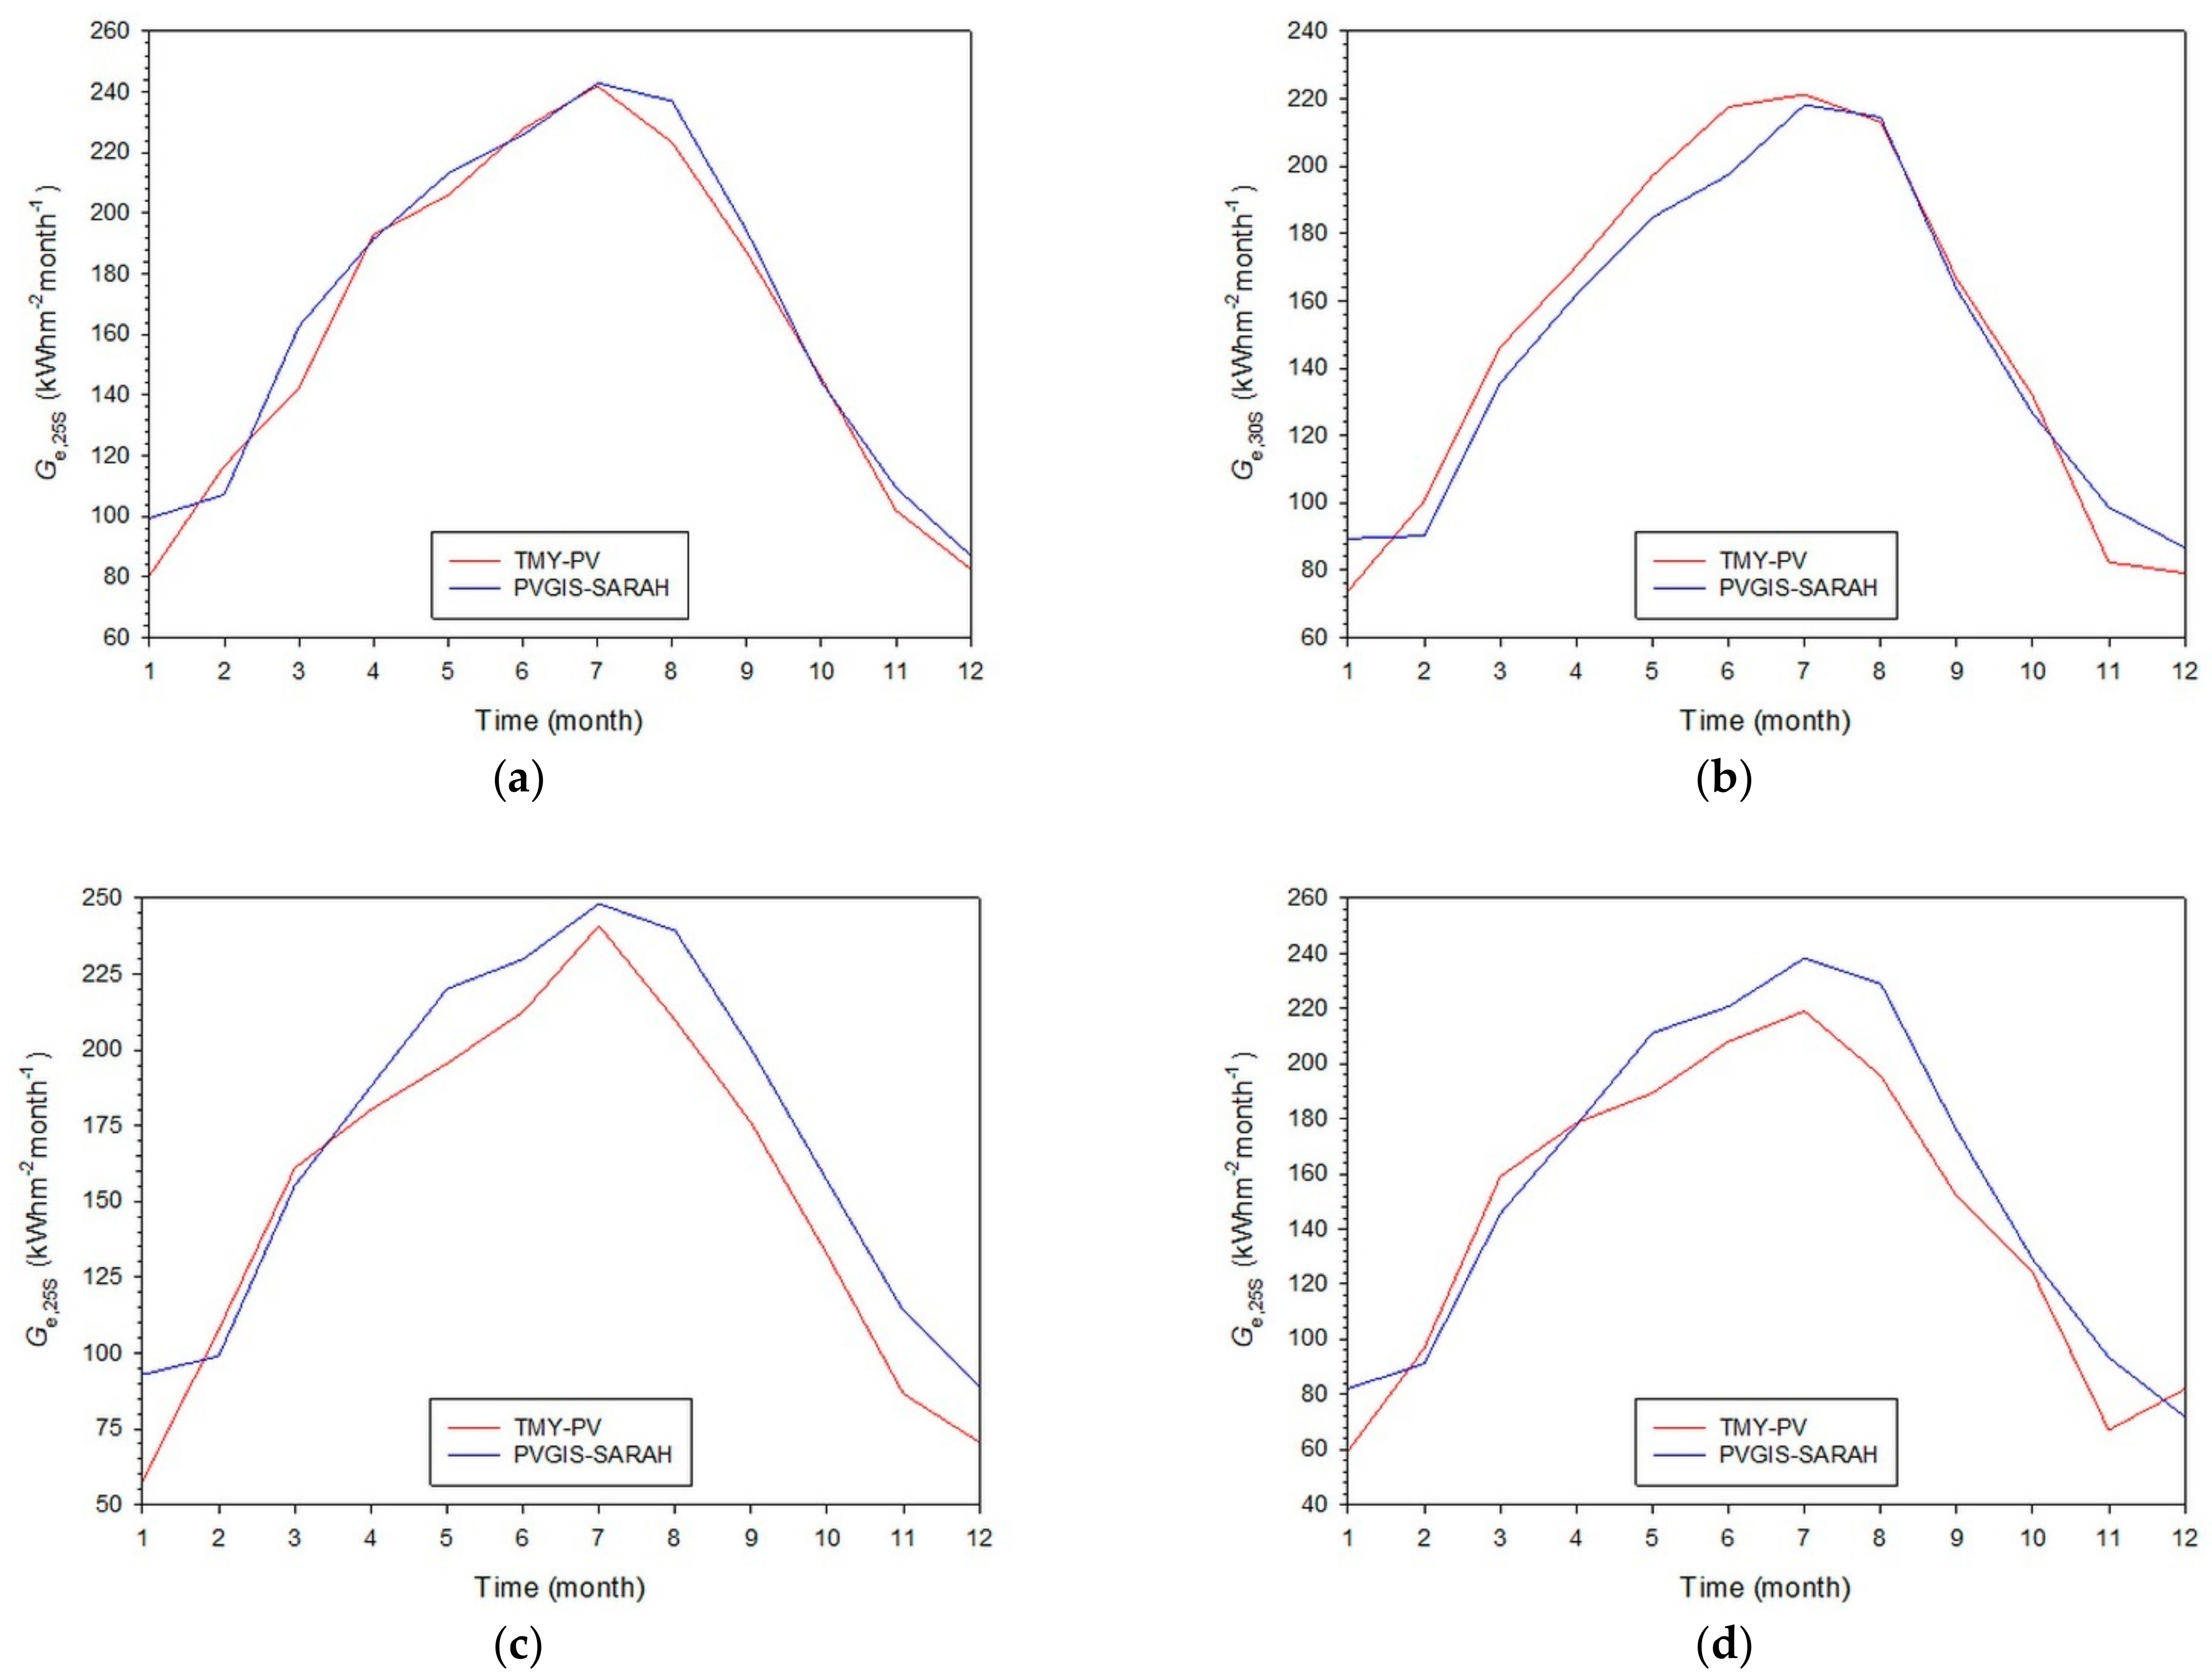
3.5. Comparison of Results with the PV-GIS Tool

Having concluded in the previous section that a constant inclination angle of either 25° S or 30° S for solar panels in Greece sufficed to obtain the maximum energy gain, a comparison was planned between the monthly Ge,25S or Ge,30S sums in the present study and those derived from the PV Geographical Information System (PV-GIS) tool [67] using the latest Surface Solar Radiation Data Set—Heliostat (SARAH) 2005–2016 database. The purpose of the comparison was to simply evaluate the solar energy derived in this study with some standard tool, such as the PV-GIS. For this reason, four stations were selected from Table 5 to represent each PVctts zone, namely Souda for PVctts zone A, Kozani for PVctts zone B, Chios for PVctts zone C, and Skyros for PVctts zone D. Figure 12 presents the above comparisons. In all cases, the PV-GIS–SARAH estimates were in excellent agreement with those from the TMY-PV-based ones of the present study, if one takes into account the different time periods used for the estimates (2005–2016 for the PV-GIS tool and 1985–2014 for the TMYs-PV). The excellent agreement in the comparisons was confirmed by their really high correlation coefficients (see the legend of Figure 12). Any slight difference between the two curves may have been due to the different time periods considered in each case (SARAH and TMY-PV), as well as the need for further development of the algorithms used for estimating the solar radiation from the satellites (SARAH database) [68].

4. Added Value of the Results

In trying to depict the results of this work in a practical manner for solar energy planners, investors, and engineers, two maps were prepared based on Figure 1. Figure 13 shows the distribution of the choice of the optimum tilt angles in Greece at either 25° S or 30° S. Two zones are apparent that divide the country in half: a northern part with β = 30° S and a southern one where β = 25° S. These zones have been drawn in an approximated way, as no intermediate stations among those selected existed in this study. Moreover, this division was in complete agreement with the solar potential map of Figure 11a, where higher insolation was found in the (south)eastern region of Greece, and a lower one was found in its northern part. Therefore, sites at lower latitudes would need south-facing solar convertors at lower tilt angles (i.e., 25°), and those at higher latitudes would require higher tilt angles (i.e., 30°).
Figure 14 gives the approximate distribution of the four PVctts zones across Greece. The approximation has the same meaning as that in the map of Figure 13.
A recent study by Crook et al. [69] showed that the PV solar power output would increase in the time period of 2010–2080 by a few percent in Europe and about 3% for Greece due to the impact of climate change. This means that the PV0 and PVctts thresholds of Table 4 will change in the future, and the new thresholds are shown in Table 7.
Finally, an extra algorithm was developed in the frame of the present work. The algorithm calculated the maximum annual solar energy received at the 33 sites in Greece. The algorithm varied both the tilt angle (β) and the azimuth angle (ψ’) of the inclined surface in the ranges of 0–90° and 130–230° in steps of 1°, respectively. Table 8 shows the maximum energy received for an optimal (ψ’, β) pair. These results only have theoretical value because, in practice, they would impose an extra cost to the solar flat-plate convertor installers in Greece. It is interesting to observe that (1) all surface azimuths were oriented almost toward due south (180°), (2) the optimum angle of inclination was within the 25–30° range, and (3) the site of Kozani showed a quite different (ψ’, β) pair than that of the other 32 locations.

5. Conclusions

The present study investigated the solar potential all over Greece through the incidence angles on flat-plate solar panels with south-facing tilt angles in the range of 5–60° in steps of 5° (φ° included) in order to find the optimal tilt for the maximum solar energy in a year under all-sky conditions. The solar availability on a horizontal plane was also included, because this parameter was one of the four criteria for defining the TOTEE zones in Greece for energy purposes in buildings. The analysis showed that the 33 Greek sites adopted in this study did not all belong to the declared TOTEE zones, but most of them had to move to another zone. Therefore, four new zones were formed and were adopted for the solar energy Ge received on a horizontal plane during a year, those being the PV0 zones (PV0 zone A: Ge > 1775 kWhm−2·year−1; PV0 zone B: 1700 kWhm−2·year−1 < Ge ≤ 1775 kWhm−2·year−1; PV0 zone C: 1625 kWhm−2·year−1 < Ge ≤ 1700 kWhm−2·year−1; PV0 zone D: Ge ≤ 1625 kWhm−2·year−1). Apart from this finding, a second innovation of the present work was the use of data in a TMY instead of data in a long period of time.
The annual solar energy sum for each site on inclined surfaces in the range 5–60° S was estimated, and four new energy zones were determined, namely the PVctts zones (PVctts zone A: Ge > 1900 kWhm−2·year−1; PVctts zone B: 1850 kWhm−2·year−1 < Ge ≤ 1900 kWhm−2·year−1; PVctts zone C: 1800 kWhm−2·year−1 < Ge ≤ 1850 kWhm−2·year−1; PVctts zone D: Ge ≤ 1800 kWhm−2·year−1). The analysis showed that the optimum tilt angles for all sites in Greece, in terms of the maximum solar energy received on flat solar convertors oriented to the south, were either 25° or 30°, depending on the site. These two inclinations were, therefore, adopted throughout all analyses. This is an extremely useful conclusion for the solar industry in Greece, as it gives a standard inclination for the metallic frames that support the solar panels and, thus, it reduces the cost of the supports. Moreover, the definition of four new (PVctts) energy zones was done to provide the solar industry, solar system investors, and solar engineers in Greece with a standardization tool, as far as the classification of various regions of the country in terms of the expected solar potential on surfaces inclined to the south is concerned (see Figure 13 and Figure 14).
The intra-annual variation of the solar energy sums averaged over the locations belonging to the same PVctts zone, as well as to all PVctts zones together, for inclinations of 25° S or 30° S were estimated. The plots included the best-fit curves to the annual mean ones and provided equations that estimated the solar energy potential per PVctts zone (and all PVctts zones) with great accuracy (R2 > 0.99). These expressions are very useful tools to architects, civil engineers, solar energy engineers, and solar energy system investors for assessing the solar energy availability at a place in Greece. For sites not included in this study, these equations may serve as a guiding tool for guessing the approximate energy. Nevertheless, this guess may be confirmed by the map in Figure 11a and Figure 13. Another important finding of this study was the confirmation of the perception that the optimum tilt angle in Greece was not φ° S, but 25° S or 30° S instead. Figure 8 provided this sound proof.
It is very interesting to know the extreme values of the energy received on a tilted plane. These two extremes occur in the winter (minimum) and summer (maximum) months because of the corresponding intensities of the solar radiation. Considering these two seasons, the seasonal Ge,25S or Ge,30S sum values were estimated for all stations. Similar graphs were provided for the seasonal Ge,25S or Ge,30S sum values averaged over each PVctts zone. From those graphs, a discrepancy between the winter values in the PVctts zones B and C was seen, in the sense that the solar energy in the latter zone was greater than that in the former. On the contrary, the summer Ge averaged sums in all four zones followed an expected decreasing trend from PVctts zone A to PVctts zone D. Nevertheless, this discrepancy had no effect on the annual energy yield.
A comparison between the TMY-PV-derived Ge curves with those using the PV-GIS tool with the SARAH 2005–2016 solar radiation database for the 33 locations showed a remarkable coincidence, one which was demonstrated at four selected sites. An observed overestimation in the annual solar energy yield at two sites might have been due to the different data periods used in both methods and the algorithm utilized for converting the satellite signals into solar radiation values [68]. Improvement of the algorithm is, therefore, considered necessary.
The main conclusion of the analysis in this study is that a solar flat-plate convertor receives its maximum energy all year in Greece with a tilt of 25° S or 30° S. As Greece covers latitudes between ≈35.2° N and ≈41.0° N, the optimum tilt angles, according to [43], lie in the range [≈45.8° S, ≈53.3° S], which is different from our result of 25–30° S. On the contrary, Koronakis [47] estimated the optimum tilt angles for Athens at 25° S in the case of flat-plate panels all year round, a finding that quite agrees with ours. The work by [48] for Athens found that a tilt angle equal to the site’s φ collected the maximum energy all year round. This conclusion is very similar to ours, if the tilt of φ° is included in the 25–30° S range. The work by [49] for 35 sites in the Mediterranean region found optimum tilt angles with southern orientations for Irakleio, Athens, and Mikra of 35.1°, 36.8°, and 38.7°, respectively, values which differ from those in the present study. Jacobson and Jadhav [50] estimated the optimum tilt angle for solar applications in Athens to be 29°, quite close to our 30°. In addition, Raptis et al. [52] found an optimum tilt angle of 30° S in Athens, which quite agrees with our results.

Author Contributions

Conceptualization, methodology, data collection, data analysis, and writing original draft manuscript, H.D.K.; methodology, mathematical formulation, FORTRAN code development for the calculation of solar radiation on inclined surfaces, review and editing of manuscript, B.E.P. Both authors have read and agreed to the published version of the manuscript.

Funding

This research was implemented in the frame of the KRIPIS-THESPIA-II project under the grant MIS 5002517, funded by the General Secretariat of Research and Technology in Greece.

Acknowledgments

The authors are thankful to HNMS for the disposition of the meteorological data from 33 stations of the network with the purpose of building the typical meteorological years.

Conflicts of Interest

The authors declare no conflict of interest.

References

  1. Hafez, A.Z.; Soliman, A.; El-Metwally, K.A.; Ismail, I.M. Tilt and azimuth angles in solar energy applications—A review. Renew. Sustain. Energy Rev. 2017, 77, 147–168. [Google Scholar] [CrossRef]
  2. Kambezidis, H.D. Annual and seasonal trends of solar radiation in Athens, Greece. J. Solar Energy Res. Updates 2018, 5, 14–24. [Google Scholar] [CrossRef]
  3. Kambezidis, H.D. The solar radiation climate of Athens: Variations and tendencies in the period 1992–2017, the brightening era. Sol. Energy 2018, 173, 328–347. [Google Scholar] [CrossRef]
  4. Kambezidis, H.D. The solar resource. In Comprehensive Renewable Energy; Sayigh, A., Ed.; Elsevier: Amsterdam, The Netherlands, 2012; pp. 27–83. ISBN 978-0-08087-872-0. [Google Scholar]
  5. Willmott, C.J. On the climatic optimization of the tilt and azimuth of flat-plate solar collectors. Sol. Energy 1982, 28, 205–216. [Google Scholar] [CrossRef]
  6. Rowlands, I.H.; Kemery, B.P.; Beausoleil-Morrison, I. Optimal solar-PV tilt angle and azimuth: An Ontario (Canada) case-study. Energy Policy 2011, 39, 1397–1409. [Google Scholar] [CrossRef]
  7. Daut, I.; Irwanto, M.; Irwan, Y.M.; Gomesh, N.; Ahmad, N.S. Clear sky global solar irradiance on tilt angles of photovoltaic module in Perlis, Northern Malaysia. In Proceedings of the International Conference on Electrical, Control and Computer Engineering (INECCE), Pahang, Malaysia, 21–22 June 2011; pp. 445–450. [Google Scholar] [CrossRef]
  8. Khatib, T.; Mohamed, A.; Sopian, K. On the monthly optimum tilt angle of solar panel for five sites in Malaysia. In Proceedings of the IEEE International Power Eng. and Optimization Conference (PEDCO), Melaka, Malaysia, 6–7 June 2012; pp. 7–10. [Google Scholar] [CrossRef]
  9. Elhab, B.R.; Sopian, K.; Mat, S.; Lim, C.; Sulaiman, M.Y.; Ruslan, M.H.; Saadatian, O. Optimizing tilt angles and orientations of solar panels for Kuala Lumpur, Malaysia. Sci. Res. Essays 2012, 7, 3758–3765. [Google Scholar] [CrossRef]
  10. Tang, R.; Wu, T. Optimum tilt-angles for solar collectors used in China. Appl. Energy 2004, 79, 239–248. [Google Scholar] [CrossRef]
  11. Jamil Ahmad, M.N.; Tiwari, G. Optimization of tilt angle for solar collector to receive maximum radiation. The open renewable. Energy J. 2009, 2, 19–24. [Google Scholar] [CrossRef]
  12. Agarwal, A.; Vashishtha, V.K.; Mishra, S.N. Comparative approach for the optimization of tilt angle. Int. J. Eng. Res. Technol. 2012, 1. Paper ID: IJERTV1IS5008. Available online: https://www.ijert.org/volume-01-issue-05-july-2012 (accessed on 28 January 2021).
  13. Yakup, M.; Malik, A.Q. Optimum tilt angle and orientation for solar collector in Brunei Darussalam. Renew. Energy 2001, 24, 223–234. [Google Scholar] [CrossRef]
  14. Jafar Κazemi, F.; Saadabadi, S.A. Optimum tilt angle and orientation of solar surfaces in Abu Dhabi, UAE. Renew. Energy 2013, 56, 44–49. [Google Scholar] [CrossRef]
  15. Shariah, A.; Al-Akhras, M.A.; Al-Omari, I.A. Optimizing the tilt angle of solar collectors. Renew. Energy 2002, 26, 587–598. [Google Scholar] [CrossRef]
  16. Altarawneh, I.S.; Rawadieh, S.I.; Tarawneh, M.S.; Alsowwad, S.M.; Ramawi, F. Optimal tilt angle trajectory for maximizing solar energy potential in Ma’an area, Jordan. J. Renew. Sust. Energy 2016, 8, 033701. [Google Scholar] [CrossRef]
  17. Talebi Ζadeh, P.; Mehrabian, M.A.; Abdolzadeh, M. Prediction of the optimum slope and surface azimuth angles using the Genetic Algorithm. Energy Build. 2011, 43, 2998–3005. [Google Scholar] [CrossRef]
  18. Jafar Κazemi, F.; Saadabadi, S.A.; Pasdarshahri, H. The optimum tilt angle for flat-plate solar collectors in Iran. J. Renew. Sustain. Energy 2012, 4, 013118. [Google Scholar] [CrossRef]
  19. Moghadam, H.; Tabrizi, F.F.; Sharak, A.Z. Optimization of solar flat collector inclination. Desalination 2011, 265, 107–111. [Google Scholar] [CrossRef]
  20. Kamali, G.A.; Moradi, I.; Khalili, A. Estimating solar radiation on tilted surfaces with various orientations: A study case in Karaj (Iran). Theor. Appl. Climatol. 2006, 84, 235–241. [Google Scholar] [CrossRef]
  21. Saraf, G.R.; Hamad, F.A.W. Optimum tilt angle for a flat plate solar collector. Energy Convers. Manag. 1988, 28, 185–191. [Google Scholar] [CrossRef]
  22. Bakirci, K. General models for optimum tilt angles of solar panels: Turkey case study. Renew. Sustain. Energy Rev. 2012, 16, 6149–6159. [Google Scholar] [CrossRef]
  23. Kacira, M.; Simsek, M.; Babur, Y.; Demirkol, S. Determining optimum tilt angles and orientations of photovoltaic panels in Sanliurfa, Turkey. Renew. Energy 2004, 29, 1265–1275. [Google Scholar] [CrossRef]
  24. Skeiker, K. Optimum tilt angle and orientation for solar collectors in Syria. Energy Convers. Manag. 2009, 50, 2439–2448. [Google Scholar] [CrossRef]
  25. Ibrahim, D. Optimum tilt angle for solar collectors used in Cyprus. Renew. Energy 1995, 6, 813–819. [Google Scholar] [CrossRef]
  26. De Miguel, A.; Bilbao, J.; Diez, M. Solar radiation incident on tilted surfaces in Burgos, Spain: Isotropic models. Energy Convers. Manag. 1995, 36, 945–951. [Google Scholar] [CrossRef]
  27. Evseev, E.G.; Kudish, A.I. The assessment of different models to predict the solar radiation on a surface tilted to the south. Sol. Energy 2009, 83, 377–388. [Google Scholar] [CrossRef]
  28. Ghosh, H.R.; Bhowmik, N.C.; Hussain, M. Determining seasonal optimum tilt angles, solar radiations on variously oriented, single and double axis tracking surfaces at Dhaka. Renew. Energy 2010, 35, 1292–1297. [Google Scholar] [CrossRef]
  29. Gong, X.; Kulkarni, M. Design optimization of a large-scale rooftop photovoltaic system. Sol. Energy 2005, 78, 362–374. [Google Scholar] [CrossRef]
  30. Yan, R.; Saha, T.K.; Meredith, P.; Goodwin, S. Analysis of yearlong performance of differently tilted photovoltaic systems in Brisbane, Australia. Energy Convers. Manag. 2013, 74, 102–108. [Google Scholar] [CrossRef]
  31. Chang, Y.P. Optimal tilt angles for photovoltaic modules in Taiwan. Int. J. Electr. Power Energy Syst. 2010, 32, 956–964. [Google Scholar] [CrossRef]
  32. Liu, X. Calculation and analysis of optimal tilt angle for PV/T hybrid collectors. In Proceedings of the International Conference on Intelligent System Design and Engineering Applications, Sanya, China, 6–7 January 2012; pp. 791–795. [Google Scholar] [CrossRef]
  33. Zhao, Q.; Wang, P.; Goel, L. Optimal PV panel tilt angle based on solar radiation prediction. In Proceedings of the 11th International Conference on Probabilistic Methods Applied to Power Systems, Singapore, 14–17 June 2010; pp. 425–430. [Google Scholar] [CrossRef]
  34. Gunerhan, H.; Hepbasli, A. Determination of the optimum tilt angle of solar collectors for building applications. Build. Environ. 2007, 42, 779–783. [Google Scholar] [CrossRef]
  35. Ulgen, K. Optimum tilt angle for solar collectors. Energy Sour. Part A Recov. Util. Environ. Eff. 2006, 28, 1171–1180. [Google Scholar] [CrossRef]
  36. Ulgen, K.; Hepbasli, A. Prediction of solar radiation parameters through clearness index for Izmir, Turkey. Energy Sour. 2002, 24, 773–785. [Google Scholar] [CrossRef]
  37. Iacobescu, F.; Badescu, V. The potential of the local administration as driving force for the implementation of the National PV systems strategy in Romania. Renew. Energy 2012, 38, 117–125. [Google Scholar] [CrossRef]
  38. Colli, A.; Zaaiman, W.J. Maximum-power-based PV performance validation method: Application to single-axis tracking and fixed-Tilt c-Si systems in the Italian Alpine region. IEEE J. Photovolt. 2012, 2, 555–563. [Google Scholar] [CrossRef]
  39. Hussein, H.M.S.; Ahmad, G.E.; El-Ghetany, H.H. Performance evaluation of photovoltaic modules at different tilt angles and orientations. Energy Convers. Manag. 2004, 45, 2441–2452. [Google Scholar] [CrossRef]
  40. EL-Kassaby, M.M. Monthly and daily optimum tilt angle for south facing solar collectors; theoretical model, experimental and empirical correlations. Sol. Wind Technol. 1988, 5, 589–596. [Google Scholar] [CrossRef]
  41. Elminir, H.K.; Ghitas, A.E.; El-Hussainy, F.; Hamid, R.; Beheary, M.M.; Abdel-Moneim, K.M. Optimum solar flat-plate collector slope: Case study for Helwan, Egypt. Energy Convers. Manag. 2006, 4, 624–637. [Google Scholar] [CrossRef]
  42. Kaldellis, J.; Zafirakis, D. Experimental investigation of the optimum photovoltaic panels’ tilt angle during the summer period. Energy 2012, 38, 305–314. [Google Scholar] [CrossRef]
  43. Tsalides, P.; Thanailakis, A. Direct computation of the array optimum tilt angle in constant-tilt photovoltaic systems. Sol. Cells 1985, 14, 83–94. [Google Scholar] [CrossRef]
  44. Kambezidis, H.D.; Psiloglou, B.E.; Gueymard, C.A. Measurements and models for total solar irradiance on inclined surface in Athens, Greece. Sol. Energy 1994, 53, 177–185. [Google Scholar] [CrossRef]
  45. Kaddoura, T.O.; Ramli, M.A.M.; Al-Turki, Y.A. On the estimation of the optimum tilt angle of PV panel in Saudi Arabia. Renew. Sustain. Energy Rev. 2016, 65, 626–634. [Google Scholar] [CrossRef]
  46. Ohtake, H.; Uno, F.; Oozeki, T.; Yamada, Y.; Takenaka, H.; Nakajima, T.Y. Estimation of satellite-derived regional photovoltaic power generation using a satellite-estimated solar radiation data. Energy Sci. Eng. 2018, 6, 570–583. [Google Scholar] [CrossRef]
  47. Koronakis, P.S. On the choice of the angle of tilt for south facing solar collectors in the Athens basin area. Sol. Energy 1986, 36, 217–225. [Google Scholar] [CrossRef]
  48. Synodinou, B.M.; Katsoulis, B.D. A comparison of three models for estimation of global solar radiation on tilted and oriented surfaces in Athens. Int. J. Sol. Energy 1996, 18, 83–102. [Google Scholar] [CrossRef]
  49. Darhmaoui, H.; Lahjouji, D. Latitude based model for tilt angle optimization for solar collectors in the Mediterranean region. Energy Proc. 2013, 42, 426–435. [Google Scholar] [CrossRef] [Green Version]
  50. Jacobson, M.Z.; Jadhav, V. World estimates of PV optimal tilt angles and ratios of sunlight incident upon tilted and tracked PV panels relative to horizontal panels. Sol. Energy 2018, 169, 55–66. [Google Scholar] [CrossRef]
  51. NREL (National Renewable Energy Laboratory). PV Watts Calculator 2017. Available online: https://pvwatts.nrel.gov (accessed on 30 September 2020).
  52. Raptis, P.I.; Kazadzis, S.; Psiloglou, B.; Kouremeti, N.; Kosmopoulos, P.; Kazantzidis, A. Measurements and model simulations of solar radiation at tilted planes, towards the maximization of energy capture. Energy 2017, 130, 570–580. [Google Scholar] [CrossRef]
  53. Weissenbacher, M. Towards new renewable energy policies in urban areas: The re-definition of optimum inclination of photovoltaic panels. J. Sustain. Develop. Energy Water Environ. Syst. 2015, 3, 372–388. [Google Scholar] [CrossRef] [Green Version]
  54. Kambezidis, H.D.; Psiloglou, B.E.; Kaskaoutis, D.G.; Karagiannis, D.; Petrinoli, K.; Garviil, A.; Kavadias, K. Generation of typical meteorological years for 33 locations in Greece: Adaptation to the needs of various applications. Theor. Appl. Climatol. 2020. [Google Scholar] [CrossRef]
  55. Available online: https://e3p.jrc.ec.europa.eu/articles/typical-meteorological-year-tmy (accessed on 11 January 2021).
  56. Kambezidis, H.D.; Psiloglou, B.E.; Karagiannis, D.; Dumka, U.C.; Kaskaoutis, D.G. Recent improvements of the Meteorological Radiation Model for solar irradiance estimates under all-sky conditions. Renew. Energy 2016, 93, 142–158. [Google Scholar] [CrossRef]
  57. Kambezidis, H.D.; Psiloglou, B.E.; Karagiannis, D.; Dumka, U.C.; Kaskaoutis, D.G. Meteorological Radiation Model (MRM v6.1): Improvements in diffuse radiation estimates and a new approach for implementation of cloud products. Renew. Sustain. Energy Rev. 2017, 74, 616–637. [Google Scholar] [CrossRef]
  58. TOTEE. Analytical National Parameter Specifications for the Calculation of the Energy Efficiency of Buildings and the Edition of the Energy Ef-ficiency Certificate; Technical Guideline No. 20701-1; Technical Chamber of Greece: Athens, Greece, 2010. [Google Scholar]
  59. Walraven, R. Calculating the position of the sun. Sol. Energy 1978, 20, 393–397. [Google Scholar] [CrossRef]
  60. Wilkinson, B.J. An improved FORTRAN program for the rapid calculation of the solar position. Sol. Energy 1981, 27, 67–68. [Google Scholar] [CrossRef]
  61. Muir, L.R. Comments on “The effect of the atmospheric refraction in the solar azimuth”. Sol. Energy 1983, 30, 295. [Google Scholar] [CrossRef]
  62. Kambezidis, H.D.; Papanikolaou, N.S. Solar position and atmospheric refraction. Sol. Energy 1990, 44, 143–144. [Google Scholar] [CrossRef]
  63. Kambezidis, H.D.; Tsangrassoulis, A.E. Solar position and right ascension. Sol. Energy 1993, 50, 415–416. [Google Scholar] [CrossRef]
  64. Liu, B.Y.H.; Jordan, R.C. The long-term average performance of flat-plate solar energy collectors. Sol. Energy 1963, 7, 53–74. [Google Scholar] [CrossRef]
  65. Iqbal, M. An Introduction to Solar Radiation; Academic Press: Toronto, ON, Canada, 1983; pp. 304–307. ISBN 0-12-373750-8. [Google Scholar]
  66. Kambezidis, H.D.; Psiloglou, B.E. Climatology of the linke and unsworth-monteith turbidity parameters for Greece: Introduction to the notion of a typical atmospheric turbidity year. Appl. Sci. 2020, 10, 4043. [Google Scholar] [CrossRef]
  67. Available online: https://re.jrc.ec.europa.eu/pvg_tools/en/#PVP (accessed on 11 January 2021).
  68. Urraca, R.; Huld, T.; Garcia-Amillo, A.; Martinez-de-Pison, F.J.; Kaspar, F.; Sanz-Garcia, A. Evaluation of global horizontal irradiance estimates from ERA5 and COSMO-REA6 reanalyses using ground and satellite-based data. Sol. Energy 2018, 164, 339–354. [Google Scholar] [CrossRef]
  69. Crook, J.A.; Jones, L.A.; Forster, P.M.; Crook, R. Climate change impacts on future photovoltaic and concentrated solar energy output. Energy Environ. Sci. 2011, 4, 3101–3109. [Google Scholar] [CrossRef]
Figure 1. Distribution of the 33 selected HNMS stations (blue triangles) across the 4 climatic zones of Greece for energy purposes (orange = climatic zone A, green = climatic zone B, blue = climatic zone C, and purple = climatic zone D). The numbers on the map inside the triangles refer to the HNMS stations.
Applsci 11 01547 g001
Figure 2. Definition of the incidence angle θ. The solar altitude γ, the tilt angle of the sloped surface β, and the azimuths of the solar position in the sky and of the orientation of the tilted plane ψ and ψ’, respectively, are shown. In the case of the present work, ψ’ = 180° (a south-facing surface). In the graph, the Sun is at its highest γ (local solar noon), which coincides with the southerly direction. The four main orientations in the local horizon of the sloped surface are also indicated (i.e., N(orth), E(ast), S(outh), W(est)).
Applsci 11 01547 g002
Figure 3. Solar energy yield per year on a horizontal plane Ge,0S at each selected site of the HNMS meteorological network. The graph includes (a) the four TOTEE zones and (b) the four PV0 zones, shown by single-arrowhead or double-arrowhead lines.
Applsci 11 01547 g003
Figure 4. Solar energy yield per year Ge,βS on the planes with tilt angles to the south in the range of 5–60° in steps of 5° at four representative sites in Greece. The maximum energy received per year in each site is presented by squares, and the energy received at tilt angles equal to φ° is shown by triangles. The energy received by a horizontal flat plane (β = 0°) is also shown.
Applsci 11 01547 g004
Figure 5. (a) Solar energy yield per year on a south-facing plane with an inclination of 0–60° in steps of 5°. The inclination of the averaged φ° is presented with triangles. The energy shown is the annual sum averaged for all sites belonging to the same PV0 zone. (b) Solar energy yield per year on a south-facing plane with an optimum inclination of 25° (triangles) or 30° (squares), depending on site. Sites are in alphabetical order and colored according to the PV0 zone. Solar irradiation data points laying on the threshold lines are categorized into the zone their center is closer to. In both graphs, the PVccts zone interfaces (straight, dashed lines) are shown.
Applsci 11 01547 g005
Figure 6. Intra-annual variation of Ge,βS (β = 25° or β = 30°) at all sites belonging to the four PVctts zones. The black bold curve represents the intra-annual variation of Ge,βS averaged over all sites.
Applsci 11 01547 g006
Figure 7. Intra-annual variation of the Ge,25S or Ge,30S sums for all sites in PVctts zone A (a), PVctts zone B (b), PVctts zone C (c), PVctts zone D (d), and all PVctts zones (e). The black solid curve represents the average monthly Ge values in every PVctts zone or all PVctts zones, while the green solid line shows the best-fit curve to the mean Ge values. The dashed lines correspond to +1σ (red curve) and −1σ (blue curve). The best-fit equations are functions of y = Ge,25S or Ge,30S in terms of x = month of the year (1, …, 12). R2 is also given.
Applsci 11 01547 g007
Figure 8. Intra-annual variation of the monthly mean Ge,25S-30S and Ge,φS sums and their monthly differences.
Applsci 11 01547 g008
Figure 9. Summer (a) and winter (b) Ge values across all sites on inclined flat plates of 25° S or 30° S angles. The sites are cited in alphabetical order within the same PVctts zones.
Applsci 11 01547 g009
Figure 10. Summer (a) and winter (b) seasonal mean Ge sums and one standard deviation (±1σ) from the mean solar energy, received on a surface with a south-facing inclination of 25° or 30°. The seasonal solar energy values are the averages over all sites that belong to the same PVctts zones.
Applsci 11 01547 g010
Figure 11. Distribution of the annual mean Ge,25S-30S sum (a) and the annual mean TL (b) (which was adopted from Kambezidis and Psiloglou [66]) values over Greece. The PVctts thresholds of 1900, 1850, and 1800 kWhm−2·year−1 can be identified in (a).
Applsci 11 01547 g011
Figure 12. Intra-annual variation of the monthly Ge,25S or Ge,30S sums for Souda (a, PVctts zone A), Kozani (b, PVctts zone B), Chios (c, PVctts zone C), and Skyros (d, PVctts zone D). The red curves are estimates based on the corresponding photovoltaic typical meteorological year (TMY-PV) of the site, while the blue ones come from the Surface Solar Radiation Data Set—Heliostat (SARAH) 2005–2016 database using the PV Geographical Information System (PV-GIS) tool. The agreement between the two approaches is remarkable. In all cases, the correlation coefficient between the two curves is high: (a) 0.9736, (b) 0.9852, (c) 0.9679, and (d) 0.9883.
Applsci 11 01547 g012
Figure 13. Spatial distribution of the optimum tilt angle β for south-facing flat-plate solar convertors in Greece for the maximum annual energy yield.
Applsci 11 01547 g013
Figure 14. Division of Greece into four PVctts zones for the operation of solar flat-plate convertors with optimal tilt angles to the south.
Applsci 11 01547 g014
Table 1. The Helenic National Meteorological Service (HNMS) stations of Agrinio, Irakleio, Kastoria, and Tripoli with their typical meteorological months (TMMs) selected from different years in the time period of 1985-2014.
StationJanFebMarAprMayJunJulAugSepOctNovDec
Agrinio199920042000199420011997200019992004198820101994
Irakleio199520012004199419971987200319961996199720042003
Kastoria198719882005198519951996199619981991199419892008
Tripoli199919851993199319951987198719861986199120041994
Table 2. Range of annual heating degrees days (HDD), cooling degree hours (CDH), and surface solar radiation (SSR) values to define the climatic zones in Greece for energy-saving in buildings [58]. The calculation of HDD and CDH considers the following cold and warm periods of the year: (1) climatic zones A and B, November 1–April 15 and May 15–September 15, respectively, and (2) climatic zones C and D, October 15–April 30 and June 1–August 31, respectively.
Climatic ZoneHDD (Dimensionless)CDH (Dimensionless)SSR (kWhm−2·year−1)
A<1000[1300, 4500][1700, 1900]
B[1000, 1500][2200, 5500][1500, 1700]
C(1500, 2000][1200, 3800][1450, 1600]
D≥2000≤1500≤1500
Table 3. Classification of the 33 sites (in alphabetical order) in terms of the received solar irradiation on a horizontal plane over a year. The classification schemes are the climatic zones based on the map of Figure 1, the TOTEE zones from Table 2 (surface solar radiation (SSR) column), and the PV0 zones derived from Figure 3b. The gray rows highlight the changes among the different classification schemes.
# *Site
(Region of)
WHO Code **
φ/λ/z ***
Categorization Scheme
Climatic ZoneTOTEE ZonePV0 Zone
12Agrinio
(Western Greece)
16672
38.617/21.383/25
BAB
4Alexandroupoli
(Eastern Macedonia and Thace)
16627
40.85/25.933/3.5
CB/CD
10Anchialos
(Thessaly)
16665
39.217/22.8/15.3
BBC
14Andravida
(Western Greece)
16682
37.917/21.283/15.1
BAB
16Araxos
(Western Greece)
16687
38.317/23.55/139
BAB
18Chios
(Northern Aegean)
16706
38.35/26.15/4
BBC
20Elliniko
(Attica)
16716
37.9/23.75/15
BAB
7Ioannina
(Epirus)
16642
39.7/20.817/484
CB/CD
31Irakleio
(also written as Heraklion, Crete)
16754
35.333/25.183/39.3
AAA
23Kalamata
(Peloponnese)
16726
37.067/22/11.1
AAB
33Kasteli
(Crete)
16760
35.12/25.333/335
AAA
2Kastoria
(Western Macedonia)
16614
40.45/21.283/660.9
DBC
6Kerkyra
(known as Corfu, Ionian Islands)
16641
39.617/19.917/4
BBD
5Kozani
(Western Macedonia)
16632
40.283/21.783/625
DBC
27Kythira
(Attica)
16743
36.133/23.017/166.8
AAA
13Lamia
(Sterea Ellada)
16675
38.85/22.4/17.4
BBC
8Larisa
(Thessaly)
16648
39.65/22.45/73.6
CBC
11Lesvos
(Northern Aegean)
16667
39.067/26.6/4.8
BAB
9Limnos
(Northern Aegean)
16650
39.917/22.8/15.3
BBC
25Methoni
(Peloponnese)
16734
36.833/21.7/52.4
AAB
3Mikra
(outskirts of Thessaloniki, Central Macedonia)
16622
40.517/22.967/4.8
CB/CD
24Naxos
(Southern Aegean)
16732
37.1/25.533/9.8
AAB
30Rodos
(known as Rhodes, Southern Aegean)
16749
36.4/28.117/11.5
AAA
22Samos
(Northern Aegean)
16723
37.7/26.917/7.3
AAB
1Serres
(Central Macedonia)
16606
41.083/23.567/34.5
DB/CD
32Siteia
(Crete)
16757
35.12/26.1/115.6
AAA
15Skyros
(Sterea Ellada)
16684
38.9/24.55/17.9
BB/CD
29Souda
(Crete)
16746
35.55/24.117/140
AAA
26Spata
(Attica)
16741
37.967/23.917/67
BAB
17Tanagra
(Sterea Ellada)
16699
38.317/23.55/139
BAB
28Thira
(known as Santorini,
Southern Aegean)
16744
36.417/25.433/36.5
AAA
19Tripoli
(Peloponnese)
16710
37.533/22.4/652
CAA
21Zakynthos
(known as Zante,
Ionian Islands)
16719
37.783/20.9/7.9
AAB
* number of the site used in the map of Figure 1. ** World Meteorological Organization station’s code. *** Geographical latitude (degrees N)/geographical longitude (degrees E)/altitude (m amsl).
Table 4. Range of the annual mean solar energy sums Ge,βS received by planes of various tilt angles β, averaged across the 33 locations to define the 4 PVccts zones in Greece for solar availability under all-sky conditions. The range of the annual mean solar energy sums received on a horizontal plane Ge,0S is also given for reference. One should notice the different ranges of the four bands in the case of the received energy on a horizontal plane in the PV0 and TOTEE classifications.
Position of the Solar PanelAnnual Mean Energy Sum Ge (kWhm−2 year−1)
PVctts Zone APVctts Zone BPVctts Zone CPVctts Zone D
Inclined at β in the range 5–60° in steps of 5° (φ° included) to the south1900 < Ge,βS1850 < Ge,βS ≤ 19001800 < Ge,βS ≤ 1850Ge,βS ≤ 1800
Horizontal, PV0
classification
Horizontal, TOTEE classification
1775 < Ge,0S
1700 < Ge,0S
1700 < Ge,0S ≤ 1775
1500 < Ge,0S ≤ 1700
1625 < Ge,0S ≤ 1700
1450 < Ge,0S ≤ 1600
Ge,0S ≤ 1625
Ge,0S ≤ 1500
Table 5. Classification of the 33 sites in terms of the PV0 and PVctts zones, together with the optimum inclination angle β to the south of the solar flat-plane convertors operating in Greece for a whole year. It is worth observing that only one-third of the sites utilize β = 30°. The gray rows denote a change of the site’s categorization from the PV0 zone in Table 3 (see also Figure 3b) to the PVctts scheme in Figure 5b.
SitePV0 ZonePVctts ZoneOptimum β (Degrees S)
AgrinioBA30
AlexandroupoliDD30
AnchialosCC30
AndravidaBA30
AraxosBA30
ChiosCC25
EllinikoBA25
IoanninaDD30
IrakleioAA25
KalamataBA30
KasteliAA25
KastoriaCC30
KerkyraDD25
KozaniCB30
KythiraAA25
LamiaCC25
LarisaCD25
LesvosBB30
LimnosCC25
MethoniBB25
MikraDD25
NaxosBA25
RodosAA25
SamosBB25
SerresDD30
SiteiaAA25
SkyrosDD25
SoudaAA25
SpataBB25
TanagraBB25
ThiraAA25
TripoliAA25
ZakynthosBA30
Table 6. Regression equations of the best-fit curves to the monthly mean Ge,βS sums, averaged over all sites together with their R2 values, where t is the month in the range 1–12 and β = 25° or 30°.
PVctts ZoneEquationR2
AGe,βS = 0.0065 t6 − 0.2119 t5 + 2.6031 t4 − 15.6520 t3 + 46.4010 t2 − 17.3060 t + 340.00000.9911
BGe,βS = 0.0024 t6 − 0.0718 t5 + 0.8320 t4 − 5.5786 t3 + 21.7070 t2 − 11.0270 t + 78.16200.9916
CGe,βS = − 0.0007 t6 + 0.0531 t5 − 1.0940 t4 + 8.9273 t3 − 33.2980 t2 + 84.4560 t + 23.52100.9948
DGe,βS = 0.0033 t6 − 0.1047 t5 + 1.3230 t4 − 8.8159 t3 + 29.7600 t2 − 10.9440 t + 61.17200.9922
AllGe,βS = 0.0052 t6 − 0.1390 t5 + 1.0938 t4 − 1.0223 t3 − 23.9260 t2 + 139.6400 t + 206.17000.9938
Table 7. Change of the PV0 and PVctts thresholds from their historical (this study) values to the new values in the time period of 2010–2080 due to the impact of climate change. The future values are the historical ones increased by 3% on average, according to [69].
PV SchemeHistorical Annual Ge (kWhm−2·year−1)Future Annual Ge (kWhm−2·year−1)
PV0 upper threshold17751828.25
PV0 middle threshold17001751.00
PV0 lower threshold16251673.75
PVctts upper threshold19001957.00
PVctts middle threshold18501905.50
PVctts lower threshold18001854.00
Table 8. Maximum annual solar energy Ge,ψ’β received at the 33 sites in Greece (in alphabetical order) on inclined surfaces having specific azimuth ψ’ and tilt β angles.
HNMS StationOptimum ψ’ (Degrees)Optimum β (Degrees)Ge,ψ’β (kWhm−2·year−1)
Agrinio166291898.66
Alexandroupoli164291731.92
Anchialos169291829.39
Andravida174291923.10
Araxos168291927.48
Chios174261820.86
Elliniko172271906.17
Ioannina179291745.51
Irakleio168241934.43
Kalamata168281916.94
Kasteli167261937.86
Kastoria172291794.31
Kerkyra172281761.94
Kozani153331904.14
Kythira163261952.81
Lamia169271839.38
Larisa171281772.59
Lesvos168271878.96
Limnos167271819.81
Methoni174281892.05
Mikra174281735.11
Naxos171271914.38
Rodos172261951.10
Samos171261882.61
Serres175291741.09
Siteia169251952.64
Skyros170271725.02
Souda166251945.01
Spata166261891.33
Tanagra169271855.87
Thira171251921.75
Tripoli172281987.37
Zakynthos173291917.92
Publisher’s Note: MDPI stays neutral with regard to jurisdictional claims in published maps and institutional affiliations.

