Article

Cycle Logistics Projects in Europe: Intertwining Bike-Related Success Factors and Region-Specific Public Policies with Economic Results

1
Department of Civil, Energy, Environmental and Material Engineering, Mediterranean University of Reggio Calabria, 89122 Reggio Calabria, Italy
2
Department of Mechanical, Energy and Management Engineering, University of Calabria, 87036 Rende, Italy
*
Author to whom correspondence should be addressed.
Submission received: 29 December 2020 / Revised: 4 February 2021 / Accepted: 6 February 2021 / Published: 9 February 2021
(This article belongs to the Special Issue Advances on Smart Cities and Smart Buildings)

Abstract

:
The aim of this paper is to investigate whether and which specific, distinctive characteristics of European cycle logistics projects and the corresponding supporting policies have an impact on their economic performances in terms of profit and profitability. First, we identify project success factors by geographic area and project-specific characteristics; then, we statistically test possible dependence relationships with supporting policies and economic results. Finally, we provide a value-based identification of those characteristics and policies which more commonly lead to better economic results. This way, our work may serve as a basis for the prioritization and contextualization of those project functionalities and public policies to be implemented in a European context. We found that cycle logistics projects in Europe achieve high profit and profitability levels, and the current policies are generally working well and supporting them. We also found that profit and profitability vary across the bike model utilized: mixing cargo bikes and tricycles generates the highest profit and profitability, whilst a trailer–tricycle–cargo bike mix paves the way for high volumes and market shares.

1. Introduction

An increasing noticeable focus on the adoption of cargo cycles for commercial deliveries and their social and economic impacts has been shown in local, national or Europe-wide projects and communication campaigns, together with a more comprehensive analysis of factors and policies characterizing non-motorized mobility programs at large [1,2,3,4,5,6,7]. In particular, such policies have relevant impacts on the achievement of sustainable urban mobility goals as well as on the improvement of local economy and employment—e.g., by minimizing European economy losses (ca. 1% of gross domestic product) due to the congestion and prolongation of private and commercial journeys [4,8,9,10].
The existing literature in this research area also identifies manifold aspects, which vary from region to region—e.g., either cities or countries [11,12,13,14,15]. Area- and project-specific variables include (but are not limited to) speed and size of vehicles, trip generation potential in the surroundings, driver’s experience and confidence, weather conditions, number of traffic lanes and side roads, outside lane width, integration of land use and transportation planning, pavement surface quality and traffic signals [4,16,17,18]. Hence, analyzing differences across countries, regions and cities is crucial since it may bring significant policy implications, which vary widely throughout the European scenario [19,20].
The literature review has been partly extended to include active travel behavior since many factors and policies affecting bike delivery initiatives were found to be delved into in scientific publications concerning the field of non-motorized travel at large. In fact, factors and policies encouraging non-motorized or active travel behavior often include specific measures geared to foster cycle logistics initiatives, especially in some European regions [1,2,3,4,5,6,7,9,10]. This way, it is more likely to capture all possible aspects potentially impacting cycle logistics initiatives. However, the significance of such aspects has been tested with statistical analyses later on in this paper.
The same applies to the investigation of factors and policies in different regions. In fact, it has been conducted on projects run on a global basis in order to avoid excluding relevant aspects not covered by studies limited to the European scenario from the statistical analysis.
Overall, this research work proposes a cross-regional comprehensive study on cycle logistics projects in Europe. It considers both projects’ features and policies in the European area, together with the corresponding economic, financial impacts. The adoption of a Europe-wide perspective is among the key contributions of this paper. In fact, the review of hitherto published works in the literature shows that existing research directs its efforts toward studies limited to urban, regional and national contexts—more than comparing Europe-wide geographical areas—as well as to themes related to public health, environment, quality of life, etc. As a result, any cross-national approach is overlooked—especially pertaining to economic, financial results—thus showing how such a Europe-wide analysis of policies and impacts is unexplored.
The aim of this paper is to statistically test whether and which specific, distinctive characteristics of European cycle logistics projects and the corresponding supporting policies have an impact on their economic performances in terms of profit and profitability.
The paper is structured as follows: after the introduction, the second section provides an extensive and complete literature review in order to identify success factors for cycle logistics projects, including brief references to some closely related aspects concerning active travel at large; in the third section, data collection and processing methods and the methodological approach are described; the fourth section includes some discussions about results; in the last section, conclusive remarks are presented.

2. Literature Review

Although the goal of this paper is intertwining success factors and local policies with economic results of cycle logistics projects in Europe, the literature review proposed in the above section embraces a wider perspective. In fact, it considers those factors and policies also affecting the adoption of bikes for the mobility of people as well as active travel behaviors at large. This was a deliberate methodological choice geared to adopt a more comprehensive perspective of analysis in order to capture all possible elements affecting the cycle logistics field. In fact, this approach avoids the siloization of cycle logistics-related factors and policies: they cannot be and are not considered separately from the “whole picture”, which includes the use of bikes for personal purposes and active travel behavior at large. In fact, many factors and policies concerning cycle logistics are included in more comprehensive political programs, affecting the wider area of bike mobility and active travel. Finally, the reason behind this wider slant of analysis is justified by considering that cycle logistics solutions for freight transport always require some supporting policies from public authorities as well as the fact that they implicitly concern the adoption of bikes by individual users. Therefore, all of those factors and policies affecting the overall use of bikes for individual purposes prove to be relevant to cycle logistics solutions.
The search strategy implemented in Scopus, the Elsevier database, included the following terms: cargo bike, cargo-bike, cargobike, cyclelogistics, cycle-logistics, cycle logistics, cycle mobility, bike + mobility, active travel, bike + economy, bike + policy, cargo cycle, cargo-cycle, cargocycle. The resulting documents were then selected by analyzing their contents with a qualitative review, and all the co-authors independently reviewed each selected paper. Finally, they shared their independent evaluations with each other and identified the documents to be used for the literature review. Moreover, additional searches were conducted on the Internet by checking for additional relevant sources—e.g., from specialized websites—to integrate with the initial documents.

2.1. Experiences from the UK and Ireland

Local authorities in the UK have targeted large logistics companies in order to incentivize them to adopt cargo bikes into their supply chain. Moreover, communication campaigns of cargo cycle programs at the local level have emphasized both perception issues and lack of awareness and regulation as factors impacting negatively on the implementation of cycle logistics initiatives [7]. Ref. [21] demonstrates that promoting policies in the UK should address three pillars: incentive system, risk perception and availability and maintenance of infrastructures. Some of these key factors are common among cycle logistics and cycling at large, despite significant definitory differences and obstacles that characterize each strain. Finally, extant studies found some relationships between the impacts of both cycle logistics and cycling at large, but the definitory elements are not shared among them: it is a question of convergence of two different strains (cycle logistics and cycling at large) toward some similar results [18,21,22,23,24,25,26,27,28,29,30].
An additional factor lies in the impacts: an inverse relationship between the adoption of bike delivery solutions and the number of obese citizens, including bike messengers, has been found, thus proving the broad extent of social impacts partly attributable to cycle logistics [22,23,24,25,26]. In fact, cycle logistics projects in the UK have several impacts, since they contribute to reduce the pressure on the National Health Service; delivering goods by bike is positively linked to health benefits and is proven to help tackle urban mobility issues, which are directly responsible for 70% of substances threatening public health [21,27]. In Scotland, different research studies have identified a complex set of shared impacts—e.g., demographic, economic and infrastructural—related to both cycle logistics and cycling at large [18,28,29,30]. In Ireland, cycle logistics have been included in two ad hoc government programs in order to increase both individual and socio-economic benefits [9]. Tackling safety issues in Irish urban transportation networks is key in order to build on the reputation of cycling as safe in cities and, especially, to ensure the business viability of bike delivery projects [18]. In this context, risk perception, infrastructures and attitudinal aspects have been identified as key factors [18,31,32]. However, the current strong political will in many towns in the UK is not the only enabling factor supporting cycle logistics and cycling at large. In fact, the traditional good public transport systems and the urban infrastructures adverse to car use in city centers act as complementary factors in the British scenario since they help in decreasing traffic levels and, at the same time, enable the timely delivery of goods and, hence, the increase in customer satisfaction for cycle logistics businesses [33]. On the contrary, public transport proved to be poorly designed in Ireland since it provoked a 29.7% drop for non-motorized commuting and a 37.5% increase in car use from 1986 to 2006, thus revealing a negative context factor and discouraging the start-up of bike delivery businesses [9,34]. Many authors have investigated socio-economic and transportation- and household-specific factors in major Irish cities: supporting policies, infrastructures, car ownership and socio-demographic status at large have been identified as some of the more relevant issues impacting non-motorized transport, thus including cycle logistics [9,35,36,37,38,39].

2.2. Experiences from Greece and Italy

An analysis of factors impacting the adoption of bikes as a standard transportation means in Greece suggested that women’s eco-cyclist inclination tends to make them ask for bike delivery services more often than men [40]. Nonetheless, the existing literature about the Greek scenario sheds light on how the gender factor is mitigated by other variables—i.e., demographic, economic and environmental—and gender may play a varying role depending on the relative significance of such factors interacting with it [40]. Demographic and cultural ones—e.g., marital and education status—often have a low impact, while age may be associated with environmental concern [41]. Finally, low income has been shown to be the most relevant economic aspect affecting the demand of bike delivery services, thus giving policy makers and managers a relevant insight into unexploited targets for new mobility solutions in Greece [40].
In Italy, factors such as the network and the topological shapes of many cities made it necessary to test several pilots which emphasize the environmental and social benefits of such initiatives [42]. These Italian projects build on previous research, which has already demonstrated that 51% of all trips for goods transportation in European cities can be realized by bike, and 19% to 48% of the overall mileage currently performed by combustion engine vehicles can be done by cargo bike [7,43]. In this context, the main factors determining the success or failure of pilots were the size and weight of goods to be delivered compared to the load capacity of cargo bikes; the relevance of time windows for the delivery; the impacts on brand image and corporate social responsibility; cost levels; availability of a supporting network and reliability of enabling technologies [42]. Finally, the cycle logistics scenario in Italy proves to be primarily affected by the social (e.g., visibility and green image, low energy consumption, service quality and coverage), physical (e.g., load capacity vs goods size, weight and number, technological reliability and battery duration) and political (e.g., better quality of life for citizens, re-use of public facilities and incentives) factors of the socio-ecologic model proposed by [16].

2.3. Experiences from Scandinavia

An analysis of Scandinavian countries, especially Denmark, showed that accessibility and availability of both safe infrastructures and parking facilities—together with high urban density—enable the start-up and development of cycle logistics projects as well as the adoption of bikes at large [20]. Other authors recognize the key role of supporting policies [16,44,45,46].

2.4. Experiences from Central Europe

In the Netherlands, the use of bikes for the mobility of both goods and people already accounted for 30% of overall local trips in 1997, thus showing a strong cultural integration of bikes into Dutch society [47]. As for cycle logistics projects, commercial deliveries in Dutch cities are generally planned for short trips within the 3.5-km threshold, while in Germany, they are feasible within 2 km [47]. Differences between the average trip thresholds in the Dutch and German scenarios are due to cultural factors as well as urban density and infrastructural factors [47]. In Germany, recent research efforts on inner-city courier shipments have identified the specific vehicle choice of “messengers”—i.e., freelance couriers—as one of the main drivers for the adoption of bike delivery solutions [48]. In turn, vehicle choice is affected by several variables at the individual—e.g., demographic, attitudes and values—technological—e.g., accessibility and availability of enabling technologies—and economic—e.g., price and availability of information—levels [48]. As for technological aspects, technical innovations adopted by cycle logistics initiatives in Germany and France have been combined with new concepts and configurations of urban mobility systems. They have been successful, especially when associated with urban micro-consolidation centers as well as technologies for reduced driver fatigue and improved range and payload [48,49,50,51]. However, recent studies have shown that effective commercial transport solutions in city centers always come out of a multitude of factors harmoniously combined with each other, such as organizational structure of supplier firms, demand patterns, technical prerequisites and cultural inclination to accept a modal shift from customers, firms and messengers [48].

2.5. Experiences out of Europe: Australia and the United States of America

Many research works report that Australian bike-based businesses are worse positioned compared with their competitors in North America, China and Europe [6,52,53,54]. The findings suggest that adverse reactions to safety helmets being compulsory together with trip distance may affect messengers’ vehicle choice and undermine the success of Australian cycling and cycle logistics programs (see also [39,55,56]). Other studies conducted in Australian and American cities suggest that individual factors, including messengers’ vehicle choice, are key in order to nurture bike delivery or bike sharing schemes as well as cycling at large [41,56,57,58,59,60,61,62,63,64,65]. As for mandatory helmet usage, it is not perceived as an advantageous factor because of the need for either purchasing or always carrying such safety accessories; studies show that it is detrimental in both Australia and the USA, with other factors being equal [17,55,66,67,68]. Moreover, urban density and availability of infrastructures are also recognized as relevant factors in Australia and the USA [69,70,71].
However, commercial deliveries in the United States are not effective because of the noticeable differences with the network and topological shapes in European inner cities [72,73,74]. Although there has been a sound debate about primary causes of the flop of Australian programs, the field research is still poorly grounded and calls for further empirical research efforts.

2.6. Experiences from Asian Countries

As regards the Malaysian scenario, customer needs and political factors play a key role—e.g., need for door-to-door transport, spread and availability of dedicated infrastructures and environmental aspects [4,75]. Other studies confirm that socio-economic impacts were found to be significant [4,76].
As Western societies have shown a strong commitment to cycle logistics and cycling at large (see Section 2.1, Section 2.2, Section 2.3, Section 2.4 and Section 2.5), likewise, Asian ones have proven to be strategically engaged in them as well because of their relevance to national agendas [77,78,79]. Policy implications also call for a dramatic change in population distribution in some Asian cities, such as in Malaysia, where a foreseeable “donut cake” distribution due to the downstreaming phenomenon in urban centers will generate a downsizing of economic activities and residential density in downtown areas, impacting, in turn, the operations and the development of bike delivery businesses [4]. Downstreaming in cities will be amplified by other local policies such as priority being afforded to motorized vehicles and lack of non-motorized promotion, resulting in a clearly disadvantageous scenario for cycle logistics projects [4]. These results call for taking the opportunity to design transportation networks suitable for cycle logistics and integrating them with existing road networks in Malaysia. Moreover, policy makers should push towards the adoption of priority policies reversing the current ones, as it happens in Europe—i.e., ensuring priority to cyclists and bike messengers, excluding them from turning or one-way direction constraints [4].
However, Malaysia and European and Northern American countries are not the only ones to cope with political, safety and socio-demographic factors, since they have proven to be relevant also to the Japanese national agenda [80,81]. In particular, the lack of effective safety regulation in Japan called for the implementation of active safety policies and countermeasures which also suggest an increase in the viability of commercial deliveries in cities [80,82,83,84,85]. This way, it has been possible to adopt more effective policies in order to tackle both bike messengers’ and goods’ safety in Japan as well as it is being done in other Western societies such as Ireland and in developing countries [18,20,28,35,36,37,38,47,86,87,88,89].

2.7. Experiences from Developing Countries

In the last century, policy makers in developing countries have focused on motorized transportation, thus promoting and designating urban development as a hindering context for cycle logistics projects. This approach to planning and implementation of activities has dominated the transportation arena, even though non-motorized travel is even more significant in developing countries than in Western societies. The reasons behind this have been recognized to be the poorly grounded literature and the poor dissemination of research results in this field, also at the power elite level [89]. Moreover, policy makers hold their responsibility since they did not relevantly take into account the positive impacts of non-motorized transportation in terms of environmental, energy and socio-economic benefits. Therefore, they neglected the need of promoting the start-up of bike delivery services—e.g., by incentivizing them or realizing supporting infrastructures. Their carelessness towards the multifaceted negative effects of traditional combustion engine vehicles—e.g., increase in congestion, energy consumption, pollution, costs, pressure on health system, safety and security—is even more alarming [90,91]. Policy makers and people at large have perceived, for many decades, that the dilemma between motorized versus non-motorized transportation could be associated with rural versus urban and developed versus non-developed, while the most advanced studies prove that cycle logistics may provide a significant contribution to cope with many issues affecting urban contexts worldwide [89].
A further challenge appears on the horizon: most cities in some developing countries, e.g., India, are not able to satisfy the need for investments and measures concerning infrastructures, safety, land use and incentive systems geared to serve their growing cycling population, including bike messengers, and the overall viability of their delivery services in inner cities [37,86,88,89,92,93,94,95,96,97,98,99,100,101].
In conclusion, where policy makers overlook the need for an integrated set of interventions geared to promote cycle logistics and cycling at large, this may result in limited success or even in failure of supporting policies. Sometimes, this political issue comes from the desire to maintain good relationships with relevant shares of voters, and other times from evidence of weak political capacity [102,103,104,105,106]. Finally, the paradigmatic shift towards bike delivery services is linked to a set of factors and interventions to tackle them. In the following, all relevant factors and policies are analyzed together with their relative significance across geographical areas and countries. Furthermore, corresponding measures are identified that prove effective in modifying the ways in which goods are delivered in cities. In this context, the comprehensive subject of this paper—i.e., Europe-wide analysis—is particularly suitable for defining policy implications in the broader field of sustainable urban transport. The focus on cities and urban areas at large is further justified by recent research results showing that even European or nationwide transport policies depend on their success at the local level [6,9].

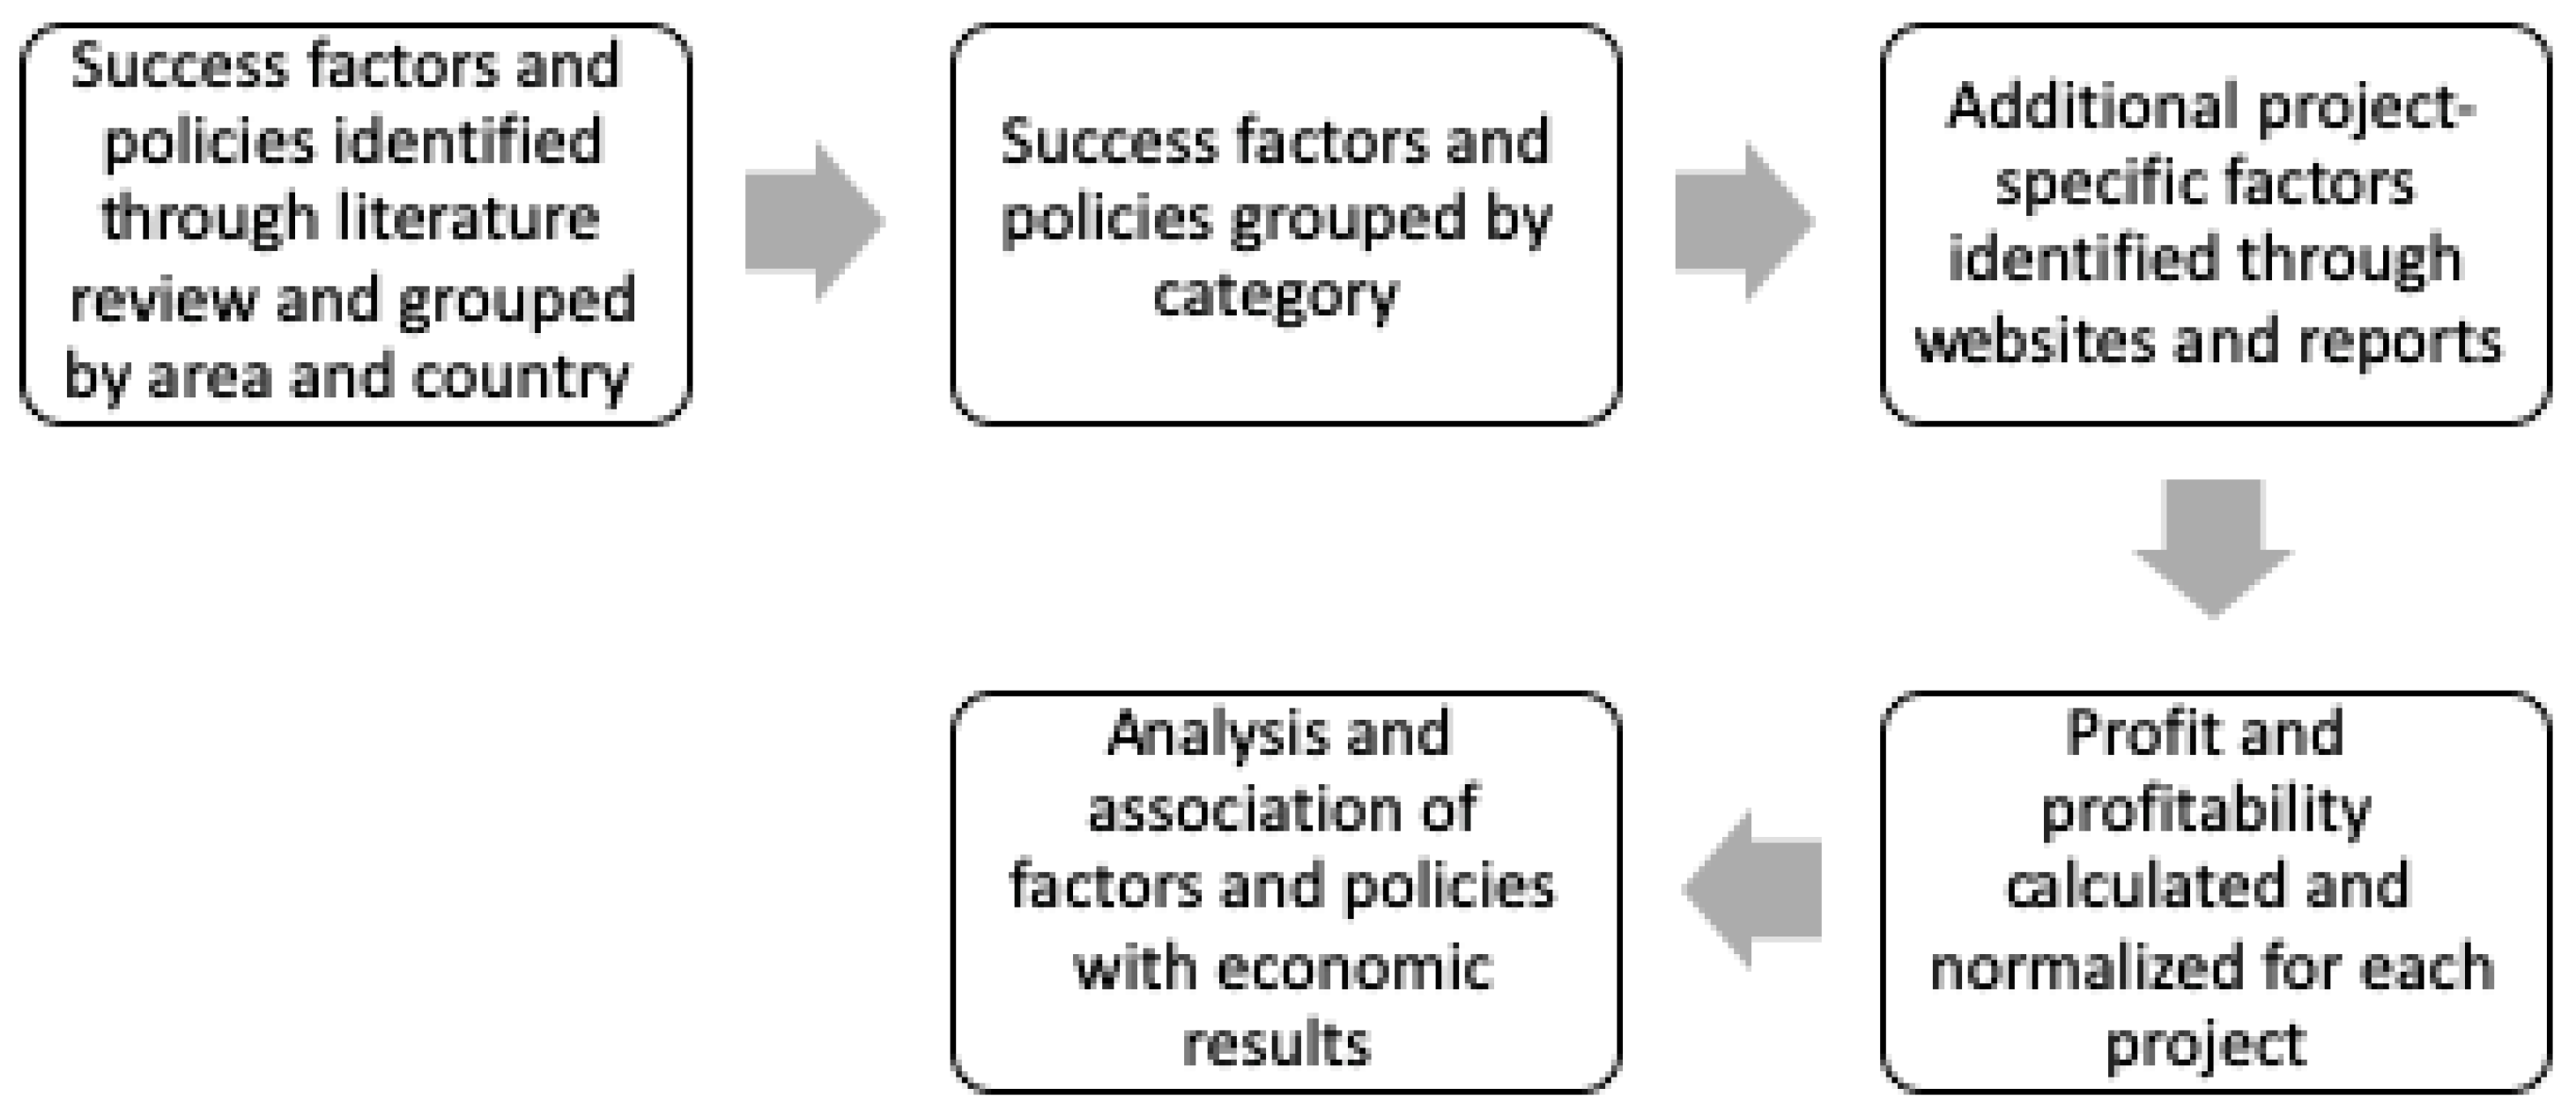
3. Data Collection and Methodological Approach

We must point out that the profit and profitability variables help when assessing the potential of an individual project to achieve business objectives or to produce an economic result based on both an effective and efficient use of resources, within the context in which such a project is implemented. In fact, in general, profit in itself is not sufficient to prove the economic appeal of an investment in a project and whether it is worth pursuing, except when dealing with a business company. On the contrary, the concept of profitability applies, more generally, to all kinds of economic organizations, including non-profit. Profitability has been calculated as a dimensionless value according to the standard definition—i.e., sum of present value of cash flows over 5 years divided by initial investment. On the contrary, profit is not dimensionless—the currency is euros—and it has been calculated by subtracting the normalized costs in the Cyclelogistics project (e.g., for bike purchasing, maintenance, insurance and messenger pay) from the overall income [107,108].
Such hypotheses depending on profit and profitability as economic, financial results are tested by utilizing normalized data that are calculated at the European level [108]. Therefore, such data do not reflect any region-specific features, as they are generated by definition and by construction with a normalization process throughout the Europe-wide scenario, which was the context of the analysis considered by the source study [108]. To the best of the authors’ knowledge, the data included in this research document are the most comprehensive and reliable, so far, and are endowed with an official element, being the result of activities supported also by the European Commission.
Both profit and profitability are calculated with reference to the specific organization implementing the cycle logistics service. Therefore, profit and profitability refer to the organization’s business/project level, whereas those values of profit and profitability are registered as economic, financial results.
The overall methodological approach and the corresponding steps are summarized below (Figure 1) and discussed in detail in the rest of this section.
Following this approach, in the first stage, critical factors and policies mentioned in Section 2 have been clustered by area and country. The results are shown in Appendix A (Table A1) and Appendix B (Table A2).
In the second stage, both critical factors and policies relevant to those projects run in Europe have been selected and grouped by category (Table 1a,b).
In the third stage, beyond factors and policies identified with the above analysis, a complementary study has been conducted in order to take into account also project-specific factors characterizing 50 cycle logistics solutions implemented in Europe (Table 2a). The main type of bike is considered as the key feature since other project-specific factors—such as size range of delivery, ease of driving and parking, price per delivery, cost per bike, etc.—result to be affected by it. In particular, the bike models considered are traditional, trailer and cargo bikes as well as tricycles. Traditional bikes are those standard models used also by urban citizens for their own private purposes. If used for commercial deliveries, they only allow transporting small-sized goods and in a limited quantity, since they do not have large cargo accessories, neither in front nor behind. They are generally cheaper than other bike models in terms of purchase, maintenance and insurance costs and ensure a higher speed and ease of driving and parking in cities. Cargo bikes have a large box, generally in front, which allows transporting even big-sized goods as well as a large quantity of small- to medium-sized items. They are much more expensive than traditional bikes and more difficult to park and drive. Trailer bikes lie in the middle between traditional and cargo ones and are endowed with a small cargo behind. As for tricycles, they are the largest and more capacious bikes as well as the ones with the highest costs. Moreover, they have the lowest average speed as well as the lowest ease of driving and parking in cities.
In the fourth stage, economic results have been calculated and normalized with reference to the data referring to the average European city as provided by the Cyclelogistics project [108], as reported in Table 2b,c. In detail, profit-and-loss data have been calculated and normalized coherently with the consolidated average economic arguments on page 19 of the aforementioned data from the Cyclelogistics project [108], whilst the average data on the European cities scenario have been extracted from page 9 of the same reference [108]. In this context, normalization means using the same average economic arguments in the aforementioned report in order to calculate profit and profitability of cycle logistics projects. This way, the methodological approach adopted allowed us to compare project data homogeneously. Profit and profitability measures for each project have been calculated over 5 years depending on available data from the Cyclelogistics project [107,108] and by rounding yearly profits down with a 0.1 correction coefficient. This way, we have reduced the overall profit (and also the profitability inferred from it). This helps us in further challenging our research hypotheses by assuming a more pessimistic scenario in terms of profit and profitability levels as well as further mitigating the risk of their overestimation. In addition, profits have been prudently calculated by considering only the share of bike-based trips explicitly devoted to goods delivery in European cities, thus assuming a scenario with an even more pessimistic underestimation.
At first, these assumptions could sound like an attempt to simplify calculations in order to be able to perform a rough estimate and comparison among projects. Anyhow, as a matter of fact, that is currently the only way to perform such an analysis because of the lack of sufficient and homogeneous data. Such a shortage of data concerns both the non-profit projects funded by the European Commission and those projects run by private start-ups. Profit and profitability have been calculated in order to obtain an insight into the potential of each individual project to achieve business objectives or to produce an economic result based on both an effective and efficient use of resources. In fact, in general, profit in itself is not sufficient to prove the economic appeal of an investment in a project and whether it is worth pursuing, except when dealing with a business company. On the contrary, the concept of profitability applies, more generally, to all kinds of economic organizations, including non-profit. Profitability has been calculated as a dimensionless value according to the standard definition—i.e., sum of present value of cash flows over 5 years divided by initial investment. On the contrary, profit is not dimensionless—the currency is euros—and it has been calculated by subtracting the normalized costs in the Cyclelogistics project (e.g., for bike purchasing, maintenance, insurance and messenger pay) from the overall income [108]. Economic results and their descriptive statistics calculated in Microsoft Excel® are reported below (Table 3, Table 4 and Table 5).
In the fifth and last stage, possible associations of factors and policies with economic results have been analyzed with IBM® SPSS® Statistics 24. Some analyses have been made in order to make inferences about data and to understand whether the observed pattern is real or due to chance. Before using IBM® SPSS® Statistics 24, the dataset was cleaned up by deleting overlapping data concerning cross-country-specific factors and policies.
Therefore, in the fourth section, mean and standard deviation were calculated again in IBM® SPSS® Statistics 24, together with other advanced statistics.
As an additional note, despite the many variables that could be identified in the literature review, the availability of data was limited to some of them. Moreover, data for some variables were only partly available. Finally, the only variables with full data available for a quantitative analysis were related to profit, profitability, geographical area and type of bike.
Finally, we state our four research hypotheses, based on the above explication of the variables:
Hypothesis 1 (H1).
The profit distribution varies across categories of geographic area, that is, across the different geographic areas, not across each country pertaining to a specific geographic area.
Hypothesis 2 (H2).
The profitability distribution varies across categories of geographic area, that is, across the different geographic areas, not across each country pertaining to a specific geographic area.
Hypothesis 3 (H3).
The profit distribution varies across categories of bike model.
Hypothesis 4 (H4).
The profitability distribution varies across categories of bike model.

4. Results and Discussion

The preliminary step of the statistical analysis was conducted in order to verify whether data distributions of profit and profitability are normal or not. Checking the normality of distributions is relevant since this methodological step impacts the choice of the statistical tests to adopt (e.g., parametric vs non-parametric tests) in order to ensure the reliability of results.
In the following, Table 6a,b show normality tests on area-specific profit and profitability. Table 7a,b show normality tests on project-specific profit and profitability.
The results show that all data distributions are not normal since the prevailing tests of normality—i.e., Kolmogorov–Smirnov and Shapiro–Wilk—lead to reject the normal distribution hypothesis.
Therefore, parametric tests—i.e., one-way ANOVA—were not conducted, whilst non-parametric ones were conducted: the Kruskal–Wallis H test was applied [110] since it is more appropriate than the Mann–Whitney U one. In fact, in our analysis, all independent categorical variables—i.e., both area- and project-specific factors—have more than two levels. In Table 8a,b, the results of the Kruskal–Wallis H tests are reported.
The results of the first statistical tests conducted–from the Kolmogorov–Smirnov to the Shapiro–Wilk one—are aimed at proving the reliability and suitability of the second step of the statistical analysis—i.e., Kruskal–Wallis H test [110]—which challenges the research hypotheses with corresponding null hypotheses. The final results prove that the only null hypothesis rejected is the one related to the bike model, thus confirming that the hypothesized dependence is true and significant. On the other hand, the across-the-region hypothesis is not supported, thus showing that there are no specific regional features affecting profit and profitability results more than others.

4.1. Discussion on the Statistical Tests of H1 and H2

In the following, statistical results concerning our research hypotheses on categories of geographic area are discussed. In particular, such hypotheses—which are negatives of the null ones reported in Table 8a—state that:
Hypothesis 1 (H1).
The profit distribution varies across categories of geographic area, that is, across the different geographic areas, not across each country pertaining to a specific geographic area.
Hypothesis 2 (H2).
The profitability distribution varies across categories of geographic area, that is, across the different geographic areas, not across each country pertaining to a specific geographic area.
As a first remark, such hypotheses are rejected. In fact, both profit and profitability distributions are the same across categories of geographic area (Table 8a). In this case, multiple comparisons were not performed because the overall test does not show significant differences across such categories.
Considering profit and profitability performances shown in Table 3 and Table 4, the statistical analysis of area-specific variables (Table 8a) shows an overall significance of success factors and policies in the European context. It also proves that there are no single factors or policies having a relevantly higher impact than others on the likelihood of success of cycle logistics projects. Although differences between distributions depending on the area are not significant, we can still analyze data in Table 4 in order to obtain a deeper understanding of the determinants of such a phenomenon. Data concerning profit and profitability by area highlight somewhat high values in terms of mean and standard deviation, except for Scandinavia. Mean values associated with projects in “Central Europe” prove to be higher than the overall average, whilst those in the “UK and Ireland” and “Greece, Italy and the Mediterranean islands” are just below it. “Scandinavia” has the lowest mean values. One of the main reasons behind that may be found by considering that cycling is an activity deeply rooted in Scandinavian cultures, especially in Denmark, which is the application context of the two projects considered for this area. Therefore, Danish people are used to transporting both small- and big-sized goods by themselves, thus not calling for bike delivery services. For instance, in 2008, IKEA invested in bikes—and trailers, if needed—at selected stores in Denmark (and also in Sweden) so that customers can ride home for free with their new purchases [111,112]. Although Danish projects show the lowest profit level, their profitability level goes high, much more than in any other area in Europe. A possible interpretation is that the high degree of accessibility and availability of suitable infrastructures in those countries helps with lowering the cost of some items—e.g., vehicle maintenance, insurance and, hence, purchase of new bikes. On the other hand, it helps with increasing service levels—e.g., deliveries are more likely to be made on time and customers are more satisfied. Moreover, supporting economic measures prove to nurture bike delivery organizations as well. Finally, such delivery services tend to be more effective, efficient and, hence, with a higher profitability in those countries than in others.

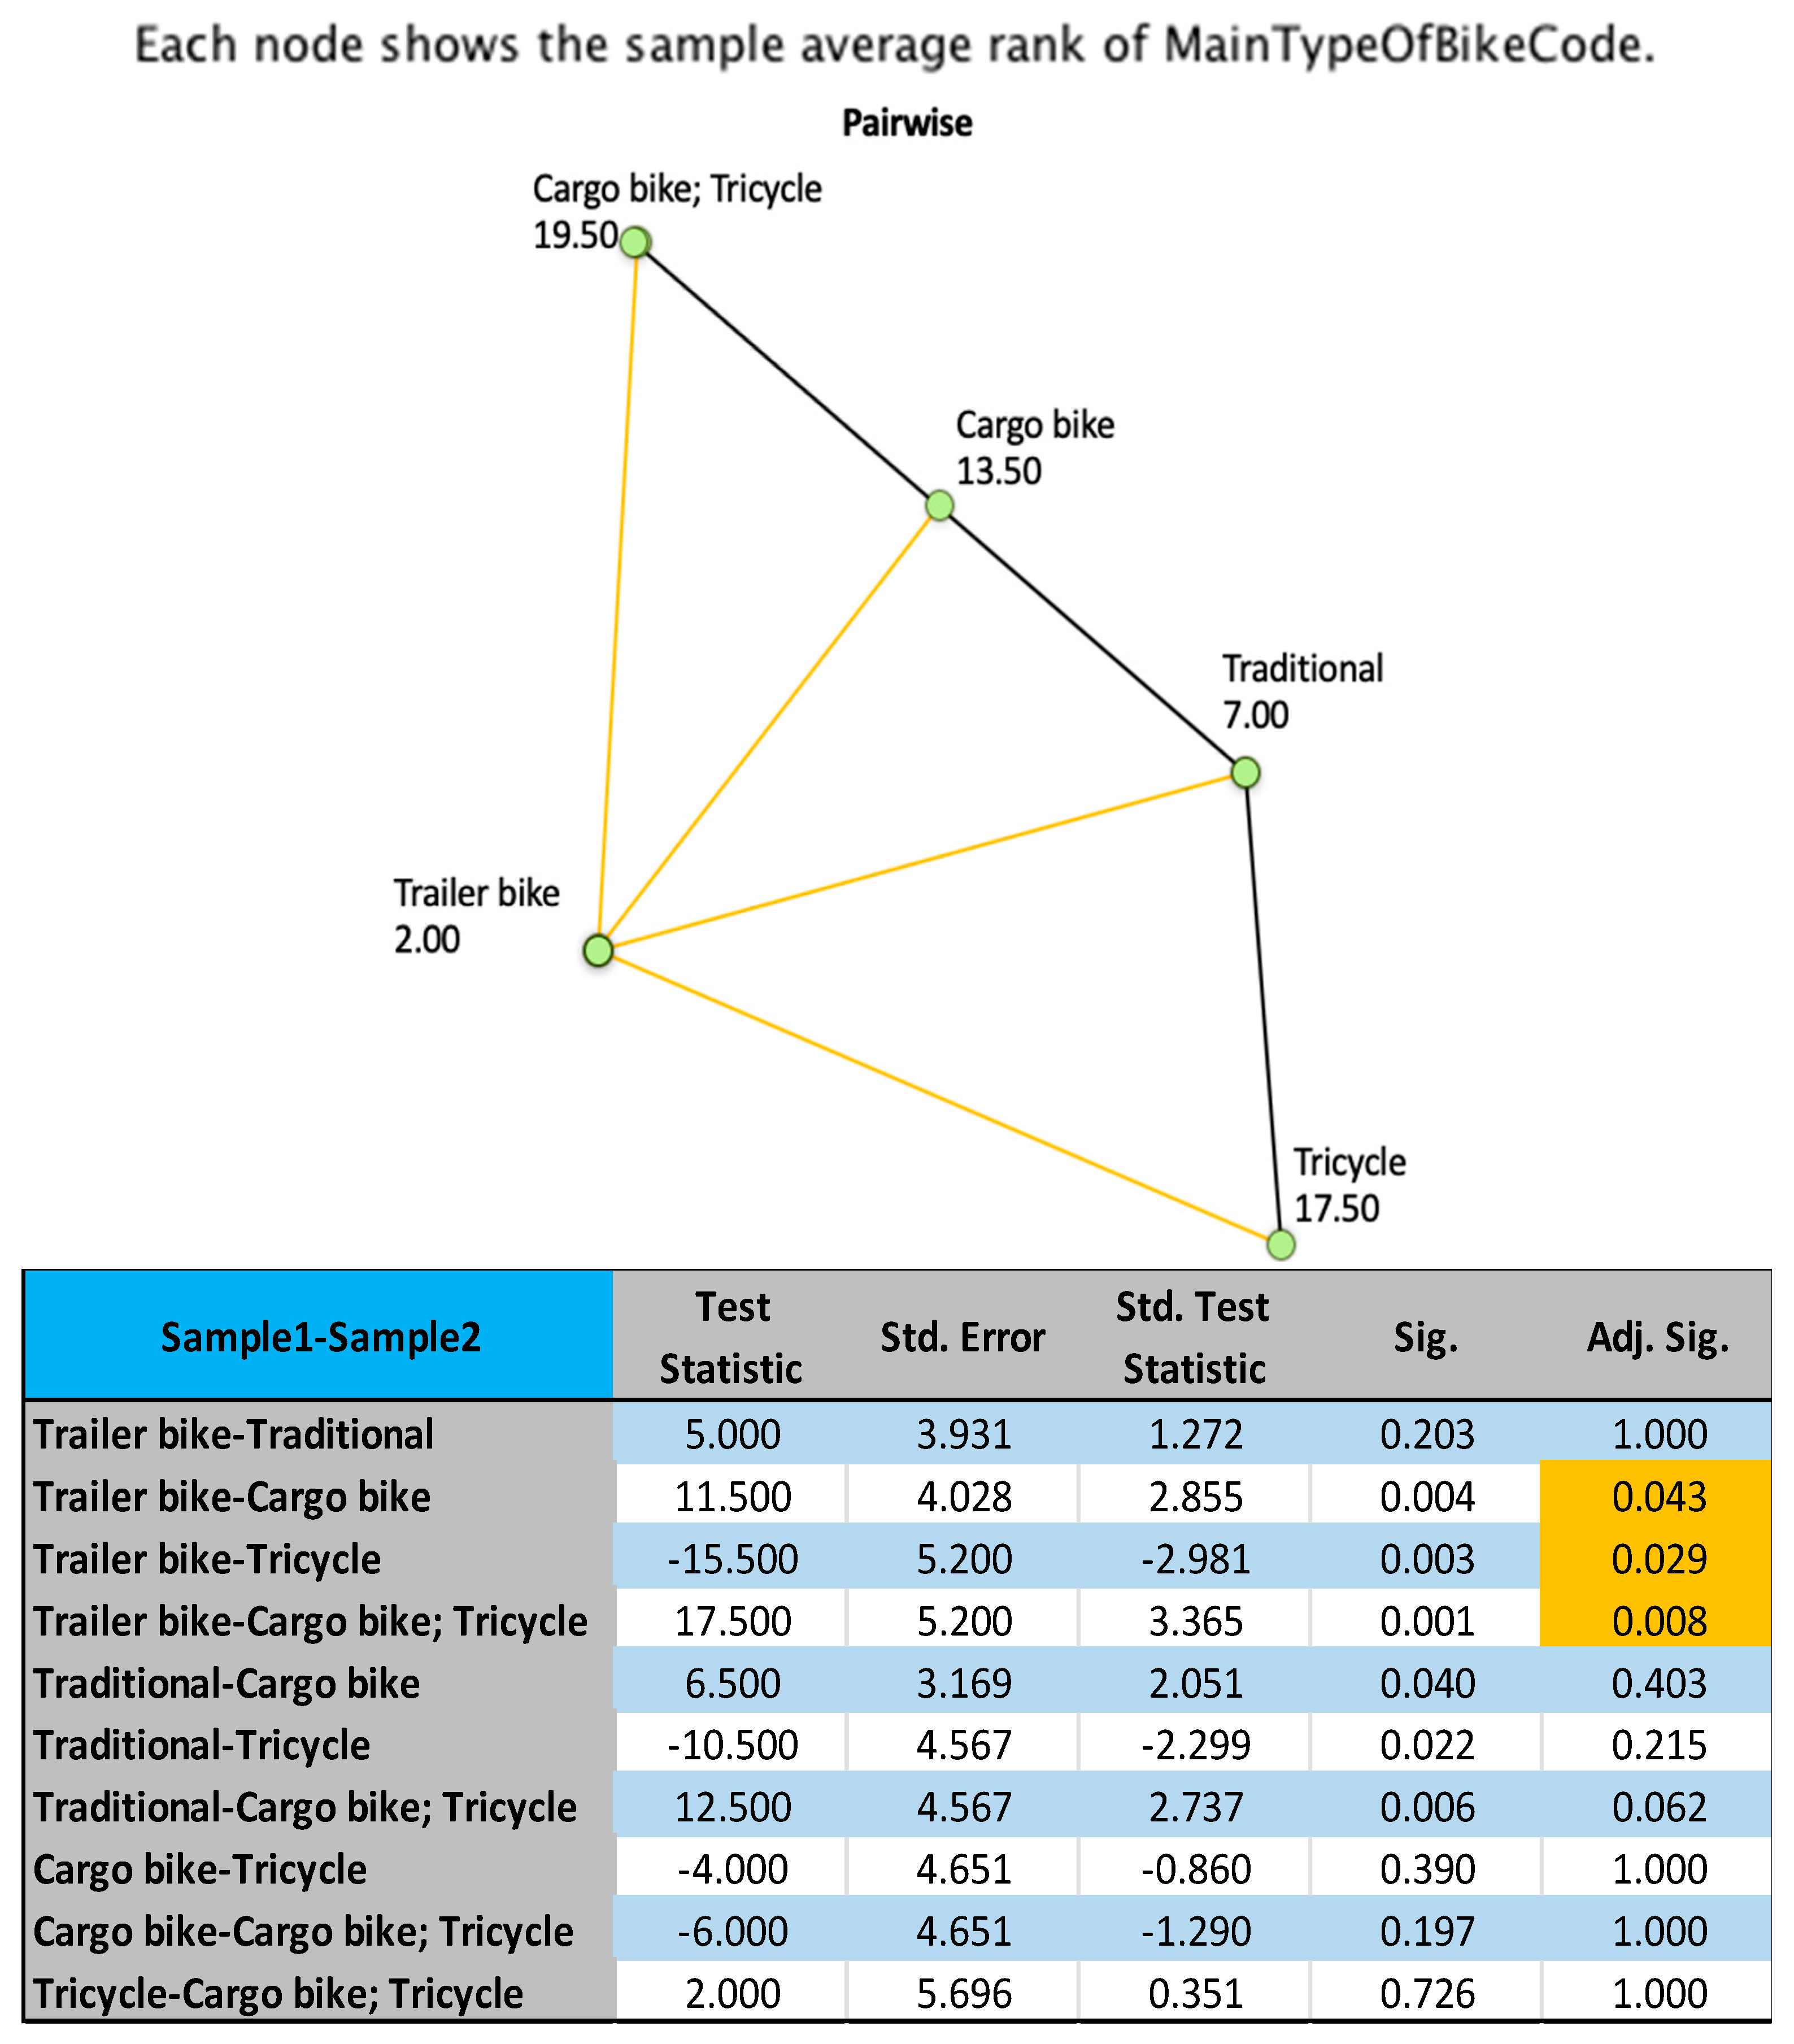
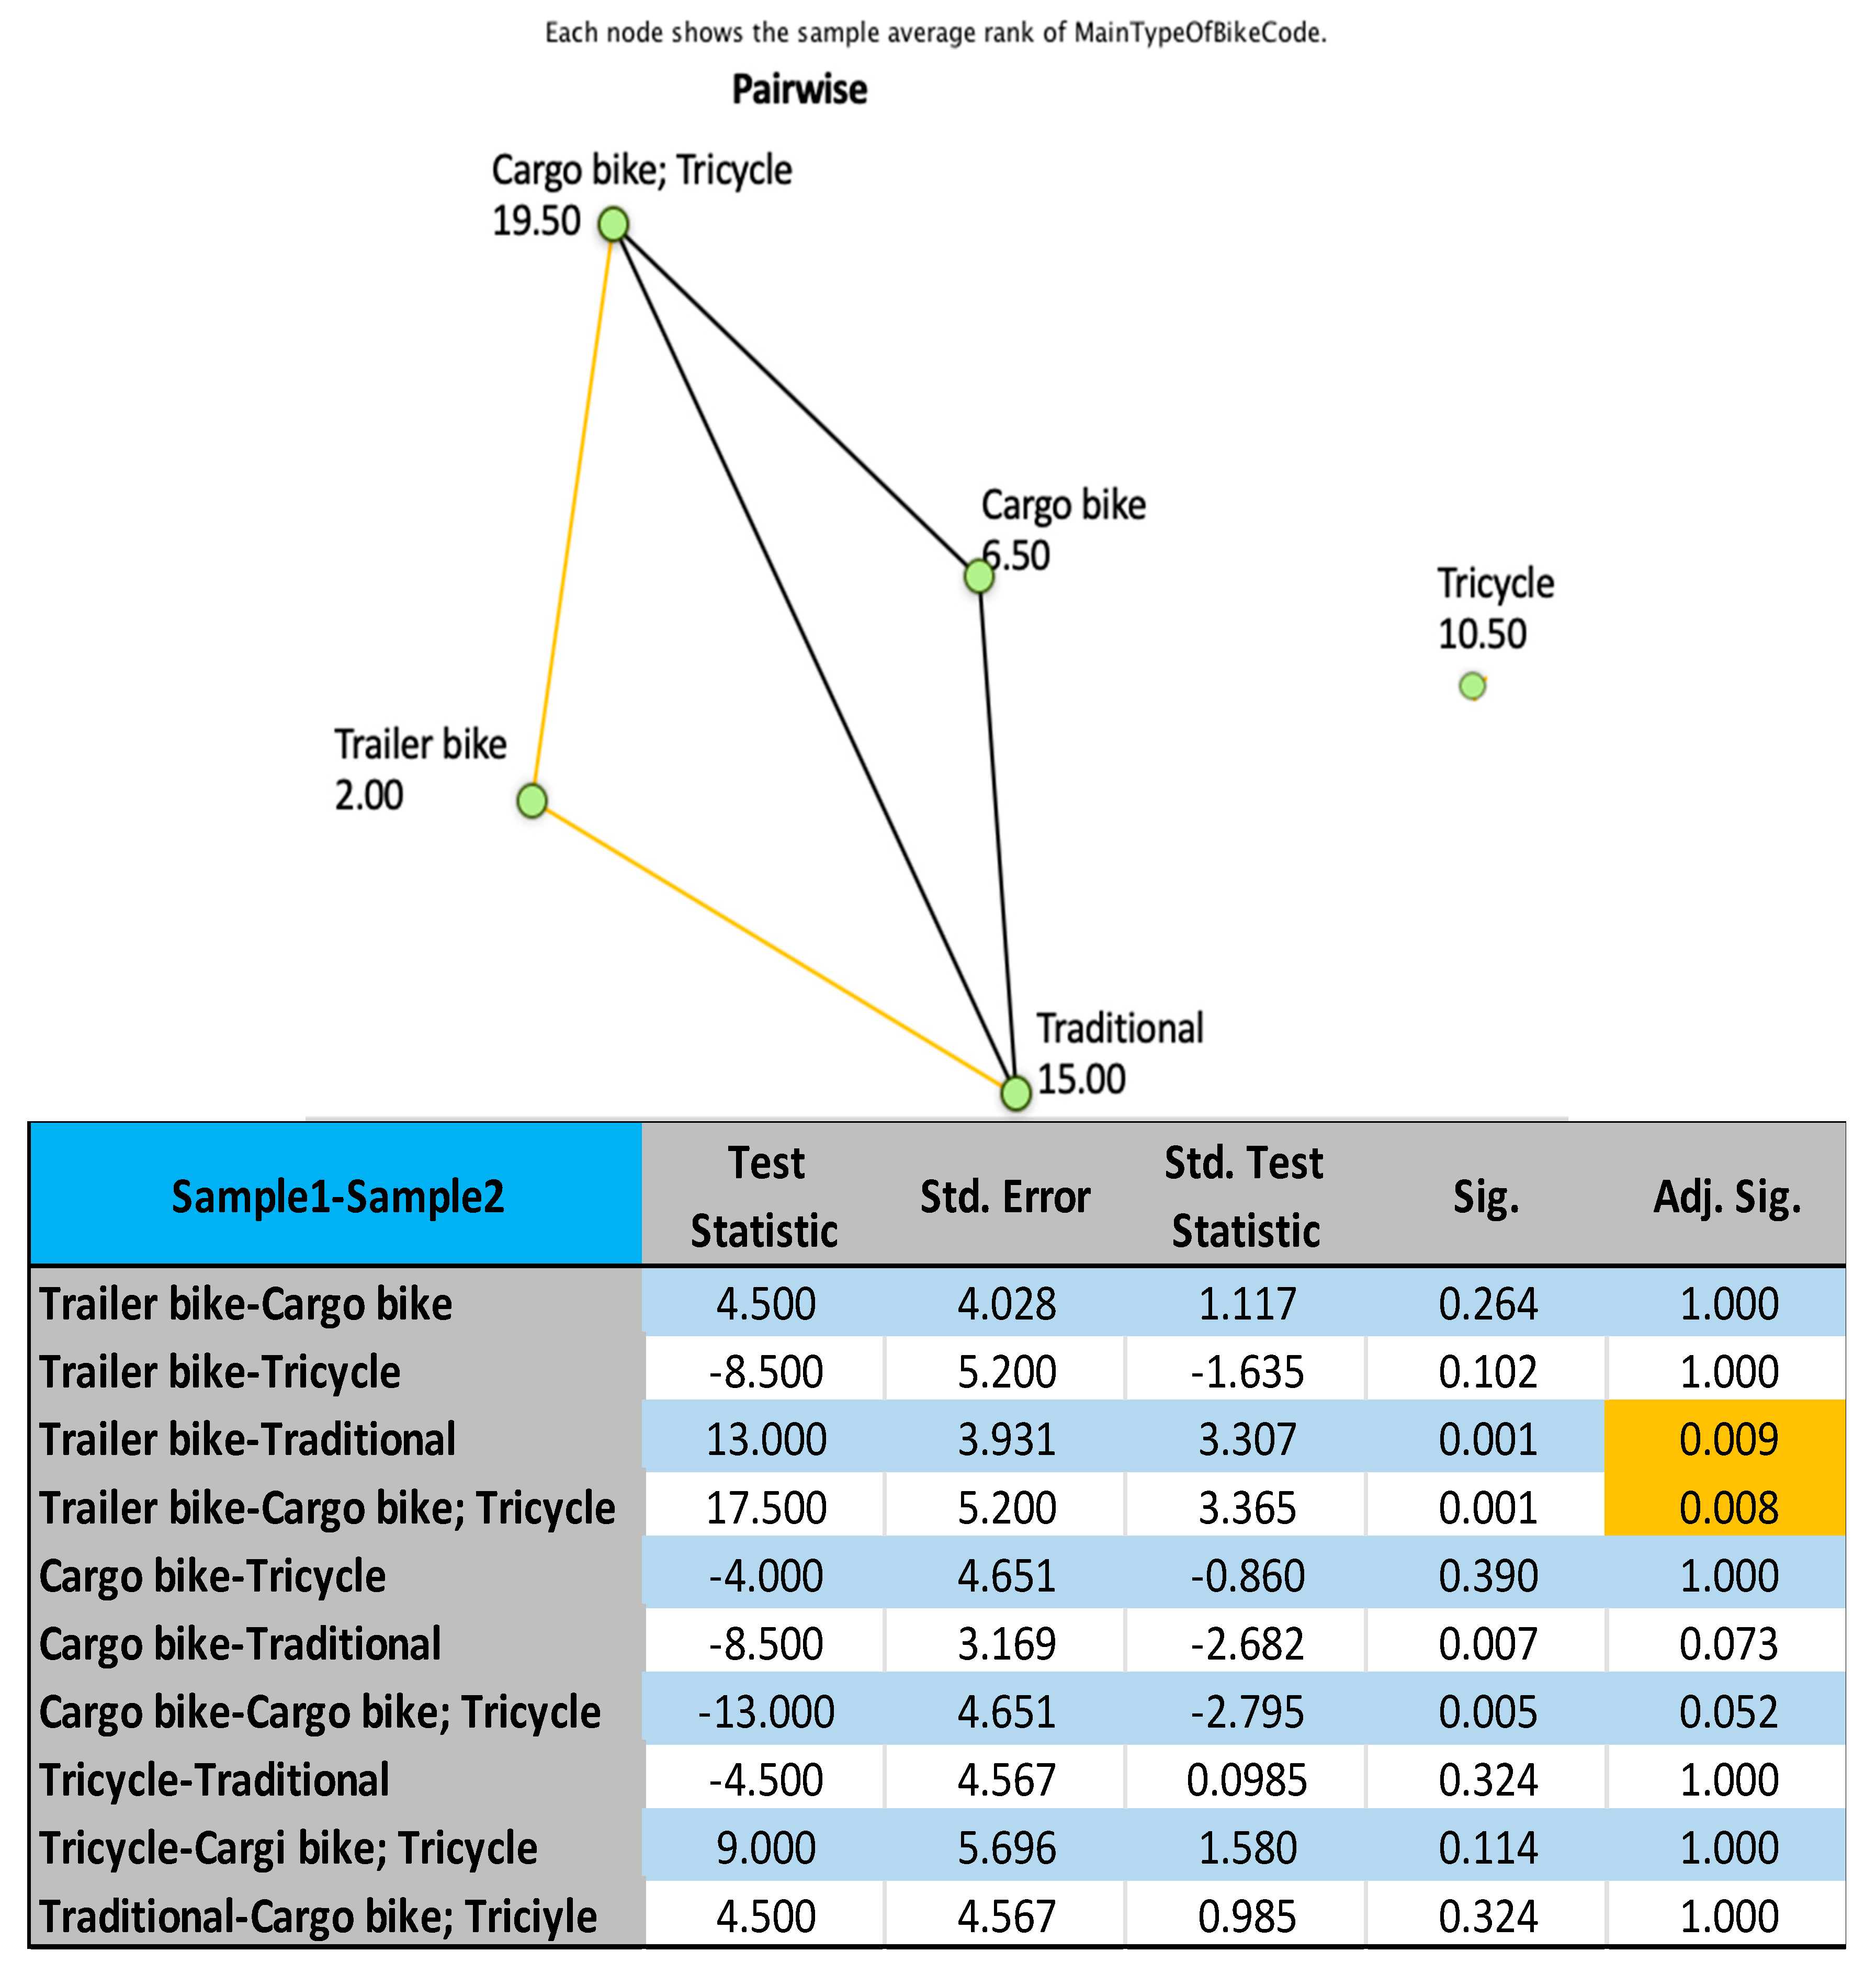
4.2. Discussion on the Statistical Tests of H3 and H4

In the following, statistical results concerning our research hypotheses on categories of main type of bike are discussed. In particular, such hypotheses—which are negatives of the null ones reported in Table 8b—state that:
Hypothesis 3 (H3).
The profit distribution varies across categories of bike model.
Hypothesis 4 (H4).
The profitability distribution varies across categories of bike model.
As a first remark, both profit and profitability distributions vary across categories of main type of bike (Table 8b). In this case, multiple comparisons were performed because the overall test does show significant differences across such categories.
In detail, the statistical analysis proves how profit and profitability distributions change according to the main type of bike utilized in cycle logistics projects and, thus, recognizes that some bike models have a relevantly higher impact than others on the likelihood of success of bike delivery businesses. Multiple comparisons concerning profit and profitability distributions across categories of the project-specific variable have been performed in order to understand which types of bike have the most significant impact on profit and profitability. The multiple comparisons have been analyzed by means of adjustment using the Bonferroni correction for multiple tests and they are reported in Figure 2 (concerning profit) and Figure 3 (concerning profitability).
In Figure 2, the pairwise comparison for profit shows the highest value for the node representing projects using contemporarily cargo bikes and tricycles. Note that this result is coherent with the data reported in Table 5, where the mean values associated with the two bike models used together are the highest ones for profit and also for profitability. Hence, that appears to be the best modal configuration. Furthermore, tricycles and cargo bikes taken separately prove to have a relatively significant impact on the profit variable and to generate relatively high values for both profit and profitability. By contrast, traditional or trailer bikes seem to not to provide such a relevant impact on profit, even though traditional bikes have a profitability mean value higher than the overall average in Table 5. On the contrary, if we analyze the paired use of different modal configurations, trailer bikes combined with big-sized bike models—i.e., either cargo bikes or tricycles or both of them—appear to be the best matched choice. In particular, trailer bikes combined with cargo bikes and/or tricycles seem to broadly cover the whole demand span. In fact, such configurations of paired bike models can satisfy altogether the delivery needs of different goods—i.e., small- to big-sized—and cope flexibly with different topological features and network shapes at the same time. As further proof, the trailer–tricycle–cargo bike configuration including all those types of bikes is the one having the highest impact on profit distribution among the three significant configurations in Figure 2. In fact, it covers a more extended demand span than either the trailer–tricycle or trailer–cargo bike configurations.
In Figure 3, the pairwise comparison for profitability shows the two highest values for those nodes representing projects exploiting cargo bikes and tricycles together as well as those adopting traditional bikes. Again, note that this result is coherent with the data reported in Table 5, where the mean values associated with the two bike models used together are the highest ones for profitability and also for profit. Analogously, traditional bikes have one of the highest values in terms of average profitability in Table 5. Hence, those appear to be the best modal configurations. The node representing tricycles, taken separately, has a relatively high value as well, but the possible matches with other modal solutions do not show statistical significance. Similarly, in Table 5, tricycles alone generate the highest mean value in terms of profit, as well as a profitability level above the overall average. On the contrary, the paired use of different modal configurations shows how trailer bikes are the most flexible bike model since they can be fruitfully combined with either traditional bikes or cargo bikes and tricycles. The significant impact on profitability shown by trailer bikes together with cargo bikes and tricycles could be explained by the broader coverage of the whole demand span, since those matched bike models satisfy the delivery needs of heterogeneously sized goods, similarly to data concerning the profit variable (Figure 2) already discussed. On the other hand, trailer and traditional bikes together also significantly affect profitability. In this case, it is worth mentioning that those bike models imply quite a low cost (Table 2a) in terms of purchase, maintenance and insurance. Moreover, they require quite a short time for goods delivery due to the high ease of driving and parking, low load capacity and high average speed in cities. Those features characterizing both trailer and traditional bikes prove how they allow efficient use of resources, thus justifying the significant performance in terms of profitability in Figure 3.

5. Conclusions

This paper proposes a comprehensive study on cycle logistics projects in Europe, focusing on their characteristics and policies and subsequent economic impacts. Such a Europe-wide perspective is one of the key contributions of this work. In fact, to the best of our knowledge, the existing literature includes only studies limited to urban, regional and national contexts. Hence, the cross-national dimension is missing, and as a consequence, the possible comparison of policies and their impact on cycle logistics solutions is poorly explored so far.
As a first remark, all of the 50 initiatives analyzed in our work are successful. This means that the overall European scenario is favorable to the start-up and development of cycle logistics projects. In fact, the data analysis performed clearly suggests that cycle logistics can generate both high profit and profitability levels. This result is coherent and further reinforced by other studies proving analogous advantages, not only from an economic perspective but also in terms of public health, environment, quality of life, etc. [4,6,8,9,10,21,22,23,24,25,26,27,33,40,42,76,80,82,83,84,85,90,91,113,114,115,116,117,118,119,120,121,122,123].
As for the area- and country-specific policies and factors, none of them have an impact more significant than the others on the likelihood of success of cycle logistics projects. A deeper analysis of such a finding leads to a threefold understanding. Firstly, a sound interpretation of this statistical result is that cycle logistics projects achieve comparably relevant profit and profitability levels in Europe, regardless of the specific factors and policies implemented in each country or area. Hence, there are no clearly superior policies compared to each other. Secondly, all of the different area- and country-specific factors and policies throughout Europe foster the economic performance of those projects in terms of profit and profitability. Thirdly, for each area, it is proven that the corresponding factors and policies are beneficial to cycle logistics projects, and hence, they should be kept in order to generate the same benefits also for future initiatives in the same geographical area. Finally, for each area in Table A1 and Table A2 in the Appendix A and Appendix B, we summarize those success factors and supporting policies which we recommend to maintain.
On the contrary, profit and profitability results vary significantly depending on the main type of bike utilized in the European projects at hand. This means that the project-specific bike model affects the economic performance of different cycle logistics solutions. In particular, profit is strongly, positively affected by the adoption of cargo bikes or tricycles taken separately and even more by their combined use. Furthermore, trailer bikes are positively associated with profit performance when paired with cargo bikes and/or tricycles. A possible interpretation concerns the higher demand coverage of a trailer–tricycle–cargo bike configuration compared with other bike models combined together, especially in terms of different sizes of the delivered goods. In fact, the transport of both small- and big-sized goods contributes to the achievement of high volumes and market shares and, in turn, of positive economic performances at large. As for profitability, the two solutions that showed the highest impacts on it are (1) the combination of cargo bikes and tricycles and (2) traditional bikes. Trailer bikes also show a significant impact on profitability when they are associated with either traditional bikes or cargo bikes and tricycles. Again, a possible explanation for the significance of trailer–tricycle–cargo bike configurations lies in the possibility of delivering heterogeneously sized goods. On the contrary, the paired use of trailer and traditional bikes has a significant impact on profitability because of the low costs and low delivery time concerning such bike models (Table 2a).
Hence, the findings clearly prove that cycle logistics projects in Europe achieve high profit and profitability levels, and the current policies are generally working well and supporting them. Moreover, profit and profitability vary across the bike models utilized. In fact, mixing cargo bikes and tricycles generates the highest profit and profitability, whilst a trailer–tricycle–cargo bike mix paves the way for high volumes and market shares.
From the methodological perspective, a twofold original contribution is claimed, since the overall approach provides a well-structured research method geared to identify relevant policies and success factors. Firstly, our literature review has covered studies focusing on cycle logistics from a global perspective, thus broadening the traditional methodological approach based on research conducted in a local or national context. Furthermore, studies about some relevant factors concerning active travel behavior and private use of bikes have been considered in order to reduce the likelihood of erroneously overlooking potentially relevant elements. Hence, the overall set of area- and country-specific aspects captured through this enlarged view is more complete than in previous studies. Secondly, the widely different and partly overlapping nature of the resulting factors and policies called for grouping them into categories. Then, such categories were tested against profit and profitability distributions. As a result, each category in Table 1a,b includes at least one factor or policy from project experiences run in Europe. Hence, it is worth mentioning that the statistical analysis embracing also non-European contexts enriched the overall set of factors and policies captured but did not significantly affect results and conclusions on area- and country-specific aspects concerning European projects.
This paper also has some limitations and gives room to future scenarios at the same time. First, it has been developed by using available data on 50 European projects and by normalizing the dataset in order to analyze and compare metrics homogeneously. A larger set of projects and corresponding data at both European and global levels are not available to date, but it would be useful to create and exploit some datasets in future research efforts. This way, researchers would be able to conduct more detailed analyses and to obtain a deeper understanding on cycle logistics at large. Second, statistical tests were conducted on European projects. A global analysis of cycle logistics experiences would also be beneficial in order to capture additional aspects and data to be further introduced into the research area. Third, this study does not compare bikes for goods delivery with other transportation means. We suggest that such a comparison should be included in the research agenda of future studies.
In conclusion, this work has implications for policy makers, managers and researchers. In fact, policy makers may use the results of this research in order to design and implement specific policies adopted in analogous areas or countries where context-dependent factors apply. This way, they could support cycle logistics projects within a consolidated framework of working policies, especially at the European Commission level. Moreover, managers of public projects as well as private firms may exploit the analysis conducted in order to design and implement successful projects. In particular, they may take into account those results related to the best bike model configuration and make decisions accordingly. Finally, researchers may exploit a new and consolidated approach and statistical results in order to conduct even more comprehensive and advanced studies on cycle logistics projects, thus overcoming the narrow local or national dimension. From this perspective, this work may give a relevant contribution in order to pave the way for future research efforts on cycle logistics.

Author Contributions

Conceptualization, C.G.; methodology C.G.; software, C.G., R.M., and R.P.; validation, C.G., R.M., and R.P.; formal analysis, C.G.; investigation, C.G., R.M., and R.P.; resources, C.G., R.M., and R.P.; data curation, C.G., R.M., and R.P.; writing—original draft preparation, C.G.; writing—review and editing, C.G., R.M., and R.P.; visualization, C.G.; supervision, C.G.; project administration, C.G.; funding acquisition, R.M. All authors have read and agreed to the published version of the manuscript.

Funding

This research received no external funding.

Institutional Review Board Statement

Not applicable.

Informed Consent Statement

Not applicable.

Data Availability Statement

Data are contained within the article.

Conflicts of Interest

The authors declare no conflict of interest.

Appendix A

Table A1. Success factors by area and country.
Area °Country *Success Factor
UK and IrelandUK
  • Good communication (perception, awareness)
  • Health benefit perception
  • Ownership model
  • Favorable socio-demographic status at large
  • Favorable safety perception
  • Favorable weather
  • Favorable urban density
Ireland
  • Accessibility
  • Health benefit perception
  • Favorable urban density
  • Travel cost reduction
  • Travel infrastructure cost reduction
  • Traffic level reduction
  • Commitment towards energy savings
  • Commitment towards pollution reduction
  • Perception of safety and security level increased
  • Favorable weather
  • Behaviors and attitudes of local road users
  • Gender factor (fostering female commuting)
  • Favorable socio-demographic status at large
  • Journey distance
  • Ownership model
UK—Scotland
  • Suitable age of targeted users, attitude and ability
  • Favorable socio-demographic status at large
  • Favorable urban density
  • Favorable weather
  • Low risk/high safety perception
  • Health benefit perception
  • Compatibility with family and household responsibilities
  • Significant income
  • Ownership model
  • Perception of active travel as the normal means of travel in cities
  • Short distance to customers for commercial deliveries
Greece, Italy and Mediterranean islandsGreece
  • Age (young users are more likely to be eco-cyclists than others)
  • Gender (women are more likely to be eco-cyclists than men)
  • Income (low income encourages active travel)
Italy
  • Suitable size and weight of goods compared to load capacity of cargo bikes
  • Relevance of time windows for the delivery
  • Positive impacts on Brand Image and Corporate Social Responsibility
  • Cost reduction
  • Availability of a supporting network
  • Reliability of enabling technologies
  • Reduced time for private and commercial journeys
  • Lower energy consumption
  • Lower congestion and emissions
  • High service quality and coverage
  • Better quality of life for citizens (not only users)
  • Short charging time for goods
  • Sufficient battery duration of e-vehicles
ScandinaviaDenmark
  • Sufficient safety perception
  • Availability of water, woods and overwhelming natural landscapes on the road
  • Closeness to home
Central EuropeGermany
  • Short, local trips (below 2-km threshold)
  • Closeness to relevant centers
  • Closeness to relevant services, economic boroughs, schools, etc.
  • Compatible demographic status, cultural inclination, professional practice and attitudes towards a modal shift from customers, firms and messengers
  • Favorable price and sufficient market conditions (demand patterns, etc.)
  • Availability of information
  • Sufficient technological conditions (battery duration, electric range)
  • Combination of technical innovations and new concepts/configurations of urban mobility systems associated with urban micro-consolidation centers
  • Reduced driver fatigue through e-cargo bike adoption
  • Improved range through e-cargo bike adoption
  • Improved payload through e-cargo bike adoption
The Netherlands
  • Short, local trips (below 3.5-km threshold)
  • Attitude culturally entrenched
France
  • Combination of technical innovations and new concepts/configurations of ur-ban mobility systems associated with urban micro-consolidation centers
  • Reduced driver fatigue through e-cargo bike adoption
  • Improved range through e-cargo bike adoption
  • Improved payload through e-cargo bike adoption
  • Compatible demographic status, cultural inclination, professional practice and attitudes towards a modal shift from customers, firms and messengers
  • Favorable price and sufficient market conditions (demand patterns, etc.)
  • Availability of information
  • Sufficient technological conditions (battery duration, electric range)
Australia and the USAAustralia
  • Increasing acceptance vs. adverse reaction to helmet compulsoriness
  • Distance from work or school
  • Income levels
  • Variety-seeking
  • Buffer solutions
  • Independence, refusal of compulsory measures, policies, etc.
  • Cost of mandatory helmet (purchasing or always carrying it)
  • Weather
USA
  • Educational status of individuals and families
  • Health benefit perception
  • Low income is positively linked
  • Features of suitable e-cargo bike for American cities
  • Variety-seeking
  • Buffer solutions
  • Independence, refusal of compulsory measures, policies, etc.
  • Cost of mandatory helmet (purchasing or always carrying it)
  • Weather
AsiaMalaysia
  • Individual needs and values (recreation, door-to-door, minimized waiting times and stops, health and environmental benefits)
  • Aesthetics
  • “Donut-cake” population distribution
  • Demographic factors (age, residential density)
  • Topographic and spatial factors (waterways, ocean, lakes, hills, flats, industrial and residential areas, schools, hospitals, economic districts)
  • Environmental factors (climate, temperature, tropical rainforests, rain, humidity)
Japan
  • Age—i.e., elderly drivers, cyclists and pedestrians’ behaviors, skills and (for cyclists and pedestrians) possession of driving license
  • Hazardous inclination of elderly people
  • Availability and reliability of safety devices
Developing countriesIndia
  • Lowering costs for low income citizens
  • Giving citizens free access
  • High benefit for low income citizens
  • Safety perception
  • Use of telecommunication technology as a substitute for physical transport
  • “Time pollution”
  • Accident, crimes, arsons
  • Drivers’ behavior, training and skills
  • Gender issues
  • Social and full cost of transportation systems
° In this paper, “Central Europe” includes only continental European countries and excludes the Italian peninsula, Greece, the Balkans and the Scandinavian peninsula. * The list of countries for each area includes only those with dedicated relevant data, but is not limited to them as some data concern the whole area and are not attributable to a single country in it.

Appendix B

Table A2. Supporting policies by geographical area and country.
Area °Country *
(Policy Program)
Supporting Policy
UK and IrelandUK
  • Campaigns on public health benefits for individuals and NHS
  • Suitable regulation
  • Traditional good public transport system in cities centers
  • Urban infrastructures adverse to car use/for non-motorized travel in cities centers and land use at large
  • Incentives to logistics companies using cargo bikes in urban contexts
  • Incentives to new adopters (with social and economic support programs)
  • Disincentives to car use
  • Educating motorists to pay more attention to other road users
  • Making cycling and walking risk-free
Ireland
(Agreed Program for Government between Fianna Fàil and the Progressive Democrats, etc.)
  • Campaigns on individual and societal benefits
  • Urban infrastructures adverse to car use/for non-motorized travel in cities centers and land use at large
  • Disincentives to motorized travel behavior
  • Favoring safety experiences of cyclists in urban contexts
  • Availability of infrastructures, facilities and operating systems
  • Women-specific supporting policies
UK—Scotland
  • Backing of intermodal systems
  • Urban infrastructures adverse to car use/for non-motorized travel in cities centers and land use at large
  • Suitable road network
Greece, Italy and Mediterranean islandsGreece; Malta
(Master Plan for the restructuring of the road network, etc.)
  • Reducing the use of motorized vehicles
  • Traffic reduction
Italy
  • Backing pilots on e-vehicles in inner cities
  • Emphasizing environmental and social effects of e-vehicles in inner cities
  • Incentives to adopt e-vehicles and re-use of public facilities entrusted to logistics companies
ScandinaviaDenmark; Norway
(National Transport Plan, etc.)
Finland
(Cycling and Walking Policy Programs, etc.)
  • Availability of safe infrastructures
  • Availability of parking facilities
  • Availability of walking and cycling routes
  • Availability of active travel-specific features in urban green spaces more than just creating such areas per se
  • Increase safety
  • Increase appeal
  • Pollution reduction
  • Distribution of urban green spaces (suitable distance between and size of them)
  • Accessibility of public open spaces
Central EuropeGermany
(National Cycling Plan:
“Ride Your Bike”, etc.)
  • Accessibility to (non-motorized) e-vehicle choice in inner-city courier shipments
  • Increased safety
The Netherlands
(Dutch Bicycle Master Plan, etc.)
Slovakia
(National Action Plan of Environment and Health, etc.)
Slovenia
(National Cycling Network Development Strategy, etc.)
Switzerland
(Mission statement for human powered mobility, etc.)
Hungary
(Position of cycle traffic and main directions of its development in Hungary, etc.)
Latvia
(Cycle Transport Development State Program for 1999–2015, etc.)
  • High accessibility to (non-motorized) vehicle choice
  • Highly subsidized accessibility
  • Accidents and deaths reduction
  • Pollution reduction
  • Availability of infrastructures
  • Increased health benefits and physical activity of citizens
  • Increased cycle tourism
  • Cooperation with EU countries to create a EuroVelo (European Cycle Route network)
  • Increased safety
France
  • Incentives to commute by bike
Australia and the USAAustralia
  • Availability of open spaces
  • Well-distributed parks and green spaces in cities
  • Closeness to home and to other parks
  • Size and number of public areas
  • Incentives to bike sharing solutions
USA
  • Availability of open spaces
  • Well-distributed parks and green spaces in cities
  • Closeness to home and to other parks
  • Size and number of public areas
AsiaMalaysia
(Vision 2020)
  • Inclusion in the national agenda and Vision 2020
  • Spread and availability of dedicated infrastructures
  • Backing of multimodal transport systems
  • Removal of physical and socio-economic barriers
  • Integration of cycling in the design of transportation networks
  • Reversal of the current priority policies (incentivizing, ensuring priority to cyclists, excluding them from turning or one-way direction constraints, improving quality of life, etc.)
Japan
  • Inclusion in the national agenda
  • Active safety policies implemented (“crash severity mitigation systems”, camera- and sensor-based “collision damage mitigation braking systems”)
Developing countriesIndia
  • Focus of policy makers in the political agenda
  • Ensuring environmental justice
  • Ensuring equity and citizen involvement in decision-making
  • Suitable topological features and network shape (accessibility, growth potential, flexibility, density, zoning strategies, comfort, directness of routes, speed potential, lane width, vehicle occupancy rate, etc.)
  • Road conditions, infrastructures and investments
° In this paper, “Central Europe” includes only continental European countries and excludes the Italian peninsula, Greece, the Balkans and the Scandinavian peninsula. * The list of countries for each area includes only those with dedicated relevant data, but is not limited to them as some data concern the whole area and are not attributable to a single country in it.

References

  1. Grimm, N.B.; Faeth, S.H.; Golubiewski, N.E.; Redman, C.L.; Wu, J.; Bai, X.; Briggs, J.M. Global change and the ecology of cities. Science 2008, 319, 756–760. [Google Scholar] [CrossRef] [Green Version]
  2. Russo, F.; Comi, A. A classification of city logistics measures and connected impacts. Procedia Soc. Behav. Sci. 2010, 2, 6355–6365. [Google Scholar] [CrossRef]
  3. Shaheen, S.; Guzman, S.; Zhang, H. Bikesharing in Europe, the Americas, and Asia. Transp. Res. Rec. 2010, 2143, 159–167. [Google Scholar] [CrossRef] [Green Version]
  4. Mat Yazid, M.R.; Ismail, R.; Atiq, R. The use of non-motorized for sustainable transportation in Malaysia. Procedia Eng. 2011, 20, 125–134. [Google Scholar] [CrossRef] [Green Version]
  5. European Commission. Living Well, Within the Limits of Our Planet. 7th EAP—The New General Union Environment Action Programme to 2020. 2014. Available online: http://ec.europa.eu/environment/pubs/pdf/factsheets/7eap/en.pdf (accessed on 29 December 2020).
  6. Fishman, E.; Washington, S.; Haworth, N.; Watson, A. Factors influencing bike share membership: An analysis of Melbourne and Brisbane. Transp. Res. Part A 2015, 71, 17–30. [Google Scholar] [CrossRef] [Green Version]
  7. Schliwa, G.; Armitage, R.; Aziz, S.; Evans, J.; Rhoades, J. Sustainable city logistics–Making cargo cycles viable for urban freight transport. Res. Transp. Bus. Manag. 2015, 15, 50–57. [Google Scholar] [CrossRef] [Green Version]
  8. European Commission. Impact Assessment Accompanying Document to the White Paper: Roadmap to a Single European Transport Area—Towards a Competitive and Resource Efficient Transport System. Available online: https://eur-lex.europa.eu/LexUriServ/LexUriServ.do?uri=SEC:2011:0358:FIN:EN:PDF (accessed on 29 December 2020).
  9. Lawson, A.R.; McMorrow, K.; Ghosh, B. Analysis of the non-motorized commuter journeys in major Irish cities. Transp. Policy 2013, 27, 179–188. [Google Scholar] [CrossRef]
  10. European Commission. Urban Mobility. 2015. Available online: http://ec.europa.eu/transport/themes/urban/urban_mobility/index_en.htm (accessed on 29 December 2020).
  11. Harkey, D.L.; Stewart, J.R. Bicycle and motor vehicle operations on wide curb lanes, bicycle lanes, and paved shoulders. In Proceedings of the 1997 Conference on Traffic Congestion and Traffic Safety in the 21st Century, Chicago, IL, USA, 8–11 June 1997; pp. 139–145. [Google Scholar]
  12. Landis, B.W.; Vattikuti, V.R.; Ottenberg, R.M.; Petritsch, T.A.; Guttenplan, M.; Crider, L.B. Intersection level of service for the bicycle through movement. Transp. Res. Rec. 2003, 1828, 101–106. [Google Scholar] [CrossRef]
  13. Klobucar, M.S.; Fricker, J.D. Network evaluation tool to improve real and perceived bicycle safety. Transp. Res. Rec. 2007, 2031, 25–33. [Google Scholar] [CrossRef]
  14. Parkin, J.; Wardman, M.; Page, M. Models of perceived cycling risk and route acceptability. Accid. Anal. Prev. 2007, 39, 364–371. [Google Scholar] [CrossRef] [Green Version]
  15. Møller, M.; Hels, T. Cyclists’ perception of risk in roundabouts. Accid. Anal. Prev. 2008, 40, 1055–1062. [Google Scholar] [CrossRef]
  16. Sallis, J.F.; Cervero, R.B.; Ascher, W.; Henderson, K.A.; Kraft, M.K.; Kerr, J. An ecological approach to creating active living communities. Annu. Rev. Public Health 2006, 27, 297–322. [Google Scholar] [CrossRef] [Green Version]
  17. Bopp, M.J.; Kaczynski, A.T.; Besenyi, G.M. Active commuting influences among adults. Prev. Med. 2012, 54, 237–241. [Google Scholar] [CrossRef] [PubMed]
  18. Lawson, A.R.; Pakrashi, V.; Ghosh, B.; Szeto, W.Y. Perception of safety of cyclists in Dublin City. Accid. Anal. Prev. 2013, 50, 499–511. [Google Scholar] [CrossRef] [PubMed] [Green Version]
  19. Lachowycz, K.; Jones, A.P. Greenspace and obesity: A systematic review of the evidence. Obes. Rev. 2011, 12, e183–e189. [Google Scholar] [CrossRef] [PubMed]
  20. Schipperijn, J.; Bentsen, P.; Troelsen, J.; Toftager, M.; Stigsdotter, U.K. Associations between Physical activity and characteristics of urban green space. Urban For. Urban Green. 2013, 12, 109–116. [Google Scholar] [CrossRef]
  21. Pooley, C.G.; Horton, D.; Scheldeman, G.; Mullen, C.; Jones, T.; Tight, M.; Jopson, A.; Chisholm, A. Policies for promoting walking and cycling in England: A view from the street. Transp. Policy 2013, 27, 66–72. [Google Scholar] [CrossRef]
  22. NICE-National Institute for Health and Clinical Excellence. Transport Interventions Promoting Safe Cycling and Walking: Evidence Briefing; National Institute for Health and Clinical Excellence: London, UK, 2006. [Google Scholar]
  23. Ogilvie, D.; Foster, C.; Rothnie, H.; Cavill, N.; Hamilton, V.; Fitzsimons, C.; Mutrie, N. Interventions to promote walking: Systematic review. Br. Med. J. 2007, 334, 1204–1207. [Google Scholar] [CrossRef] [Green Version]
  24. DfT—Department for Transport (DfT). Sustainable Travel Guide; DfT: London, UK, 2010.
  25. DfT—Department for Transport (DfT); DoH—Department of Health. Active Travel Strategy; DfT: London, UK, 2010.
  26. Travel Actively: Walking and Cycling for Health and Wellbeing. Available online: https://www.travelactivelydata.org.uk/ (accessed on 29 December 2020).
  27. Silva, A.; Ribero, A. An integrated planning for cities to promote sustainable mobility. In Proceedings of the European Transport Conference, Leiden Leeuwenhorst Conference Centre, Noordwijkerhout, The Netherlands, 5–7 October 2009. [Google Scholar]
  28. Ryley, T.J. Use of non-motorized modes and life stage in Edinburgh. J. Transp. Geogr. 2006, 14, 367–375. [Google Scholar] [CrossRef]
  29. Shove, E. Beyond the ABC: Climate change policies and theories of social change. Environ. Plan. A 2010, 42, 1273–1285. [Google Scholar] [CrossRef] [Green Version]
  30. HoL—House of Lords Science and Technology Select Committee. Behaviour Change Report; TSO: London, UK, 2011; Available online: http://www.publications.parliament.uk/pa/ld201012/ldselect/ldsctech/179/179.pdf (accessed on 29 December 2020).
  31. Zegeer, C. FHWA Study Tour for Pedestrian and Bicyclist Safety in England, Germany, and The Netherlands; US Department of Transportation: Washington, DC, USA, 1994.
  32. Aultman-Hall, L.; Kaltenecker, M.G. Toronto bicycle commuter safety rates. Accid. Anal. Prev. 1999, 31, 675–686. [Google Scholar] [CrossRef]
  33. TfL—Transport for London. Central London Congestion Charging: Sixth Annual Report; TfL: London, UK, 2008. Available online: http://content.tfl.gov.uk/central-london-congestion-charging-impacts-monitoring-sixth-annual-report.pdf (accessed on 29 December 2020).
  34. DoT—Department of Transport. Statement of Strategy: 2003–2005; Department of Transport: Dublin, Ireland, 2003.
  35. Tolley, R. The Greening of Urban Transport: Planning for Walking and Cycling in Western Cities; Belhaven Press: London, UK, 1990. [Google Scholar]
  36. Cervero, R. Mixed land uses and commuting: Evidence from the American Housing Survey. Transp. Res. Part A Policy Pract. 1996, 30, 361–377. [Google Scholar] [CrossRef]
  37. Pucher, J.; Komanoff, C.; Shimek, P. Bicycling renaissance in North America? Recent trends and alternative policies to promote bicycling. Transp. Res. Part A Policy Pract. 1999, 33, 625–654. [Google Scholar] [CrossRef]
  38. Plaut, P.O. Non-motorized commuting in the US. Transp. Res. Part Transp. Environ. 2005, 10, 347–356. [Google Scholar] [CrossRef]
  39. Oliver, M.; Badland, H.; Mavoa, S.; Witten, K.; Kearns, R.; Ellaway, A.; Hinckson, E.; Mackay, L.; Schluter, P.J. Environmental and socio-demographic associates of children’s active transport to school: A cross-sectional investigation from the URBAN Study. Int. J. Behav. Nutr. Phys. Act. 2014, 11, 1–12. [Google Scholar] [CrossRef] [PubMed] [Green Version]
  40. Sardianou, E.; Nioza, E. Who are the eco-bicyclists? Transp. Res. Part D 2015, 34, 161–167. [Google Scholar] [CrossRef]
  41. Sigurdardottir, S.B.; Kaplan, S.; Moller, M.; Teasdale, T.W. Understanding adolescents’ intentions to commute by car or bicycle as adults. Transp. Res. Part D 2013, 24, 1–9. [Google Scholar] [CrossRef] [Green Version]
  42. Nocerino, R.; Colorni, A.; Lia, F.; Luè, A. E-bikes and E-scooters for smart logistics: Environmental and economic sustainability in pro-E-bike Italian pilots. Transp. Res. Procedia 2016, 14, 2362–2371. [Google Scholar] [CrossRef] [Green Version]
  43. Gruber, J.; Ehrler, V.; Lenz, B. Technical potential and user requirements for the implementation of electric cargo bikes in courier logistics services. In Proceedings of the 13th World Conference on Transport Research, Berlin, Germany, 15–18 July 2013. [Google Scholar]
  44. Bedimo Rung, A.L.; Mowen, A.J.; Cohen, D.A. The Significance of Parks to Physical Activity and Public Health: A Conceptual Model. Am. J. Prev. Med. 2005, 28 (Suppl. 2), 159–168. [Google Scholar] [CrossRef]
  45. Public Health Office Copenhagen. Sunde Københavnere i alle Alder–Københavns Kommunes Sundhedspolitik 2006–2010 (Healthy Copenhageners in All Ages–Health Policy of the Municipality of Copenhagen for 2006–2010). Municipality of Copenhagen. 2006. Available online: https://www.kk.dk/sites/default/files/edoc_old_format/Borgerrepraesentationen/12-10-2006%2017.30.00/Dagsorden/24-10-2006%2010.44.52/Kbhs_Kom_Sundhspol_250906.PDF (accessed on 29 December 2020).
  46. Toftager, M.; Ekholm, O.; Schipperijn, J.; Stigsdotter, U.K.; Bentsen, P.; Grønbæk, M.; Randrup, T.B.; Kamper-Jørgensen, F. Distance to green space and physical activity: A Danish national representative survey. J. Phys. Act. Health 2011, 8, 741–749. [Google Scholar] [CrossRef] [Green Version]
  47. Pucher, J. Bicycling boom in Germany: A revival engineered by public policy. Transp. Q. 1997, 51, 31–46. [Google Scholar]
  48. Gruber, J.; Kihm, A.; Lenz, B. A new vehicle for urban freight? An ex-ante evaluation of electric cargo bikes in courier services. Res. Transp. Bus. Manag. 2014, 11, 53–62. [Google Scholar] [CrossRef] [Green Version]
  49. Tfl—Transport for London. Cycle Freight in London: A Scoping Study; Transport for London, Mayor of London: London, UK, 2009. Available online: http://content.tfl.gov.uk/cycle-as-freight-may-2009.pdf (accessed on 29 December 2020).
  50. Dablanc, L. Transferability of Urban Logistics Concepts and Practices from a Worldwide Perspective—Deliverable 3.1—Urban Logistics Practices—Paris Case Study. TURBLOG_WW Project. 2011. Available online: https://trimis.ec.europa.eu/project/transferability-urban-logistics-concepts-and-practices-world-wide-perspective#tab-outline (accessed on 29 December 2020).
  51. Leonardi, J.; Browne, M.; Allen, J. Before-after assessment of a logistics trial with clean urban freight vehicles: A case study in London. Procedia Soc. Behav. Sci. 2012, 39, 146–157. [Google Scholar] [CrossRef] [Green Version]
  52. Fishman, E. The impacts of public bicycle share schemes on transport choice. In Proceedings of the Asia-Pacific Cycle Congress. Brisbane Convention and Exhibition Centre, Brisbane, Australia, 18–21 September 2011. [Google Scholar]
  53. Meddin, R. The Bike-Sharing World: First Days of Summer 2011. 2011. Available online: http://bike-sharing.blogspot.com/search?q=Brisbane (accessed on 29 December 2020).
  54. Rojas-Rueda, D.; De Nazelle, A.; Tainio, M.; Nieuwenhuijsen, M.J. The health risks and benefits of cycling in urban environments compared with car use: Health impact assessment study. Br. Med. J. 2011, 343, d4521. [Google Scholar] [CrossRef] [Green Version]
  55. Alta Bike Share. Melbourne Bike Share Survey; Prepared for VicRoads: Melbourne, Australia, 2011. [Google Scholar]
  56. Fan, J.X.; Wen, M.; Kowaleski-Jones, L. Sociodemographic and environmental correlates ofactive commuting in rural America. J. Rural Health 2014, 31, 176–185. [Google Scholar] [CrossRef] [PubMed]
  57. Mokhtarian, P.L. Travel as a desired end, not just a means. Transp. Res. A 2005, 39, 93–96. [Google Scholar] [CrossRef]
  58. Bassett, D.R., Jr.; Pucher, J.; Buehler, R.; Thompson, D.L.; Crouter, S.E. Walking, cycling, and obesity rates in Europe, North America, and Australia. J. Phys. Act. Health 2008, 5, 795–814. [Google Scholar] [CrossRef] [PubMed]
  59. Shephard, R.J. Is active commuting the answer to population health? Sports Med. 2008, 38, 751–758. [Google Scholar] [CrossRef]
  60. TfL—Transport for London. Travel in London Report 3; Transport for London: London, UK, 2010.
  61. Bopp, M.J.; Kaczynski, A.T.; Wittman, P. The relationship of eco-friendly attitudes with walking and biking to work. J. Public Health Manag. Pract. 2011, 17, 9–17. [Google Scholar] [CrossRef]
  62. Midgley, P. Bicycle-Sharing Schemes: Enhancing Sustainable Mobility in Urban Areas; United Nations: New York, NY, USA, 2011. [Google Scholar]
  63. Kaczynski, A.T.; Bopp, M.J.; Wittman, P. To drive or not to drive: Factors differentiating active versus non-active commuters. Health Behav. Public Health 2012, 2, 14–19. [Google Scholar]
  64. LDA Consulting. Capital Bikeshare 2011 Member Survey Report; LDA Consulting: Washington, DC, USA, 2012. [Google Scholar]
  65. Fishman, E.; Washington, S.; Haworth, N. Bike share’s impact on car use: Evidence from the United States, Great Britain, and Australia. Transp. Res. D 2014, 31, 13–20. [Google Scholar] [CrossRef] [Green Version]
  66. Fischer, C.M.; Sanchez, C.E.; Pittman, M.; Milzman, D.; Volz, K.A.; Huang, H.; Sanchez, L.D. Prevalence of bicycle helmet use by users of public bikeshare programs. Ann. Emerg. Med. 2012, 60, 228–231. [Google Scholar] [CrossRef] [PubMed]
  67. Fishman, E.; Washington, S.; Haworth, N. Barriers and facilitators to public bicycle scheme use: A qualitative approach. Transp. Res. F 2012, 15, 686–698. [Google Scholar] [CrossRef] [Green Version]
  68. Fishman, E.; Washington, S.; Haworth, N. Bike share: A synthesis of the literature. Transp. Rev. 2013, 33, 148–165. [Google Scholar] [CrossRef] [Green Version]
  69. Giles-Corti, B.; Broomhall, M.H.; Knuiman, M.; Collins, C.; Douglas, K.; Ng, K.; Lange, A.; Donovan, R.J. Increasing walking. How important is distance to, attractiveness, and size of public open space? Am. J. Prev. Med. 2005, 28, 169–176. [Google Scholar] [CrossRef] [PubMed]
  70. Kaczynski, A.T.; Potwarka, L.R.; Saelens, B.E. Association of park size, distance and features with physical activity in neighborhood parks. Am. J. Public Health 2008, 98, 1451–1456. [Google Scholar] [CrossRef] [PubMed]
  71. Kaczynski, A.T.; Potwarka, L.R.; Smale, B.J.A.; Havitz, M.E. Association of parkland proximity with neighborhood and park-based physical activity: Variations by gender and age. Leis. Sci. 2009, 31, 174–191. [Google Scholar] [CrossRef]
  72. Le Galès, P.; Zagrodzki, M. Cities Are Back in Town: The US/Europe Comparison. Cahier Européen Numéro 05/06 du Pôle Ville/métropolis/Cosmopolis; Centre d’Etudes Européennes de Sciences Po: Paris, France, 2006. [Google Scholar]
  73. Conway, A.; Fatisson, P.; Eickemeyer, P.; Cheng, J.; Peters, D. Urban micro-consolidation and last mile goods delivery by freight-tricycle in Manhattan: Opportunities and challenges. In Proceedings of the Transportation Research Board 91st Annual Meeting, Washington, DC, USA, 22–26 January 2012. [Google Scholar]
  74. Giuliano, G.; O’Brien, T.; Dablanc, L.; Holliday, K. NCFRP Project 36 Synthesis of Freight Research in Urban Transportation Planning; National Cooperative Freight Research Program: Washington, DC, USA, 2013. [Google Scholar]
  75. Rietveld, P. Biking and Walking: The Position of Non-Motorized Transport Modes in Transport Systems, Tinbergen Institute Discussion Papers 01-111/3; Tinbergen Institute: Amsterdam, The Netherlands, 2001. [Google Scholar]
  76. Litman, T.; Burwell, D. Issues in sustainable transportation. Int. J. Glob. Environ. Issues 2006, 6, 331–347. [Google Scholar] [CrossRef]
  77. EPU-Economic Planning Unit under Malaysia’s Prime Minister’s Department. Vision 2020. 1991. Available online: https://www.epu.gov.my/en (accessed on 29 December 2020).
  78. Richardson, B.C. Sustainable transport: Analysis frameworks. J. Transp. Geogr. 2005, 13, 29–39. [Google Scholar] [CrossRef]
  79. Chapman, L. Transport and climate change: A review. J. Transp. Geogr. 2007, 15, 354–367. [Google Scholar] [CrossRef]
  80. Matsui, Y.; Oikawa, S.; Hitosugi, M. Analysis of carto-bicycle approach patterns for developing active safety devices. Traffic Inj. Prev. 2015, 17, 434–439. [Google Scholar] [CrossRef]
  81. Tada, M.; Okada, M.; Renge, K. An analysis of elderly drivers’, cyclists’ and pedestrians’ behaviors using wearable sensors. Trans. Jpn. Soc. Med. Biol. Eng. 2016, 54, 129–134. [Google Scholar]
  82. Kuzumaki, S. Our approach to a safe sustainable society. J. Soc. Automot. Eng. Jpn. 2009, 63, 11–19. (In Japanese) [Google Scholar]
  83. Shibata, E. Development of driving assist system “EyeSight” by new stereo camera. J. Soc. Automot. Eng. Jpn. 2009, 63, 93–98. (In Japanese) [Google Scholar]
  84. Saneyoshi, K. Recent trends of real-time stereo vision for automobile and application to pedestrian detection. J. Soc. Automot. Eng. Jpn. 2013, 67, 84–89. (In Japanese) [Google Scholar]
  85. Behera, R.; Gangadharan, J.; Kutty, K.; Nair, S.; Vaidya, V. A novel method for day time pedestrian detection. SAE Int. J. Passeng. Cars-Electron. Electr. Syst. 2015, 8, 406–412. [Google Scholar] [CrossRef]
  86. Fazio, J. Nonmotorized-Motorized Traffic Accidents and Conflicts on Delhi Streets. In Transportation Research Record 1487, TRB; National Research Council: Washington, DC, USA, 1995; pp. 68–74. [Google Scholar]
  87. Graham, S.; Marvin, S. Telecommunication and the City; Routledge: London, UK, 1996. [Google Scholar]
  88. Tolley, R. The Greening of Urban Transport, 2nd ed.; John Wiley and Sons: Chichester, UK, 1997. [Google Scholar]
  89. Khisty, C.J. A systemic overview of non-motorized transportation for developing countries: An agenda for action. J. Adv. Transp. 2003, 37, 273–293. [Google Scholar] [CrossRef]
  90. Khisty, C.J.; Zeitler, U. Is Hypermobility a Challenge for Transport Ethics and Systemicity? Syst. Pract. Action Res. 2001, 597–613. [Google Scholar] [CrossRef]
  91. Khisty, C.J.; Ayvalik, C. Automobile Dominance and the Tragedy of the Land-Use/Transport System: Some Critical Issues. Syst. Pract. Action Res. 2003, 53–73. [Google Scholar] [CrossRef]
  92. Maunder, D. Household and Travel Characteristics in Two Residential Areas in New Delhi, India; TRRL. Supplement Report, 673; Department of the Environment: Crowthome, UK, 1981.
  93. Fruin, J.J.; Benz, G.P. Pedestrian Time-Space Concept for Analyzing Comers and Crosswalks. In Transportation Research Record 959, TRB; National Research Council: Washington, DC, USA, 1984; pp. 18–24. [Google Scholar]
  94. Replogle, M.A. Sustainable Transportation Strategies for Third-World Development. In Transportation Research Record 1294, TRB; National Research Council: Washington, DC, USA, 1991. [Google Scholar]
  95. Fruin, J.J. Designing for Pedestrians, Chapter 8. Public Transportation; Gray, G., Hoel, L., Eds.; Prentice Hall: Englewood Cliffs, NJ, USA, 1992. [Google Scholar]
  96. Khisty, C.J. Transportation in Developing Countries: Obvious problems, Possible Solutions. In Transportation Research Record 1396, TRB; National Research Council: Washington, DC, USA, 1993. [Google Scholar]
  97. Whitelegg, J. Transport for a Sustainable Future; Belhaven Press: London, UK, 1993. [Google Scholar]
  98. Taaffe, E.G.; Gauthier, H.L.; O’Kelly, M.E. Geography of Transportation; Prentice Hall: Upper Saddle River, NJ, USA, 1996. [Google Scholar]
  99. Forkenbrock, D.J.; Schweitzer, L.A. Environmental Justice and Transportation Investment Policy; Public Policy Center, University of Iowa: Iowa City, IA, USA, 1997. [Google Scholar]
  100. Tellis, R.; Khisty, C.J. Social Cost Component of an Efficient Toll. In Transportation Research Record 1576, TRB; National Research Council: Washington, DC, USA, 1997. [Google Scholar]
  101. Peters, D. Gender Issues in Transportation: A Short Introduction. In Proceedings of the UNEP Regional Workshop-Deals on Wheels, San Salvador, Salvador, 28–30 July 1999. [Google Scholar]
  102. Mackett, R. Policies to attract drivers out of their cars for short trips. Transp. Policy 2001, 8, 295–306. [Google Scholar] [CrossRef]
  103. Mackett, R. Why do people use their cars for short trips? Transportation 2003, 30, 329–349. [Google Scholar] [CrossRef]
  104. Jarvis, H. Dispelling the myth that preference makes practice in residential location and transport behaviour. Hous. Stud. 2003, 18, 587–606. [Google Scholar] [CrossRef]
  105. Alfonzo, M. To walk or not to walk? The hierarchy of walking needs. Environ. Behav. 2005, 37, 808–836. [Google Scholar] [CrossRef]
  106. Anable, J. ‘Complacent car addicts’ or ‘Aspiring environmentalists’? Identifying travel behaviour segments using attitude theory. Transp. Policy 2005, 12, 65–78. [Google Scholar] [CrossRef] [Green Version]
  107. Cyclelogistics. Cargo Bikes—The Economic Argument. 2011. Available online: http://one.cyclelogistics.eu/docs/113/the_economic_argument_printingmarks_Euro_Pound.pdf (accessed on 29 December 2020).
  108. Cyclelogistics–Moving Europe Ahead–Final Public Report. Available online: http://one.cyclelogistics.eu/docs/117/D6_9_FPR_Cyclelogistics_print_single_pages_final.pdf (accessed on 29 December 2020).
  109. Poliedra-Politecnico di Milano. A New Move for Business. Available online: http://www.poliedra.polimi.it/wp-content/uploads/PROEBIKE_Final-Report_it.pdf (accessed on 29 December 2020). (In Italian).
  110. Siegel, S.; Castellan, N.J. Nonparametric Statistics for the Behavioral Sciences, 2nd ed.; McGraw-Hill: New York, NY, USA, 1988. [Google Scholar]
  111. Copenhagenize. IKEA Idea with Velorbis Bikes. 2008. Available online: http://www.copenhagenize.com/2008/06/ikea-idea-with-velorbis-bikes.html (accessed on 29 December 2020).
  112. MyAmsterdamBike. 2016. Available online: https://myamsterdambike.com/5-businesses-embracing-cargo-bike/ (accessed on 29 December 2020).
  113. Ljung Aust, M.; Jakobsson, L.; Lindman, M.; Coelingth, E. Collision avoidance systems—Advancements and efficiency. In Proceedings of the SAE 2015 World Congress & Exposition, Detroit, MI, USA, 21–23 April 2015. [Google Scholar]
  114. Hess, A.-K.; Schubert, I. Functional perceptions, barriers, and demographics concerning e-cargo bike sharing in Switzerland. Transp. Res. Part D 2019, 71, 153–168. [Google Scholar] [CrossRef]
  115. Fikar, C.; Hirsch, P.; Gronalt, M. A decision support system to investigate dynamic last-mile distribution facilitating cargo-bikes. Int. J. Logist. Res. Appl. 2018, 21, 300–317. [Google Scholar] [CrossRef]
  116. Binetti, M.; Caggiani, L.; Camporeale, R.; Ottomanelli, M. A Sustainable Crowdsourced Delivery System to Foster Free-Floating Bike-Sharing. Sustainability 2019, 11, 2772. [Google Scholar] [CrossRef] [Green Version]
  117. Krause, K.; Assman, T.; Schmidt, S.; Matthies, E. Autonomous driving cargo bikes–Introducing an acceptability-focused approach towards a new mobility offer. Transp. Res. Interdiscip. Perspect. 2020, 6, 100135. [Google Scholar] [CrossRef]
  118. Bielinski, T.; Wazna, A. Electric Scooter Sharing and Bike Sharing User Behaviour and Characteristics. Sustainability 2020, 12, 9640. [Google Scholar] [CrossRef]
  119. Assman, T.; Lang, S.; Müller, F.; Schenk, M. Impact Assessment Model for the Implementation of Cargo Bike Transshipment Points in Urban Districts. Sustainability 2020, 12, 4082. [Google Scholar] [CrossRef]
  120. Sheth, M.; Butrina, P.; Goodchild, A. Measuring delivery route cost trade-offs between electric-assist cargo bicycles and delivery trucks in dense urban areas. Eur. Transp. Res. Rev. 2019, 11, 11. [Google Scholar] [CrossRef] [Green Version]
  121. Becker, S.; Rudolf, C. Exploring the Potential of Free Cargo-Bikesharing for Sustainable Mobility. GAIA 2018, 27, 156–164. [Google Scholar] [CrossRef]
  122. Baum, L.; Assman, T.; Strubelt, H. State of the art—Automated micro-vehicles for urban logistics. IFAC PapersOnLine 2019, 52, 2455–2462. [Google Scholar] [CrossRef]
  123. Rajesh, P.B.; Rajan, A.J. Sustainable Performance of Cargo Bikes to Improve the Delivery Time Using Traffic Simulation Model. FME Trans. 2020, 48, 411–418. [Google Scholar] [CrossRef]
Figure 1. Methodological approach and stages.
Applsci 11 01578 g001
Figure 2. Multiple comparisons of differences concerning profit reported in Table 8b. Each row tests the null hypothesis that the Sample 1 and Sample 2 distributions are the same. Asymptotic significances (2-sided tests) are displayed. The significance level is 0.05. Significance values have been adjusted by the Bonferroni correction for multiple tests.
Applsci 11 01578 g002
Figure 3. Multiple comparisons of differences concerning profitability reported in Table 8b. Each row tests the null hypothesis that the Sample 1 and Sample 2 distributions are the same. Asymptotic significances (2-sided tests) are displayed. The significance level is 0.05. Significance values have been adjusted by the Bonferroni correction for multiple tests.
Applsci 11 01578 g003
Table 1. (a) Success factors by category. (b) Supporting policies by category.
(a) Success Factors Category
Good information, communication
Health benefits
Economic appeal and ownership
Behavioral propensity as a consequence of individual values, needs and socio-demographic variables at large
Perceived safety and security
Favorable weather
Favorable urban density, traffic and distance
Accessibility, availability of infrastructures, services and enabling technologies
Environmental and energy consumption benefits
(b) Supporting Policies Category
Communication policies
Regulatory policies
Public transport policies
Architectural and infrastructural policies
Safety policies
Economic policies
Environmental policies
Table 2. (a) Project-specific factors (sources: [107,109] and projects’ websites). (b) Average economic arguments from [108]. (c) Average data on the European cities scenario from [108].
(a)
CountryMain Type of BikeMax. Load (km)Cost of Bike (EUR)Average Speed in Cities (km/h)Ease of DrivingEase of Driving in Adverse ConditionsEase of ParkingDistinctive Size Range of Delivery
UKTrailer bike80250–50020HighHighHighSmall/Medium
UKCargo bike; Tricycle2502000–12,00015HighMedium/LowMediumSmall/Medium
IrelandTrailer bike80250–50020HighHighHighSmall/Medium
IrelandCargo bike802000–500020HighHighHighSmall/Medium/Big
GreeceTraditional4080–30020HighHighHighSmall
ItalyTraditional4080–30020HighHighHighSmall/Medium
ItalyTraditional4080–30020HighHighHighSmall
ItalyTrailer bike80250–50020HighHighHighSmall
ItalyTricycle2503000–12,00015HighMedium/LowMediumBig
ItalyCargo bike802000–500020HighHighHighSmall/Medium/Big
GreeceTraditional4080–30020HighHighHighSmall
GreeceTraditional4080–30020HighHighHighSmall/Medium
GreeceTraditional4080–30020HighHighHighSmall
ItalyTrailer bike80250–50020HighHighHighSmall
ItalyTricycle2503000–12,00015HighMedium/LowMediumBig
ItalyCargo bike802000–500020HighHighHighSmall/Medium/Big
Cross-country
(Denmark, UK)
Traditional4080–30020HighHighHighSmall
Cross-country
(Denmark, UK)
Traditional4080–30020HighHighHighSmall
Cross-country
(Denmark, UK)
Traditional4080–30020HighHighHighSmall
Cross-country
(Denmark, UK)
Traditional4080–30020HighHighHighSmall
The NetherlandsCargo bike802000–500020HighHighHighSmall/Medium/Big
GermanyCargo bike802000–500020HighHighHighSmall/Medium/Big
AustriaCargo bike802000–500020HighHighHighSmall
GermanyCargo bike802000–500020HighHighHighSmall/Medium/Big
AustriaCargo bike802000–500020HighHighHighSmall
FranceCargo bike; Tricycle2502000–12,00015HighMedium/LowMediumSmall/Medium/Big
France, DenmarkTraditional4080–30020HighHighHighSmall
SwitzerlandTrailer bike80250–50020HighHighHighSmall
FranceCargo bike; Tricycle2502000–12,00015HighMedium/LowMediumSmall/Medium/Big
France, DenmarkTraditional4080–30020HighHighHighSmall
FranceCargo bike; Tricycle2502000–12,00015HighMedium/LowMediumSmall/Medium/Big
SpainTricycle2503000–12,00015HighMedium/LowMediumSmall/Medium/Big
HungaryTraditional4080–30020HighHighHighSmall/Medium
(b)
Tangible CostsCargo BikeVan
Set up costs
Purchase costEUR 2483.00EUR 3310 per annum
Running costs
Annual maintenanceEUR 237.00Included in the hire cost
FuelZeroEUR 1334.00 per annum
Excise dutyZeroEUR 201.00 per annum
InsuranceEUR 154.00 per annumEUR 591.00 per annum
Rider/Driver costs
Hourly pay rateEUR 9.60Usually self-employed paid by delivery (EUR 1.59 per delivery)
Intangible costs
Emissions ContributionZero152 g/km CO2
Congestion ContributionMinimal impactAnother vehicle on the road contributing to congestion
NoiseNoneDiesel Clatter
Average speed in city10–12 mph5–15 mph
ParkingNot a problemRestricted (risk of parking ticket)
FlexibilityAccess to restricted areas and cycle pathsRestricted to the road network
Range50 miles per dayUnlimited
Contribution to rider/driver healthRigorous daily workoutSedentary
(c)
Average European city with 240,000 inhabitants and 1,000,000 trips per day
All TripsBicycle, Pedestrian, Public TransportMotor Vehicle TripsMotorized Trips Related to Goods Transport
1,000,000400,000600,000490,000
Among motorized trips related to good transport:Number of trips per dayNumber of trips to shift to bicycle and cargo bikeRelative % of shift within motorized trips related to goods
Motorized trips related to goods transport490,000250,00051%
Delivery100,00025,00025%
Service and business110,00055,00050%
Shopping130,000100,00077%
Leisure90,00040,00044%
Commuter60,00030,00050%
Table 3. Area-/country-specific policy and factor categories, average profit and profitability levels.
AreaProfitability over 5 YearsAverage Estimated Profit/Year (EUR)
UK and Ireland2.4376,225.00
4.08476,945.00
2.4376,225.00
5.29619,060.00
5.29619,060.00
4.08476,945.00
Greece, Italy and Mediterranean islands5.0980,850.00
5.0980,850.00
5.0980,850.00
2.4376,225.00
4.92616,560.00
4.08476,945.00
4.08476,945.00
4.92616,560.00
5.0980,850.00
5.0980,850.00
2.4376,225.00
4.08476,945.00
5.0980,850.00
4.08476,945.00
Central Europe °4.08476,945.00
4.08476,945.00
4.08476,945.00
4.08476,945.00
4.08476,945.00
5.29619,060.00
5.29619,060.00
2.4376,225.00
4.92616,560.00
5.0980,850.00
2.4376,225.00
4.92616,560.00
4.92616,560.00
5.0980,850.00
5.0980,850.00
5.29619,060.00
4.08476,945.00
4.08476,945.00
4.08476,945.00
5.0980,850.00
4.08476,945.00
5.0980,850.00
2.4376,225.00
5.0980,850.00
Cross-area5.0980,850.00
5.0980,850.00
5.0980,850.00
5.0980,850.00
5.0980,850.00
5.0980,850.00
° In this paper, “Central Europe” includes only continental European countries and excludes the Italian peninsula, Greece, the Balkans and the Scandinavian peninsula.
Table 4. Profit and profitability statistics by area-/country-specific policy and factor category.
Area-/Country-Specific Policy CategoryArea-/Country-Specific Factor CategoryProfit StatisticsProfitability Statistics
MeanStd DeviationMeanStd Deviation
UK and IrelandCommunication campaigns;
Well-designed regulation system;
Supporting an integrated public transport system;
Accessibility and availability of infrastructures;
Educating, designing and implementing safety;
Supporting economic measures
390,743.33251,778.48173.931.28
Greece, Italy and Mediterranean islandsCommunication campaigns;
Supporting economic measures
269,889.29232,259.184.400.94
Scandinavia and Central Europe °Communication campaigns;
Supporting economic measures;
Accessibility and availability of infrastructures
Supporting environmental protection measures
363,047.50231,328.934.520.85
Overall-306,423.00234,417.894.420.93
° In this paper, “Central Europe” includes only continental European countries and excludes the Italian peninsula, Greece, the Balkans and the Scandinavian peninsula.
Table 5. Project-specific factors, average profit and profitability levels.
Main Type of BikeProfitProfitability
MeanStd DeviationMeanStd Deviation
Trailer bike76,225.000.002.430.00
Cargo bike476,945.000.004.080.00
Tricycle616,560.000.004.920.00
Traditional bike80,850.000.005.090.00
Cargo bike; Tricycle619,060.000.005.290.00
Overall373,928.00275,273.724.371.05
Table 6. (a) Preliminary analysis of normal distribution hypothesis of area-specific profit and profitability: skewness and kurtosis. (b) Preliminary analysis of normal distribution hypothesis of area-specific profit and profitability: Kolmogorov–Smirnov and Shapiro–Wilk tests.
(a)
Descriptives
StatisticStd. Error
ProfitMean 750,672.7778407,828.85784
95% Confidence Interval for MeanLower Bound−109,770.8996
Upper Bound1,611,116.4551
5% Trimmed Mean 406,373.9198
Median 476,945.0000
Variance 2,993,838,791,115.359
Std. Deviation 1,730,271.30564
Minimum 76,225.00
Maximum 7,622,500.00
Range 7,546,275.00
Interquartile Range 535,710.00
Skewness 4.1170.536
Kurtosis 17.2561.038
ProfitabilityMean 4.31330.23310
95% Confidence Interval for MeanLower Bound3.8215
Upper Bound4.8051
5% Trimmed Mean 4.3637
Median 4.5000
Variance 0.978
Std. Deviation 0.98898
Minimum 2.43
Maximum 5.29
Range 2.86
Interquartile Range 1.01
Skewness −1.0580.536
Kurtosis 0.0391.038
(b)
Tests of Normality
Kolmogorov–Smirnov aShapiro–Wilk
StatisticdfSig.StatisticdfSig.
Profit0.475500.0000.359400.000
Profitability0.240500.0070.794400.001
a Lilliefors Significance Correction.
Table 7. (a) Preliminary analysis of normal distribution hypothesis of project-specific profit and profitability: skewness and kurtosis. (b) Preliminary analysis of normal distribution hypothesis of project-specific profit and profitability: Kolmogorov–Smirnov and Shapiro–Wilk tests.
(a)
Descriptives
StatisticStd. Error
ProfitMean 306,376.750053,249.06184
95% Confidence Interval for MeanLower Bound194,925.1827
Upper Bound417,828.3173
5% Trimmed Mean 301,791.6667
Median 278,897.5000
Variance 56,709,251,742.829
Std. Deviation 238,137.04404
Minimum 76,225.00
Maximum 619,060.00
Range 542,835.00
Interquartile Range 396,095.00
Skewness 0.1460.512
Kurtosis −1.9840.992
ProfitabilityMean 4.39100.21590
95% Confidence Interval for MeanLower Bound3.9391
Upper Bound4.8429
5% Trimmed Mean 4.4500
Median 4.9200
Variance 0.932
Std. Deviation 0.96554
Minimum 2.43
Maximum 5.29
Range 2.86
Interquartile Range 1.01
Skewness −1.2130.512
Kurtosis 0.4130.992
(b)
Tests of Normality
Kolmogorov–Smirnov aShapiro–Wilk
StatisticdfSig.StatisticdfSig.
Profit0.328500.0000.738400.000
Profitability0.258500.0010.767400.000
a Lilliefors Significance Correction.
Table 8. (a) Kruskal–Wallis H test of area-specific factors and policies. (b) Kruskal–Wallis H test of project-specific factors.
(a) Hypothesis Test Summary
Null Hypothesis (H0i) Challenging the Corresponding i-th Hypothesis (Hi)TestSig.Decision
H01 vs. H1The distribution of profit is the same across categories of areaIndependent Samples Kruskal–Wallis Test0.151Retain the null hypothesis
H02 vs. H2The distribution of profitability is the same across categories of areaIndependent Samples Kruskal–Wallis Test0.828Retain the null hypothesis
(b) Hypothesis Test Summary
Null Hypothesis (H0i) Challenging the Corresponding i-th Hypothesis (Hi)TestSig.Decision
H03 vs. H3The distribution of profit is the same across categories of main type of bikeIndependent Samples Kruskal–Wallis Test0.001Reject the null hypothesis
H04 vs. H4The distribution of profitability is the same across categories of main type of bikeIndependent Samples Kruskal–Wallis Test0.001Reject the null hypothesis
Asymptotic significances are displayed. The significance level is 0.05.
Publisher’s Note: MDPI stays neutral with regard to jurisdictional claims in published maps and institutional affiliations.

