1. Introduction
In recent years, research for photovoltaics development has been oriented towards the search for lower costs and higher conversion efficiencies. One of the fields of investigation concerns the optimal use of the solar spectrum by means of Luminescent Solar Concentrator (LSC). A typical LSC consists of a sheet of transparent material (generally polymeric matrix as PolyMethylMethAcrylate (PMMA)) where luminescent particles are homogeneously dispersed. The luminescent particles can selectively absorb the solar radiation and re-emit the energy absorbed at longer wavelengths, where PhotoVoltaic (PV) cells exhibit the highest efficiency. Therefore, the light is captured by the larger, planar surface of the slab, and the main part (~75%) of the converted radiation is waveguided in the slab’s plane (thanks to the total internal reflection) and concentrated on the smaller PV cell area on the edges to produce electricity (
Figure 1). This reduces the amount of Silicon cells needed to generate a particular amount of energy and the overall cost of the panel, since the waveguiding material is inexpensive.
The hypothesis of converting the incident solar spectrum into monochromatic light in the LSCs was already proposed at the end of the 1970s, when LSCs based on organic dyes were first introduced as a low-cost technology to enhance the power conversion efficiency (PCE) of PV solar cells through improving their spectral response [
1]. They can collect both diffuse and direct solar radiation, making them a suitable technology to be used in countries where diffuse solar radiation is dominant (more than 50%) such as in northern European countries [
2]. Unlike traditional PV panels, LSCs are transparent and can be made with a wide variety of colors and shapes. Thanks to these characteristics, LSCs can be seen as potential structural energy components in the design of PV windows, skylights, and colored PV panels in building facades, but also of noise barriers, advertisement signs, shelters, agricultural covers, and so on, reducing environmental pollution caused by fossil fuels.
The considerable energy savings achievable by using LSC panels could also have an interesting application in the field of remediation of contaminated sites. Several different physicochemical and biological approaches have been suggested for the remediation of contaminated water [
3,
4,
5] and soils [
6,
7], so that selecting a suitable technology is often a difficult yet crucial step for the successful reclamation of a contaminated site [
8,
9]. However, activities aimed at the remediation of contaminated sites or the treatment of effluents also have an environmental impact, since they make use of chemical products or processes, with consequent consumption of raw materials and energy. In many cases these aspects are not negligible, and could compromise the sustainability of the approach or even invalidate its beneficial aspects. This is the case with the Electro Kinetic Remediation Technology (EKRT) [
10,
11], which has proved particularly interesting and efficient in dealing with various types of contaminations allowing in situ interventions, and demonstrates a more ecological character, compared to other approaches [
12], but suffers from some critical issues including high energy consumption [
13] that require new solutions to confirm the technology as operationally valid.
In light of a growing demand for remediation interventions characterized by high environmental sustainability, there is a considerable request to promote those technologies with a reduced impact on the environment, among which a primary role is attributed to phytoremediation. This term includes a series of technologies based on the use of plants to remediate organic and inorganic contaminants in soil and other environmental matrices (sediments, water). The interest in these phytotechnologies has increased over time, given some significant advantages in their use compared to traditional remediation technologies: low cost, simplicity of operation, environmental benefits. Recent contributions based on Life Cycle Assessment (LCA) comparison of different technologies clearly show the major advantage of phytoremediation in environmental impact and ecological footprint with respect to consolidated technologies or excavation and landfill disposal [
14].
Phytotechnologies fall entirely within the green remediation category [
15], and given their minimal environmental impact, have been proposed as an effective nature-based solution (NBS), as they ensure environmental remediation in a sustainable and economically efficient way [
16,
17].
Phytoremediation includes several decontamination processes; the most used are:
Phytoextraction: process of contaminants extraction (organic and inorganic) from the soil through roots and subsequent translocation and accumulation in plant tissues (roots and shoots);
Phytodegradation: degradation of organic contaminants through plant biochemical processes by the increase in the microbial activity, which promotes the degradation of a contaminant in the soil;
Rhizofiltration: decontamination of polluted water carried out by aquatic plants either floating or submerged which uptake and concentrate, by their roots, the contaminants, removing them from aqueous environments;
Phytostabilization: containment or immobilization of contaminants in the rhizospheric region of plants by adsorption or precipitation preventing the leaching of dissolved contaminants and the aerial dispersion of contaminated soil particles;
Phytovolatilization: adsorption of contaminants by the root system, followed by translocation into the shoots and release into the atmosphere through the leaves’ transpiration process.
Among the various phytotechnologies in contaminated sites, phytoextraction is the most important for the removal of heavy metals. In the last twenty years, several innovative strategies have been developed to maximize the efficiency of the approach, which depends both on the biomass produced and the quantity of metal absorbed by the plants [
18]. These strategies are aimed both to improve the performance of plants by using species with high biomass production and by increasing the bioavailability of contaminants through appropriate soil treatments with additives capable of increasing the concentration of metals in the liquid phase of the soil [
19,
20]. Among these innovative strategies, the possibility of relying on plant growth-promoting bacteria (PGPB) to improve the effectiveness of phytoextraction processes is of particular interest. These beneficial plant bacteria living in close association with roots have several positive effects on plant growth and develop PGPB can significantly contribute to increase plants metal uptake and, consequently, the efficiency and the rate of phytoextraction [
20,
21]. The increase in uptake is often further enhanced by simultaneous addition of metals mobilizing agents such as chelating compounds [
22], to be selected and dosed appropriately in order not to penalize the sustainability of the approach, and possibly monitor with non-invasive approaches to avoid uncontrolled diffusion in the environment [
23].
However, since phytoremediation is a highly site-specific approach, each innovation requires preliminary tests on an increasing scale to verify its effectiveness before full-scale applicability, including the setting up of dedicated greenhouses as a suitable environment for feasibility tests to optimally prepare full-scale interventions [
24]. These increasing-scale trials mostly take place in greenhouses that are subject to considerable costs when they require the maintenance of optimal temperature conditions.
In a controlled environment, it is possible to better study the use of additives that increase the bioavailability of contaminants. The evaluation of the responses to plant stress and all those measures that can have significant positive effects on the efficiency of phytoremediation, particularly root-microorganism interactions, is often crucial to the success of the technology. Proper management of greenhouse conditions (light, temperature, humidity, and irrigation) can considerably improve phytoremediation feasibility tests’ efficiency and speed. In semi-controlled and protected conditions, some obstacles to plant growth can be studied and overcome, such as the reduced biological activity of plants due to seasonality and the bioavailability dynamics of pollutants.
In particular, aim of this study was to provide the information necessary for evaluating the possibility of coupling Luminescent Solar Concentrators with phytoremediation in remediation procedures. Indeed, as the wave-guiding material is semi-transparent and wavelength selective, LSCs could also find promising applications in greenhouse roof panels: by selecting only the light that plants do not use for photosynthesis [
25], it should be possible to produce electricity without penalizing plants growth, or possibly even increase agricultural productivity.
For this purpose, phytoextraction tests were carried out with three plant species (Brassica juncea, Helianthus annuus and Lupinus albus) to assess the effect of LSC panels on plant growth and the absorption capacity of contaminants by plants on a soil polluted by arsenic and lead. Experiments were carried out by comparing plants grown under LSC panels versus plants grown under polycarbonate panels. LSC panels doped with Lumogen Red F305 (BASF) as luminescent dye were used to be evaluated as optical filter and not as a PV device for electricity production. The parameters examined were those essential for a phytoremediation feasibility test:
possibility of plant growth in contaminated soil;
biomass production;
uptake of contaminants by plants;
total removal of pollutants by plants.
This is a highly innovative perspective since, to the best of our knowledge, there are no consolidated studies and results on the use of LSC in the remediation of contaminated sites using phytoremediation technologies, when, due to soil contamination, plants should grow under significant stress conditions.
2. Materials and Methods
2.1. Soil
The soil considered was collected from a former industrial site in Tuscany (Italy) contaminated by lead (Pb) and arsenic (As) arising from manufacturing activities of various chemicals. Soil samples were collected from the 0 to 20 cm layer, air-dried, and sieved through a 2 mm sieve before laboratory analysis. In
Table 1, soil pH was determined in a soil/water ratio of 1:2.5 [
26], cation exchange capacity (CEC) using barium chloride (pH = 8.1) [
27], and texture by the pipette method [
28]. Total nitrogen (N) was determined by the Kjeldahl method [
29], available phosphorus (P) by extraction with sodium bicarbonate [
30], and organic matter by wet combustion [
31].
2.2. Chelating Agents
Plant uptake is mainly influenced by the bioavailable fractions rather than the total amount in the soil. For the highest efficiency in soil phytoextraction, an increased availability of soluble forms of the contaminants is required. Bioavailability depends on the soil characteristics that determine the release of Pb and As in the soil solution and plants ability to uptake and transfer the metals to their tissues.
A high cation exchange capacity (CEC) and alkaline pH reduce Pb mobility and bioavailability. Consequently, in soils contaminated by Pb, phytoextraction has many limitations, deriving from the behavior of the element in the soil environment.
To increase bioavailability, the uptake and translocation of metals, the addition of chelating agents has been extensively used in phytoextraction, with organic acids being particularly effective in increasing the solubility of metals [
32,
33].
For many years, chelating agents have been used to increase plants uptake of micronutrients from the soil. Chelating agents’ action is mainly based on the release of metals from the soil–solid surfaces and the formation of stable metal complexes in soil solution available for plant uptake. In this experimental campaign, Ethylene Diaminete Traacetic Acid (EDTA) was selected being one of the most used chelant, which increases the uptake of several metals, Pb in particular [
34]. Indeed, it was preferred to opt for a well-known and commonly used solution, with positive results in assisted phytoextraction processes, even very recent ones [
35,
36], in order to reduce uncertainty about this factor and focus more attention on the effect of using LSC panels.
2.3. Photosynthetic Process and Selection of Luminescent Dye
In the process of photosynthesis, plants absorb the solar radiation in the range 400–700 nanometers (this range is called Photosynthetically Active Radiation, PAR), primarily using the pigment Chlorophyll, the most abundant in the plant. In addition to chlorophyll, plants also use other pigments belonging to the carotenoid group.
The chlorophyll exists in two forms: chlorophyll
a and chlorophyll
b. Chlorophyll
a shows a strong light absorption in the blue zone of the solar spectrum as well in the red zone; chlorophyll
b absorbs mostly blue and orange light. In contrast, both absorb poorly the green and near-green light, which reflects the typical green color of the leaves. In the near-green zone, the absorption of carotenoids takes place (
Figure 2).
The photosynthetic efficiency (i.e., the fraction of light energy converted into chemical energy during photosynthesis) depends on the wavelength of light. The red light (600–700 nm) is the most efficient; the efficiency increases when coupled to an equal far-red light (700–800 nm). The violet-blue light, even if less efficient (efficiency = 0.65–0.75) [
38], is necessary for photosynthesis because it promotes the development of chloroplasts, where photosynthesis takes place [
39]. A low percent of violet-blue light (~7%) is enough to ensure plants good health [
40]. Outside the visible spectrum, the UV light (200–400 nm) damages the chloroplasts hindering the photosynthetic process [
41].
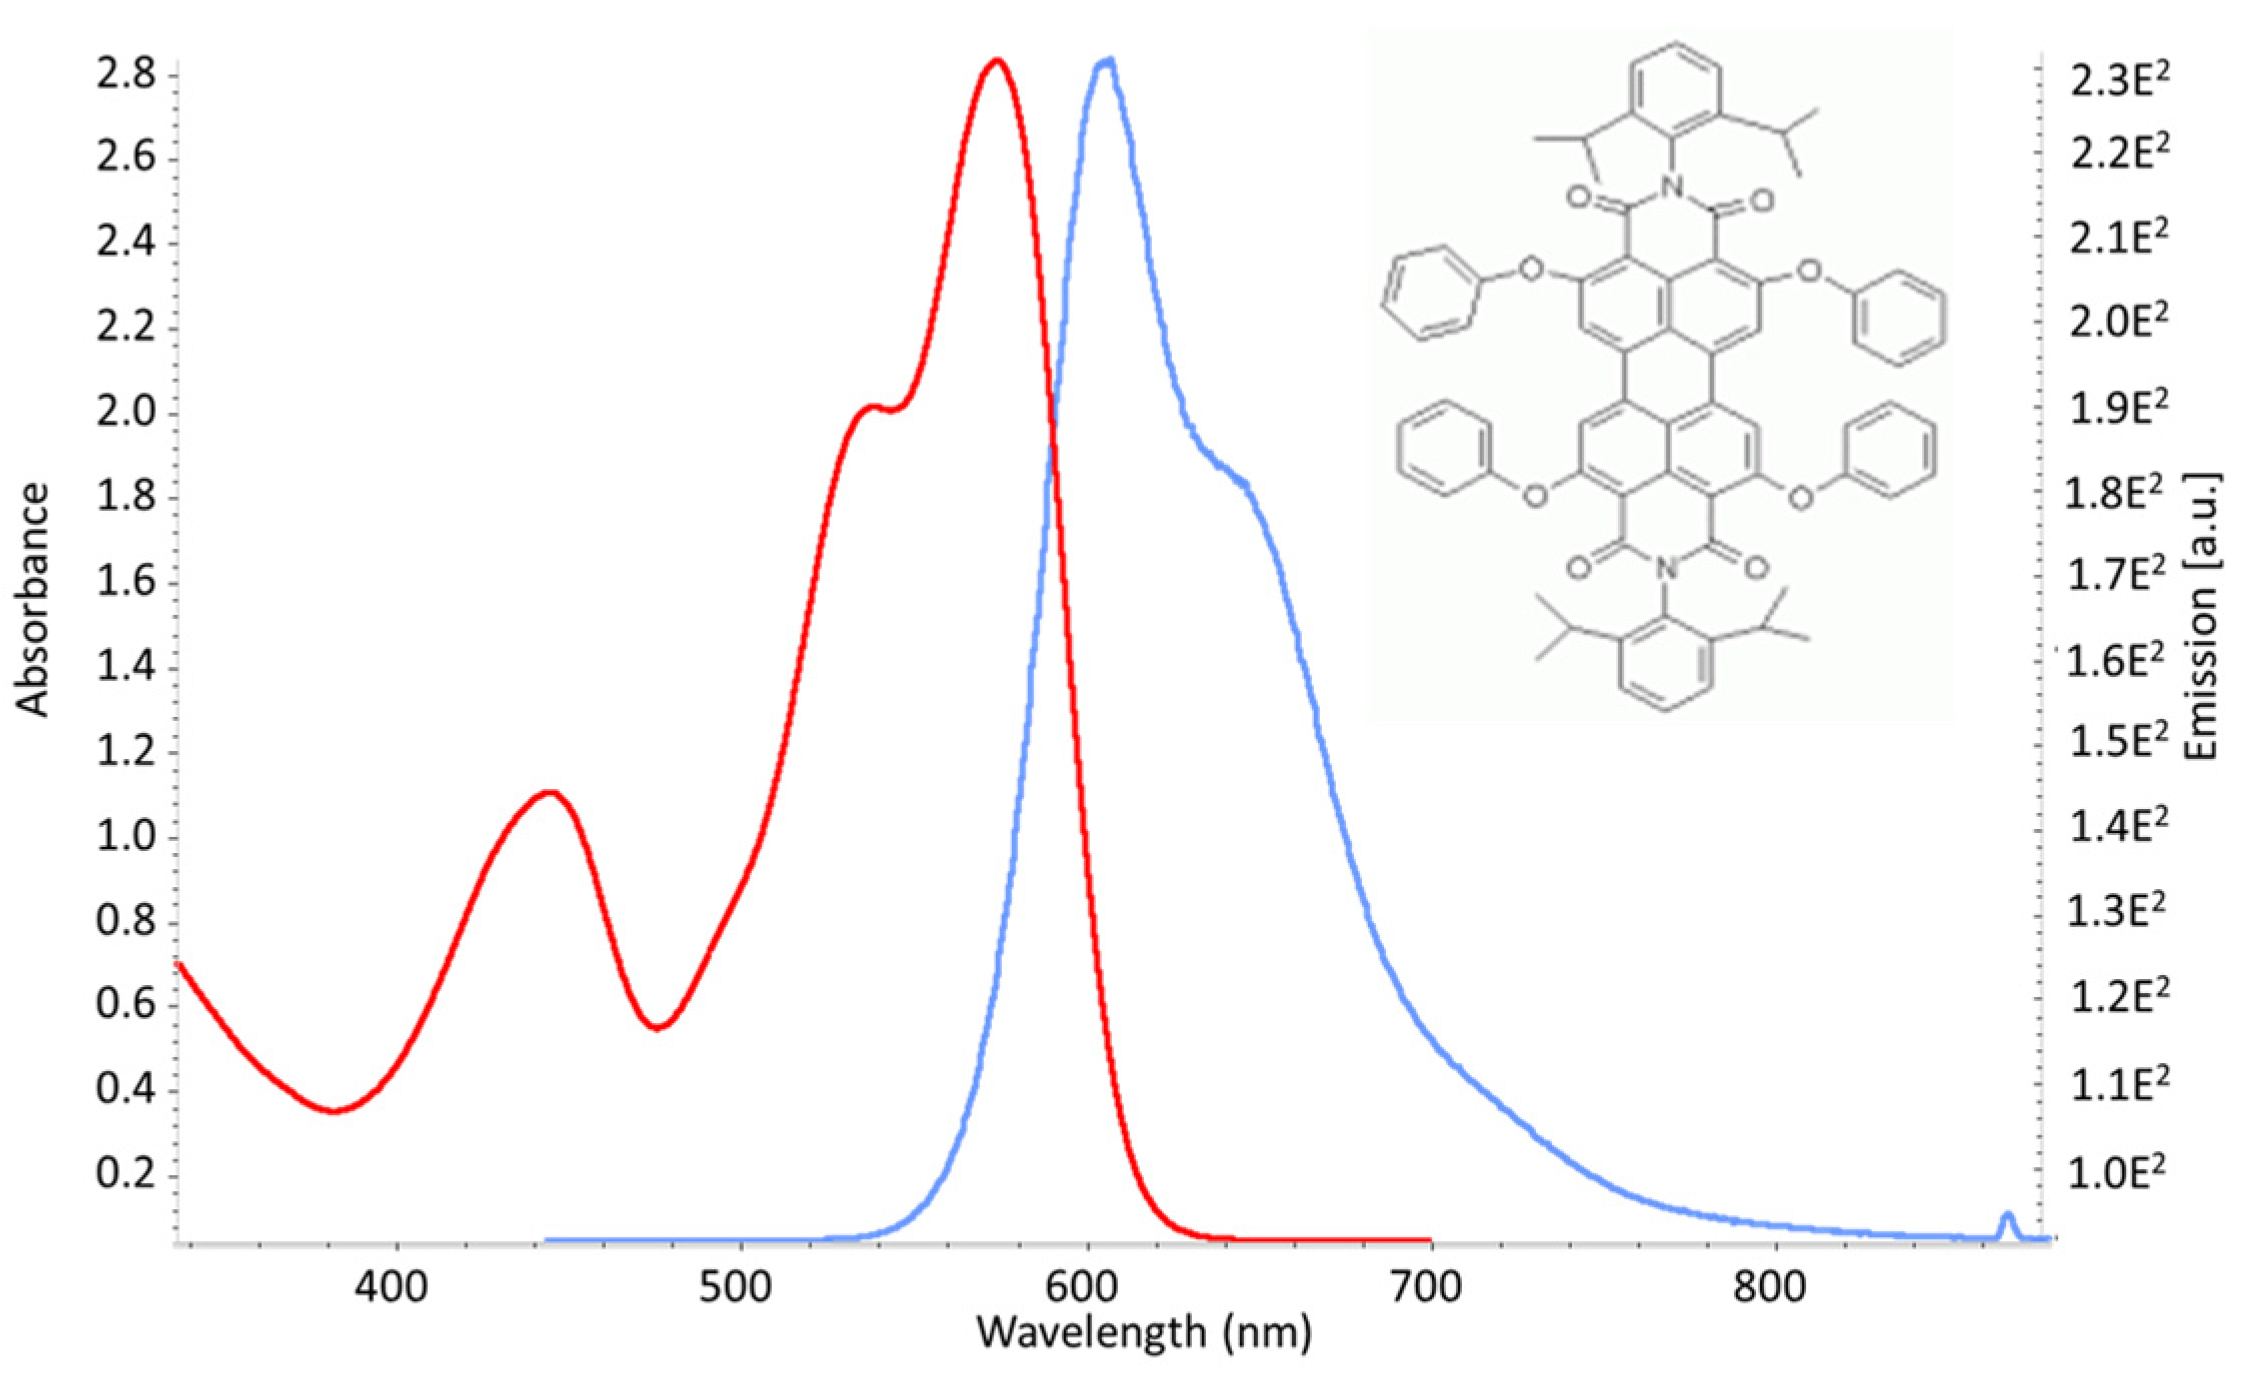
Considering this, luminescent dye Lumogen F305 (perylene-based molecule by BASF) was chosen for its spectroscopic features, high quantum yield (100%) and good photostability (5% of degraded dye after 4600 h accelerated ageing). Indeed, the absorption spectrum of Lumogen is characterized by a strong band in the range 500–600 nm with maximum absorption at 576 nm and a weak band between 400 and 500 nm; the photoluminescence emission takes place between 600 and 750 nm with a maximum fluorescence peak at 615 nm (
Figure 3).
Green light of solar spectrum, which is largely captured by Lumogen, is not absorbed by chlorophylls and carotenoids. Therefore, a LSC panel doped with Lumogen does not interfere with the photosynthetic process.
High intensity and correct distribution of transmitted sunlight are required to LSC plates for greenhouse application; these conditions allow high growth and good development of plants. Increased conversion of sunlight absorbed in electricity is also needed for making self-supporting greenhouses. In this respect, the amount of luminescent dye in the plate plays a key role.
Different dye concentrations were evaluated to determine the best one in terms of quantity and quality of transmitted light and electricity production. Transmitted light and its distribution in PAR range were measured from the transmittance UV–Vis spectra by using a Perkin Elmer UV–Vis–NIR Lambda 950 spectrometer. Every spectrum was firstly weighted for the solar spectrum by the AM 1.5 Reference Solar Spectrum. Then, the integrated area of the solar weighted transmission spectrum (in the range 400–700 nm) of the sample was perceptualized using the AM 1.5 as reference.
PAR attenuation (%) is the attenuation of the transmitted light (I
TL) with respect to the incident light (I
IL), as reported in Equation (1):
2.4. LSC Panel Design
A typical greenhouse hard cover is made of double-wall PolyCarbonate (PC) panels with sizes that range from 1.2 × 0.6 m to 3 × 2 m. In contrast with this, large LSC modules rarely exceed a short-side length of 50–60 cm. In fact, the performances of larger devices are limited by self-absorption of the fluorescent dye (multiple absorption-emission events that reduce the light transport efficiency, due to the overlap between the absorption and emission spectra,
Figure 3).
A reasonable trade-off is a module with a fixed short side of 50–60 cm and a variable length of 0.5 to 2 m; this size permits to have modules with a large area but where the optical path inside the slab is not so long to limit the performance due to self-absorption [
42].
In addition, proper structural characteristics as rigidity and thermal insulation are required in practical use as roofing. Hence, a suitable LSC device for greenhouses requires a dedicated design with the integration of additional materials to fulfill these specifications.
In the present work, LSC panels with dimensions of 50 × 50 × 0.6 cm and 100 × 100 × 0.6 cm were used, fabricated by Altuglas (Arkema Group) using an industrial method of “cell-casting polymerization” [
43]. In particular, PMMA ShieldUp
® (impact resistant) was used as transparent material. LSCs with ShieldUp
® are a patented technology [
44] resulting from the collaboration between Arkema Group and Eni S.p.A, specially developed to provide a polymer composition that is highly resistant to shocks, remains transparent regardless of temperature, and possesses greater flexibility, all while it absorbs and re-emits light. These characteristics make it suitable for greenhouse roofing.
Measures of electrical efficiency of a complete LSC device were also performed. Eight silicon cells IXYS SLMD142H01LE (dimensions 24.7 × 0.6 cm each and an active surface of 14.8 cm2) were glued on the four edges of the slab, wired in series, and connected to a Keithley 2602A (3A DC, 10A Pulse) digital multimeter to record the power response. A 50 × 50 × 0.6 cm device was exposed directly to the sun and the current-voltage (I-V) curves were collected.
The corresponding power conversion efficiency (PCE) was estimated though the following formula:
where in
is the open-circuit voltage,
is the short-circuit current density,
is the intensity of the light incident on the device (Global Normal Irradiance GNI = 1000 W/m
2), and
(Fill Factor) is defined by the following ratio:
with
and
defined as the voltage and current density, respectively, corresponding to the maximum power point.
Considering Equations (2) and (3), it results .
The power production from the panel estimated in this way represents the peak value, obtained with a naked LSC slab. However, the effective power conversion efficiency is influenced by the final configuration of the device, so measures on the building-integrated panel are deemed necessary.
2.5. Experimental Design
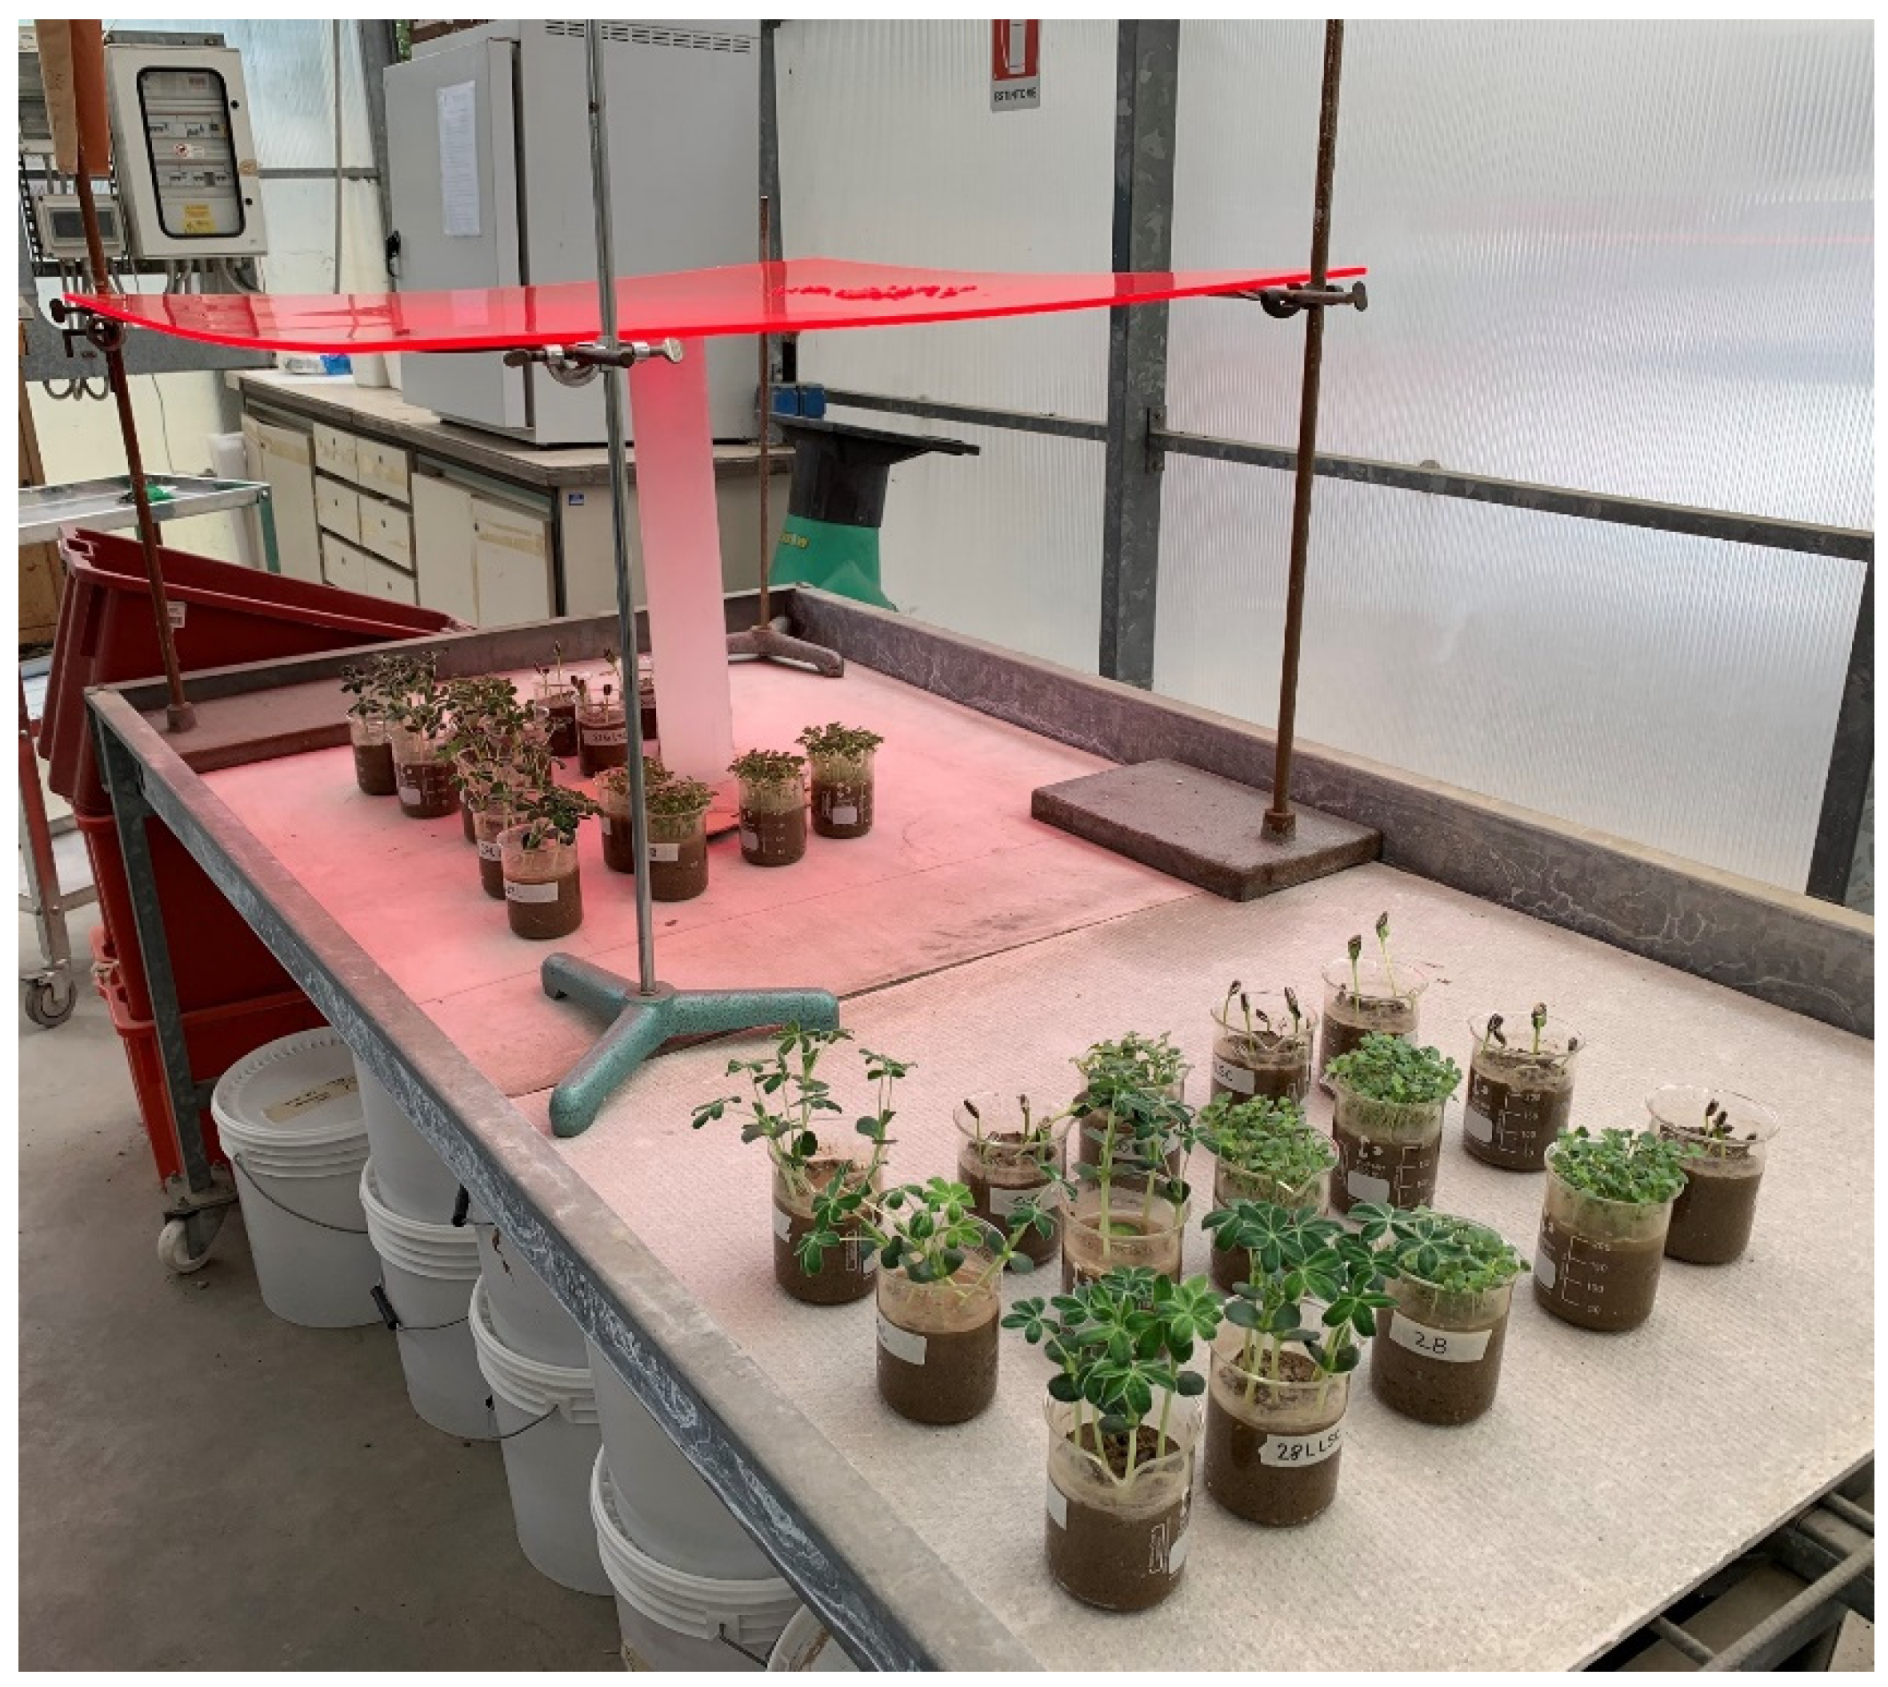
The microcosm tests were carried out in two different conditions: inside a greenhouse (first phase) and outdoor (second phase). In the first phase (
Figure 4), the plants were grown on a microcosm scale under a red LSC panel of 100 × 100 cm supplied by Eni, positioned at the height of about 50 cm to allow adequate plant growth. As a comparison, the same tests were set up outside the LSC panel. The first phase aimed to evaluate if the red LSC panel could hinder or reduce the biomass production of the selected species.
In the second phase (
Figure 5), outside the greenhouse, tests were set up using small boxes made of polycarbonate and LSC panels, built and supplied by Eni with a size of 50 × 50 cm. Microcosms were placed inside the red LSC box, so that the plants were totally subject to the action of the LSC panels. The same number of microcosms for each species were placed in the polycarbonate box, in order to have a comparison at the same conditions. In this second phase, metals bioavailability has been increased by the addition of EDTA for some samples.
In both phases, the growth of plant species commonly used for phytoremediation,
Brassica juncea (B), Lupinus albus (L), and
Helianthus annuus (H) [
20,
22] was considered to evaluate the biomass yield and the accumulation of the target metals (As and Pb).
2.5.1. Indoor Microcosm Tests
The phytoextraction test was carried out in 400 mL microcosms, i.e. pots filled with soil in which the selected species are grown. Pots were filled with 300 g of As and Pb contaminated soil.
Ten microcosms per species were prepared, for a total number of microcosms of 30, 15 grown under the LSC panel and 15 outside the panel. Sowing was carried out using 0.5 g of Brassica juncea, 6 seeds of Helianthus annuus, and 5 seeds of Lupinus albus. The experiment was organized in a randomized complete block design.
Microcosms were watered daily (at least twice a day) according to the needs of the plants. B. juncea was the plant species that needed the least water. On average 20 mL for B. juncea and 25 mL for L. albus and H. annuus, twice a day.
The whole experiment lasted 30 days. Plants were separated into roots and shoots. Vegetal samples were accurately washed with deionized water, and roots were further sonicated for 5 min with a Branson Sonifier 250 ultrasonic processor (Branson Ultrasonic Corporation, Danbury, CT, USA) to remove the soil particles possibly still present, and then rinsed with deionized water. Vegetal samples were dried up to constant weight in a ventilated oven at 40 °C and each dry weight (DW) was recorded.
2.5.2. Outdoor Microcosm Tests
The microcosm test was conducted outdoor under two boxes measuring 50 × 50 × 50 cm, one in transparent polycarbonate and the other consisting of red LSC panels. The amount of soil per microcosm was 300 g. The selected plant species were the same as the first phase: B. juncea (B), L. albus (L) and H. annuus (H). Sowing was carried out using 0.5 g of brassica seeds, 6 sunflower seeds, and 5 lupine seeds. For each species, tests were conducted in triplicate both without and with the addition of EDTA. The trial lasted about 30 days. Irrigation was carried out based on the daily need of the plants. About 20 days after sowing, treatment with the 2 mM EDTA solution started. A total dose of 10 mL of EDTA solution was added for each treated microcosm, divided into 5 days, diluting the daily dose with water. At the end of both tests, the plants were harvested by separating the leaves and stems from the roots. The fresh weight of the developed biomass was measured and after careful washing, the plant samples were placed in an oven at about 45 °C to dry. The dry weight was then determined, and the samples were prepared to be analyzed and evaluate the amount of As and Pb accumulated in vegetable tissues.
2.6. Lead and Arsenic Analysis in Soil and Plants
Each plant sample (roots and shoots) was ground into fine particles (<1 mm) and digested according to US-EPA 3052 [
45]. Total As (using a method for the generation of hydrides) and Pb concentration in soil and plants (aerial part and roots) were analyzed by ICP-OES (Varian AX Liberty. Varian Inc., Palo Alto, CA, USA).
2.7. Quality Assurance and Quality Control
QA/QC were performed by testing two standard solutions (0.5 and 2 mg L−1) every 10 samples. Certified reference materials, CRM ERM e CC141 for soil and CRM ERM - CD281 for plants, were used. The limit of quantification (LOQ) for Pb and As were of 5 and 50 mg L−1, respectively. The recovery of spiked samples ranged from 95% to 101% with a Relative Standard Deviation (RSD) of 1.88 of the mean for Pb and from 94 to 101% with a RSD of 1.91 of the mean for As.
2.8. Statistical Analysis
Statistical analysis was performed using STATISTICA version 6.0 (Statsoft, Inc., Tulsa, OK, USA). Effects of treatments were analyzed using one-way analysis of variance (ANOVA). Differences between means were compared and a post-hoc analysis of variance was performed using the Tukey’s honestly significant difference test (P < 0.05).
3. Results
3.1. LSC Panels Properties and Performance
Tests with various concentrations of luminescent dye were performed in the range 40–160 ppm, in order to identify the right composition to both maximize the photosynthesis process and the energy production. LSC plate doped with 160 ppm of Lumogen F305 has been identified to have the right characteristics to be used in microcosm experiments. As reported in
Table 2, it transmits a sufficient PAR light (about 30%), a low UV light (0.6%), and a high red and far-red light (90%); the blue light is also satisfactory (7.8%) [
42].
A power conversion efficiency (PCE) of 1.5% (corresponding to 15 W/m2) was obtained for the naked LSC slab (0.5 × 0.5 m2) using Equations (1) and (2). Starting from 1.5% that is the maximum value obtained, the PMMA ShieldUp® implementation in the final configuration (to achieve the necessary structural characteristics) determines a drop, albeit modest, of the effective power conversion efficiency.
The power produced is reasonably sufficient to fulfill all or part of greenhouse needs, as airflow and water pumping irrigation, based on the characteristics of the specific greenhouse. Indeed, greenhouse electrical consumption depends on several parameters (as the location, the season of the year, technological innovation level and so on). However, the large surfaces of the greenhouse roofs can be potentially entirely covered by LSC ShieldUp® devices to maximize energy production.
3.2. First phase: Indoor LSC Panel
The first phase aimed to evaluate if the red LSC panel could hinder or reduce the biomass production of the selected species. The obtained results for the fresh weight for the aerial part and roots are reported in
Figure 6. In the following, B LSC, H LSC, and L LSC indicate the brassica, sunflower and lupine plants grown under the LSC panel. B, H, and L refer to species grown outside the LSC panel, also indicated with the label CT (control).
From data showed, it can be noticed a trend towards a higher production of fresh biomass for the aerial part of the plants grown under the LSC panel. On average, considering the mean values, this increase ranges from around 24% to 31%. In
Figure 6, the fresh weight values obtained for the roots have also been reported, even if these data are not particularly significant on a microcosm scale due to the difficulty of their harvesting and the modest production. Additionally, in this case, a general trend towards higher (root) biomass production under the LSC panel can be seen, although the differences between the plants grown outside or below the LSC panel are not very large.
To compare the overall biomass production, it is possible to consider the whole set of microcosms and calculate the sum of the biomass produced of the five microcosms of each species. The results are reported in
Figure 7.
These results from fresh weights are also confirmed by the trend of the dry weight of the biomass, as shown in
Table 3.
In this case, there are significant differences between the aerial parts of plants grown under the red panel and those grown outside the panel, with an increase of about 25%, 27%, and 28% of the mean values for B. Juncea, H. Annuus, and L. Albus, respectively.
Considering that energy saving is one of the strengths of "green remediation", the usefulness of LSC panels can be demonstrated if the plants cultivated grow and develop like those grown in traditional greenhouses. The results obtained seem to support this thesis. By absorbing mainly green light, red LSC panels maintain the blue spectral range necessary to activate photosynthesis. At the same time, the quantity and quality of light transmitted by the luminescent dye incorporated in these panels can improve the spectrum red fraction where the photosynthetic activity is highest [
46,
47,
48]. Indeed, it should also be considered that these results were obtained with plants grown in contaminated soil, therefore under stress conditions.
3.3. Arsenic and Lead Uptake by Plants
An essential parameter to evaluate the feasibility of a phytoremediation intervention is the plant ability to absorb contaminants. The concentration of As absorbed by the plants is reported in
Table 4.
No difference was found between the amount absorbed by plants grown under the LSC panel and those grown outside the panel. The values obtained, which are the average over five replicates, are not significantly different from each other; thus, it appears that the LSC panel did not have a negative influence on As uptake by plants both in the aerial part and in the roots of plants.
The average values of Pb concentration were shown in
Table 5. Further, in the case of Pb, the LSC panel did not affect the absorption of the metal. The mean Pb concentration values are not significantly different in plants grown under or outside the panel.
3.4. Total Accumulation
The “total accumulation” (i.e., the total metal amount extracted by plants) was evaluated as product of metal concentration and aerial biomass [
49]. This parameter provides an estimation of phytoextraction efficiency, since it includes both metal uptake and vegetal biomass production [
20].
Data of total accumulation are reported in
Figure 8.
The tests conducted in the greenhouse show positive effects on plants grown under the red LSC panel. On the contrary, since there are no differences in the absorption of contaminants, the increase in plant biomass grown under the red LSC panel also shows a beneficial effect on the total uptake values. On balance, the LSC panel could improve plant growth and development, with a consequent increase in the amount of metals removed from the contaminated soil.
3.5. Second Phase: Outdoor Comparison between LSC and Polycarbonate Boxes
As described above, the microcosm test was conducted outdoor using two boxes, one in transparent polycarbonate and the other consisting of red LSC panels.
In this case, the lighting conditions of the plants in the microcosms are significantly different from those of the first phase of the experiments. Indeed, there is no longer the shielding due to the greenhouse under which the first phase tests were conducted: the two boxes were placed outdoor, directly under the sunlight. In addition, for the LSC box all sides are made of red LSC panels, condition that should simulate on a small scale the effect of a hypothetical greenhouse made up exclusively of red LSC panels (in the comparison box all sides are made of polycarbonate).
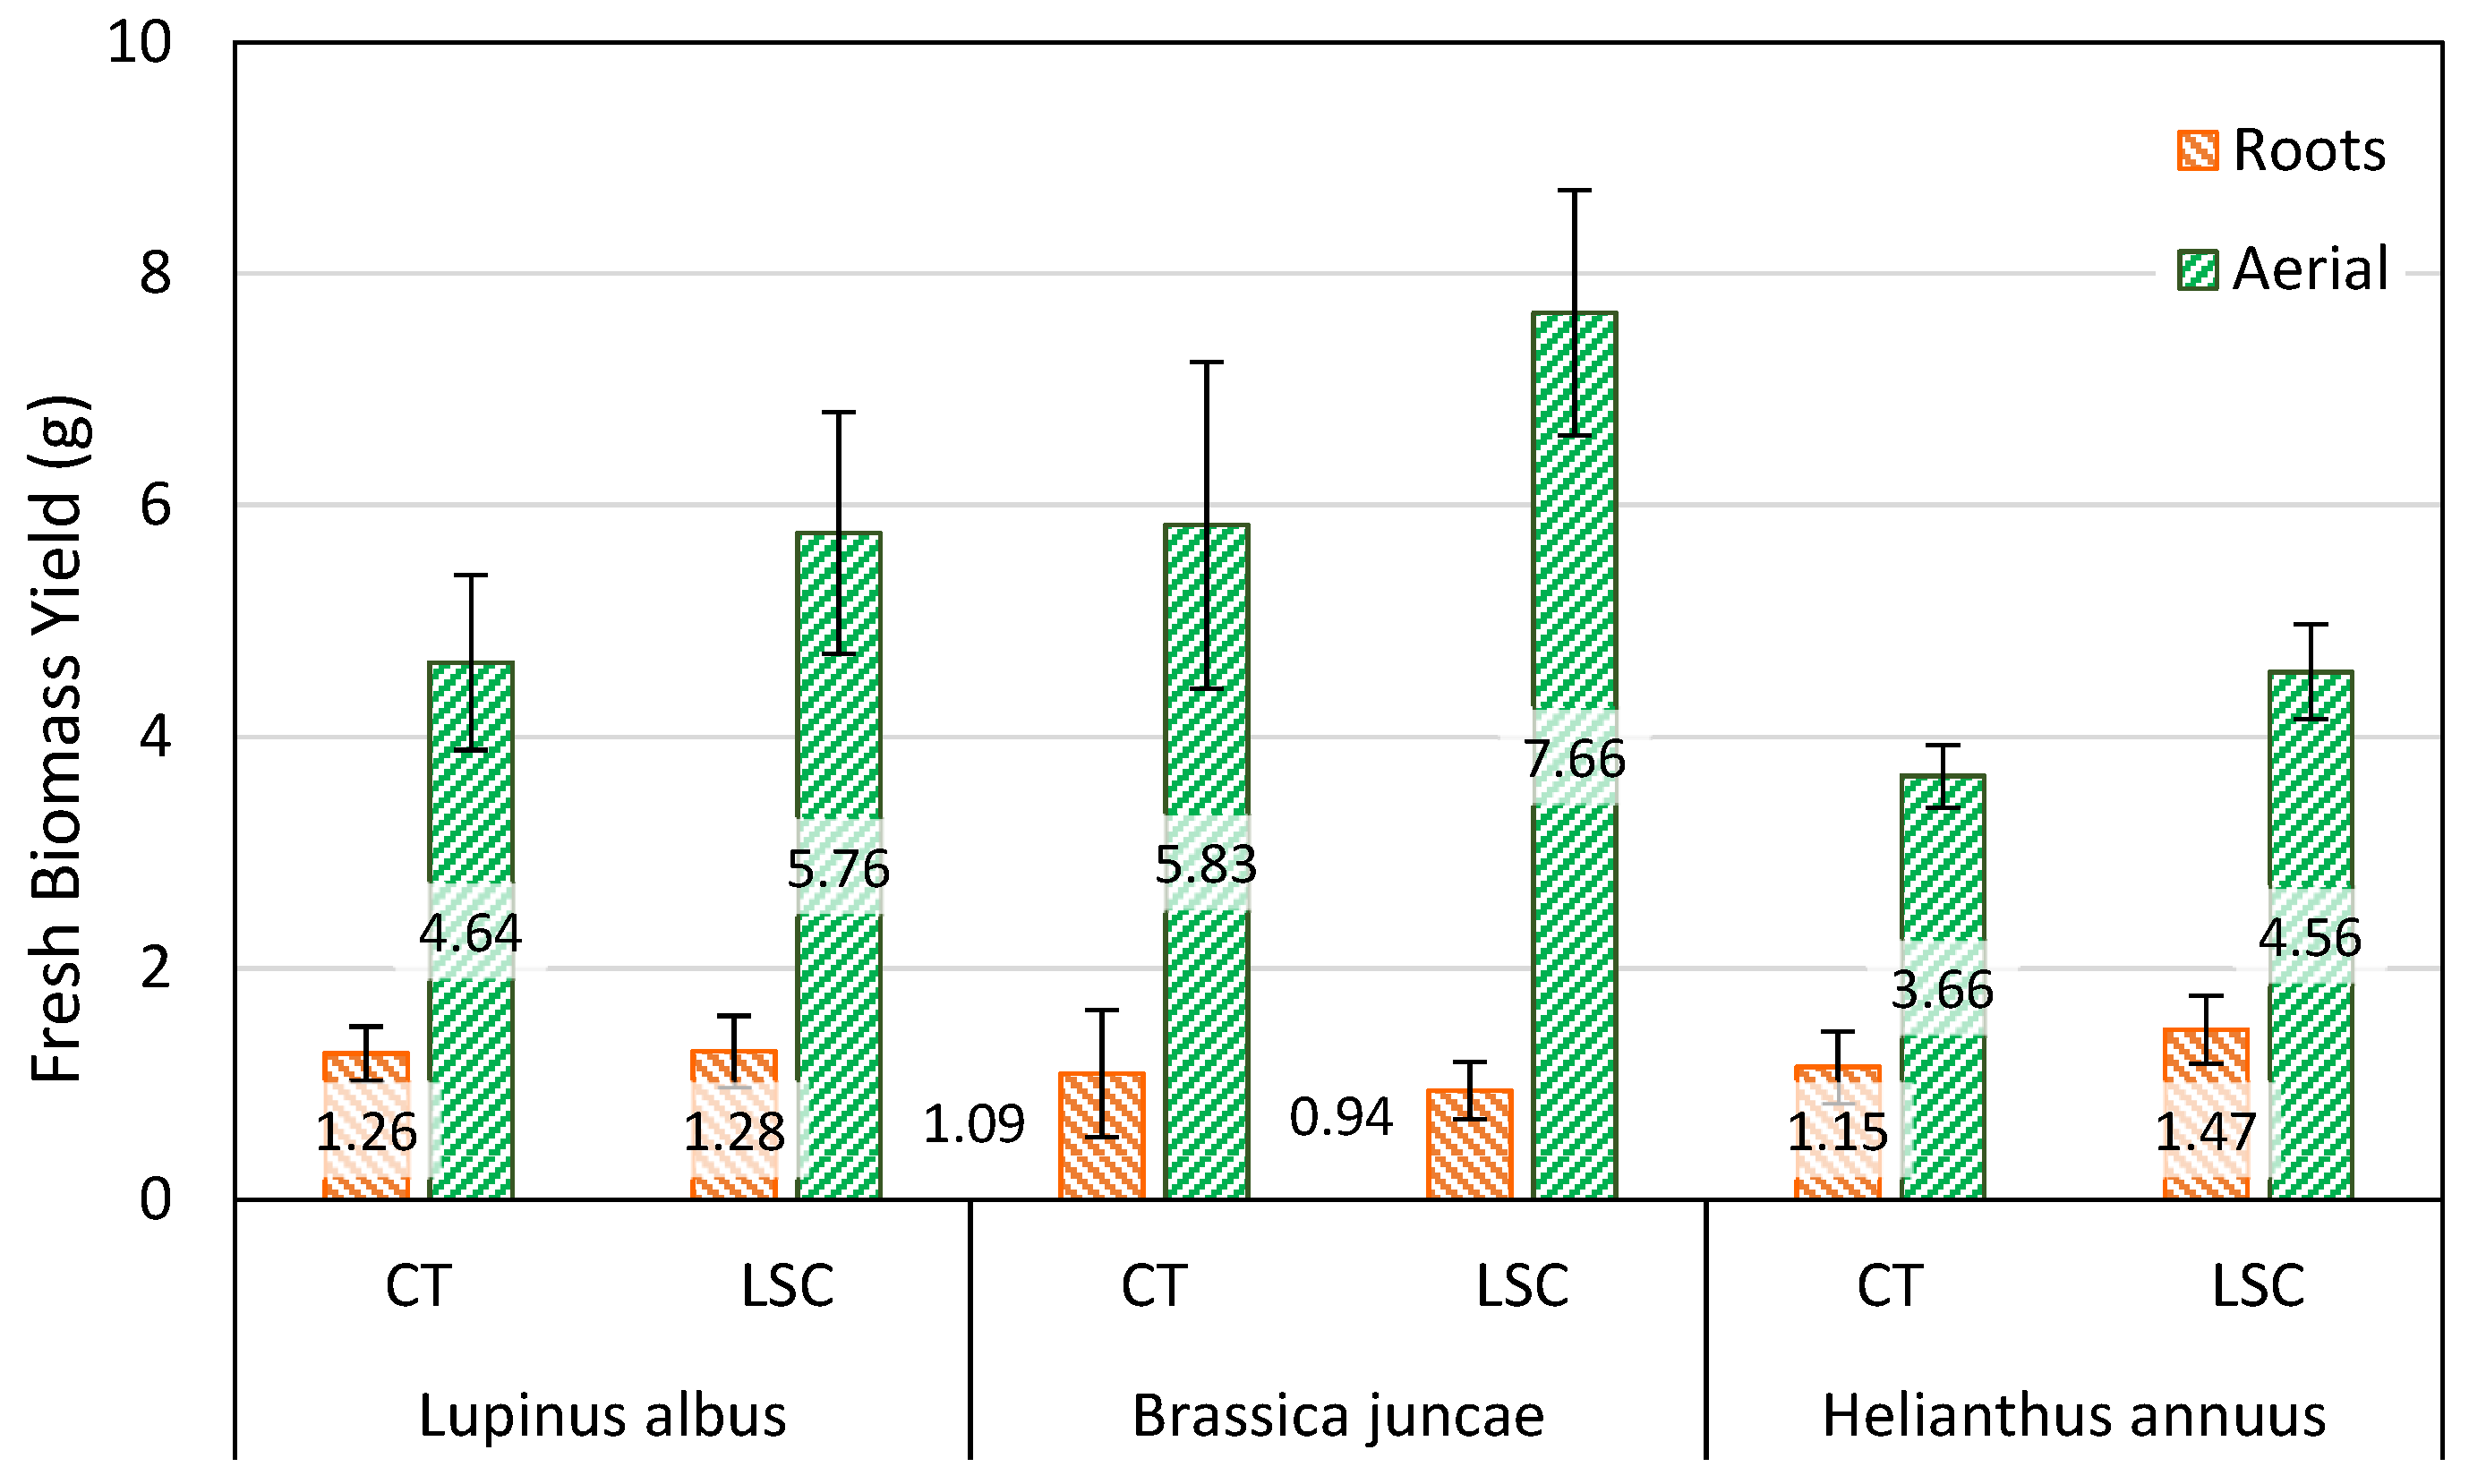
In general, the plants grew well, even after adding EDTA. Additionally, in this case, the results obtained show that the production of fresh biomass, especially in the aerial part, is higher for plants grown under the red box (
Figure 9).
The trend of dry weight of the biomass of the plants is similar to that of the fresh weight; the data has been reported in
Table 6.
A picture of plants grown under the two different boxes before EDTA addition is reported in
Figure 10. As an example, for each of the three plant species, two microcosms grown in the LSC box (on the left of the viewer) are compared with two microcosms grown in the polycarbonate box (on the right).
It must be emphasized that the addition of EDTA (not reported in
Figure 10) did not show a negative effect on biomass production. This result can be attributed to both the fractional addition of the chelating agent and the short growth period of the plants in the microcosm tests.
The concentration values of As and Pb in the aerial part and in the roots of the plants are shown in
Table 7.
From the results obtained, it can be seen that the concentration of Pb and As is in general very similar for the plants grown under the red box and under the polycarbonate one. In some cases, the plants under the red box even showed a slightly improvement in the absorption of the contaminants. In general, the present experiment results showed that in all plants, EDTA addition increased Pb concentrations in shoots compared with the control.
The addition of EDTA increased the Pb content in the brassica plants in the aerial part by more than four times, without notable differences between the plants grown under the red box and those under the polycarbonate box.
A similar increase was also found in the aerial part of the sunflower, with an increase in the concentration of Pb of about 4.5 times in plants grown under the polycarbonate box and about 6 times in those grown under the red box. The most relevant effects of the addition of EDTA were found in the lupine plants with increases in Pb concentration of the aerial part of about 10 times the value found in the plants not treated with the chelating agent. The results were the same for both boxes.
The effect of EDTA was instead not very evident in the root system, where the difference in the concentration of Pb between treated and untreated microcosms was always minimal.
Lead is not easily transferred to above-ground plant biomass, since it is mainly stored in root cells [
50,
51]. In this experiment, the addition of EDTA has proved to be particularly effective for phytoextraction because it seems to have favored the translocation of the metal in the aerial part. It can be supposed that EDTA chelates Pb in the soil liquid phase then the soluble Pb–EDTA complex enters the roots and Pb is transported through the plant and accumulated in the aerial part [
52].
The results did not show any adverse effect of EDTA on arsenic uptake. This can be ascribed to the action that EDTA carries out on iron oxides, partially solubilized by the complexing agent [
53]. The mobility of arsenic in soil is greatly influenced by the presence of Fe-oxides where significant amounts of As are adsorbed [
54]. Arsenate forms outer-sphere complexes by electrostatic coulombic interactions on all variable charge minerals [
54]. It can be hypothesized that the disruptive effects of the oxides by EDTA release the arsenic that goes into soil solution becoming available for plants. As a matter of fact, in the specific contaminated soil, the plants can uptake both the contaminants even if not essential elements. There were no differences in the concentration of the two metals between the plants grown in the polycarbonate box and the LSC red box. After all, the EDTA metal complexes are poorly photodegradable in the soil, mostly when plants have grown and in the alkaline conditions of soil pH [
55].
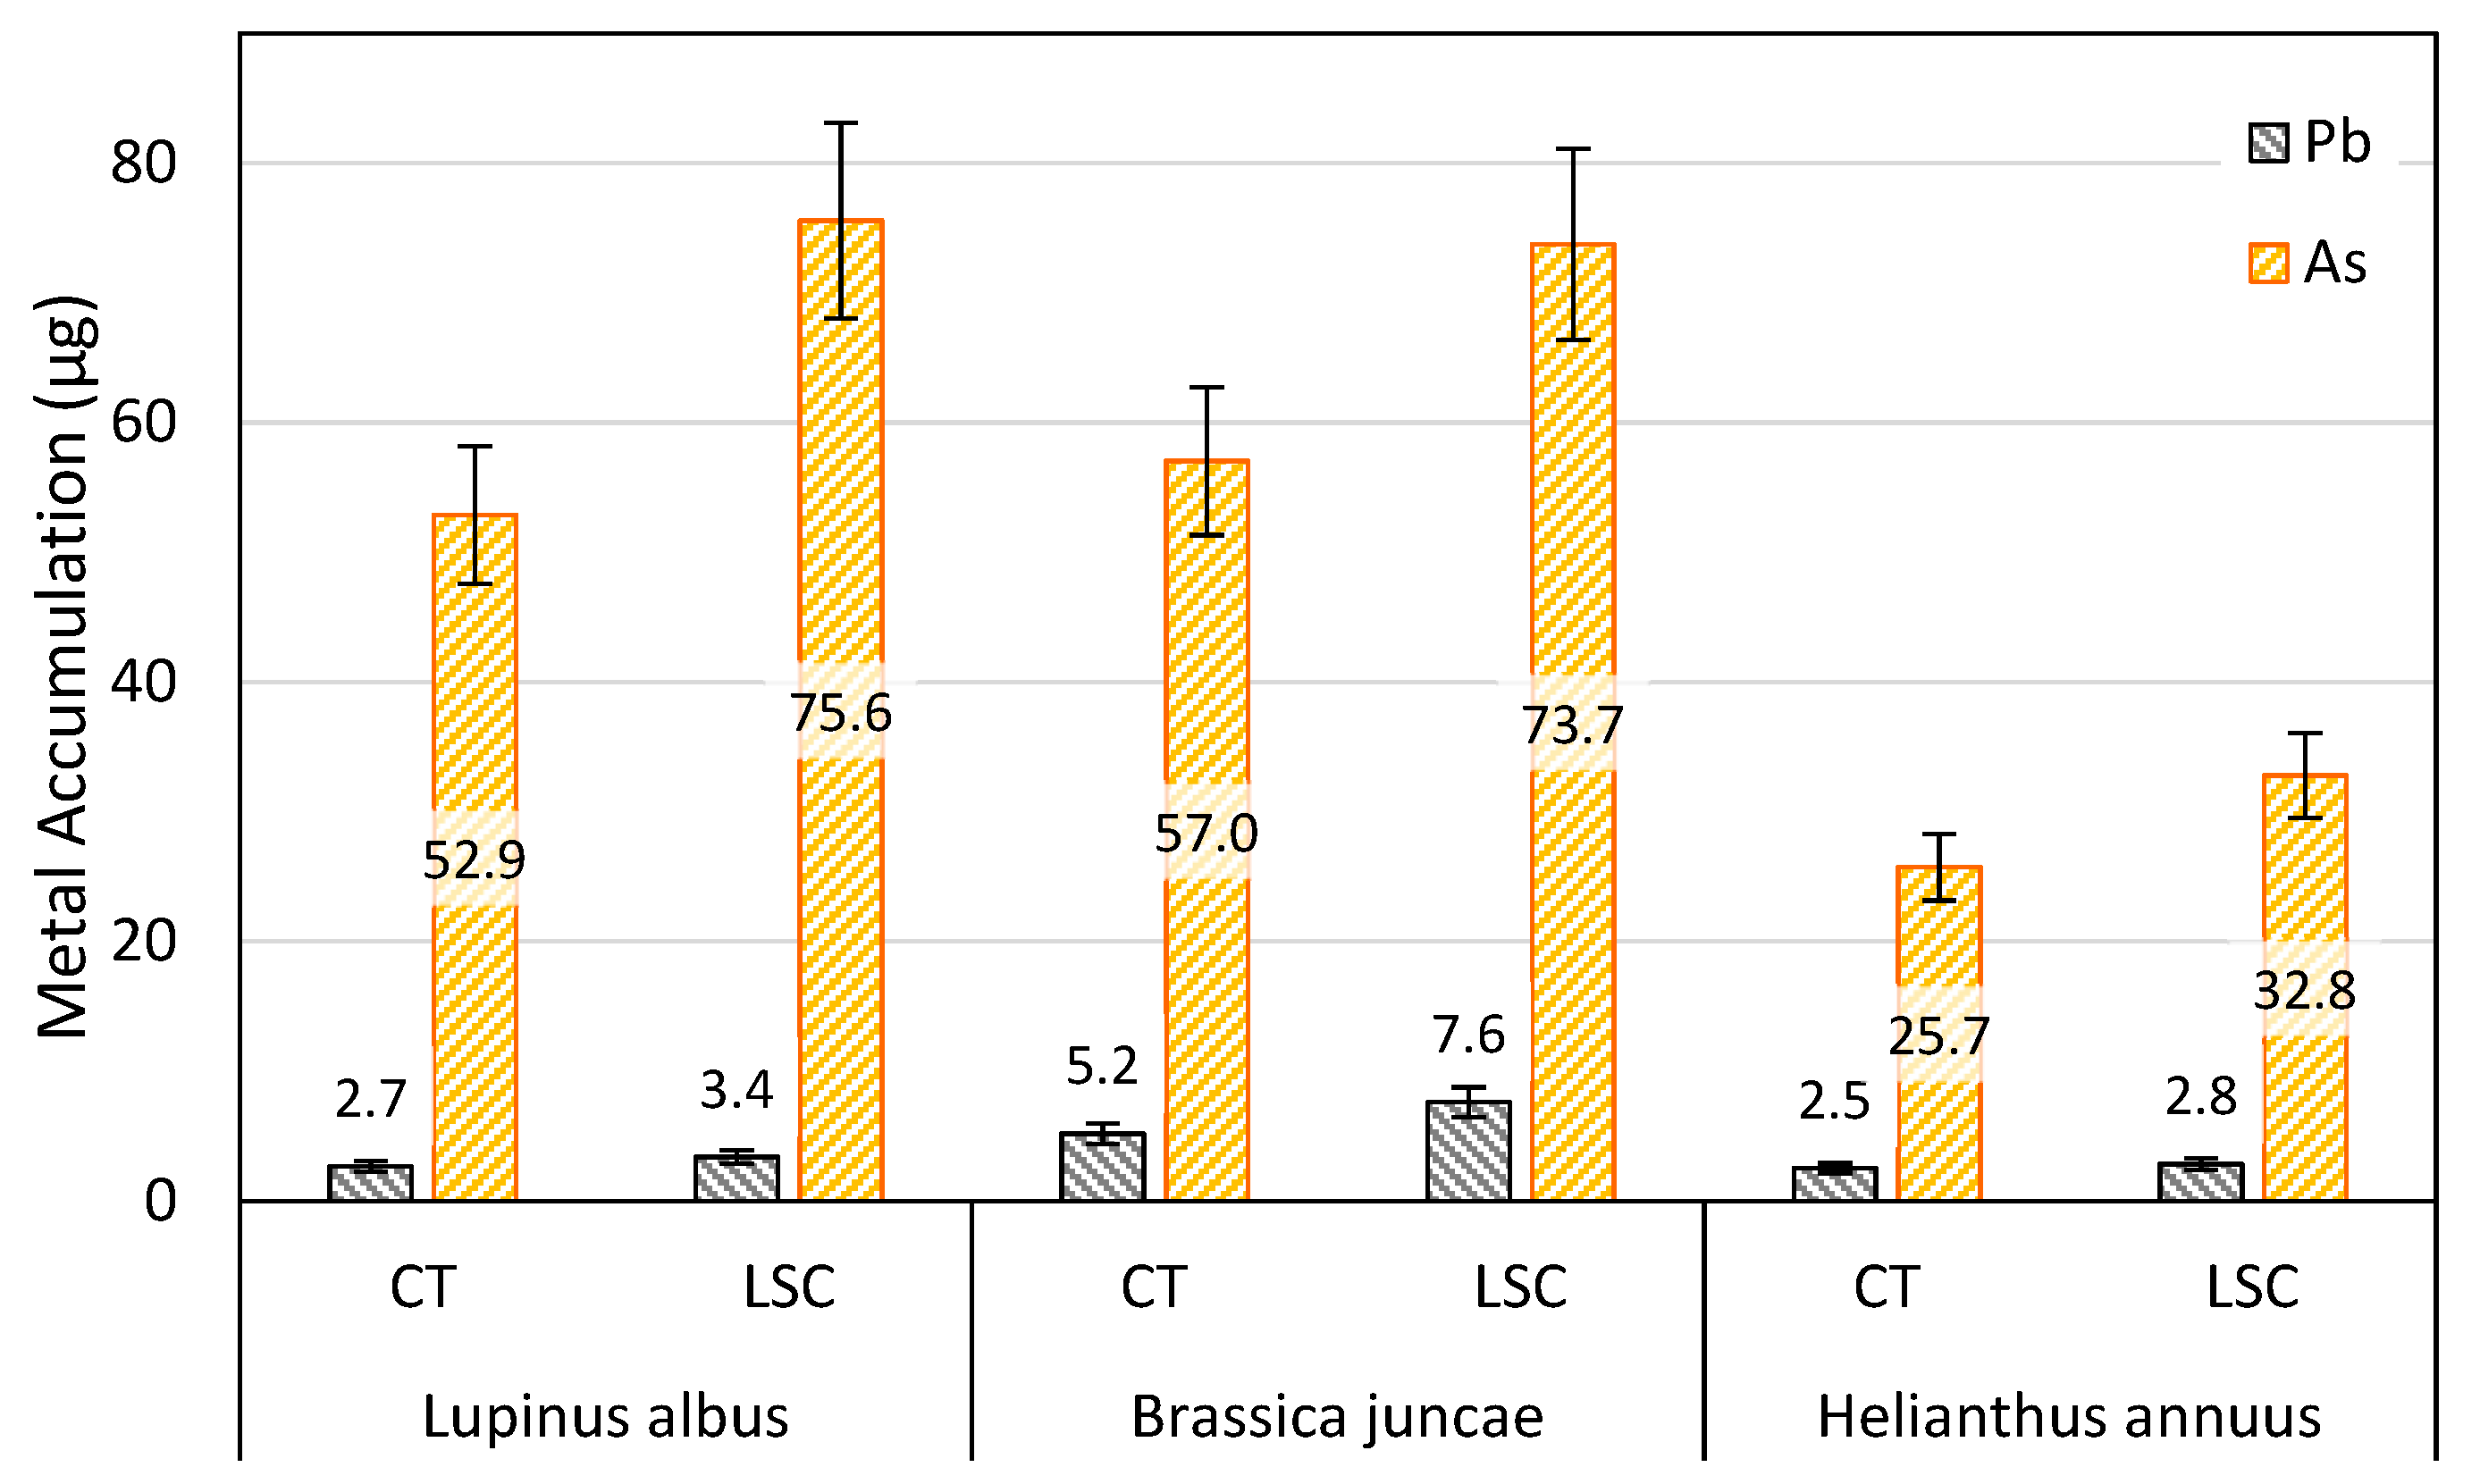
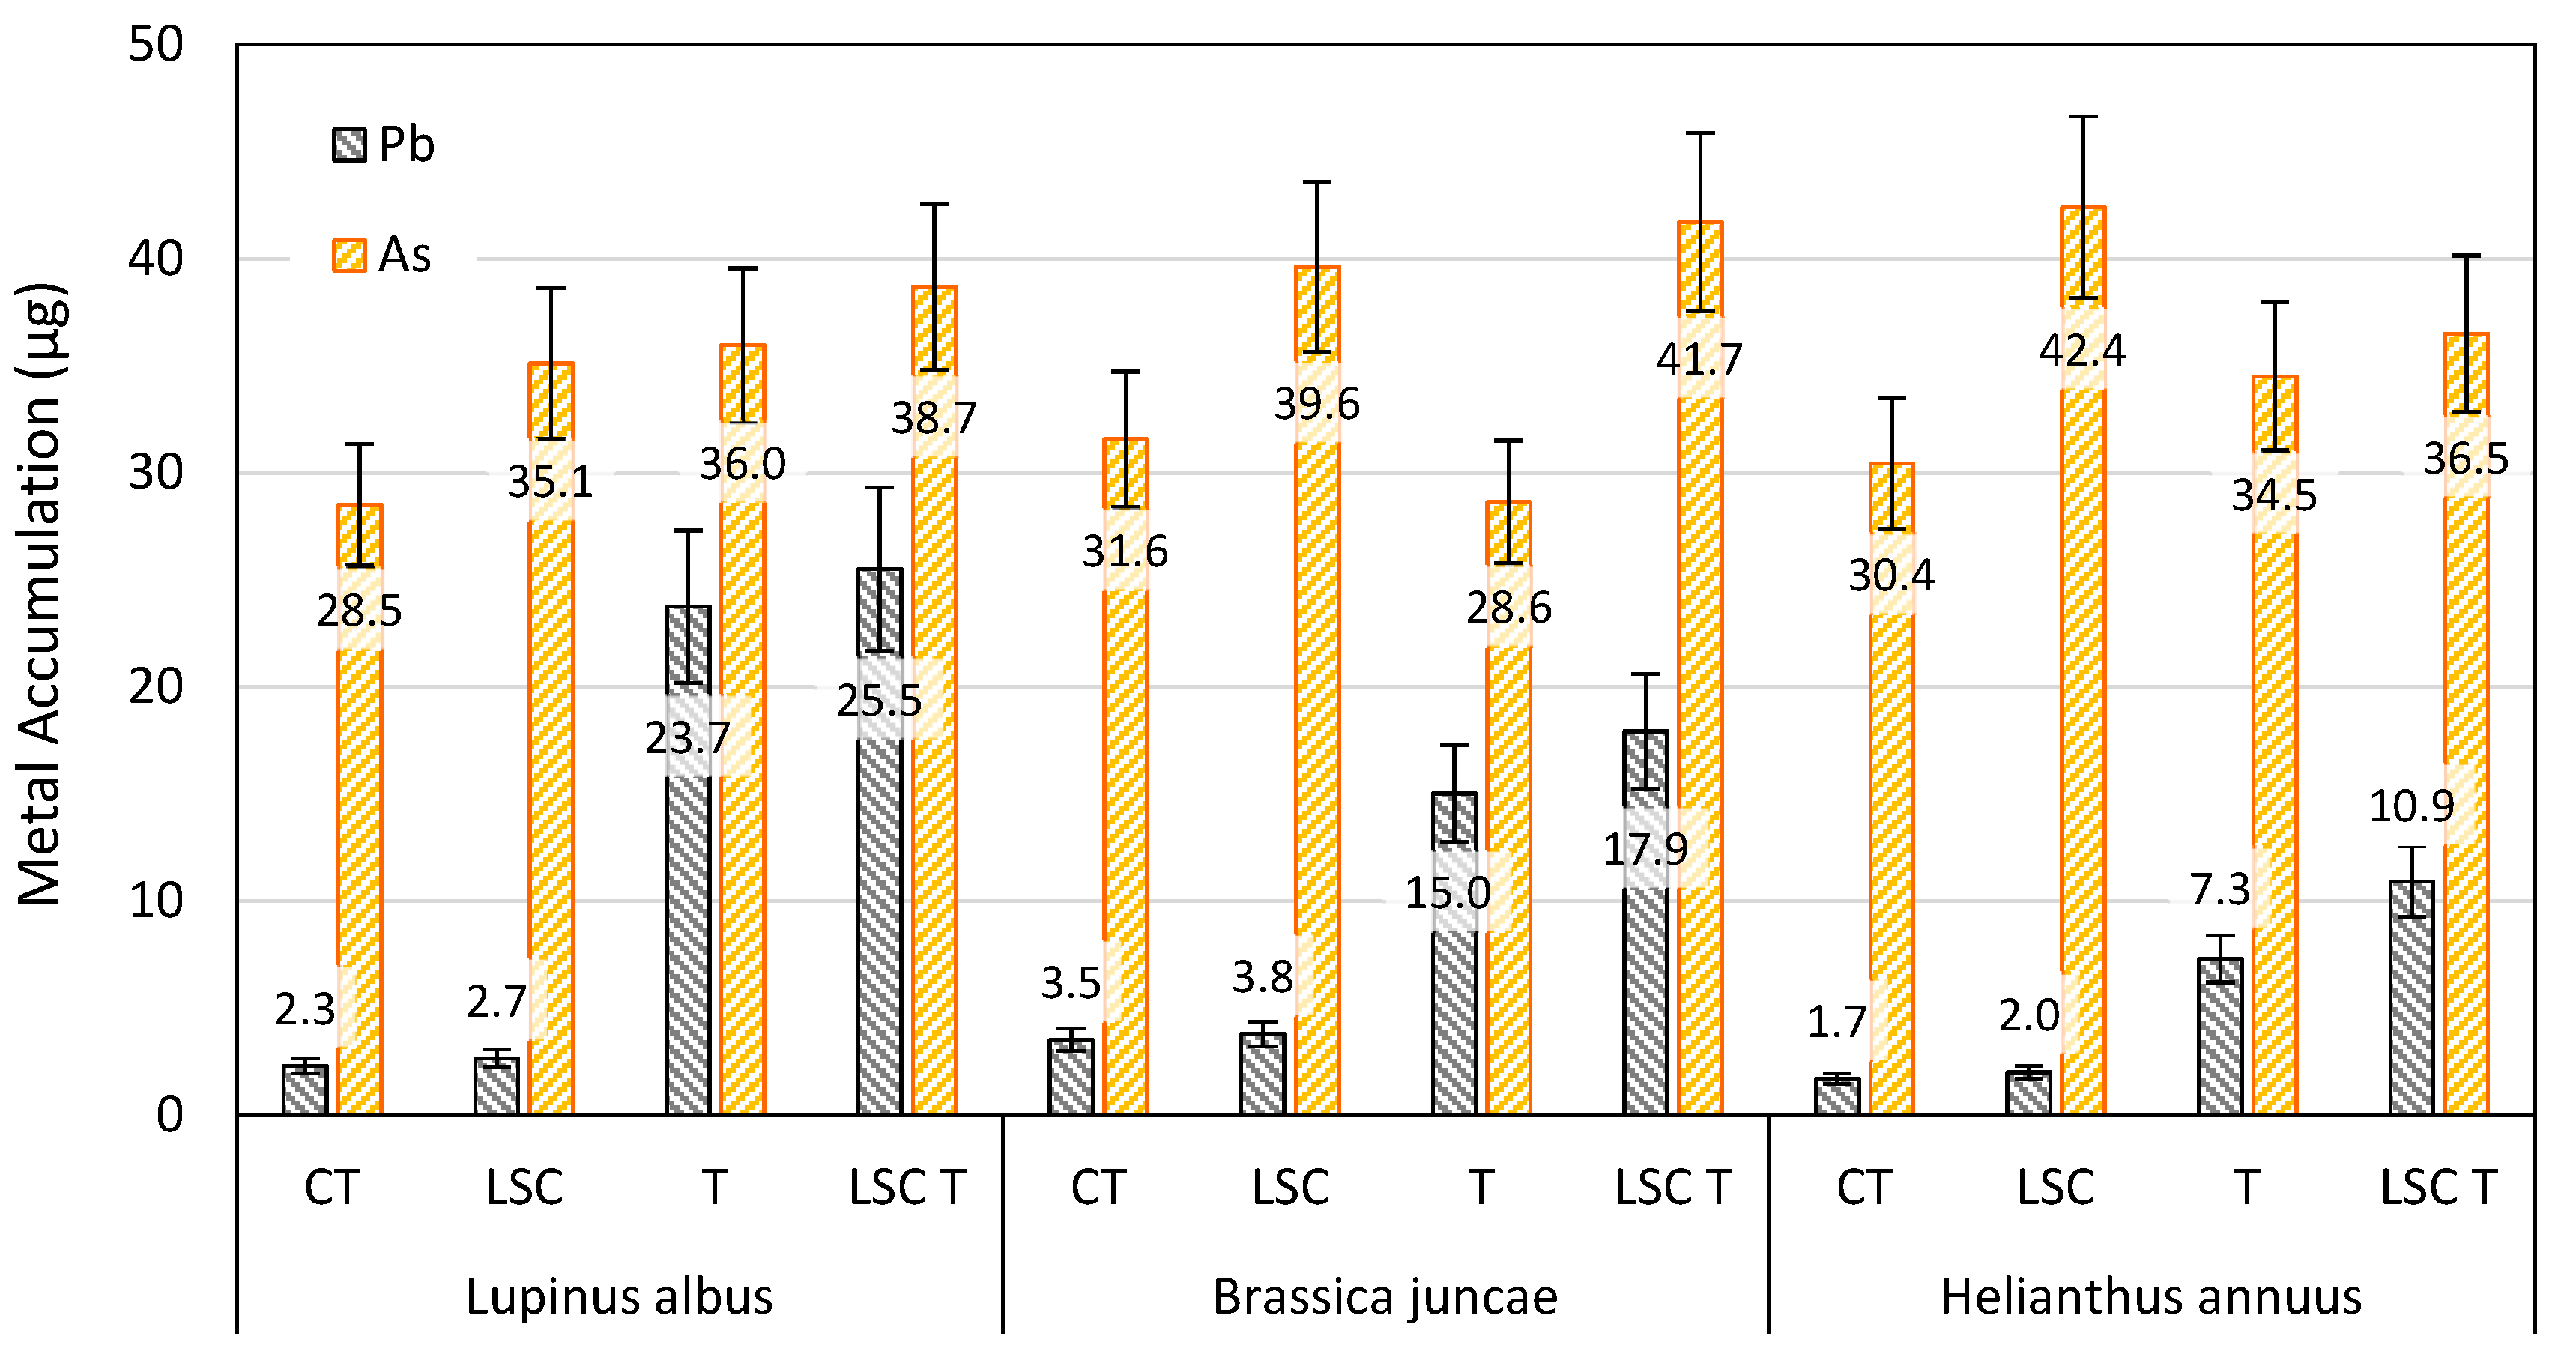
The total accumulation of the two metals for the three investigated plants is reported in
Figure 11 for As and Pb.
This parameter, which, as previously stated, is essential in evaluating the efficiency of phytoremediation, shows a positive effect of the LSC panels, as it is generally higher for tests carried out in the red box. The results showed that plants development under the red box also appears visually higher than that under the polycarbonate box. Thus, the positive effects are more explicit in outdoor tests rather than in greenhouses, as in general the light conditions in the greenhouse tend to decrease due to the shielding effect of the walls of the structure.
4. Conclusions
In a context of growing international attention linked to the need to resort to renewable energy sources, the possibility of using LSC panels for the growth of vegetables is becoming a path pursued with great interest. LSCs can collect both diffuse and direct solar radiation, making them a suitable technology to be used in countries where diffuse solar radiation is dominant such as in northern European countries (with more than 50% diffuse light). Research is still at an early stage regarding the beneficial effects of LSCs on the plant growth, which will require a better understanding of the potential impacts of this technology on growth across the huge diversity of vegetable species.
Nevertheless, the results of the present experimentation show that LSC panels in PMMA ShieldUp doped with 160 ppm Lumogen Red F305 have the right characteristics to be used for greenhouse application, since they do not penalize the growth of plants, but rather they contribute to enhance the photosynthetic efficiency: the fluorescent dye transmits a sufficient PAR light (about 30%), a low UV light (0.6%) and a high red and far-red light (90%), while maintaining a satisfactory blue light (7.8%), necessary to improve the photosynthetic efficiency.
Despite the preliminary nature of the conducted tests, which to the best of the authors knowledge are absolutely innovative as there are no similar experiences even at an international level, the results seem absolutely promising. Indeed, despite stressful conditions due to a high concentration of contaminants in the soil, the plants under the LSC panel grew well showing a higher uptake capacity with respect to plants grown in the traditional greenhouse in polycarbonate. At the same time, plants grown in the LSC greenhouse showed an interesting increase in fresh biomass production on microcosm scale. These results offer some ideas for the possible use of these materials in the field of remediation through phytoremediation, especially on a larger scale where both LSCs and phytoremediation techniques deemed to be further proved.
An on-site greenhouse capable of being energy self-sufficient allows feasibility tests to be carried out in optimal times, regardless of the climatic conditions (protection from high temperatures in summer and low temperatures in winter) even with the addition of chemical additives and biological (PGPR) to choose the best strategy for full-scale remediation activities. In this sense, the power produced by relying on LSC panels could be utilized to fulfill all or part of the greenhouse needs, as airflow and water pumping irrigation. Indeed, the large surfaces of the greenhouse roofs can be potentially entirely building-integrated with by LSC devices to maximize energy production.
About this, measures of electrical efficiency of a complete LSC device (50 × 50 × 0.6 cm3) with 160 ppm Lumogen Red F305 concentration showed a power conversion efficiency (PCE) of 1.5%, equal to a maximum power production of 15 W/m2.
Depending on the greenhouse size, location, year season and technological innovation degree, a use could also be envisaged for ex situ phytoremediation activities. For example, by digging the contaminated soil at a certain depth it may be possible to place it inside the greenhouse and program the growth of plants on the soil to be reclaimed in any climatic season, considerably reducing the remediation times especially in the presence of contamination by organic compounds.
On a full scale, LSC panels can also be used as canopies, placed at a certain height on the area to be reclaimed, using appropriate anchoring systems, allowing the LSC properties to be exploited. The height of the panels should be established based on the potentially used agricultural machinery, and sowing should also be arranged in such a way as to allow access and use of these means.


 ,
, 


