
Anthropometric Profile and Physical Fitness Performance Comparison by Game Position in the Chile Women’s Senior National Football Team

 , ,
, ,  and
and
Abstract
:1. Introduction
2. Materials and Methods
2.1. Design
2.2. Participants
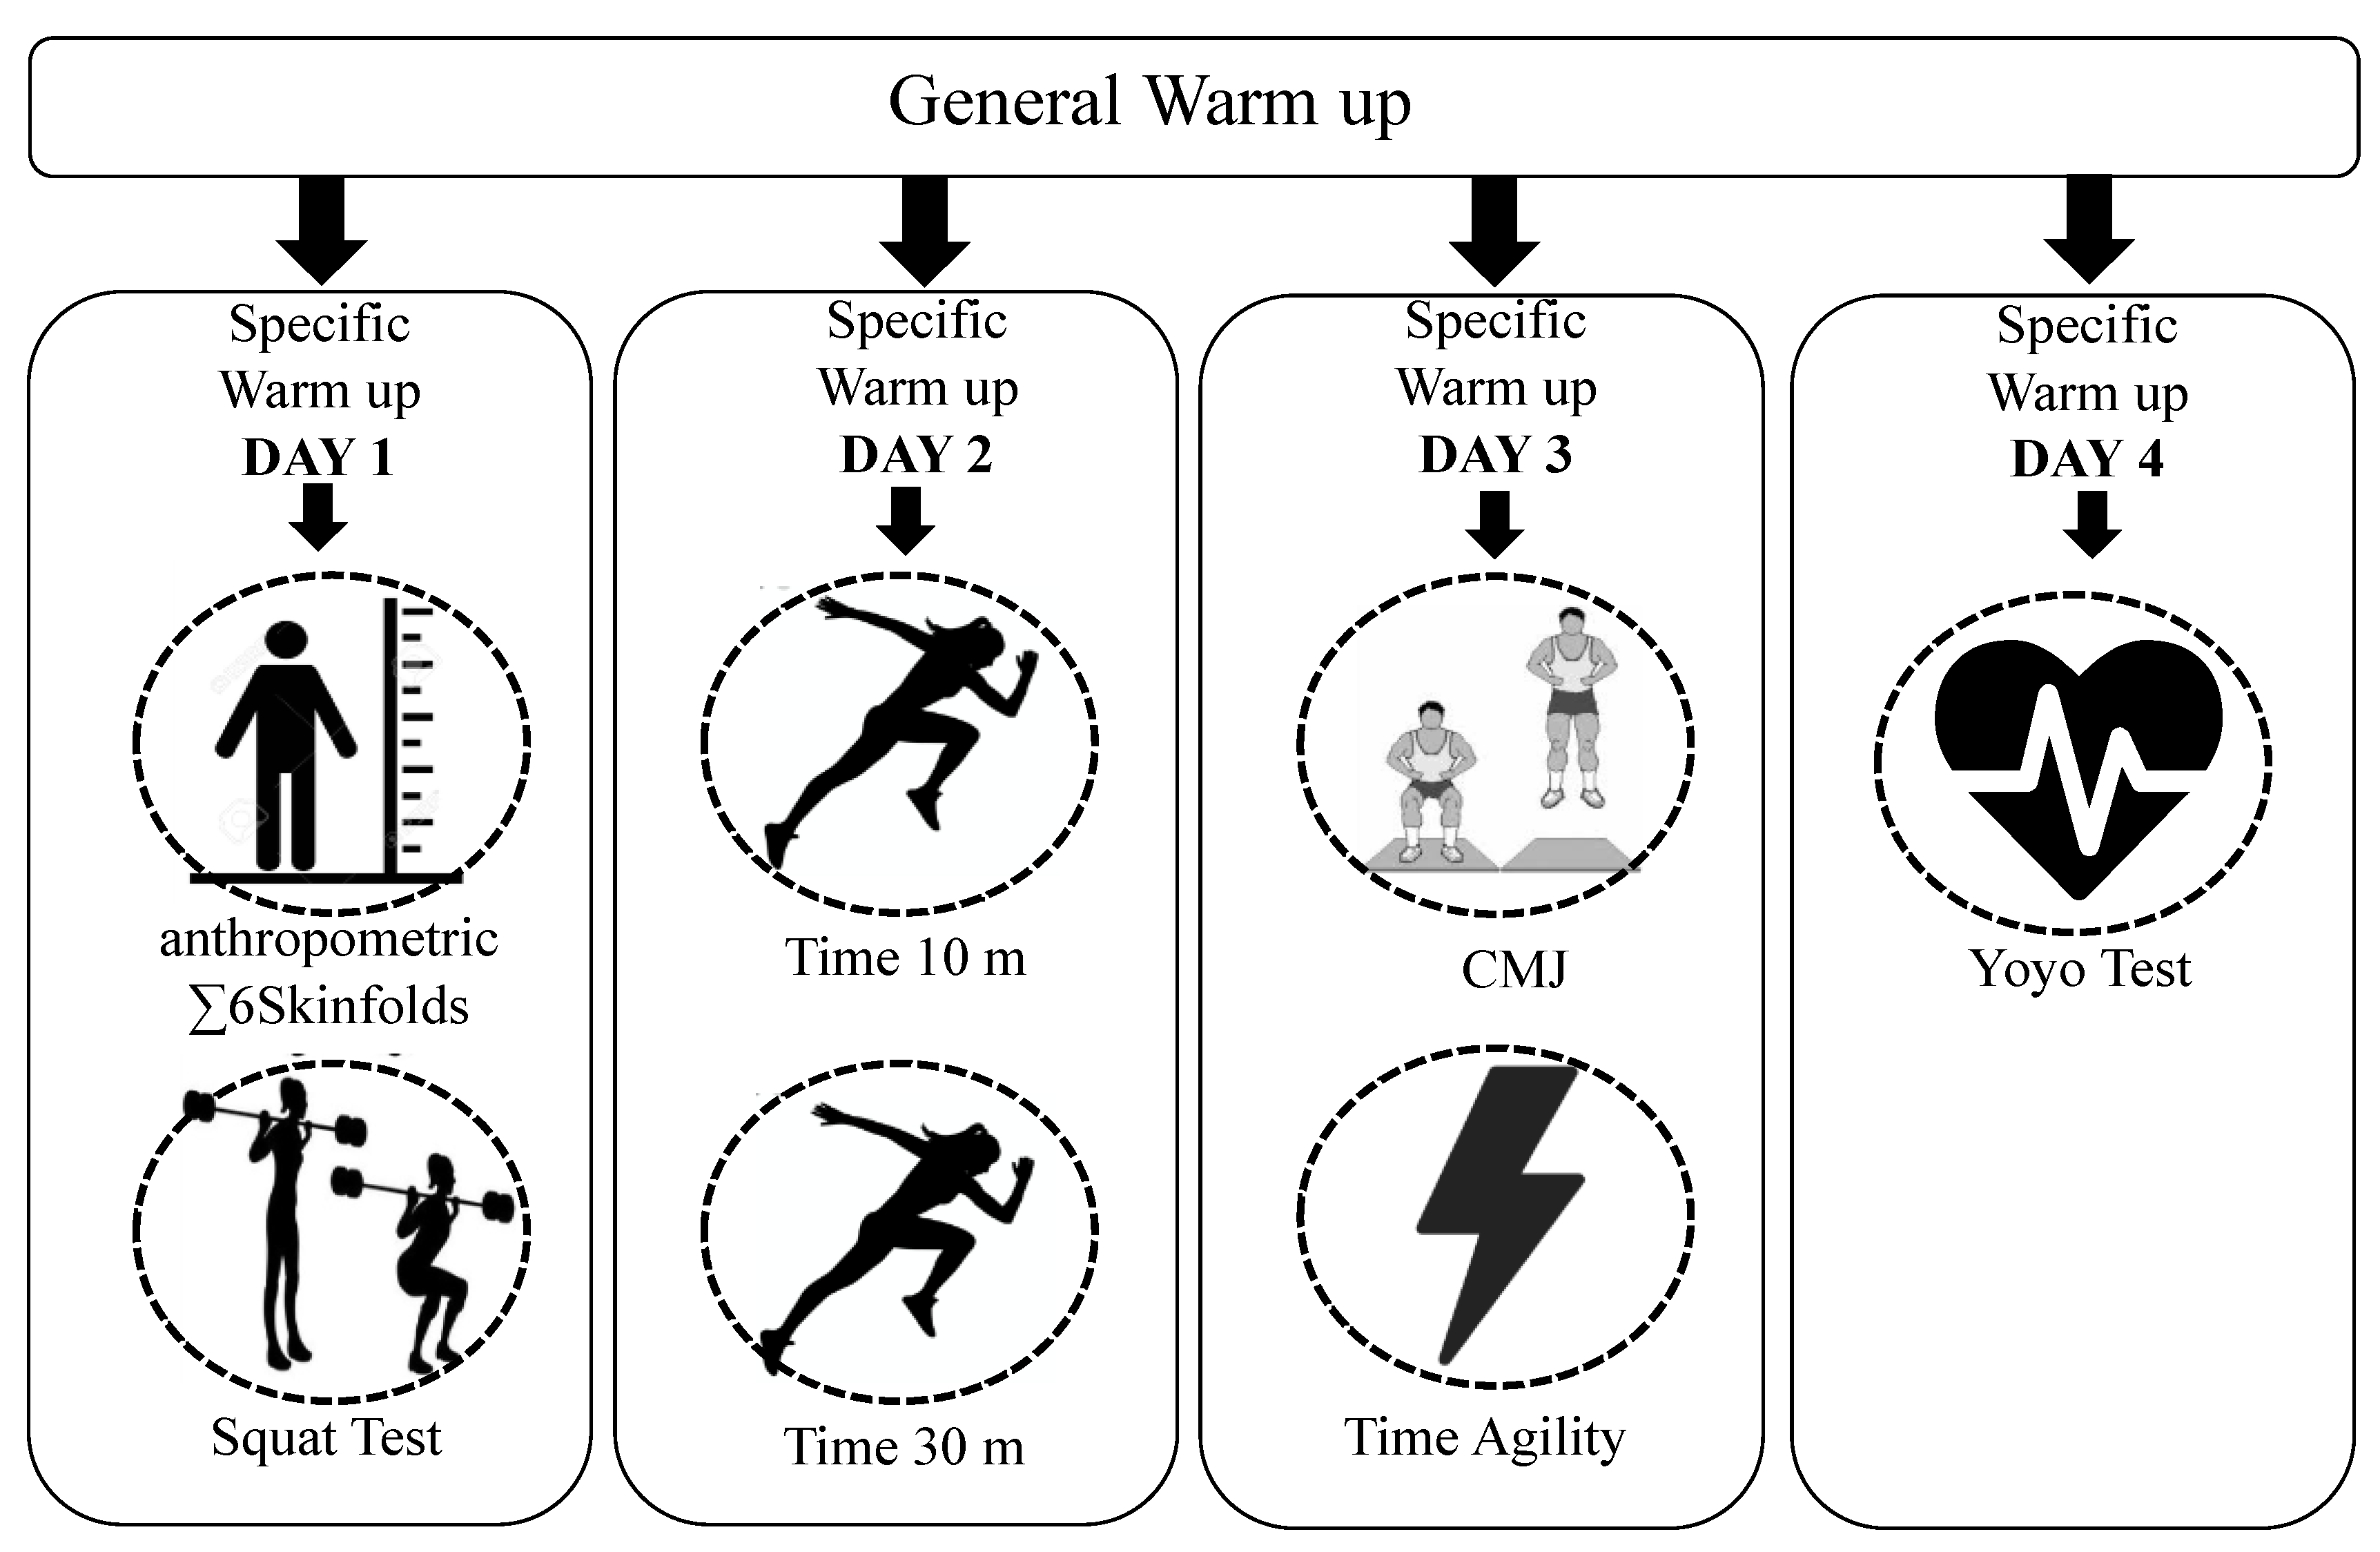
2.3. Temporalization
- Day 1: anthropometric evaluation and squat test (ST).
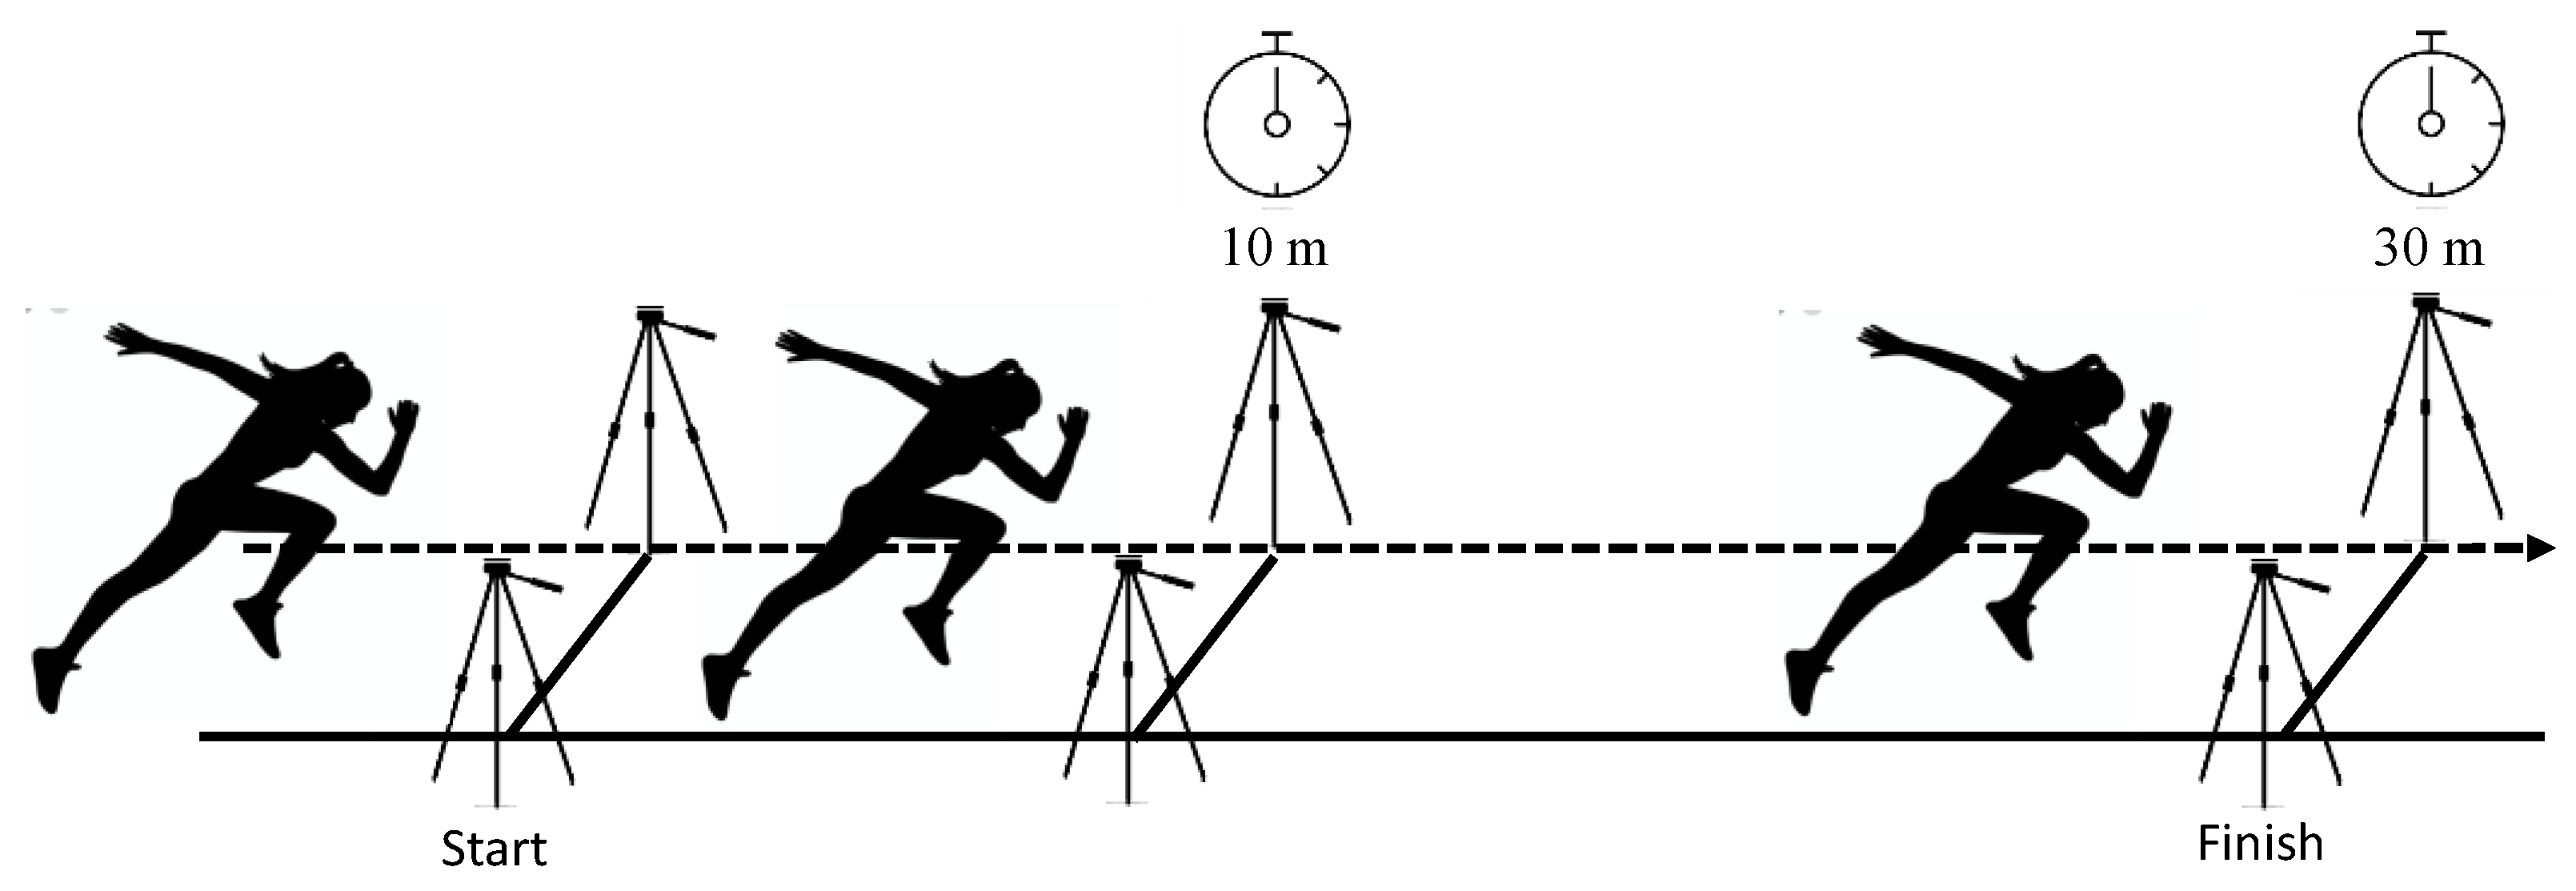
- Day 2: running speed, measured by the time to sprint 10 and 30 m (T10 and T30, respectively).
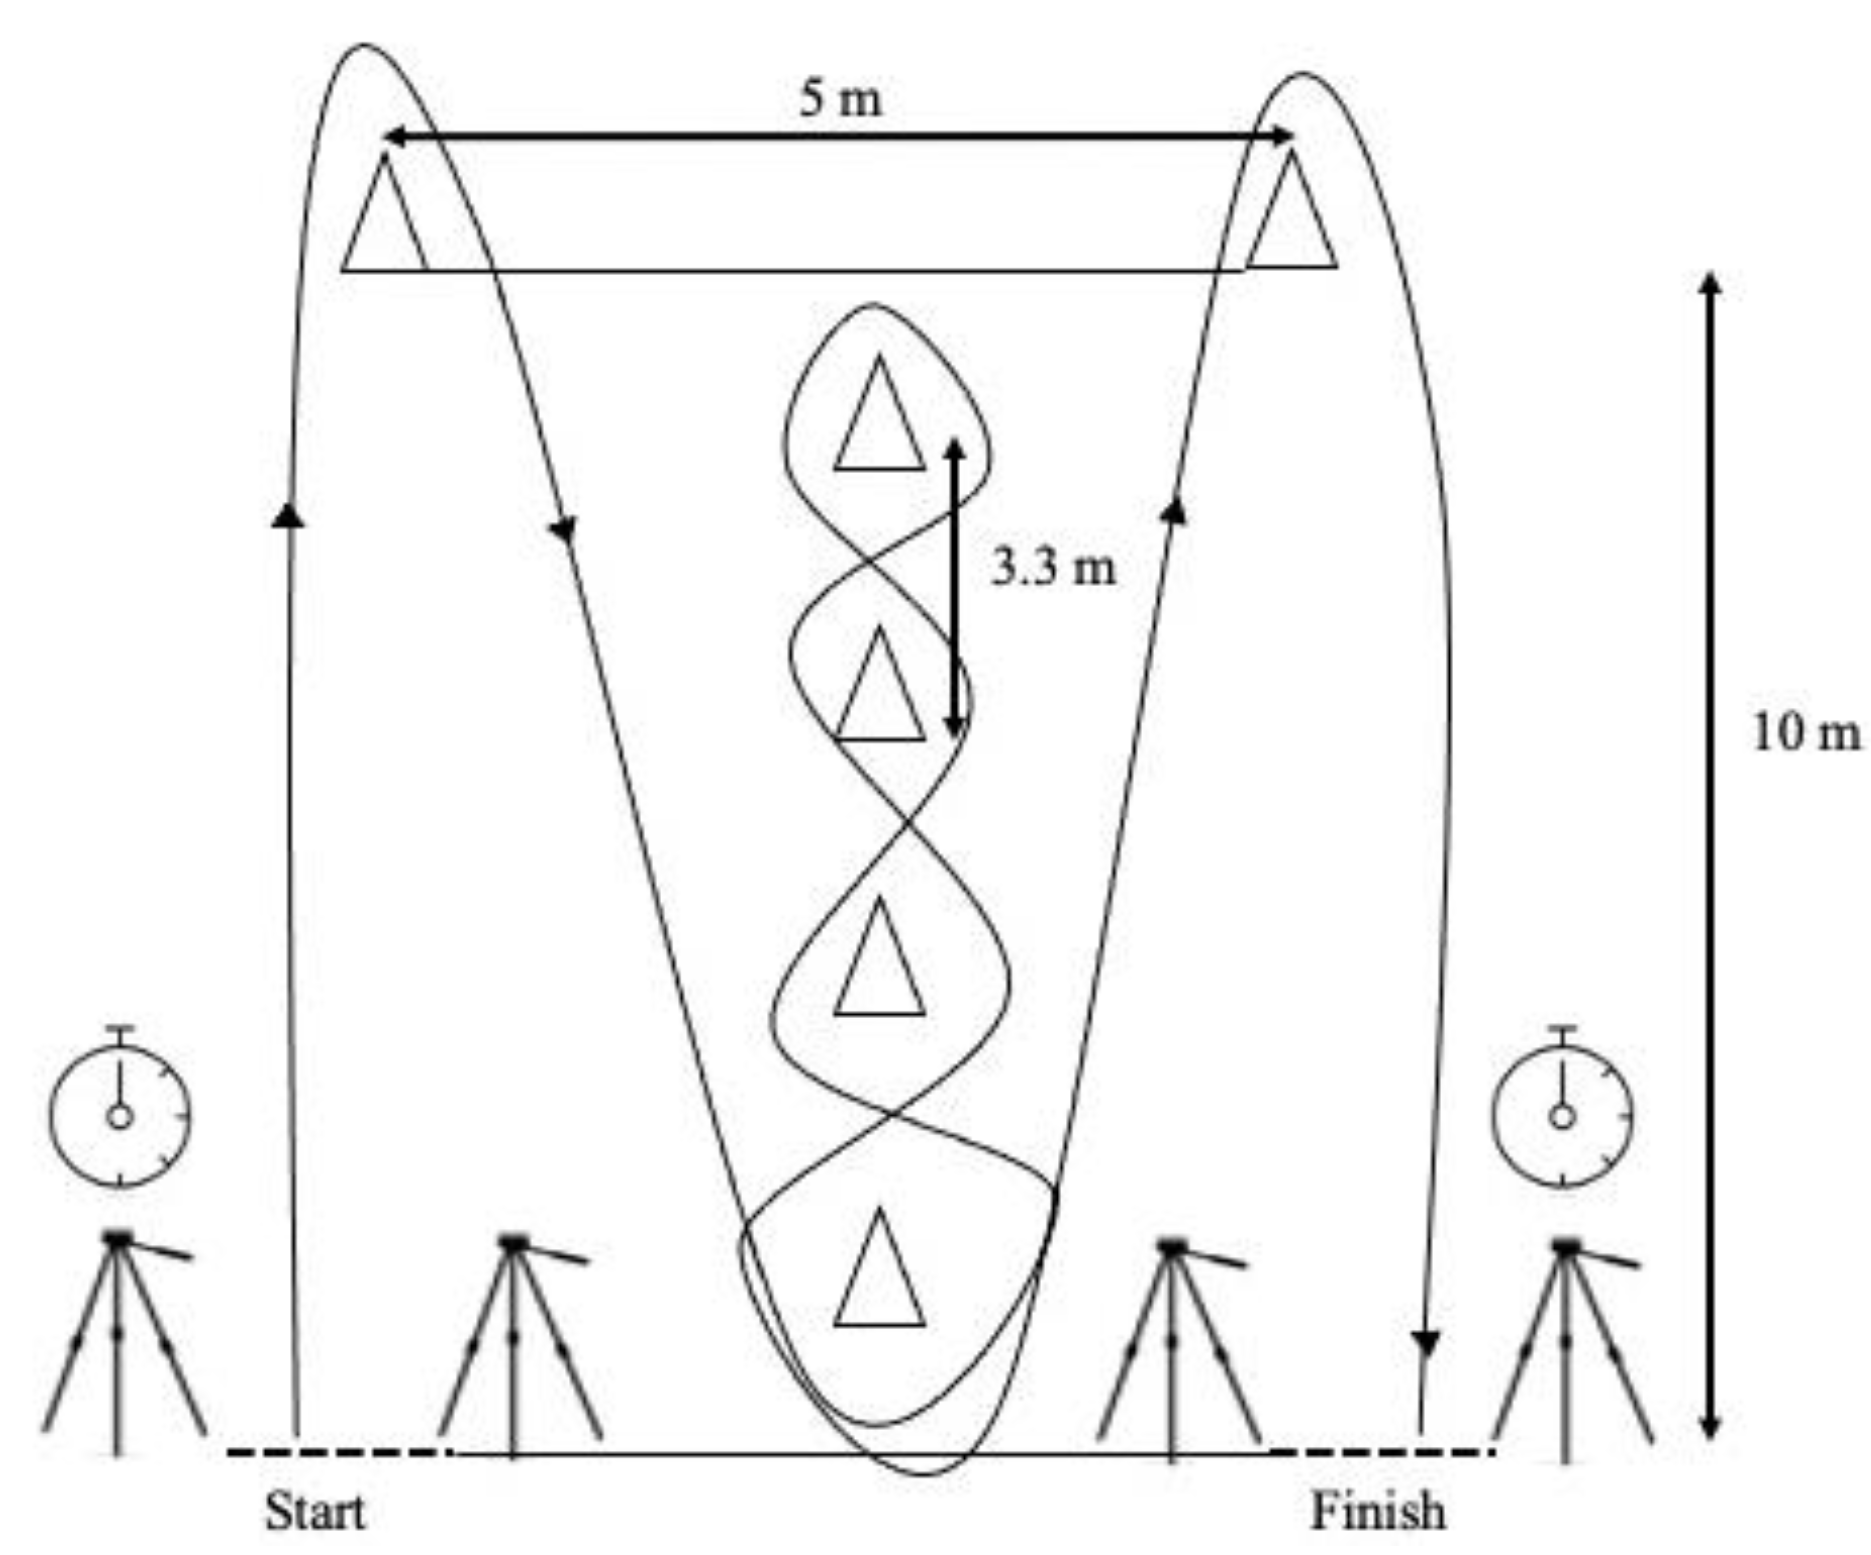
- Day 3: countermovement jump (CMJ) and agility test (AGI).
- Day 4: level-one yo-yo intermittent recovery test (MYYR1).
2.4. Procedure
2.4.1. Anthropometry
2.4.2. Squat Test
2.4.3. Time to Sprint 10 (T10) and 30 Meters (T30)
2.4.4. Illinois Agility Test (IAT)
2.4.5. Countermovement Jump (CMJ)
2.4.6. Level 1 Yo-Yo Intermittent Recovery Test (MYYR1)
2.5. Ethical Considerations
2.6. Statistical Analysis
3. Results
4. Discussion
5. Conclusions
6. Practical Applications
Author Contributions
Funding
Institutional Review Board Statement
Informed Consent Statement
Data Availability Statement
Acknowledgments
Conflicts of Interest
References
- Boone, J.; Vaeyens, R.; Steyaert, A.; Vanden Bosshe, L.; Bourgois, J. Physical Fitness of Elite Belgian Soccer Players by Player Position. J. Strength Cond. Res. 2012, 26, 2051–2057. [Google Scholar] [CrossRef] [PubMed] [Green Version]
- Manson, S.; Brughelli, M.; Harris, N.K. Physiological Characteristics of International Female Soccer Players. J. Strength Cond. Res. 2014, 28, 308–318. [Google Scholar] [CrossRef]
- Nikolaidis, P.T. Physical fitness in female soccer players by player position: A focus on anaerobic power. Hum. Mov. 2014, 15, 74–79. [Google Scholar] [CrossRef]
- Ingebrigtsen, J.; Dillern, T.; Shalfawi, S.A.I. Aerobic capacities and anthropometric characteristics of elite female soccer players. J. Strength Cond. Res. 2011, 25, 3352–3357. [Google Scholar] [CrossRef]
- FIFA. Physical Analysis of The Fifa Women’s World Cup France 2019. Available online: https://img.fifa.com/image/upload/zijqly4oednqa5gffgaz.pdf (accessed on 10 October 2020).
- Vescovi, J.D.; Favero, T.G. Motion characteristics of women’s college soccer matches: Female athletes in motion (faim) study. Int. J. Sports Physiol. Perform. 2014, 9, 405–414. [Google Scholar] [CrossRef] [PubMed]
- Mohr, M.; Krustrup, P.; Andersson, H.; Kirkendal, D.; Bangsbo, J. Match Activities of Elite Women Soccer Players at Diferent Performance Levels. J. Strength Cond. Res. 2008, 22, 341–349. [Google Scholar] [CrossRef]
- Mallo, J.; Mena, E.; Nevado, F.; Paredes, V. Physical Demands of Top-Class Soccer Friendly Matches in Relation to a Playing Position Using Global Positioning System Technology. J. Hum. Kinet. 2015, 47, 179–188. [Google Scholar] [CrossRef] [Green Version]
- Masanovic, B.; Vukcevic, A.; Spaic, S. Sport-Specific Morphology Profile: Differences in Anthropometric Characteristics between Elite Soccer and Basketball Players. J. Anthropol. Sport Phys. Educ. 2018, 2, 43–47. [Google Scholar] [CrossRef]
- Madic, D.M.; Andrasic, S.; Gusic, M.; Molnar, S.; Radanovic, D.; Trajkovic, N. Seasonal Body Composition Variations in Adolescent Soccer Players. Int. J. Morphol. 2018, 36, 877–880. [Google Scholar] [CrossRef]
- Kammoun, M.M.; Trabelsi, O.; Gharbi, A.; Masmoudi, L.; Ghorbel, S.; Tabka, Z.; Chamari, K. Anthropometric and physical fitness profiles of Tunisian female soccer players: Associations with field position. Acta Gymnica 2020, 50, 130–137. [Google Scholar] [CrossRef]
- Gjonbalaj, M.; Georgiev, G.; Bjelica, D. Differences in Anthropometric Characteristics, Somatotype Components, and Functional Abilities Among Young Elite Kosovo Soccer Players Based on Team Position. Int. J. Morphol. 2018, 36, 41–47. [Google Scholar] [CrossRef] [Green Version]
- Sæther, S.A. Characteristics of Professional and Non-Professional Football Players—An Eight-Year Follow-Up of Three Age Cohorts. Montenegrin J. Sport. Sci. Med. 2017, 6, 13–18. [Google Scholar] [CrossRef]
- Barraza, F.; Yáñez, R.; Báez, E.; Rosales, G. Características Antropométricas por Posición de Juego en Mujeres Futbolistas Chilenas de la Región de Valparaíso, Chile. Int. J. Morphol. 2015, 33, 1225–1230. [Google Scholar] [CrossRef] [Green Version]
- Risso, F.G.; Jalilvand, F.; Orjalo, A.J.; Moreno, M.R.; Davis, D.L.; Birmingham-Babauta, S.A.; Stokes, J.J.; Stage, A.A.; Liu, T.M.; Giuliano, D.V.; et al. Physiological Characteristics of Projected Starters and Non-Starters in the Field Positions from a Division I Women’s Soccer Team. Int. J. Exerc. Sci. 2017, 10, 568–579. [Google Scholar] [PubMed]
- Turner, A.; Walker, S.; Stembridge, M.; Coneyworth, P.; Reed, G.; Birdsey, L.; Barter, P.; Moody, J. A Testing Battery for the Assessment of Fitness in Soccer Players. Strength Cond. J. 2011, 33, 29–39. [Google Scholar] [CrossRef] [Green Version]
- Krustrup, P.; Mohr, M.; Amstrup, T.; Rysgaard, T.; Johansen, J.; Steensberg, A.; Pedersen, P.K.; Bangsbo, J. The Yo-Yo intermittent recovery test: Physiological response, reliability, and validity. Med. Sci. Sports Exerc. 2003, 35, 697–705. [Google Scholar] [CrossRef] [PubMed]
- Doyle, B.; Browne, D.; Horan, D. Differences in anthropometric and physical performance characteristics between U17, U19, and Senior Irish female international football players. Int. J. Sports Sci. Coach. 2020, 174795412096819. [Google Scholar] [CrossRef]
- Haugen, T.A.; Breitschädel, F.; Seiler, S. Sprint mechanical properties in soccer players according to playing standard, position, age and sex. J. Sports Sci. 2020, 38, 1070–1076. [Google Scholar] [CrossRef]
- Booysen, M.J.; Gradidge, P.J.-L.; Constantinou, D. Anthropometric and Motor Characteristics of South African National Level Female Soccer Players. J. Hum. Kinet. 2019, 66, 121–129. [Google Scholar] [CrossRef] [Green Version]
- Milanović, Z.; Sporiš, G.; James, N.; Trajković, N.; Ignjatović, A.; Sarmento, H.; Trecroci, A.; Mendes, B.M.B. Physiological Demands, Morphological Characteristics, Physical Abilities and Injuries of Female Soccer Players. J. Hum. Kinet. 2017, 60, 77–83. [Google Scholar] [CrossRef] [Green Version]
- Datson, N.; Hulton, A.; Andersson, H.; Lewis, T.; Weston, M.; Drust, B.; Gregson, W. Applied Physiology of Female Soccer: An Update. Sports Med. 2014, 44, 1225–1240. [Google Scholar] [CrossRef] [Green Version]
- García-Pinillos, F.; Ruiz-Ariza, A.; Moreno Del Castillo, R.; Latorre-Román, P.A. Impact of limited hamstring flexibility on vertical jump, kicking speed, sprint, and agility in young football players. J. Sports Sci. 2015, 33, 1293–1297. [Google Scholar] [CrossRef]
- Lillo, C.; Carlos, S.; Aguilera, J.; Roco, A.; Benjamín, V.; Carillo, Í.; Alberto, R. Perfil morfológico de jugadoras profesionales de fútbol en Chile. MediSur 2019, 16, 248–258. [Google Scholar]
- Moreira, A.; Massa, M.; Thiengo, C.R.; Rodrigues Lopes, R.A.; Lima, M.R.; Vaeyens, R.; Barbosa, W.P.; Aoki, M.S. Is the technical performance of young soccer players influenced by hormonal status, sexual maturity, anthropometric profile, and physical performance? Biol. Sport 2017, 34, 305–311. [Google Scholar] [CrossRef] [Green Version]
- Soto Silva, V.H.; Huerta Ojeda, Á. Perfil Antropométrico De Los Países Participantes Del Campeonato Sudamericano Juvenil Femenino De Fútbol Año 2006. Mot. Hum. 2013, 14, 29–35. [Google Scholar] [CrossRef]
- Vescovi, J.D.; Mcguigan, M.R. Relationships between sprinting, agility, and jump ability in female athletes. J. Sports Sci. 2008, 26, 97–107. [Google Scholar] [CrossRef]
- Kubayi, A.; Paul, Y.; Mahlangu, P.; Toriola, A. Physical Performance and Anthropometric Characteristics of Male South African University Soccer Players. J. Hum. Kinet. 2017, 60, 153–158. [Google Scholar] [CrossRef] [Green Version]
- Slimani, M.; Nikolaidis, P.T. Anthropometric and physiological characteristics of male Soccer players according to their competitive level, playing position and age group: A systematic review. J. Sports Med. Phys. Fitness 2017, 59, 141–163. [Google Scholar] [CrossRef]
- González-Badillo, J.J.; Marques, M.; Sánchez-Medina, L. The Importance of Movement Velocity as a Measure to Control Resistance Training Intensity. J. Hum. Kinet. 2011, 29, 15–19. [Google Scholar] [CrossRef] [PubMed]
- Pareja-Blanco, F.; Suarez-Arrones, L.; Rodríguez-Rosell, D.; López-Segovia, M.; Jiménez-Reyes, P.; Bachero-Mena, B.; González-Badillo, J.J. Evolution of determinant factors of repeated sprint ability. J. Hum. Kinet. 2016, 54, 115–126. [Google Scholar] [CrossRef] [Green Version]
- Torres-Torrelo, J.; Rodríguez-Rosell, D.; González-Badillo, J.J. Light-load maximal lifting velocity full squat training program improves important physical and skill characteristics in futsal players. J. Sports Sci. 2017, 35, 967–975. [Google Scholar] [CrossRef]
- Sánchez-Medina, L.; Pallarés, J.; Pérez, C.; Morán-Navarro, R.; González-Badillo, J. Estimation of Relative Load From Bar Velocity in the Full Back Squat Exercise. Sports Med. Int. Open 2017, 01, E80–E88. [Google Scholar] [CrossRef]
- Baumgart, C.; Freiwald, J.; Hoppe, M. Sprint Mechanical Properties of Female and Different Aged Male Top-Level German Soccer Players. Sports 2018, 6, 161. [Google Scholar] [CrossRef] [Green Version]
- Hammami, M.A.; Ben Klifa, W.; Ben Ayed, K.; Mekni, R.; Saeidi, A.; Jan, J.; Zouhal, H. Physical performances and anthropometric characteristics of young elite North-African female soccer players compared with international standards. Sci. Sports 2020, 35, 67–74. [Google Scholar] [CrossRef]
- Bishop, C.; Turner, A.; Maloney, S.; Lake, J.; Loturco, I.; Bromley, T.; Read, P. Drop Jump Asymmetry is Associated with Reduced Sprint and Change-of-Direction Speed Performance in Adult Female Soccer Players. Sports 2019, 7, 29. [Google Scholar] [CrossRef] [Green Version]
- Negra, Y.; Chaabene, H.; Amara, S.; Jaric, S.; Hammami, M.; Hachana, Y. Evaluation of the Illinois Change of Direction Test in Youth Elite Soccer Players of Different Age. J. Hum. Kinet. 2017, 58, 215–224. [Google Scholar] [CrossRef] [Green Version]
- Amiri-Khorasani, M.; Sahebozamani, M.; Tabrizi, K.G.; Yusof, A.B. Acute Effect of Different Stretching Methods on Illinois Agility Test in Soccer Players. J. Strength Cond. Res. 2010, 24, 2698–2704. [Google Scholar] [CrossRef] [Green Version]
- Deprez, D.; Coutts, A.J.; Lenoir, M.; Fransen, J.; Pion, J.; Philippaerts, R.; Vaeyens, R. Reliability and validity of the Yo-Yo intermittent recovery test level 1 in young soccer players. J. Sports Sci. 2014, 32, 903–910. [Google Scholar] [CrossRef]
- Fanchini, M.; Castagna, C.; Coutts, A.J.; Schena, F.; McCall, A.; Impellizzeri, F.M. Are the Yo-Yo intermittent recovery test levels 1 and 2 both useful? Reliability, responsiveness and interchangeability in young soccer players. J. Sports Sci. 2014, 32, 1950–1957. [Google Scholar] [CrossRef]
- Karakoç, B.; Akalan, C.; Alemdaroğlu, U.; Arslan, E. The Relationship between the Yo-Yo Tests, Anaerobic Performance and Aerobic Performance in Young Soccer Players. J. Hum. Kinet. 2012, 35, 81–88. [Google Scholar] [CrossRef]
- Martínez-Lagunas, V.; Hartmann, U. Validity of the Yo-Yo Intermittent Recovery Test Level 1 for Direct Measurement or Indirect Estimation of Maximal Oxygen Uptake in Female Soccer Players. Int. J. Sports Physiol. Perform. 2014, 9, 825–831. [Google Scholar] [CrossRef]
- Bangsbo, J.; Iaia, F.M.; Krustrup, P. The Yo-Yo Intermittent Recovery Test. Sport. Med. 2008, 38, 37–51. [Google Scholar] [CrossRef] [PubMed]
- Hopkins, W.G.; Marshall, S.W.; Batterham, A.M.; Hanin, J. Progressive statistics for studies in sports medicine and exercise science. Med. Sci. Sports Exerc. 2009, 41, 3–12. [Google Scholar] [CrossRef] [PubMed] [Green Version]
- FIFA. Physical Analysis of the FIFA Women’s World Cup Canada 2015. Available online: https://resources.fifa.com/image/upload/canada-2015-physical-analysis-2812487.pdf?cloudid=agoxuqlps0zbiuyudcv0 (accessed on 8 October 2020).
- Lockie, R.G.; Moreno, M.R.; Lazar, A.; Orjalo, A.J.; Giuliano, D.V.; Risso, F.G.; Davis, D.L.; Crelling, J.B.; Lockwood, J.R.; Jalilvand, F. The physical and athletic performance characteristics of division I collegiate female soccer players by position. J. Strength Cond. Res. 2018, 32, 334–343. [Google Scholar] [CrossRef] [PubMed]
- Case, M.J.; Knudson, D.V.; Downey, D.L. Barbell Squat Relative Strength as an Identifier for Lower Extremity Injury in Collegiate Athletes. J. Strength Cond. Res. 2020, 34, 1249–1253. [Google Scholar] [CrossRef]
- Faude, O.; Koch, T.; Meyer, T. Straight sprinting is the most frequent action in goal situations in professional football. J. Sports Sci. 2012, 30, 625–631. [Google Scholar] [CrossRef] [PubMed]
- Romero-Caballero, A.; Varela-Olalla, D.; Loëns-Gutiérrez, C. Fitness evaluation in young and amateur soccer players: Reference values for vertical jump and aerobic fitness in men and women. Sci. Sports 2020. [Google Scholar] [CrossRef]
- Sedano, S.; Vaeyens, R.; Philippaerts, R.M.; Redondo, J.C.; Cuadrado, G. Anthropometric and anaerobic fitness profile of elite and non-elite female soccer players. J. Sports Med. Phys. Fitness 2009, 49, 387–394. [Google Scholar]
- Bradley, P.S.; Dellal, A.; Mohr, M.; Castellano, J.; Wilkie, A. Gender differences in match performance characteristics of soccer players competing in the UEFA Champions League. Hum. Mov. Sci. 2014, 33, 159–171. [Google Scholar] [CrossRef]
- Marcote-Pequeño, R.; García-Ramos, A.; Cuadrado-Peñafiel, V.; González-Hernández, J.M.; Gómez, M.Á.; Jiménez-Reyes, P. Association between the force–velocity profile and performance variables obtained in jumping and sprinting in elite female soccer players. Int. J. Sports Physiol. Perform. 2019, 14, 209–215. [Google Scholar] [CrossRef] [PubMed]
- Jiménez-Reyes, P.; Samozino, P.; García-Ramos, A.; Cuadrado-Peñafiel, V.; Brughelli, M.; Morin, J.B. Relationship between vertical and horizontal force-velocity-power profiles in various sports and levels of practice. PeerJ 2018, 2018, 1–18. [Google Scholar] [CrossRef]
- Emmonds, S.; Nicholson, G.; Begg, C.; Jones, B.; Bissas, A. Importance of physical qualities for speed and change of direction ability in elite female soccer players. J. Strength Cond. Res. 2019, 33, 1669–1677. [Google Scholar] [CrossRef]
- Brocherie, F.; Girard, O.; Forchino, F.; Al Haddad, H.; Dos Santos, G.A.; Millet, G.P. Relationships between anthropometric measures and athletic performance, with special reference to repeated-sprint ability, in the Qatar national soccer team. J. Sports Sci. 2014, 32, 1243–1254. [Google Scholar] [CrossRef]
- Mujika, I.; Santisteban, J.; Impellizzeri, F.M.; Castagna, C. Fitness determinants of success in men’s and women’s football. J. Sports Sci. 2009, 27, 107–114. [Google Scholar] [CrossRef]
- Bajramovic, I.; Likic, S.; Talovic, M.; Alic, H.; Jeleskovic, E.; Sporis, G. Differences in the Level of Morphological Characteristics, Speed Abilities and Aerobic Endurance in Relation to the Team Position of Top Female Football Players. J. Anthropol. Sport Phys. Educ. 2018, 2, 127–130. [Google Scholar] [CrossRef]


| Variables | Goalkeepers (n = 7) | Defenders (n = 14) | Midfielders (n = 13) | Forwards (n = 16) | Intergroup Comparisons | |||||
|---|---|---|---|---|---|---|---|---|---|---|
| M ± SD | CI (95%) | M ± SD | CI (95%) | M ± SD | CI (95%) | M ± SD | CI (95%) | p Value * | Effect Size ¥ | |
| Age (years) | 25 ± 5.5 | (19.8–30.1) | 24.6 ± 4.6 | (21.9–27.3) | 24.9 ± 4.2 | (22.3–27.4) | 23.8 ± 4.5 | (21.4–26.3) | 0.921 | 0.010 |
| Weight (kg) | 66.7 ± 5.05 abc | (62–71.4) | 58.4 ± 4.4 a | (55.9–61) | 59.7 ± 4.8 b | (56.7–62.6) | 56.2 ± 5.3 c | (53.4–59.1) | <0.001 | 0.330 |
| Height (cm) | 172.5 ± 6.6 abc | (166.3–178.7) | 159.4 ± 4.2 a | (157–161.8) | 161.7 ± 4.5 b | (159–164.5) | 159 ± 5.8 c | (159–155.8) | 0.002 | 0.445 |
| %Fat | 28.12 ± 1.62 a | (26.61–29.6) | 26.49 ± 2.77 | (24.88–28.09) | 25.44 ± 2.77 | (23.76–27.1) | 24.24 ± 2.55 a | (22.87–25.6) | 0.010 | 0.216 |
| %Muscle | 45.93 ± 2.40 | (43.71–48.1) | 46.63 ± 2.72 | (45.05–48.2) | 47.16 ± 2.73 | (45.51–48.8) | 48.60 ± 1.99 | (47.54–49.6) | 0.067 | 0.143 |
| Σ6Skinfold | 67.78 ± 13.3 | (55.45–80.1) | 68.5 ± 14.3 | (60.19–76.8) | 64.15 ± 13.31 | (56.10–72.1) | 55.31 ± 13.92 | (47.89–62.7) | 0.057 | 0.150 |
| Goalkeepers (n = 7) | Defenders (n = 14) | Midfielders (n = 13) | Forwards (n = 16) | Intergroup Comparisons | ||||||
|---|---|---|---|---|---|---|---|---|---|---|
| M ± SD | CI (95%) | M ± SD | CI (95%) | M ± SD | CI (95%) | M ± SD | CI (95%) | p Value * | Effect Size ¥ | |
| MPV (m/s) | 0.97 ± 0.11 | (0.86–1.08) | 0.95 ± 0.09 | (0.87–1.01) | 0.96 ± 0.09 | (0.90–1.02) | 1.00 ± 1.11 | (0.94–1.06) | 0.608 | 0.039 |
| 1RM (kg) | 79.70 ± 8.29 | (72.0–87.3) | 82.08 ± 6.61 | (78.2–85.9) | 79.29 ± 6.56 | (75.32–83.25) | 82.35 ± 9.11 | (77.49–87.21) | 0.664 | 0.033 |
| RS (RM/BW) | 1.19 ± 0.13 ab | (1.07–1.31) | 1.41 ± 0.17 a | (1.31–1.51) | 1.33 ± 0.12 | (1.25–1.40) | 1.46 ± 0.13 b | (1.39–1.54) | 0.001 | 0.290 |
| T10 (s) | 2.06 ± 0.04 abc | (2.02–2.10) | 1.95 ± 0.09 ad | (1.89–2.00) | 1.95 ± 0.06 be | (1.91–1.99) | 1.86 ± 0.08 cde | (1.82–1.91) | <0.001 | 0.422 |
| T30 (s) | 5.12 ± 0.05 abc | (5.07–5.17) | 4.76 ± 0.12 ad | (4.69–4.83) | 4.84 ± 0.15 be | (4.75–4.93) | 4.61 ± 0.17 cde | (4.52–4.70) | <0.001 | 0.580 |
| IAT (s) | 17.7 ± 0.12 abc | (17.6–17.9) | 16.92 ± 0.33 a | (16.73–17.11) | 17.2 ± 0.33 bd | (17.00–17.41) | 16.81 ± 0.39 cd | (16.6–17.02) | <0.001 | 0.500 |
| CMJ (cm) | 30.6 ± 2.5 | (28.3–33) | 28.70 ± 4.41 | (26.15–31.25) | 28.08 ± 3.00 | (26.26–29.90) | 31.88 ± 5.24 | (29.08–34.67) | 0.076 | 0.137 |
| MYYR1 (m) | 902 ± 198.4 abc | (719.3–1086.4) | 1314.2 ± 238.8 a | (1176.3–1452.2) | 1486.1 ± 235.4 b | (1343.8–1628.4) | 1402.5 ± 297.3 c | (1244.05–1560.94) | <0.001 | 0.362 |
| VO2 max (mL/kg/m) | 43.9 ± 1.66 abc | (42.4–45.5) | 47.44 ± 2 a | (46.28–48.59) | 48.88 ± 1.97 b | (47.68–50.07) | 48.18 ± 2.49 c | (46.85–49.51) | <0.001 | 0.362 |
| Variables | Weight | Height | %G | %M | ∑6fold | MPV | 1RM | RS | T10 | T30 | IAT | CMJ |
|---|---|---|---|---|---|---|---|---|---|---|---|---|
| Height | −0.178 | |||||||||||
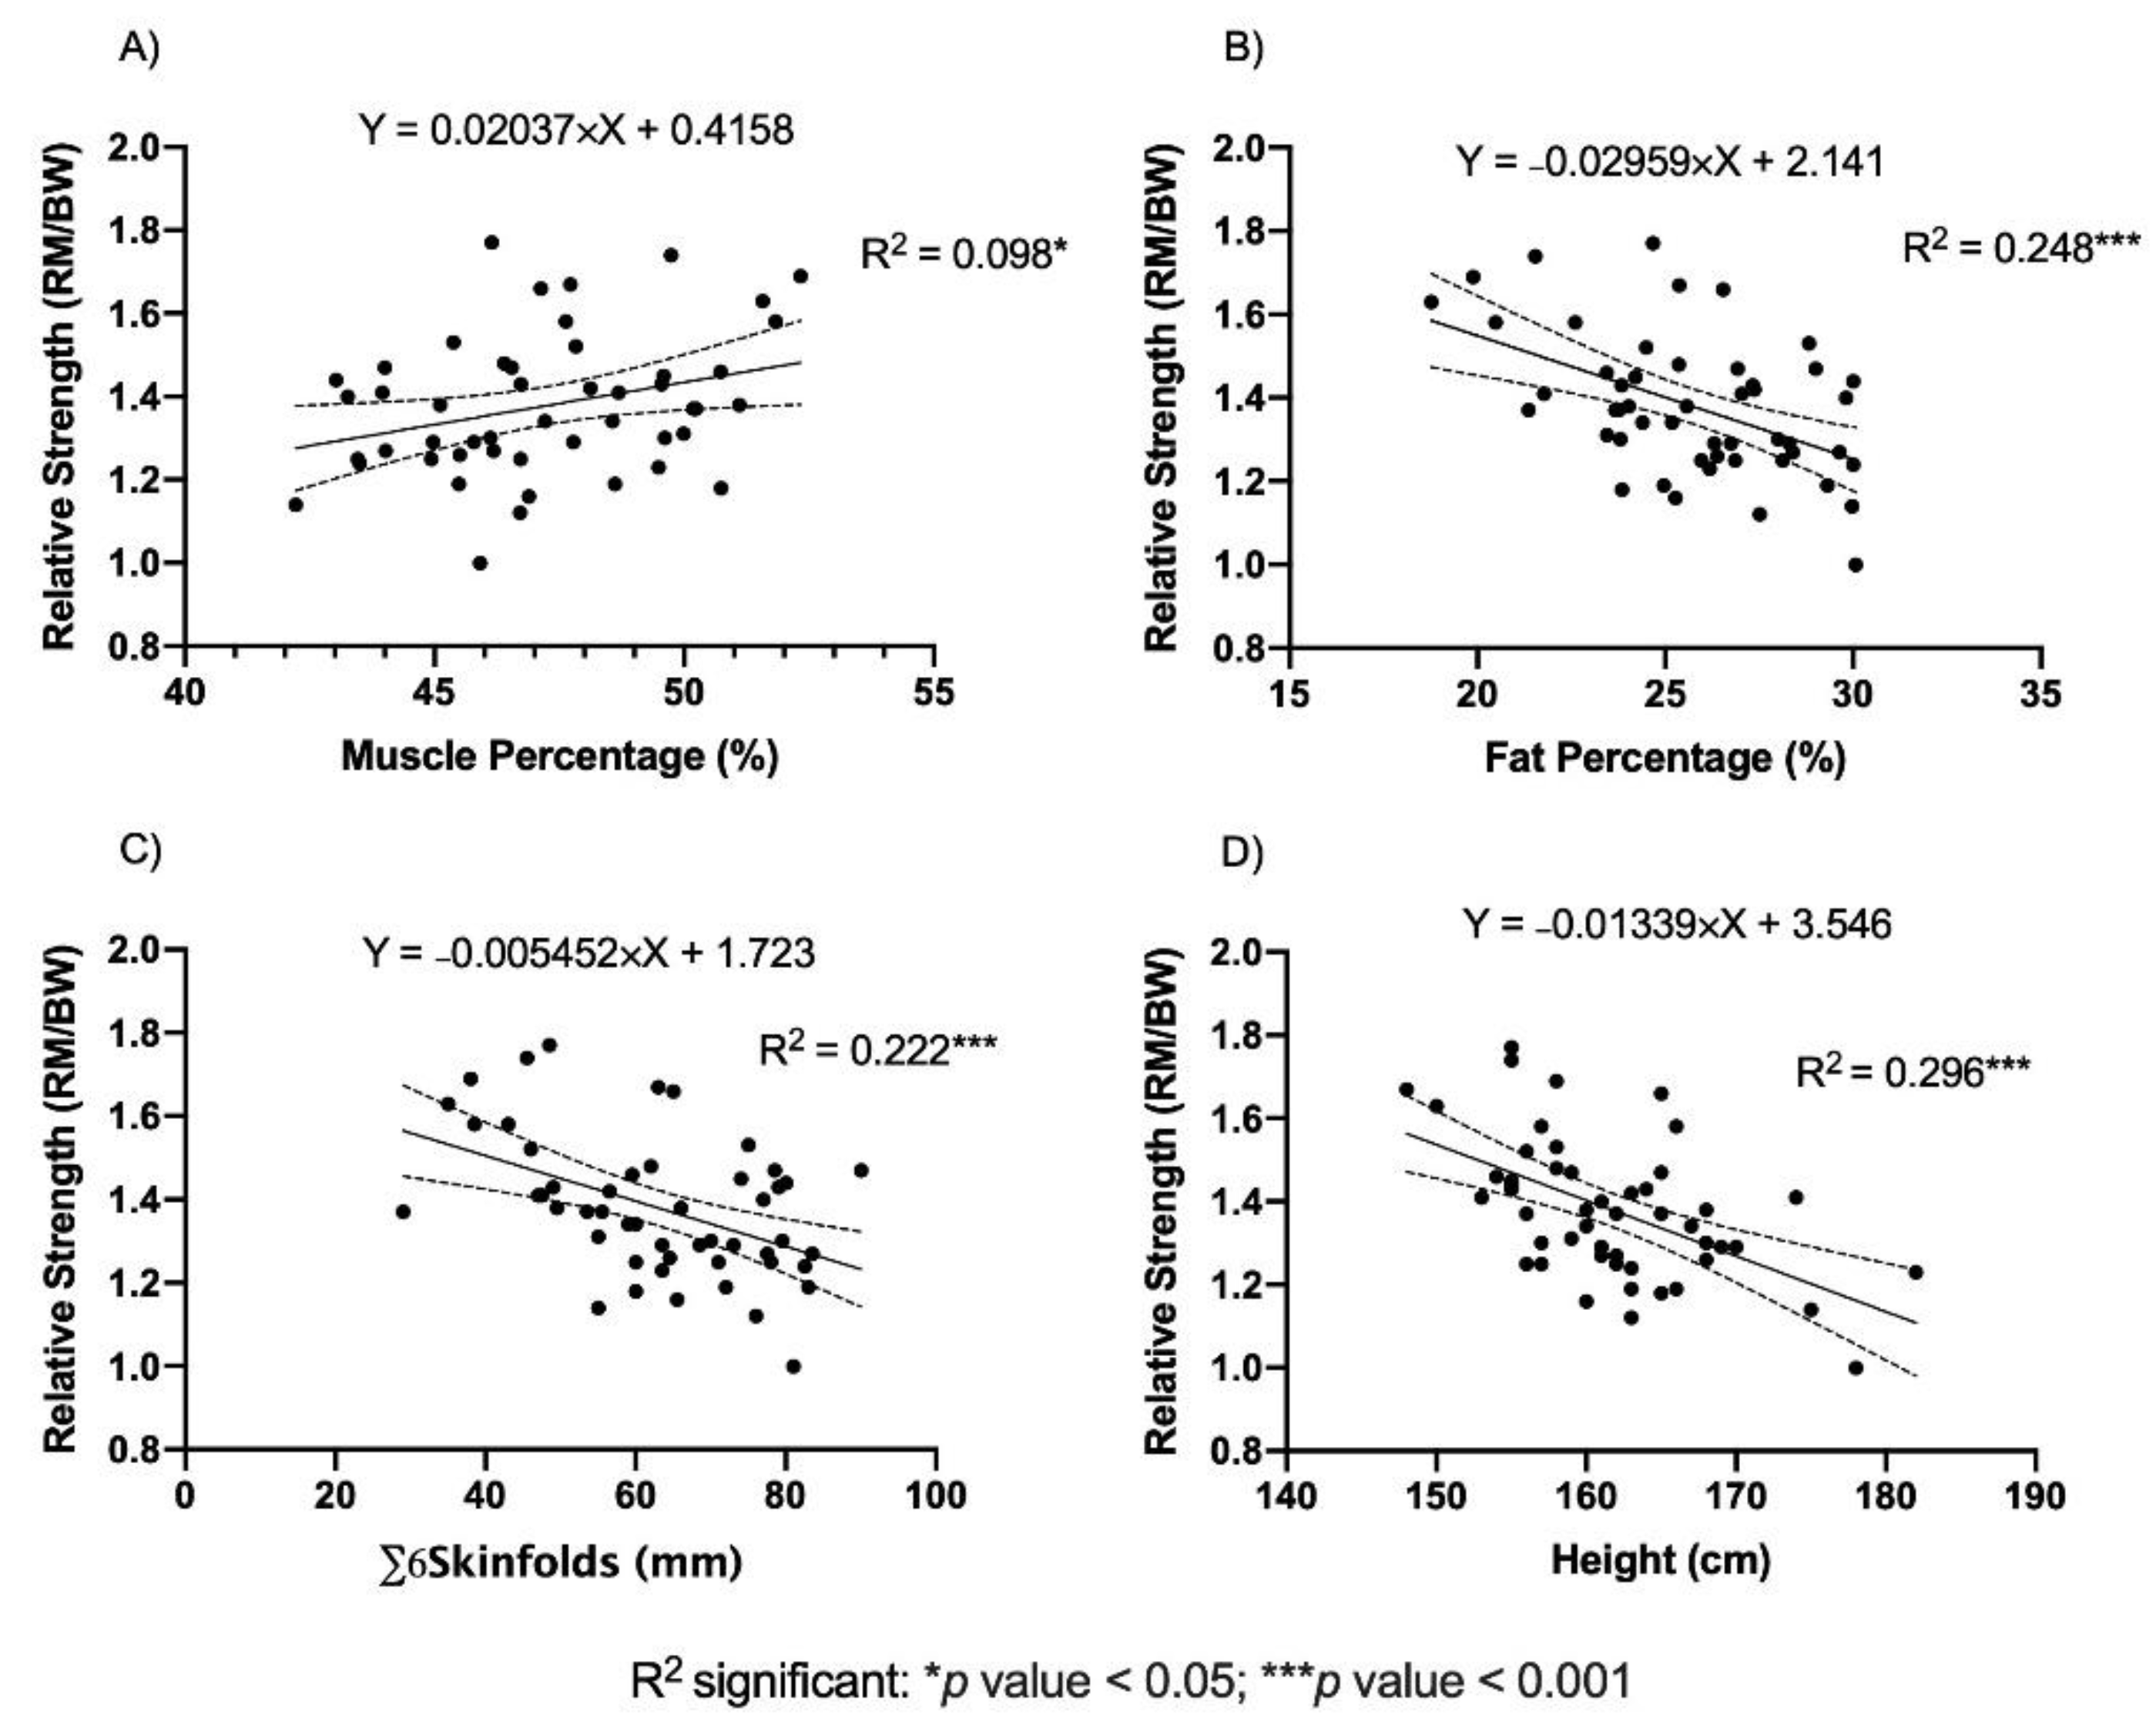
| %Fat | 0.418 ** | 0.302 * | ||||||||||
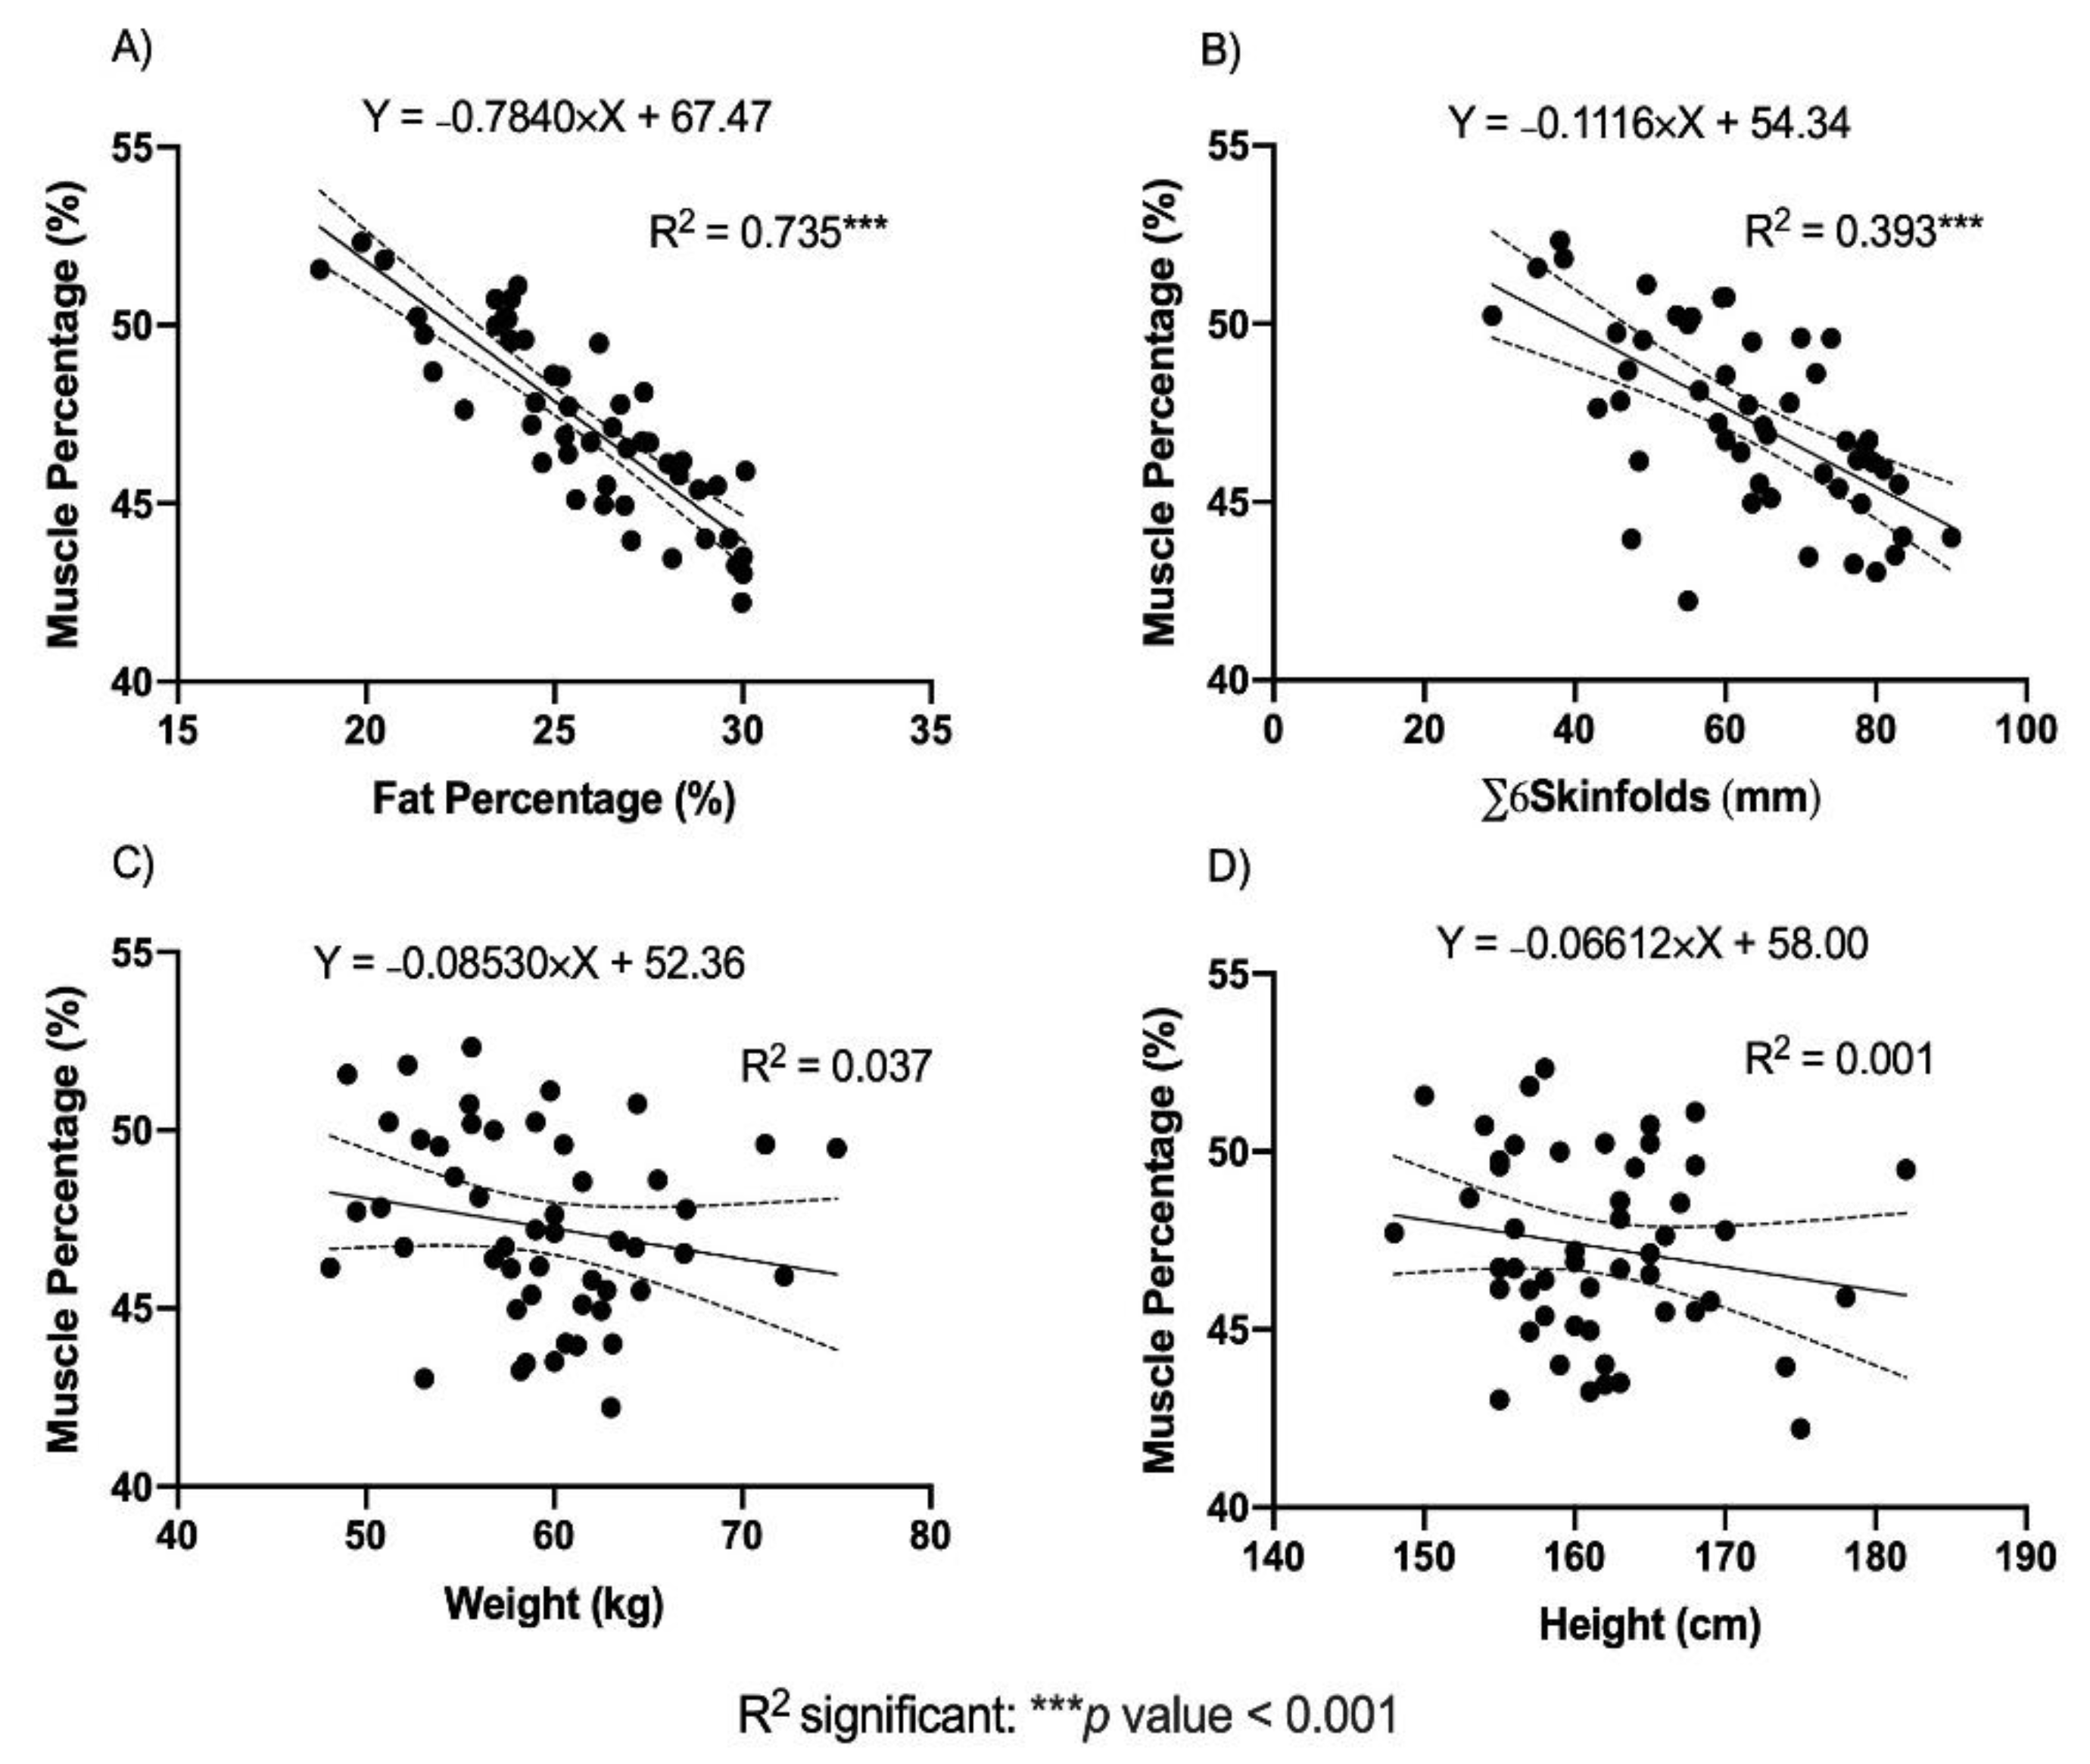
| %Muscle | −0.192 | −0.164 | −0.858 ** | |||||||||
| Σ6Skinfold | 0.527 ** | 0.112 | 0.823 ** | −0.627 ** | ||||||||
| MPV | 0.182 | 0.075 | −0.248 | 0.210 | −0.202 | |||||||
| 1RM | 0.208 | −0.066 | −0.190 | 0.184 | −0.034 | 0.812 ** | ||||||
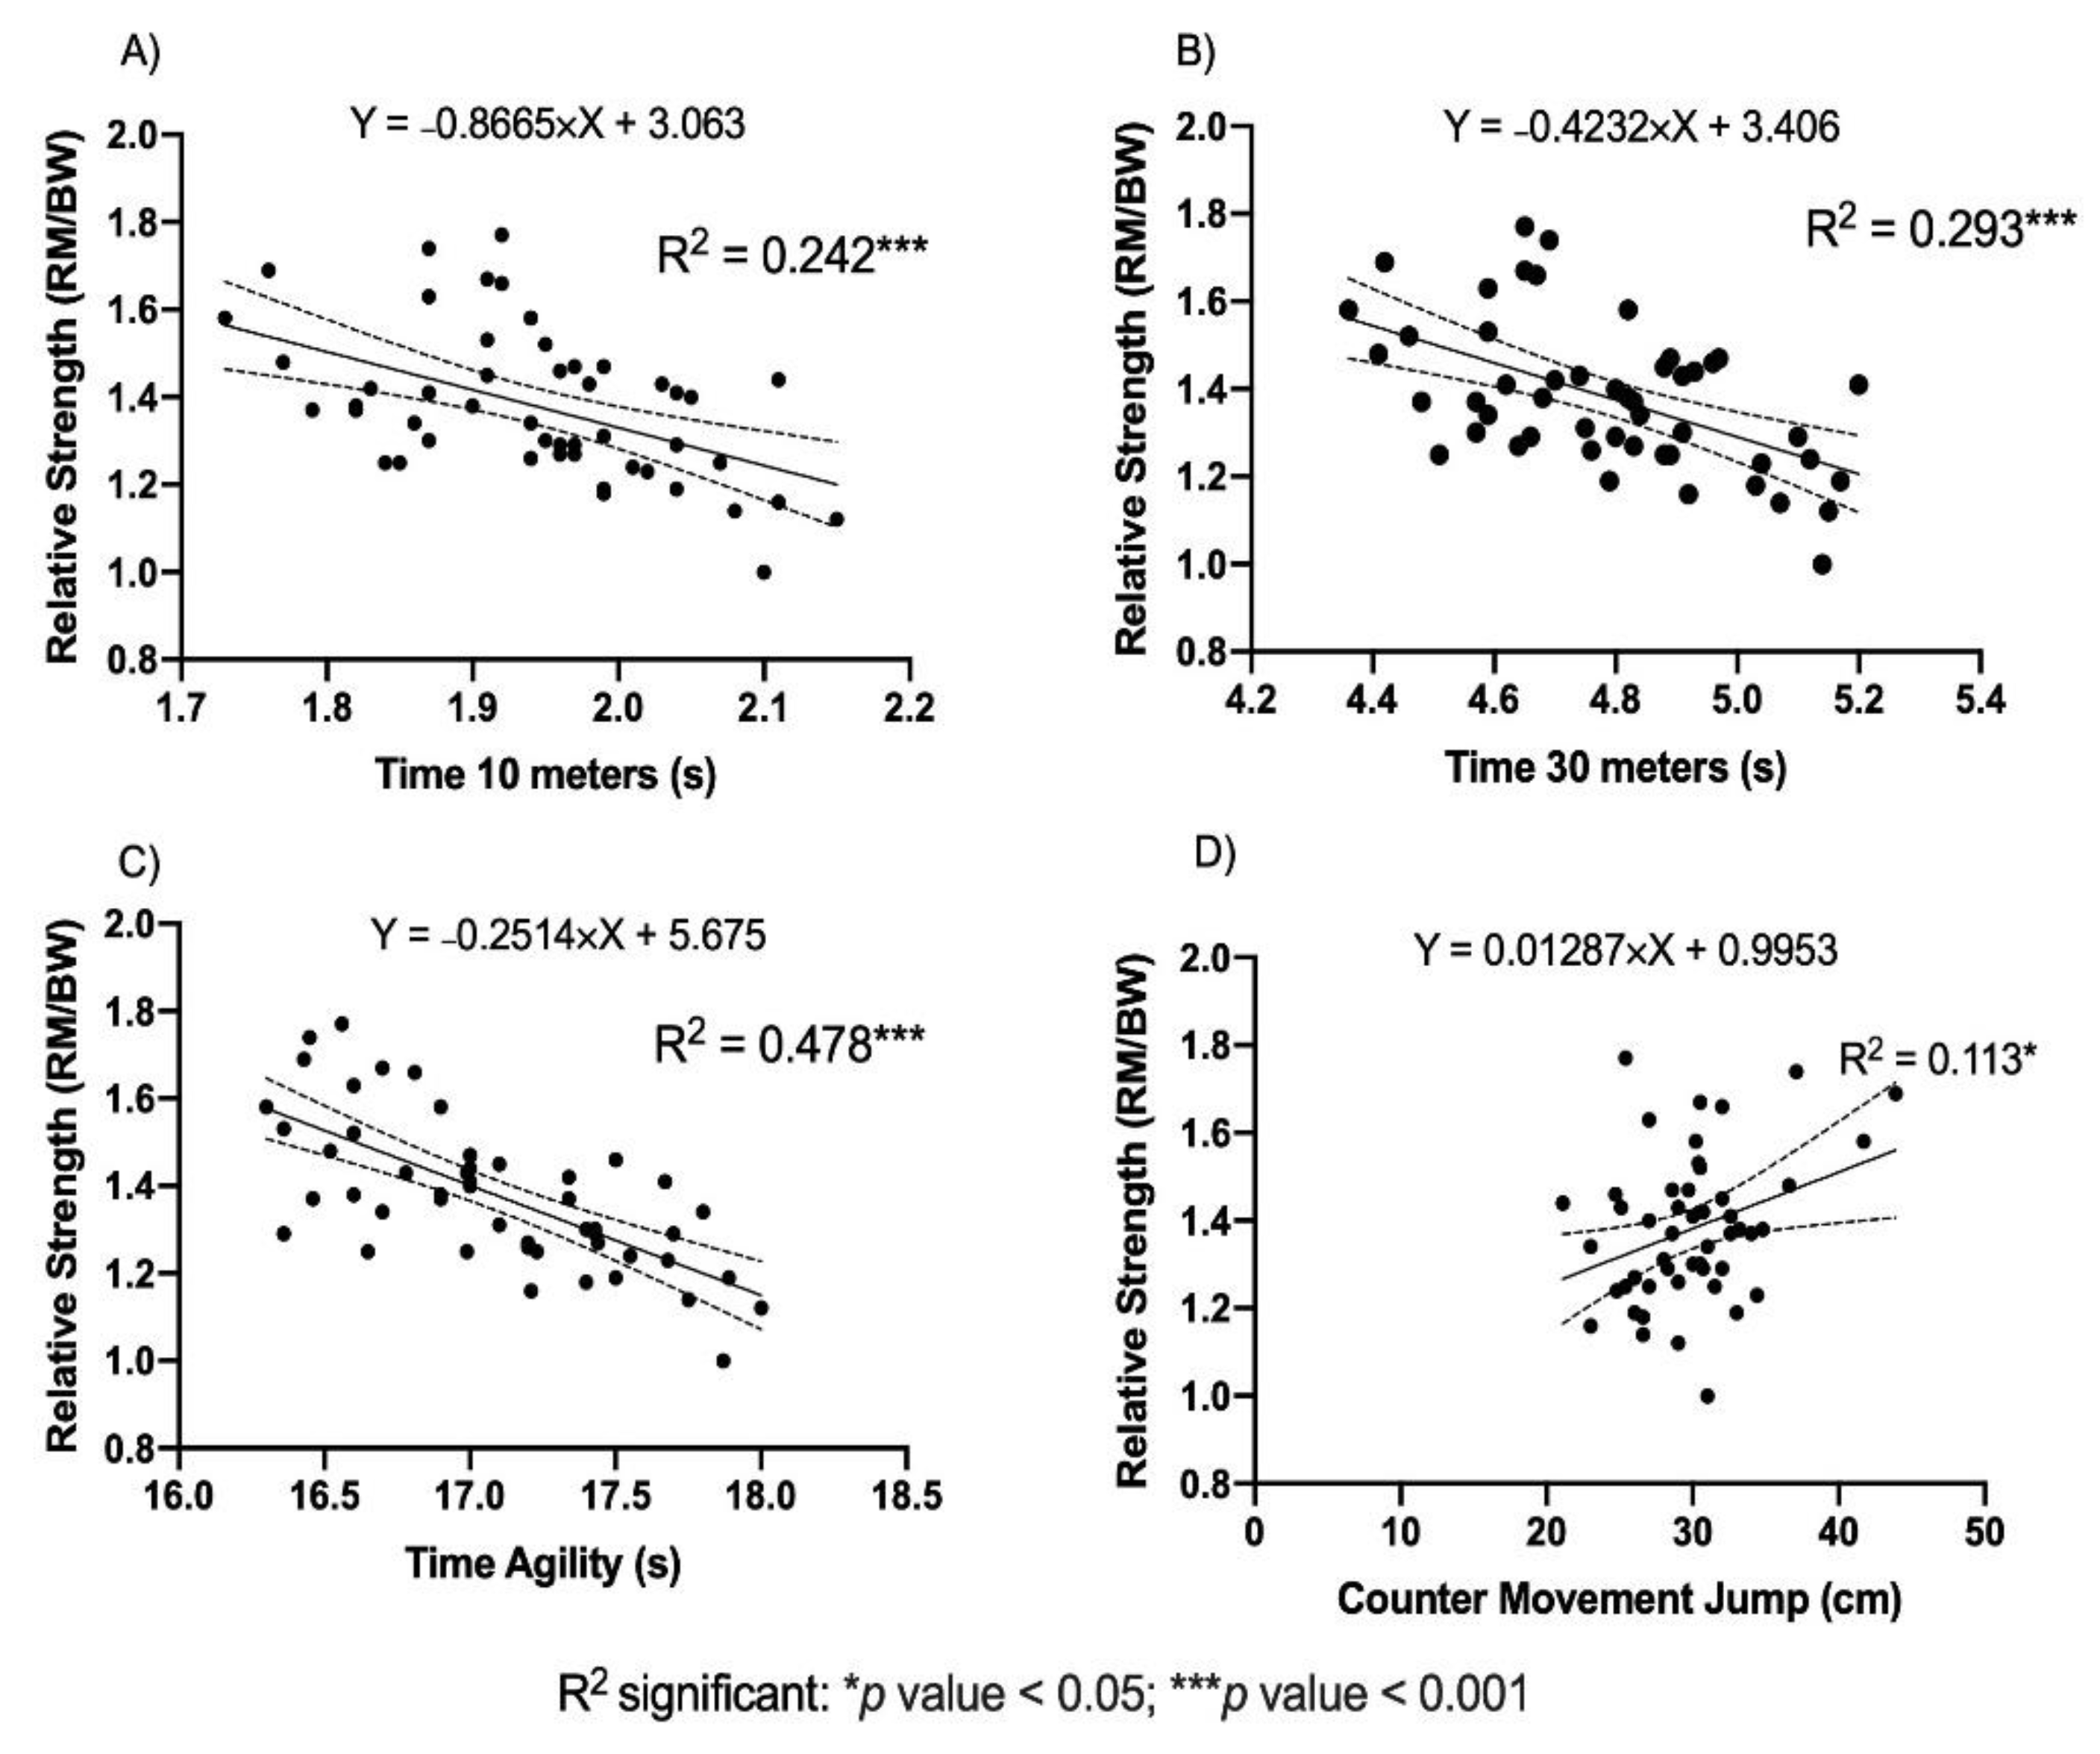
| RS | −0.648 ** | −0.563 ** | −0.498 ** | 0.313 * | −0.472 ** | 0.468 ** | 0.602 ** | |||||
| T10 | 0.363 ** | 0.216 | 0.588 ** | −0.492 ** | 0.499 ** | −0.329* | −0.306 * | −0.507 ** | ||||
| T30 | 0.498 ** | 0.211 | 0.498 ** | −0.341 * | 0.466 ** | −0.199 | −0.195 | −0.541 ** | 0.777 ** | |||
| IAT | 0.576 ** | 0.294 * | 0.421 ** | −0.249 | 0.422 ** | −0.279* | −0.303 * | −0.691 ** | 0.607 ** | 0.806 ** | ||
| CMJ | 0.058 | 0.167 | −0.394 ** | 0.377 ** | −0.385 ** | 0.530 ** | 0.487 ** | 0.336 * | −0.605 ** | −0.415 ** | −0.403 ** | |
| MYYR1 | −0.470 ** | −0.195 | −0.343 * | 0.144 | −0.382 ** | −0.052 | −0.181 | 0.228 | −0.402 ** | −0.421 ** | −0.347 * | −0.067 |
Publisher’s Note: MDPI stays neutral with regard to jurisdictional claims in published maps and institutional affiliations. |
© 2021 by the authors. Licensee MDPI, Basel, Switzerland. This article is an open access article distributed under the terms and conditions of the Creative Commons Attribution (CC BY) license (http://creativecommons.org/licenses/by/4.0/).
Share and Cite
Villaseca-Vicuña, R.; Molina-Sotomayor, E.; Zabaloy, S.; Gonzalez-Jurado, J.A. Anthropometric Profile and Physical Fitness Performance Comparison by Game Position in the Chile Women’s Senior National Football Team. Appl. Sci. 2021, 11, 2004. https://0-doi-org.brum.beds.ac.uk/10.3390/app11052004
Villaseca-Vicuña R, Molina-Sotomayor E, Zabaloy S, Gonzalez-Jurado JA. Anthropometric Profile and Physical Fitness Performance Comparison by Game Position in the Chile Women’s Senior National Football Team. Applied Sciences. 2021; 11(5):2004. https://0-doi-org.brum.beds.ac.uk/10.3390/app11052004
Chicago/Turabian StyleVillaseca-Vicuña, Rodrigo, Edgardo Molina-Sotomayor, Santiago Zabaloy, and Jose Antonio Gonzalez-Jurado. 2021. "Anthropometric Profile and Physical Fitness Performance Comparison by Game Position in the Chile Women’s Senior National Football Team" Applied Sciences 11, no. 5: 2004. https://0-doi-org.brum.beds.ac.uk/10.3390/app11052004