
Leading Edge Blowing to Mimic and Enhance the Serration Effects for Aerofoil †


1
College of Engineering, University of Baghdad, Baghdad 10081, Iraq
2
Department of Mechanical and Aerospace Engineering, Brunel University London, Middlesex UB8 3PH, UK
3
Faculty of Aerospace Engineering, Technion—Israel Institute of Technology, Haifa 32000, Israel
*
Author to whom correspondence should be addressed.
†
This paper is an extended version of our paper (AIAA-2018-3287) published in the Proceedings of the 24th AIAA/CEAS Aeroacoustics Conference, Atlanta, USA, 25–28 June 2018, which adds the “enhancement” aspect of the leading edge blowing to the leading edge serration.
Appl. Sci. 2021, 11(6), 2593; https://0-doi-org.brum.beds.ac.uk/10.3390/app11062593
Submission received: 25 December 2020
/
Revised: 22 February 2021
/
Accepted: 10 March 2021
/
Published: 15 March 2021
(This article belongs to the Special Issue Recent Advances in Flow-Induced Noise)
Abstract
:Leading edge serration is now a well-established and effective passive control device for the reduction of turbulence–leading edge interaction noise, and for the suppression of boundary layer separation at high angle of attack. It is envisaged that leading edge blowing could produce the same mechanisms as those produced by a serrated leading edge to enhance the aeroacoustics and aerodynamic performances of aerofoil. Aeroacoustically, injection of mass airflow from the leading edge (against the incoming turbulent flow) can be an effective mechanism to decrease the turbulence intensity, and/or alter the stagnation point. According to classical theory on the aerofoil leading edge noise, there is a potential for the leading edge blowing to reduce the level of turbulence–leading edge interaction noise radiation. Aerodynamically, after the mixing between the injected air and the incoming flow, a shear instability is likely to be triggered owing to the different flow directions. The resulting vortical flow will then propagate along the main flow direction across the aerofoil surface. These vortical flows generated indirectly owing to the leading edge blowing could also be effective to mitigate boundary layer separation at high angle of attack. The objectives of this paper are to validate these hypotheses, and combine the serration and blowing together on the leading edge to harvest further improvement on the aeroacoustics and aerodynamic performances. Results presented in this paper strongly indicate that leading edge blowing, which is an active flow control method, can indeed mimic and even enhance the bio-inspired leading edge serration effectively.
1. Introduction
Today the aviation industry is facing major challenges with respect to the noise pollution. To overcome the challenges, many airplane and aero-engine manufacturers continue to step up their efforts to reduce the airplane and turbomachinary noise.
Of particular interest is the broadband noise generated by a hydrodynamic interaction between the incoming turbulent flow and the leading edge of fan blades. This mechanism is, perhaps, the most relevant at the rotor-stator stage of the aero-engine, where the wake generated from the upstream rotor impinges the downstream stator (or the outlet-guided-vanes (OGV)) to radiate the broadband interaction noise. The analytical work by Amiet [1] describes the radiated turbulent–leading edge interaction noise as:
where ω is the angular frequency, Λuu is the longitudinal integral length scale of the turbulence, Γ is the gamma function, Tu is the turbulence intensity, U is the velocity, R is the observer distance, S is the aerofoil span, d is the aerofoil thickness, and is the normalised longitudinal wavenumber. From this expression, apart from the aerofoil geometry and physical configuration, the level of the interaction noise can be governed by the external factors in flow such as the longitudinal turbulence length scale and the turbulence intensity.
Inspired by the ability of owl to hunt in acoustic stealth, there is now a great interest to reproduce the shape of owl’s wings in aerofoil blades. First, primary feathers on the owls’ wing (leading edge) are serrated. Second, the trailing edge feathers of the owl’s wing are tattered. Third, the rest of the owls’ wing are covered in velvety feathers. It is believed that the leading edge serrations are responsible for the reduction of the leading edge noise. When the leading edge of an aerofoil blade is serrated, it can affect the acoustical response with the incoming turbulent flow. Many studies have already been performed on the effect of leading edge serrations on broadband noise. In a joint experimental-numerical investigation by Clair et al. [2] on the leading edge interaction noise of a NACA 65(12)-10 aerofoil, the wavy leading edge is found to achieve noise reduction between 3–4 dB. Narayanan et al. [3] performed a fundamental study to assess the effects of a serrated leading edge on the interaction noise characteristics of a flat plate and an aerofoil. A nearly isotropic turbulence was produced using mesh grid positioned inside a nozzle. The authors demonstrate significant noise reduction between 5–8 dB in a flat plate configuration. The level of broadband noise reduction is a strong function of the serration amplitude (longitudinal distance between the peak and trough), but it is less sensitive to the serration wavelength (spanwise distance between successive peaks). There have also been many studies using high-fidelity numerical flow simulation to provide a physical insight of the noise reduction mechanisms by the serration [4,5,6]. These studies show that the surface pressure fluctuation and the far field noise on a serrated leading edge are de-correlated by the serrated leading edges. In particular, the noise source at the mid-region of the oblique edge becomes ineffective across the mid to high frequency range. The serration could cause a significant decrease in the surface pressure fluctuations around the tip and mid-regions of the serration, which directly results in a broadband noise reduction. Another noise reduction mechanism is attributed to the phase interference and destruction effect between the serration peak and the mid-region of the oblique edge. Accordingly, the serration trough region remains effective in the noise radiation.
Now if we focus on the aerodynamic performances, Fish and Battle [7] show that the humpback whale benefits from tubercles along the leading edge of its flippers, which would resemble remarkably well with the serrated leading edge of owls. The context is the enhancement of the maneuverability by delaying flow separation. However, it is noteworthy that, despite the delayed aerodynamic stall and improved post-stall lift performance, the serrated leading edges also reduce the maximum lift coefficient and increase the drag coefficient, resulting in lower lift-to-drag ratio. Johari et al. [8] perform experimental evaluation of the effects of various wavelength and amplitude configurations on the aerodynamic force characteristics of a full-span NACA 634-021 aerofoil at a Reynolds Number of 183,000. Despite the increased post-stall lift up to 50%, the stall angle pertaining to the serrated aerofoil is actually reduced. Detrimental effect is also observed for both the lift coefficient and drag coefficient, which decrease and increase, respectively, against the baseline aerofoil. Miklosovic et al. [9] replicate several aerofoil models whose the tapered wing possesses the aspect ratios similar to that of the humpback whale flipper. Following the wind tunnel experiments, they observe an increase above the baseline configuration of the maximum lift by 6%, and a delay of the stall angle by about 40% for the flipper model with leading edge bumps. Despite some discrepancies in the literatures, the general consensus of the serrated leading edge is that, though the stall angle and the maximum lift coefficient can be increased by an optimised serrated-configuration, the lift coefficients at the pre-stall regime will be lower than those produced by an unmodified, baseline leading edge.
The momentum exchange owing to the mixing between the streamwise vortices and the otherwise separated boundary layer is regarded as one of the main mechanisms to prevent/delay the boundary layer separation, and subsequently improve the post-stall performance by a serrated aerofoil. The streamwise vortices in the form of counter-rotating pairs are predominantly generated at the troughs of the serration as a direct consequence of the serration geometry [10]. Skillen et al. [11] highlight that the streamwise vortices can be induced by the spanwise pressure gradient where the near wall low-momentum fluid is transported away from the serration peak towards the trough. Conversely, high-momentum fluid from the freestream is drawn to re-energise the boundary layer downstream of the serration peaks. Focusing on the evolution of vorticity near the serration troughs, Hansen et al. [12] observe that the external pressure force transforms the initial vorticity near the leading edge into pairs of counter-rotating streamwise vortices via a three-dimensional process (stretching, tilting and diffusion).
The brief literature review above concerns exclusively the aerofoil with serrated leading edge acting as a simple and effective passive control device for the reduction of interaction broadband noise and mitigation of the boundary layer separation. A research question worth exploring is whether both the aeroacoustics and flow control mechanisms can be replicated by a completely different flow control approach. “Active” flow control has some advantages of being versatile when the flow condition can change considerably over a short period of time, and producing little parasite drag when the control device can be well integrated to the aerofoil system. The analytical solution of Amiet [1] described in Equation 1 provides an explicit relationship between the level of leading edge noise radiation and the turbulence intensity and integral length scale of the incoming flow. Therefore, one avenue to reduce the leading edge noise is to seek method to weaken the fluid-leading edge interaction. Leading edge blowing is an attractive method to achieve this objective because the injection of mass flow from the leading edge against the turbulent inflow could potentially decrease the turbulence intensity, hence the level of interaction noise radiation. Another hypothesis is that the interaction between the leading edge jet and the freestream inflow can create a Kelvin–Helmholtz type of shear mechanism to generate vortical structures propagating in the downstream direction along the aerofoil surface. It is expected that these vortices can draw the high momentum flow from the outer wall towards the low speed fluid at the near wall, in a similar manner as the one produced by a serrated leading edge for the mitigation of the boundary layer separation.
The main research questions here first concern whether, for a straight leading edge aerofoil, the level of mass flow from the leading edge blowing, and the spanwise distance between each successive orifices, can be correlated with the serration amplitude and serration wavelength, respectively, for a serrated leading edge aerofoil. The second research question concerns whether combining the leading edge blowing to a serrated leading edge can enhance and further elevate both the aeroacoustics and aerodynamic performances. This paper will present experimental results for an asymmetrical aerofoil subjected to (1) serrated leading edge, and (2) straight leading edge with blowing, both of which will be subjected to exactly the same flow conditions, and finally, (3) a hybrid device containing both the serration and blowing features. Comparisons of the aeroacoustics and aerodynamics results achieved by these approaches will be made quantitatively to demonstrate whether the serration effects on an aerofoil can be mimicked and enhanced by a leading edge blowing.
2. Experimental Setup
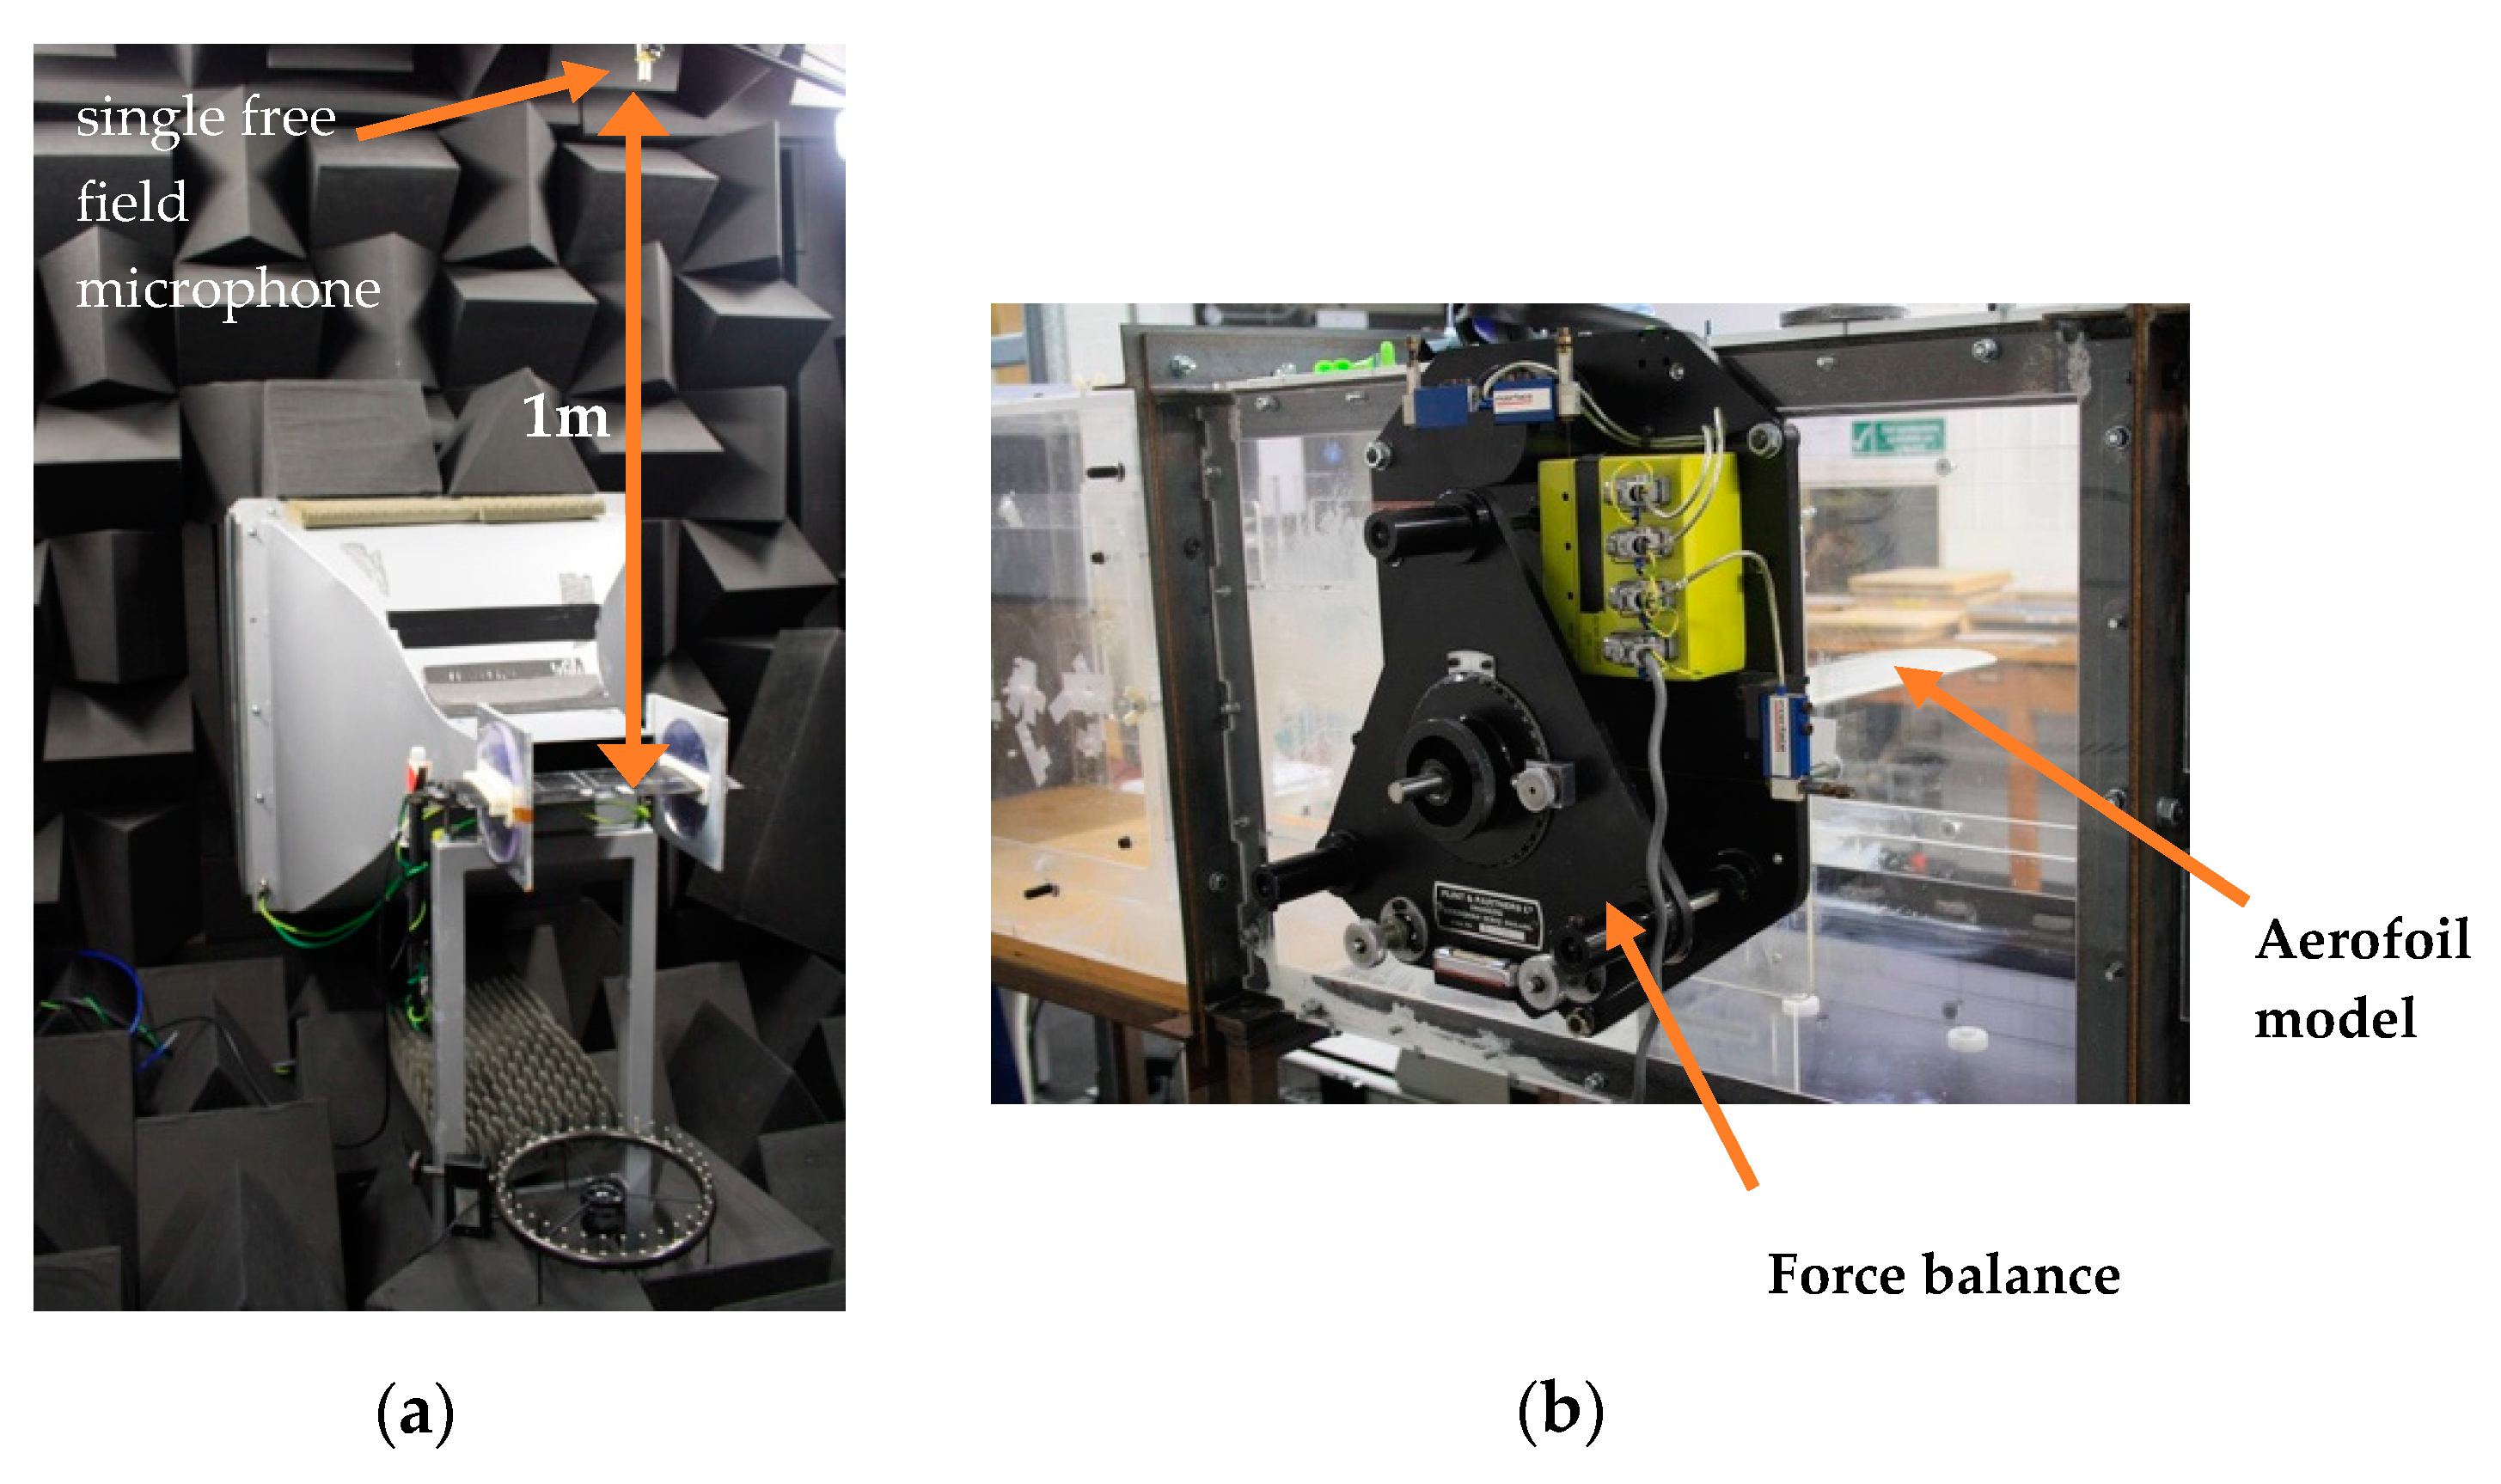
The measurements of the far field noise as result of the turbulence–leading edge interaction of the aerofoil were conducted in the aeroacoustics wind tunnel at Brunel University London, UK [13]. The dimension of the anechoic chamber is 4 m × 5 m × 3.4 m. The open jet wind tunnel is driven by a centrifugal fan outside the chamber and the airflow inside the tunnel is acoustically treated by a 10 m long silencer. The cross section area of the nozzle exit is 10 cm (height) × 30 cm (width). A maximum free jet velocity of approximately 80 ms−1 can be reached. The range of the Reynolds numbers in the present aeroacoustics study is 2 × 10⁵ ≤ Re ≤ 5 × 10⁵ based on the chord length of the aerofoil, C (= 0.15 m), which is equivalent to free stream velocity U between 20 and 50 ms−1, respectively. The aerofoil system was mounted horizontally between two parallel side plates. As shown in Figure 1a, a single pre-polarized condenser microphone (LarsonDavis 377B02) was located at 1.0 m from the leading edge of the aerofoil at the mid span and at a polar angle of 90 degree. The noise data from the microphone was sampled at frequency of 44 kHz for 10 s by a 16-bit Analog–Digital (A/D) card from the National Instrument. The far field acoustic data was windowed, Fast Fourier Transformed (1024 point) and averaged to compute the Power Spectral Density (PSD) with a 1 Hz bandwidth and frequency resolution of about 43 Hz.
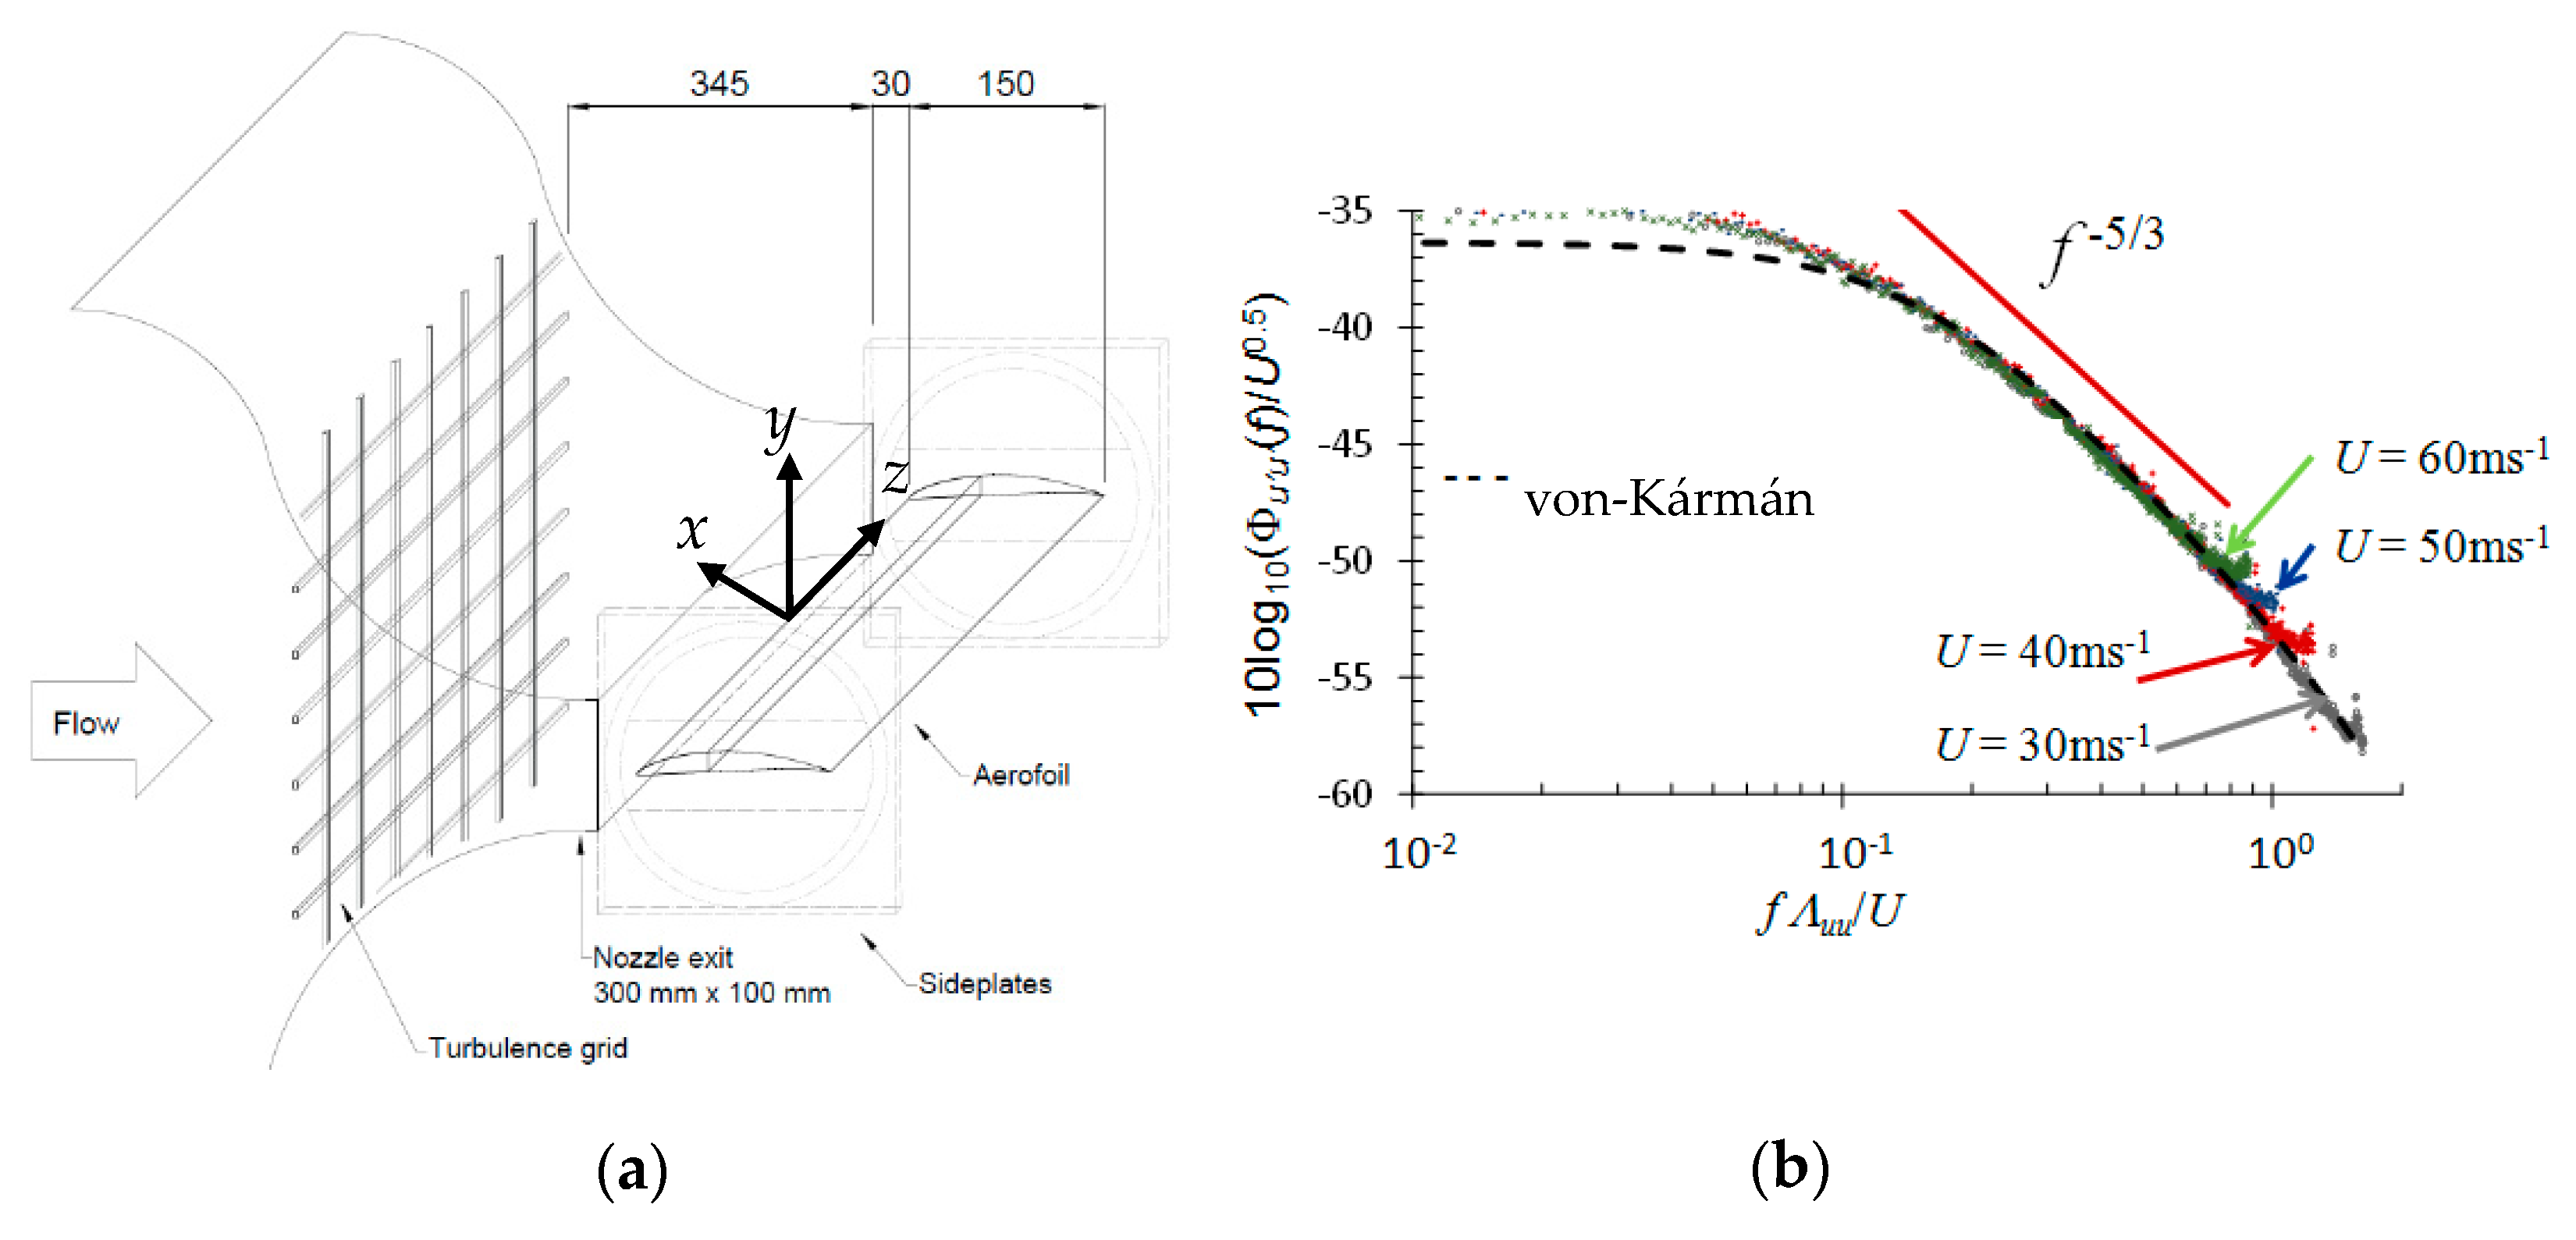
To determine the level of the freestream turbulence intensity (Tu) at the location coincides with the leading edge of the aerofoil (but without the presence of the aerofoil), a single hot wire was used to measure the streamwise velocity fluctuations u’. The diameter and length of the hot wire are 5 μm and 1.25 mm, respectively. The hot wire was operated at an overheat ratio of 1.6. Placing the hot wire probe at 30 mm downstream of the nozzle exit, which corresponds to the leading edge of aerofoil when fixed to the side plates, the background Tu produced by this wind tunnel (i.e., without placing turbulence grid inside the nozzle, and without the aerofoil) is between 0.1 and 0.2%. In order to generate elevated level of Tu, a bi-planar turbulence grid was placed inside the nozzle, as shown in Figure 2a. Using the same hot wire probe, and without the presence of the aerofoil, the Tu has been identified for this study as the average value encompassing the two-dimensional y–z plane, which is calculated as Tu≈4.5%. The measured PSD of the fluctuating velocity, which is presented in Figure 2b, can be seen as nearly isotropic as demonstrated by the relatively good match with the von-Kármán universal spectrum for the longitudinal velocity fluctuation. This theoretical spectrum is represented by the following equation:
where is the mean-square of the velocity fluctuation, Λuu is the integral length scale, kx = ω/U is the streamwise wavenumber, and Kη is a parameter that controls the slope of the high-frequency roll-off.
Aerodynamic forces (lift and drag) were measured in a separate wind tunnel. The wind tunnel is an open circuit, suction type with a closed-test section of 0.5 m (height) × 0.5 m (width). The air enters the wind tunnel through a nozzle with an area ratio of 1:3 after passing through several flow-conditioning fine meshes and a honeycomb to generate a uniform flow with Tu≈0.3%. Note that no turbulence grid is used for the aerodynamic measurements. The aerofoil model was placed horizontally across almost the entire width of the test section (2.5 mm gap was left at each side of the wind tunnel side window). This wind tunnel is not acoustically treated and is not suitable for the noise measurement. Instead, it is only used for measurements of the lift and drag produced by the aerofoil. A three-component strain gauge force balance was used to measure the aerodynamic forces produced by the aerofoil. As shown in the earlier Figure 1b, the aerodynamic forces will transmit to the three strain gauges via some pre-tensioned cables. The angle of attack of the aerofoil is rotated through a disc between –8° and +30°. Wind tunnel blockage correction is applied in the data analysis. All tests are undertaken at angles of attack –15° ≤ α ≤ 15° degrees. The freestream velocity U is set at 24 ms−1. The rotating dial mechanism of the mounting plate is used to adjust the angle over this range with an estimated uncertainty of ±0.2°. Three data sets were taken for each test case so that the lift and drag coefficients presented in this paper will represent the averaged values.
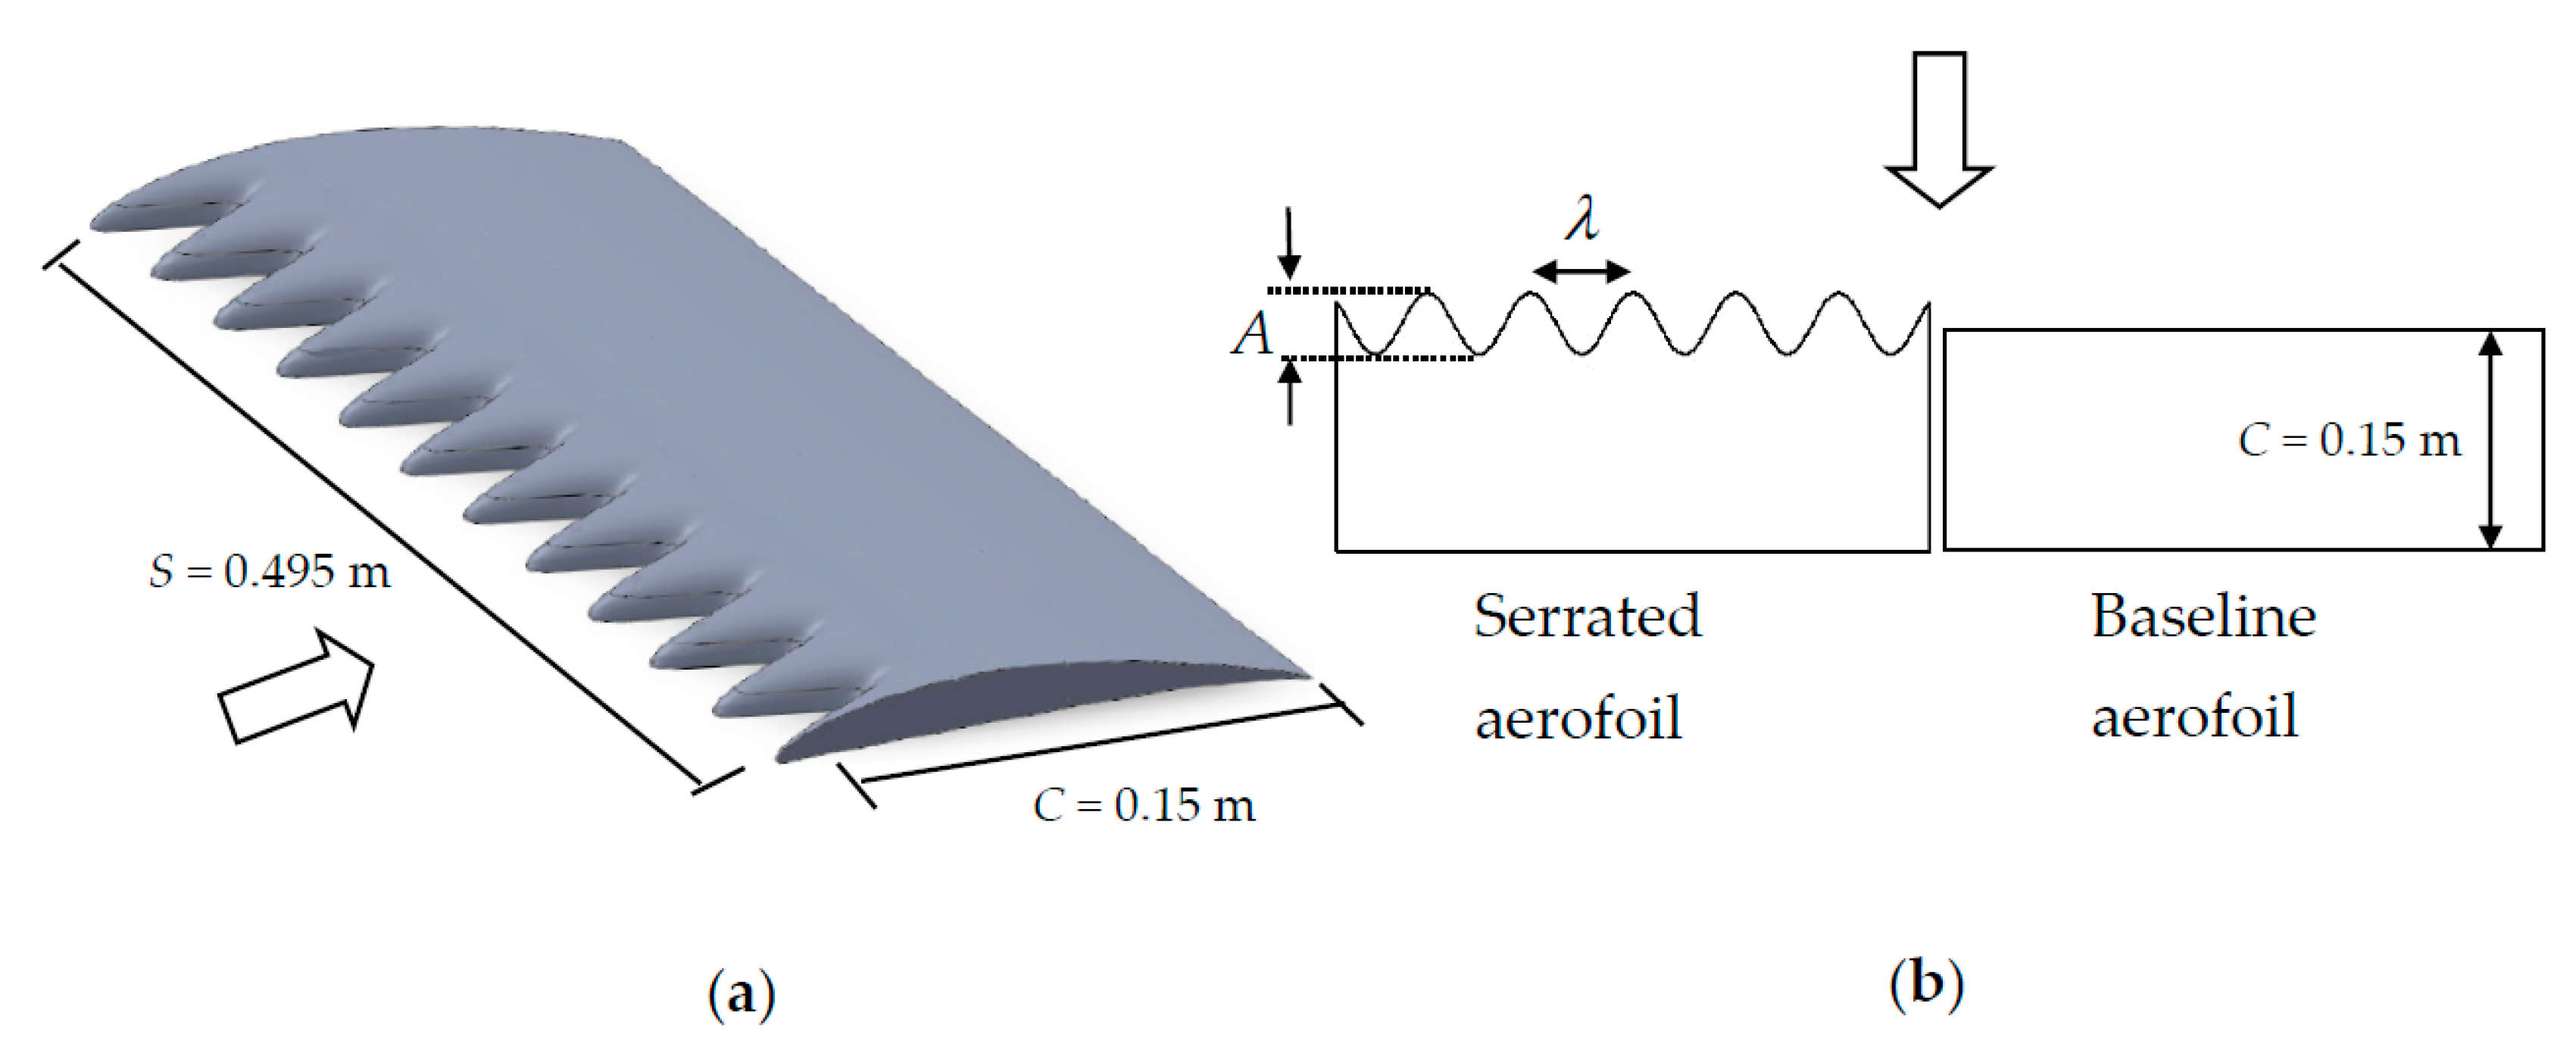
The NACA65 (12)-10 aerofoil model has a chord and span of C = 0.15 m and S = 0.495 m, respectively. The aerofoil model consists a main body with a length of 0.1 m and an interchangeable leading edge of 0.05 m. The geometrical modification only affects the leading edge region, and the remaining part of the aerofoil at rear is unaffected.
The design of the serrations can be described by a sinusoidal curve along the leading edge with the characteristic shape of semi-cyclic serration tips. The sinusoidal curve is described by the serration amplitude A and the wavelength λ. A design principle, which is to keep the same wetted area between the serrated leading edge and the baseline straight leading edge, is adopted in this study. This means that the serration peak will extend upstream of the baseline leading edge by A/2, while the remaining A/2 is cut into the aerofoil main body. This is reflected in Figure 3. In the current study, combinations of two serration amplitudes (A = 15 and 30 mm) and two serration wavelengths (λ = 5 and 10 mm) were investigated. Summary of the geometrical details are provided in Table 1.
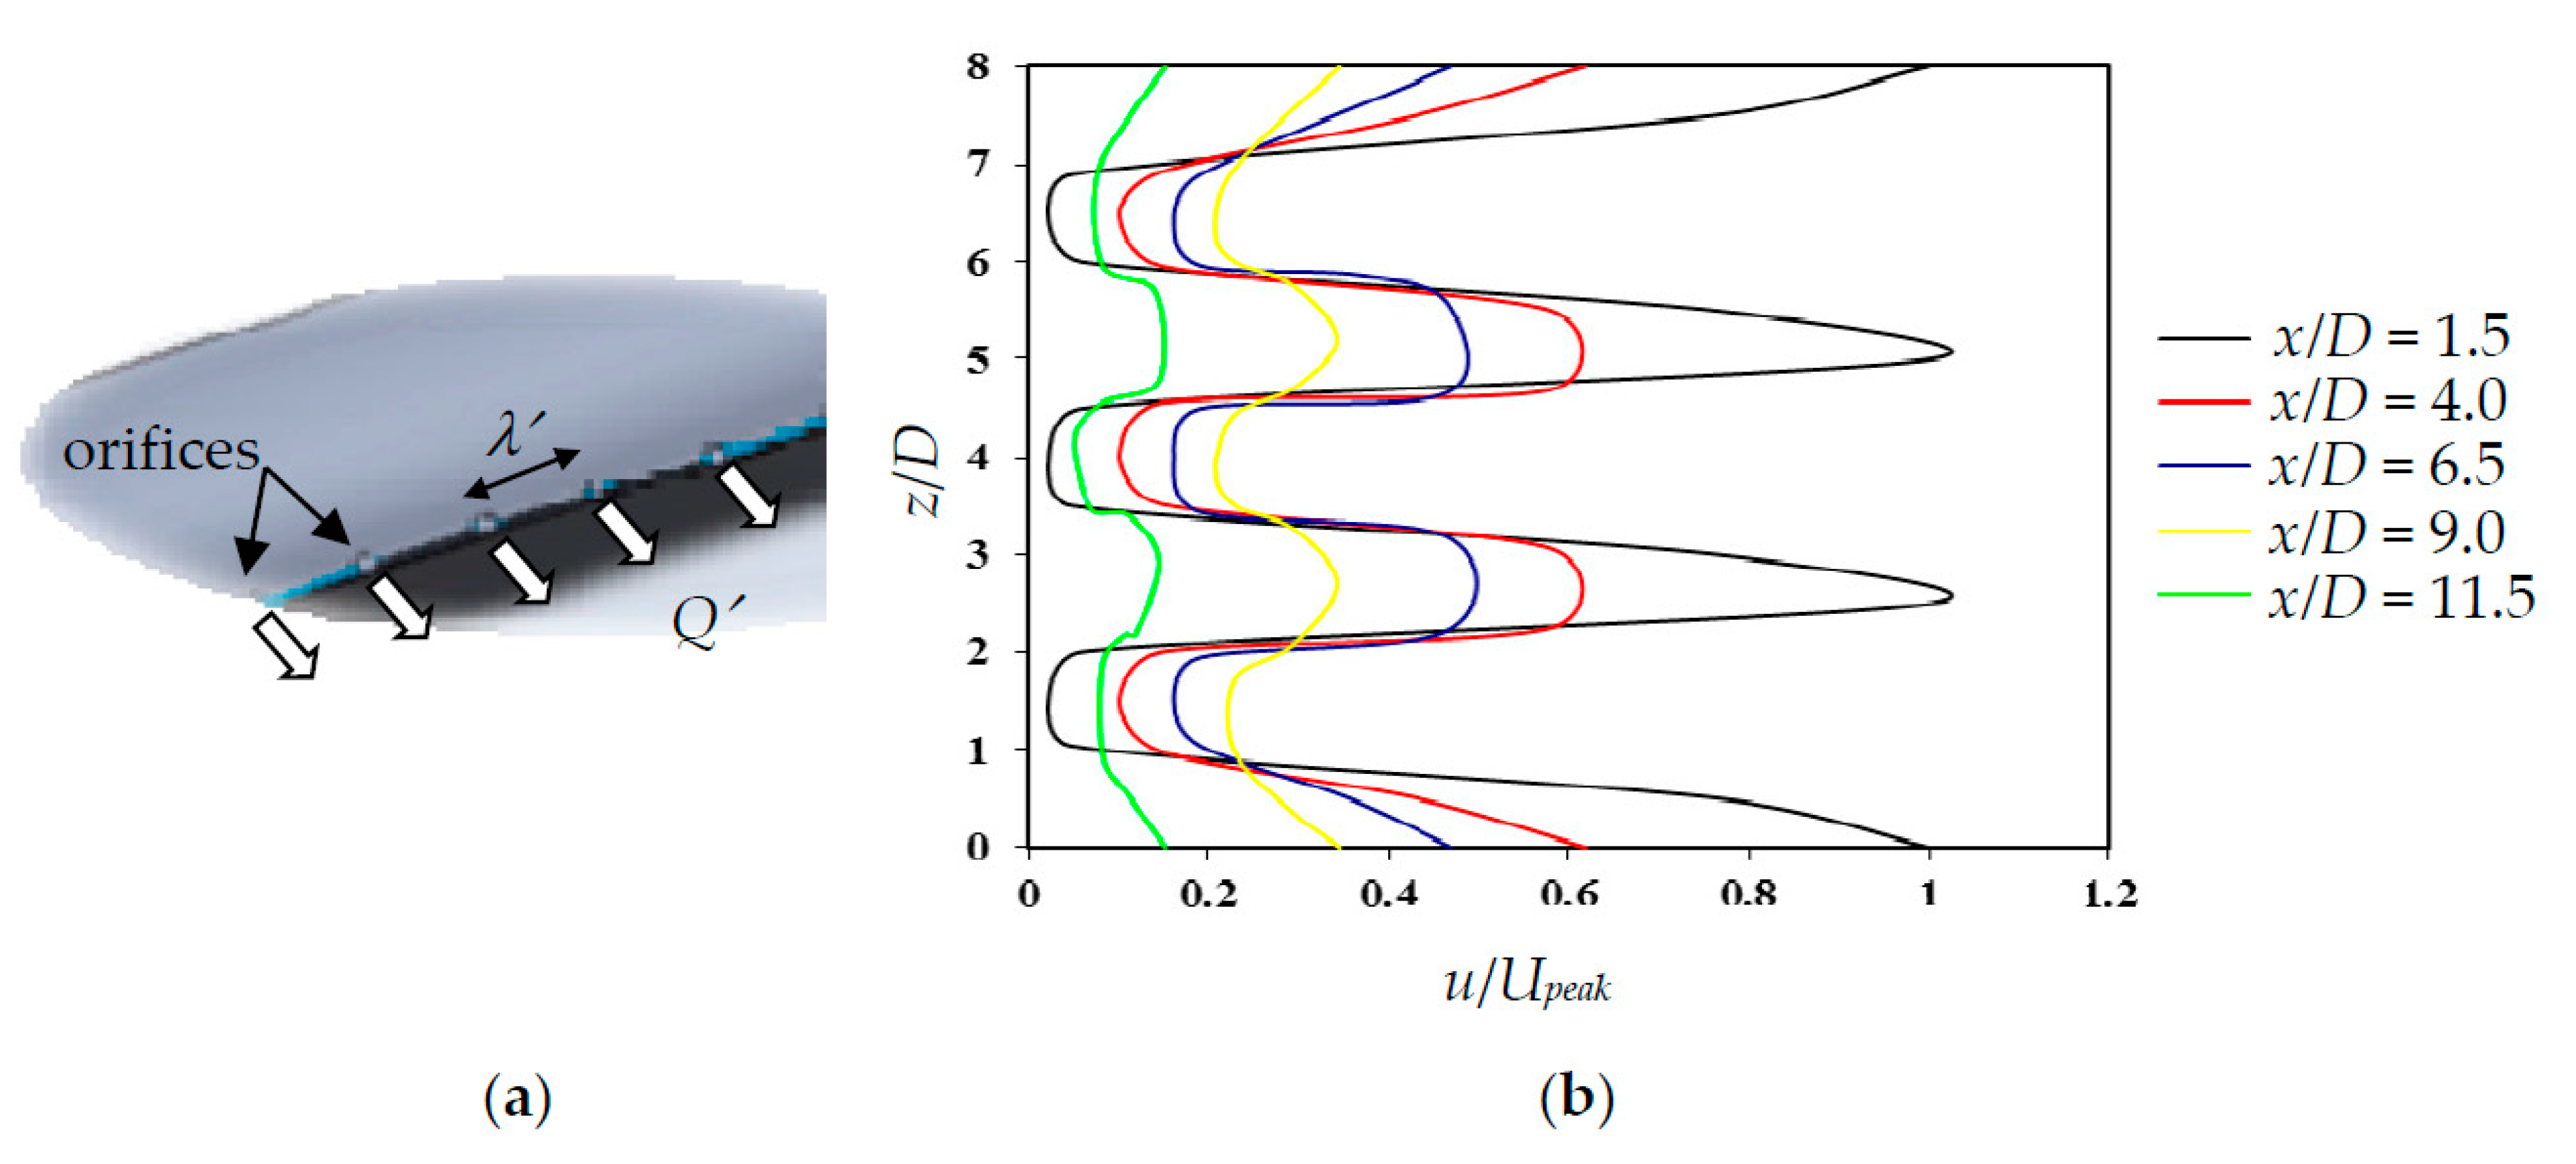
As shown in Figure 4a, mass airflow injection is delivered through the multiple orifices along the leading edge. Each of these orifices has the same diameter D = 2 mm. To study the effect of the spanwise distance between the orifices λ’, two straight leading edges with λ’ = 5 mm and 10 mm were manufactured. External air supply is connected to the aerofoil and the flow rate can be adjusted through a digital valve. The regulator and air supply are located outside of the anechoic chamber in order to isolate the valve noise. The bulk air supply into the aerofoil body is quantified by Q (liter/min), which is monitored by a digital flow rate meter. Through a system of air channels inside the aerofoil body, the air flow rate from each orifice (Q ‘) is approximately equal to Q/φ, where φ is the total number of orifices along the leading edge. In practice, though there might be pressure loss incurred within the aerofoil internal air channel system, it is assumed negligible.
During the quiescent condition (without the mean flow), hot wire sensor was used to measure the spanwise profiles of the air jet mean velocity exiting the straight leading edge aerofoil at several streamwise direction x/D. Note that the coordinate system pertinent to the results in Figure 4b should refer to Figure 2a. Figure 4b shows an example of the velocity profile with the bulk flow rate Q = 208 L/minute when λ’ = 5 mm. Each spike in the figures represents the maximum air jet velocity produced by a particular orifice on the leading edge. The measured velocity u is normalised by Upeak, which is the peak velocity measured at x/D = 1.5 (i.e., closest distance from the orifice exit). This means that the reference velocity is taken as the maximum jet velocity at x/D = 1.5. The results shown in Figure 4b, therefore, would demonstrate the decay of the maximum jet velocity with respect to the streamwise distance. It can be seen that between x/D = 1.5 and 4.0, the produced jet from each orifice will decrease by 40%. Further increase of x/D beyond 4.0 will result in further reduction of the maximum jet velocity, but on a slower rate. In addition, the jet is also found to spread longitudinally, but a fully merged and developed flow would not be attained unless it reaches at least x/D > 11.5.
3. Results
The results will be discussed at the aerodynamic and aeroacoustics sub-sections. The aerodynamic force measurements were conducted in the aerodynamic wind tunnel under a wide range of angles of attack –15° ≤ α ≤ 15° at free-stream U = 24 ms−1, corresponding to Reynolds number of Re = 2.4 × 10⁵. The Tu in this case is quite low at 0.3%. The aeroacoustics measurements were conducted in a separate aeroacoustics wind tunnel at α = 0° across 2.0 × 10⁵ ≤ Re ≤ 5.0 × 10⁵, which correspond to 20 ≤ U ≤ 50 ms−1, respectively. For the aeroacoustics experiments, the elevated Tu is about 4.5%. No boundary layer tripping devices are implemented for both experiments.
In the following sections, the naming of each serrated leading edge is made in accordance to the values of their serration wavelength λ, and serration amplitude A. For example, the serrated leading edge that has a serration wavelength of 5 mm and serration amplitude of 15 mm will be named as λ5A15 (see Table 1). The same strategy is adopted for the leading edge blowing case. For example, a spanwise orifice distance of 5 mm and a blow rate of Q ’ = 3.2 L/minute for each orifice will be named as λ’5Q ’3.2.
3.1. Aerodynamic Forces
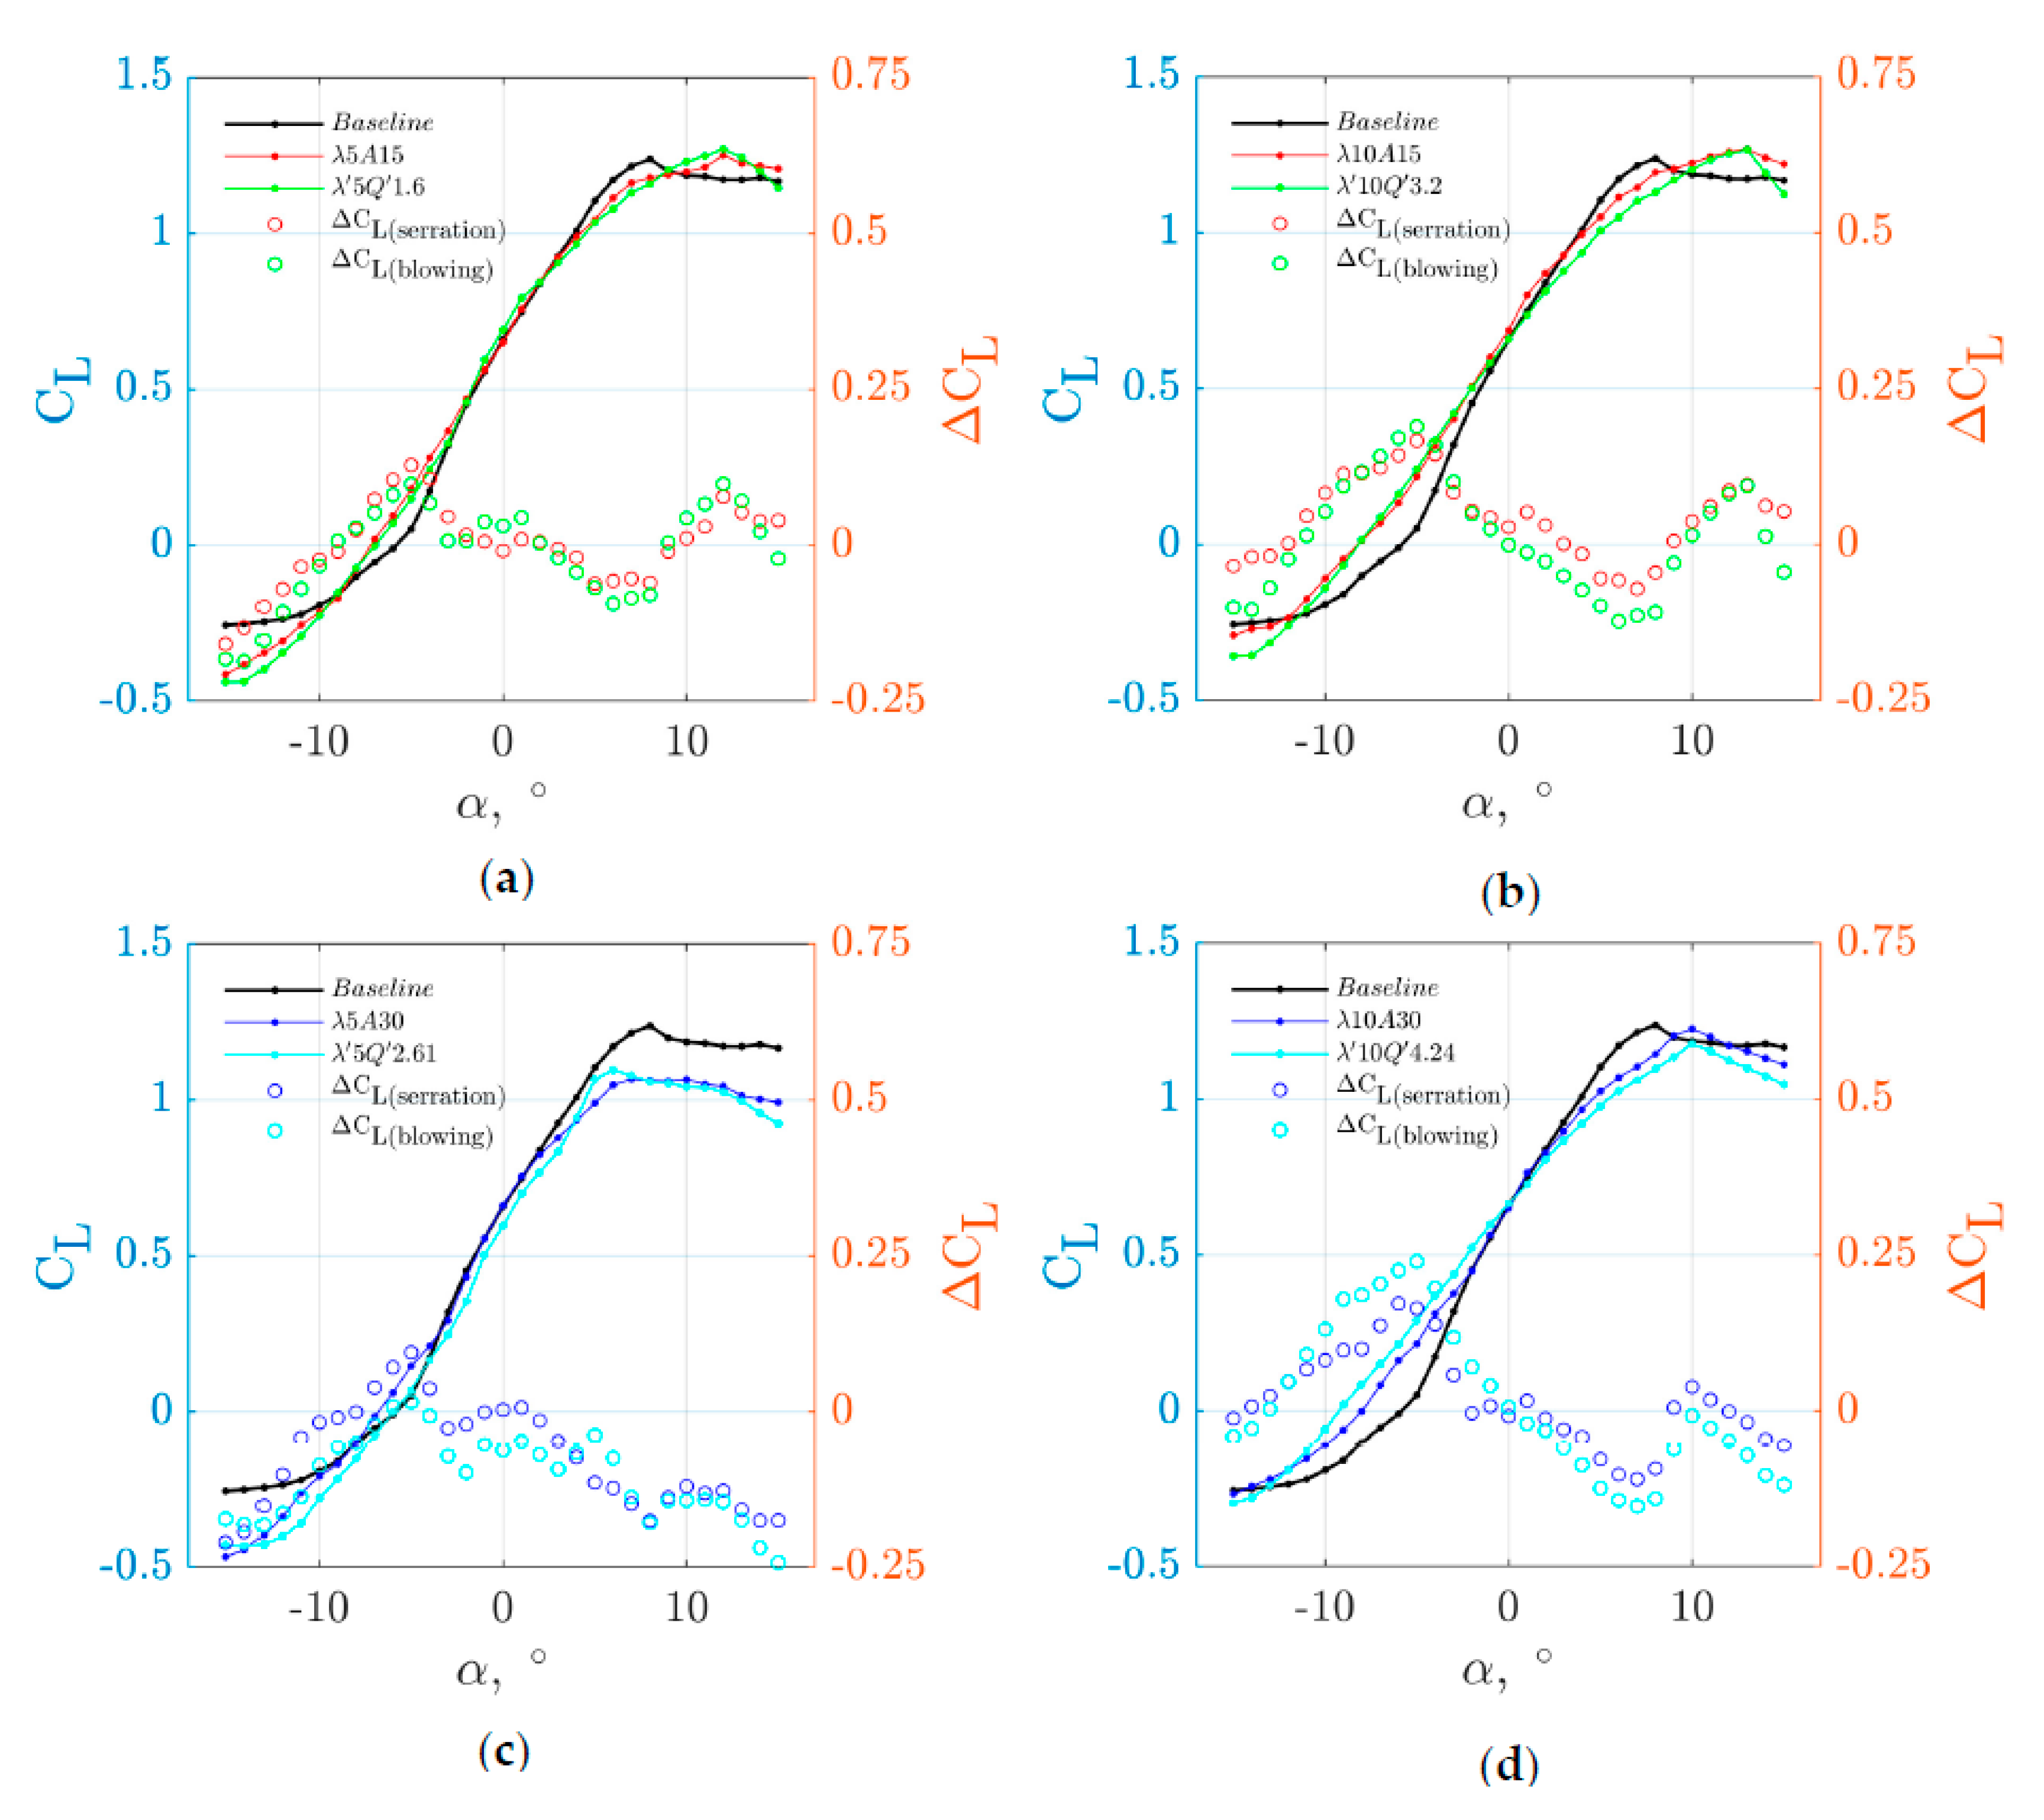
Figure 5 compares the aerodynamic lift coefficient CL generated by the aerofoil as a function of angle of attack α. Three cases are examined. First is the baseline leading edge. Second is when the aerofoil is subjected to leading edge serration, and third is the leading edge blowing. In all cases the planform areas (C × S) are the same, which enable an unambiguous definition of the CL. Four types of serrated leading edges are used in this study: λ5A15, λ10A15, λ5A30 and λ10A30. The figure also includes the ΔCL, which is defined as follow:
where a positive value of ΔCL denotes a higher lift coefficient generated by either the serrated leading edge or blowing leading edge, at a particular α, compared to the baseline aerofoil. The opposite is true. The difference in the drag coefficient ΔCD (to be shown in Figure 6) is also defined in a similar fashion, i.e., a positive ΔCD means that a larger drag coefficient is produced by the treated aerofoil, and vice versa.
ΔCL (α) = CL (treated) (α) − CL (baseline) (α)
ΔCD (α) = CD (treated) (α) − CD (baseline) (α)
It can be seen that for the baseline case the corresponding CL curve follows largely the classical thin aerofoil theory where a lift curve slope dCL/dα≈2π is evident at –6° ≤ α ≤ 8°. At α > 8°, the aerofoil starts to stall and the lift coefficient begins to drop. On the other hand, at α < –6° the CL does not vary much at increasingly negative angle of attack.
Generally, it is observed that a smaller serration wavelength (i.e., λ = 5 mm), regardless of the serration amplitude A, can preserve the lift curve slope of 2π at –6° ≤ α ≤ 8°. For a larger serration wavelength, such as the λ = 10 mm case, a smaller value of lift curve slope (dCL/dα≈0.08) is produced by the serrated aerofoil. With regard to the effect of the serration amplitude, it can be concluded that a smaller serration amplitude (i.e., A = 15 mm) is more effective than the larger serration amplitude (A = 30 mm). The effectiveness is measured in two phenomena. First, the stall angle is usually larger. Second, the values of the CL as a function of α are larger. This trend remains true at the post-stall regime as clearly demonstrated in the ΔCL distributions. Based on the above observation, the most superior serrated aerofoil in terms of the lift generation are the λ5A15 and λ10A15.
The analysis now focuses on the aerofoil with leading edge blowing. As mentioned earlier, the spanwise distributions of the leading edge orifices are defined by λ’ = 5 mm and 10 mm. These two spacing correlate with the serrated aerofoil with λ = 5 mm and 10 mm, respectively. For the λ’ = 5 mm leading edge configuration, the blowing rates would vary between 1.6 ≤ Q ‘ ≤ 3.06 L/min. For the λ’ = 10 mm, the blowing rates vary between 3.2 ≤ Q ‘ ≤ 6.12 L/min. It is worth mentioning that the lower limits of Q ‘ for both the λ’ = 5 mm and 10 mm leading edge configurations (λ’5Q ‘1.6 versus λ’10Q ‘3.2) stem from the same bulk mass blowing rate Q into the aerofoil. The same applies to the upper limits (λ’5Q ‘3.06 versus λ’10Q ‘6.12). After analysing from a large experimental dataset, it can be concluded that a lower blow rate Q ‘ tends to increase the CL and stall angle. The effect of the blow rate to the CL can also be affected by the λ’. For example, in Figure 5 the λ’5Q ‘1.6 is found to produce the best resemblance to the λ’10Q ‘3.2 in terms of their CL curves. This can be confirmed by another example where the λ’5Q ‘3.06 matches the best CL curve with the λ’10Q’6.12 (not shown here for brevity). However, it should be noted that the dCL/dα produced by the different combinations of λ’ and Q ‘ can still be very different.
Within the Q ‘ range described above, it is possible to match some of the CL curves produced by the leading edge blowing against those produced by the serrated aerofoil. The comparison can also be found in Figure 5. First, a trend is discernible whereby an increase of the serration amplitude from A = 15 mm to 30 mm can re-produce somewhat very similar CL variations with the α by an increase of the blowing rate from Q ‘ = 1.6 L/min to 2.61 L/min (when λ’ = 5 mm), or 3.2 L/min to 4.24 L/min (when λ’ = 10 mm). In other words, a doubling of the serration amplitude corresponds to a ΔQ ‘≈1 L/min.
Interestingly, a second trend concerning the correlation between the serration wavelength λ and the leading edge blow rate Q ‘ also emerges. In order to match the same CL curves, a doubling of the serration wavelength from λ = 5 mm to 10 mm will also correspond to a doubling of the Q ‘.
Both trends suggest that the manipulation of the CL distributions and the mitigation of boundary layer stall at high angles of attack by the leading edge serration and leading edge blowing are governed by similar flow mechanisms. More importantly, the λ’ and Q ‘ can indeed mimic the λ and A, respectively, to produce the same aerodynamic performances. This is a significant finding.
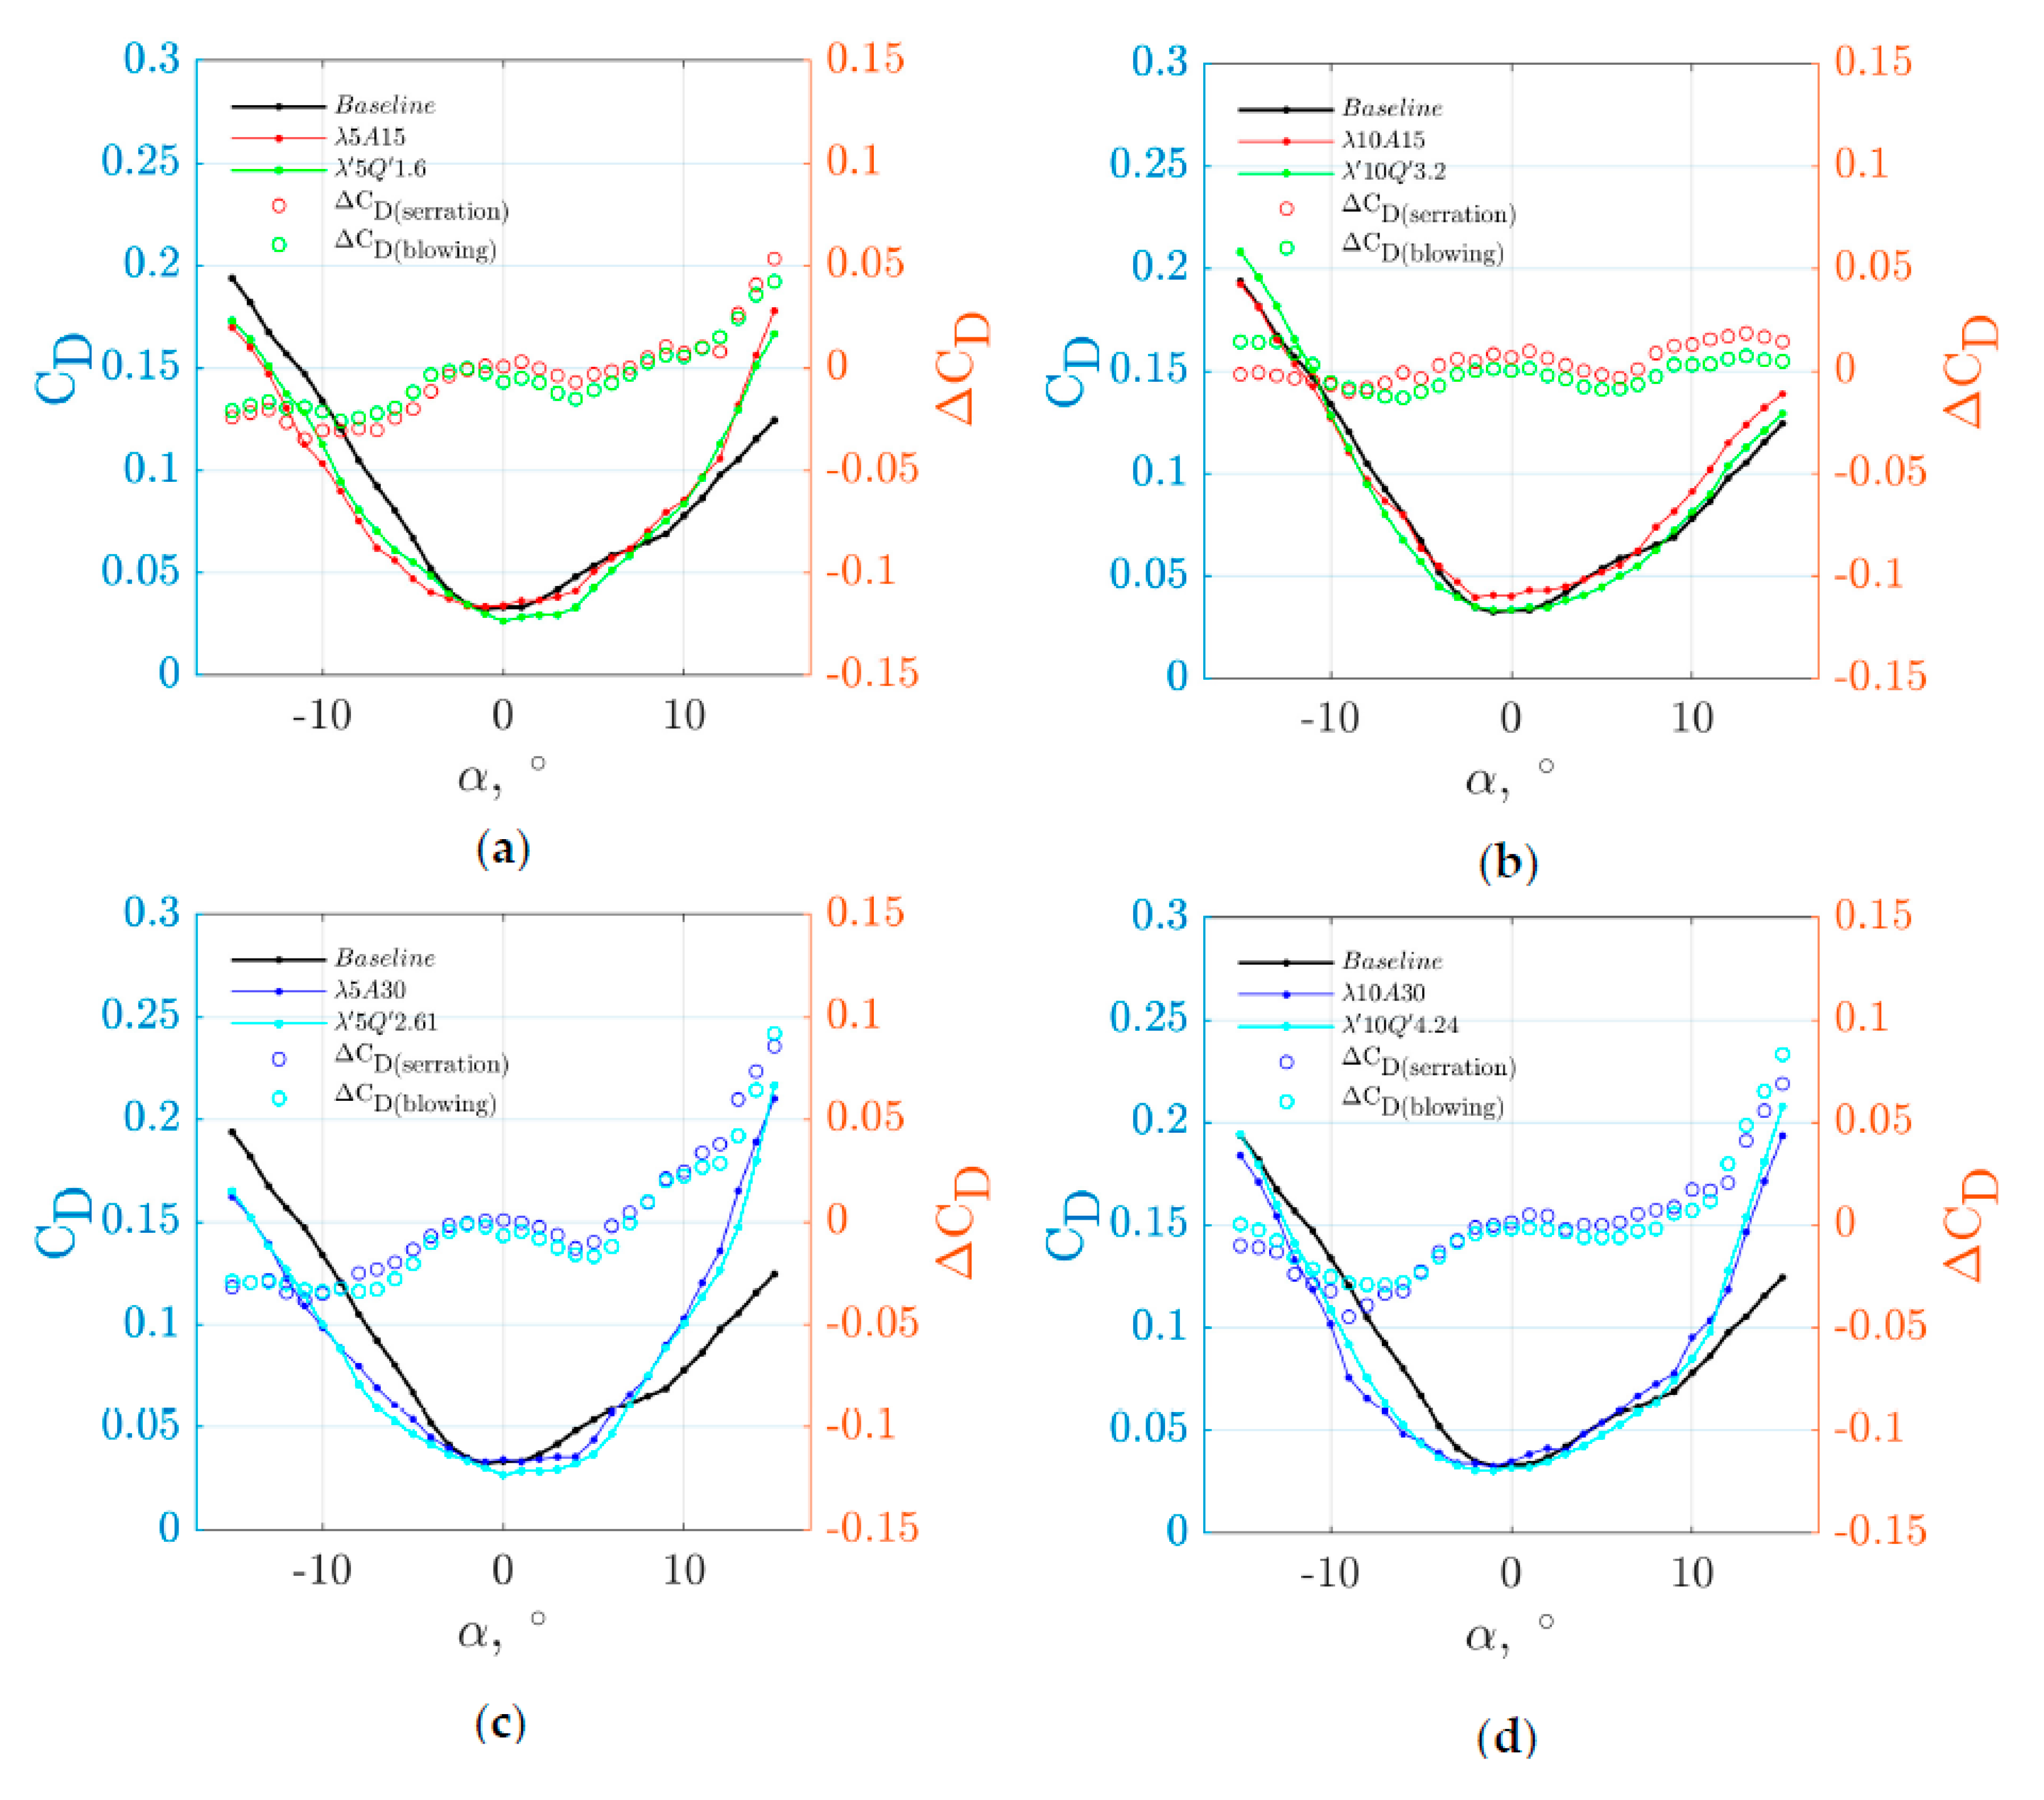
Further corroboration can be made in Figure 6 for the variations of the drag coefficients CD, as well as the ΔCD, against the α. Similar to their CL counterparts, each paring between the serrated leading edge and blowing leading edge for the CD across –15° ≤ α ≤ 15° is also very well matched. All curves have roughly the same point of interception with CD≈0.03 at α = 0°. Majority of the (λ, A) and (λ’, Q ‘) pairing, when compared with the baseline leading edge, would exhibit a reduction of CD across –15° ≤ α ≤ 0°, but an increase of CD across 0° < α ≤ 15°. The increase of the CD at the post-stall regime is noticeable for both the blowing leading edge and serrated leading edge. The exception is the pairing between the λ10A15 and λ’10Q ‘3.20 where the CD curves follow closely the baseline one throughout the range of angle of attack investigated here, including the otherwise post-stall regime. This particular control configuration represents an optimal and reliable choice in terms of the minimal drag production.
3.2. Acoustic Results
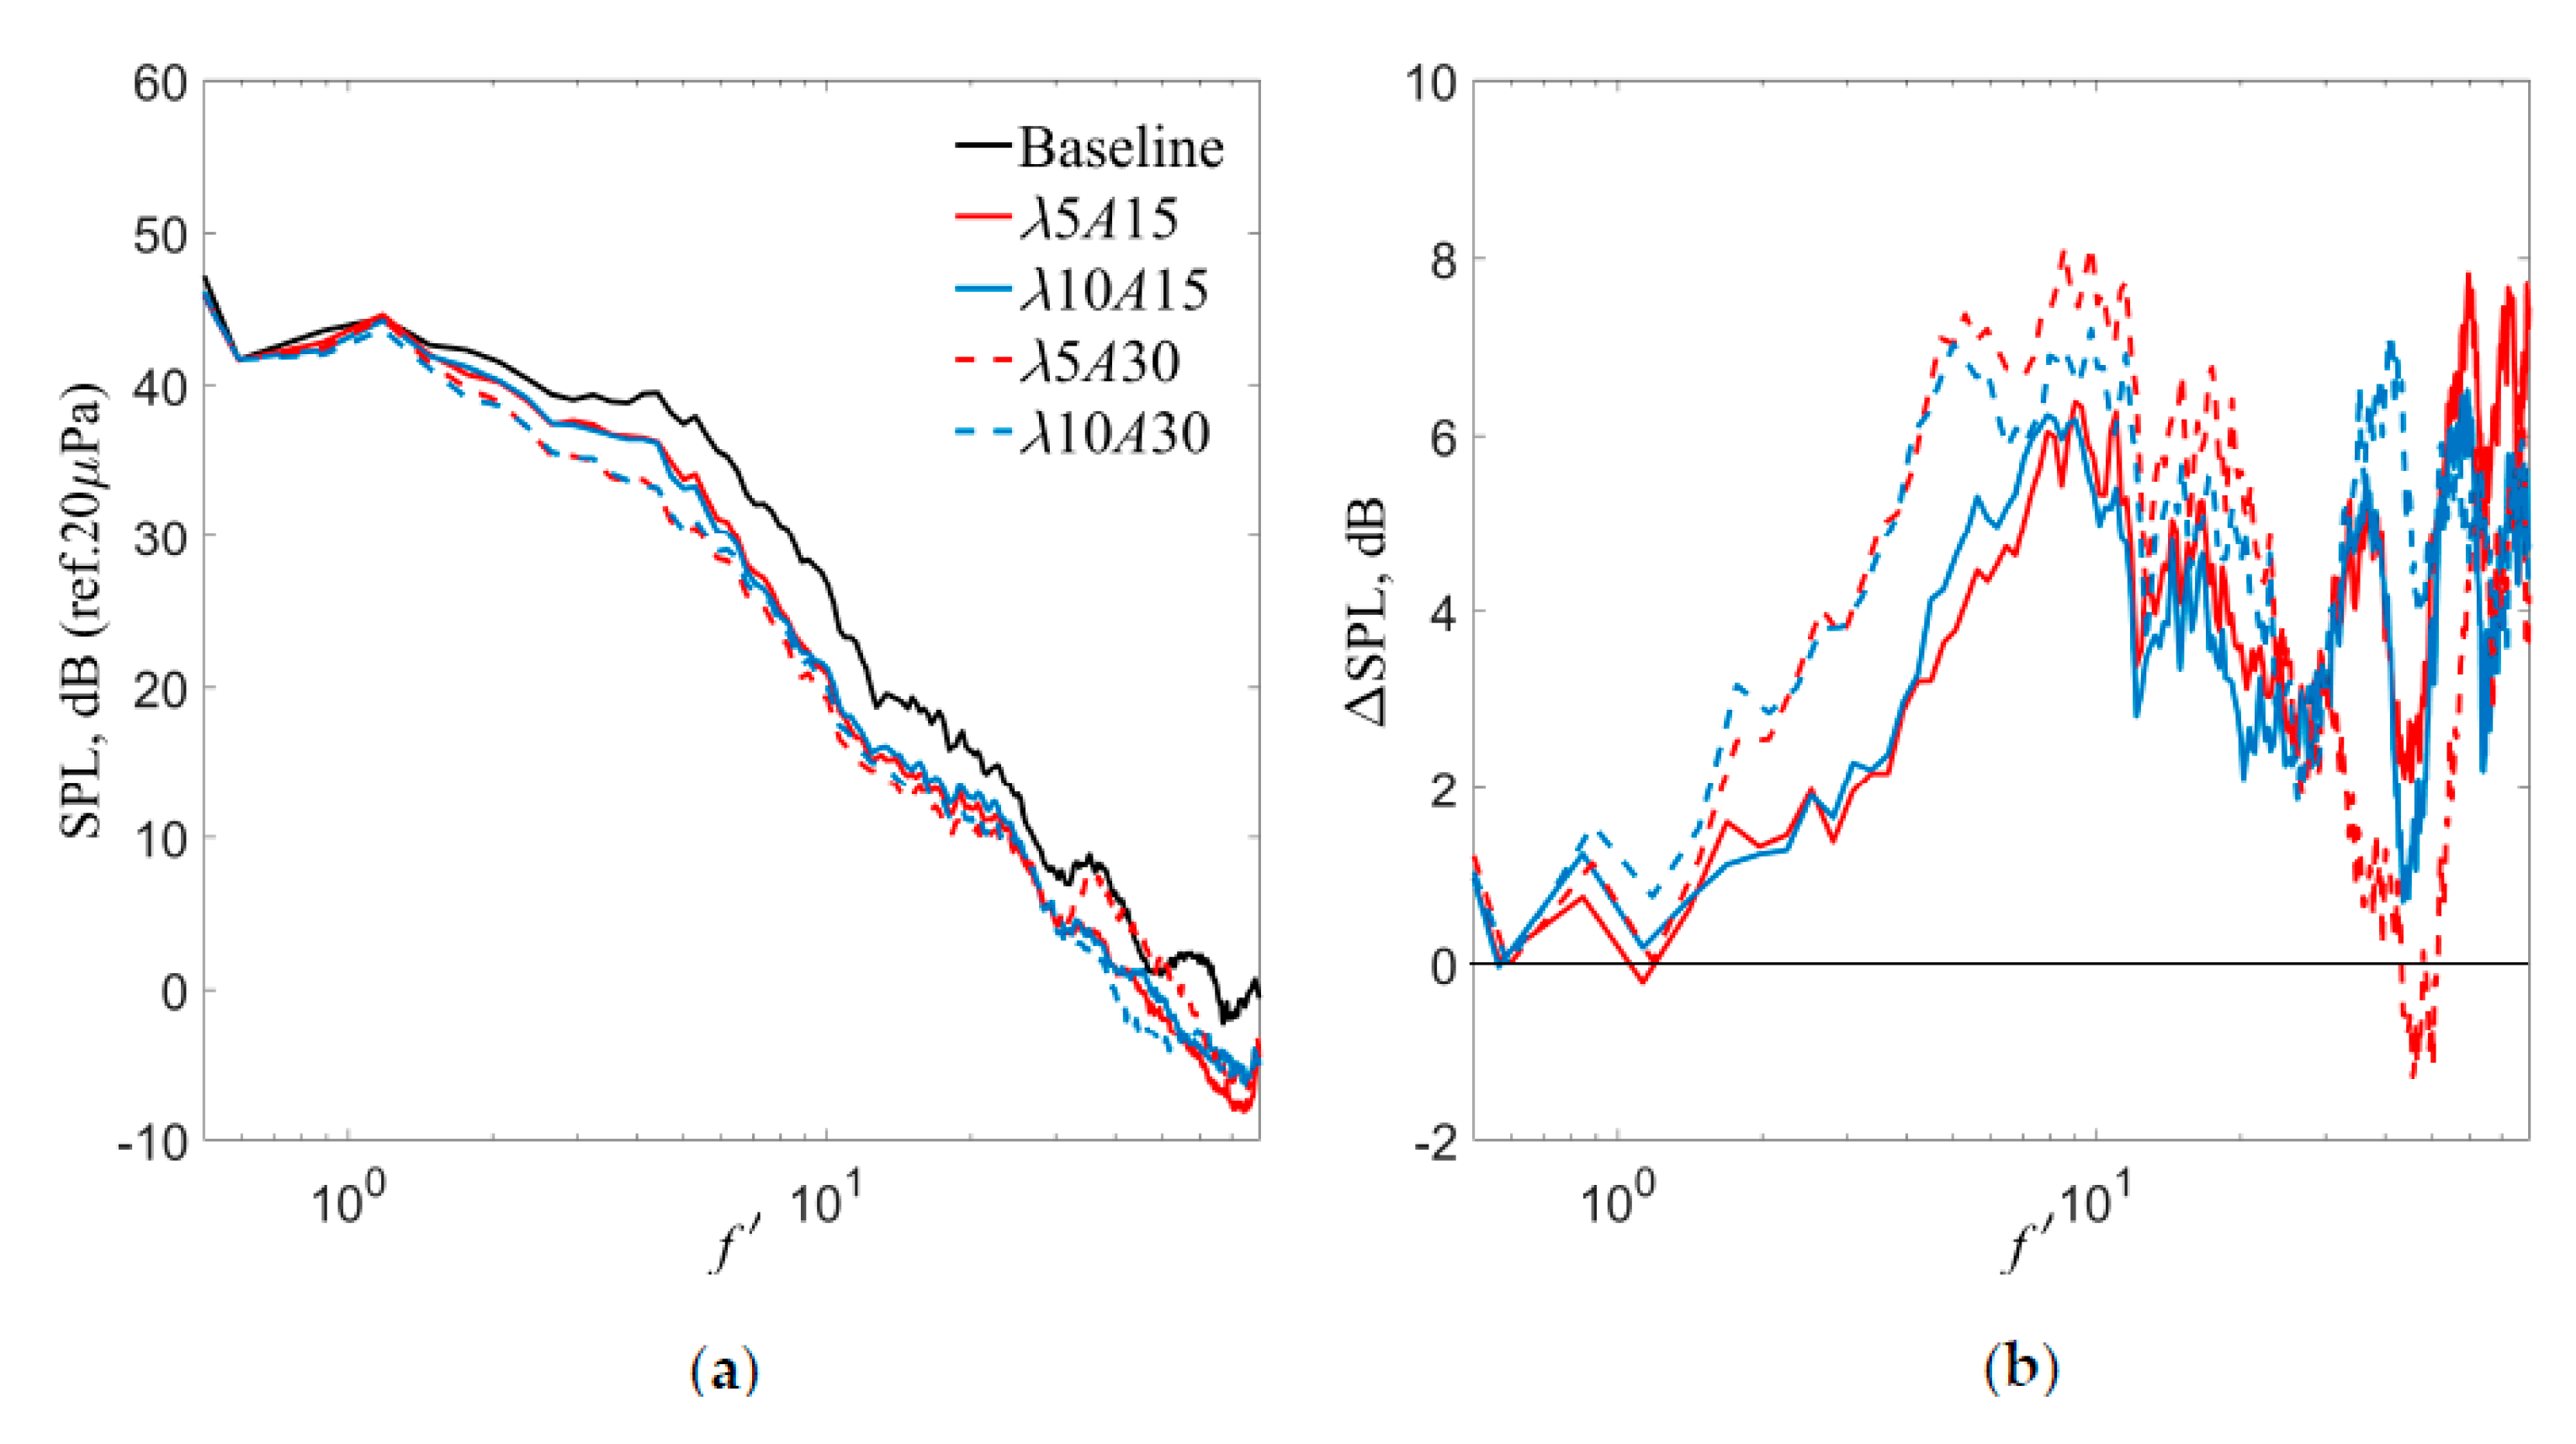
This section will show the acoustical results when the leading edge of the aerofoil is subjected to both the serration and blowing treatments, respectively. By examining the Sound Pressure Level SPL as a function of non-dimensional frequency f ‘ (=fC/U, where C is the aerofoil chord length) generated by the baseline aerofoil in Figure 7a, the mostly broadband nature of the spectrum at the low to medium frequency is related to the turbulence–leading edge interaction noise. It is also clear that the elevated freestream Tu has triggered a bypass transition on the aerofoil surface, as there is no evidence of the Tollmien-Schlichting instability tonal noise in the acoustic spectrum.
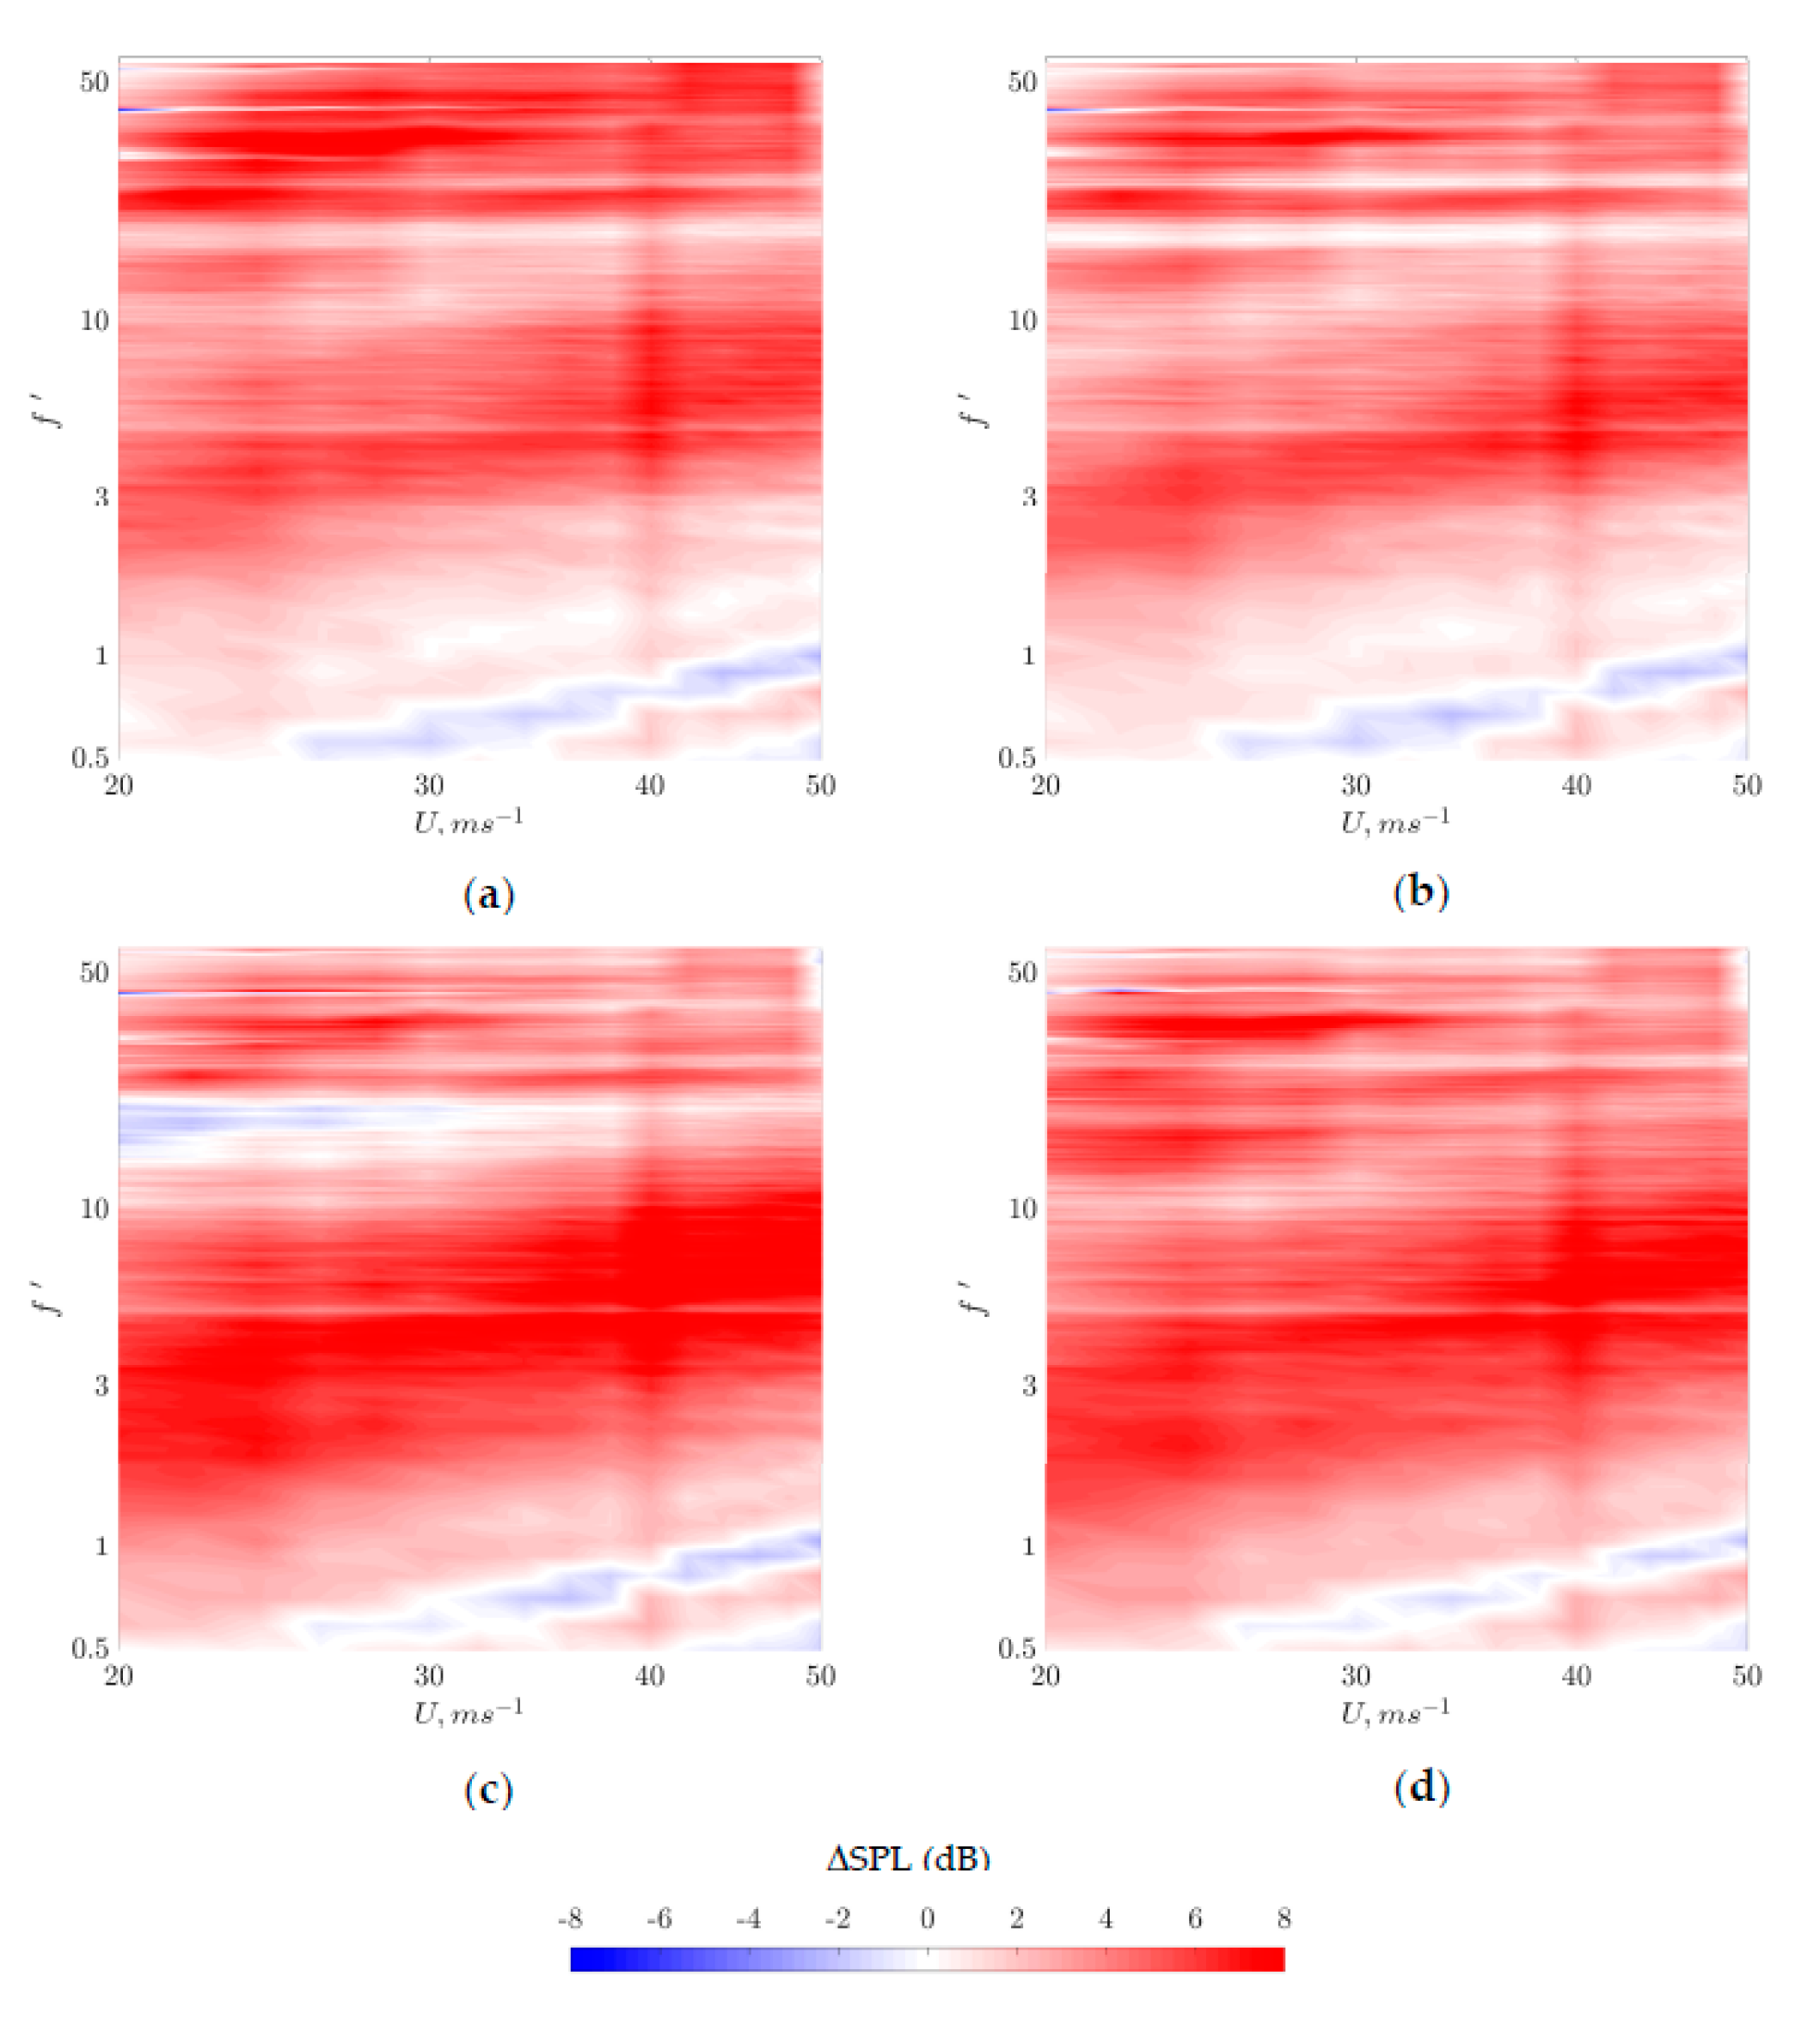
Here, ΔSPL is defined as the difference in SPL between the acoustic spectra generated by the baseline and treated leading edges (either serration or blowing). A positive ΔSPL denotes noise reduction by the treated aerofoil, while a negative ΔSPL denotes noise increase. The following discussion focuses on the aeroacoustical performances by the serrated leading edge only. As demonstrated in Figure 7a,b, the most effective serration configuration for the turbulence–leading edge broadband noise reduction is the combination of the smallest λ and largest A, although a slight noise increase at high frequency can also be detected. The A exerts a more dominant factor on the noise reduction compared to the λ, which has also been reported in [14,15]. Repeating the same set of serrated leading edges across a wider range of U essentially returns the same positive outcomes, as shown in Figure 8.
The next discussion concerns one of the most important outcomes of this paper. Facilitating different levels of Q ‘ on the leading edge could produce very interesting aeroacoustical performances. The turbulence–leading edge broadband noise reduction by leading edge blowing can indeed be achieved. In some cases, ΔSPL as high as 10 dB can be achieved by one of the leading edge blowing configurations. However, it is important to stress that the noise reduction can only be achieved over a rather narrow range of blowing rate Q ‘. When the blowing rate is outside of this optimal range, no significant noise reduction can be observed.
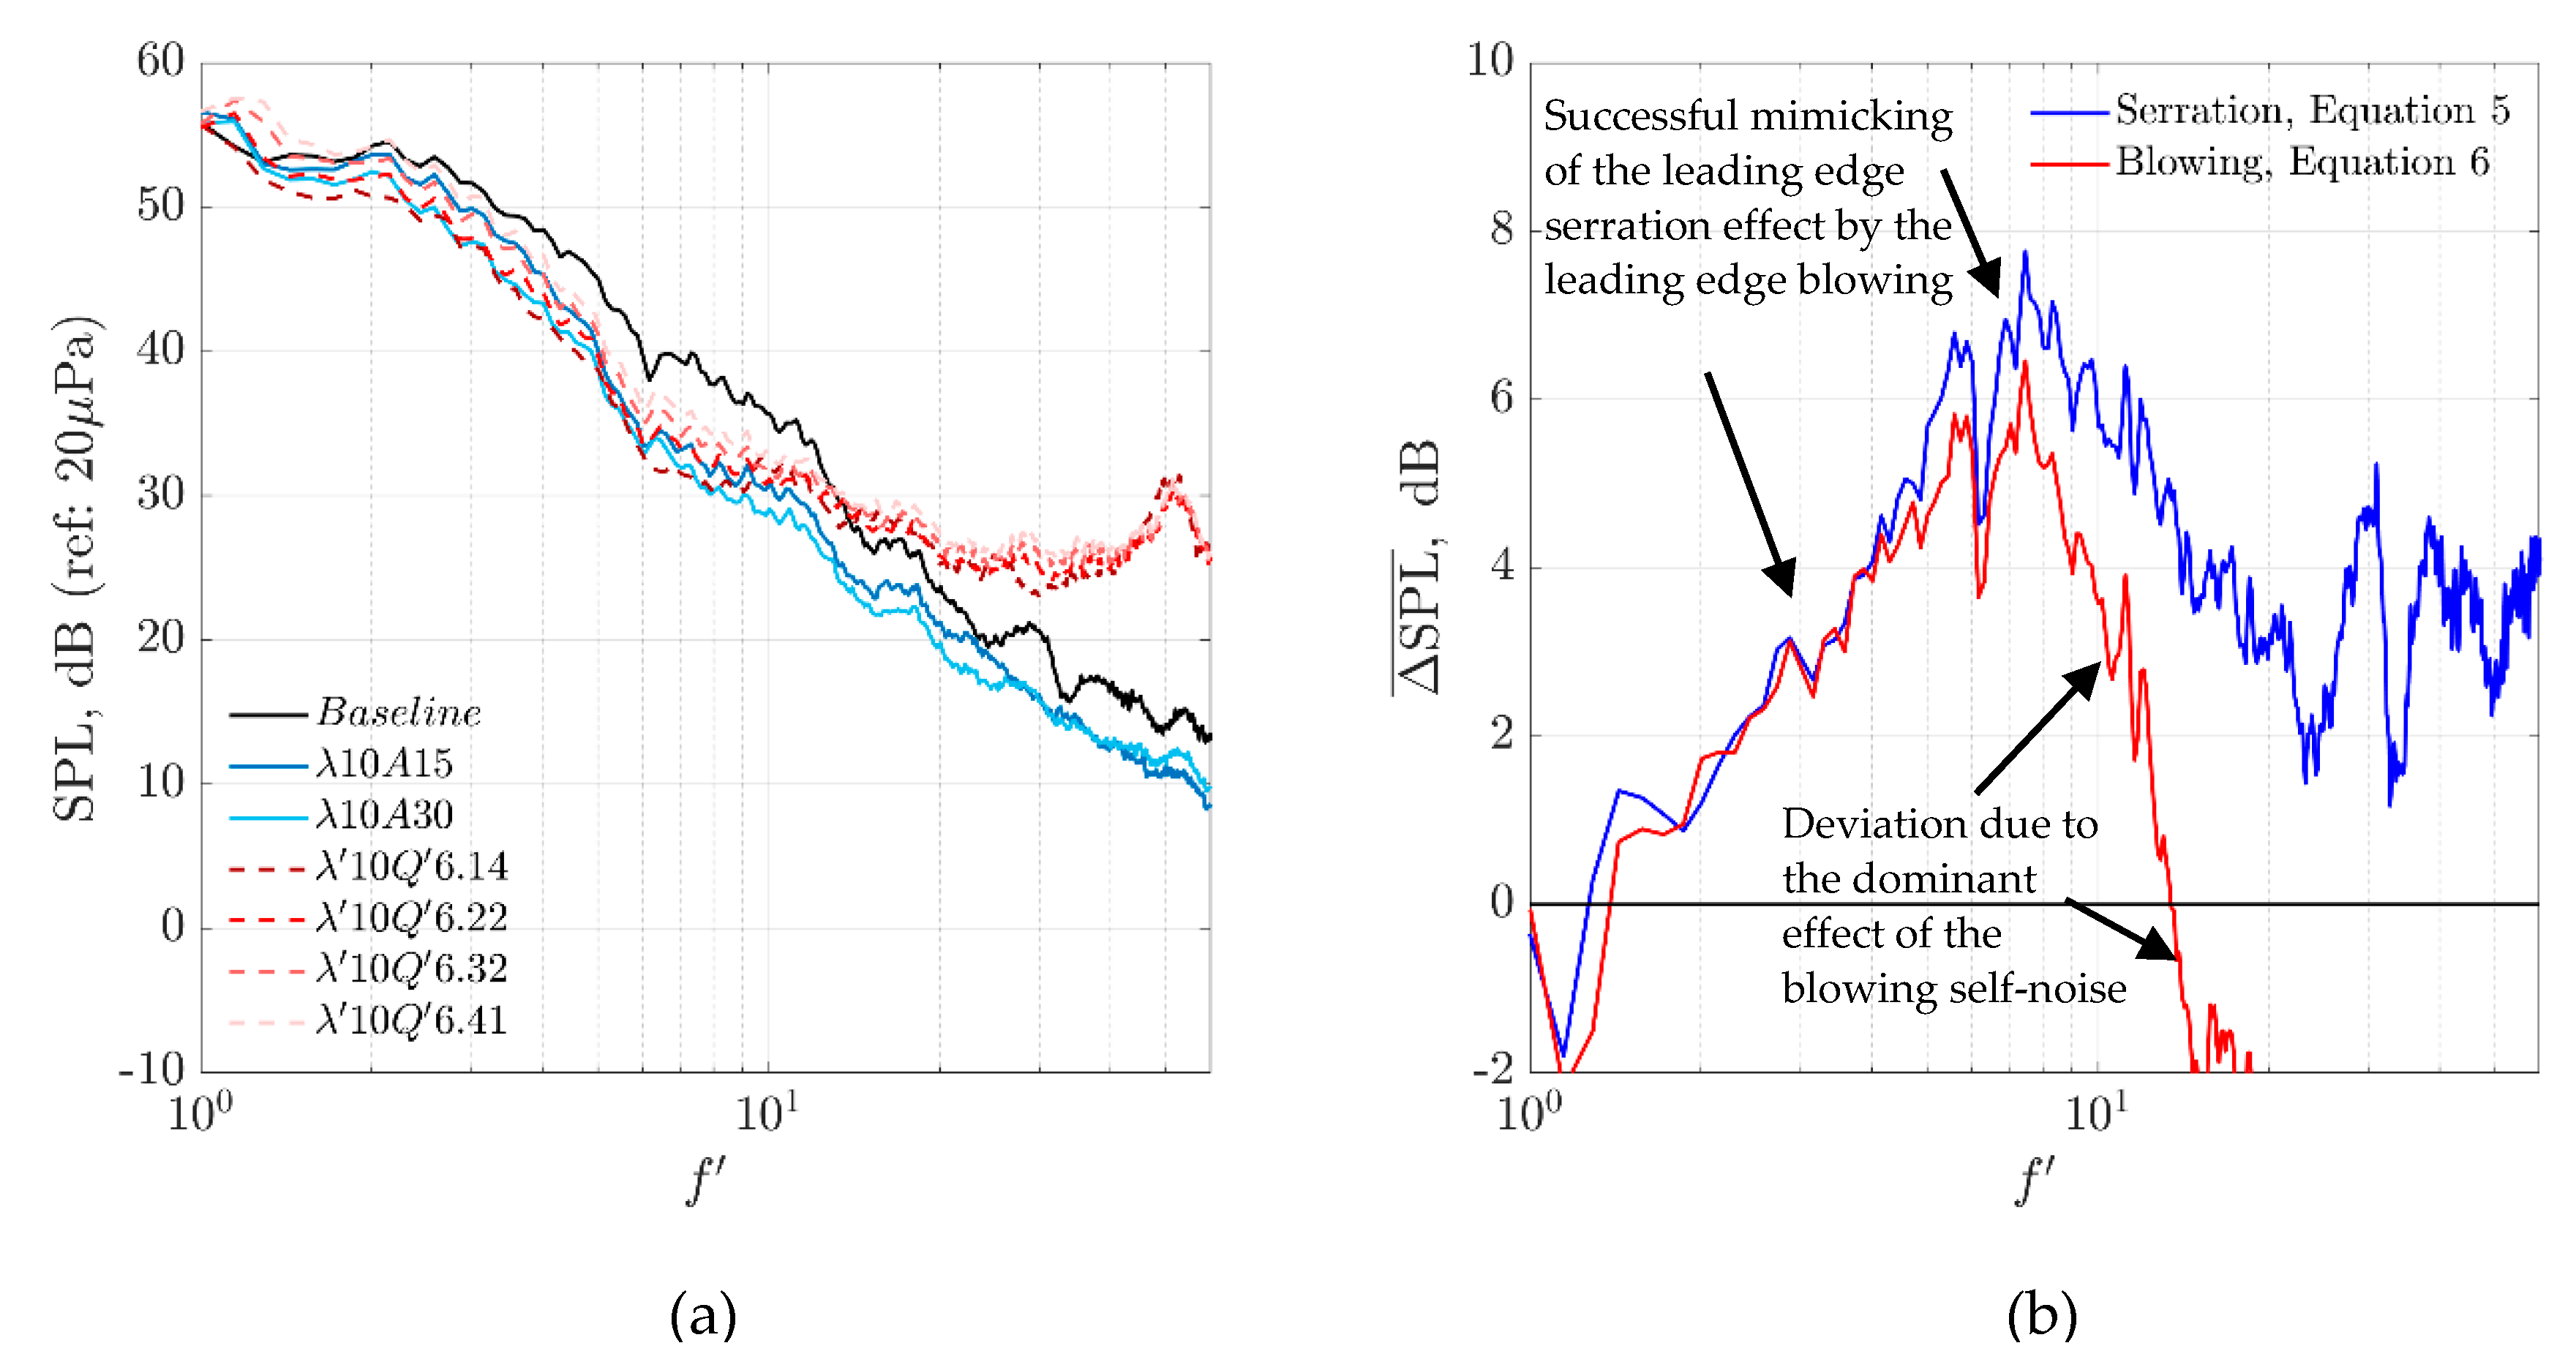
From the acquired dataset, a selection of the acoustic spectra subjected to leading edge blowing within the range of 6.14 ≤ Q ‘ ≤ 6.41 L/minute is presented here. Figure 9a shows the acoustic spectra produced by the leading edge blowing for the λ’10Q ‘6.14, λ’10Q ‘6.22, λ’10Q ‘6.32, and λ’10Q ‘6.41 at U = 45 ms−1. Acoustic spectra produced by the λ10A15 and λ10A30 serrated leading edges are also included for comparison. Note that the comparison between the serrated and blowing leading edges is based on the matching value of λ and λ’, respectively. In order to provide a clearer picture of the comparison, the mean-difference in the SPL level between the baseline and treated aerofoil is defined below:
Similarly, a positive value in the denotes that noise reduction is achieved against the baseline, and vice versa.
An examination of Figure 9b can easily identify strong similarities in the noise reduction trend at f ‘ < 8. This is a clear evidence that the leading edge blowing can indeed mimic the serrated leading edge. Above this frequency, however, cumulative jet noise produced by the orifices becomes dominant and overtakes the aerofoil noise radiation. As a result, negative value of (i.e., noise increase) can be produced. It should also be noted that the optimised Q ‘ values listed above for the broadband noise reduction are slightly higher than the optimised Q ‘ in the CL distributions (see Figure 5), which was performed under different U and Tu domains. The different levels of sensitivity for Q ‘ in producing the aeroacoustics and aerodynamic performances are expected due to the different physical mechanisms involved.
The effective margin of the leading edge blowing volume flow rate is so narrow that a small deviation from the optimised Q ‘, which ultimately relates to the exit jet velocity, can produce a large difference in the aeroacoustics performance. The concept of the leading edge blowing is to minimise the interaction of an incoming turbulent flow with the leading edge of the aerofoil. Through blowing, the leading edge jet continuously opposes, and possibly dissipates the incoming turbulent eddies by either displacing the leading edge stagnation point of the aerofoil, or creating a “buffer zone” over the vicinity of the aerofoil leading edge. It seems that one, or possibly both of these mechanisms could be very sensitive to the Q ‘.
4. Use of Leading Edge Blowing to Enhance the Serration Effects (Hybrid Device)
4.1. Acoustic Results
The serrated leading edge has been demonstrated as a powerful passive device for the reduction of the turbulence–leading edge broadband interaction noise. Some recent studies [1,2,3,4,5,6] report that the far field reduction are underpinned by the reduction of the surface pressure fluctuations around the tip and mid-regions of the serration, as well as the phase interference and destruction effect between the serration peak and the mid-region of the oblique edge. These suggest that the serration trough region remains effective in the radiation of the interaction noise.
The results provided thus far for the leading edge blowing, as an active device, strongly indicate that the produced exit air jet can counteract with the inflow turbulence, and successfully mimic the leading edge serration effect to reduce the level of the broadband interaction noise radiation.
A new concept is developed here to use the leading edge blowing to enhance the serration effects. The rationale to investigate such hybrid device is based on the hypothesis that when the orifices are placed strategically across a serrated leading edge, e.g., at the tip and trough regions of the serration, the exit air jets can further reduce the level of turbulence interaction. Figure 10 provides an illustration for the hybrid device. In the current study, the serrated leading edge is of the type λ45A30. The relatively large serration wavelength used here, instead of a prefer choice of smaller serration wavelength that is known to be a favourable choice for leading edge noise reduction, is to mitigate the manufacturing complexity of the internal air plenum chamber for the aerofoil.
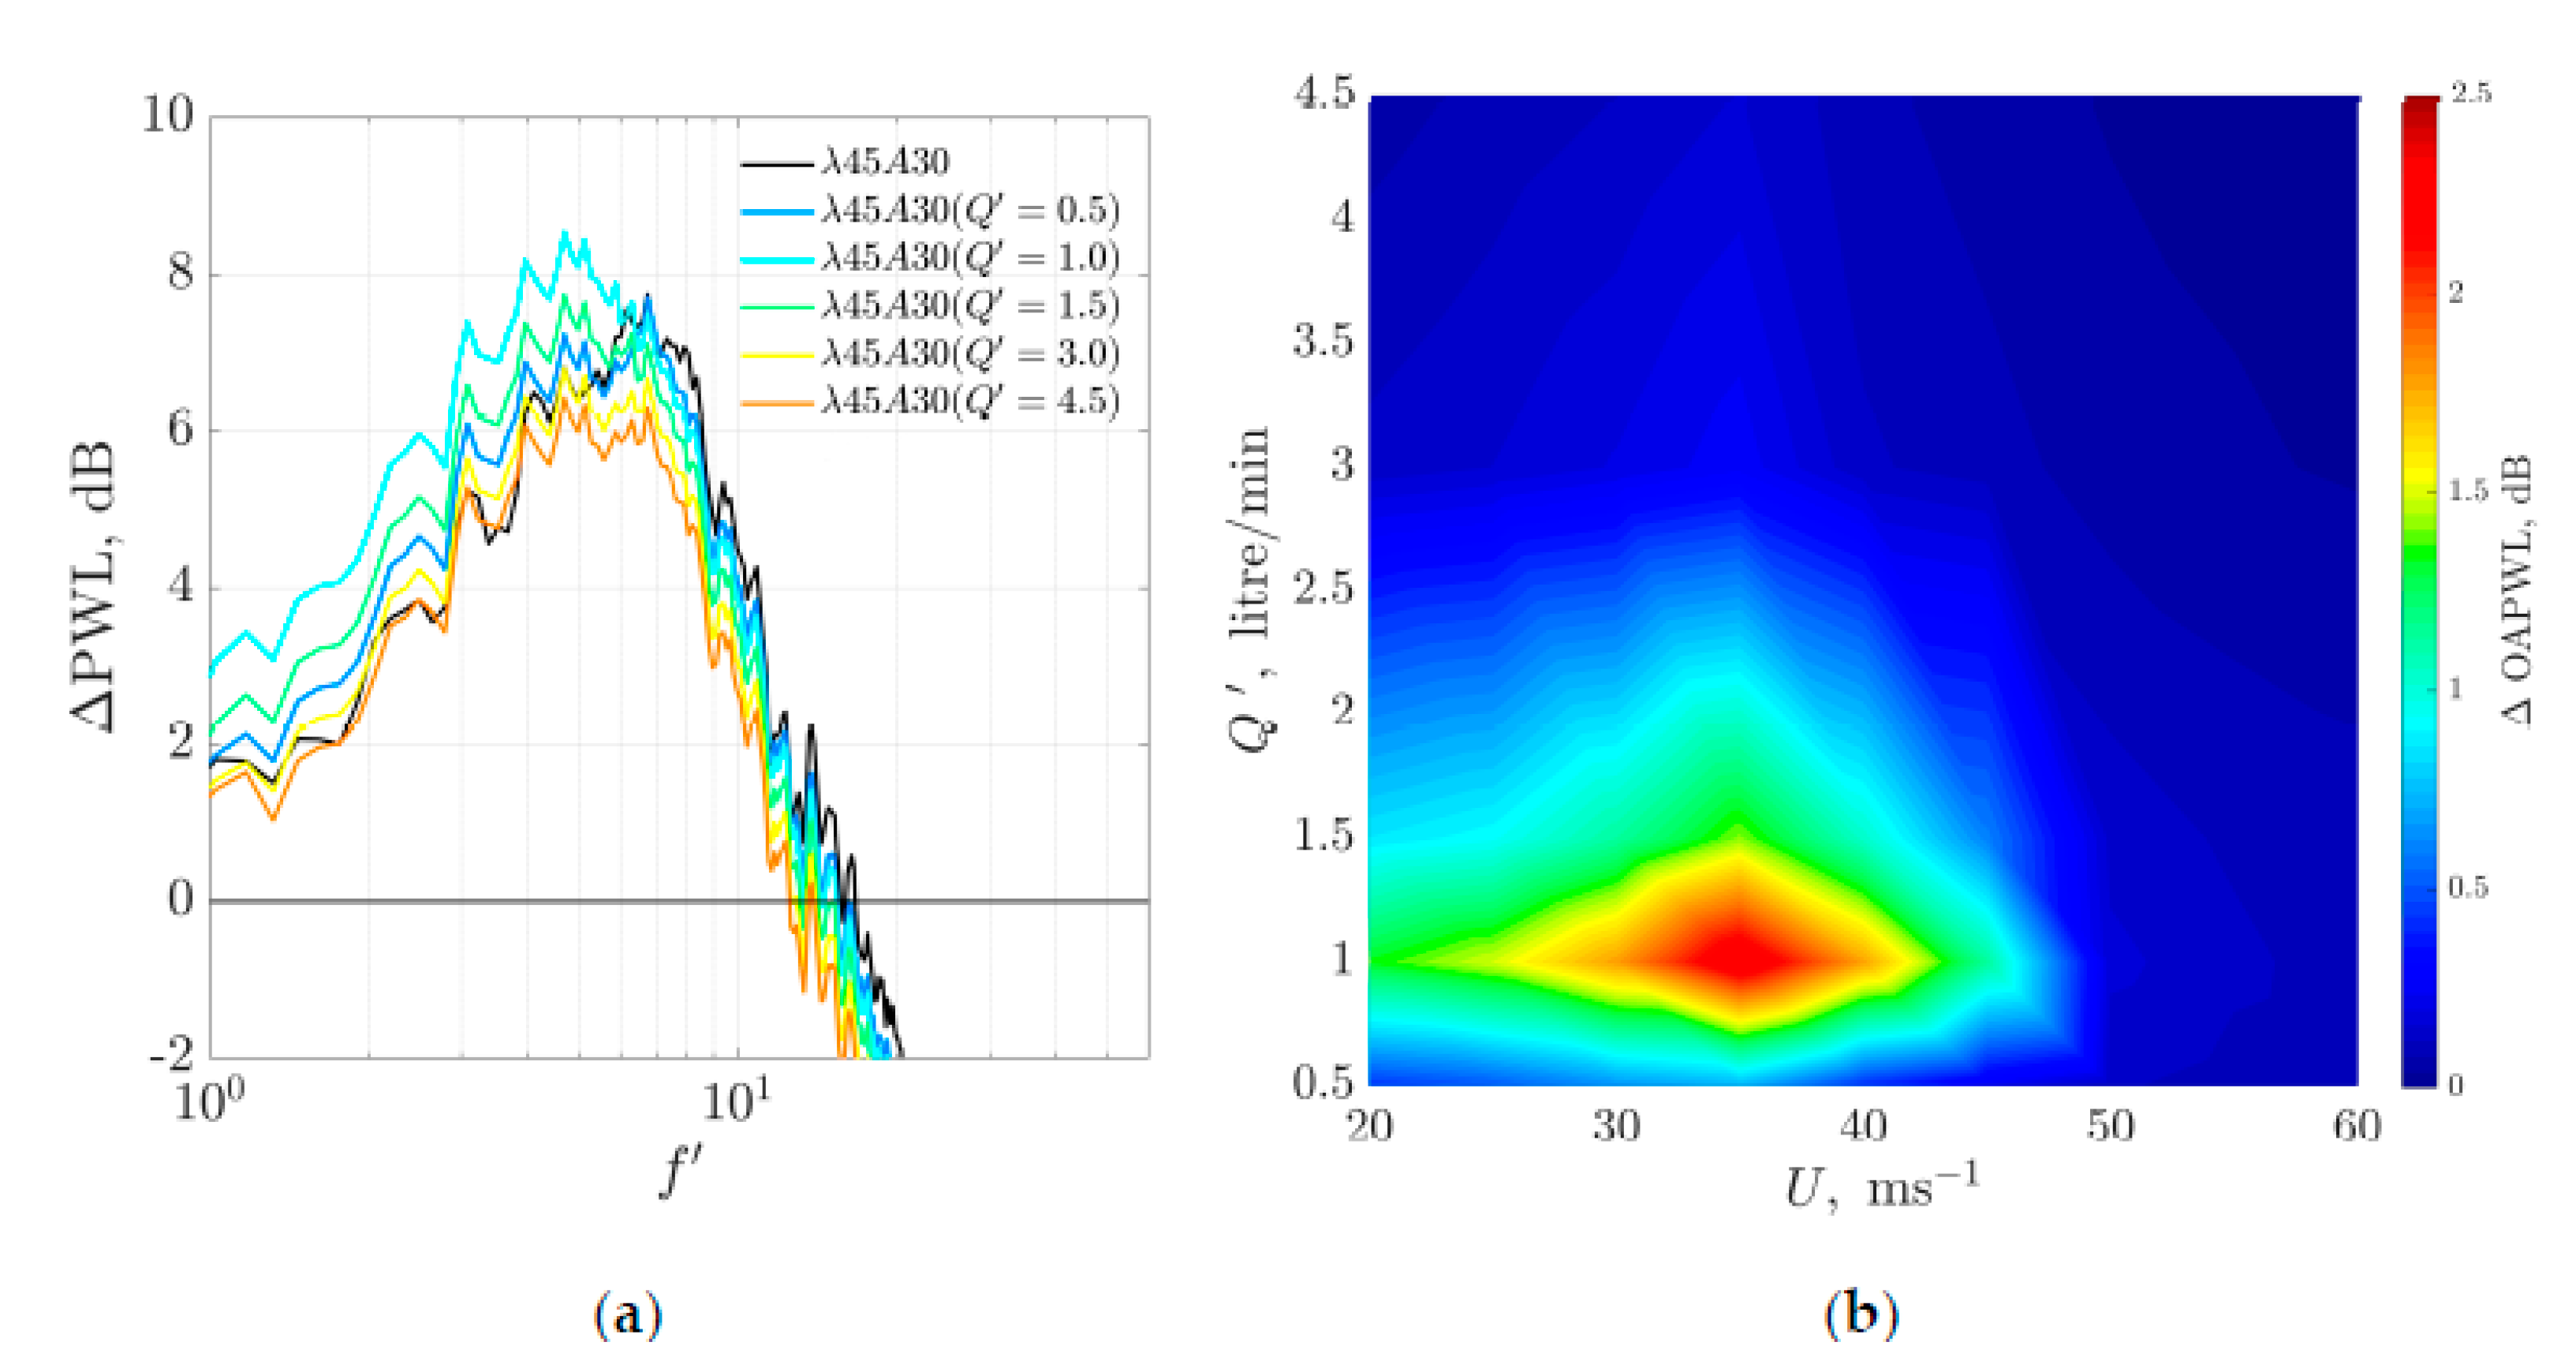
Under exactly the same experimental procedures and inflow turbulence level, a comparison of the ΔPWL as a function of normalised frequency f ‘ produced by (1) the λ45A30 only, and (2) hybrid device (λ45A30 + blowing Q ‘) at U = 40 ms−1 and α = 0° is shown in Figure 11a. Note that the ΔPWL is the difference in the Sound Power Level between the baseline and either the λ45A30 or the hybrid device. Similarly, a positive value of ΔPWL denotes noise reduction against the baseline, and the opposite is true. The values of Q ‘ indicated in the figure refer to the flow rate at each orifice. From the figure, the λ45A30 serration-only case is shown to achieve a maximum noise reduction of ~ 7 dB at f ‘ ≈ 7. After facilitating a small blow rate of Q ‘ = 0.5 L/min for the hybrid device, the noise reduction performance is enhanced throughout f ‘ < 7 where a further 1 dB improvement can be observed across the lower frequency. Further level of improvement is achieved when Q ‘ is increased to 1.0 L/min, where the peak noise reduction is about 8.5 dB at a lower frequency of f ‘ = 5. Compared to the serration-only case, the addition of leading edge blowing can cultivate a further 2 dB level of noise reduction throughout f ‘ < 5. Interestingly, the sensitivity of the noise radiation against Q ‘ for the hybrid device can be optimised. This is because when Q ‘ is increased beyond the level of 1.0 L/min, the overall level of ΔPWL begins to drop across the frequency. In a relatively high blow rate Q ‘ = 4.5 L/min, the corresponding ΔPWL is lower than the serration-only case, essentially means that this particular high blow rate hybrid device is detrimental. The results in Figure 11a thus indicate that there is an optimum value of Q ‘ in the hybrid device, and the maximum noise reduction is generally shifted to a lower frequency.
Another useful quantity to describe the noise reduction performance of the hybrid device is the Overall Sound Power Level (OAPWL). In the current analysis, the sound power is integrated between 0.1 and 20 kHz. Figure 11b shows the contour map of the ΔOAPWL produced by the difference in OAPWL between the serration-only (λ45A30) and hybrid (λ45A30 + Q ‘ = 0.5–4.5 L/min), as a function of Q ‘ and U at α = 0°. Essentially, the ΔOAPWL defined here represents a quantity that measures the further level of noise reduction on top of the level that is already achieved by the serration-only case. The contour map emphasises the very sensitive nature of the blow rate Q ‘ in the hybrid device. The blowing does not provide quantifiable benefits when the inflow velocity U is relatively high. Very high level of blowing itself is also not recommended. Generally, it works best when the inflow velocity is relative low and couples with a low blow rate Q ‘. From the figure, the upper limits of the optimal combination for Q ‘ and U are 2 L/min and 45 ms−1, respectively. We refer to this area as the “effective zone”. Velocity profiles similar to those shown in Figure 4b have also been performed for the hybrid device. The nearest streamwise measurement point relative to the orifice at the serration tip is about 2 mm. Using the measured streamwise velocity at this location as the reference, the Q ‘ can be converted to Upeak for the exit jet. Within the effective zone, the most optimal blowing level that achieves the largest level of ΔOAPWL (~2.5 dB) is to apply an exit jet of Upeak between 10 and 13% of the inflow velocity. Again, a reminder that the ΔOAPWL measures the further level of noise reduction above the serration-only case. To the best knowledge of the authors, this is the first report where the interaction noise reduction by a serrated leading edge can be enhanced by combining it with leading edge blowing.
4.2. Aerodynamic Results
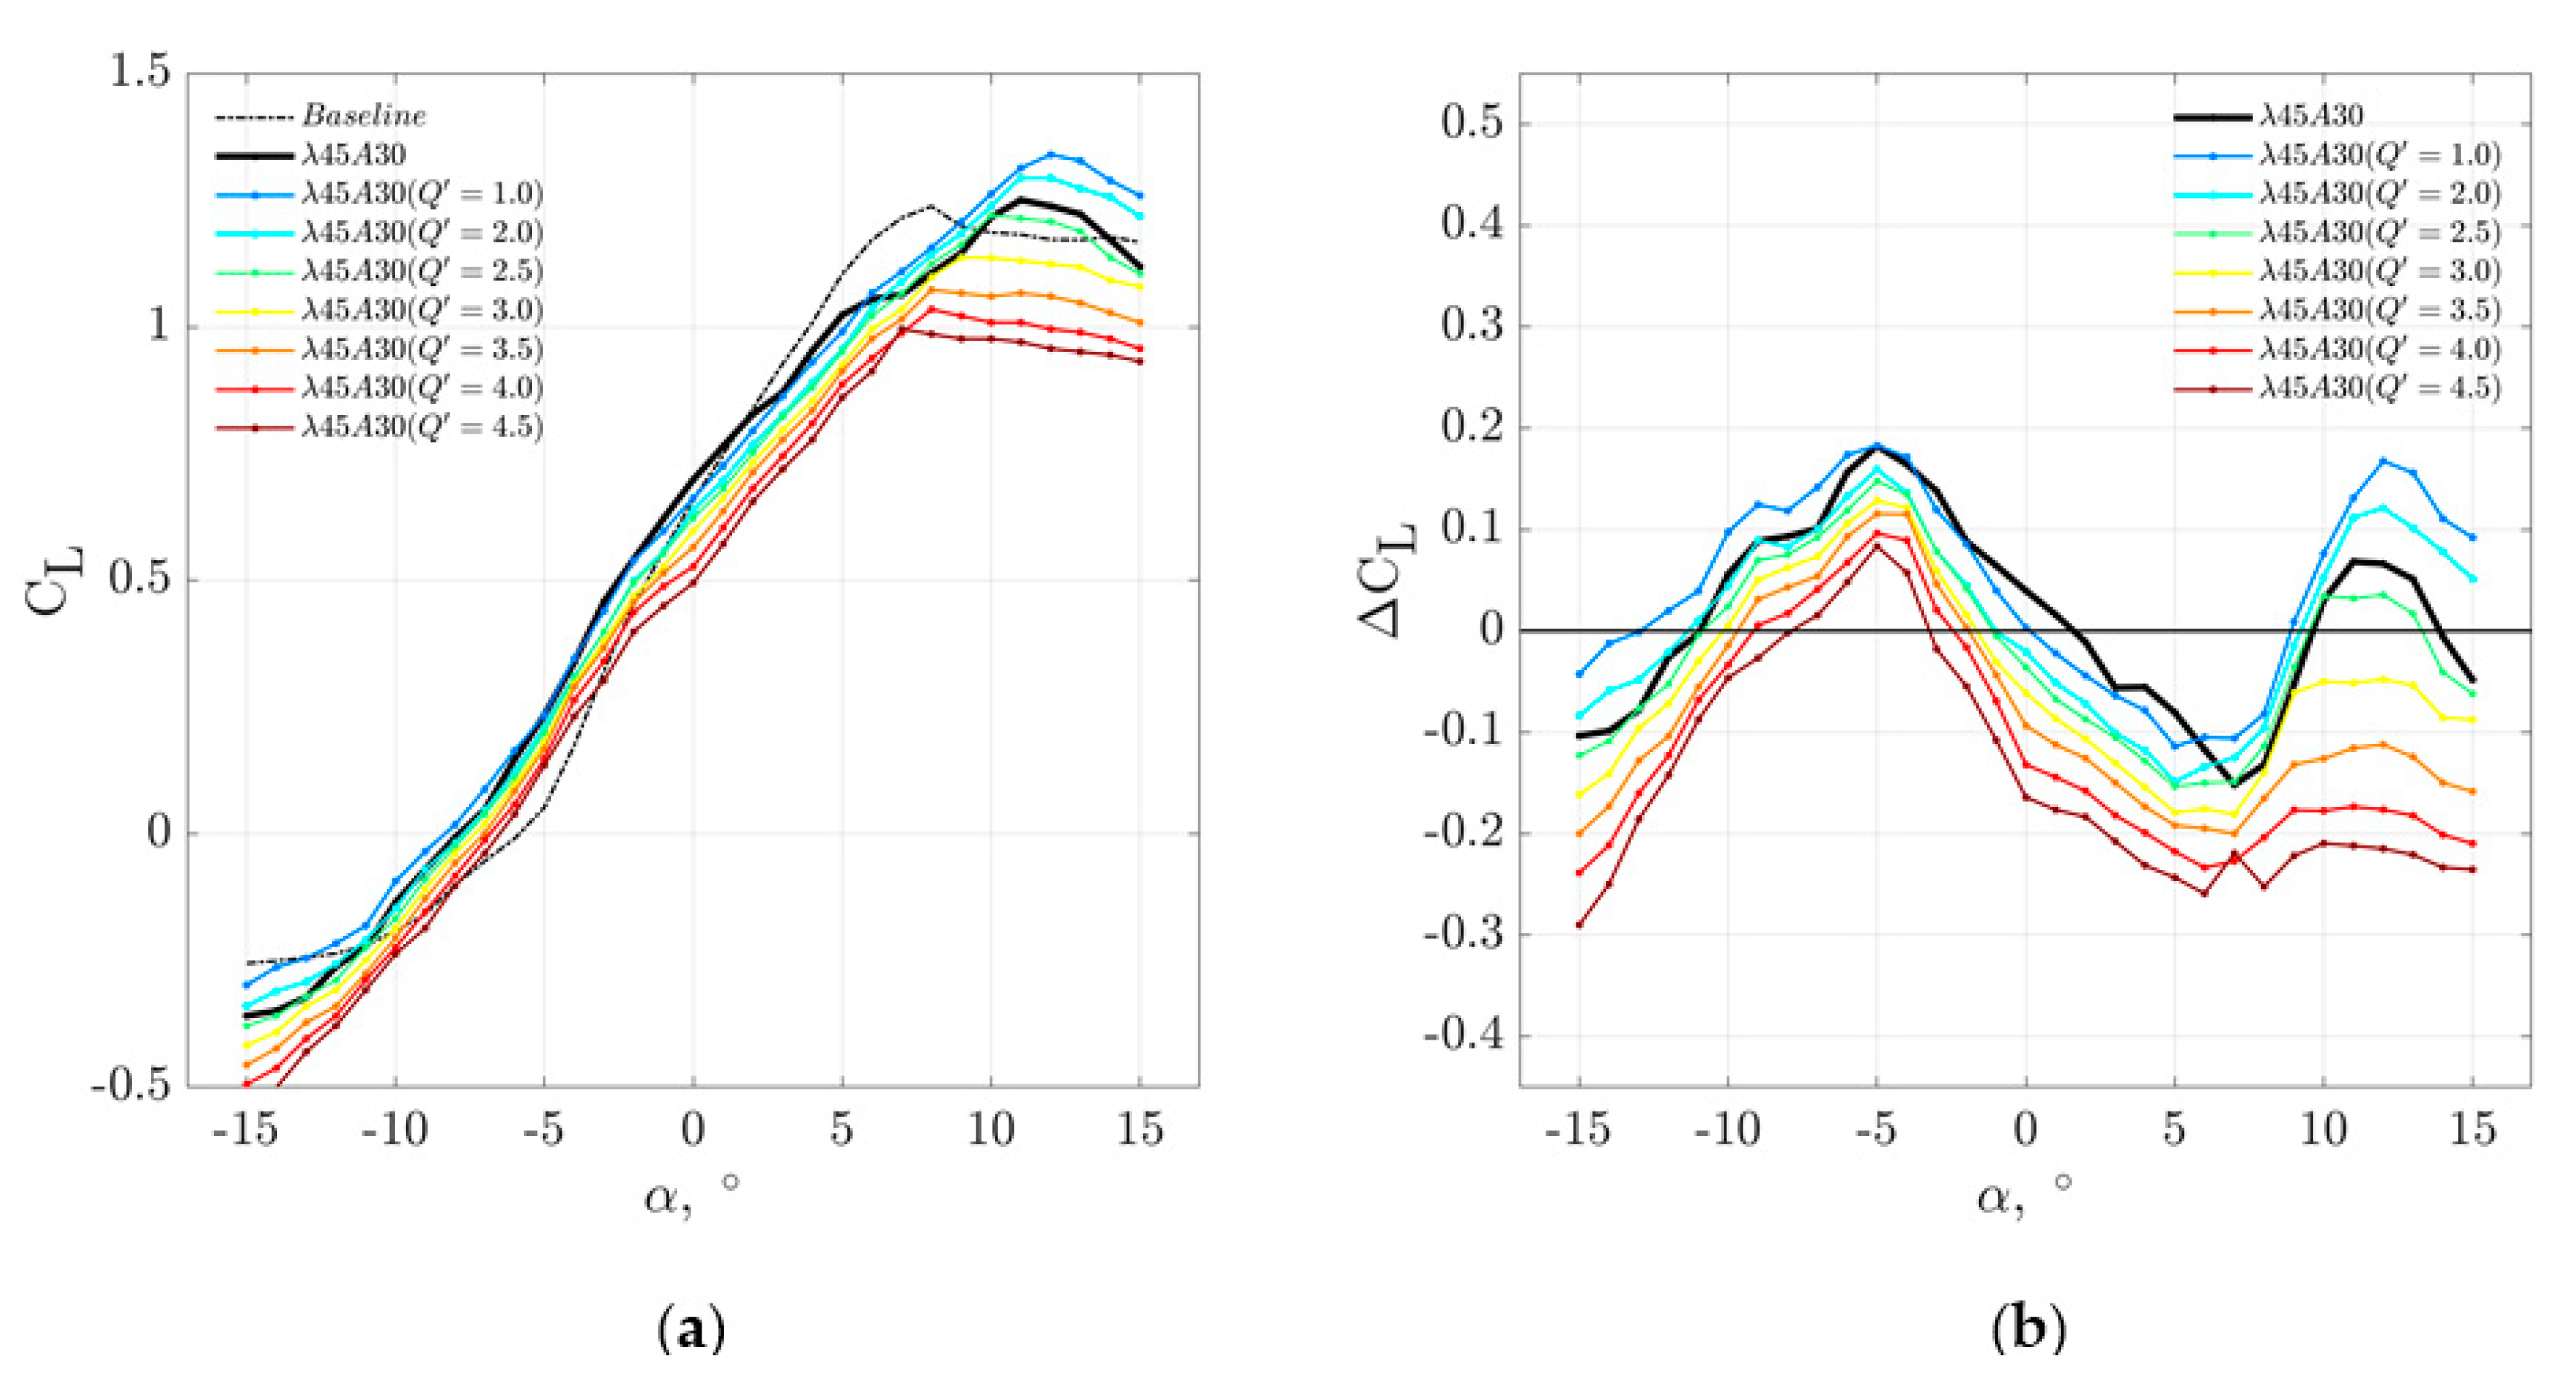
The evaluation of the hybrid device is now turned to the aerodynamic performance. Under the same experimental flow condition as that in Section 3.1, Figure 12a shows the CL against the angles of attack α produced by the baseline, serration-only (λ45A30) and hybrid (λ45A30 + Q ‘ = 1.0–4.5 L/min) leading edge device at U = 25 ms−1. Figure 12b shows the corresponding distributions of the ΔCL. Note that the definition of the ΔCL is the same as before, i.e., ΔCL(α) = CL treated(α) − CL baseline(α), where a positive ΔCL denotes improvement of the CL achieved by either the serration-only or hybrid devices. The CL and ΔCL distributions for both the baseline and serration-only cases bear the same characteristics as those shown and discussed earlier in Figure 5. Interestingly, the response in CL against the Q ‘ for the hybrid device also exhibits a remarkably similar fashion as the far field radiation discussed in Section 4.1 (although one should take note that the flow conditions for the noise and aerodynamic tests are different). The most optimal blow rate is the same at Q ‘ = 1.0 L/min, in which not only it increases the stall angle by about 1 degree, but it also produces the maximum CL of 0.1 higher than the maximum CL produced by the serration-only. From then on, a gradual increase of the Q ‘ will affect negatively the CL generation across the entire α range investigated here. By examining Figure 12b, the distribution of the ΔCL exhibits a sinusoidal-liked pattern against α for both the serration-only and hybrid devices. The decay rates at which the ΔCL changes with the Q ‘, d(ΔCL)/d(Q ‘), at four representative α are summarised in Table 2. From the table, it is clear that the decay rate is the greatest when the aerofoil is set at high loading condition (i.e., α = 12°), while it is relatively mild at the pre-stall region at α = 6°. The ΔCL is the least sensitive to the Q ‘ at the mild negative geometrical angle of attack (α = –5°), before picking up the d(ΔCL)/d(Q ‘) again at large negative geometrical angle of attack (α = –15°). As a summary of the hybrid device to the CL generation, the effective blow rate only spans across a very narrow margin of Q ‘. Exceeding this margin will easily negate the effectiveness of the serration-only configuration. Another observation for the use of hybrid device is that it creates the largest response in the CL generation when the aerofoil is at high loading condition, which is applicable to both the nose up and nose down configurations.
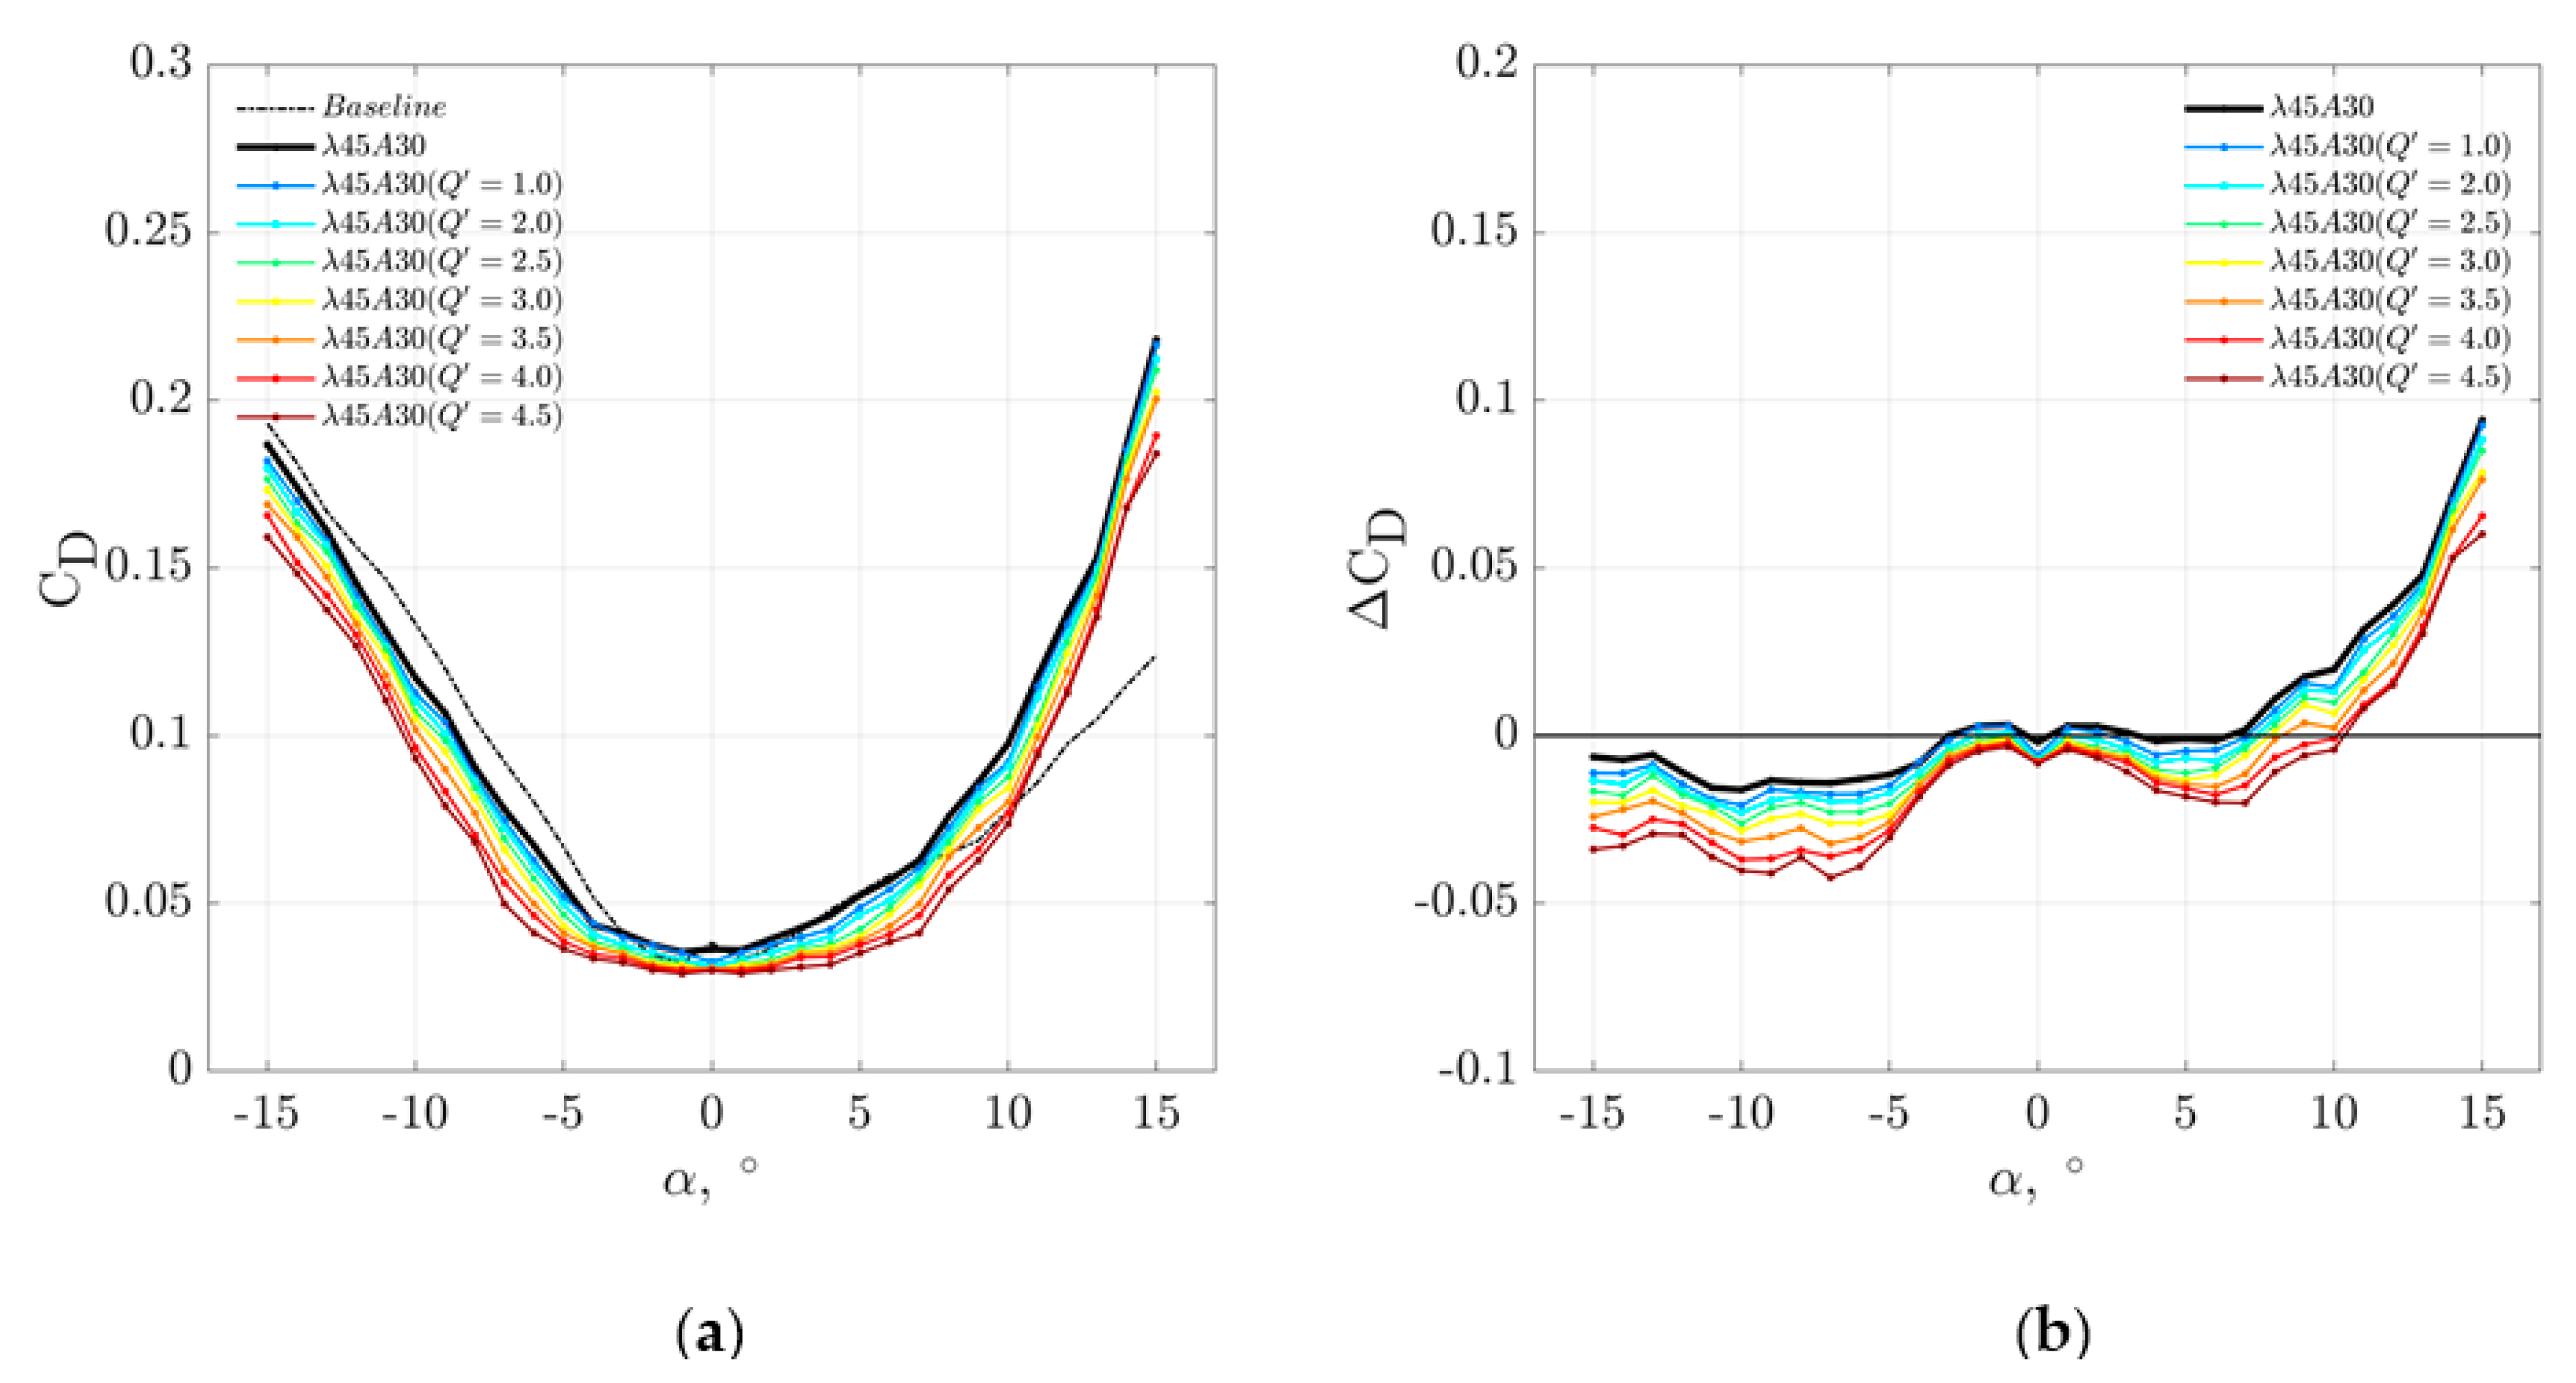
Interestingly, the hybrid device produces a more versatile performance in the drag coefficient CD. Figure 13a,b show the CD and ΔCD against the angles of attack α produced by the baseline, serration-only (λ45A30) and hybrid (λ45A30 + Q ‘ = 1.0–4.5 L/min) leading edge device at U = 25 ms−1, respectively. The ΔCD is defined in a same manner as the ΔCL. Unlike the ΔCL counterpart whose performance is underpinned by an optimal level, the hybrid device consistently shows an improvement of the ΔCD as soon as the Q ‘ is applied. The distributions of ΔCD in Figure 13b clearly show that improvement over the serration-only can be enhanced by increasing the level of Q ‘, especially at |α| ≥ 5°. A simple explanation of the lower CD as Q ‘ increases, which is applied from the serrated leading edge against the inflow direction, is due to the counteracting force provided by the blowing jet in an anti-main flow direction. The implication of the results in Figure 13b is significant in that the use of leading edge blowing can help to reduce the extra parasite drag normally associated with a leading edge serration.
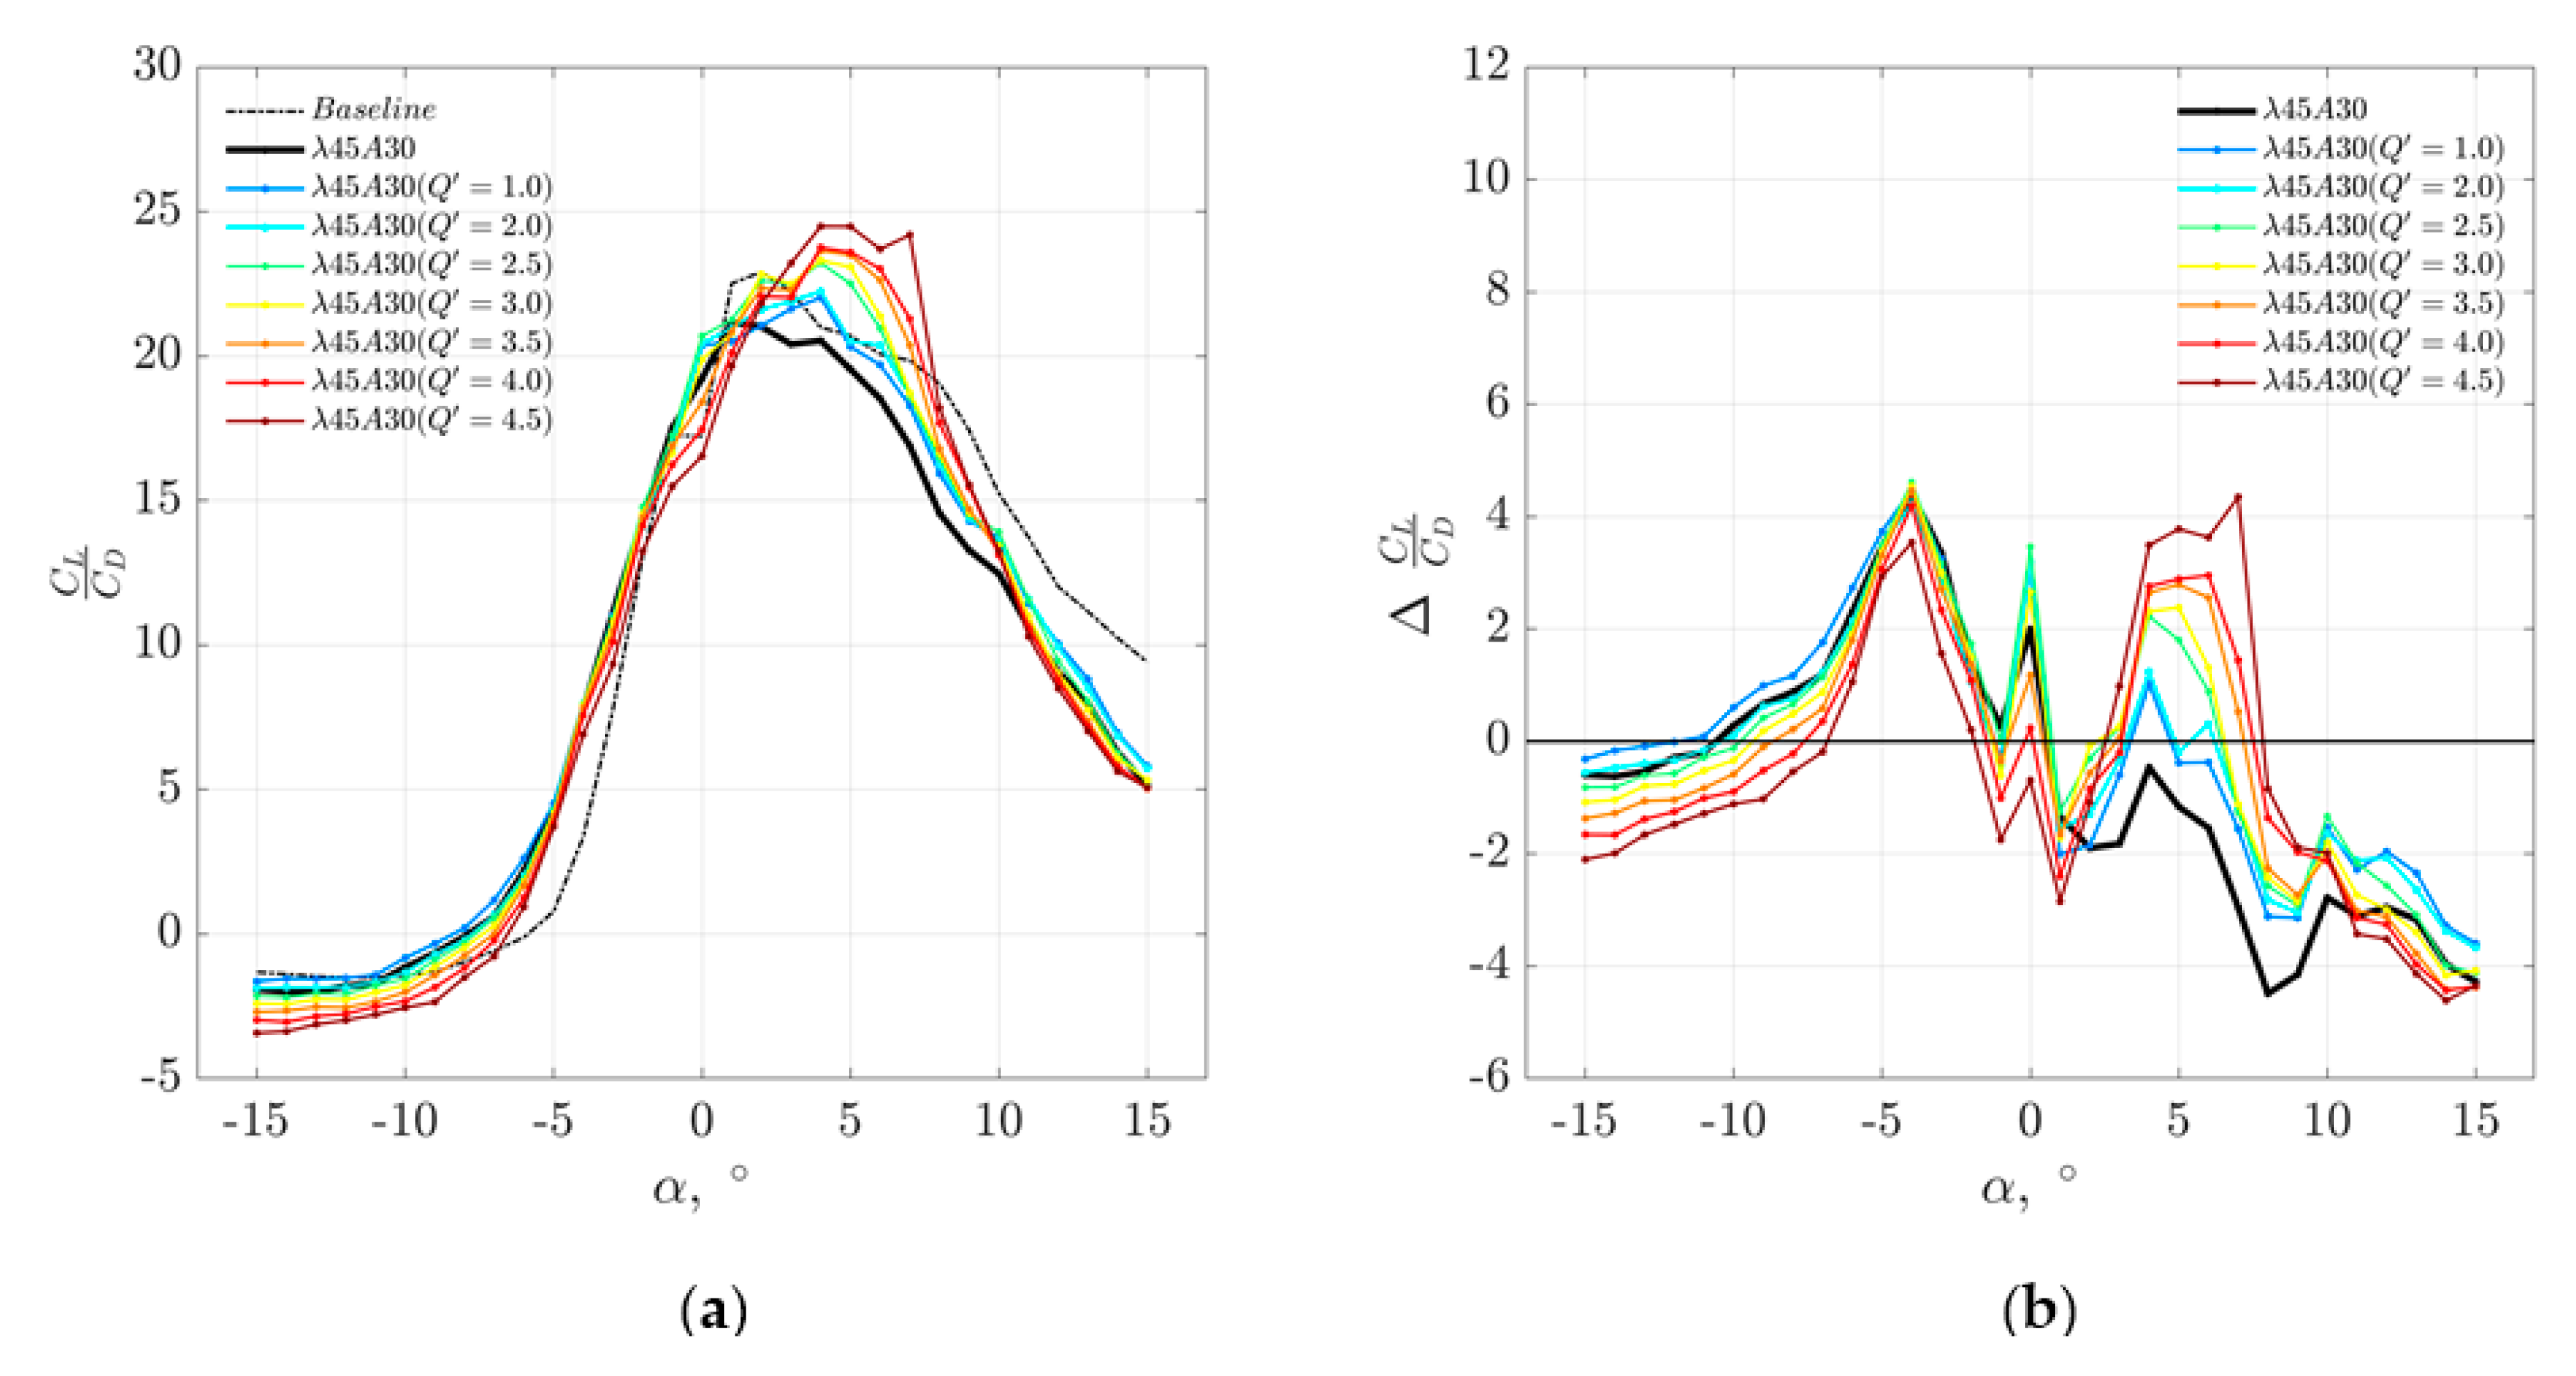
Because of the different responses of CL and CD against the Q ‘, it would be of interest to examine the ratio between them. Defining ΔCL/CD (α) = CL/CD treated(α) − CL/CD baseline(α), Figure 14a,b show the CL/CD and ΔCL/CD against the angles of attack α produced by the baseline, serration-only (λ45A30) and hybrid (λ45A30 + Q ‘ = 1.0–4.5 L/min) leading edge device at U = 25 ms−1, respectively. The most significant results lie in the region of 3° ≤ α ≤ 8°, where the serration-only case would have performed poorly. The hybrid device is no doubt a better choice than the serration-only case. More importantly, it can even outperform the baseline aerofoil as soon as the Q ‘ is introduced. The improvement increases as the Q ‘ increases. At α ≥ 10°, although not as good as the baseline aerofoil, the hybrid device still outperforms the serration-only aerofoil when a finite range of optimal Q ‘ is utilised. The impact of adding leading edge blowing to the serration at negative angle of attack, however, is less beneficial.
5. Conclusions
According to classical theory on aerofoil noise [1], injection of mass flow from the leading edge (against the incoming flow) can potentially be an effective mechanism to reduce the turbulence intensity, hence the level of turbulence–leading edge interaction noise radiation can also be reduced. The leading edge blowing may also displace the stagnation point, subsequently lessen the level of impingement between the incoming turbulent eddies and the leading edge. After the injection of air from the leading edge orifices and mixed with the incoming flow, the mass flow can be entrained back and propagated as streamwise vortices in the downstream direction along the aerofoil surface. These streamwise vortices generated indirectly as a result of the leading edge blowing could also be effective in the suppression of boundary layer separation. On the other hand, leading edge serration is now a well-established effective passive control device for the reduction of turbulence–leading edge interaction noise and mitigation of the boundary layer separation. It is envisaged that leading edge blowing, an active flow control approach, could produce the same mechanisms as those produced by a serrated leading edge.
NACA 65(12)-10 is chosen as the baseline aerofoil in this experimental study. Four types of serrated leading edge in different combinations of serration wavelength λ and amplitude A, as well as straight leading edge with different spanwise orifice spacing λ’ and blow rate Q ‘ were investigated. From the results, there exists an explicit relationship between the A and Q ‘, as well as the λ and λ’ for the aerodynamic lift and drag coefficients produced across a wide range of angle of attack. In terms of the aeroacoustics performance, it can also be concluded that there exists a correlation between the A and Q ‘ for the turbulent–leading edge interaction broadband noise reduction. Unlike the serration counterpart, the effectiveness of the leading edge noise reduction by blowing is found to be very sensitive to the choice of Q ‘, and to some extents, the λ’. Although more investigations are still needed, particularly on the flow mechanisms, the current paper contributes in a positive outcome for a proof-of-concept where the serration effect on aerofoil can be mimicked by the leading edge blowing.
A new concept is investigated for the addition of the leading edge blowing to enhance the serration effect. The rationale is based on the hypothesis that when the air orifices are placed strategically across a serrated leading edge, the exit air jets can further reduce the level of turbulence interaction. This hybrid device can indeed cultivate further level of noise reduction at low to medium frequency. In the context of the overall Sound Power Level performance, the most optimal Q ‘ that achieves the largest level of reduction (~2.5 dB more than the serration-only case) is to apply an exit jet velocity of between 10 and 13% of the main inflow velocity. However, the preliminary indication is that such criterion is only valid between the low and medium inflow velocity range (less than 45 ms−1). In terms of the lift coefficients, the effectiveness of the Q ‘ spans across a narrow margin. Exceeding this margin can negate the effectiveness of the serration-only configuration. The hybrid device is the most effective at the high loading condition to increase further both the stall angle and maximum lift coefficient compared to the serration-only case. Unlike the lift coefficients whose performance is underpinned by an optimal level of the Q ‘, the hybrid device demonstrates a more versatile performance in the drag coefficient. The results show that as the Q ‘ increases, the drag coefficient reduces. This leads to an encouraging outlook for the lift-to-drag ratio. The most significant results lie in the pre-stall angles of attack with industrial relevance (i.e., between three and eight degree), where the hybrid device can easily maneuver from the otherwise negative outlook in the serration-only case to even outperform the baseline aerofoil. At the stall and post-stall angles of attack (i.e., equal and larger than ten degree), although not as good as the baseline aerofoil, the hybrid device is still more beneficial than the serration-only case at some optimal values of Q ‘.
In conclusion, the results presented in this paper represent the first step towards a novel device that can realistically harvest a joint-benefit in the aeroacoustics and aerodynamic performances for aerofoil. Further investigations are encouraged to understand the flow dynamics, characterise in detail the induced flow modifications and identify different mechanisms responsible for the global results on the aeroacoustics and aerodynamics.
Author Contributions
Conceptualization: T.P.C. and Y.A.-O.; Methodology: Y.A.-O., T.P.C., and O.S.; Data acquisition and Analysis: Y.A.-O.; Interpretation and Writing: T.P.C., Y.A.-O., and O.S. All authors have read and agreed to the published version of the manuscript.
Funding
This research was funded by the UK Engineering and Physical Sciences Research Council research grant (Grant No. EP/N018737/1) “Quiet Aerofoils of the Next-Generation”.
Institutional Review Board Statement
Not applicable.
Informed Consent Statement
Not applicable.
Data Availability Statement
The data presented in this study are available on request from the corresponding author.
Acknowledgments
The authors would like to thank Till Biedermann from the Düsseldorf University of Applied Sciences, Germany, for contributing some data in this paper. The third author would like to thank the Israel Science Foundation (Grant No. 207162) for the funding of her time to be spent in this project.
Conflicts of Interest
The authors declare no conflict of interest.
References
- Amiet, R.K. Acoustic Radiation from an Airfoil in a Turbulent Stream. J. Sound. Vib. 1975, 41, 407–420. [Google Scholar] [CrossRef]
- Clair, V.; Polacsek, C.; Le Garrec, T.; Reboul, G.; Gruber, M.; Joseph, P.F. Experimental and Numerical Investigation of Turbulence-Airfoil Noise Reduction Using Wavy Edges. AIAA J. 2013, 51, 2695–2713. [Google Scholar] [CrossRef] [Green Version]
- Narayanan, S.; Chaitanya, P.; Haeri, S.; Joseph, P.F.; Kim, J.W.; Polacsek, C. Airfoil Noise Reductions through Leading Edge Serrations. Phys. Fluids. 2015, 27, 025109. [Google Scholar] [CrossRef]
- Kim, J.W.; Haeri, S. An Advanced Synthetic Eddy Method for the Computation of Aerofoil–Turbulence Interaction Noise. J. Comput. Phys. 2015, 287, 1–17. [Google Scholar] [CrossRef] [Green Version]
- Kim, J.W.; Haeri, S.; Joseph, P.F. On the Reduction of Aerofoil–Turbulence Interaction Noise Associated with Wavy Leading Edges. J. Fluid Mech. 2016, 792, 526–552. [Google Scholar] [CrossRef] [Green Version]
- Turner, J.; Kim, J.W. Towards Understanding Aerofoils with Wavy Leading Edges Interacting with Vortical Disturbances. In Proceedings of the 22nd AIAA/CEAS Aeroacoustics Conference, Lyon, France, 30 May–1 June 2016. AIAA Paper 2016–2952. [Google Scholar]
- Fish, F.; Battle, J. Hydrodynamic Design of the Humpback Whale Flipper. J. Morphol. 1995, 225, 51–60. [Google Scholar] [CrossRef]
- Johari, H.; Henoch, C.; Custodio, D.; Levishin, A. Effect of Leading Edge Protuberances on Airfoil Performance. AIAA J. 2007, 45, 2634–2642. [Google Scholar] [CrossRef]
- Miklosovic, D.S.; Murray, M.M.; Howle, L.E.; Fish, F.E. Leading Edge Tubercles Delay Stall on a Humpback Whale (Megaptera Novaeanglias) Flipper. Phys. Fluids. 2004, 16, L39. [Google Scholar] [CrossRef] [Green Version]
- Hansen, K.L.; Kelso, R.M.; Dally, B.B. Performance Variations of Leading Edge Tubercles for Distinct Airfoil Profiles. AIAA J. 2011, 49, 185–194. [Google Scholar] [CrossRef]
- Skillen, A.; Revell, A.; Pinelli, A.; Piomelli, U.; Favier, J. Flow over a Wing with Leading-Edge Undulations. AIAA J. 2015, 53, 464–472. [Google Scholar] [CrossRef]
- Hansen, K.L.; Rostamzadeh, N.; Kelso, R.M.; Dally, B.B. Evolution of Streamwise Vortices Generated between Leading Edge Tubercles. J. Fluid Mech. 2016, 788, 730–766. [Google Scholar] [CrossRef]
- Vathylakis, A.; Kim, J.H.; Chong, T.P. Design of a Low-Noise Aeroacosutic Wind Tunnel Facility at Brunel University. In Proceedings of the 20th AIAA/CEAS Aeroacoustics Conference, Atlanta, GA, USA, 16–20 June 2014; pp. 2014–3288. [Google Scholar]
- Biedermann, T.M.; Chong, T.P.; Kameier, F.; Paschereit, C.O. Statistical-Empirical Modelling of Airfoil Noise Subjected to Leading Edge Serrations. AIAA J. 2017, 55, 3128–3142. [Google Scholar] [CrossRef]
- Chong, T.P.; Biedermann, T.; Koster, O.; Hasheminejad, S.M. On the Effect of Leading Edge Serrations on Aerofoil Noise Production. In Proceedings of the 24th AIAA/CEAS Aeroacoustics Conference, Atlanta, GA, USA, 25–29 June 2018; pp. 2018–3289. [Google Scholar]
Figure 1.
(a) Typical set up for the aerofoil noise experiments at the Brunel aeroacoustics wind tunnel for the turbulence–leading edge interaction noise; (b) load cell system used for the lift/drag measurements in a closed-section aerodynamic wind tunnel.
Figure 1.
(a) Typical set up for the aerofoil noise experiments at the Brunel aeroacoustics wind tunnel for the turbulence–leading edge interaction noise; (b) load cell system used for the lift/drag measurements in a closed-section aerodynamic wind tunnel.

Figure 2.
(a) Placement of the turbulence bi-planar grid inside the nozzle of the aeroacoustics wind tunnel; (b) comparison of the normalized turbulent energy spectra between the experimental results and the von-Kármán model for the longitudinal velocity fluctuations. The streamwise location of the measurement corresponds to the leading edge of the aerofoil (30 mm from the nozzle exit), but without the presence of the aerofoil.

Figure 3.
(a) Isometric drawing of the NACA 65(12)-10 aerofoil model with serrated leading edge; (b) comparison between a serrated aerofoil and baseline aerofoil.
Figure 3.
(a) Isometric drawing of the NACA 65(12)-10 aerofoil model with serrated leading edge; (b) comparison between a serrated aerofoil and baseline aerofoil.

Figure 4.
(a) Isometric drawing of the NACA 65(12)-10 aerofoil model with blowing leading edge; (b) streamwise development of the velocity profiles produced by the leading edge blowing under the configuration of λ’ = 5 mm, Q = 208 L/min, and quiescent condition.
Figure 4.
(a) Isometric drawing of the NACA 65(12)-10 aerofoil model with blowing leading edge; (b) streamwise development of the velocity profiles produced by the leading edge blowing under the configuration of λ’ = 5 mm, Q = 208 L/min, and quiescent condition.

Figure 5.
Comparison of the lift coefficient CL and ΔCL as a function of angle of attack α produced by serrated and blowing leading edges at U = 24 ms−1.
Figure 5.
Comparison of the lift coefficient CL and ΔCL as a function of angle of attack α produced by serrated and blowing leading edges at U = 24 ms−1.

Figure 6.
Comparison of the drag coefficient CD and ΔCD as a function of angle of attack α produced by serrated and blowing leading edges at U = 24 ms−1.
Figure 6.
Comparison of the drag coefficient CD and ΔCD as a function of angle of attack α produced by serrated and blowing leading edges at U = 24 ms−1.

Figure 7.
Comparison of (a) SPL and (b) ΔSPL as a function of normalized frequency f ‘ produced by the baseline and serrated leading edges at U = 25 ms−1 and α = 0°.
Figure 7.
Comparison of (a) SPL and (b) ΔSPL as a function of normalized frequency f ‘ produced by the baseline and serrated leading edges at U = 25 ms−1 and α = 0°.

Figure 8.
Comparison of ΔSPL as a function of f ‘ and U at α = 0° produced by the serrated leading edges (a) λ5A15; (b) λ10A15; (c) λ5A30; and (d) λ10A30.
Figure 8.
Comparison of ΔSPL as a function of f ‘ and U at α = 0° produced by the serrated leading edges (a) λ5A15; (b) λ10A15; (c) λ5A30; and (d) λ10A30.

Figure 9.
Comparison of (a) SPL as a function of normalized frequency f ‘ produced by the serrated leading edges (blueish solid lines: λ10A15 and λ10A30) and the blowing leading edges (reddish broken lines: λ’10Q ‘6.14, λ’10Q ‘6.22, λ’10Q ‘6.32 and λ’10Q ‘6.41) at U = 45 ms−1 and α = 0°. Take note of the matching λ and λ ‘ between the serrated and blowing leading edges; (b) the corresponding for the serration (Equation 5) and blowing (Equation 6) leading edges.

Figure 10.
Isometric drawing of the hybrid device featuring a serrated leading edge with orifices at the serration troughs and tips for leading edge blowing. Note that the sketching of the exit air jets is not to scale, is for illustration only and may not represent the real flow behaviors.
Figure 10.
Isometric drawing of the hybrid device featuring a serrated leading edge with orifices at the serration troughs and tips for leading edge blowing. Note that the sketching of the exit air jets is not to scale, is for illustration only and may not represent the real flow behaviors.

Figure 11.
(a) Comparison of ΔPWL as a function of normalized frequency f ‘ produced by the baseline and either the serration-only (λ45A30) and hybrid leading edge device (λ45A30 + blowing Q ‘) at U = 40 ms−1 and α = 0°. The leading edge blowing range covers 0.5 ≤ Q ‘ ≤ 4.50 L/min, and (b) contour map of ΔOAPWL produced by the difference in OAPWL between the serration-only (λ45A30) and hybrid (λ45A30 + Q ‘), as a function of Q ‘ and U at α = 0°.

Figure 12.
Comparison of the (a) CL as a function of α produced by the baseline and hybrid (λ45A30 + blowing Q ‘) leading edge device at U = 25 ms−1. The leading edge blowing range covers 0.0 (serration only) ≤ Q ‘ ≤ 4.5 L/min, and (b) The corresponding ΔCL as a function of α, where ΔCL is the difference in CL between the hybrid (λ45A30 + Q ‘ = 0.0–4.50 L/min) and the baseline.

Figure 13.
Comparison of the (a) CD as a function of α produced by the baseline and hybrid (λ45A30 + blowing Q ‘) leading edge device at U = 25 ms−1. The leading edge blowing range covers 0.0 (serration only) ≤ Q ‘ ≤ 4.5 L/min, and (b) The corresponding ΔCD as a function of α, where ΔCD is the difference in CD between the hybrid (λ45A30 + Q ‘ = 0.0–4.50 L/min) and the baseline.

Figure 14.
Comparison of the (a) CL/CD as a function of α produced by the baseline and hybrid (λ45A30 + blowing Q ‘) leading edge device at U = 25 ms−1. The leading edge blowing range covers 0.0 (serration only) ≤ Q ‘ ≤ 4.5 L/min, and (b) The corresponding ΔCL/CD as a function of α, where ΔCL/CD is the difference in CL/CD between the hybrid (λ45A30 + Q ‘ = 0.0–4.50 L/min) and the baseline.


Table 1.
Geometrical parameters of the leading edge serrations.
| A (mm) | λ (mm) | A/C | λ/C | A/λ | |
|---|---|---|---|---|---|
| Baseline | - | - | - | - | - |
| λ5A15 | 15 | 5 | 0.1 | 0.033 | 3 |
| λ5A30 | 30 | 5 | 0.2 | 0.033 | 6 |
| λ10A15 | 15 | 10 | 0.1 | 0.067 | 1.5 |
| λ10A30 | 30 | 10 | 0.2 | 0.067 | 3 |
Table 2.
Summary of the decay rates of ΔCL against the Q ‘ at four representative α.
| α (o) | d(ΔCL)/d(Q ‘) |
|---|---|
| −15 | −0.072 |
| −5 | −0.029 |
| 6 | −0.045 |
| 12 | −0.120 |
Publisher’s Note: MDPI stays neutral with regard to jurisdictional claims in published maps and institutional affiliations. |
© 2021 by the authors. Licensee MDPI, Basel, Switzerland. This article is an open access article distributed under the terms and conditions of the Creative Commons Attribution (CC BY) license (http://creativecommons.org/licenses/by/4.0/).
Share and Cite
MDPI and ACS Style
Al-Okbi, Y.; Chong, T.P.; Stalnov, O. Leading Edge Blowing to Mimic and Enhance the Serration Effects for Aerofoil. Appl. Sci. 2021, 11, 2593. https://0-doi-org.brum.beds.ac.uk/10.3390/app11062593
AMA Style
Al-Okbi Y, Chong TP, Stalnov O. Leading Edge Blowing to Mimic and Enhance the Serration Effects for Aerofoil. Applied Sciences. 2021; 11(6):2593. https://0-doi-org.brum.beds.ac.uk/10.3390/app11062593
Chicago/Turabian StyleAl-Okbi, Yasir, Tze Pei Chong, and Oksana Stalnov. 2021. "Leading Edge Blowing to Mimic and Enhance the Serration Effects for Aerofoil" Applied Sciences 11, no. 6: 2593. https://0-doi-org.brum.beds.ac.uk/10.3390/app11062593
Note that from the first issue of 2016, this journal uses article numbers instead of page numbers. See further details here.