1. Introduction
In a recent press release, the European Space Agency (ESA) noted that the lockdown, due to the COVID-19 pandemic, significantly decreased air pollution in major quarantined European cities [
1]. Furthermore, daily global
emissions fell by 26% at the beginning of April 2020 compared to the mean 2019 levels [
2]. These data reflect changes in activities, electricity demand, and road and air traffic [
2]. As a consequence of significant air emissions associated with car traffic, in recent years, the automotive industry has made substantial progress towards sustainability [
3]. Cars equipped with electrified powertrains appear to have a key role in the transition towards zero
emissions and pollutants [
4,
5], such as particulate matters, nitrogen oxide (NOx), and sulfur dioxide. Furthermore, several authors have set 2020 as the turning point for the establishment of e-mobility in urban areas [
6,
7,
8,
9]. Recently, the powertrain electrification process of vehicles has extended to different categories, such as commercial and industrial trucks, generating new application domains, in addition to new opportunities for energetic and environmental benefits [
10,
11,
12,
13,
14].
Most of these commercial and industrial trucks are also equipped with hydraulic or pneumatic systems designed to perform specific operations through the motion of controllable vehicle components, for which the required power is generated and transferred by the internal combustion engine (ICE), involving a significant quantity of energy losses [
15]. In particular, for this kind of vehicle, the largest share of the power consumption is required by the hydraulic or pneumatic system during idling operations, and, consequently, many researchers have focused on energy saving strategies for these systems, rather than making the vehicle traction more efficient [
15,
16,
17].
A common energy saving strategy is represented by the control of the hydraulic equipment, and consists of a hydraulic pump, control valves, and actuators [
18]. The improvement of the pump control performance consists of controlling the speed of actuators to ensure the generation of the exact quantity of oil flow needed for the required motion of controllable vehicle components, reducing possible dispersed and laminated flows [
19]. For a fixed displacement pump, the oil flow is controlled by varying the rotation speed of the pump or, for a variable displacement pump, acting on the pump displacement. In 1992, Virvalo [
20] proposed innovative solutions in hydraulics and pneumatics, including distributed motion control. Zimmerman et al. [
21] discussed the energy consumption of a load-sensing excavator hydraulic system and possible energy savings by means of a numerical simulation. In addition, the energy efficiency can be improved by means of advanced control algorithms, including genetic algorithms [
22,
23] and fuzzy logic [
24] controllers. Quan et al. [
25] and Aly and Salem [
26] presented comprehensive reviews related to the power efficiency of electro-hydraulic systems.
Moreover, as evidenced in recent literature [
15,
27], another promising trend is represented by hybrid systems, in which the energy absorbed by the hydraulic pump is provided by a parallel energy source that can replace the conventional ICE. In [
15], the authors proposed an interesting improvement to a hybrid system, which, however, was initially made by an external company. To the best of the authors’ knowledge, no published study in the literature or technical reports provides insights into the practical realization of these kinds of hybrid systems for commercial and industrial trucks.
This work presents the preliminary realization of an electric-powered hydraulic pump system (e-HPS) that drives the lifting of the dumpster and the garbage compaction in a waste compactor truck. The proposed e-HPS electrically drives the hydraulic pump that equips the hydraulic system of the compactor truck, rather than the traditional ICE-driven hydraulic pump systems (ICE-HPSs) for similar applications.
In this study, the power consumption during the garbage collection cycle was first defined in the case of the ICE-HPS and later experimentally measured in the case of the proposed e-HPS. The different components of the e-HPS are described and the battery pack was modelled using the kinetic battery model (KiBaM), implemented in the Simulink MathWorks environment. The KiBaM was first used to estimate the state of charge (SOC) of the battery pack during the garbage collection cycle and later to evaluate the trend of the battery state of health (SOH) as a function of the number of charge/discharge cycles. The end-of-life of the battery pack was determined to determine the economic feasibility of the proposed e-HPS for the whole lifespan of the compactor truck.
The immediate advantage of the proposed e-HPS is that the hydraulic pump can be driven by the electric motor, at a high efficiency operating point [
28] and zero
emissions, without using the ICE. In addition to the expected fuel saving, switching off the ICE also offers the additional advantage to reduce acoustic emissions with respect to conventional compactor trucks, particularly for garbage collection in urban centers undertaken at night. The contribution of this study, with respect to the present literature [
15,
27], is to provide an implementation method to build an electrical e-HPS system and to analyze the economic feasibility of this technology compared to conventional ICE-HPS.
The aim of this paper is twofold: first, to provide a deep insight into the practical realization of the e-HPS for the retrofit of a conventional waste compactor truck, addressing the knowledge gap in the scientific literature and the lack of technical datasheets; and, second, to assess the economic feasibility of the proposed retrofit, and investigate the fuel consumption and reduction of emissions during its use phase. Finally, the insight from this study could be extended to a broader range of vehicles that use similar hydraulic systems, such as ICE forklifts and dump trucks, laying the foundations for more economic and greener logistic operations.
This paper is organized as follows. After a general description of the e-HPS,
Section 2 describes the garbage collection operations, the experimental measurements and battery simulation, and the vehicle consumption and carbon emissions.
Section 3 discusses the results of the electric power measurements, the KiBaM simulations, the estimations of both the battery’s end-of-life and the operating costs and emissions.
Section 4 and
Section 5 present the discussion and the conclusion, respectively.
2. Materials and Methods
The compactor truck vehicle examined in this study was the Ministarb-7 assembled by Fratelli Mazzocchia SPA company [
29], characterized by a body volume of 7 m
3 and an average garbage capacity of 5 tons. The garbage collection is performed by means of a hydraulic system that operates a tilting waste collector and a single-bladed plate compacting system.
In the traditional Ministarb-7, the hydraulic system is basically driven by the vehicle thermal engine, which can be categorized as an ICE-HPS. The prototype version of this vehicle, proposed in this paper, was developed by the authors in collaboration with the Italian companies OPV Solutions SRL and Fratelli Mazzocchia SPA. In the prototype truck model, the mechanical power required by the hydraulic system for the garbage collection operations is supplied by means of an electric power system, rather than a thermal engine, and can be categorized as e-HPS. Note that hereafter, the trucks equipped with the conventional and electrified systems will be referred to by the acronyms of ICE-HPS and e-HPS, respectively.
The garbage collection system consists of a hydraulic circuit that includes a reservoir for storing the hydraulic fluid, a pump for driving the fluid in the hydraulic circuit, and an actuator required to selectively receive the fluid from the pump and operate governable machine components. A detailed description of garbage collection operations and tasks is presented in
Section 2.2.
2.1. Electrified Power Unit Design
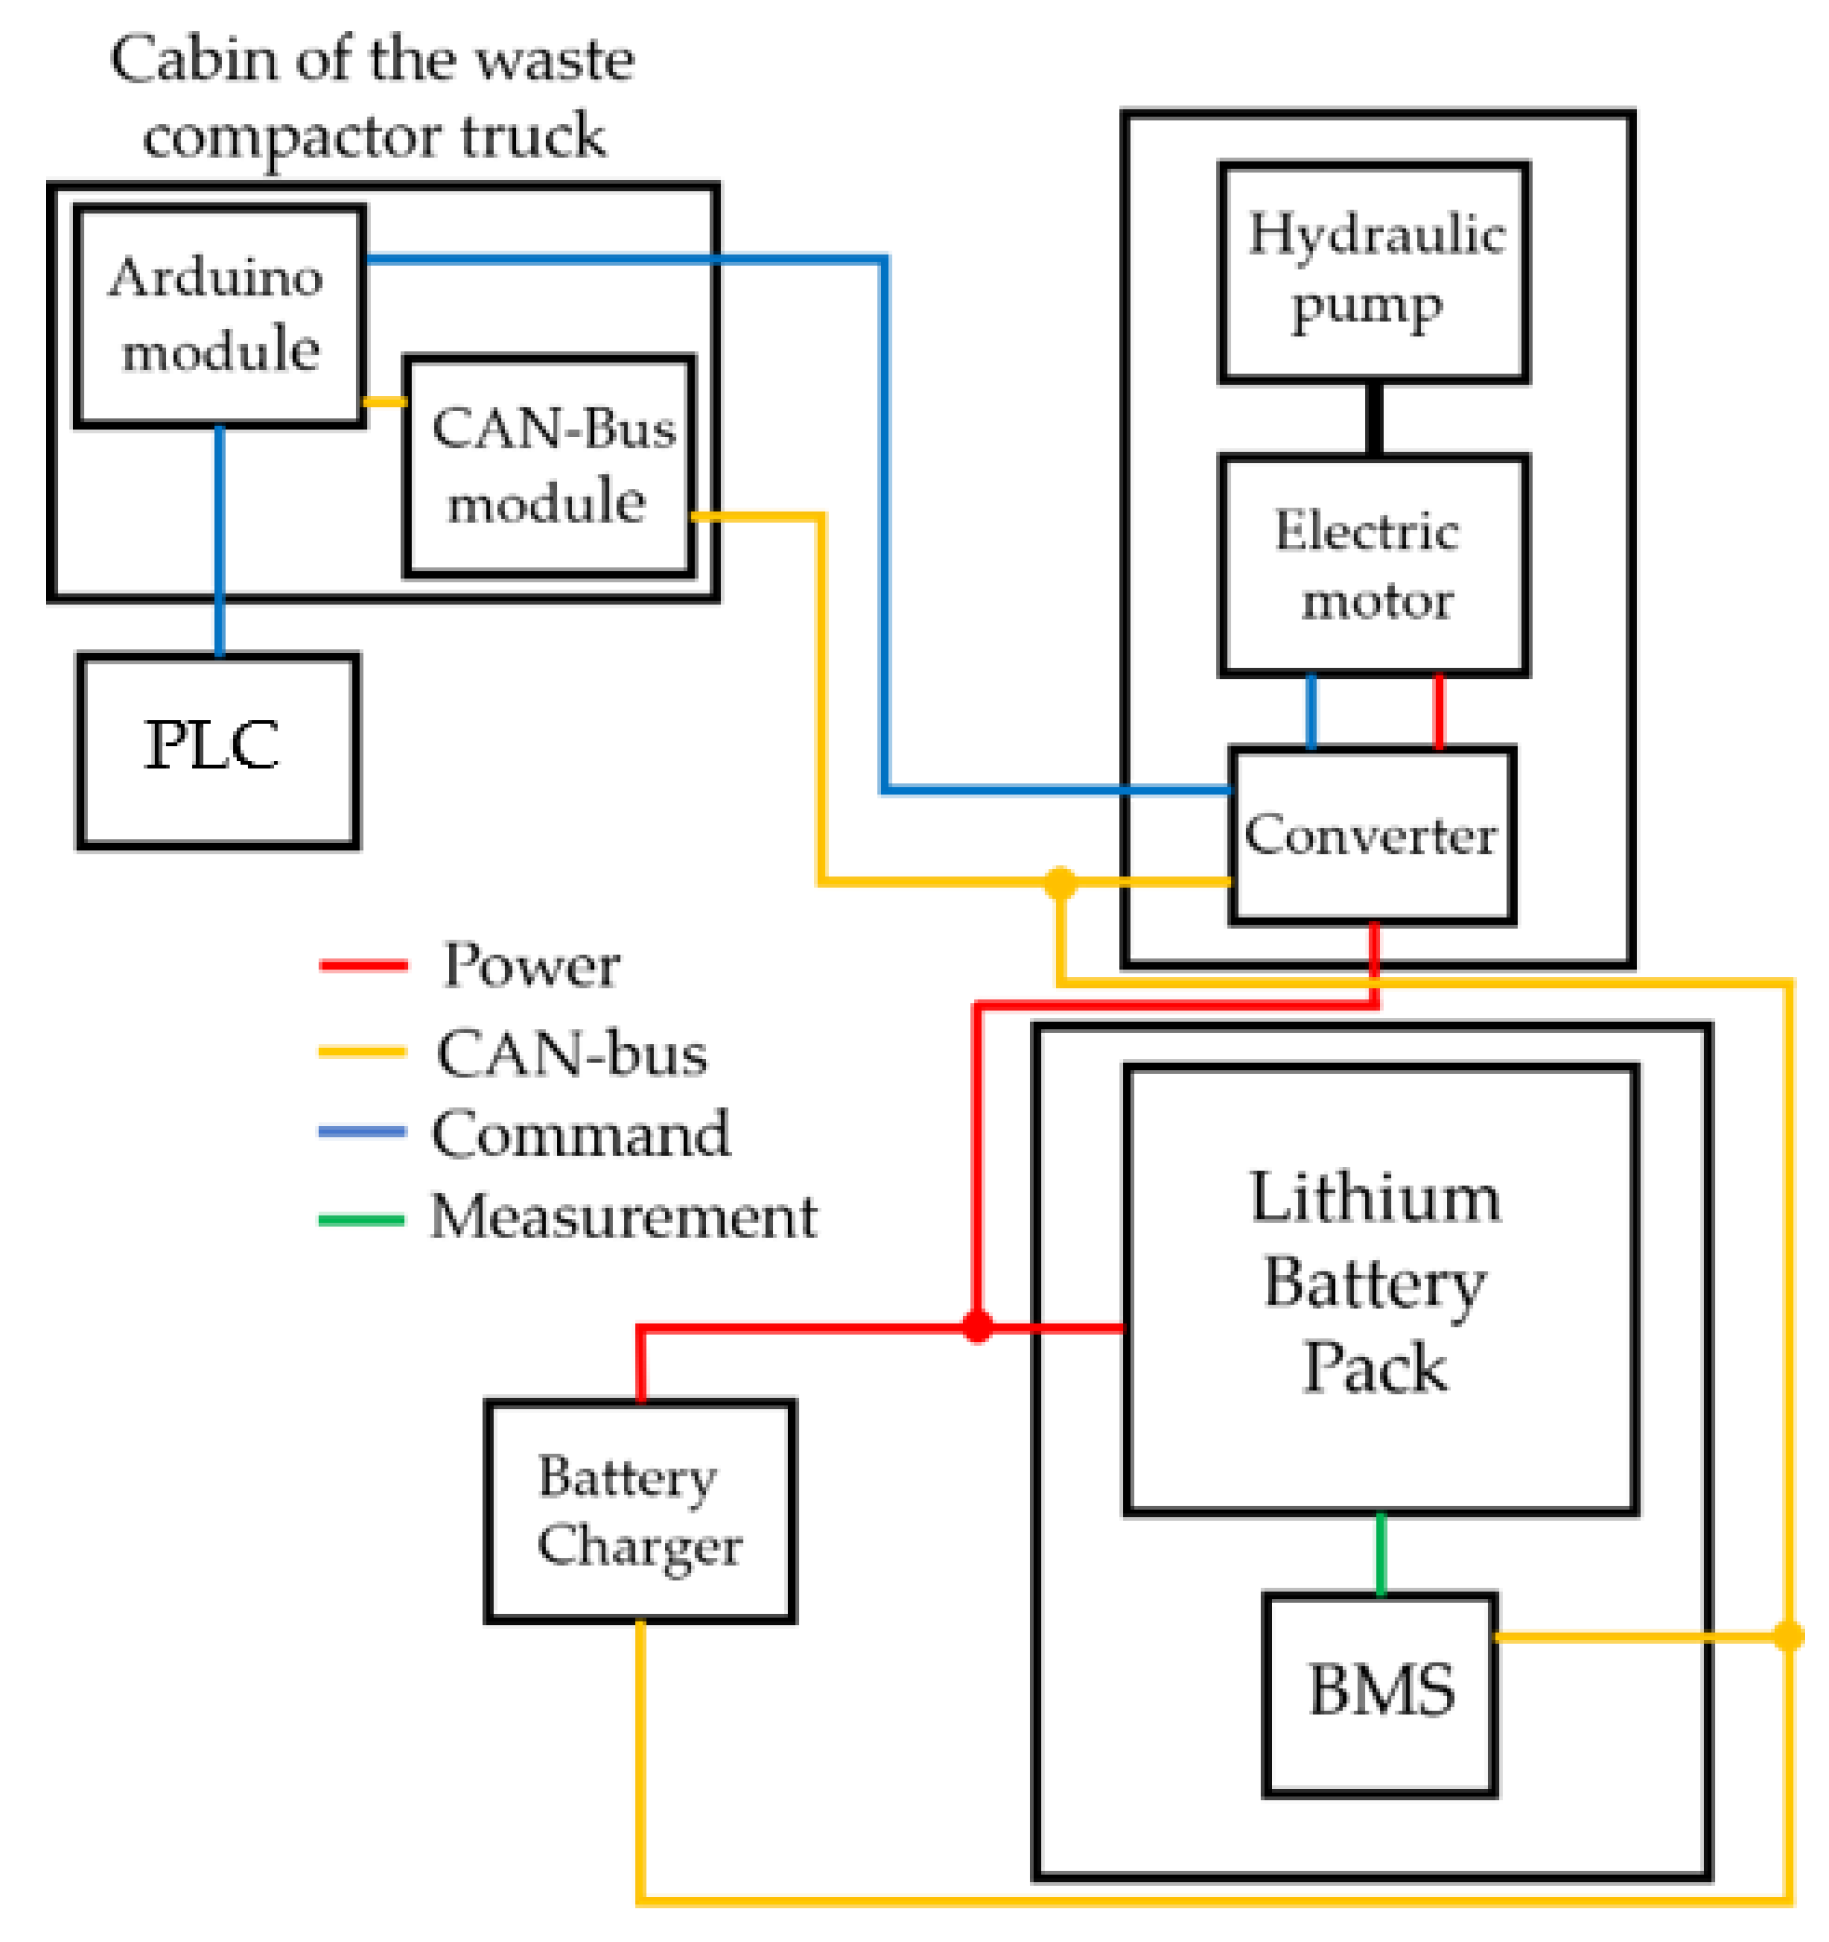
This section describes the electrified system for the movement of a dumpster for urban garbage collection and the related compaction. This e-HPS is a substitute for the ICE-HPS already present on this vehicle, and the structure was designed with the possibility of adapting it to different vehicle sizes; this specification makes it modular. The structure of the e-HPS can be divided into four subsystems, as shown in
Figure 1, which are:
2.1.1. Cabin-Control Unit
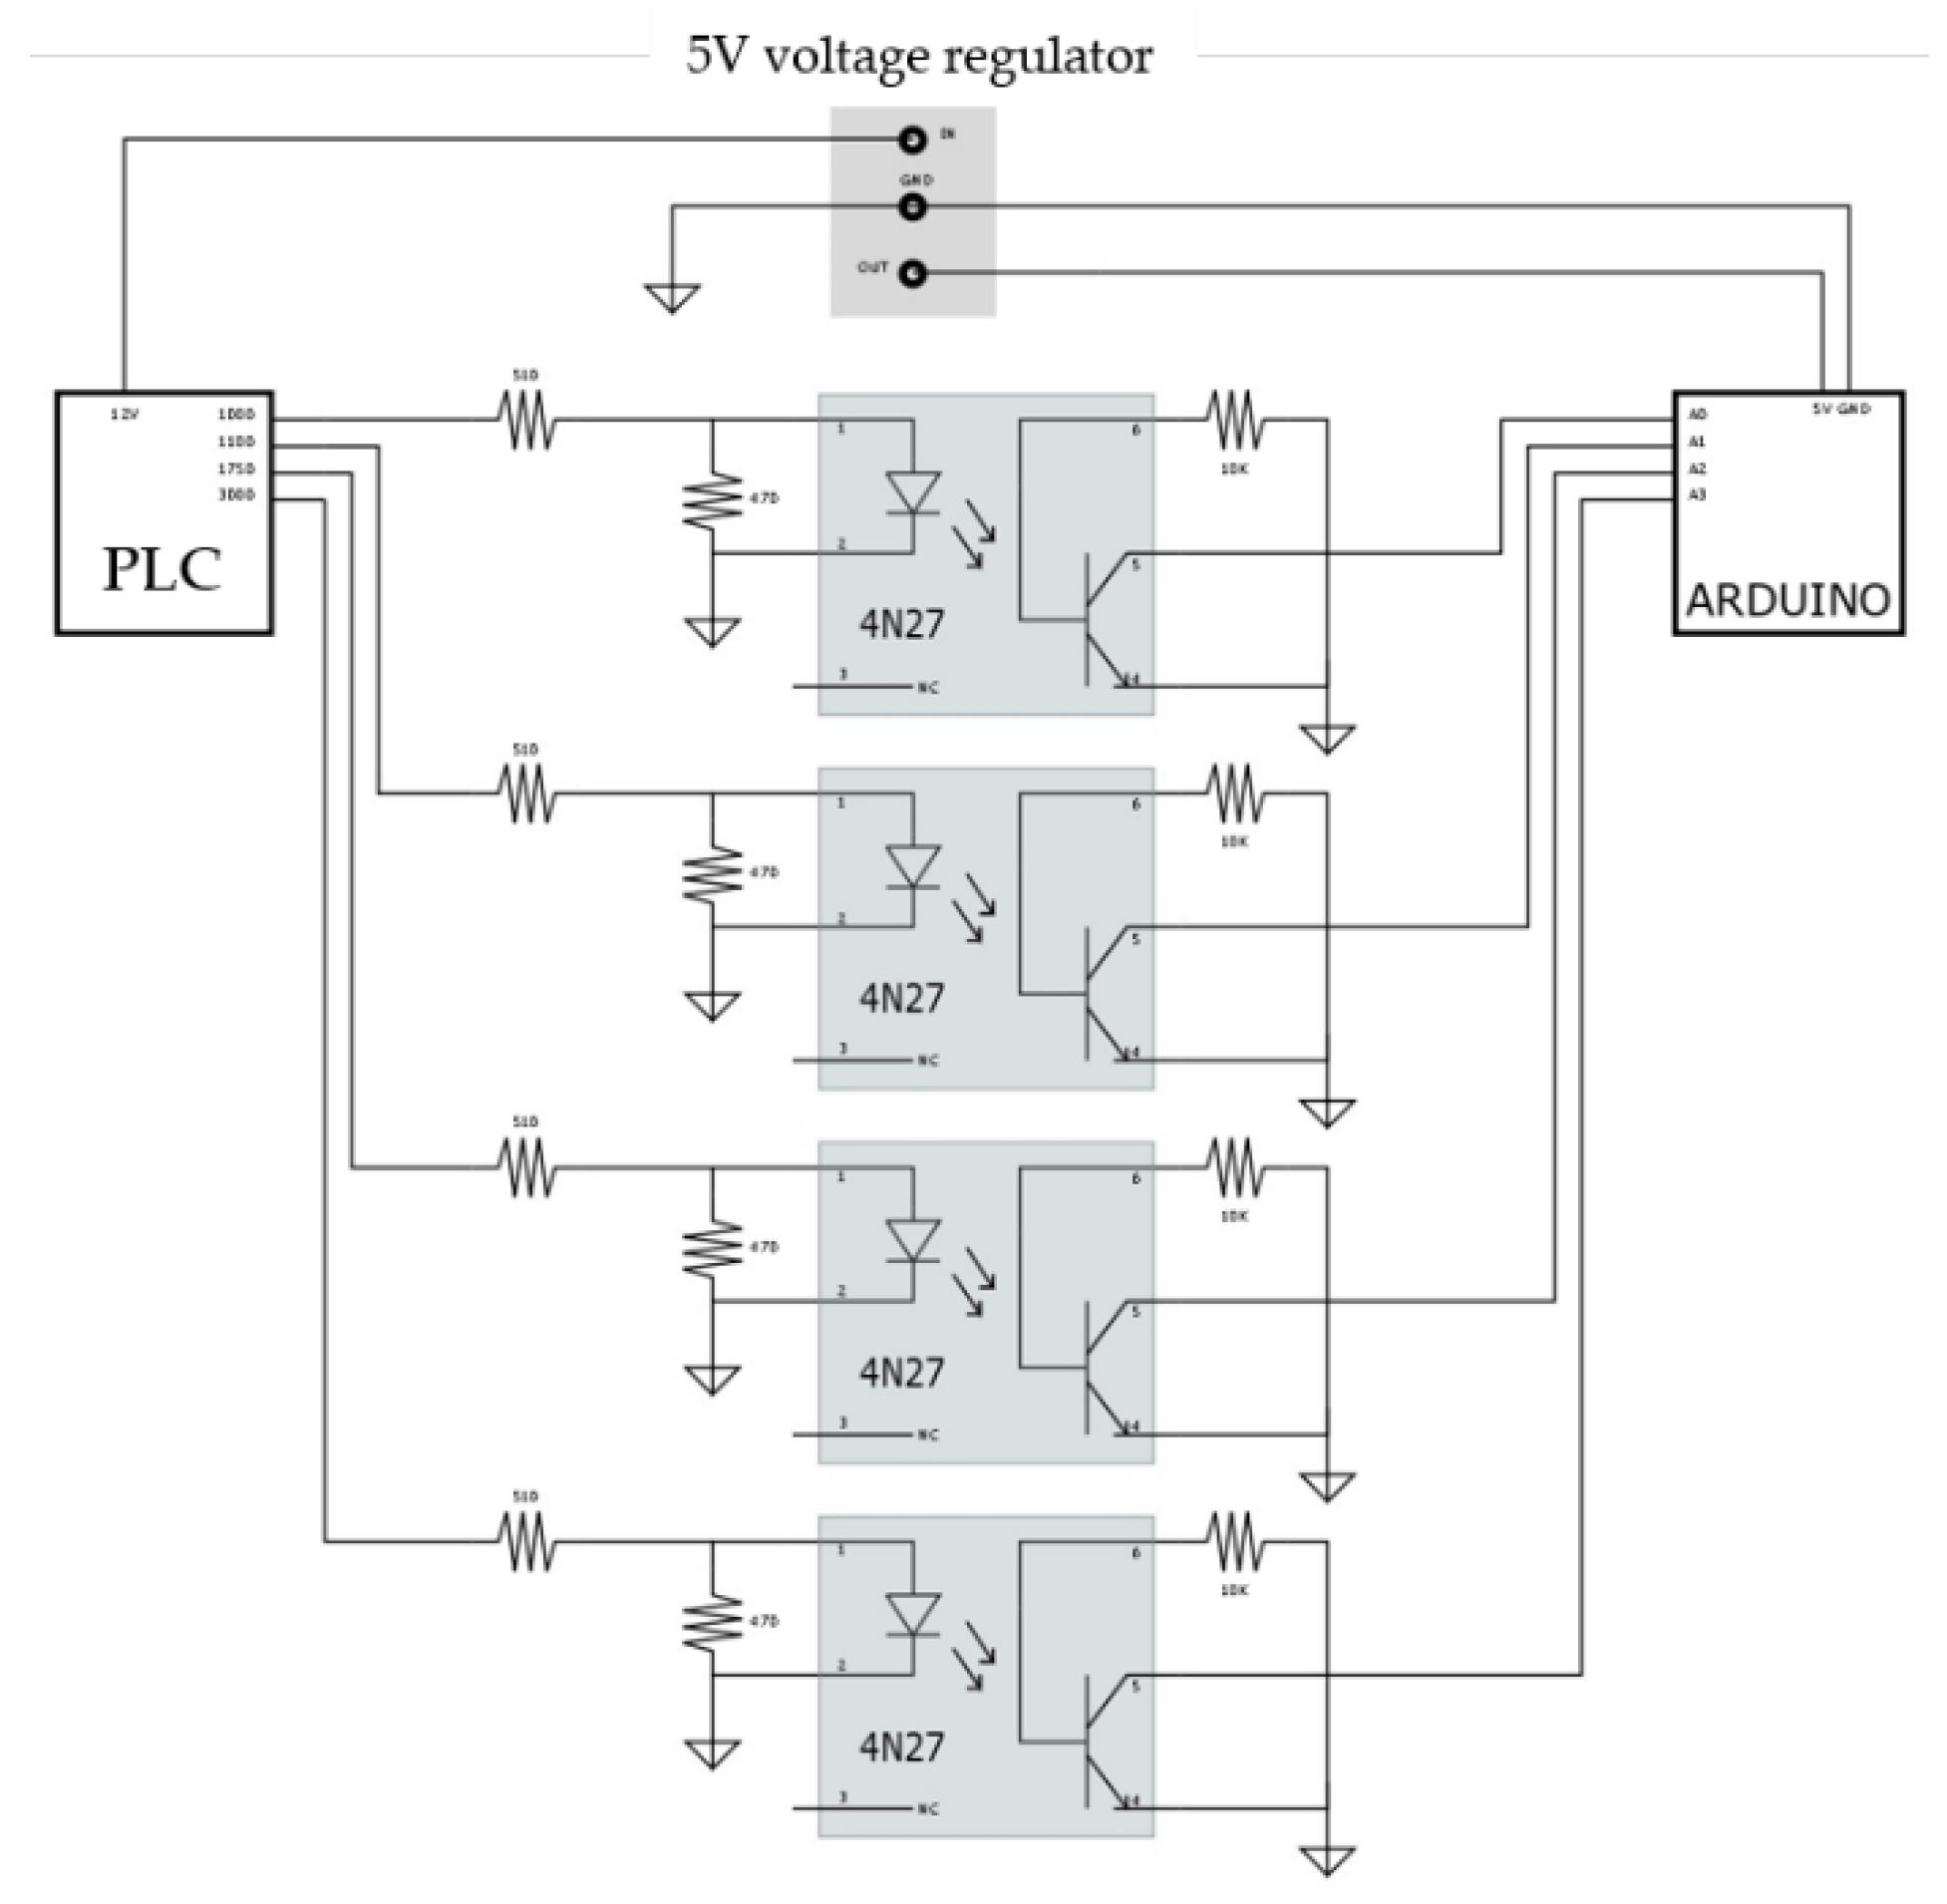
The brain of the system is located inside the cabin and characterized by the control unit, which is composed of a microcontroller and a Can-Bus module: the microcontroller used as control unit is the Arduino-nano board. The interface module (IM) is located between the Arduino and the programmable logic controller (PLC) blocks, and provides power to the Arduino and receives commands from the PLC. The IM consists of a thousand-hole-board with an interface circuit, welded on top, between the PLC and the Arduino-nano. It is made of a 5 V voltage regulator (R-78B05), which has the function of powering the Arduino-nano itself, and four photo couplers (4N27), as shown in
Figure 2.
The PLC sends the movement commands of the tank with pulses at 12 V; however, for the Arduino-nano, the maximum allowable voltage is 5 V; photo-couplers are then used to ensure that when the PLC sends a 12 V input value, the Arduino reads it as a 5 V value.
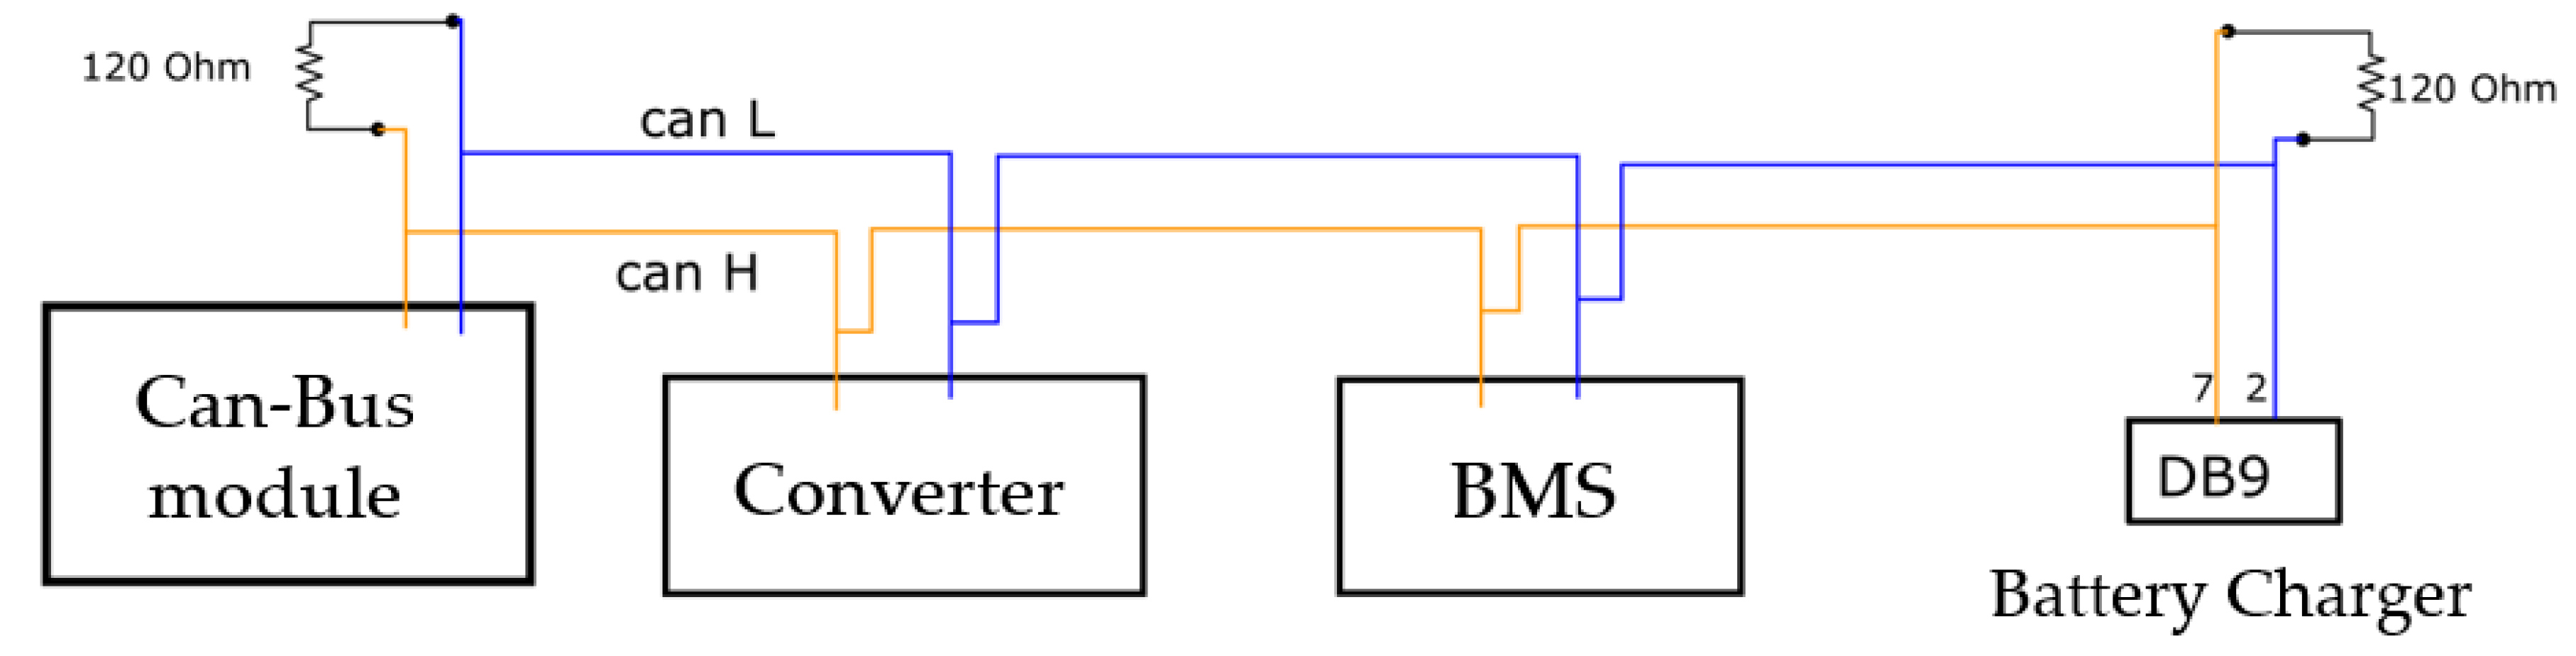
The Can-Bus module, which is visible in
Figure 1, has the function of reading/sending messages to the different devices of the electric system. The devices are connected sequentially with the starting point on the Can-Bus module (terminator connected through a jumper) and the ending point of the battery charger (terminator inserted in the DB9 connector of the wiring). The connections are made using a twisted pair of orange and blue wires (orange represents Can-High and blue Can-Low), as shown in
Figure 3.
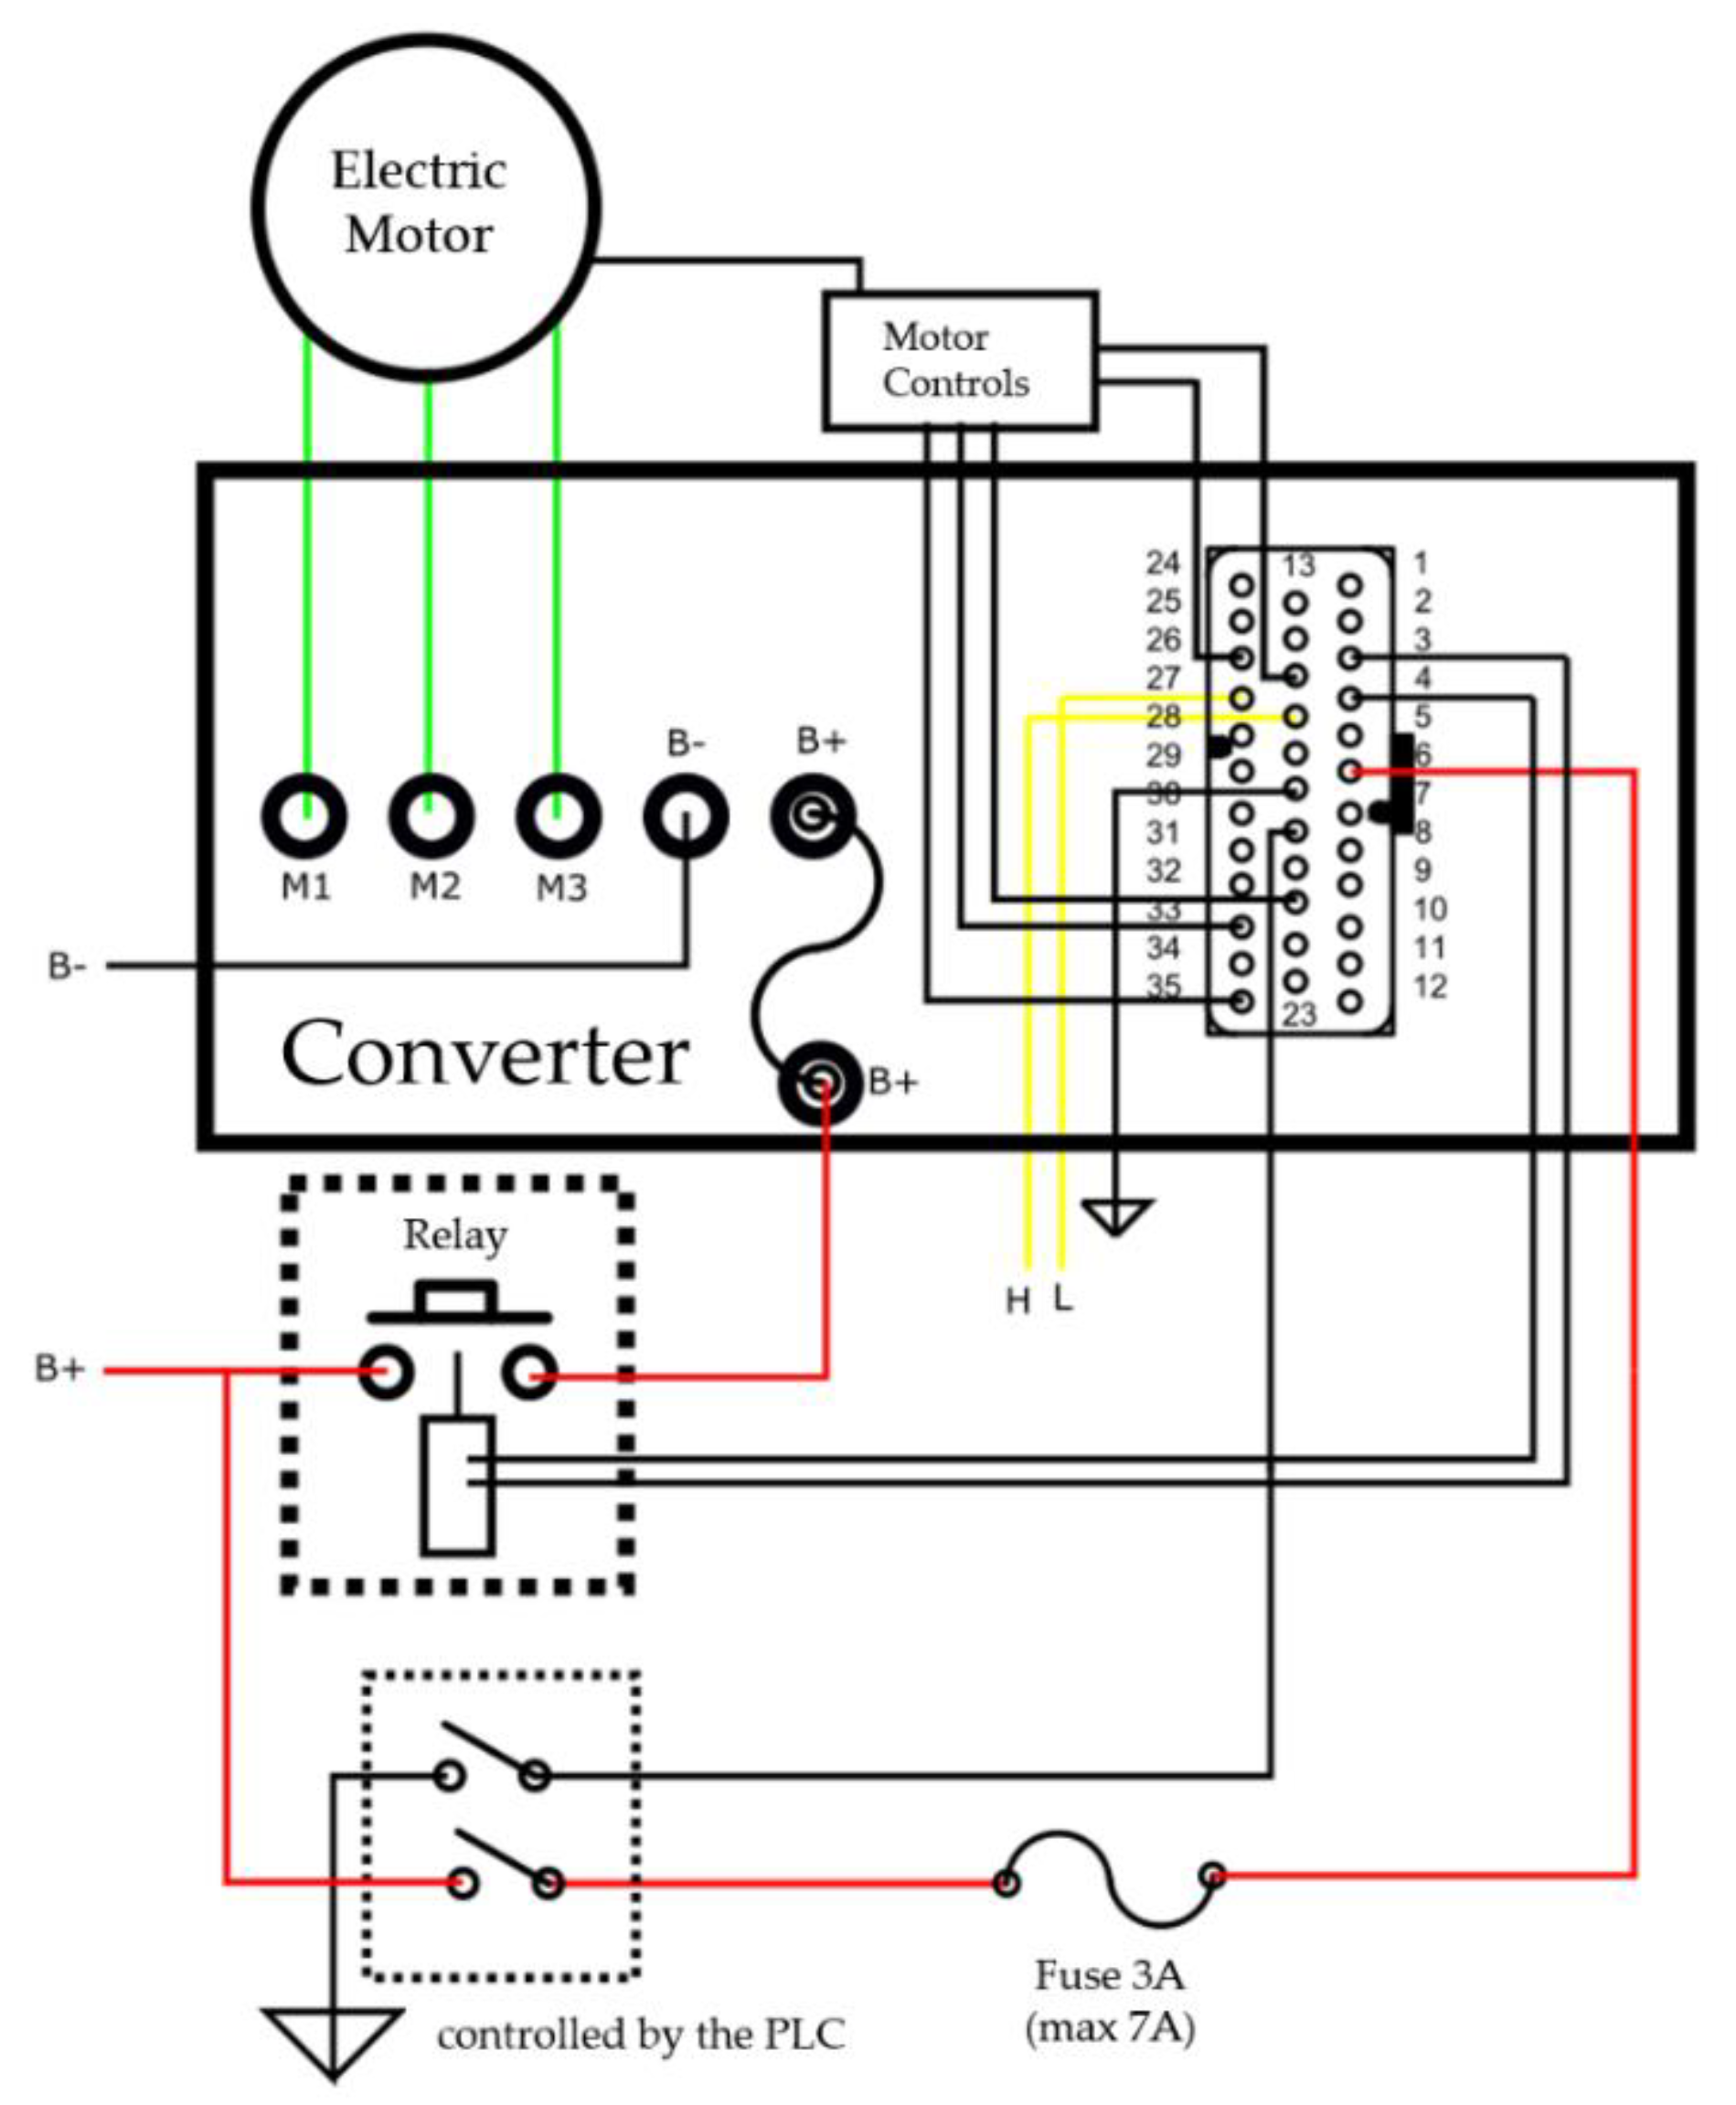
2.1.2. Electric Motor/Converter/Hydraulic Pump
This macro-block is made up of three devices: the electric motor, the converter, and the hydraulic pump. The electric motor used is a brushless three-phase machine with permanent magnets (model Miromax HPM); its nominal voltage and rated power are 48 V and 10 kW, respectively. The electric motor controller is the Sevcon Gen4 Size 6 model. The connection diagram (
Figure 4) between the controller and the electric motor is characterized by various types of connection:
in red, the power connections (B+ represents the “positive” voltage terminal of the battery pack, 48V);
in yellow, the Can-Bus link;
in black, the low-voltage controls (B- represents the “negative” voltage of the battery pack, usually taken as 0 V);
in green, the connection of the motor phases.
The information relating to the pin-out of the converter is beyond the scope of this article. Finally, the hydraulic pump is supplied with the compactor truck Mitsubishi Canter Ministarb-7 (model: OMFB LTA 40S).
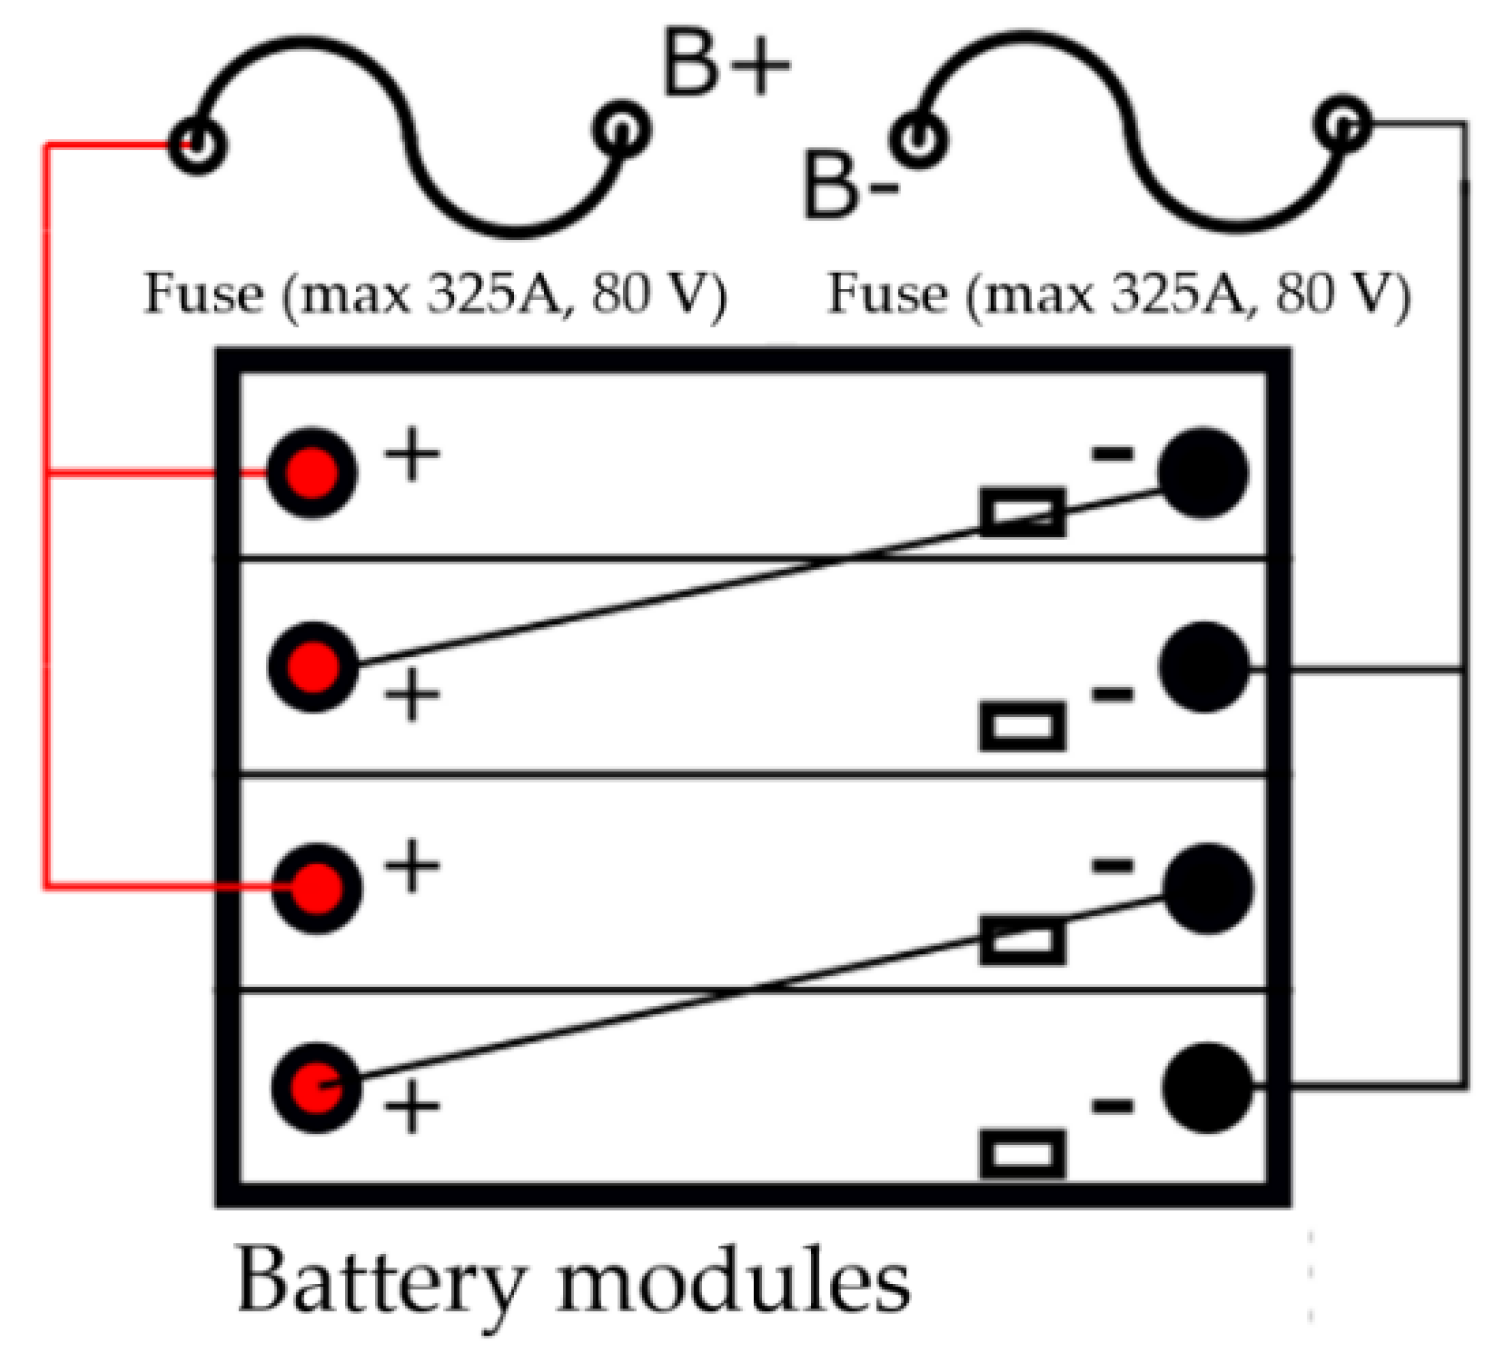
2.1.3. Battery Pack and BMS
The battery pack consists of four 24 V modules connected to form a pair of two modules in parallel and two pairs in series, as shown in
Figure 5.
Each module is composed of 420 battery cells (Samsung 2900mAh INR18650-29E), arranged as seven groups in series; each group is composed of 60 cells in parallel. The nominal capacity of a single battery module is 3.8 kWh and the nominal capacity of the entire battery pack is 15.2 kWh.
The BMS has the purpose of checking and controlling the state of charge (SOC) and the state of health (SOH) of the battery pack during its charge and discharge cycles; the model used in this study was the Emus G1. Each battery module is controlled by the corresponding BMS slave unit, which acquires the voltage values of the seven groups within the corresponding battery module. The four slave units are managed by a single master unit that can communicate with the other devices through the Can-Bus channel. The master unit also receives information on the current flowing into and out of the battery pack, through current sensors.
2.1.4. Battery Charger
The battery charger used for this electric system was the Zivan NG9, whose input frequency and voltage are 50 Hz and 400 Vac from the grid, respectively. The high power (up to 9 kW) and high efficiency (over 87%) of this Zivan battery charger guarantee significant energy savings and a consequent economic advantage. The Zivan battery charger can communicate with the BMS through the Can-Bus channel.
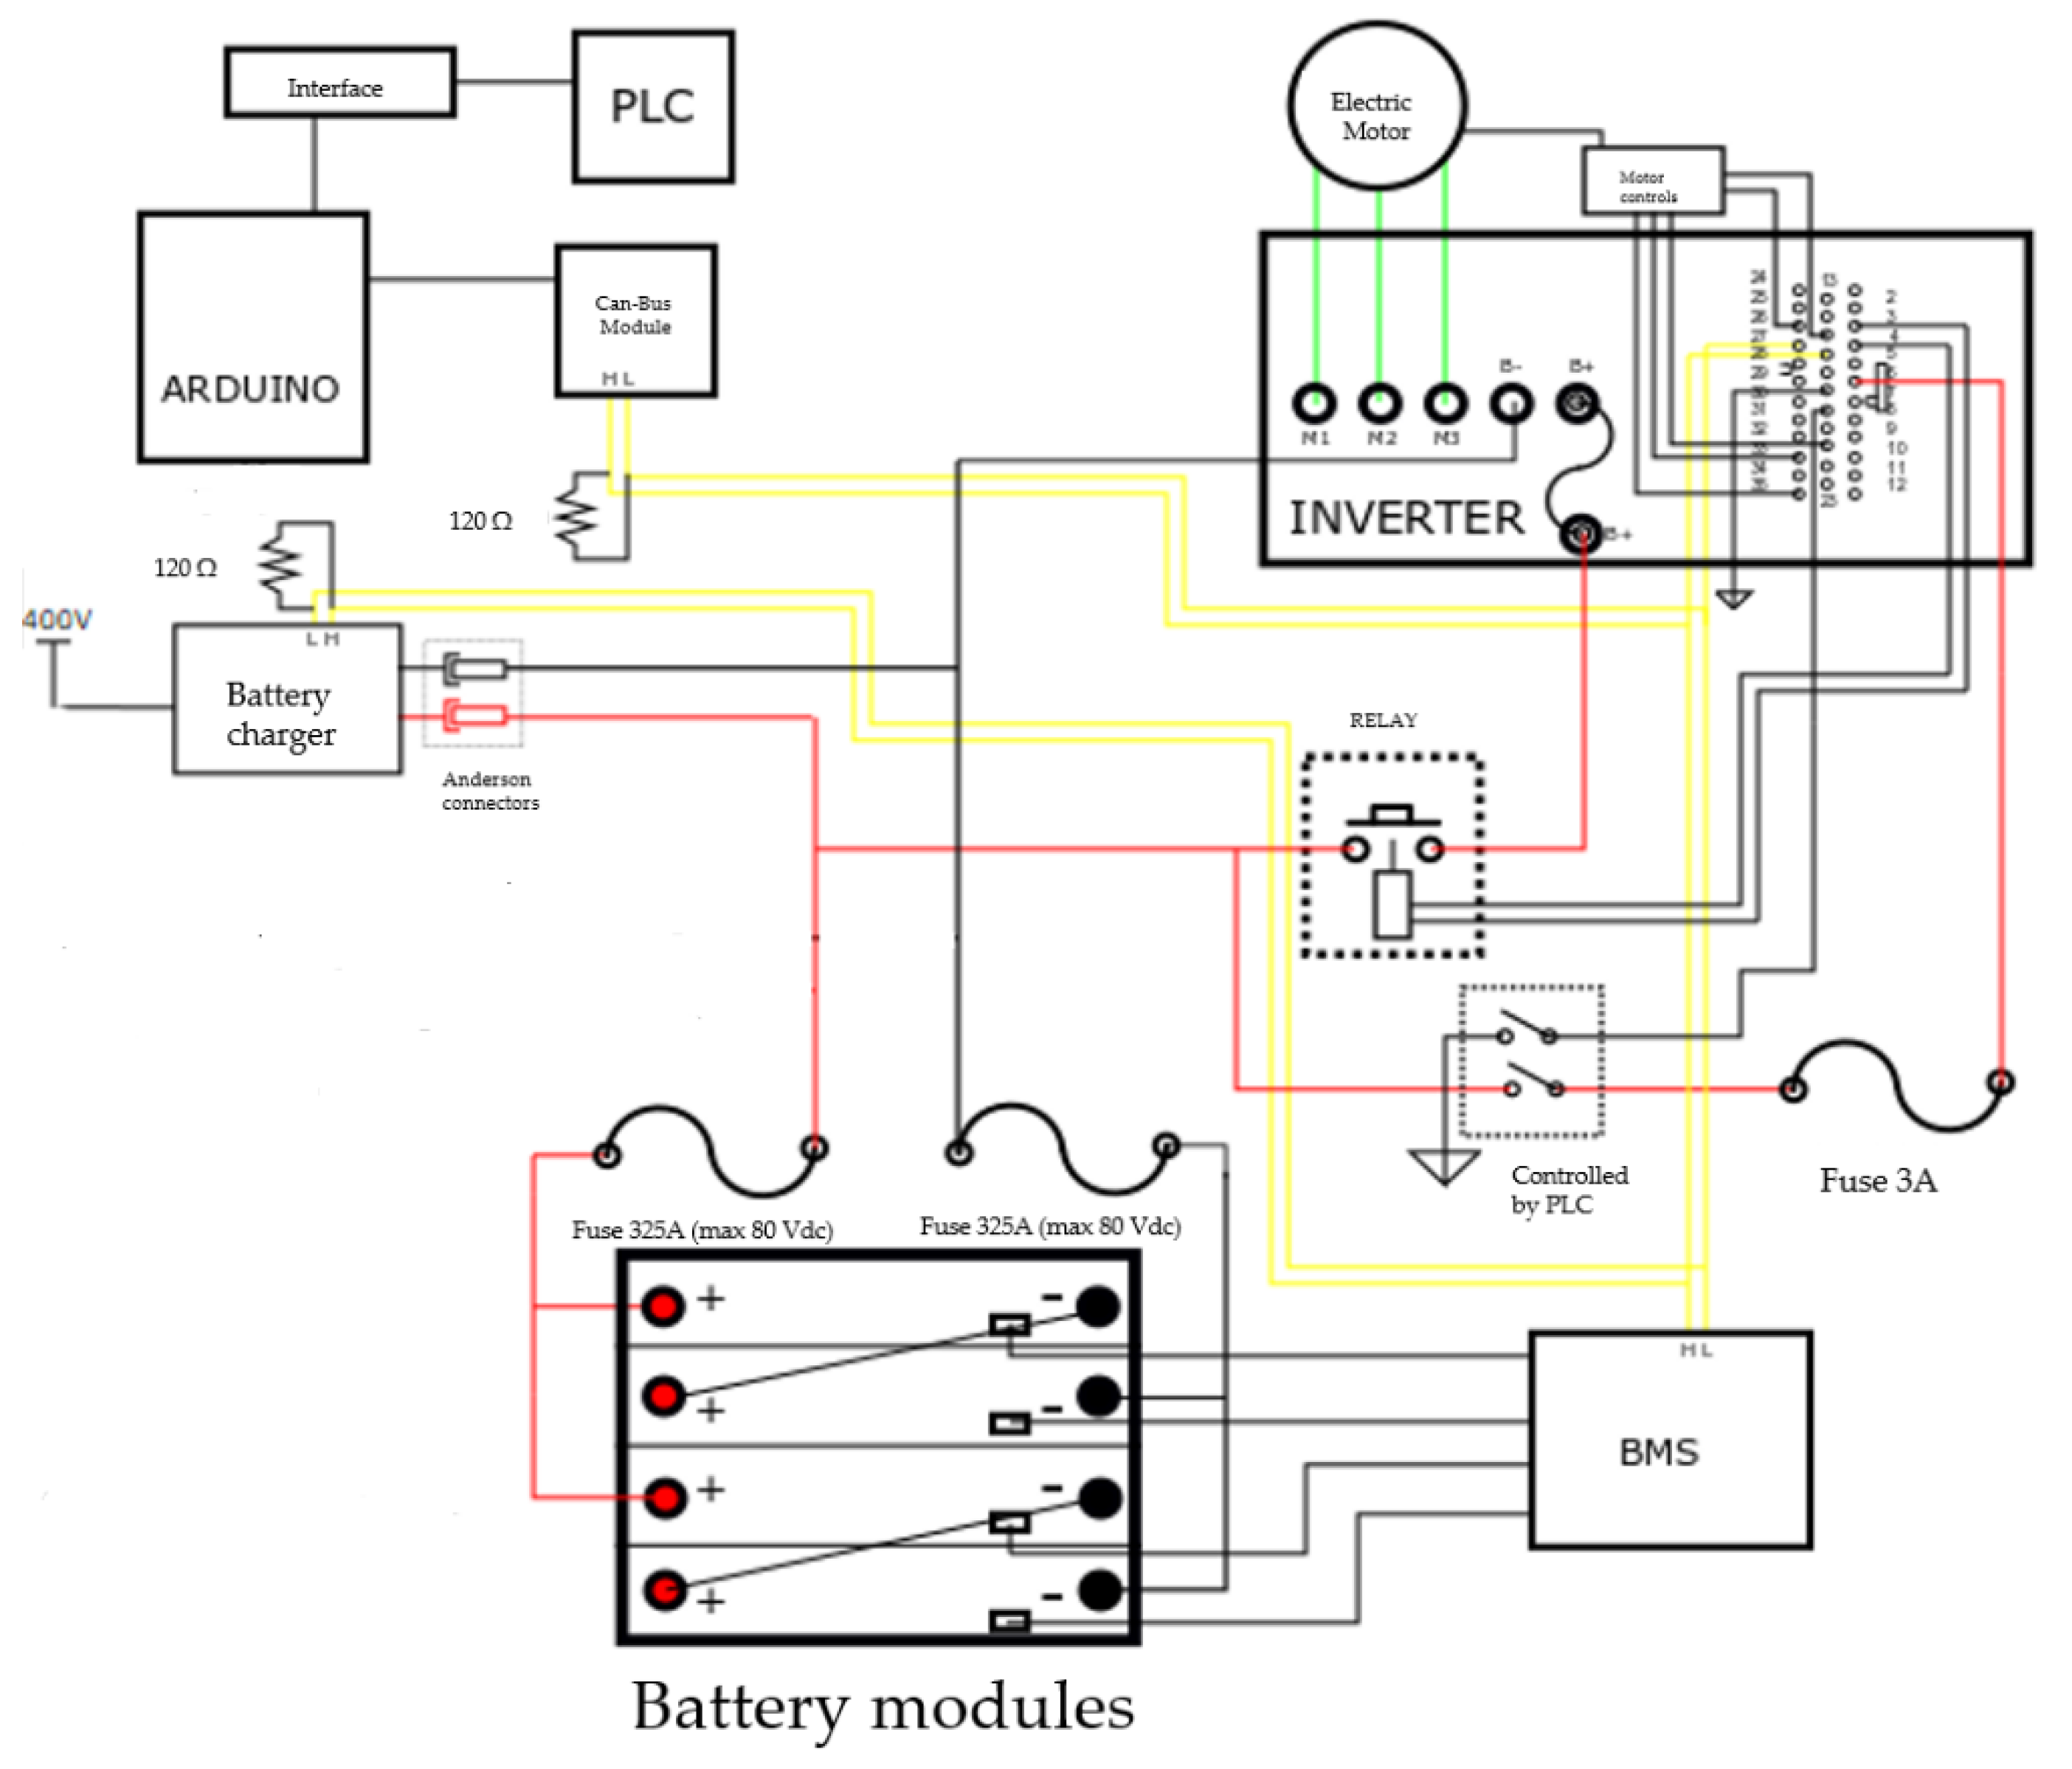
2.1.5. Electric Schematic Overview of the e-HPS
The complete electric schematic of the proposed e-HPS is shown in
Figure 6. The four subsystems can communicate through the Can-Bus link. The two 120 Ω-terminations are highlighted and the Anderson connectors are represented to electrically join the battery charger to the battery pack. The color legend is the same as that reported in
Section 2.1.2. The BMS block is located next to the battery modules.
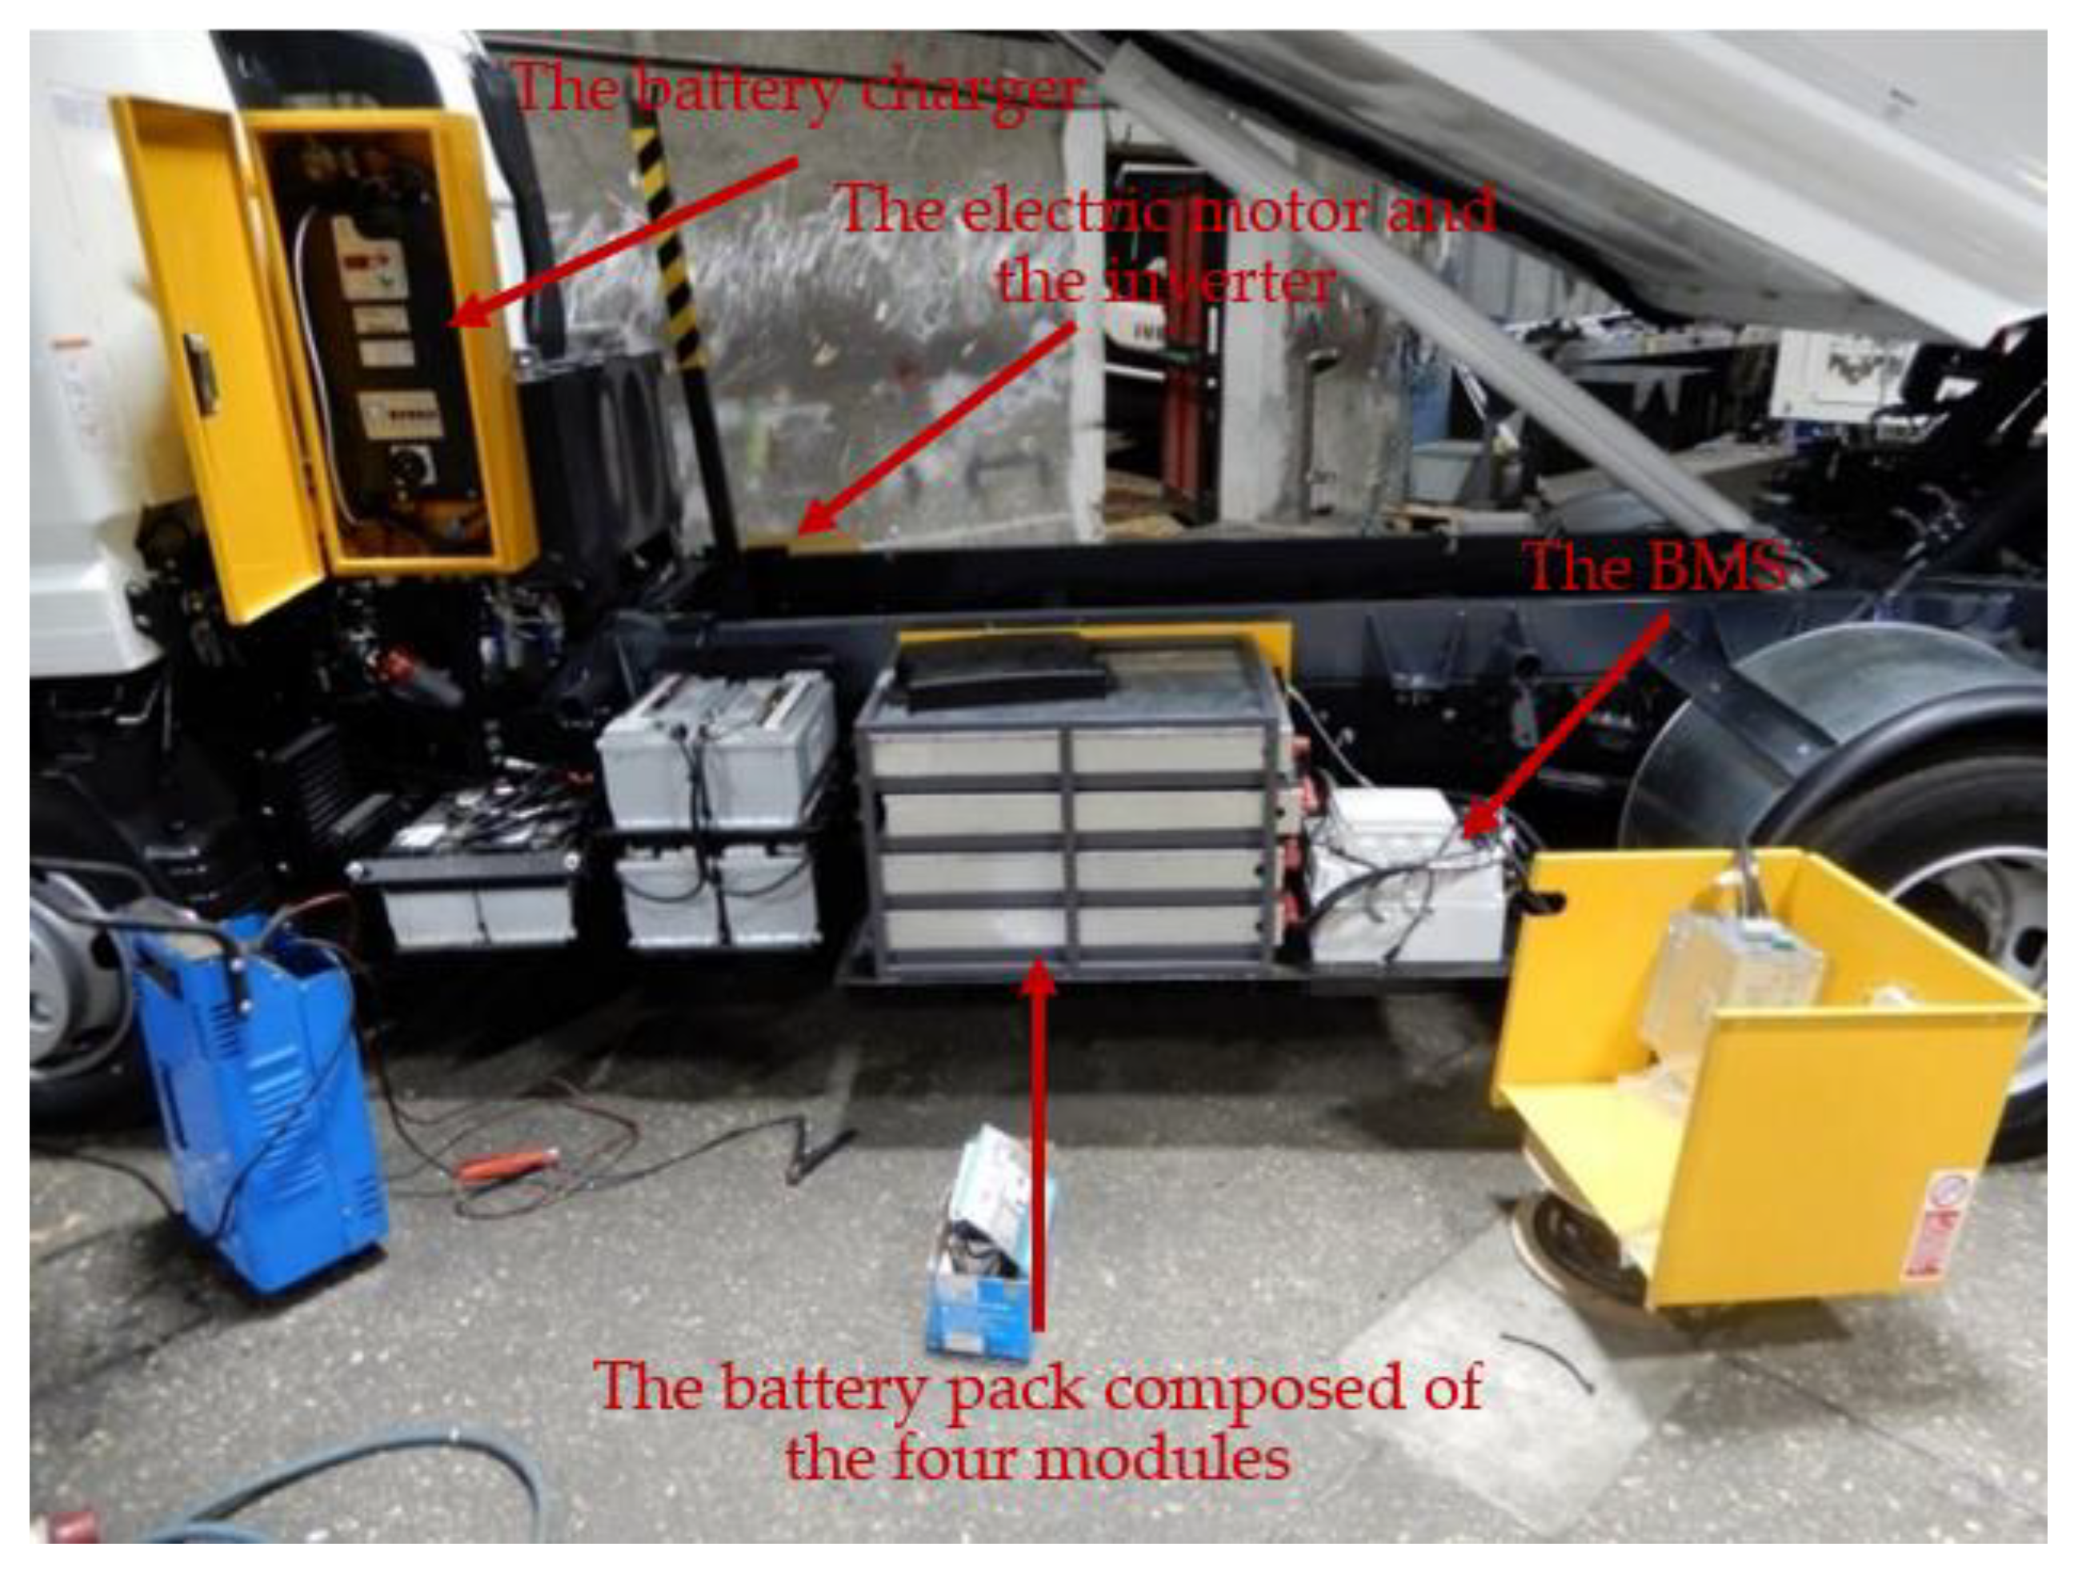
Figure 7 shows the last two subsystems, the battery charger and the battery pack, in addition to the BMS unit, mounted on the waste collection truck. The battery charger is shown in the top left corner of
Figure 7, as the black device inside the orange box. The battery pack is located at the lower center of
Figure 7, as the four aluminum blocks. The white block on the right side is the BMS unit. The control unit is located inside the white cabin of the vehicle, on the left side in
Figure 7. The electric motor and the relative controller are located on the back side of the vehicle, with respect to the one shown in
Figure 7.
The overall additional weight of the e-HPS can be estimated to be about 130 kg, that is:
25 kg for each battery module;
17 kg for the electric motor;
2 kg for the inverter;
2 kg for the BMS;
9 kg for the battery charger.
2.2. Garbage Collection Operations
This paragraph describes the vehicle operations and single tasks assumed to be required for the garbage collection and the traveling phase in a typical workday. The compactor truck travels to waste collection points (traveling activity) powered by the thermal engine. When the truck stops to collect garbage (idling activity), the hydraulic pump that provides the handling mechanism is directly engaged to the combustion engine shaft in the case of the ICE-HPS, or the electric motor shaft in the case of the proposed e-HPS. The proposed e-HPS, described in
Section 2.1, allows the accomplishment of all garbage collection operations.
To model the collection system, three different phases were taken into account, namely: (1) the dumpster lift; (2) the garbage compaction; and (3) the load discharge.
In the first phase, the dumpster lift cycle consists of lifting large garbage dumpsters and discharging the garbage contained within the dumpster into the enclosed vehicle hopper. During this operation, the rear-mounted lifting comb device engages the longitudinal sidewall of the garbage dumpster and lifts it until it reaches the discharge position, then, through the movement of a specific hydraulic device, the garbage is tipped into the truck hopper.
In the second phase, the garbage compaction is operated by means of a metal pusher plate within the truck body, which, through an oscillating movement, pushes the garbage against the mass already loaded and retracts. It should be noted that for each garbage load in the truck body, two garbage pushes are required to complete the compaction operation. The system for compaction is composed of an articulated single-bladed plate, activated by four double-action hydraulic cylinders.
In the final, third phase, when the truck body is full, it is necessary to discharge the garbage load onto a dump site. This operation involves the stabilization of the truck through a specific mechanical device (stabilizer), the lifting of the truck body, and the final push of the garbage from the vehicle body.
Garbage collection operations and tasks provided by the compactor truck, and the related mechanical power and task times, are summarized in
Table 1. The values of pump speed, mechanical power, temporal duration, and number of cycles for each phase, reported in
Table 1, are defined by the company Fratelli Mazzocchia SPA.
The sequence of collection tasks is composed of one hundred repetitions of one dumpster lift followed by two garbage compactions. The three load discharges are temporally equally distributed with the collection activities.
2.3. Experimental Measurements and Battery Simulation
In this section, three separately conducted studies, whose results were sequentially connected to each other, are described:
the measurements of the electric power supplied by the battery pack during only one cycle for each operation phase described in
Table 1: dumpster lift, garbage compaction, and load discharge;
the high-rate (2C-rate) discharge test of a single battery module and the corresponding implementation, in MATLAB/Simulink environment, of a predictive control model that includes the real time SOC estimation during a workday time;
the prediction of the SOH of the battery pack as a function of the number of charge and discharge cycles. The SOH forecast was realized through a MATLAB/Simulink simulation.
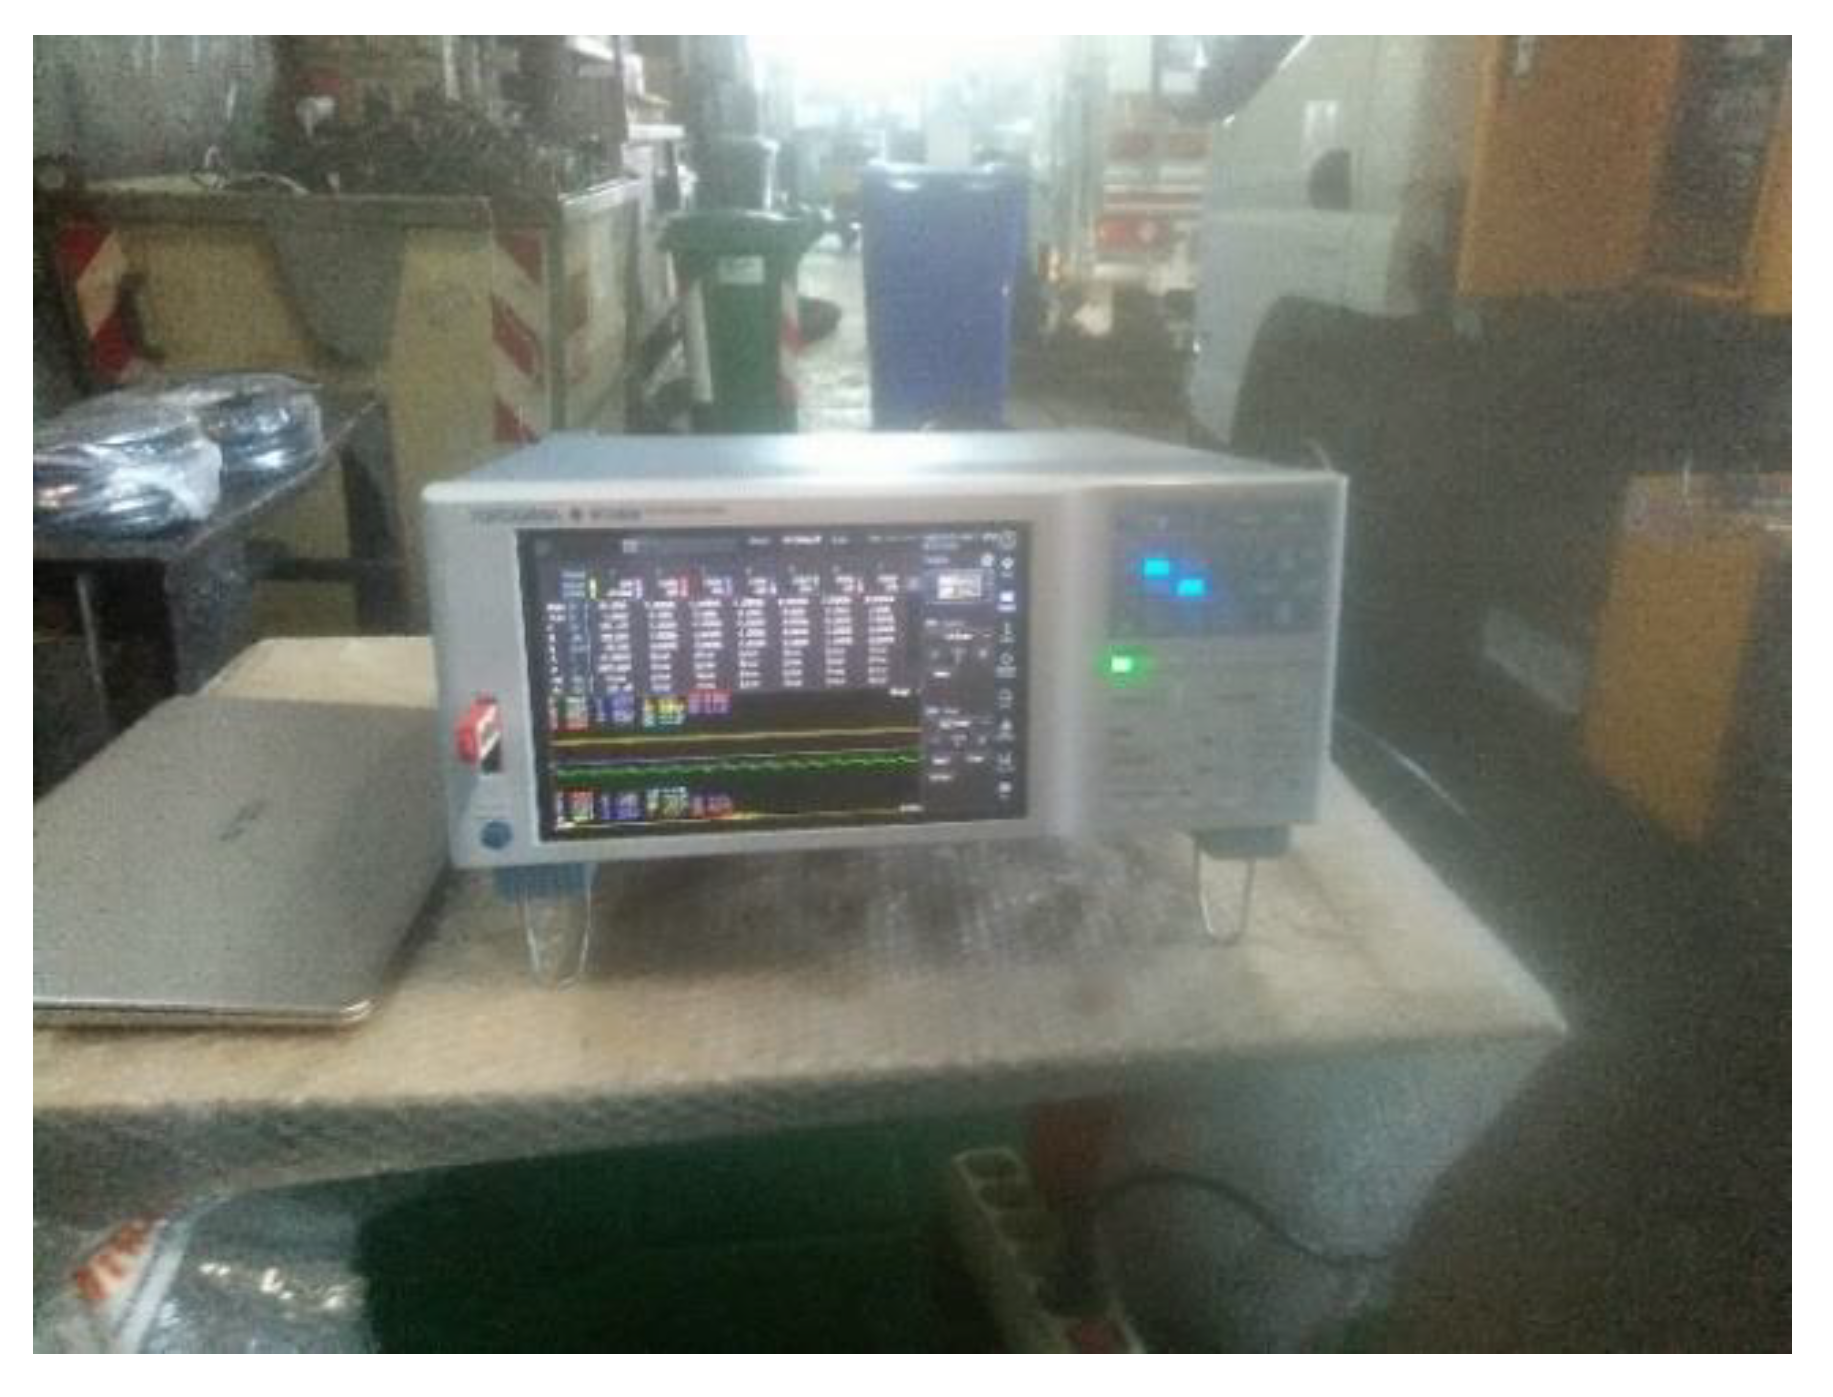
2.3.1. Setup of the Electric Power Measurements
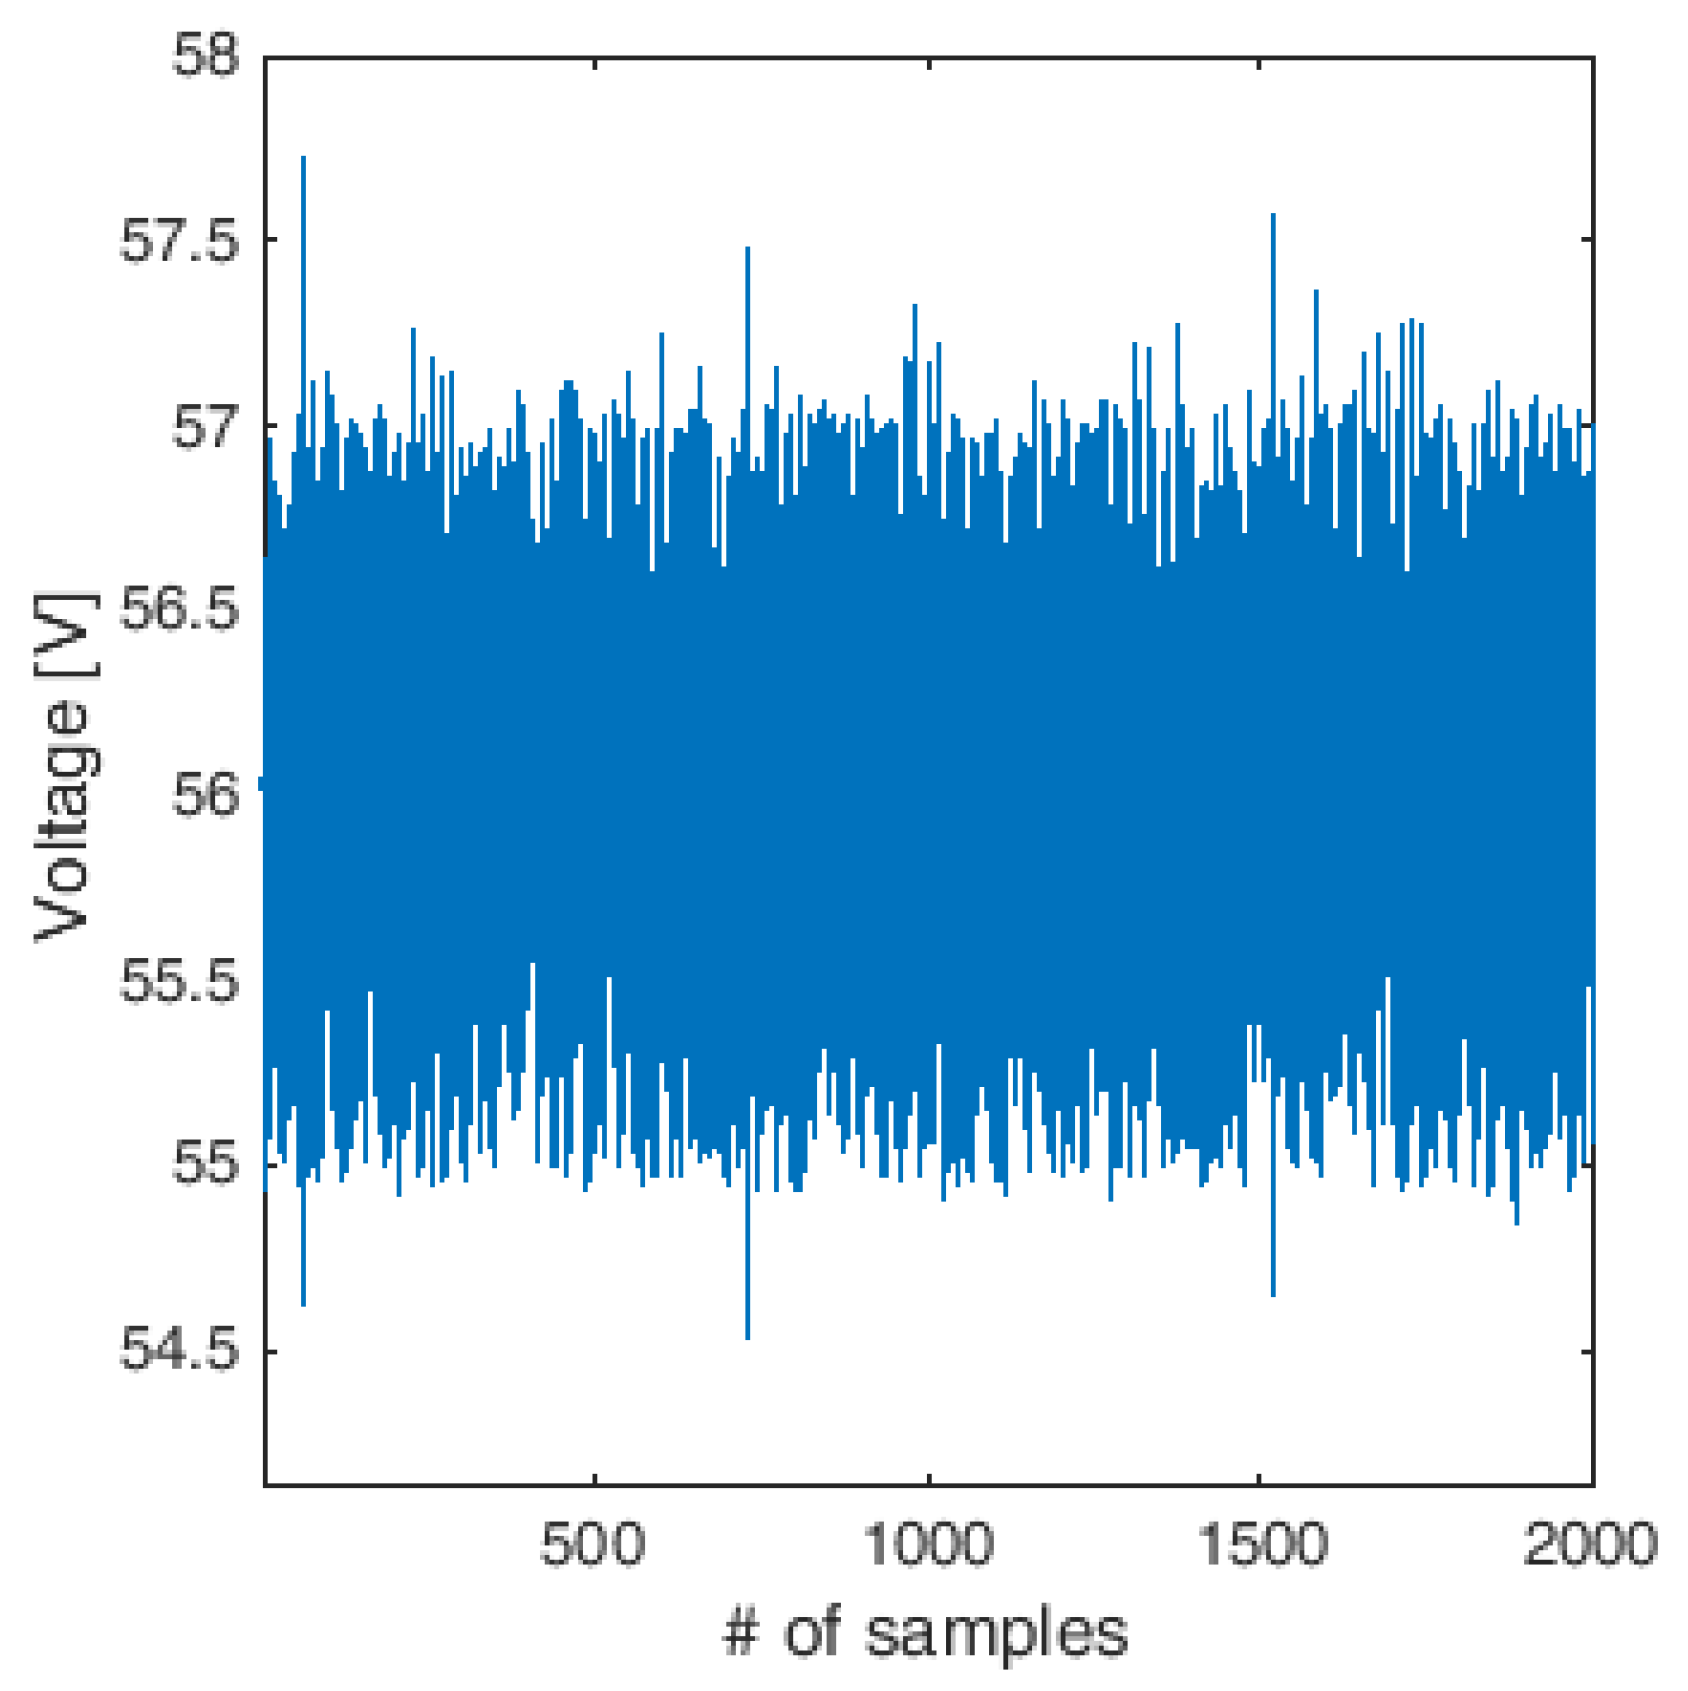
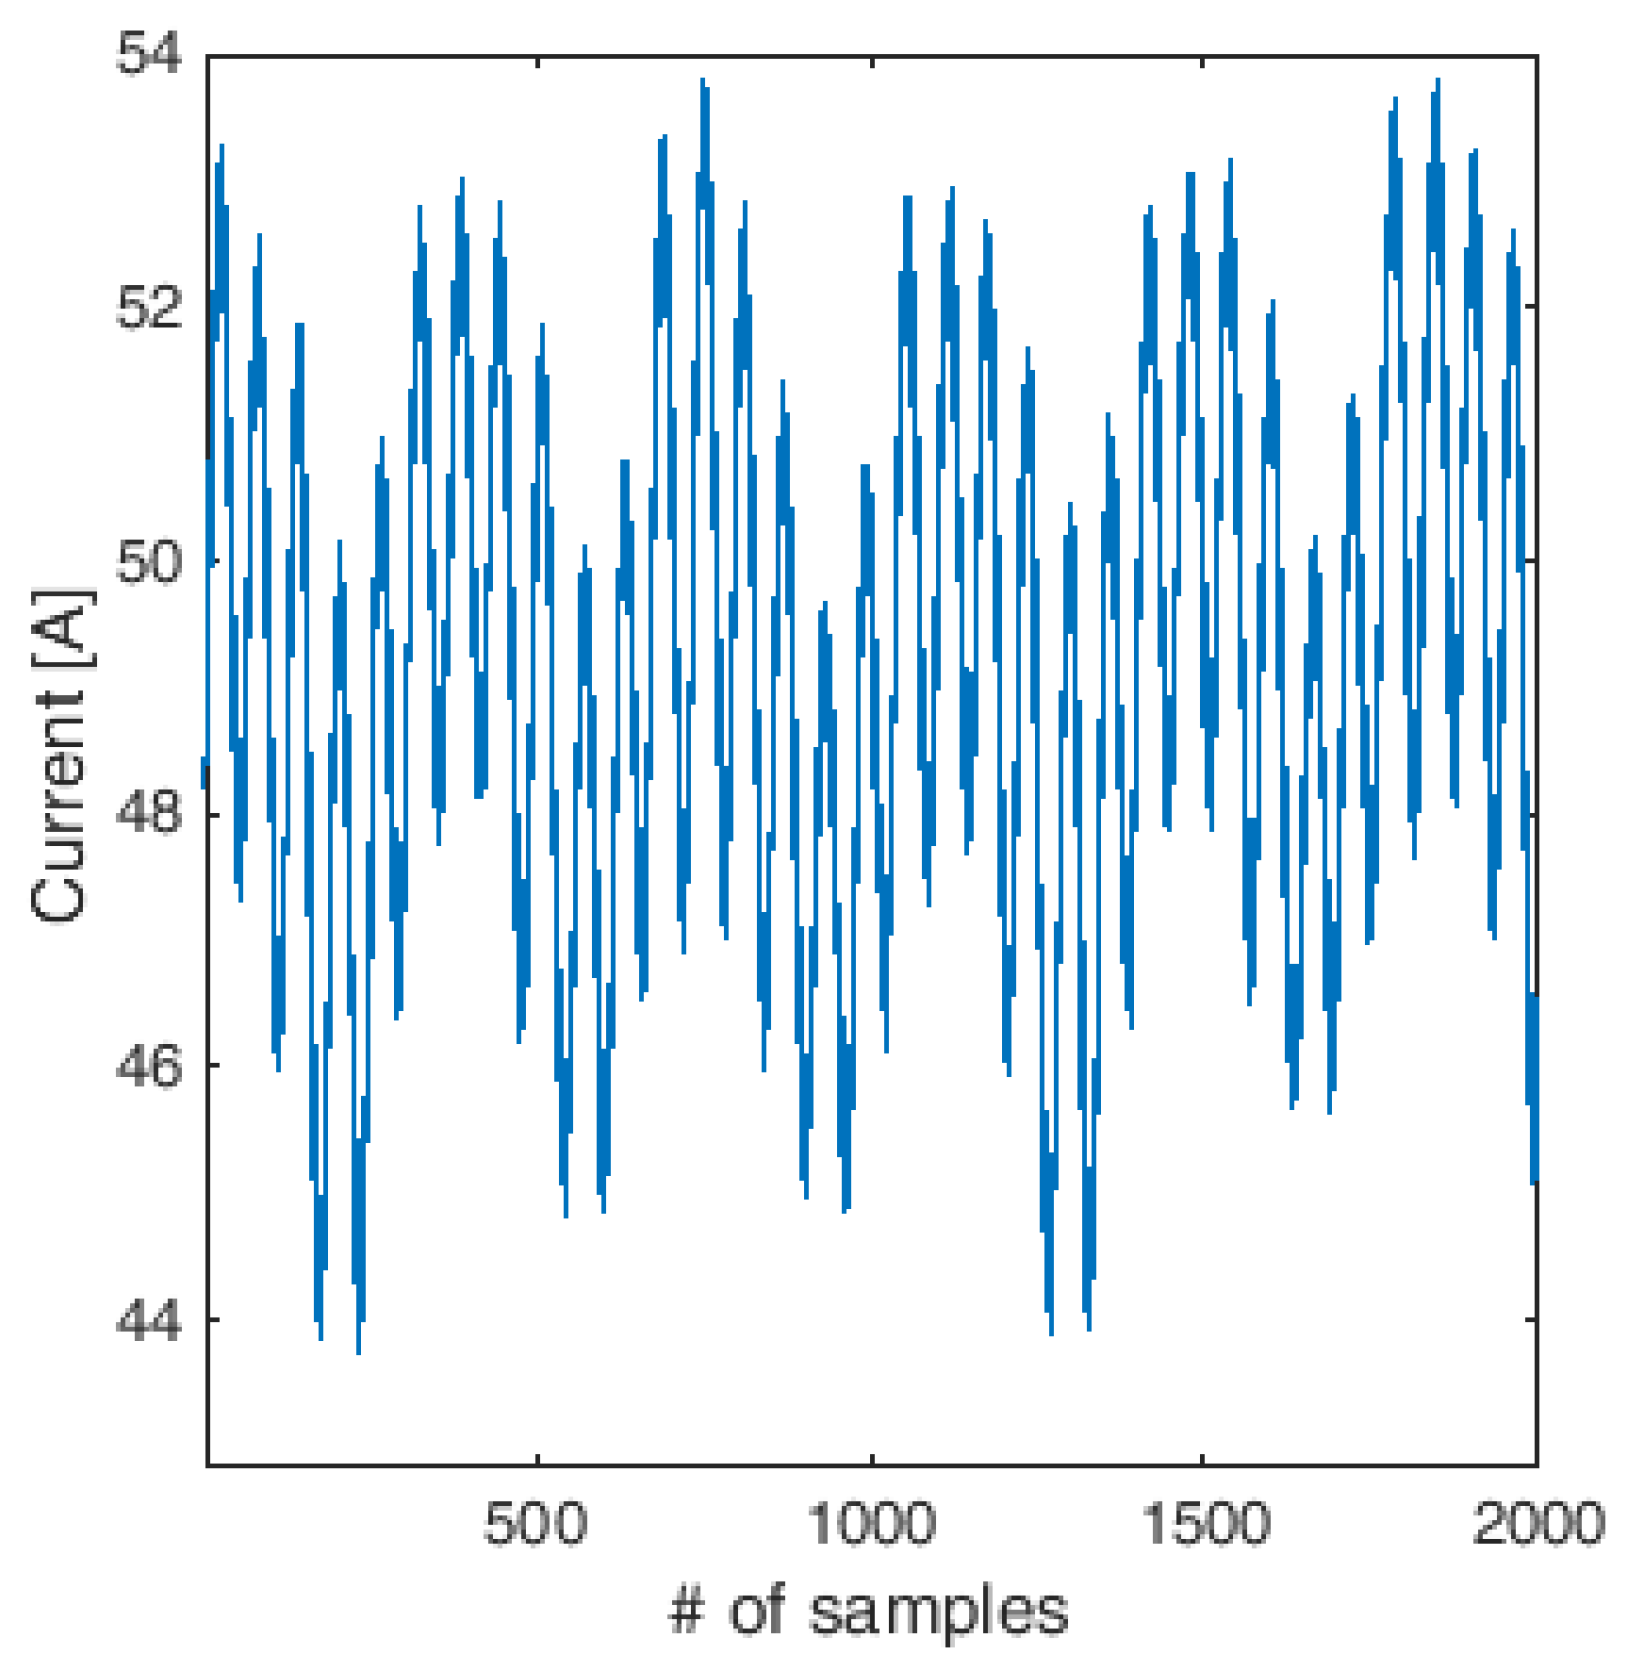
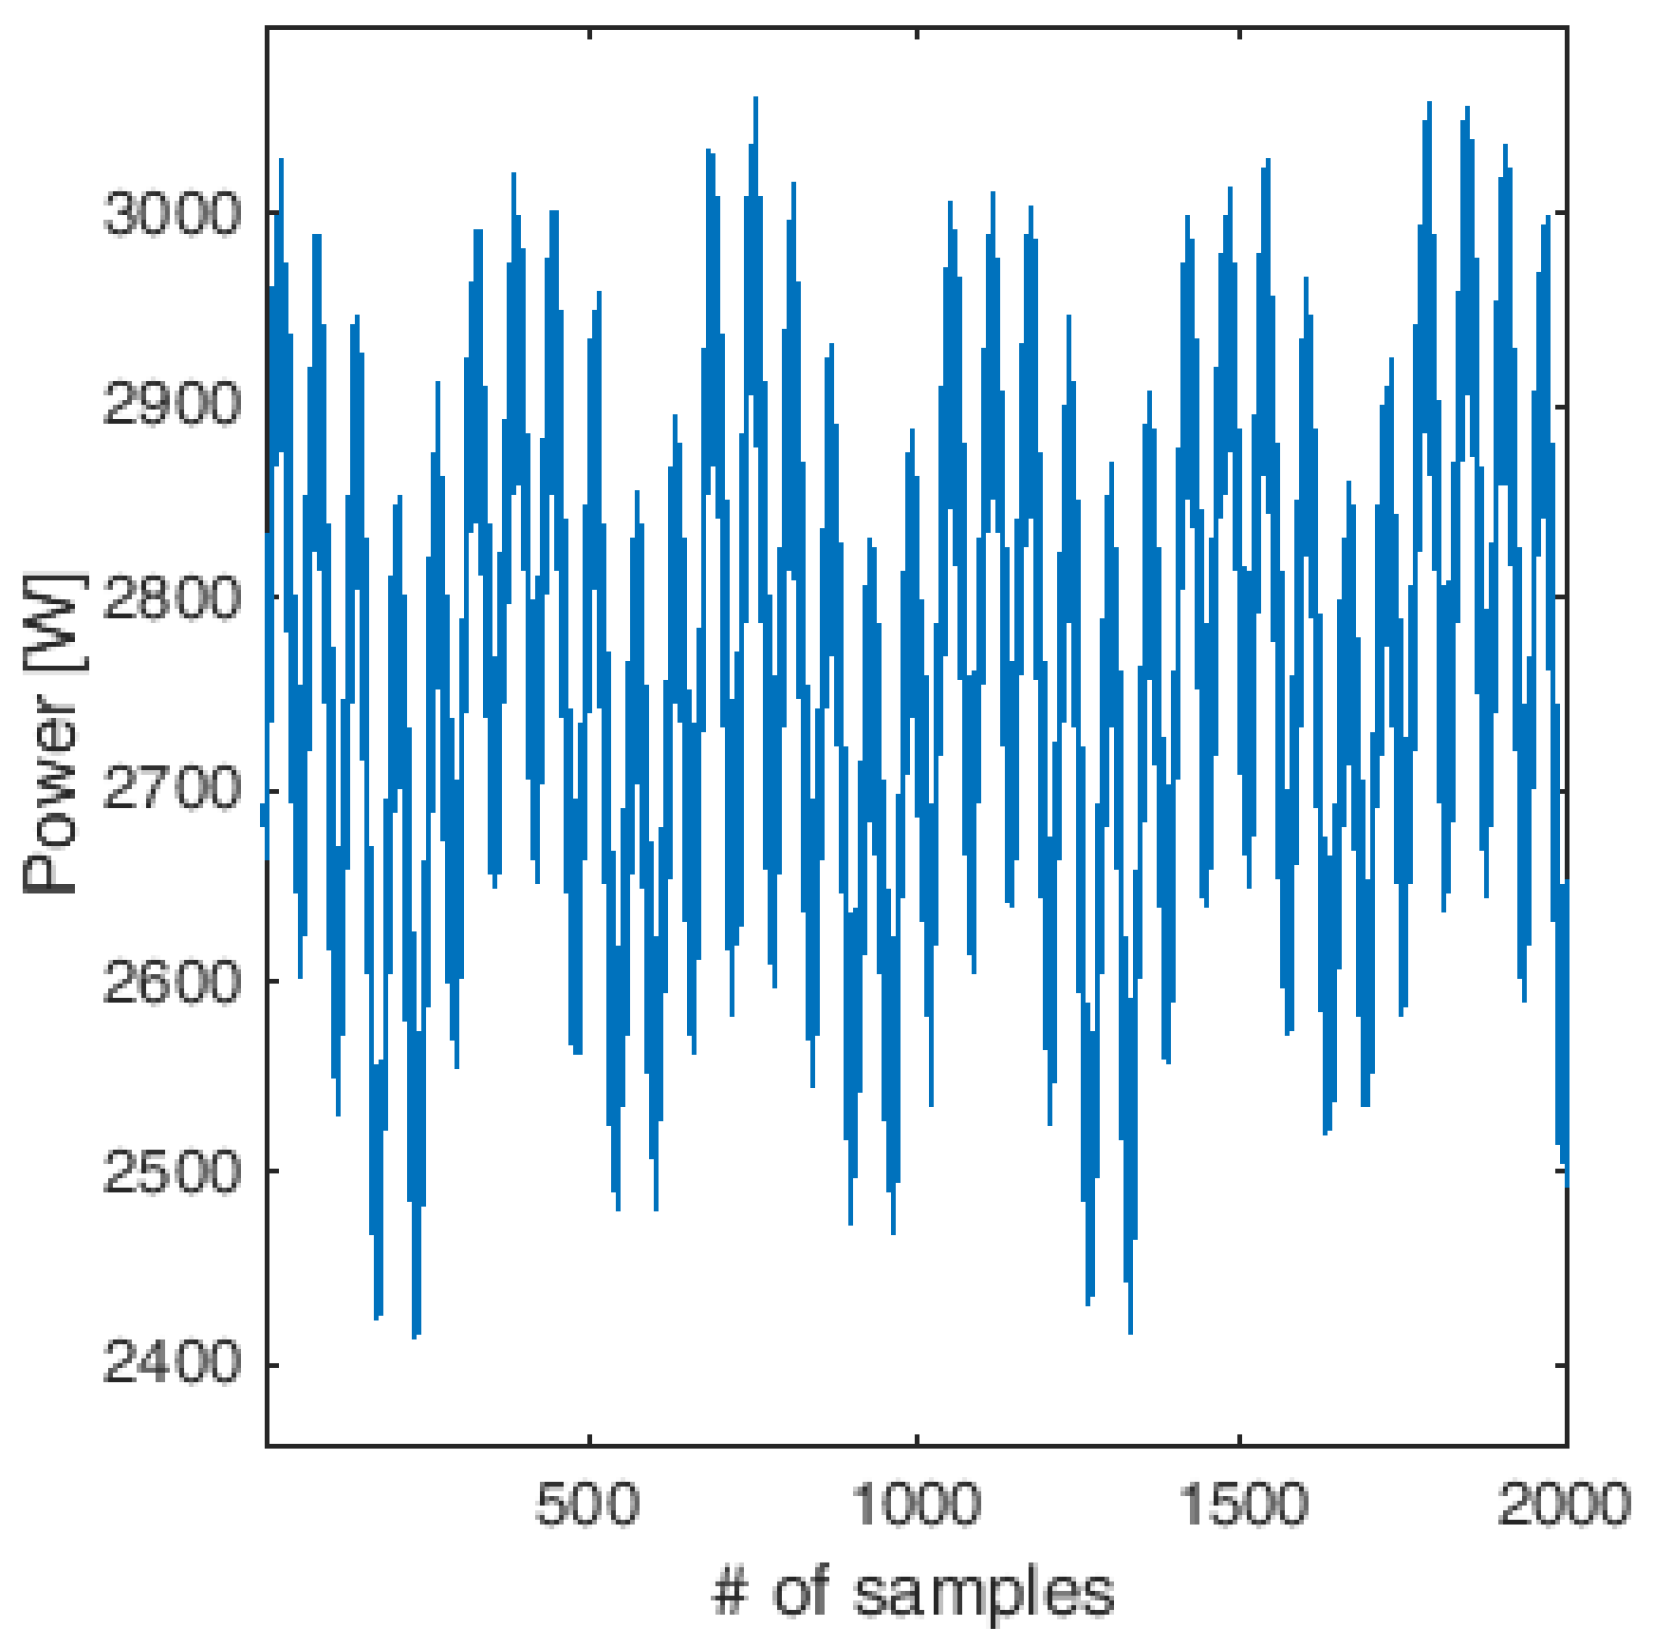
To quantify the electric power needed to perform all of the mechanical cycles reported in
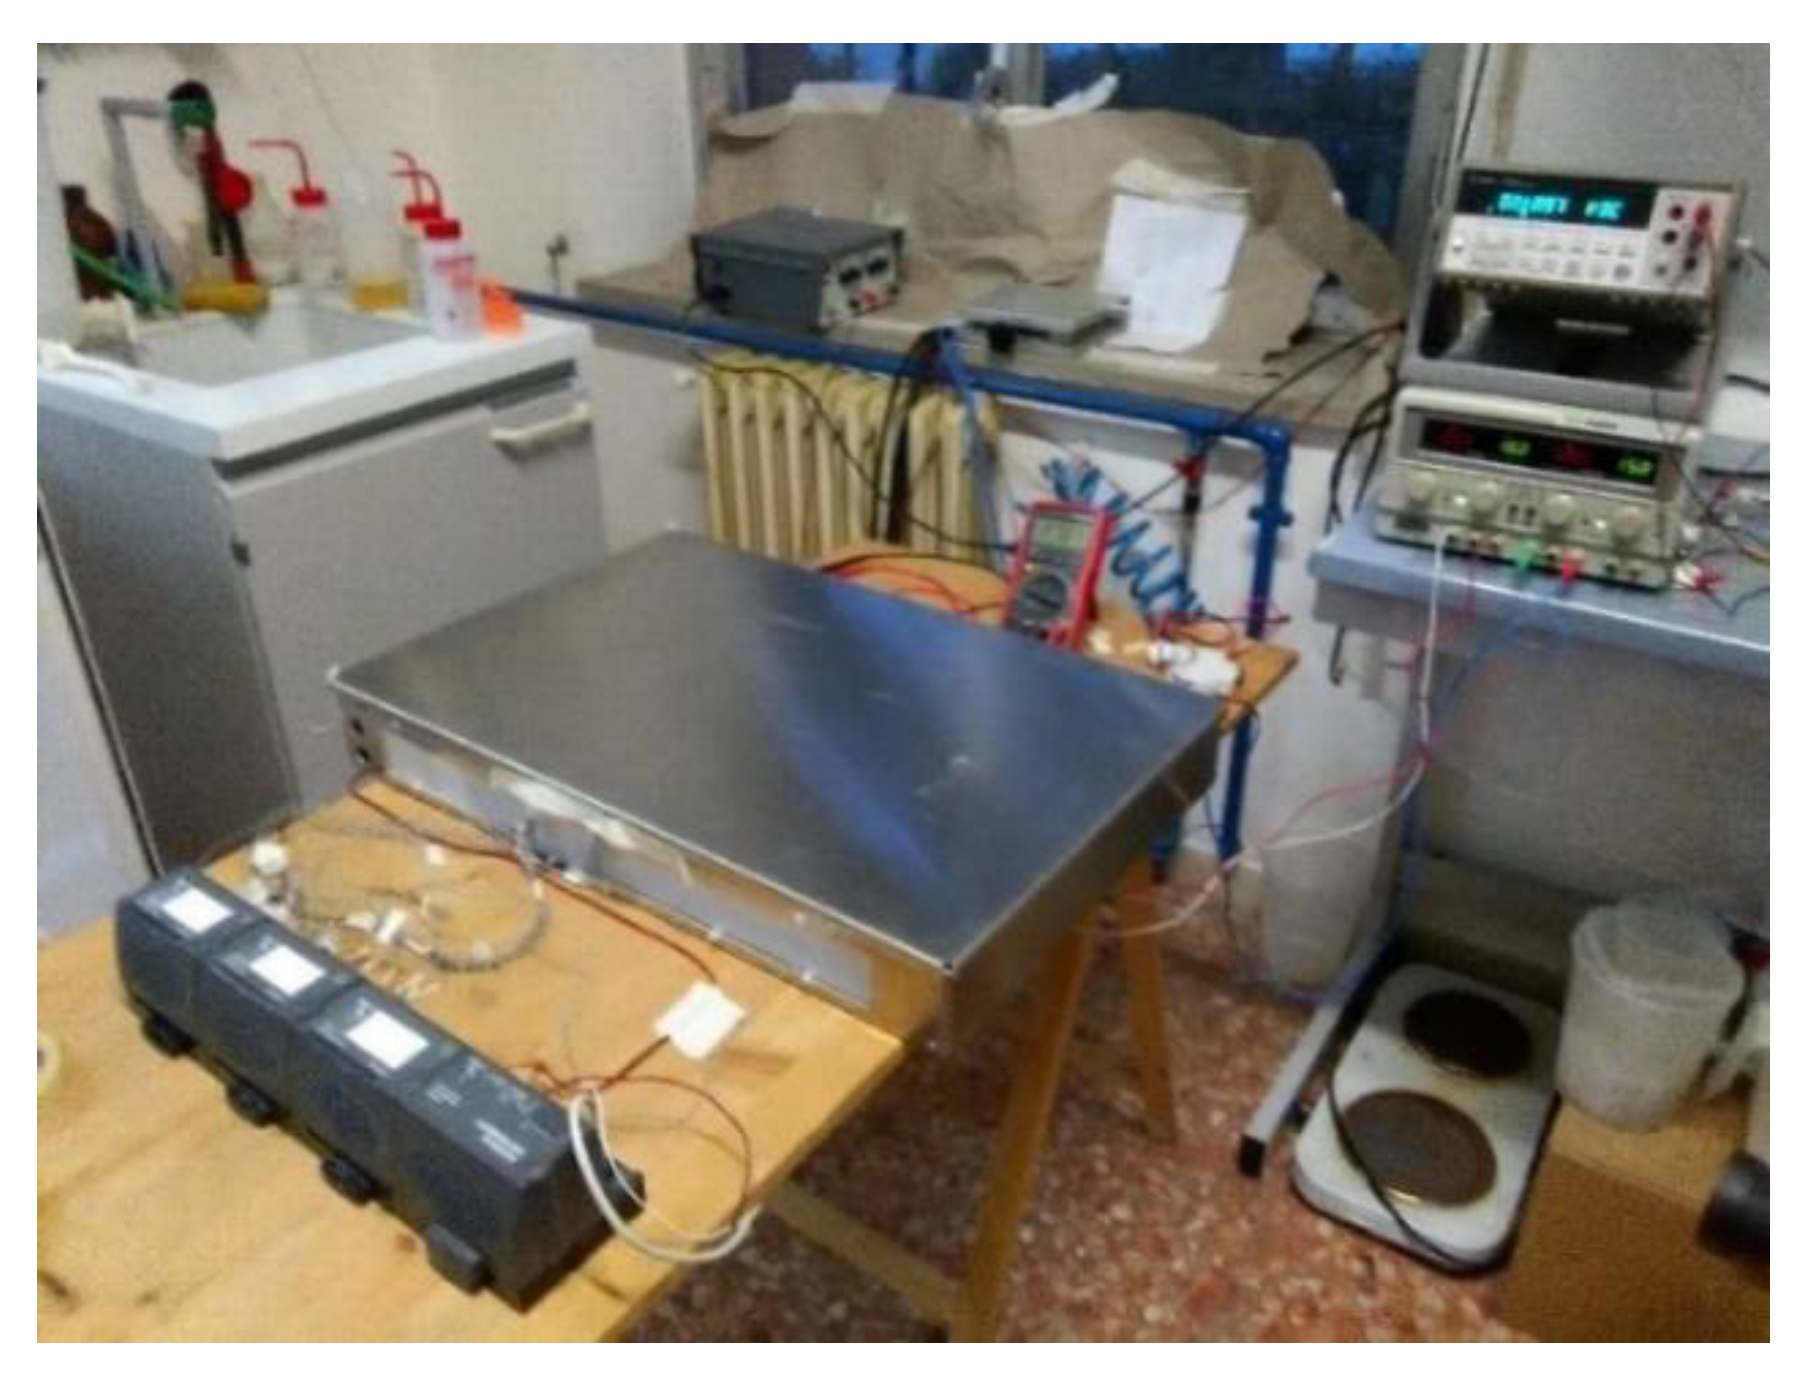
Table 1, the electric measurements of the voltage and current, supplied by the battery pack during the three operation phases, were carried out. The measurements were performed only for one cycle of dumpster lift, garbage compaction, and load discharge. The measuring campaign was carried out through the use of the Yokogawa WT 5000 power analyzer, as shown in
Figure 8. The instrument measured the voltage between the battery terminals, and a direct coupling was made between the battery terminals and the power analyzer (its accuracy is ±0.02% of the reading value). The current supplied by the battery pack was measured via an amperometric clamp (Chauvin Arnoux E3N, its accuracy is ±3% of the reading value) connected as an input to the power analyzer.
2.3.2. Implementation of the MATLAB/Simulink Simulations
To evaluate the behavior of the entire battery pack during the collection activities, the kinetic battery model (KiBaM) [
30] was implemented in the MATLAB/Simulink environment. The KiBaM charge estimator expresses the chemical processes inside the battery through a kinetic transfer of the charges involved. The model can be rapidly explained considering two tanks in which the maximum charge that can be delivered by the accumulator is distributed. One tank is called the “available charge well”, which is solely responsible for the transfer of chemical charges between the storage system and the external network, valid for both charge and discharge phases. Conversely, the other tank, defined as the “bound charge well”, exchanges charges only with the available charge well. The flow of these charges depends on the difference in magnitude of the charges present in the two tanks
and
(where
represents the SOC of the battery), and by a valve k which regulates the passage. The parameter k has the dimension 1/time and limits the rate at which the charge can flow between the two charge wells. The charge is distributed between the two tanks by means of the parameter c (0 < c < 1). The parameter c is defined as the ratio between the initial charge in tank
(
and the maximum deliverable charge (C), which is the sum of the initial charges in tank
and tank
. The equations that describe the flow of the charges in both tanks are the following:
where
and
are the total charges of the two tanks, respectively; whereas
and
. The initial conditions are:
,
, with
. The variable
represents the current delivered as a function of time. Therefore, the KiBaM system allows the flows of the charges during the discharge/charge processes to be modeled, according to the following equations:
is the available charge that has not been transferred from the bound charge well to the available charge well. The amount of
increases with the number of charge/discharge cycles, consequently the amount of
decreases with the number of charge/discharge cycles. The equation that considers the increasing rate with time of the variable
is:
In Equation (3), the value of can be determined as ; from Equation (3) it is possible to determine the value of the parameter k, starting from the knowledge of determined by the experimental evualuation of constant-rate discharge from a complete charge.
However, to calibrate the system to emulate the accumulator behavior it is essential to carry out experimental tests. A first test consists of discharging the accumulator using an extremely small current, thus obtaining the value of the maximum deliverable capacity, that is, . Furthermore, discharging the battery with a high current results in the initial charge relative to the available charge well .
Both experimental tests were performed. The first test was carried out on a single battery cell using a small commercial battery charger (LiPro balance charger) that allowed a discharge test with limited current (0.1 C-rate) to also be performed.
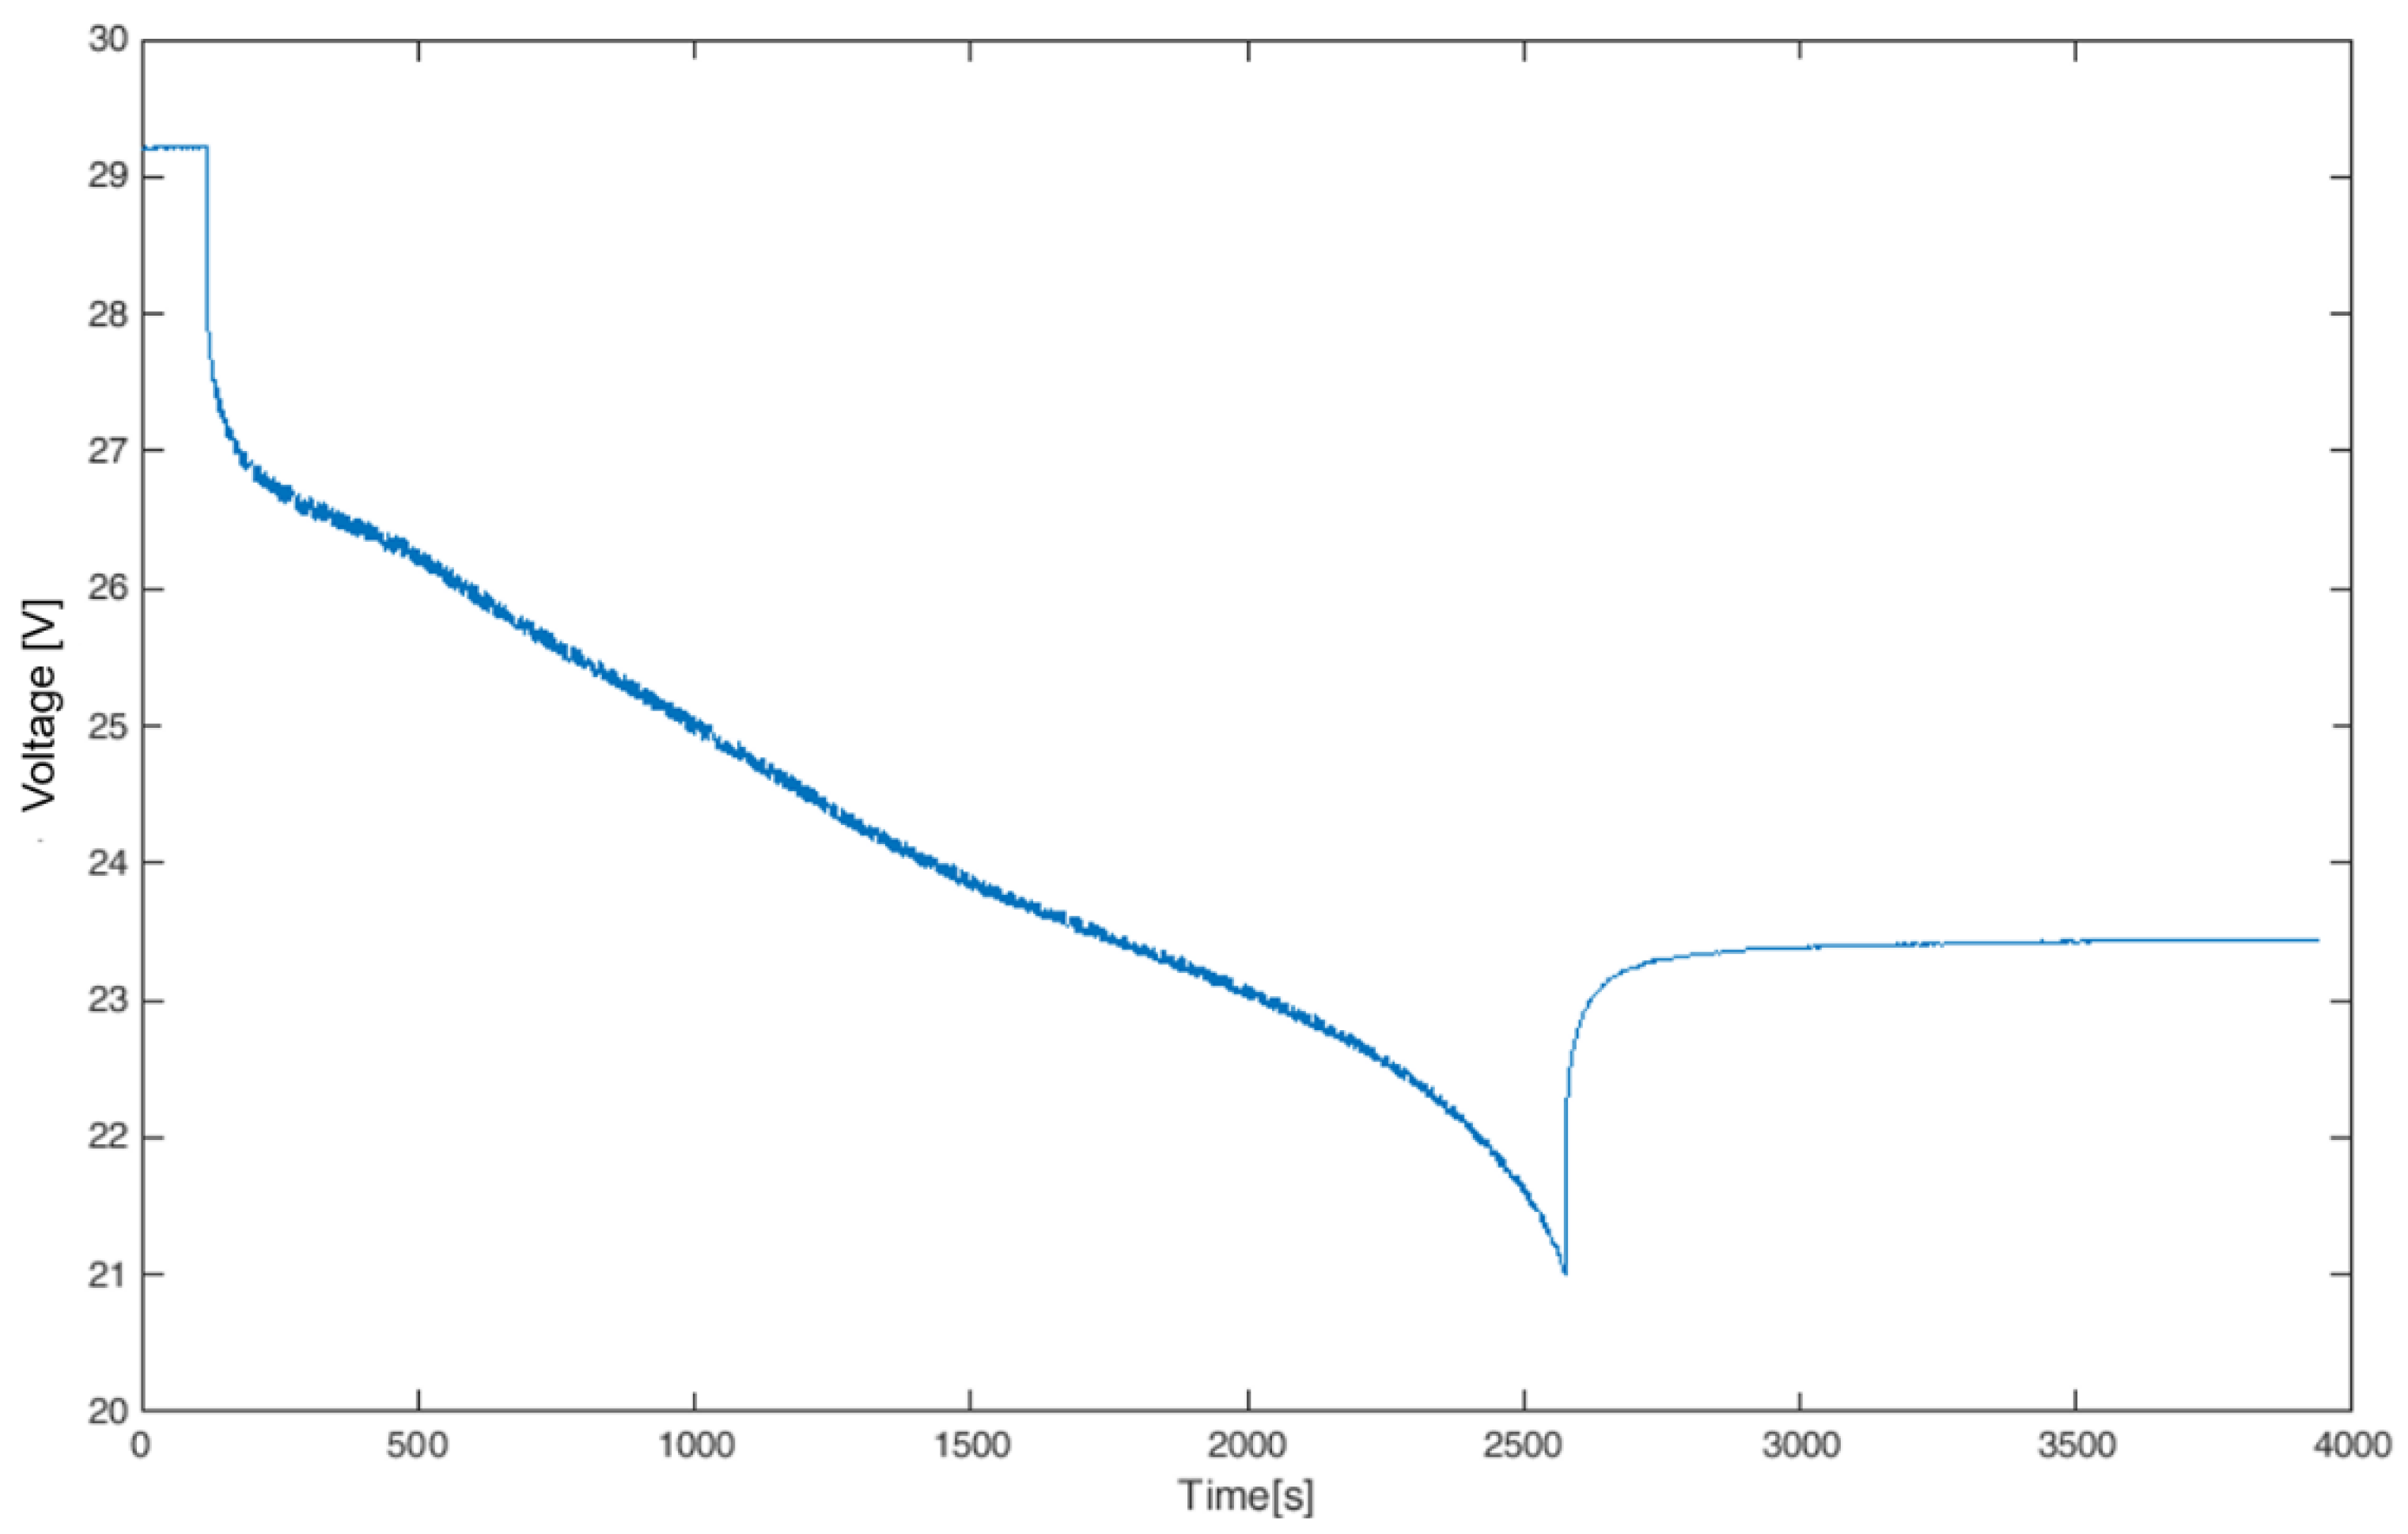
The second experimental test required significantly more effort and was carried out on one battery module. The setup was performed using a set of power sinks (up to 7.5 kW of dissipated active power) connected to the battery module terminals through a power transistor that forced the supplied current to be as constant as possible during the discharging time. The DC current and voltage were measured by a shunt resistor and a voltage divider, respectively. A compact data acquisition (DAQ) module NI-9206 was used to acquire the DC voltage and current. The accuracies of the shunt resistor and the DAQ board are ±0.25% of the reading value and ±0.1% of the full scale, respectively.
Figure 9 shows the battery module during the discharging test. The test was performed at the 2C-rate, close to the maximum discharging rate for this type of lithium cell.
The experimental tests allowed evaluation of the two initial constants: the maximum deliverable capacity ( 250 Ah) and the initial capacity ( = = 160 Ah), with c = 0.64 and k in the magnitude order of .
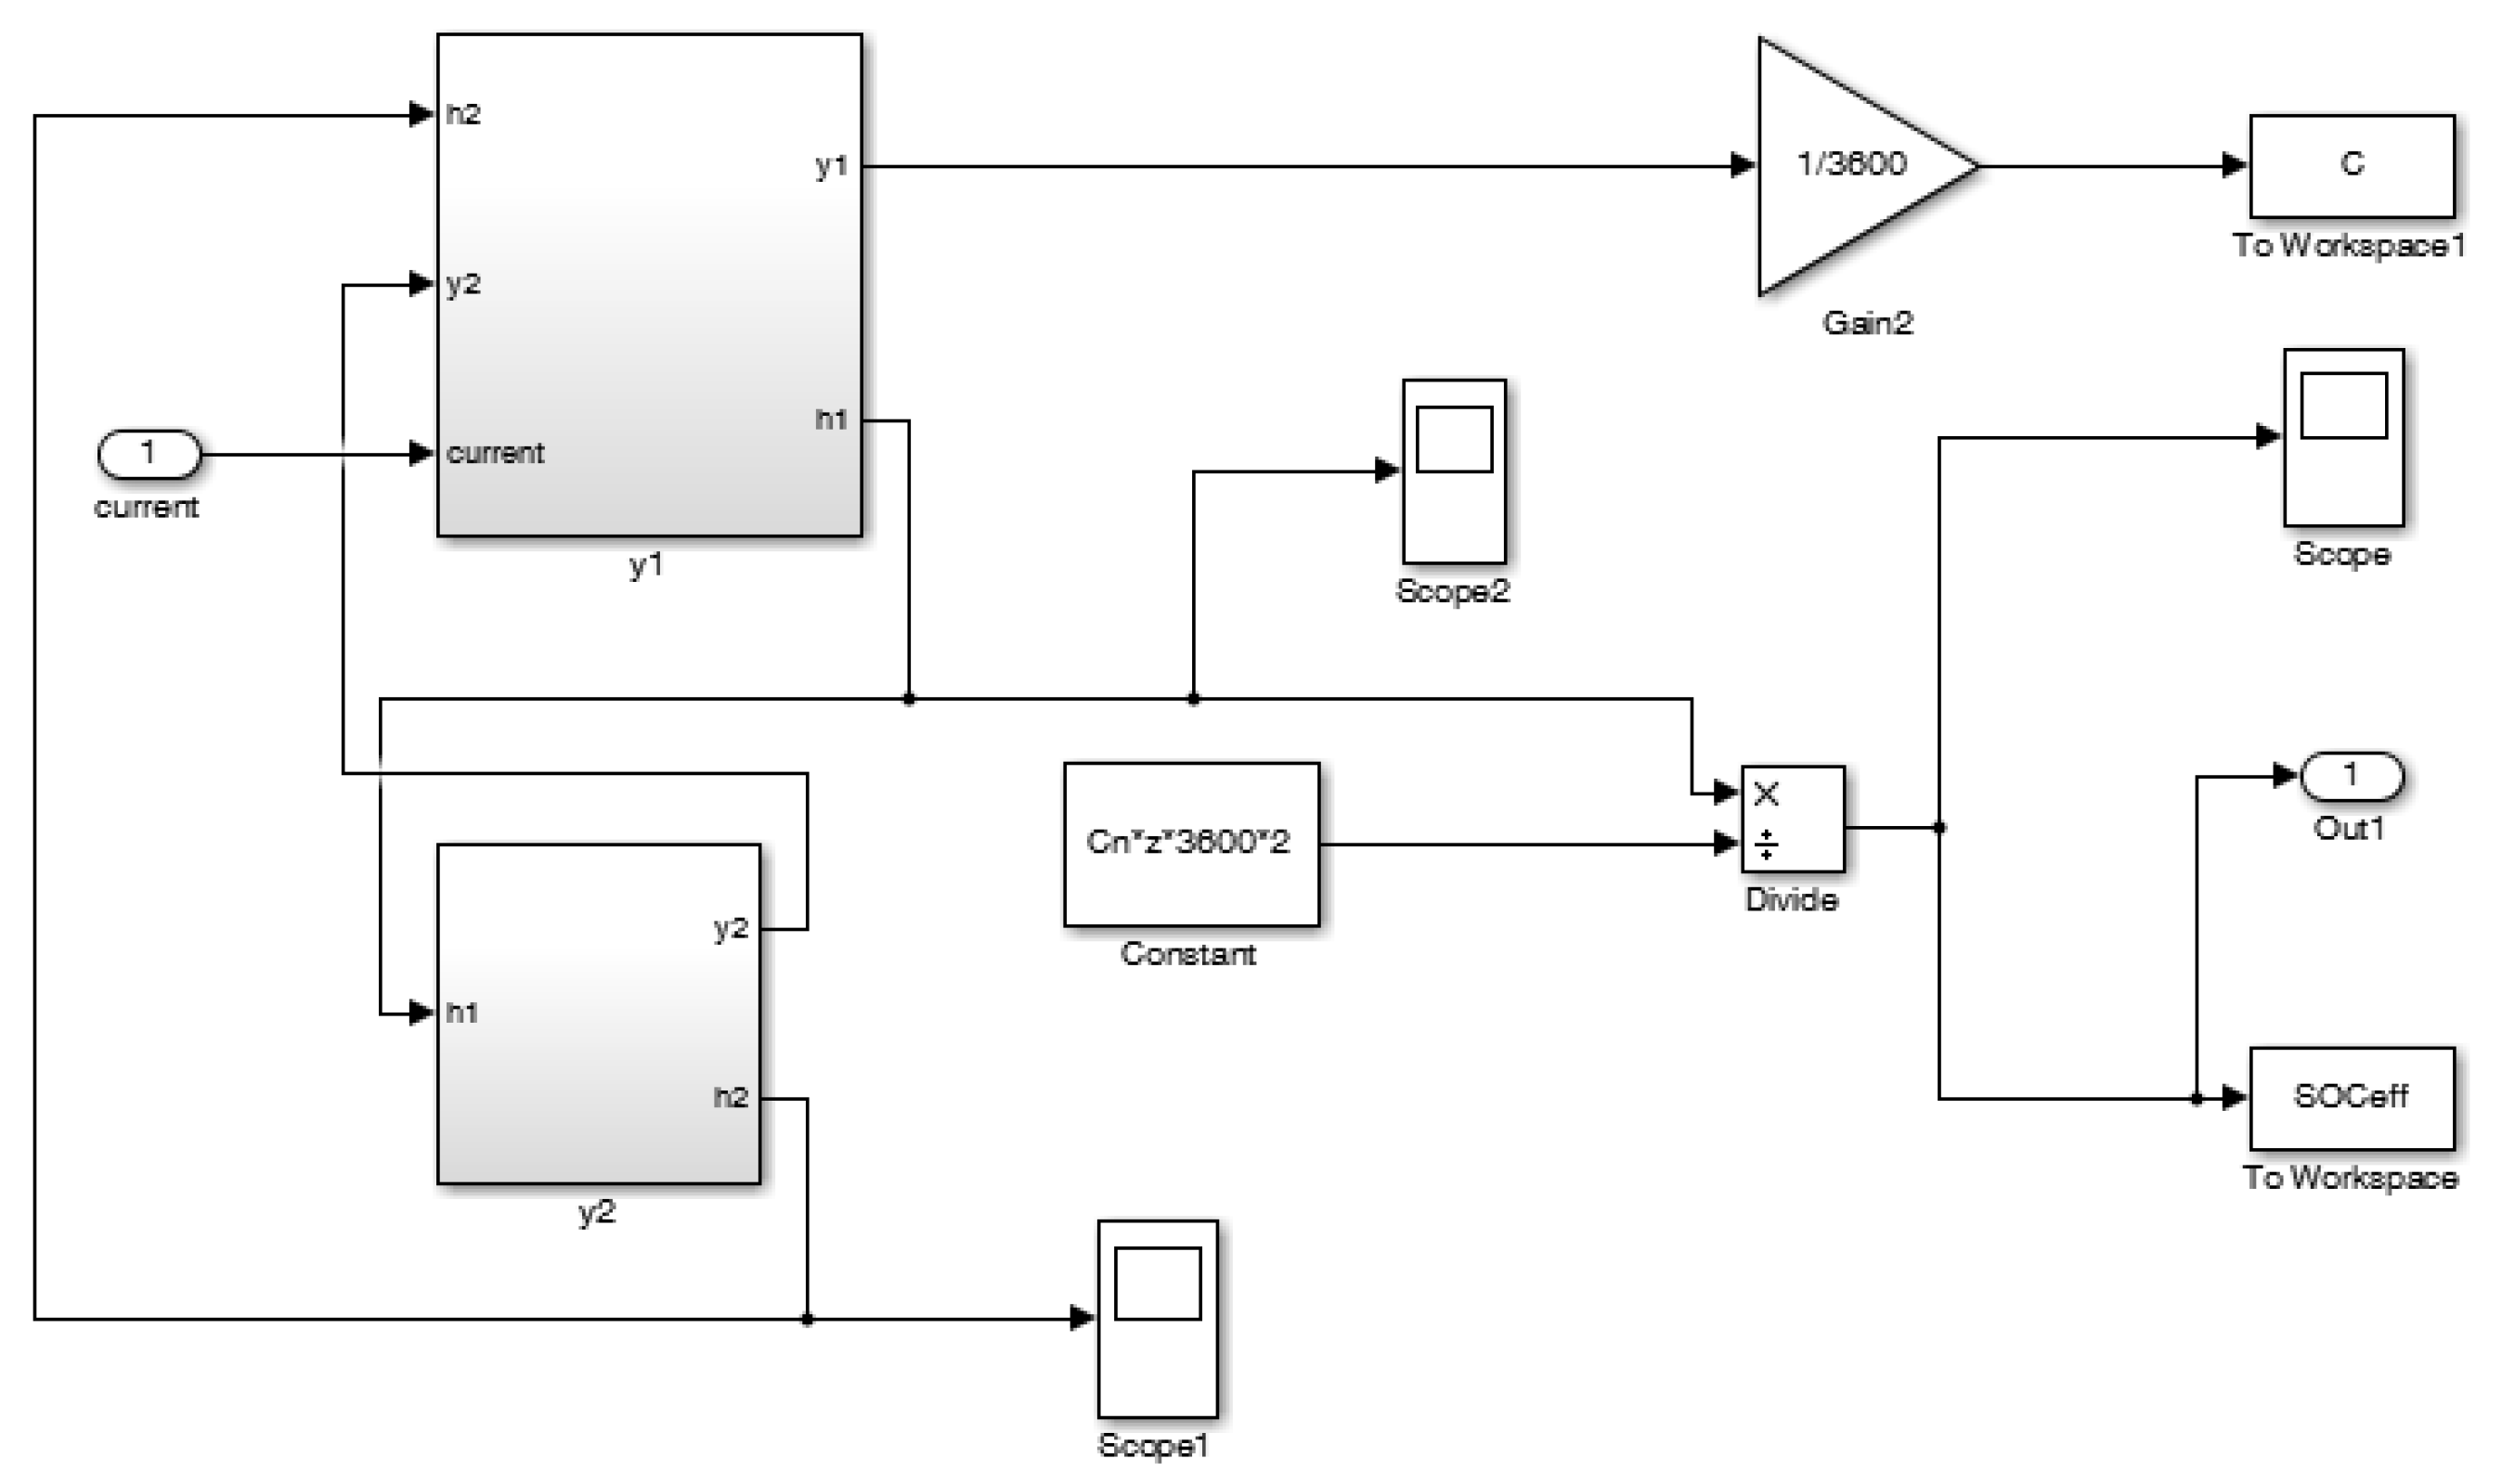
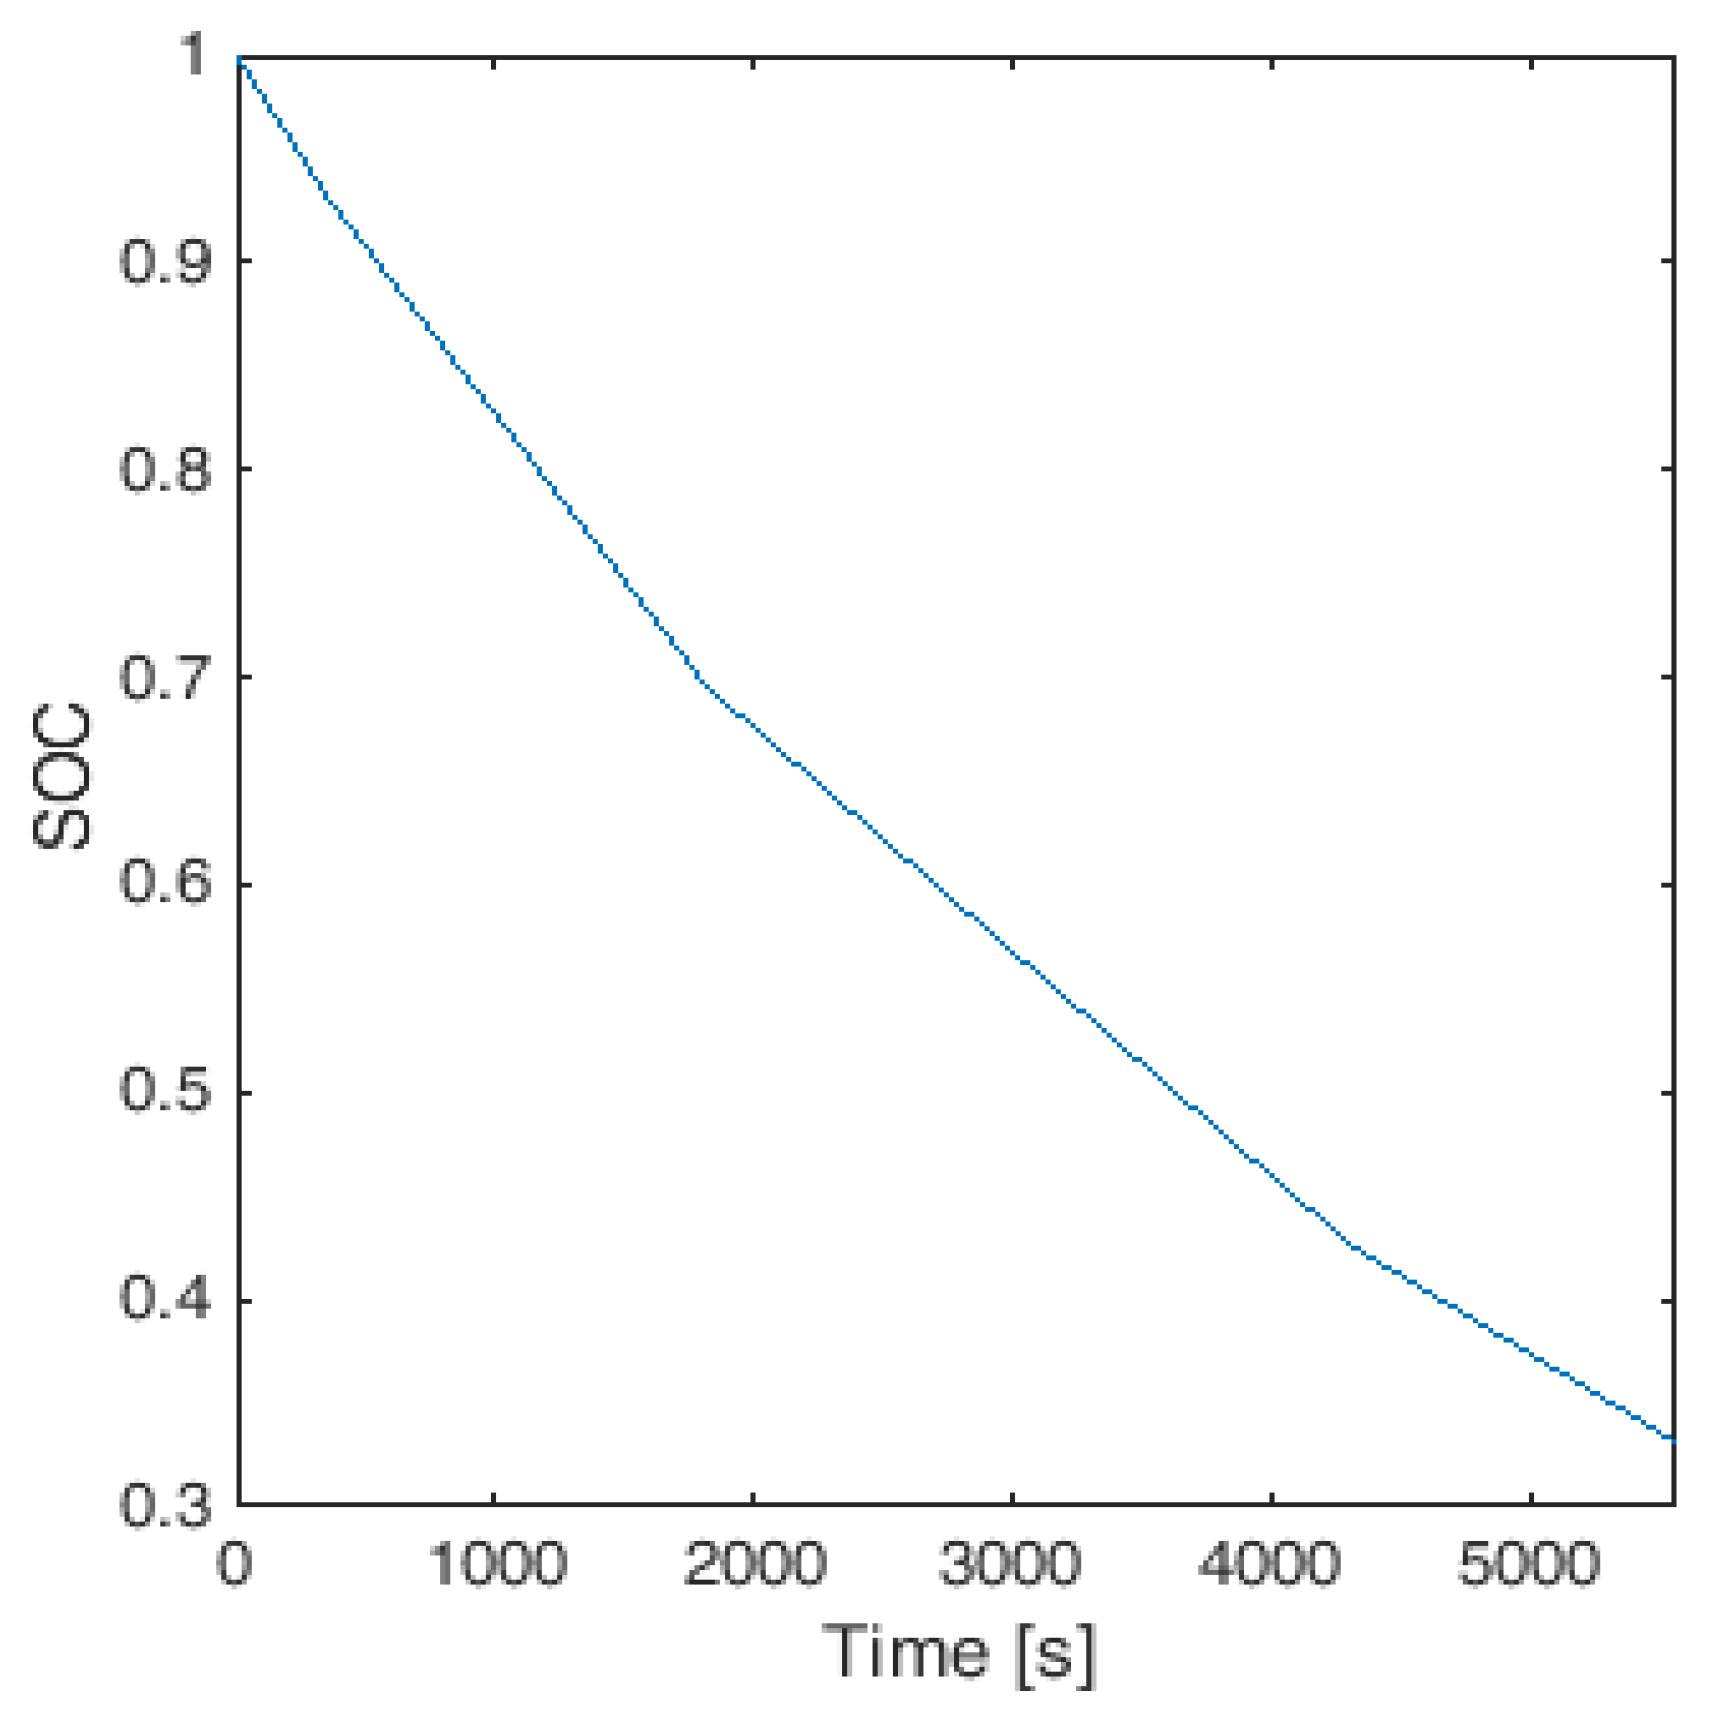
The SOC estimator was subsequently implemented in the MATLAB/Simulink environment by implementing Equations (1) and (2) and starting from the calculated initial conditions.
Figure 10 shows the implemented Simulink model to determine the SOC during the time taken to perform the collection activities.
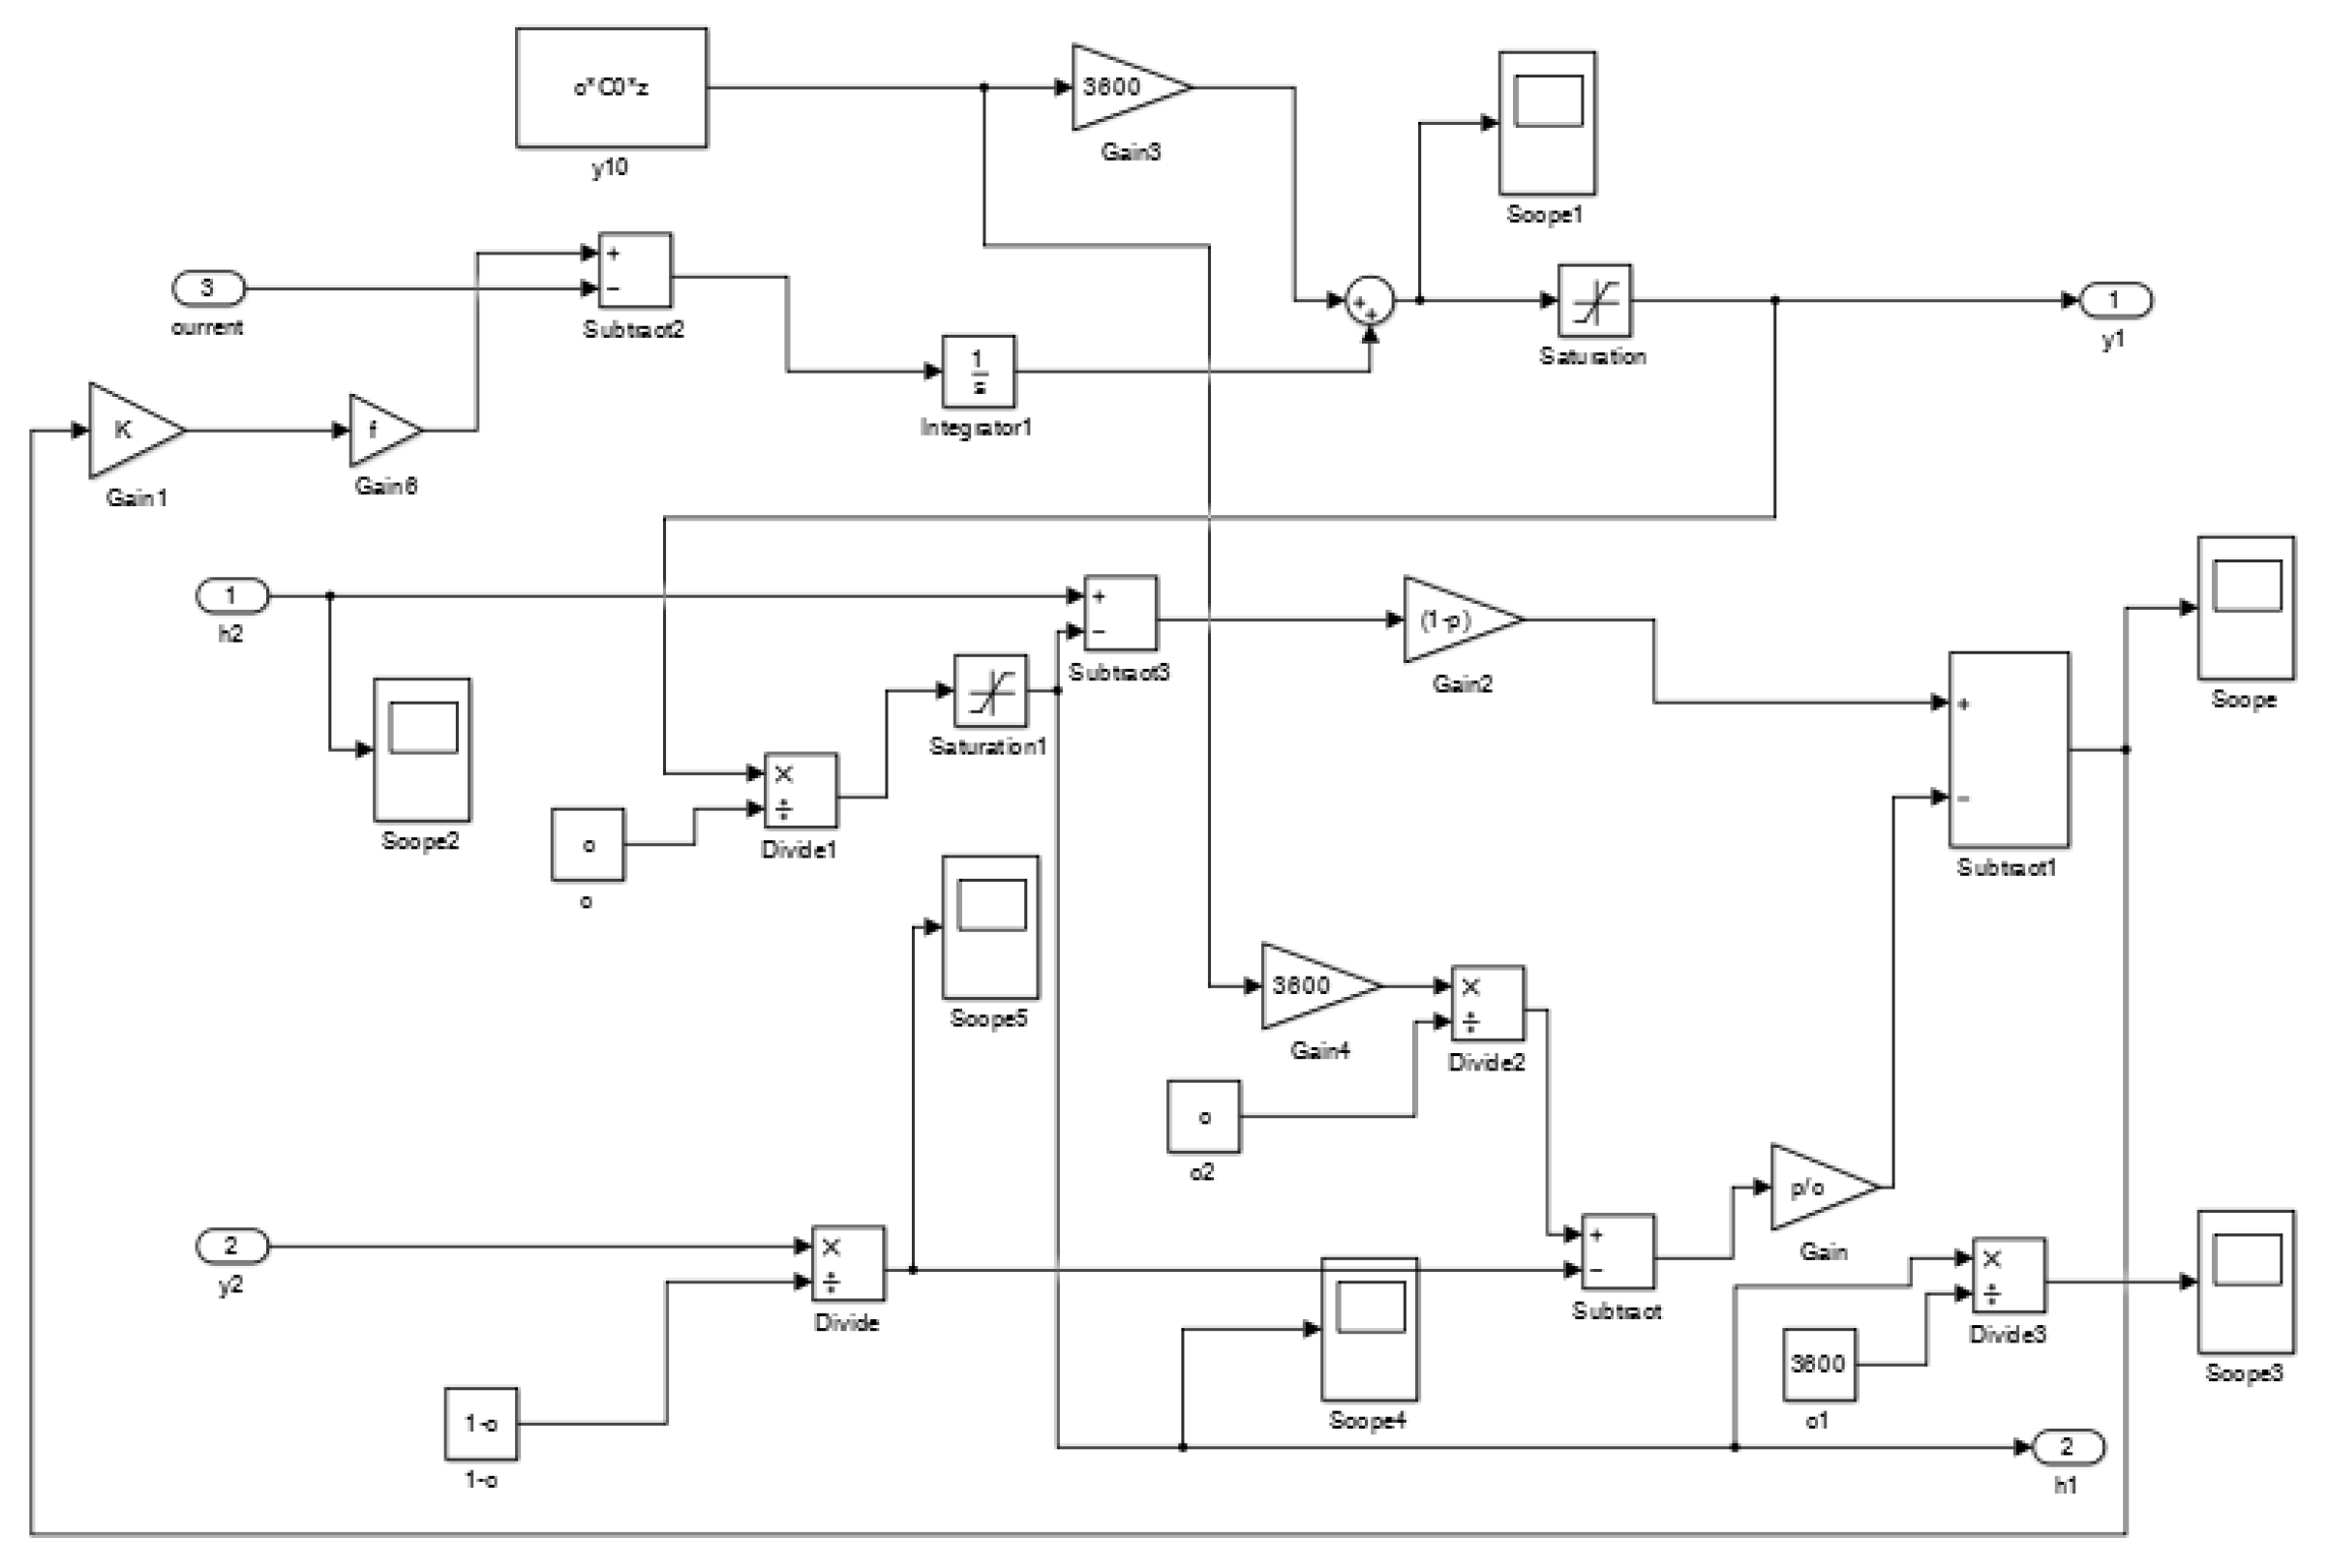
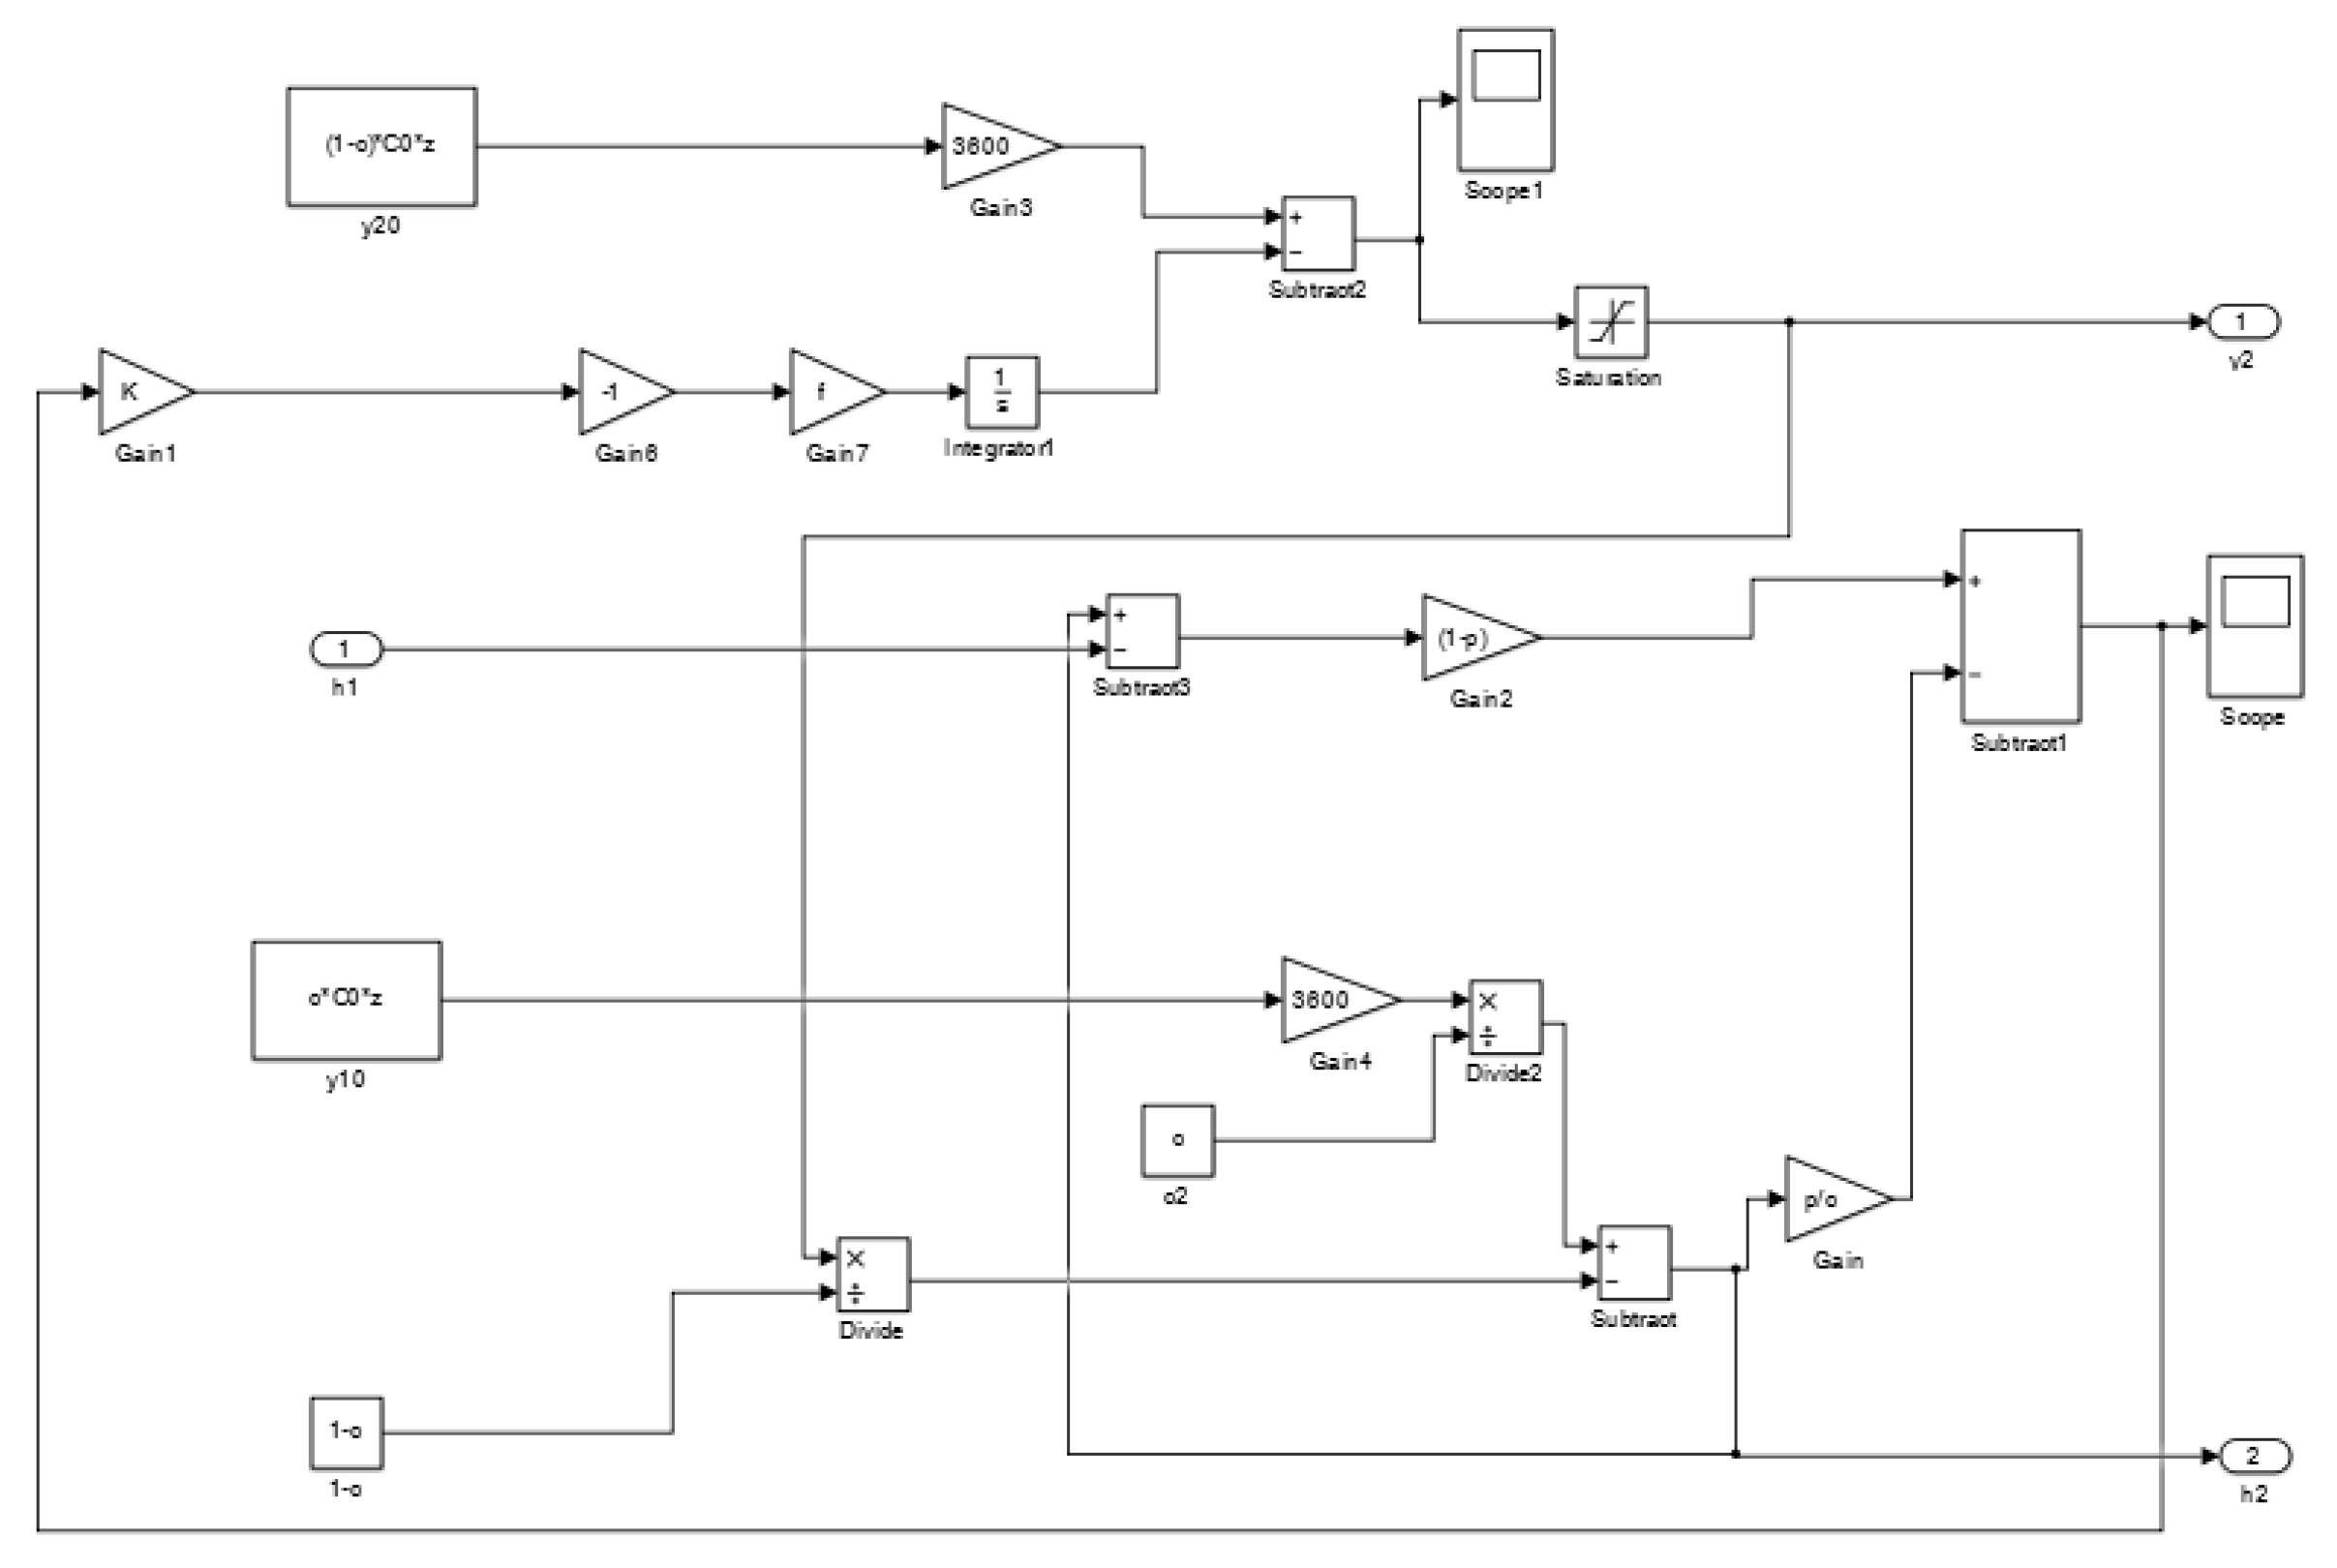
Figure 11 and
Figure 12 show the two Simulink models to determine the variables
and
, respectively.
In this study, the “collection scenario” was defined as the set of garbage collection operations defined in
Section 2.2. Each operating phase was repeated several times corresponding to collection tasks reported in
Table 1.
As shown in
Figure 10, the functioning of the implemented SOC estimator also considers the initial variables of nominal capacity (
) and
.
A thermal model of the battery pack was not considered in this study because thermal measurements were carried out during the 2C-rate discharging test and it was evident that the internal temperature, initially at room temperature (20 °C), increases to 35 °C in little less than 1000 s (around 16 min) of continuous exercise.
None of the tasks undertaken by the compactor truck (
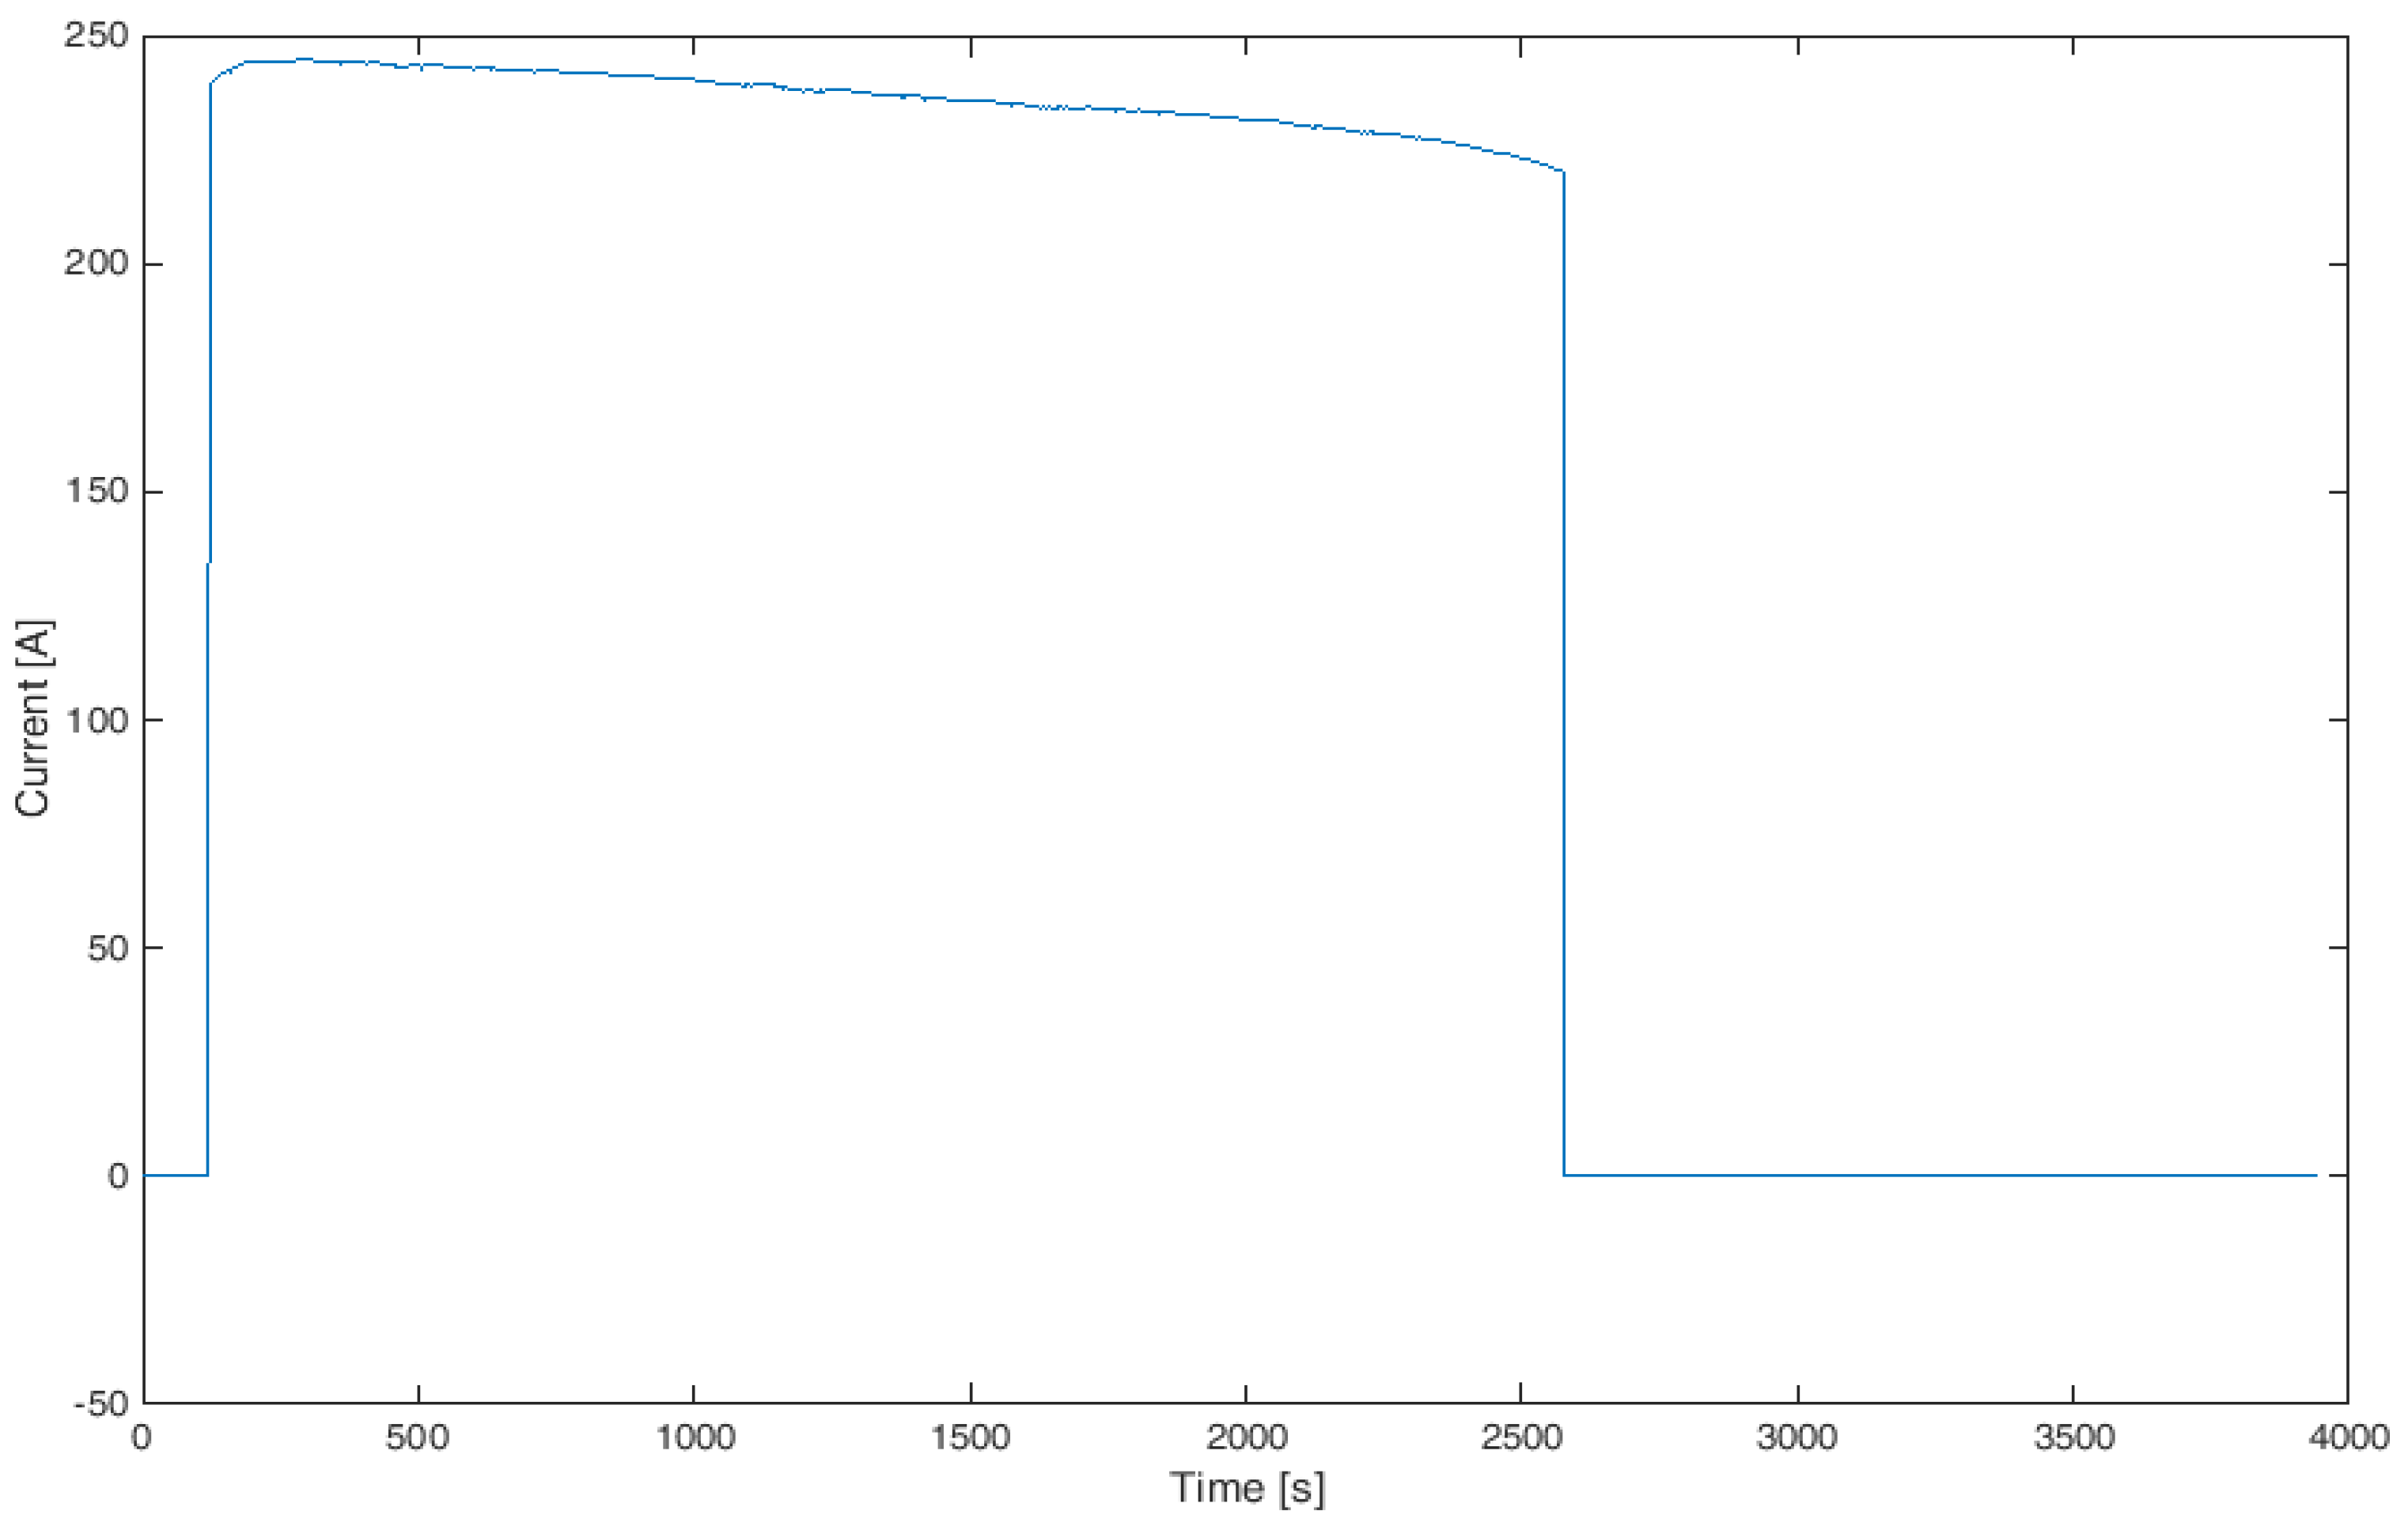
Table 1) can be assimilated to a continuous 2C-rate current discharge from the battery pack for such a long time. In fact, it is made clear in
Section 3 that the current provided by the battery pack, during the working operations of
Table 1, is always below the 1C-rate current discharge, for a short period of time, generally no more than 30 s. Under these operating conditions, the battery pack temperature can be considered to be in the range of the external temperature plus 5 °C.
It is worth noting that the initial external temperature of the battery pack depends on the seasonal weather conditions. The most extreme conditions occur during summer and winter, when the temperature can range in some countries from −20 to 60 °C, thus affecting electro-chemical systems [
31]. This temperature range is compatible with the specifics of the batteries considered in this study.
However, to avoid the occurrence of temperature conditions outside the allowed limits, the battery pack was equipped with cooling fans that are activated when the outer casing temperature of the single cell exceeds 40 °C.
2.3.3. Battery End-of-life Assessment
The SOC estimator was used to provide an estimate of the daily depth of discharge (DOD) of the battery pack. This information can be used to predict the overall lifespan of the battery pack as a function of the number of charging/discharging cycles. As is known from the literature, a battery is often regarded to have reached its end-of-life for vehicle application when one of the battery’s performance values has fallen below 80% of the SOH; that is, the end-of-life is reached when the battery capacity has dropped below 80% of its initial value [
32].
In [
33], the authors conducted a deep study on the ageing of lithium cell batteries undergoing dynamic stress tests (DSTs). The test cycle was defined as: the cell first starts at a specified SOC level and the DST profile is applied repetitively until the specified stop level is reached. The cell was then recharged back to its starting level at the 1 C-rate to finish one test cycle. In [
33], experimental data are reported as a function of the number of cycles, the SOC, the DOD, and the cell temperature. In [
30], the KiBaM is deeply investigated for the same battery cell as that used in the current study, and the values of the main parameters of KiBaM are evaluated under steady state conditions and after several discharge/charge cycles to estimate the ageing of the battery cell.
In the current study, the starting SOC level was 100% and the ending SOC level was determined by the Simulink estimator, that is the DOD. A further simulation, based on the battery model shown in
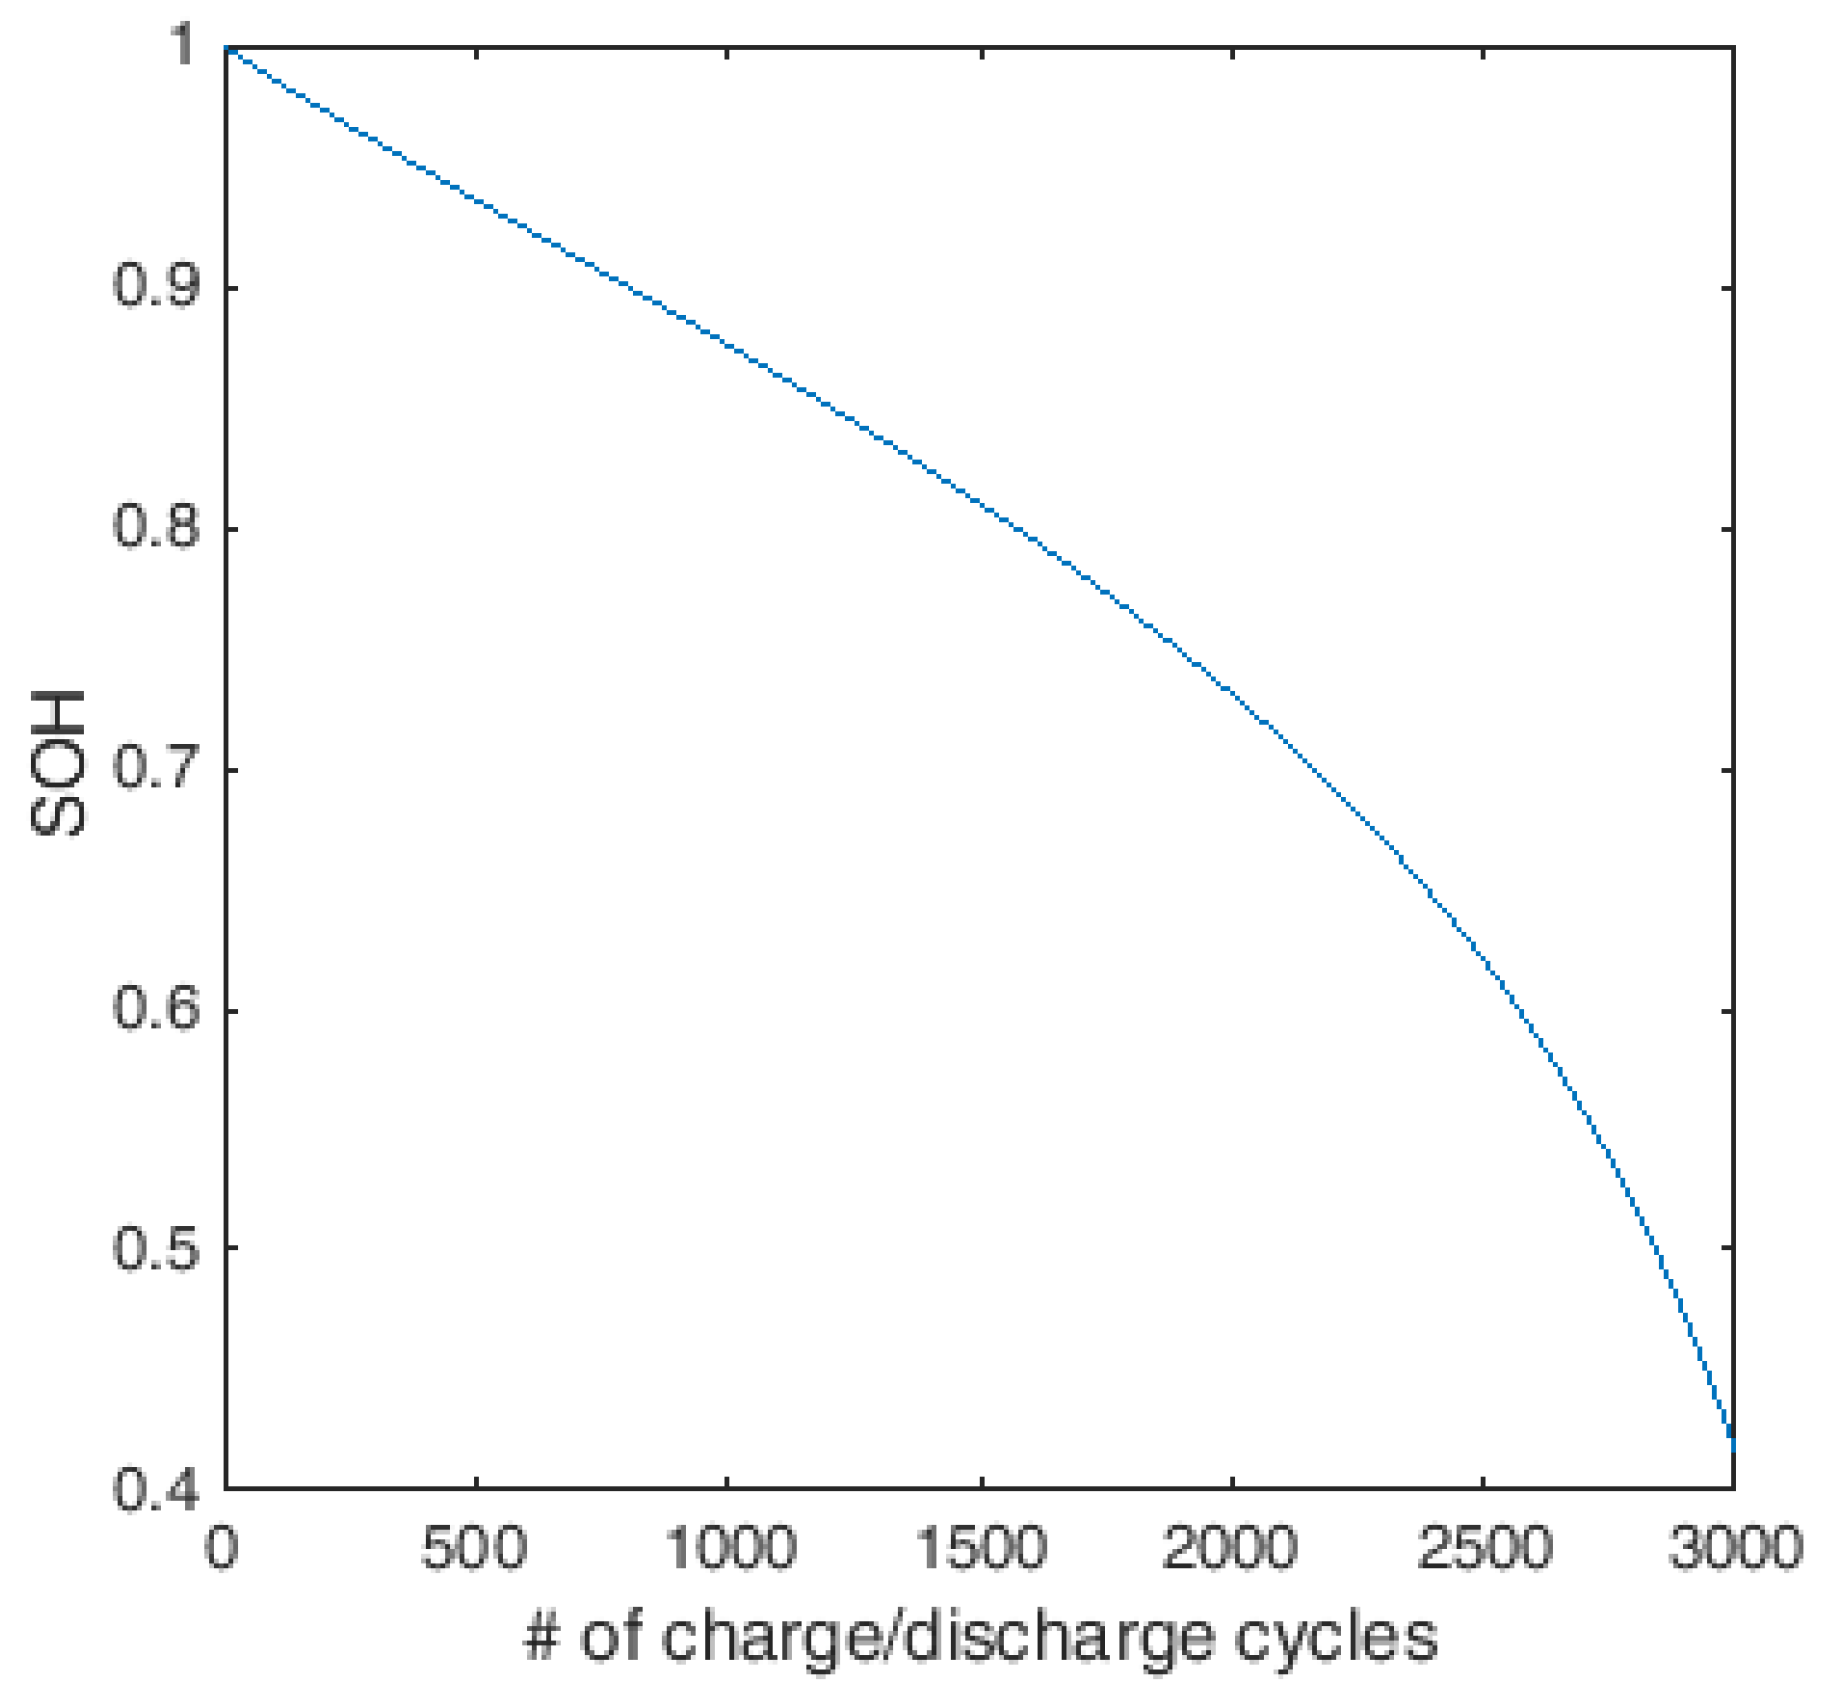
Section 2.3.2, was considered to estimate the number of charge/discharge cycles to achieve 80% of the battery SOH, that is, its end-of-life. To perform this estimate, the model of the SOC estimator was made to cycle the collection scenario 3000 times and, to simulate the progressive aging of the battery pack, the parameters k and c were intentionally varied during each cycle; in this model, k and c are the parameters that account for the ageing of the battery performance. Each cycle corresponds to a collection scenario for the discharging phase and the 1/3 C-rate charge for the charging phase.
The results obtained by the SOH simulation were compared with the results in [
33] to validate the reliability of the simulation. The SOH simulation was finally used to estimate the number of charge/discharge cycles to reach the end-of-life of the battery pack.
2.4. Vehicle Consumption and Carbon Emissions
As described in the
Section 1, the comparison between the two system configurations (e-HPS and ICE-HPS) was aimed to establish the potential cost savings and emissions reduction in an urban context. Cost analysis considers the purchase of the electric power system and its maintenance, in addition to the diesel fuel consumption and the electricity demand for battery recharging. The considered time horizon was taken according to the vehicle lifespan and assumed to be 12 years [
34]. Furthermore, it was assumed that the vehicle was used 5 days per week, for a total of 260 collection scenarios per year.
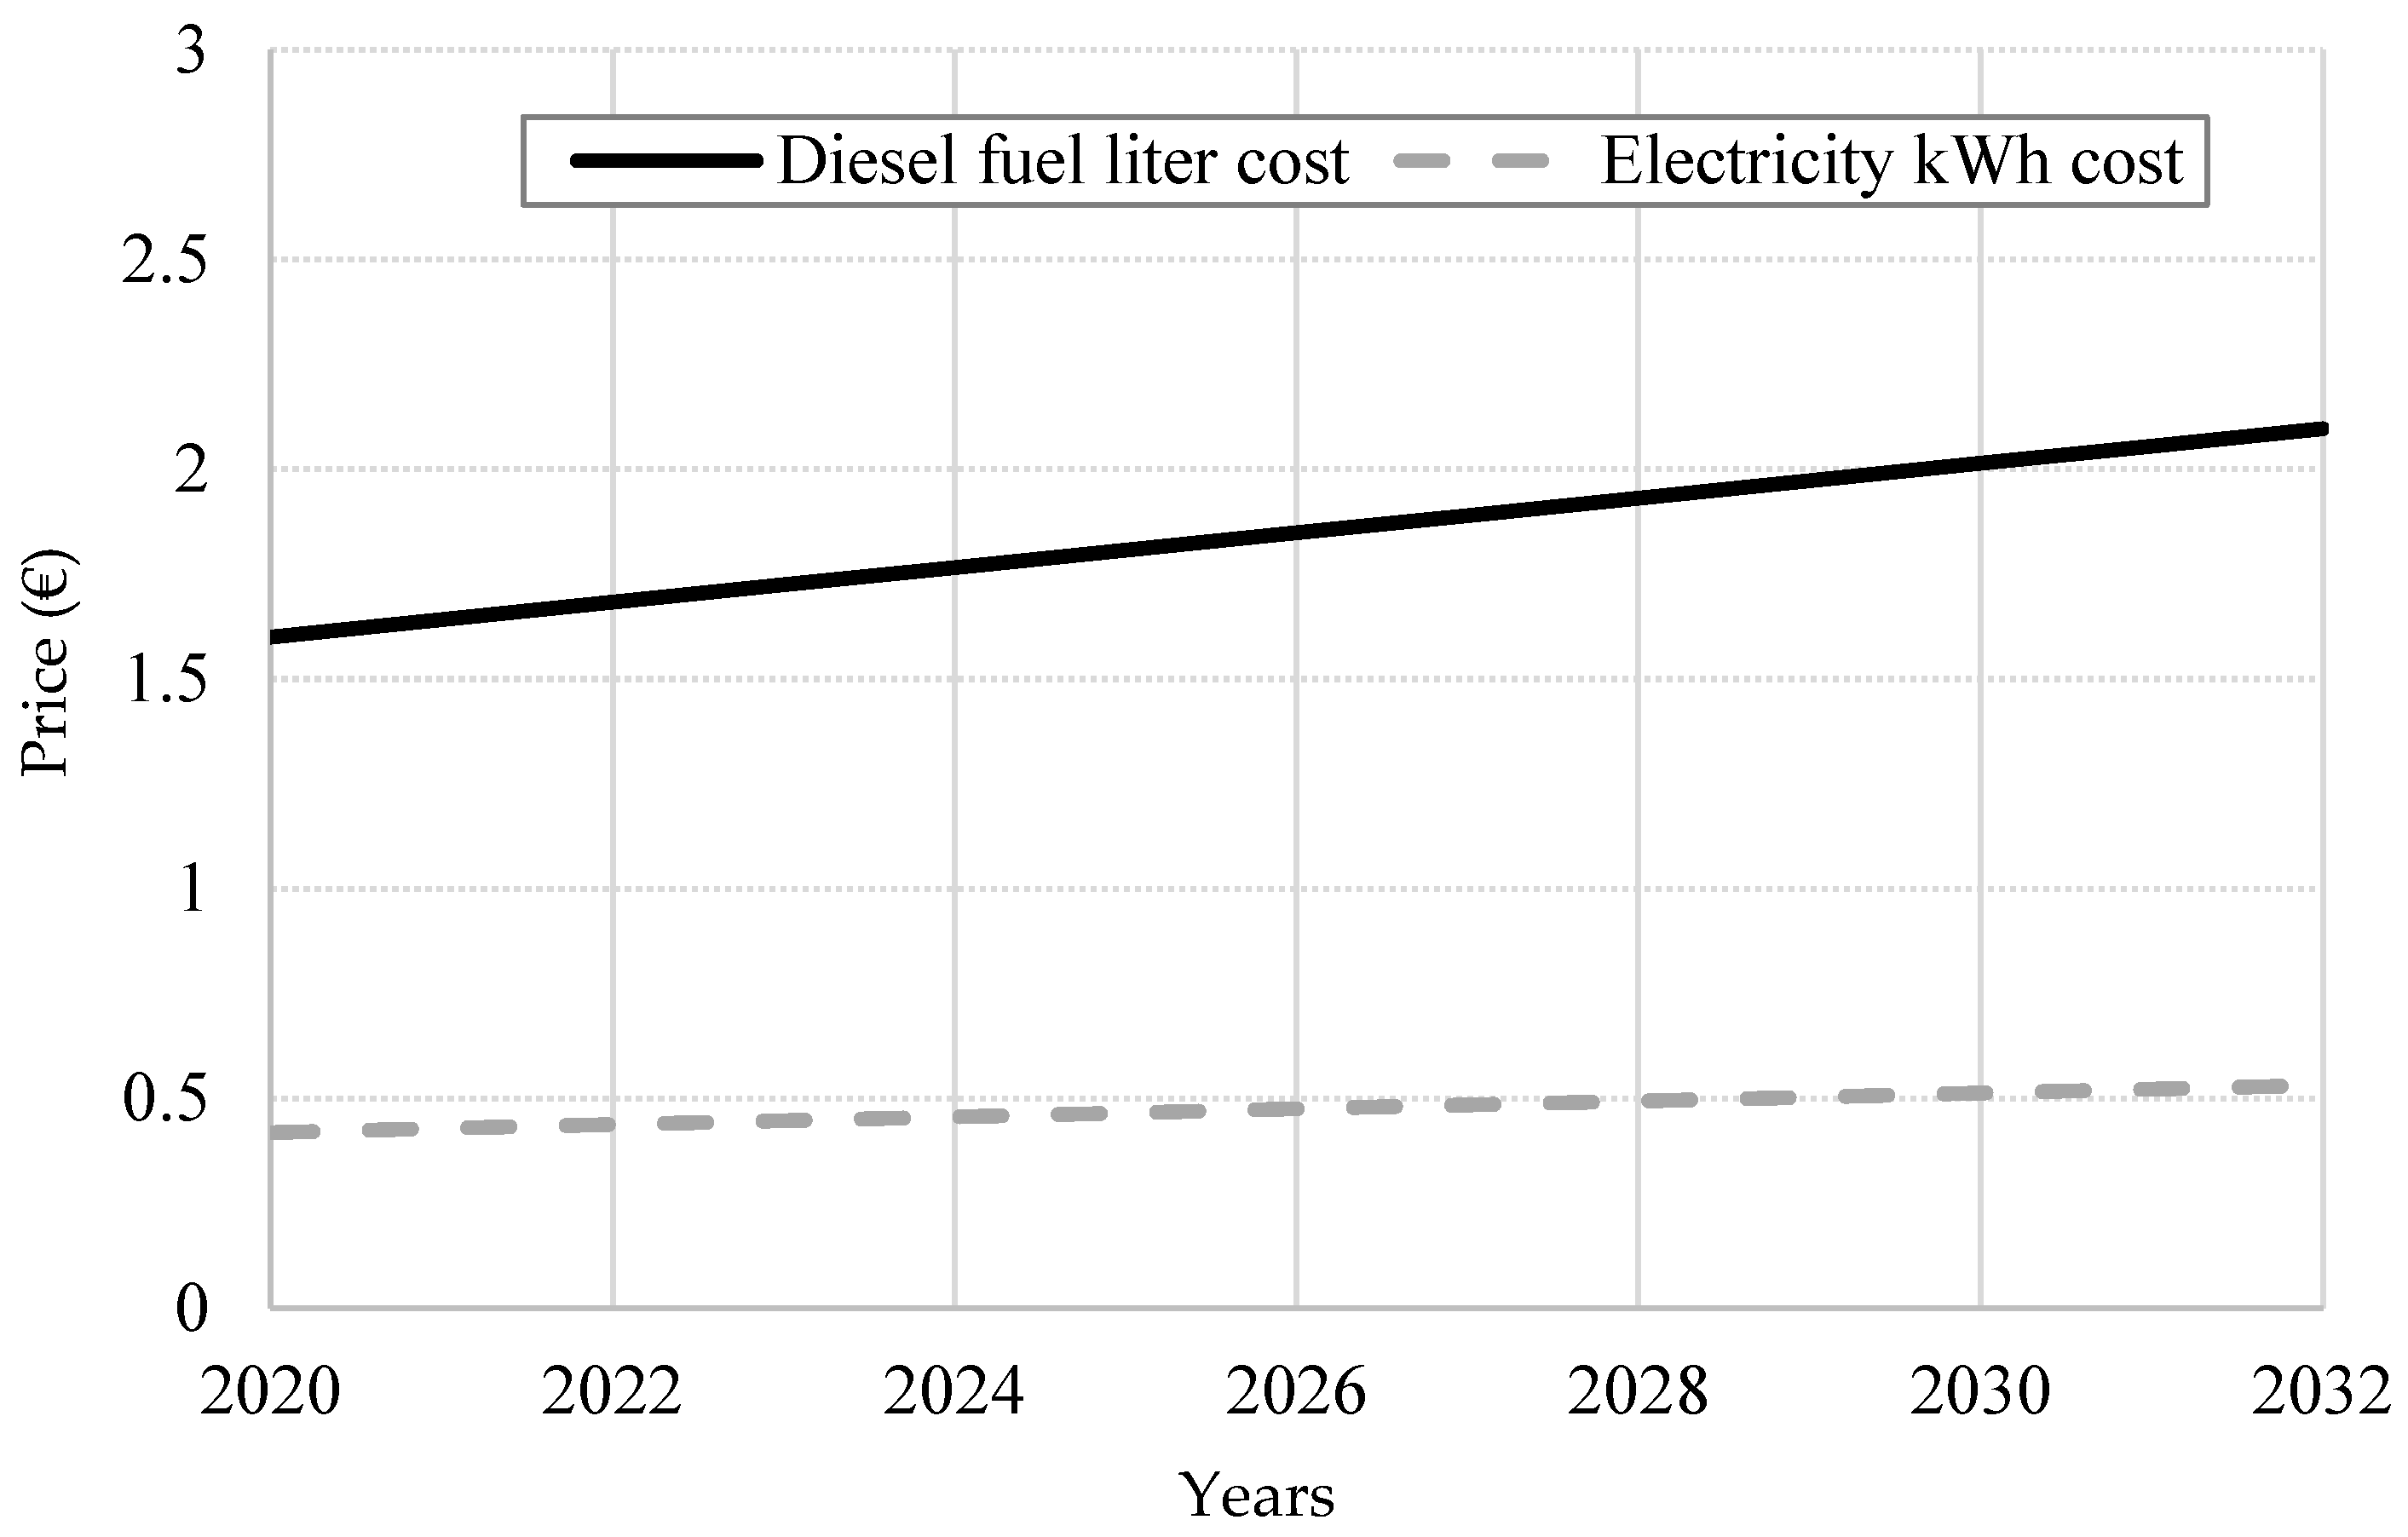
For the ICE-HPS, costs consider only the diesel fuel consumption required for garbage collection operations within the assumed vehicle lifespan and, for this time horizon, fuel was forecasted using a regression analysis based on a 5-year moving average of the diesel fuel price in Italy. The historical time series for the average diesel fuel price was obtained from the official website of the Italian Ministry of Economic Development [
35]. For the idling phase, the fuel consumption analysis was based on the brake-specific fuel consumption (BSFC) of the 3.0-litre TDI Euro 5 engine developed by Volkswagen group [
36,
37]. This engine, which has the same displacement and comparable power, was considered instead of the original Mitsubishi Canter 4P10T6 Euro 5 engine that is equipped in the considered compactor truck, for which no official engine maps appear to be available in the literature or technical reports.
For the e-HPS, the price of electricity in Italy was estimated based on historical series available in the ARERA database [
38] and the future price was forecasted using a regression analysis of a 2-year moving average.
emissions are directly related to the amount of fuel consumed in the combustion engine, for which it is possible to assume an emission factor of 2.668 kg
per liter [
39].
To allow comparison,
emissions were computed for both ICE-HPS and e-HPS considering the entire path traveled by the compactor truck in a typical workday. In this study, we assumed an average daily traveled distance of 10 km in an urban context and fuel consumption, for the traveling phase, of 0.335 L/km [
40,
41]. It should be noted that, for the e-HPS, only the traveling phase produces
emissions, being the garbage collection activity in the idling phase, then, full electric.
4. Discussion
The e-HPS represents an innovative option for the retrofit of the ICE-HPS in conventional industrial trucks. The practical realization of the e-HPS considered the perfect interfacing of the four subsystems: cabin-control unit, electric motor/converter/hydraulic pump, battery pack/battery management system (BMS), and battery charger. The chosen components are easily available and ensure a high efficiency system. The Arduino-nano was revealed to be a reliable control unit and, through the Can-Bus communication protocol, allows all of the devices to work together in an efficient and safe way. The realized e-HPS is made of affordable components and their connection layout is descriptive at a practical level, reproducible, simple, and effective.
The electric power measurements quantified the daily power consumption, allowing estimation, using the KiBaM model, of the SOC of the battery pack after the collection scenario time. The results of the KiBaM model were extended to forecast the end-of-life time of the battery pack by analyzing the corresponding SOH. The obtained results are in accordance with the performance of the lithium-ion battery technology presented in the related literature.
Regarding the battery pack, this study indicates that the number of battery cells should be as low as possible, while maintaining a good safety margin of the SOC, that is, generally over 20% [
48]. In this study, 1680 cells resulted in 30% of the SOC remaining after the collection scenario activities, ensuring the battery’s end-of-life of 1500 charge/discharge cycles and only two battery pack replacements within the truck lifespan.
The economic analysis highlighted that, although the e-HPS requires an initial cost to be realized, the resulting fuel savings allow the investor to save about € 65,000 over 12 years. Furthermore, results show that the total CO2 emissions for the e-HPS are about 80% lower than those for the ICE-HPS. This last point leads to two reflections:
In general, CO2 emissions are associated mainly with the idling phase rather than with the traveling phase.
Equipping the work truck with the proposed e-HPS could be an effective option to reduce CO2 emissions and fuel consumption rather than realizing a full electric compactor truck, including an electric powertrain for traction, particularly during the transition phase from thermal to electric vehicles, when a high number of thermal work trucks are already built and registered.
Furthermore, conversely to the ICE-HPS, the e-HPS would fit perfectly with two technologies:
the consolidated start-stop system, now present in almost all commercial and work vehicles;
the emerging vehicle-to-grid (V2G) system that considers vehicles, equipped with a battery pack, as grid storage units to sell demand response services by either returning electricity to the grid or by favoring their charging rate.
5. Conclusions
This work presented the preliminary realization of a proposed e-HPS that drives the lifting of the dumpster and garbage compaction of a waste compactor truck, as opposed to the traditional ICE-HPS for similar applications.
The power consumption during the collection scenario cycle was firstly defined in the case of the ICE-HPS and later experimentally measured in the case of the proposed e-HPS. The different components of the e-HPS were described in detail and the battery pack was modelled using the KiBaM, implemented in the MATLAB/Simulink environment. The KiBaM was firstly used to estimate the SOC of the battery pack during the collection scenario cycle and later to evaluate the trend of the battery SOH, as a function of the number of charge/discharge cycles. The end-of-life of the battery pack was assessed to perform the economic feasibility of the proposed e-HPS during the whole lifespan of the compactor truck, which was assumed to be 12 years.
The results highlighted the implementation mode to build this electrical system (e-HPS), and both the electric power measurements and the KiBaM simulations demonstrated the reliability of the realized system. The economic analysis showed the convenience of the e-HPS, both in terms of emission reductions and fuel cost savings, compared to the traditional ICE-HPS.
The limitations of this study could include, from an energy perspective, the lack of implementation of a kinetic energy recovery system (KERS) on the truck. However, from an economic perspective, the cost evaluation was realistic based on a prototype scenario. In fact, the installation costs of the e-HPS, which are now dominant compared to the costs of the devices, will be reduced according to economies of scale.
Future investigations could include implementing the KERS and equipping the e-HPS with a 48 V alternator, coupled to the ICE, to partially recharge the battery pack during the traveling phase.
The insights from this study could be extended to a broader range of vehicles that use similar hybrid systems, especially for vehicles that have a ratio between the idling phase and the traveling phase greater than one, such as ICE forklifts and dump trucks, thus laying the foundations for more economical and greener logistic operations.

 ,
, 


