
Modeling of Voltage Fluctuations Generated by Arc Furnaces

Faculty of Transport, Electrical Engineering and Computer Science, Pulaski University of Technology and Humanities, Malczewskiego 29, 26-600 Radom, Poland
Appl. Sci. 2021, 11(7), 3056; https://0-doi-org.brum.beds.ac.uk/10.3390/app11073056
Submission received: 17 January 2021
/
Revised: 12 March 2021
/
Accepted: 23 March 2021
/
Published: 29 March 2021
(This article belongs to the Special Issue Mathematical Modelling, Control, and Stability Studies of Electrical Power Systems)
Abstract
:Arc furnaces can be classified as electricity receivers, which largely affect the quality of electricity in the power system. Voltage fluctuations are the main disturbance generated by arc furnaces. The effects of voltage fluctuations include the phenomenon of flickering light. Apart from voltage fluctuations, arc devices, to a lesser extent, are the source of current and voltage asymmetry, voltage curve distortion, and voltage dips. The main purpose of theoretical considerations is to assess the voltage fluctuations generated by arc furnaces. The article presents a model of an arc device in which the arc has been replaced by a voltage whose value depends on the arc length. It presents also the results of the analysis of measurements of the parameters characterizing voltage fluctuations and flicker indicators.
1. Introduction
The issues of voltage fluctuations in power systems and their mathematical description are presented, among others, in the following publications [1,2,3,4,5,6,7]. The voltage fluctuations generated mainly by arc furnaces have been published in [8,9,10,11,12,13,14,15,16]. The significant contribution of the UIE (International Union for Electricity) to the research on voltage fluctuations as a source of the flicker phenomenon should also be emphasized. The effect of many years of research was the development of the concept and implementation for production of a flickermeter [17].
Voltage fluctuations are defined according to the standard [18] as cyclic changes of the voltage envelope or a series of random changes of the root mean square (RMS) voltage around the nominal value.
Voltage changes from UA to UB determine fluctuations:
or are expressed as a percentage of the supply voltage:
Arc furnaces are devices that use an electric arc between electrodes and the charge to melt scrap. Arc devices are among the restless receivers of electricity. Due to the unstable operation of the arc furnaces, rapid changes in power consumption when melting scrap are experienced.
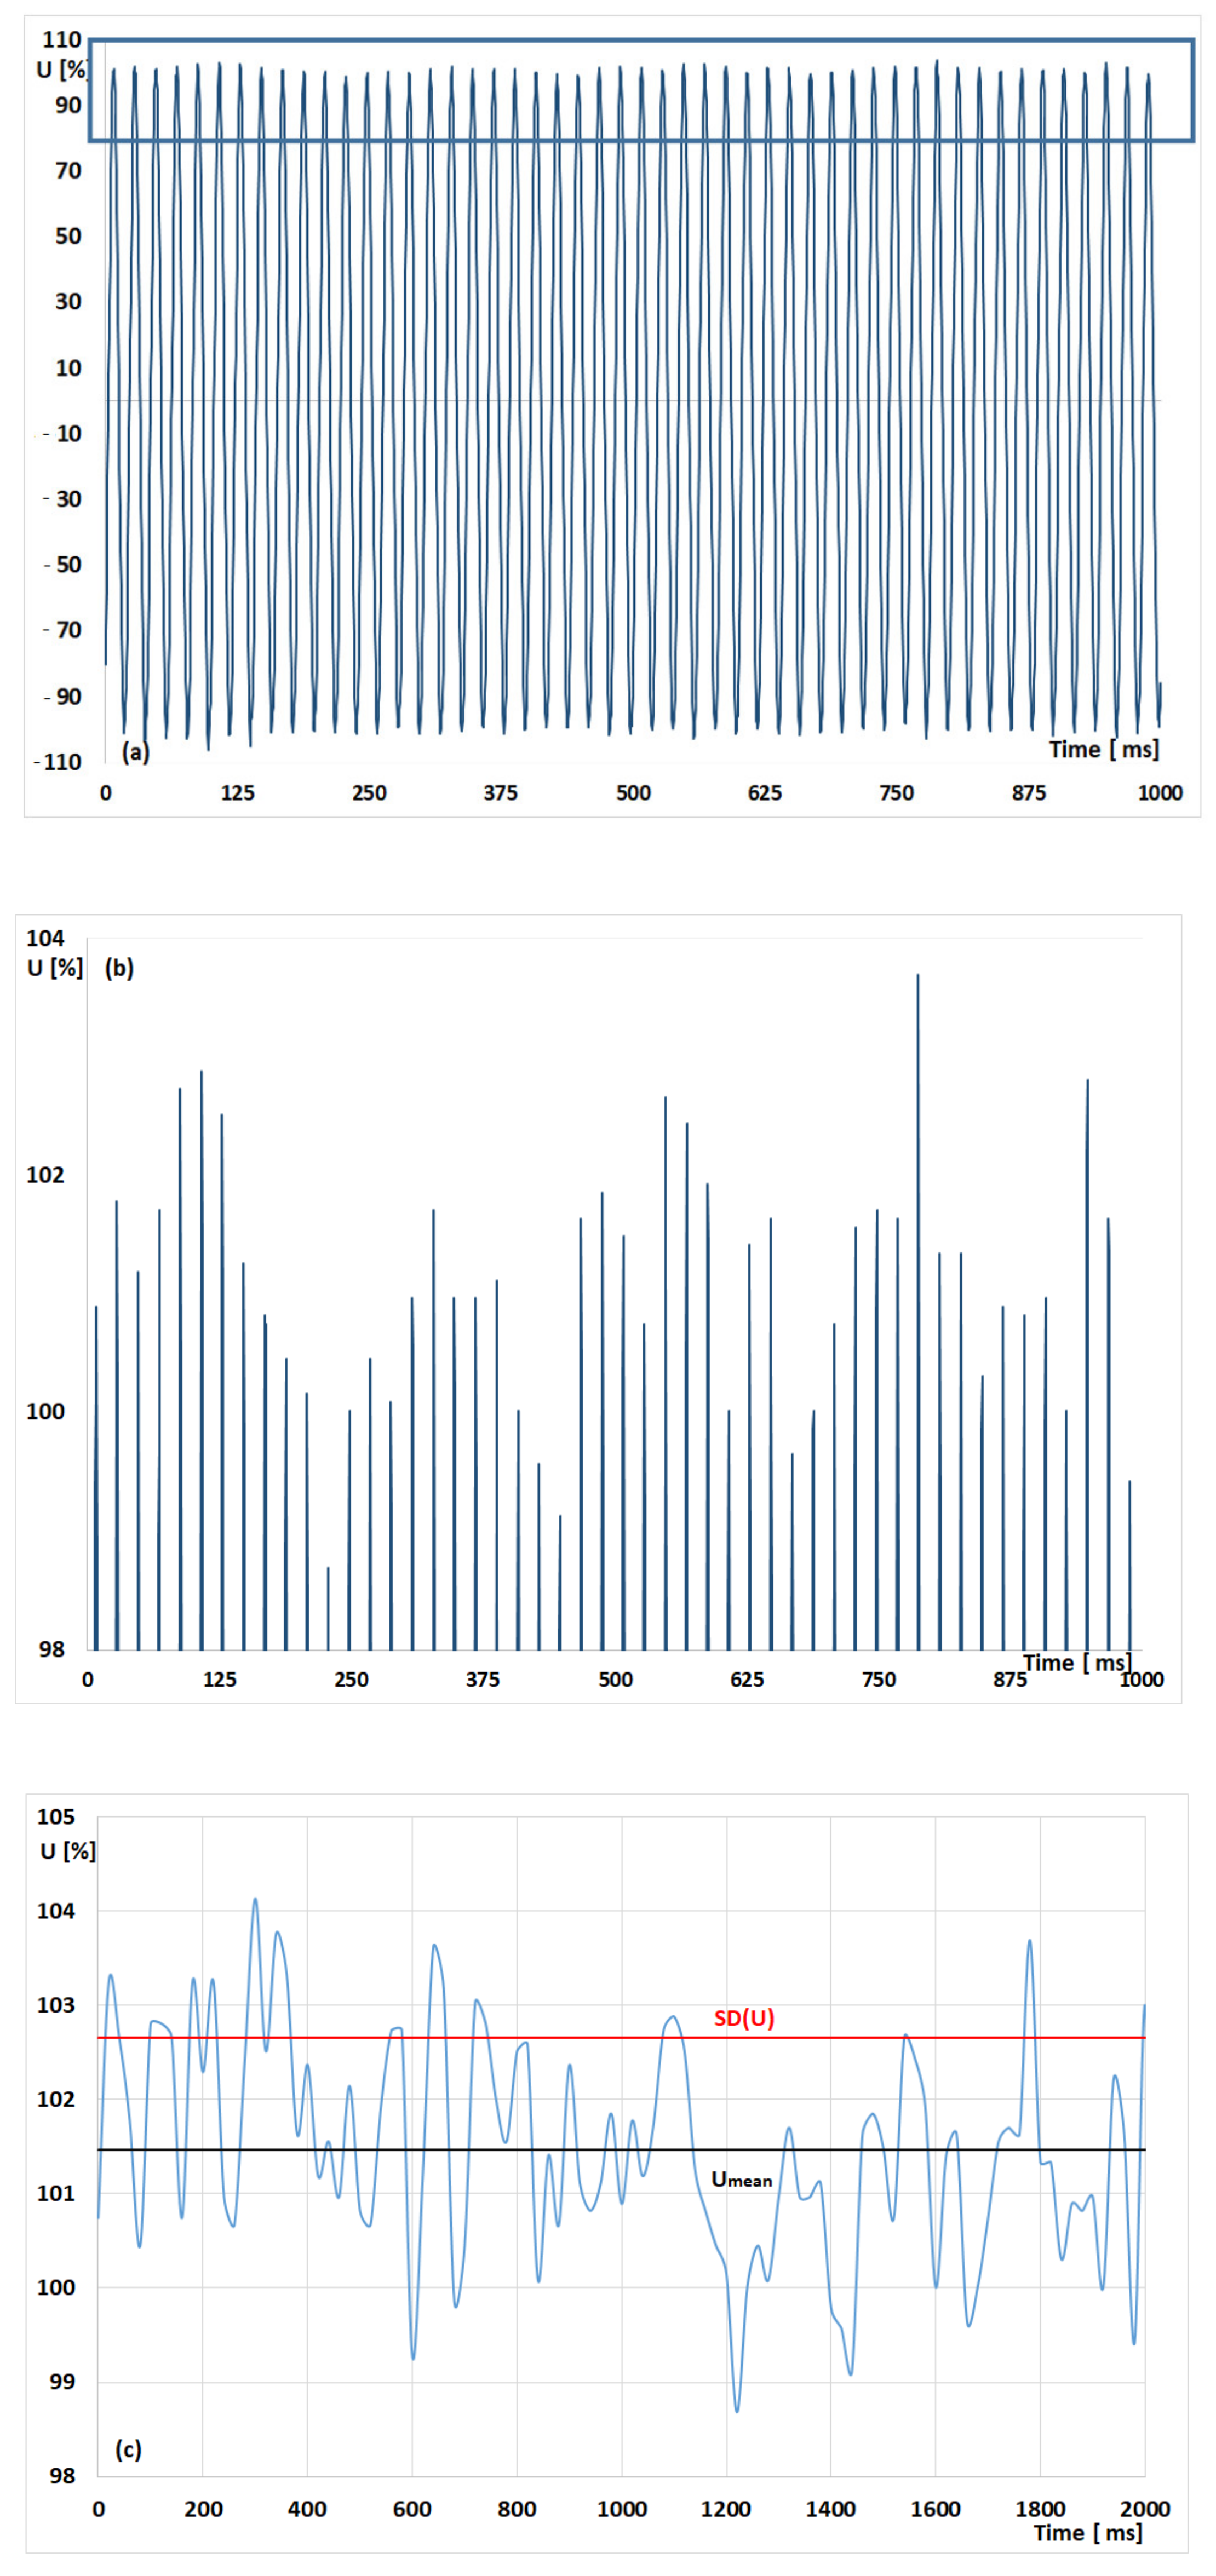
Very fast changes in the value of the furnace currents cause equally rapid voltage fluctuations in the supply network. In the case of arc furnaces, voltage changes (fluctuations) range from a few to several changes per second. Figure 1, Figure 2 and Figure 3 show the voltage waveforms recorded by the author in the networks supplying arc furnaces. Measurements were made at different short-circuit powers of the mains supplying arc furnaces (steel mills), during the various stages of smelting in the arc furnace, and at a different number of working parallel arc furnaces.
Figure 1a shows the voltage oscillogram recorded in the supply network of arc furnaces. Figure 1b in magnification shows the maximum values of the oscillogram. You can see the change of the voltage oscillogram envelope. Figure 1c presents changes Urms voltage. Urms voltage was calculated in 10 ms intervals.
Both the value of the voltage curve (oscillogram) and the RMS voltage Urms are presented in relation to the rated voltage of Equation (3). The rated voltage of the network was adopted as Un = 100%.
For example, the RMS value was converted to the form expressed as a percentage:
The advantage of such a solution is the unification of the analysis of measurement results and model tests at various voltage levels.
In publication [19], standard deviation of the voltage SD(U) was used as a reliable source for the evaluation of randomly changing voltage fluctuations:
where:
SD(U)—standard deviation of voltage
Ui—value for the i-th rms voltage sample
Umean—RMS voltage mean for n samples
n—number of voltage samples
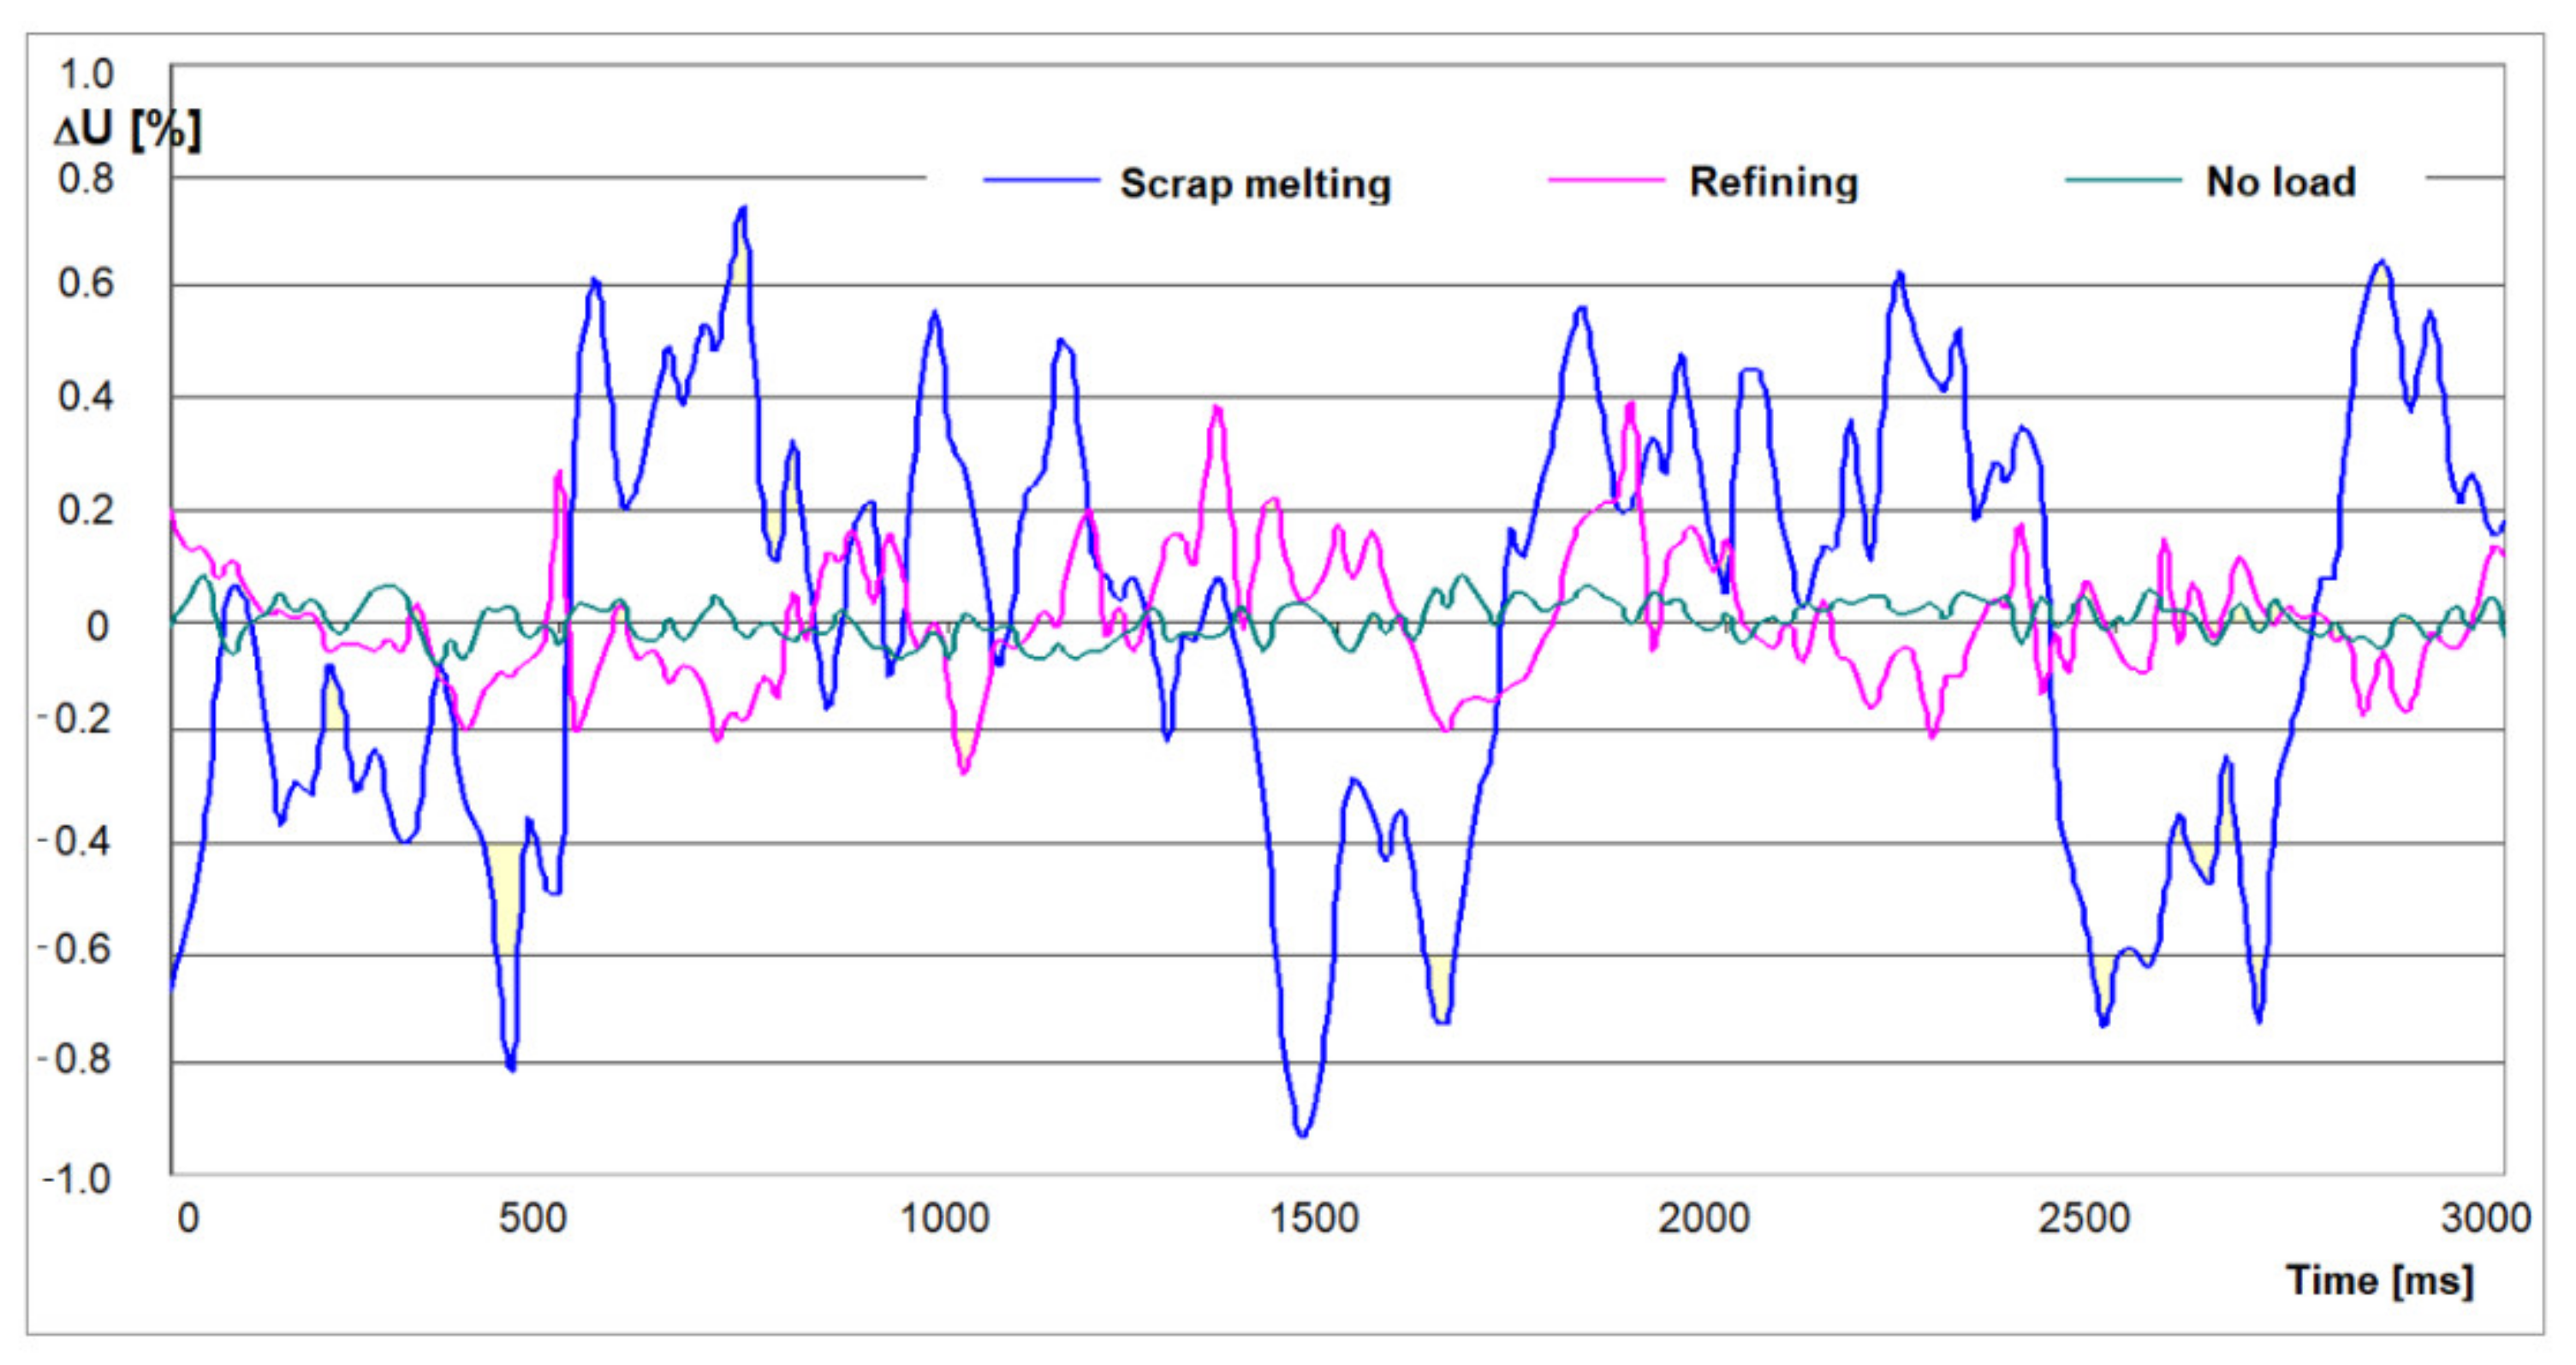
In the case of arc furnaces, the range of changes in voltage fluctuations changes in individual phases of the smelting. The greatest fluctuations occur during the initial scrap melting phase. The arc furnace transformer works from an idle state with the electrodes raised to a short circuit when the electrodes are in contact with the charge. With the melting of the scrap under the electrodes, the arc stabilizes. This reduces the amplitudes of voltage fluctuations.
The amplitude of voltage fluctuations ΔU is presented as a percentage of the nominal voltage of the network—Figure 2.
Due to the non-linear nature of the electric arc, it is very difficult to estimate the increase in voltage fluctuations with arc devices operating in parallel.
Electric arc furnaces are classified as non-linear loads of electricity. Therefore, the superposition method cannot be used to calculate voltage fluctuations in the operation of several arc devices.
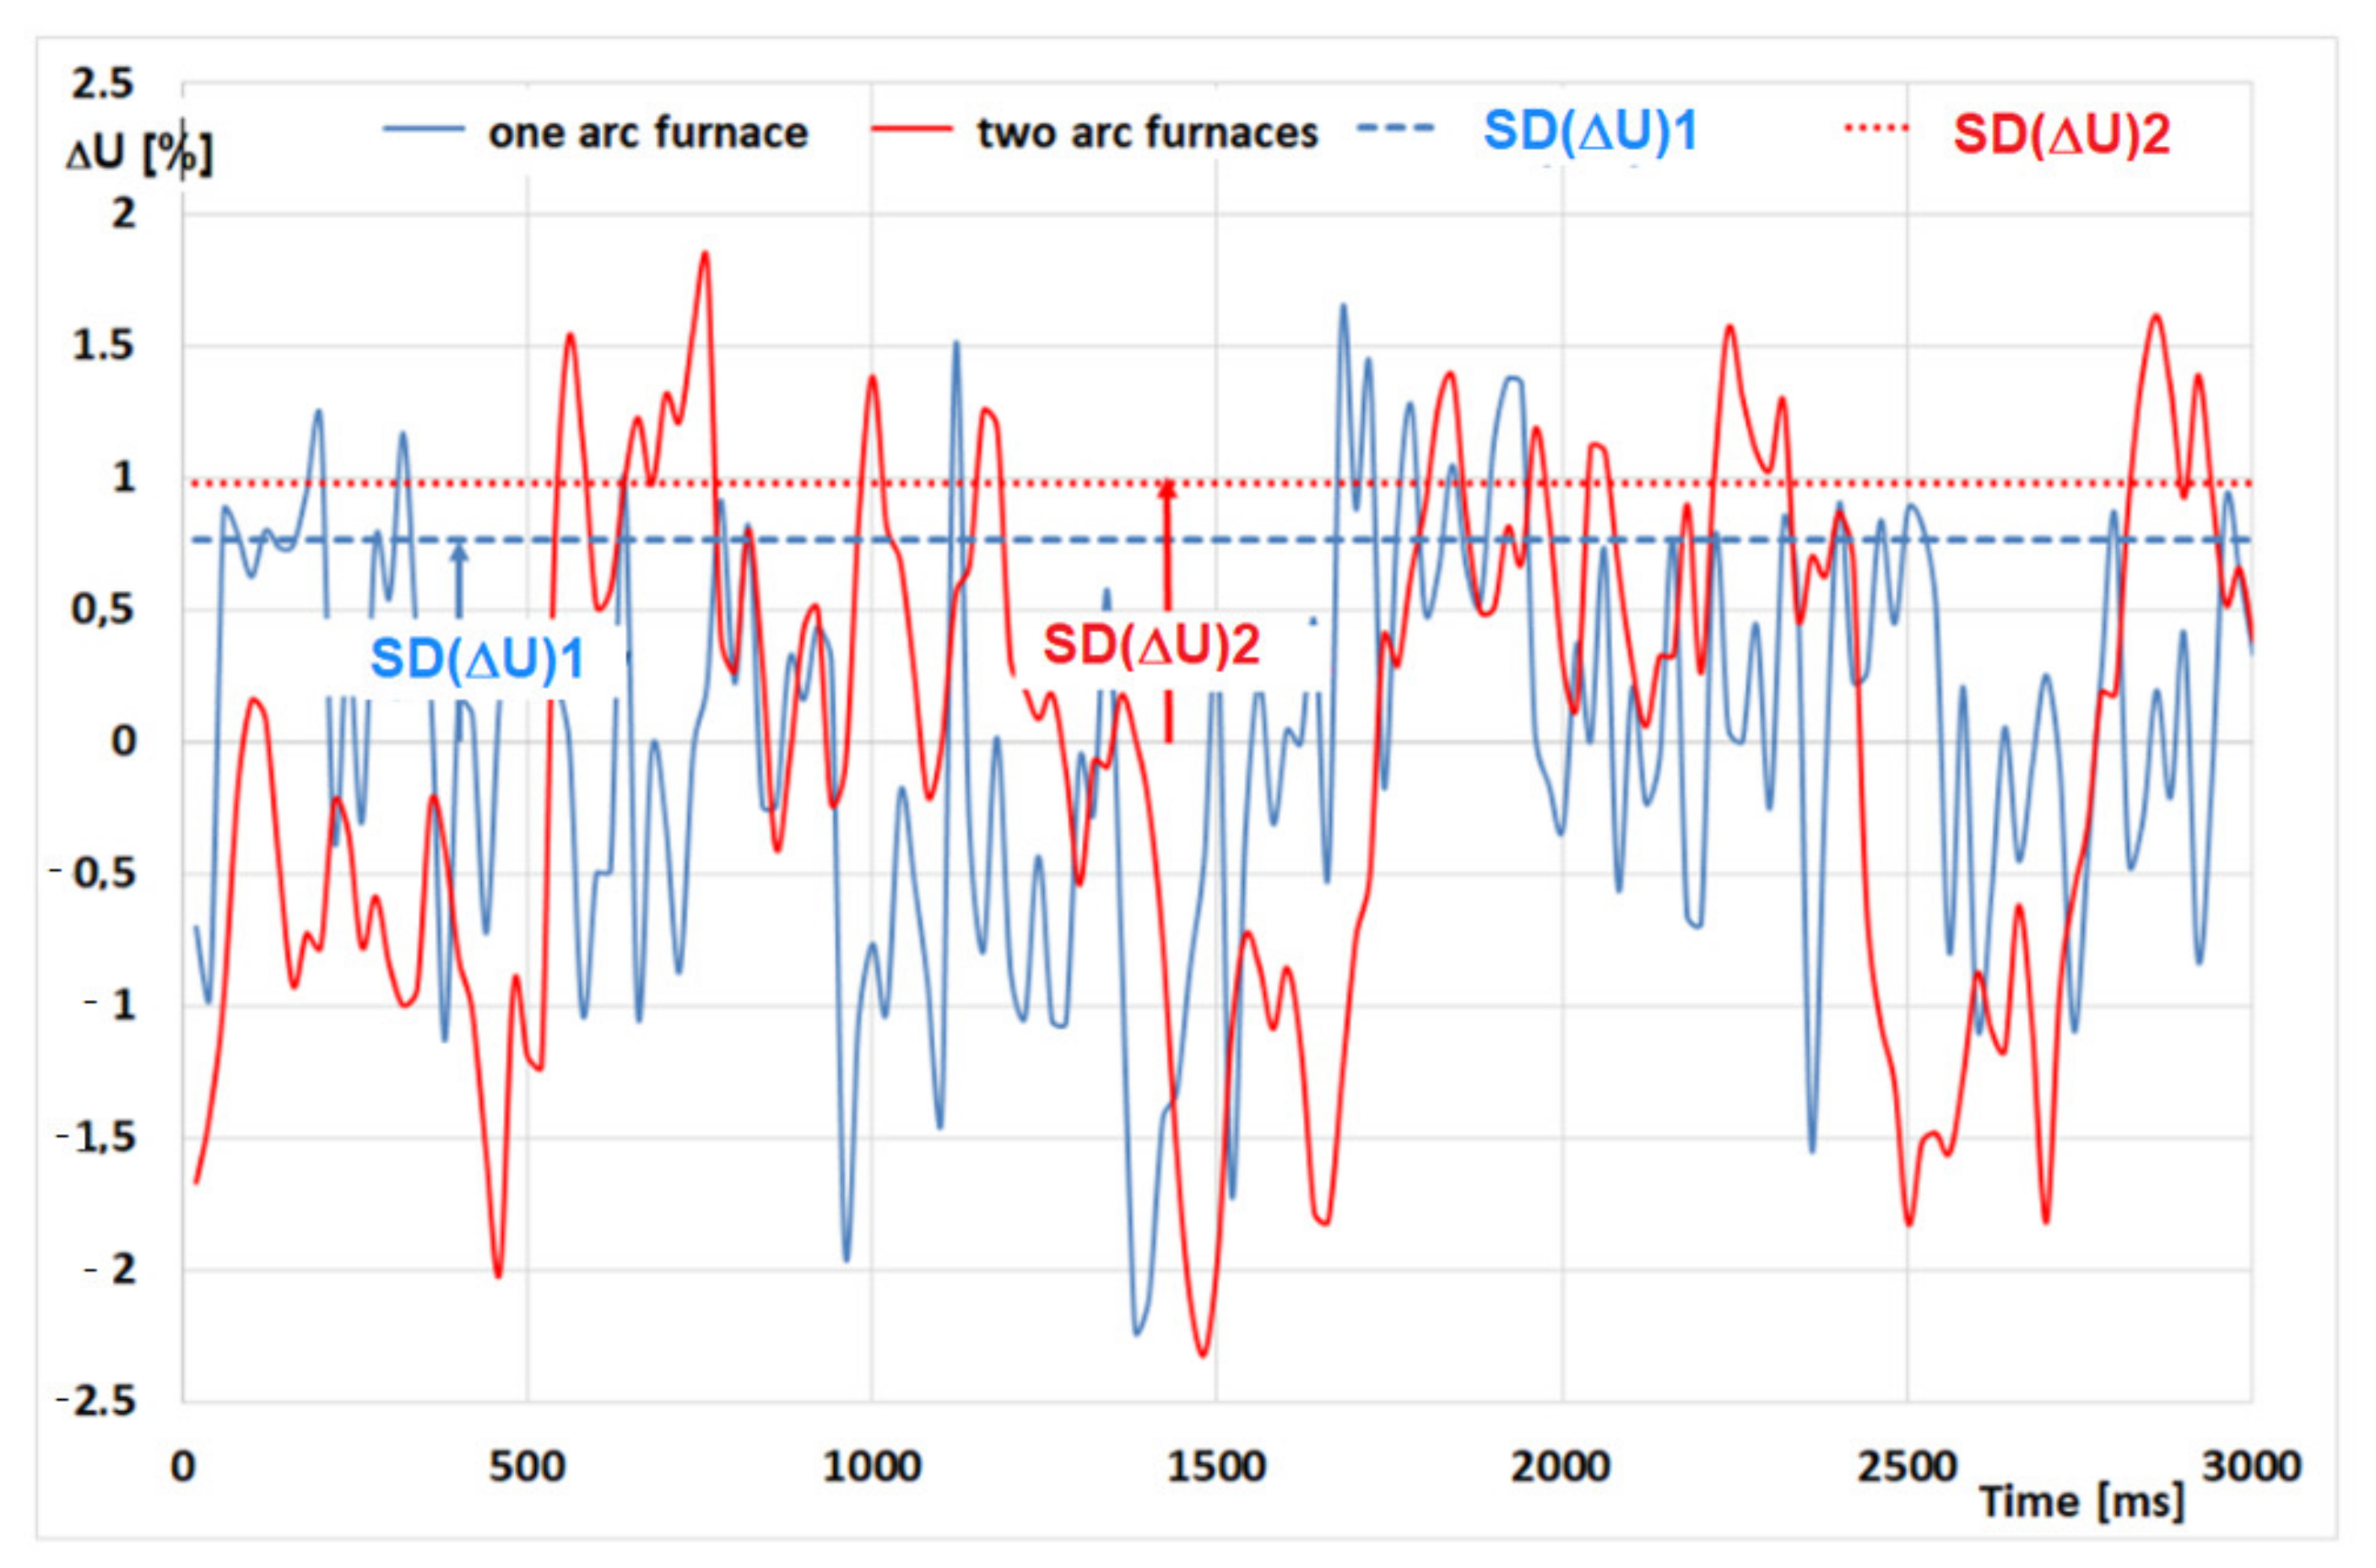
Figure 3 shows comparatively the voltage fluctuations recorded with one and two operating arc devices. The standard deviation of voltage fluctuations for a different number of arc furnaces is also presented.
The voltage fluctuations recorded in the networks supplying arc devices shows how disturbing arc furnaces are for the power quality—Figure 3. Switching the furnace causes voltage fluctuation whose amplitude can be determined by the standard deviation (SD ΔU)1. Connecting another furnace causes an increase in voltage fluctuations, with the amplitude of fluctuations SD(ΔU)2.
The article is a continuation of the issues of the impact of electric arc furnaces on the supply network presented in publication [20]. Currently, the focus was mainly on the voltage fluctuations.
The article presents a proposal of the arc furnace model with a power supply network. The proposed model is a compromise resulting from the adopted initial assumptions and the usefulness of the model in practical (engineering) applications.
Publication [21] presents an analysis of harmonics generated by arc furnaces. The proposed DCMM (Data-driven Compartmental Modeling Method) considers the coupling relationship among different frequencies of harmonics to enhance the modeling accuracy, meanwhile, the dimensions of the harmonic dataset are reduced to improve computational efficiency [21]. However, harmonic disturbances are not related to other disturbances, for example, voltage fluctuations. Publication [22] discusses a method for selecting the elements of a C-type filter working with a conventional LC-type filter for compensating reactive power and filtering out higher harmonics generated by arc furnaces and ladle furnaces. The assessment of the parameters of the power supply network for arc furnaces based on the measurements of currents and voltages is presented in publication [23]. The single-phase equivalent diagram of the arc furnace supply network is being considered (similarly to the presented article). The disruptive influence of arc furnaces on the quality of energy in the power system is presented in the article [24]. The dependence of voltage fluctuations (characterized by flicker indicators) on the short-circuit power of the supply network was analyzed. The operation of arc furnaces is modeled with the use of simulation programs. These programs already have applications or blocks that simulate disturbances caused by arc devices. For example, in the article [25], to ensure sufficient dynamics and accuracy, the model predictive direct power control was applied using the MATLAB/Simulink Real Time Workshop environment implemented into the dSPACE™ control system DS1005. The article proposes a classical method of voltage fluctuation modeling. The adopted assumptions constitute a compromise between the (acceptable) accuracy of calculations and the possibility of using the model for practical applications. The disadvantage of the proposed method is the quasi-dynamic way of reflecting the phenomena occurring in the supply network during individual melts in the arc furnace. Using the proposed model, one can determine, among others, maximum values of voltage fluctuations that will occur for the given short-circuit power of the network and the power of the furnace transformer.
2. Modeling of Voltage Fluctuations in the Operation of a Single Arc Furnace
There are many methods of electric arc modeling. The most important methods include dynamic [26,27,28], classic based on nonlinear differential equations [29], based on resistance and inductance [30], using a voltage source variable in time, and defined as a nonlinear function depending on the length of the electric arc [31,32,33]. For modeling arc devices, computer simulation programs are widely used [34,35,36,37,38,39,40,41,42].
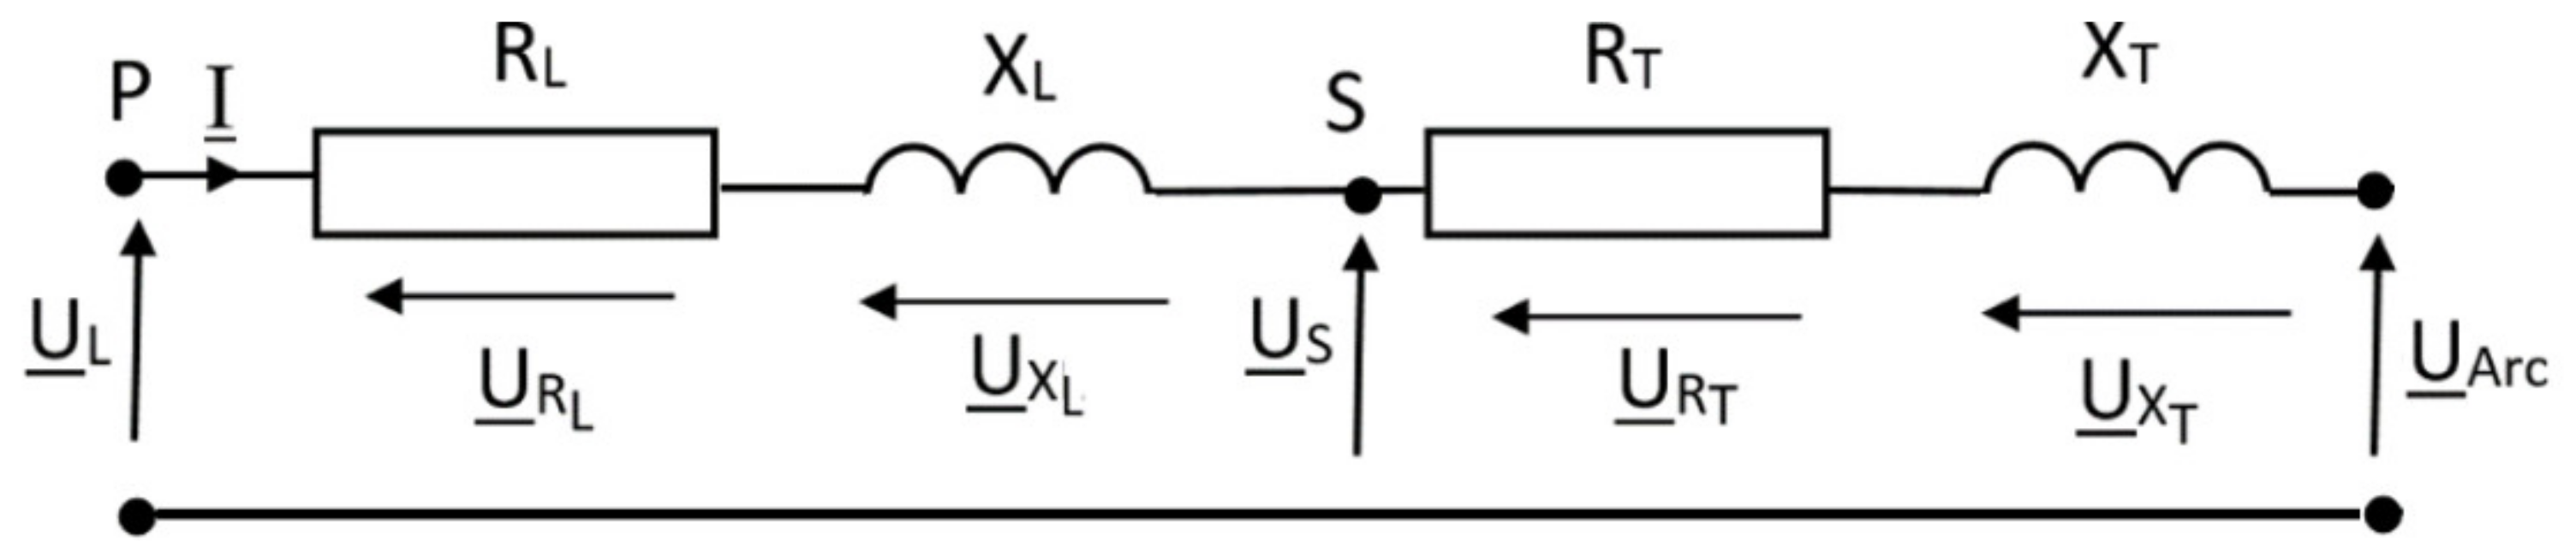
The method proposed in the article can be classified as quasi-dynamic. The proposed model of the arc device allows for the estimation of the influence of the steel plant supply conditions on the amount of voltage fluctuations generated by arc furnaces (by changing the parameters of the RL and XL supply networks). The supply voltage UL represents an ideal constant voltage sinusoidal source, which has been adopted as UL = 100%.
The electric arc of the furnace is represented by the voltage UArc. The arc voltage UArc varies depending on the arc length. In the research, only the first voltage harmonic was assumed, which means that the shape of the arc voltage was ignored. The high-current path with the furnace transformer is represented by resistance RT and reactance XT.
The performed measurements and statistical analysis of the actual voltage fluctuations recorded in the networks supplying the arc furnaces allowed for the development of a model of the furnace installation. The arc furnace, due to the nature of the electric arc, is a non-linear receiver. After ignition, an electric arc occurs between the electrodes and the molten scrap. The electric arc is represented by the voltage UArc. As a result of the movement of the electrodes, the distance of the electric arc changes. The effect of changing the arc length is the change of the voltage UArc. The arc voltage UArc was simulated using a sinusoidal voltage source with an amplitude depending on the arc length, which is the basic harmonic of the arc voltage.
Based on the analysis of measurement data, a power supply scheme for the arc furnace has been proposed. The arc furnace power supply system is shown in Figure 4.
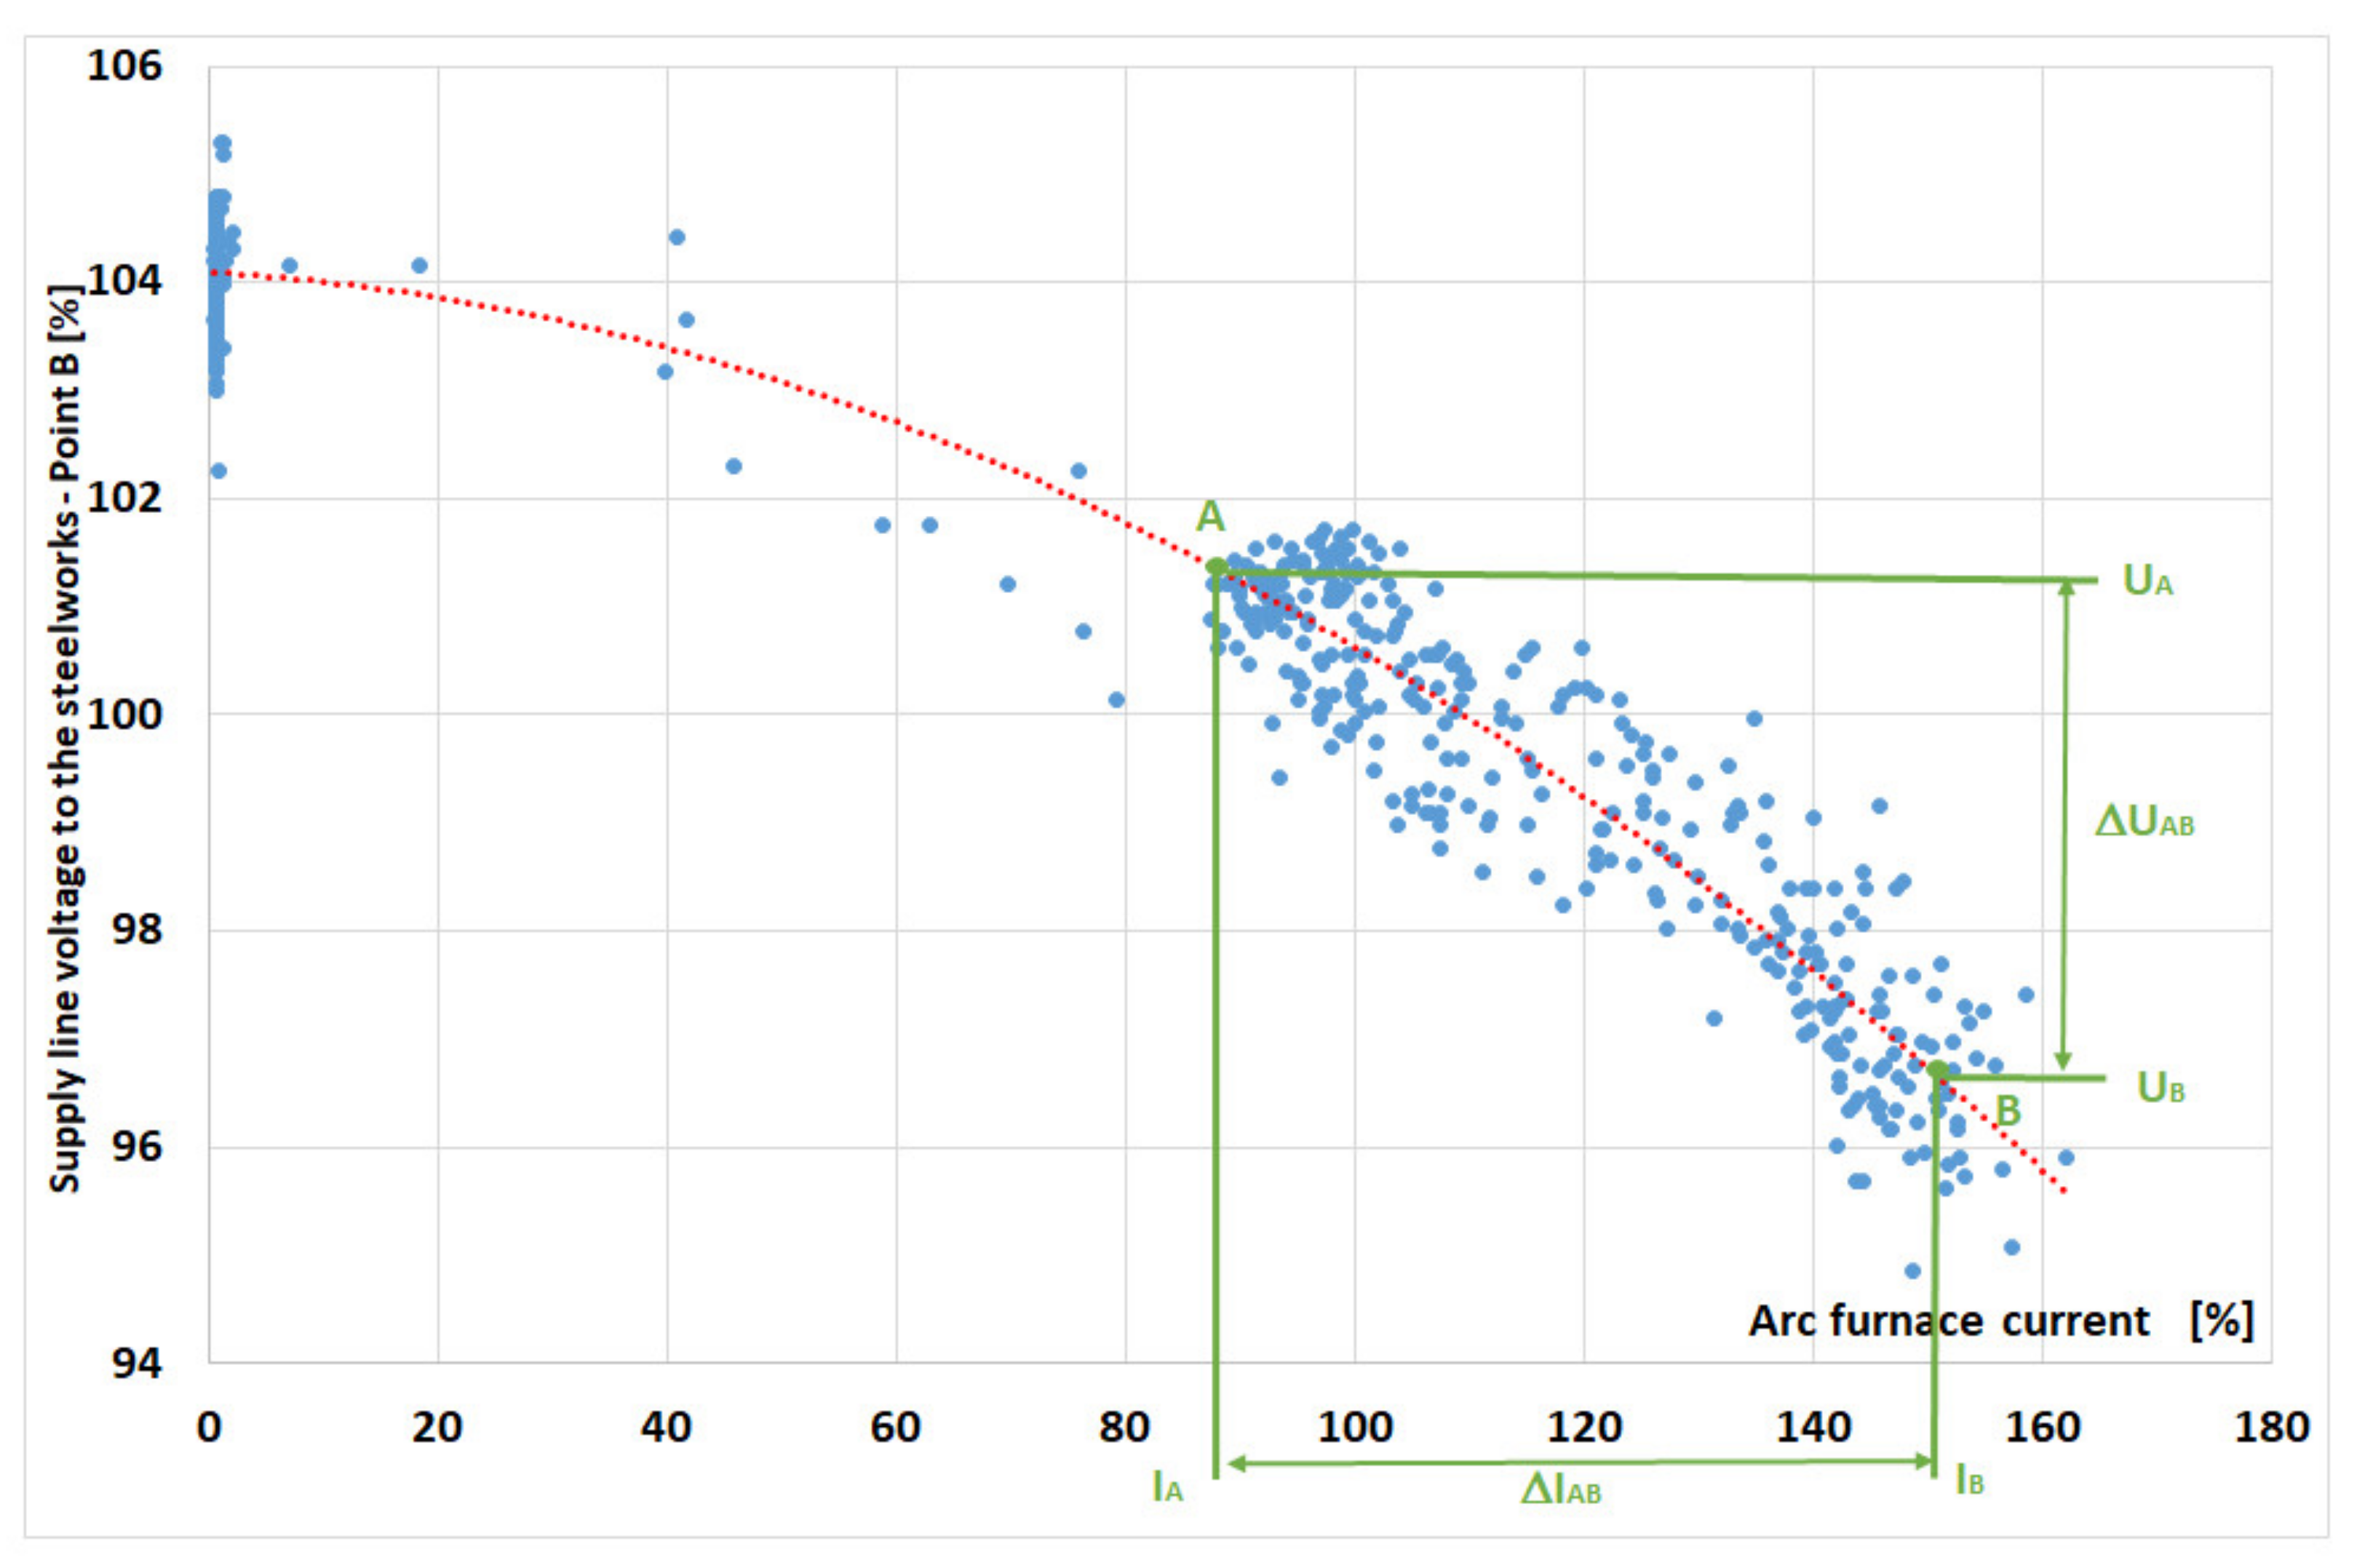
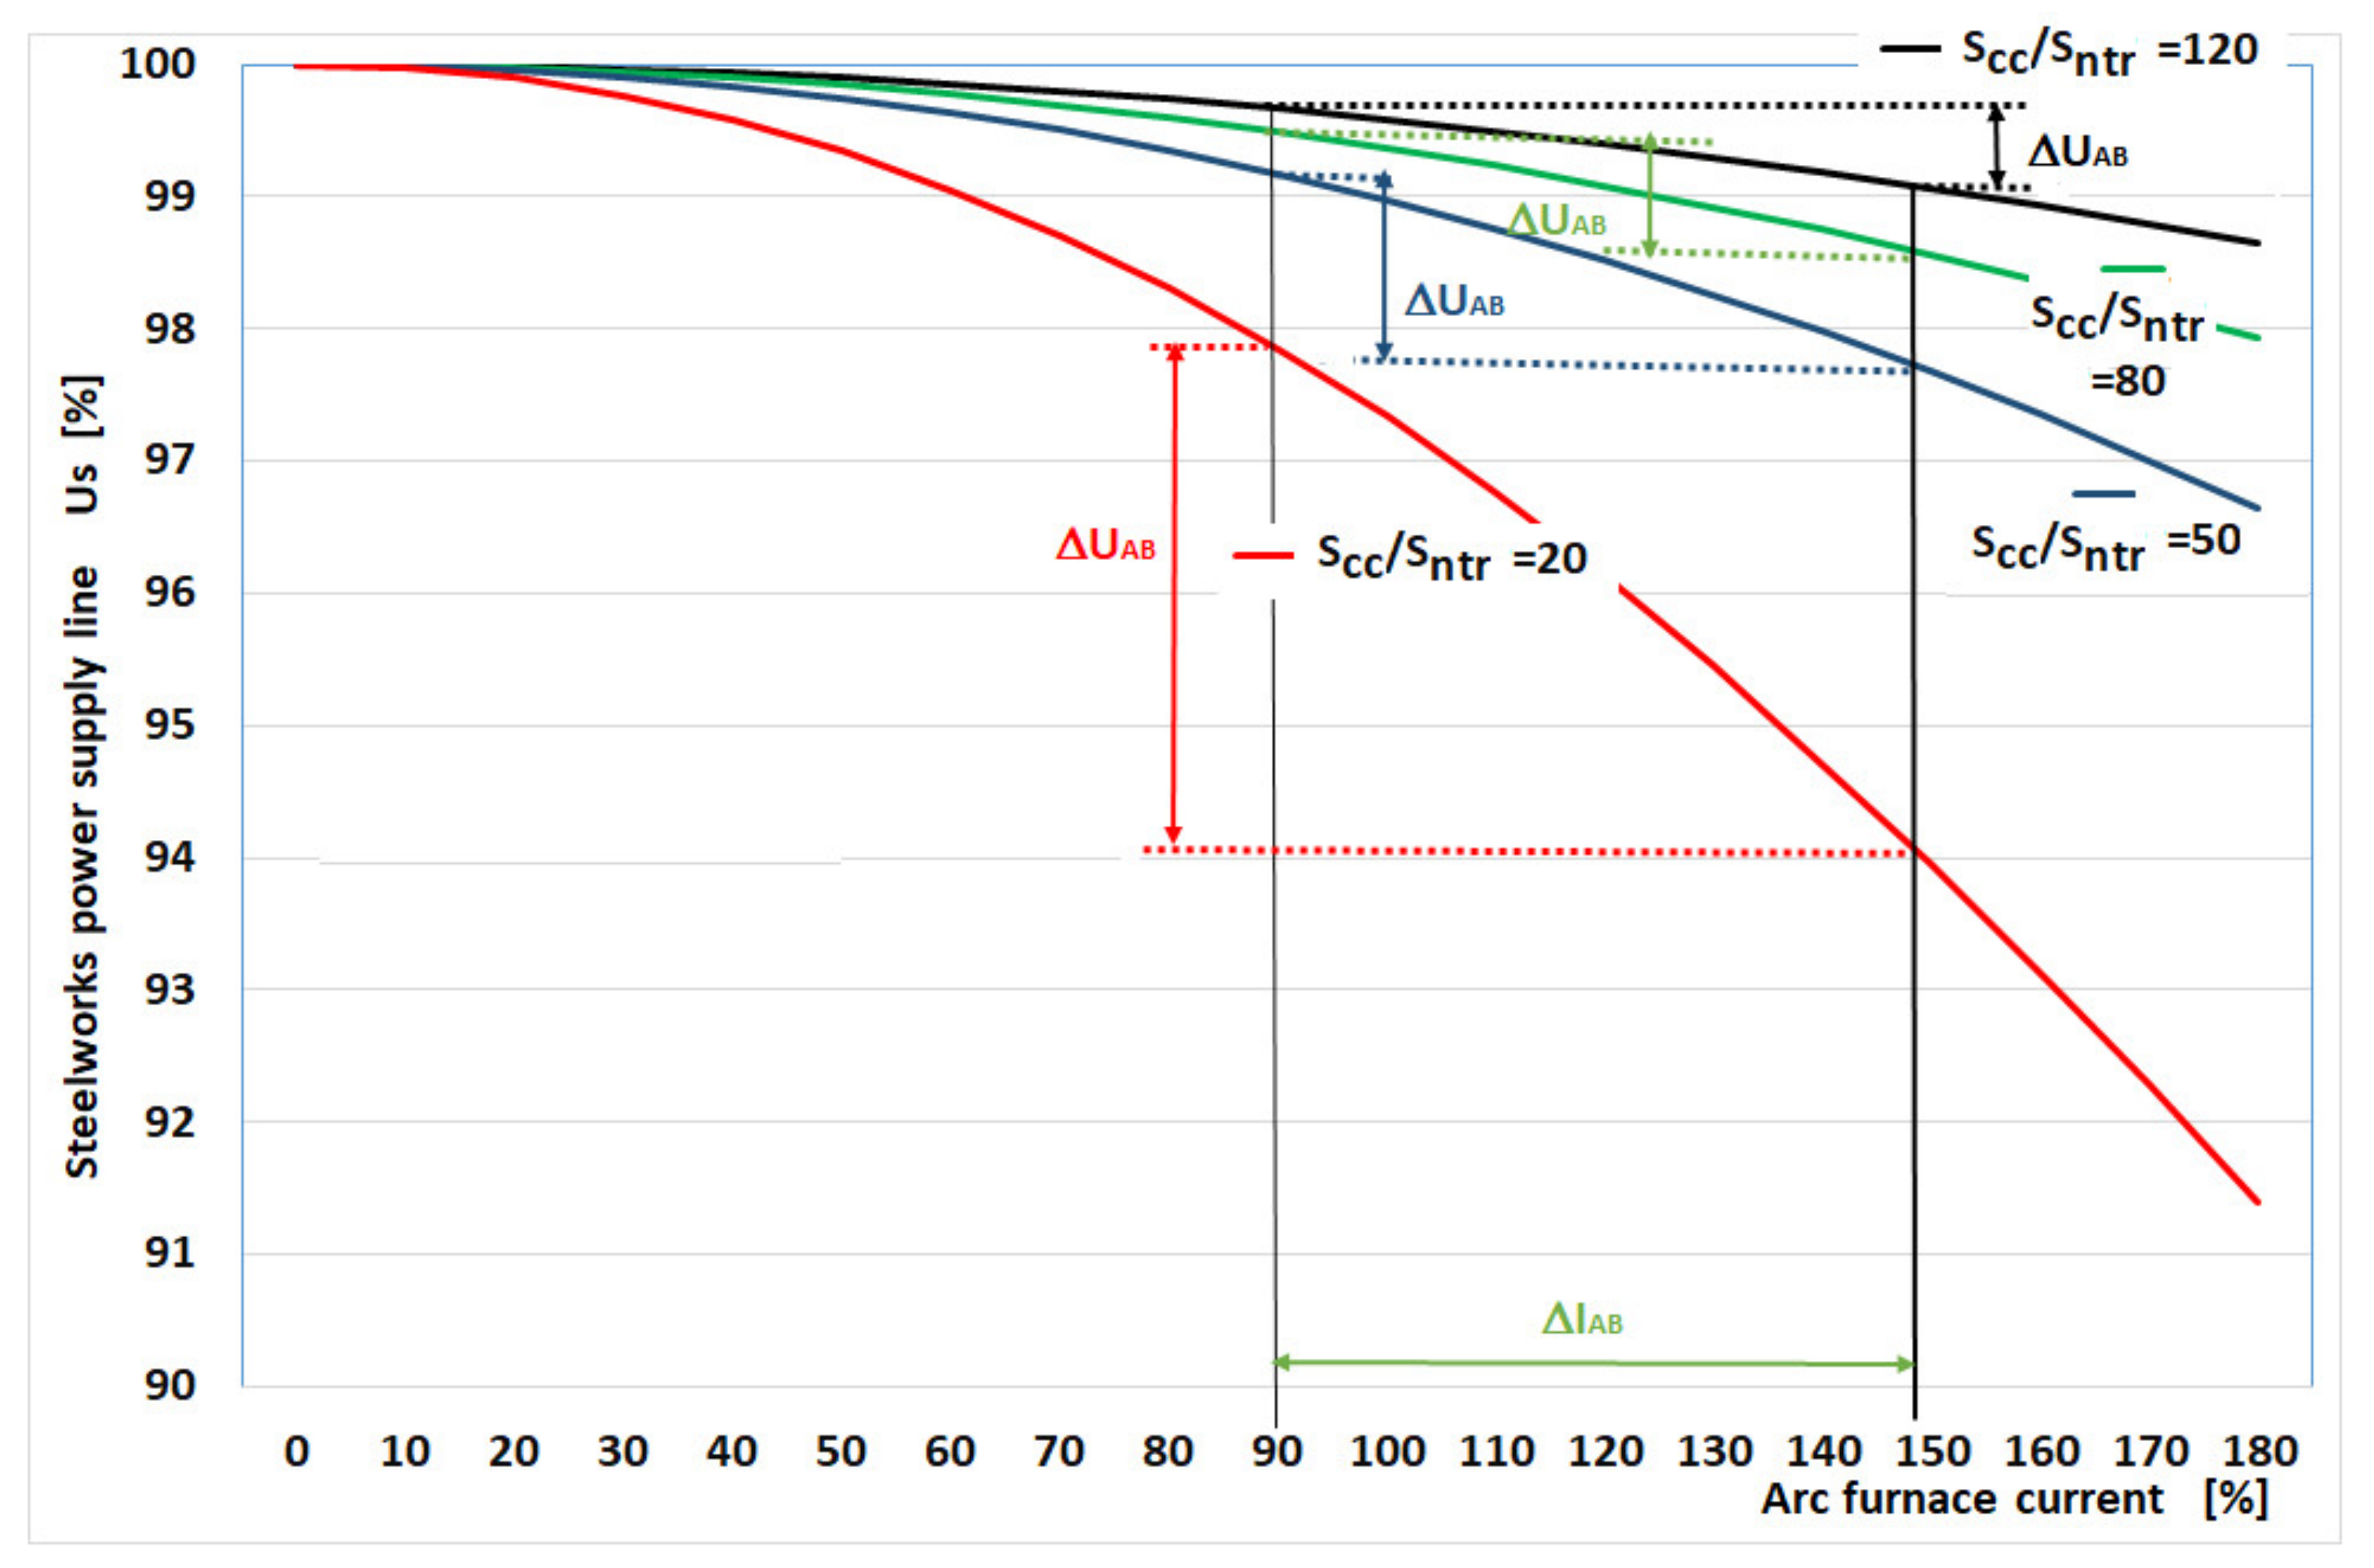
The range of current changes directly affects the amount of voltage fluctuations in the supply line of the arc furnace. After ignition of the arc between the electrodes and the charge, as a result of the changes in the arc length, the current I changes its value dynamically. For arc furnaces, the scrap (charge) melting current typically varies around 120% of the rated (IN nominal current) current. In the initial stage of smelting, the current changes are the highest and it is assumed that they take place between the values specified by IA and IB, where IA is 90% IN and IB is 150% IN. The changes in current between IA and IB, as defined ΔIAB, cause voltage changes between UA and UB, defined as voltage fluctuations and marked ΔUAB—Figure 5.
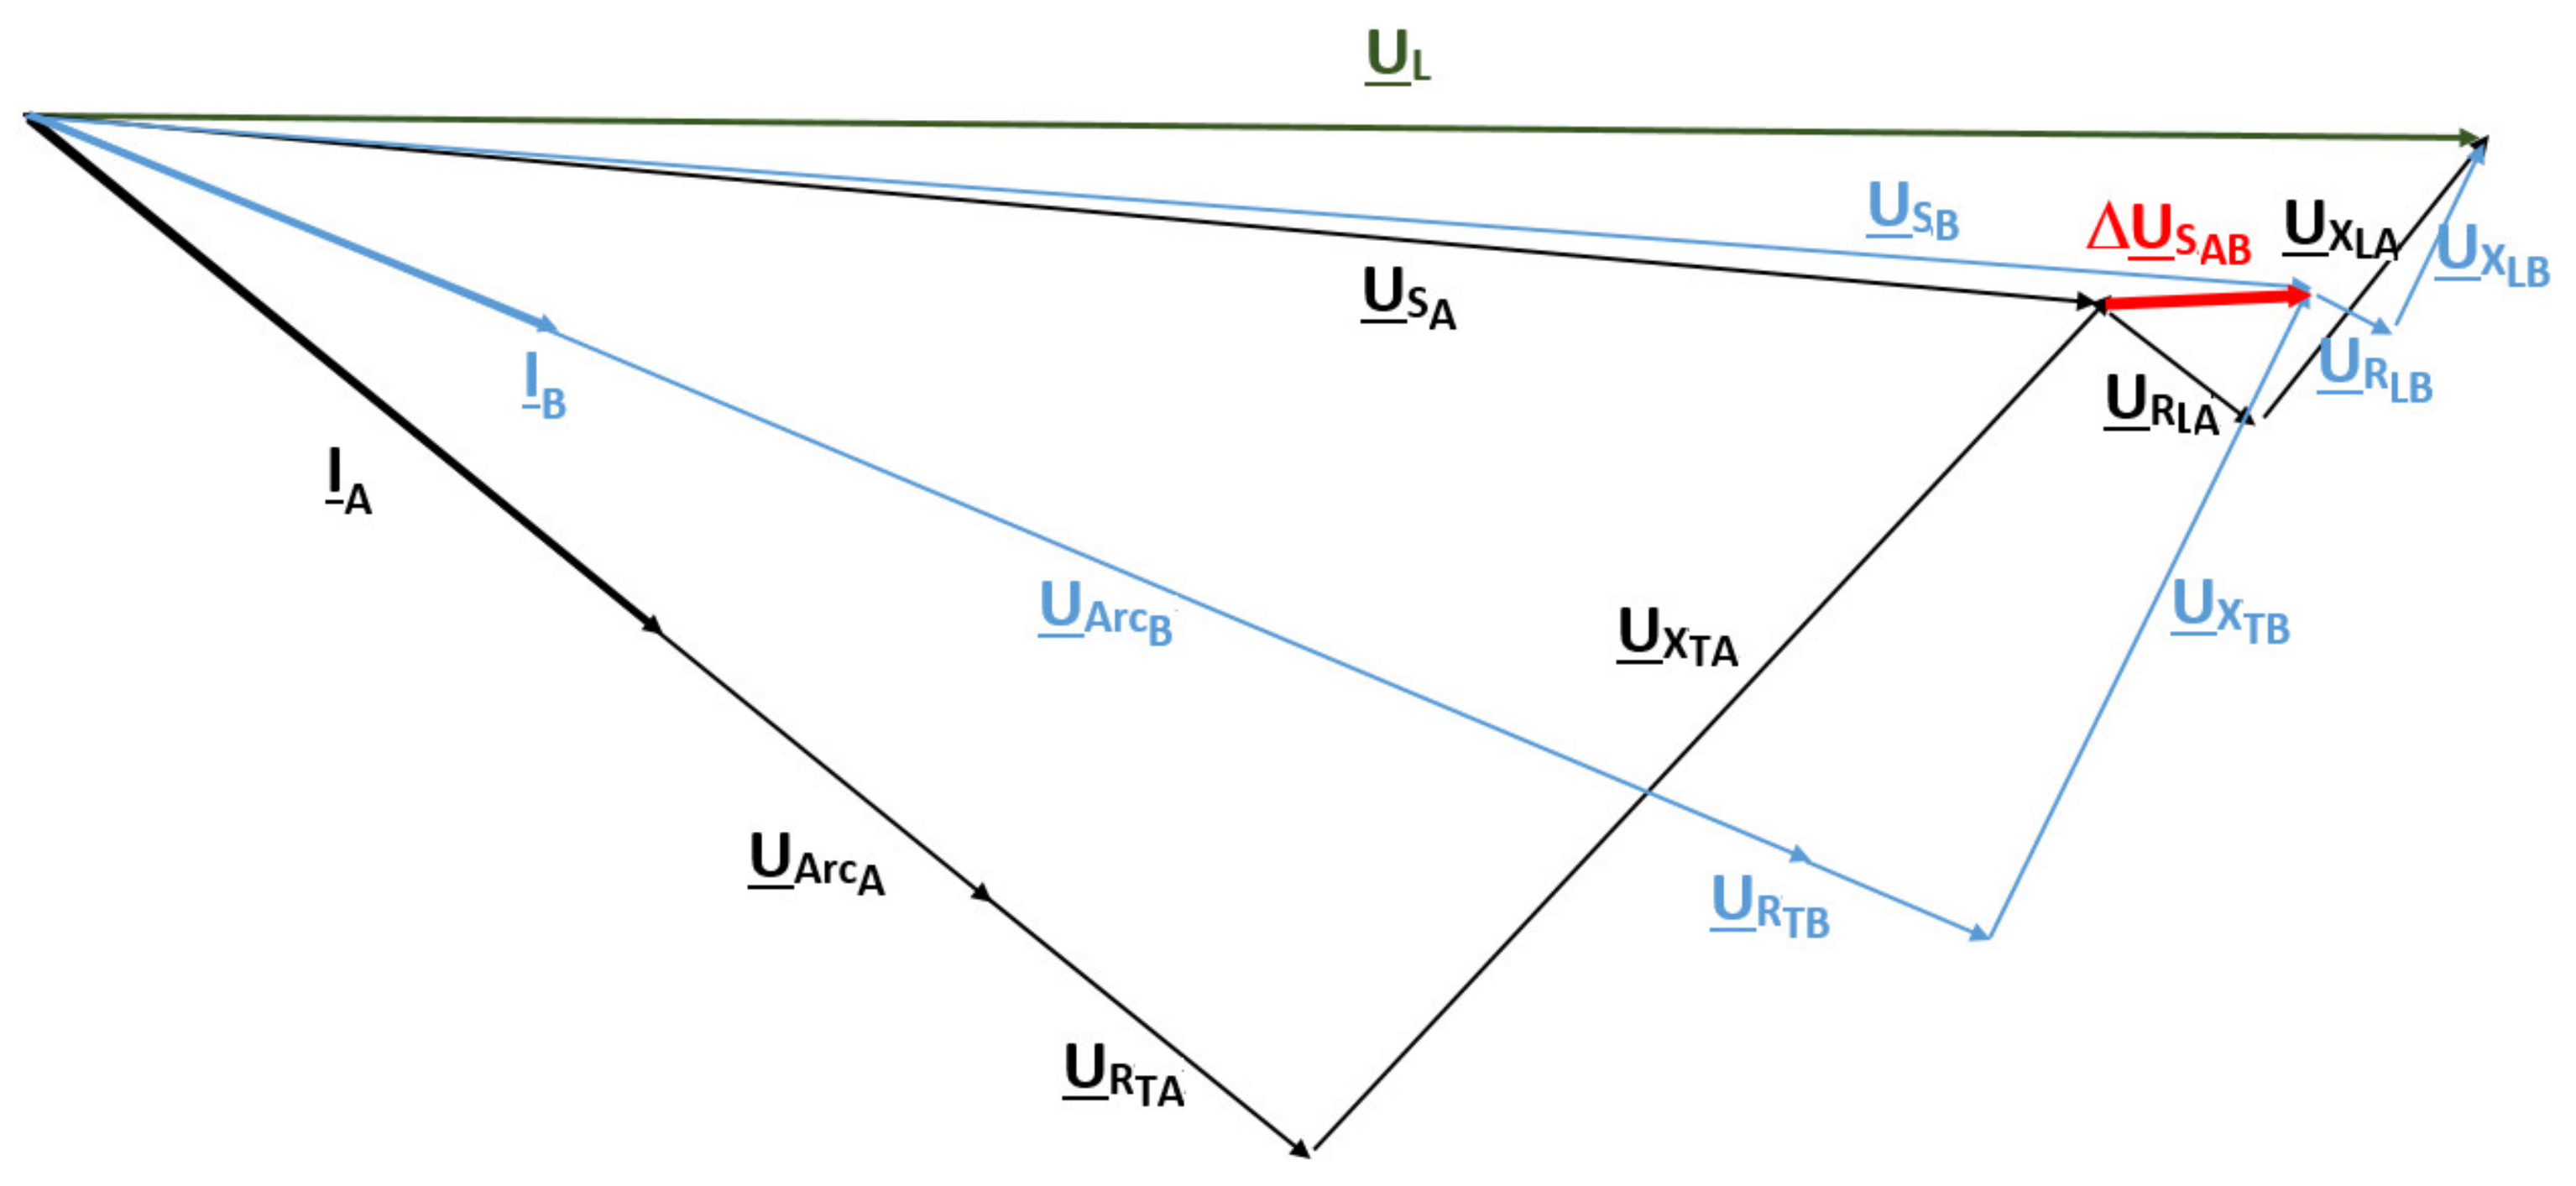
For the single-phase power supply scheme for the arc furnace shown in Figure 4 and the current changes with the assumed values of IA and IB, a vector diagram can be drawn—Figure 6.
Based on the vector diagram of the arc furnace currents and voltages shown in Figure 4, UArcA and UArcB arc voltages can be calculated as:
and voltages USA and USB:
Voltage changes from USA to USB determine fluctuations in point S—Figure 4:
or expressed as a percentage of the UL reference voltage:
or as a standard deviation voltage:
The assumed changes in the current from IA to IB, around the melting current IM, represent the greatest disturbances occurring in the initial phase of melting the scrap—Figure 5.
As the amount of molten scrap increases, the changes in the current consumed by the arc furnace decrease. It is influenced by the stabilization of the electric arc between the electrodes and the charge (molten scrap). The reduction of the range of current changes is represented by different histograms corresponding to the various phases of melting in an arc furnace.
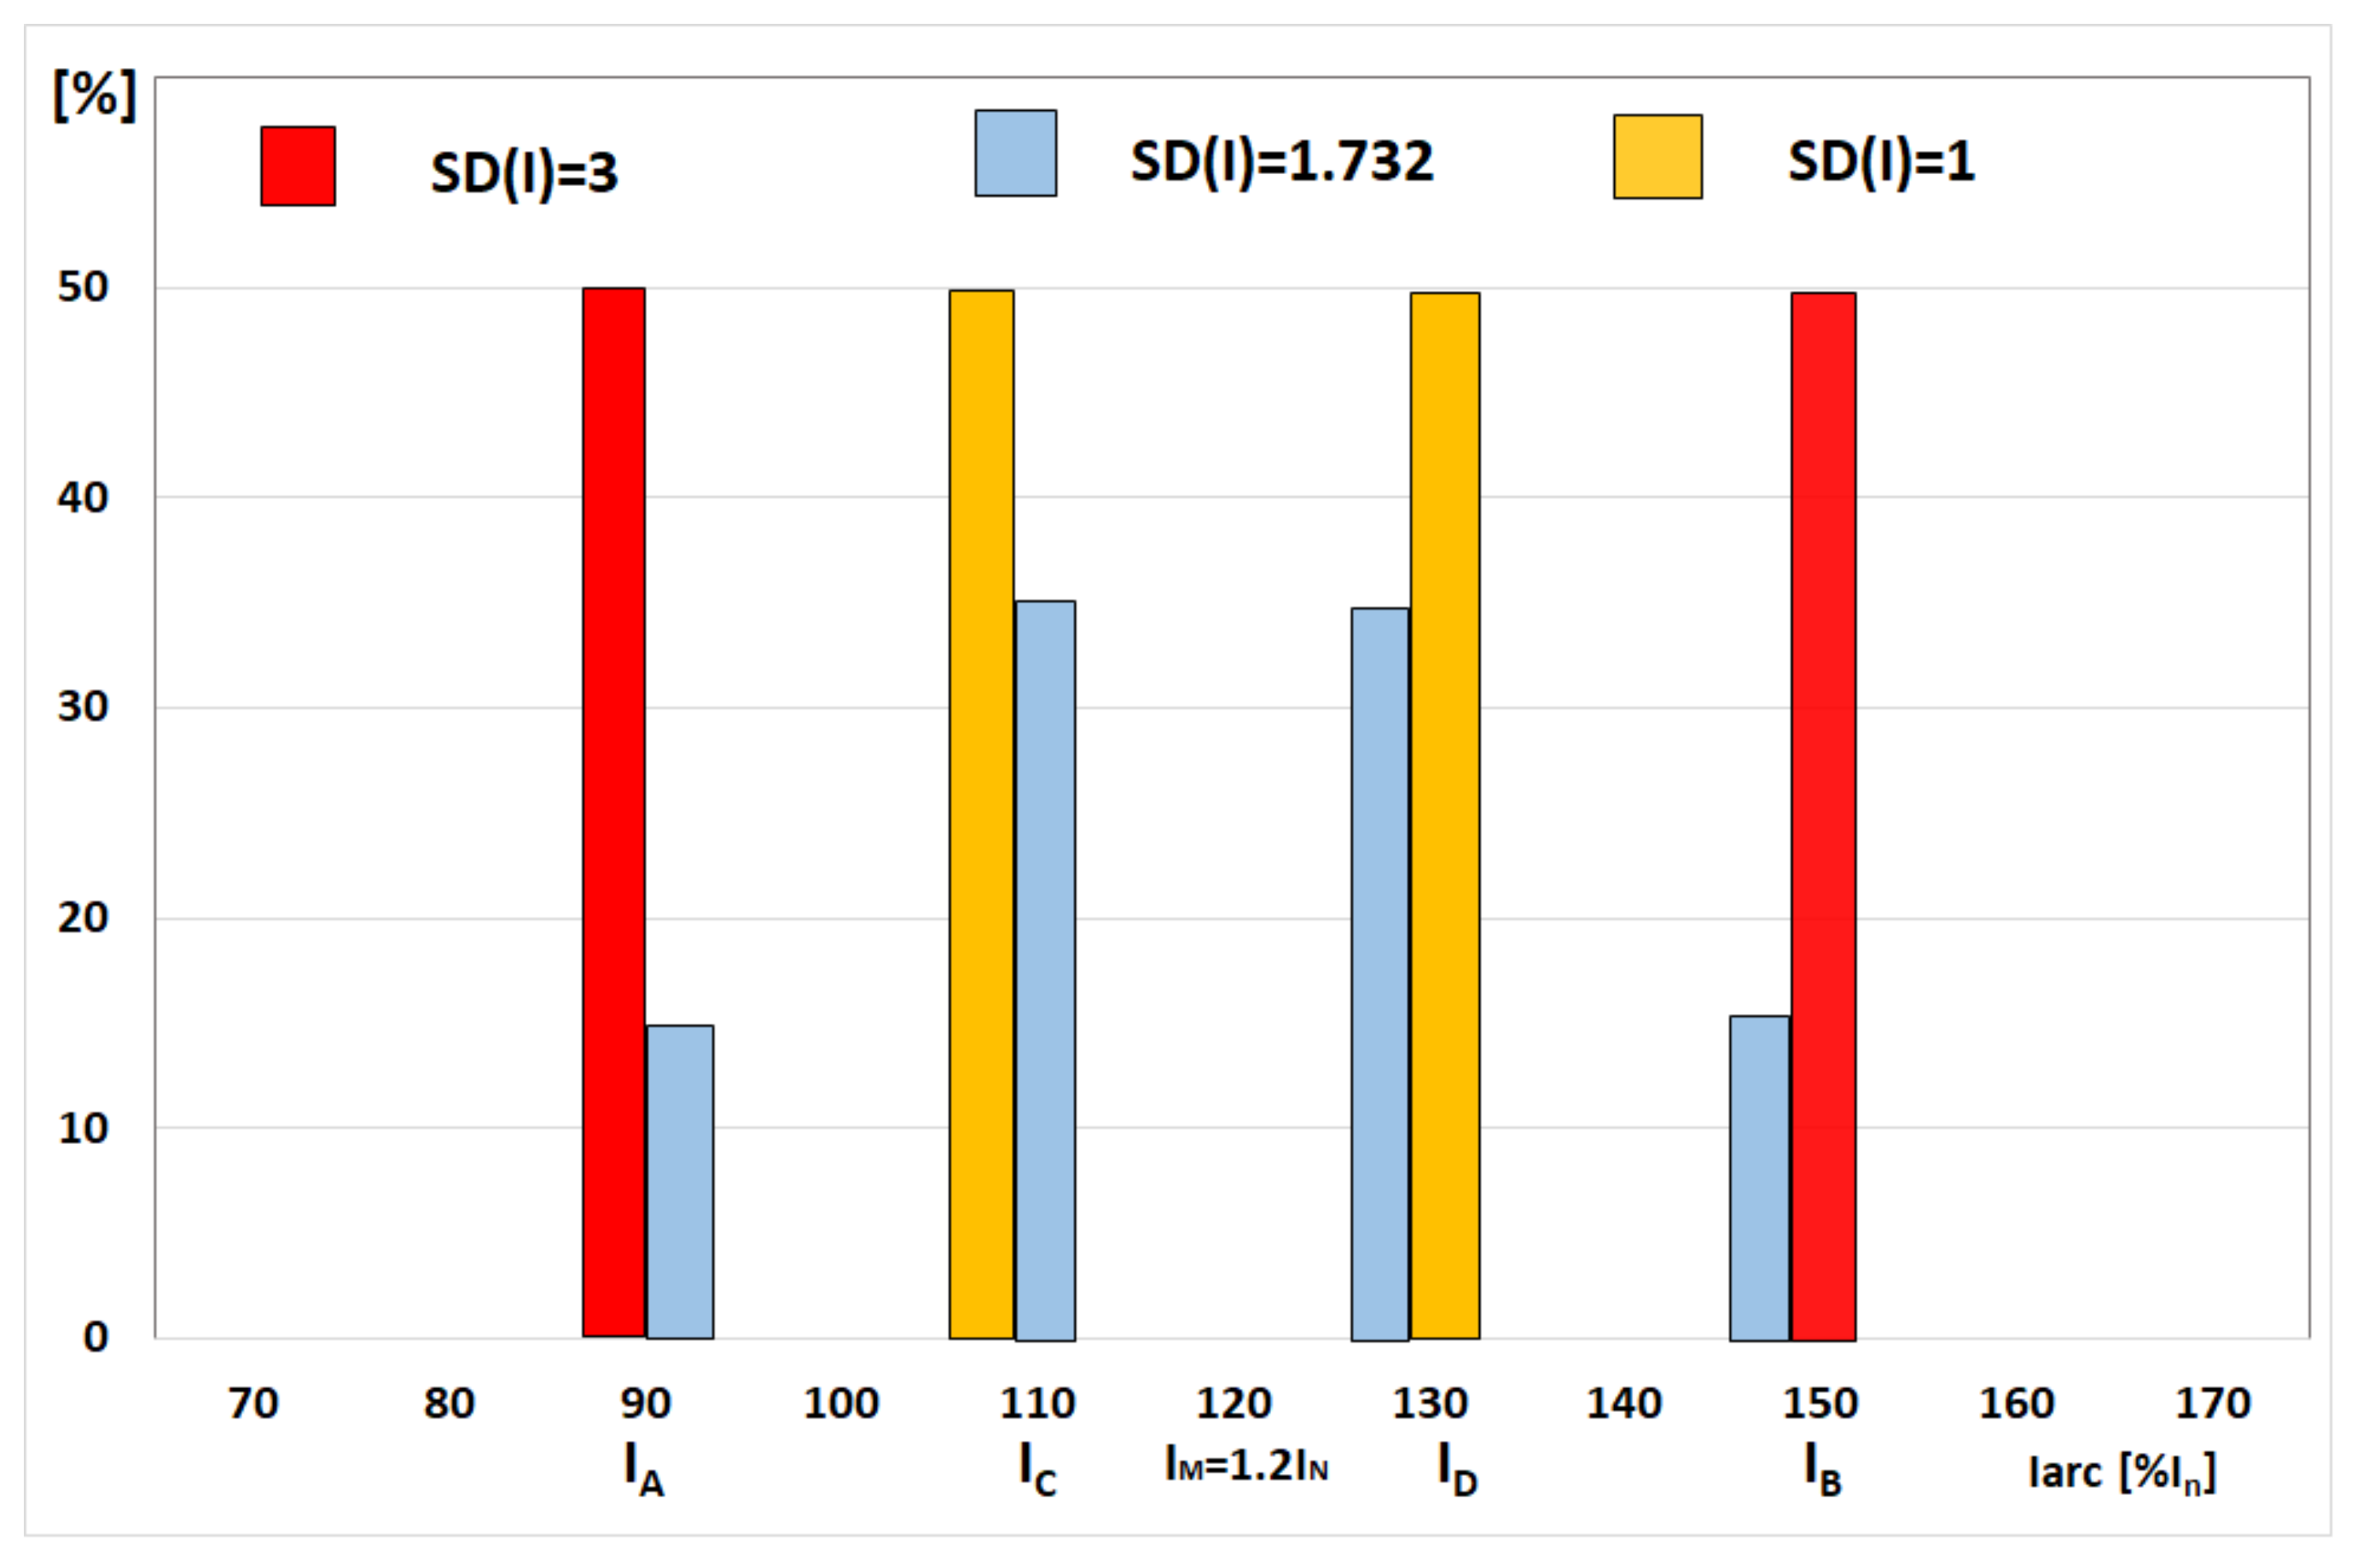
Figure 7 shows sample histograms corresponding to changes in the furnace current in the various stages of the smelting. In the initial phase of scrap melting, the greatest changes in the furnace current occur between the IA and IB values. These changes are characterized by a histogram (red), for which the standard deviation is SD(I) = 3. After melting a part of the scrap, the current assumes the values IA, IB, IC, ID. The probability of the occurrence of currents is characterized by the histogram (blue), where SD(I) = 1.732. In the further part of the smelting in the arc furnace, the electric arc between the electrodes and the charge (molten scrap) is stabilized. The current fluctuates between IC and ID, which corresponds to the histogram (yellow), for which SD(I) = 1.
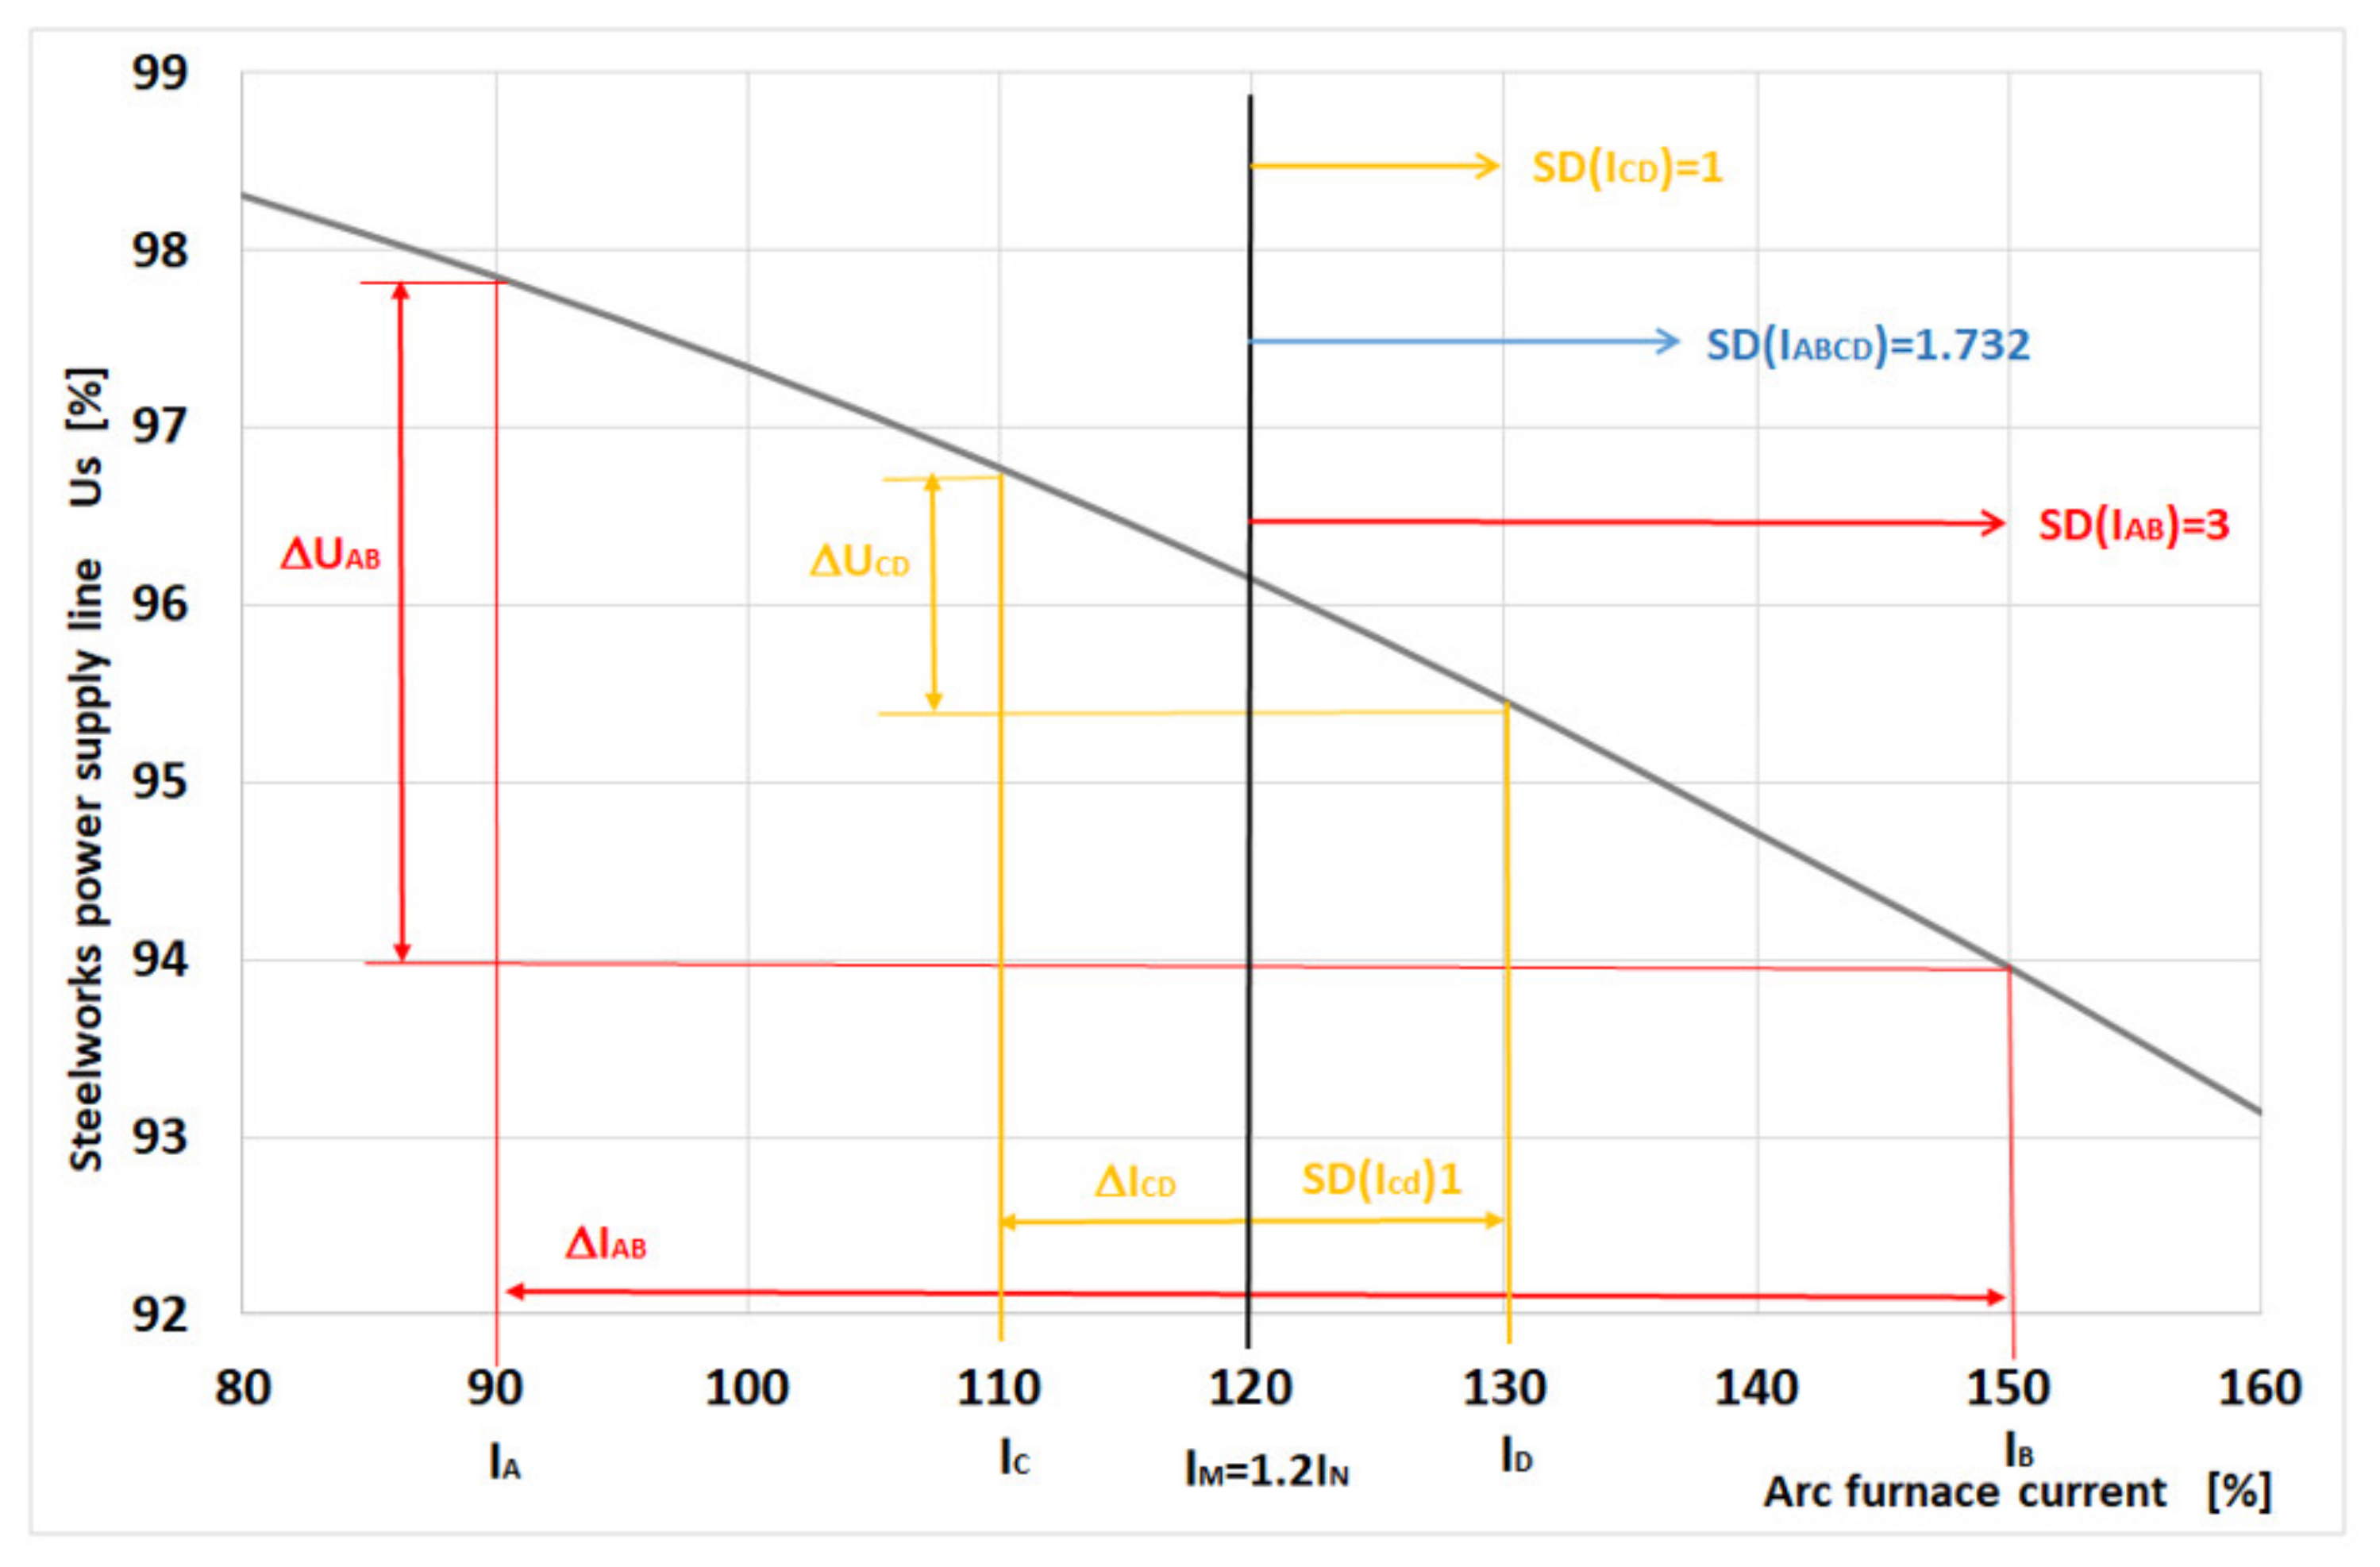
Figure 7 also shows the standard deviation of the current arc furnace corresponding to the various histograms. Figure 8 shows examples of voltage fluctuations for various furnace current histograms and the standard deviations of the currents from the mean value of IM = 1.2 IN.
The presented histograms are only selected examples of the ranges of changes in the arc furnace current adopted for the research. Analyzing the impact of arc furnaces on the power system, it was found that the greatest disturbances arise in the initial phase of steel smelting. The presented current change histograms are representative of the beginning of the melting of the scrap and subsequent addition of the scrap to the furnace ladle.
One of the most important parameters affecting the voltage fluctuations generated by the arc furnace is the ratio of the short-circuit power of the supply network to the power of the furnace transformer.
The short-circuit power SCC characterizes the supply network in terms of resistance to disturbances caused by loads with rapidly changing load. Arc furnaces are such receivers. The factors determining the short-circuit power of the network (e.g., at the point of connecting the arc furnaces) are supply voltage and line impedance.
In the proposed model, the short-circuit power is determined by the parameters of the supply network, resistance-RL and reactance-XL. The electrical parameters of the electric arc furnace installation are defined by resistance-RT and reactance-XL. The electric arc is represented by the voltage UArc. The following ratios of the short-circuit power of the network to the power of the furnace transformer were proposed for model tests, Scc/Sntr—20, 50, 80, 120, which takes into account the different electrical parameters of the power supply line—Figure 9:
- -
- Scc/Sntr: 20, 50—correspond to the worst electrical conditions for powering the steelworks. With such low short-circuit power of the network, voltage fluctuations generated by arc furnaces will cause excessive disturbances, perceived, for example, as flickering light caused by lighting receivers.
- -
According to the UIE recommendations given in publication [44], it is recommended that the minimum ratio of the short-circuit power of the SCC network to the power of the furnace transformer Sntr should be 120. When these power conditions are provided for the steel plant, the voltage fluctuations generated by arc furnaces will not cause an annoying flicker of light.
Due to the recommendations presented in [43,44], such Scc/Sntr values were adopted in the presented research. It was assumed that the greatest changes in current are D(I) = 3, which corresponds to the beginning of melting the scrap. Current variations from IA to IB cause voltage fluctuations in the ΔUAB. They are marked with different colors for different short-circuit powers of the supply network—Figure 9.
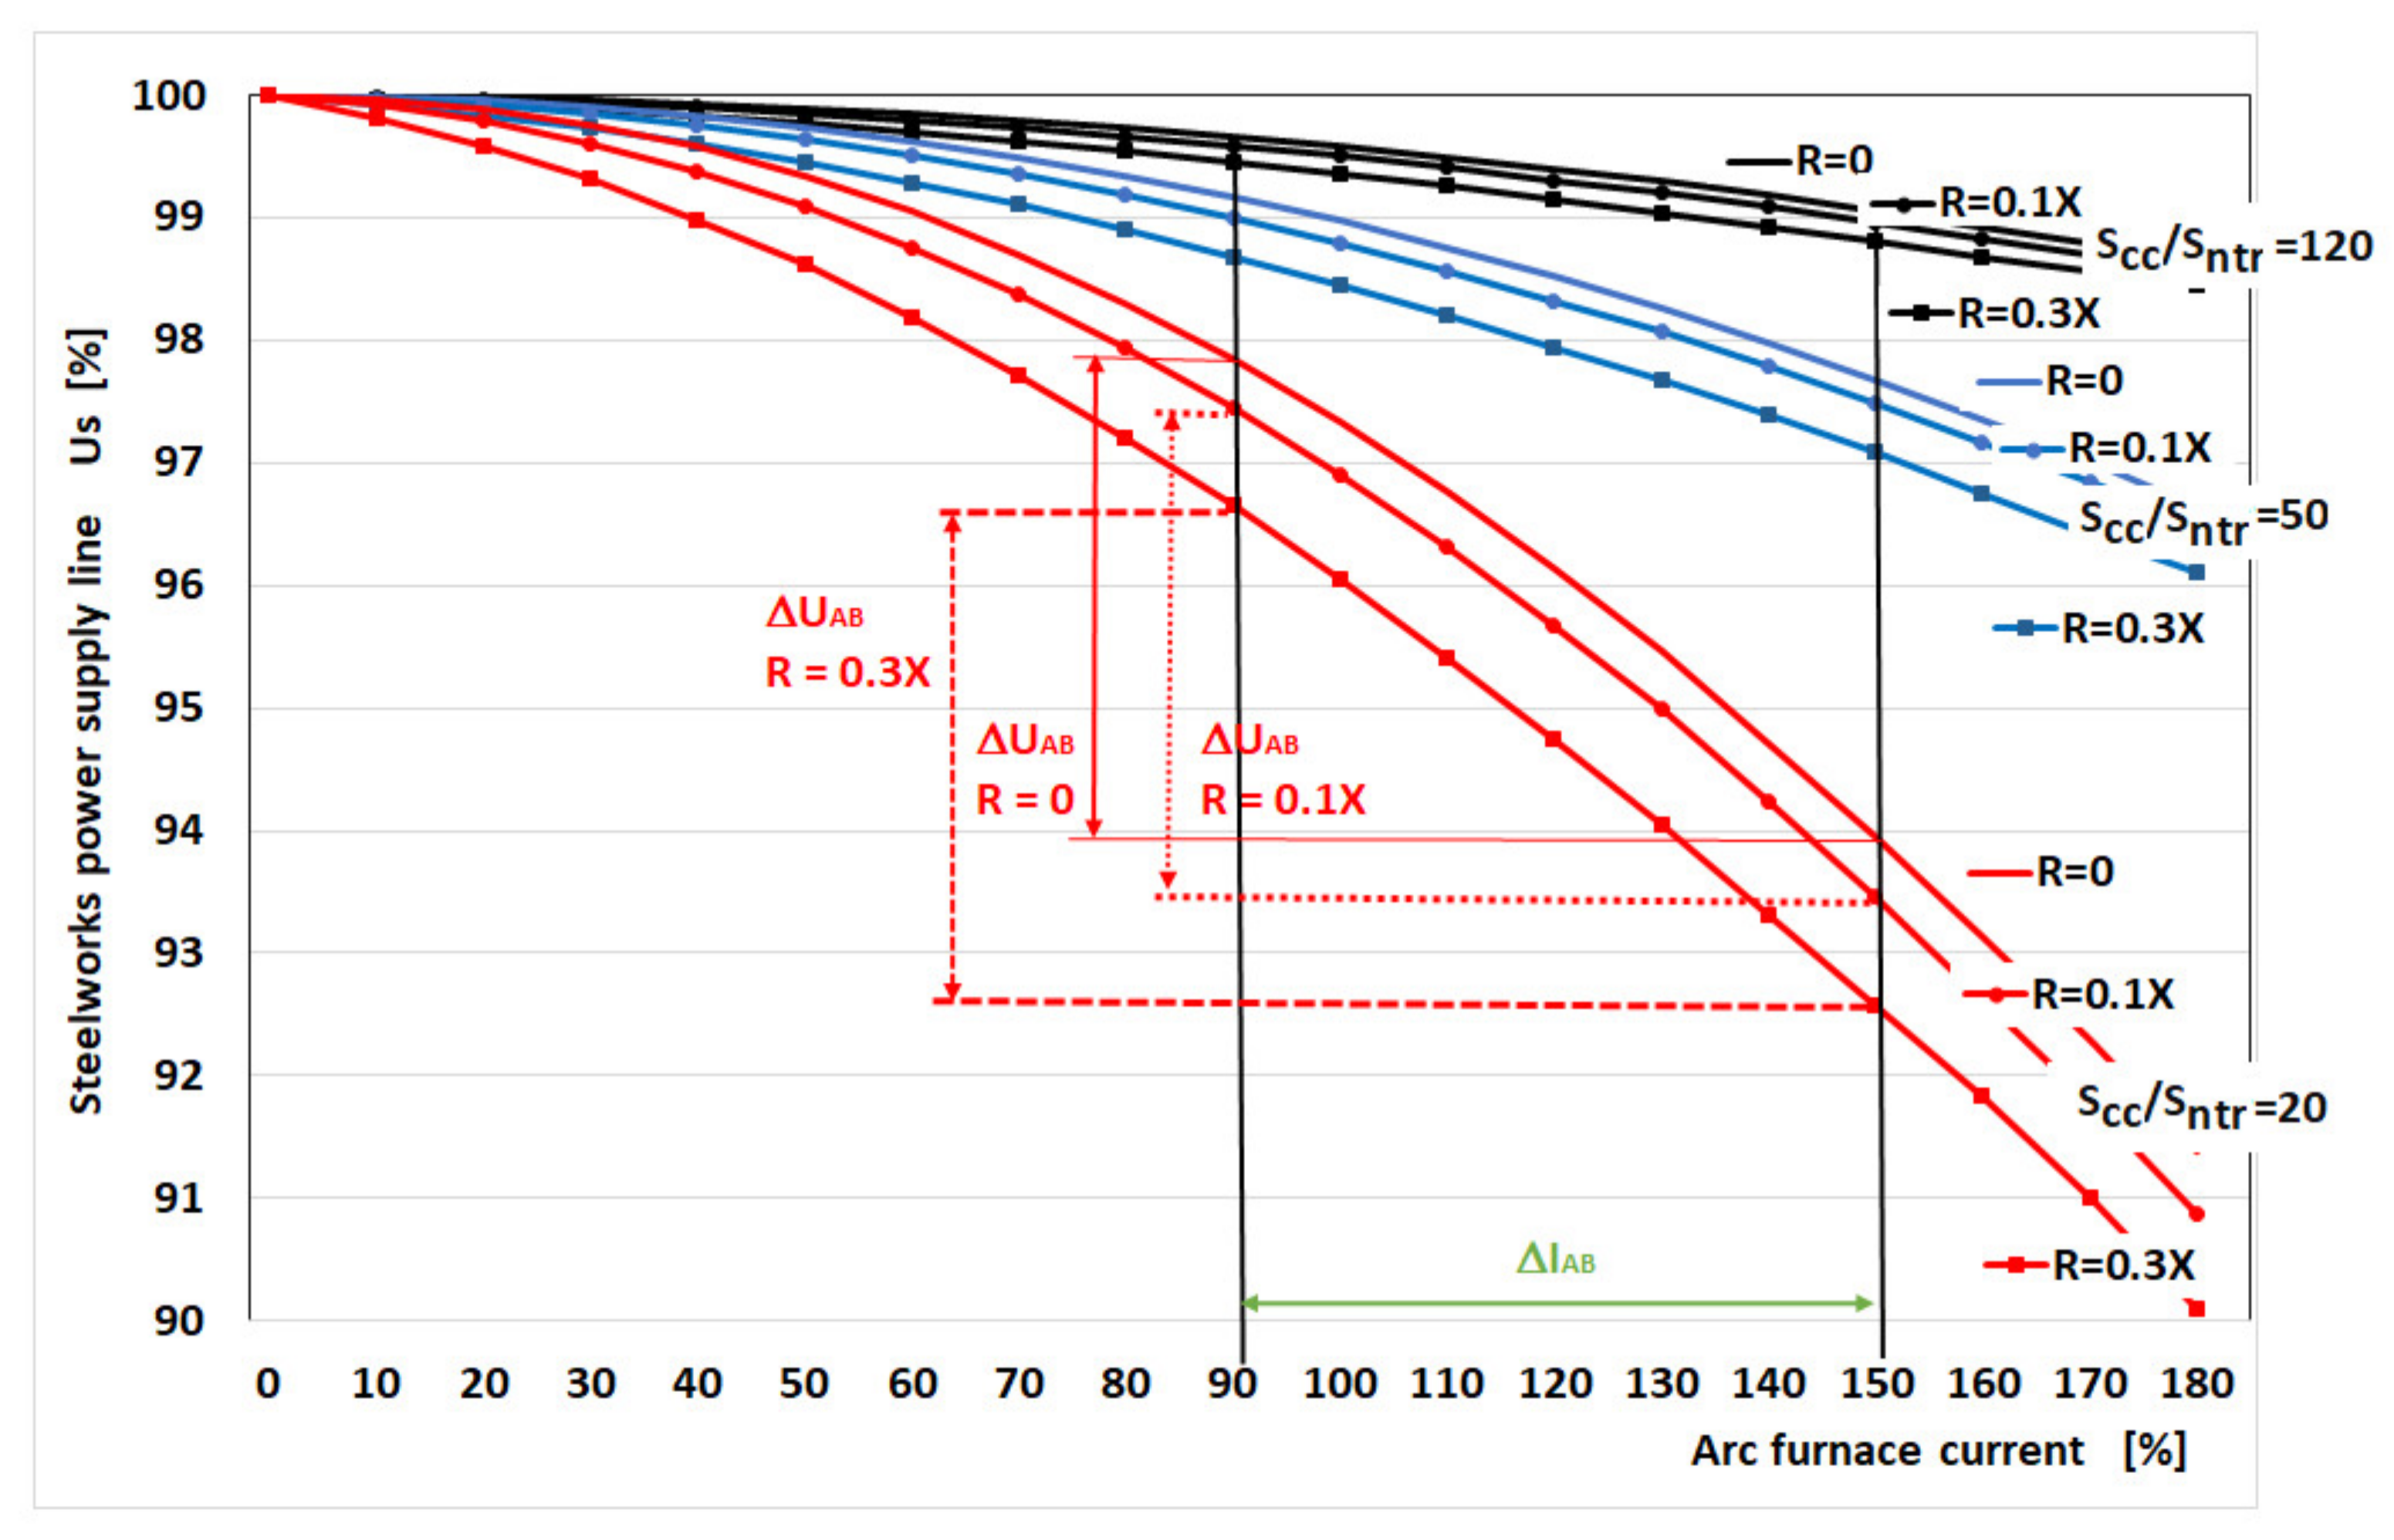
Figure 10 compares the graphs with and without the resistance in the electric arc supply line. For a sufficiently high short-circuit power of the supply network Scc/Sntr = 120, omitting the resistance does not cause significant errors in determining voltage fluctuations—Table 1.
For the range of furnace current changes between the extreme values of IA and IB (ΔIAB), a voltage fluctuation ΔUAB is generated. In the case of a sufficiently high short-circuit power of the network in relation to the power of the furnace transformer (Scc/Sntr = 120), omitting the resistance causes a difference in the calculated voltage fluctuation ΔUAB of 0.051% (in relation to the rated voltage Un = 100%). For Scc/Sntr = 50, the resistance omission has an error of 0.107% and for Scc/Sntr = 20 it is 0.19%.
Based on the analysis of the curves shown in Figure 10 and the analysis of the data in Table 1, it was found that the neglect of the resistance RL and RT has a negligible effect on the value of the determined voltage fluctuations. Taking into account only the resistances XL and XT in the electric arc supply circuit greatly simplifies the model calculations. The results of the calculations for the cases with and without resistance are presented in the further part of the article.
3. Modeling of Voltage Fluctuations in Parallel Operation of Arc Furnaces
Due to the non-linear nature of the electric arc, it is difficult to determine the voltage fluctuations in the parallel operation of arc devices.
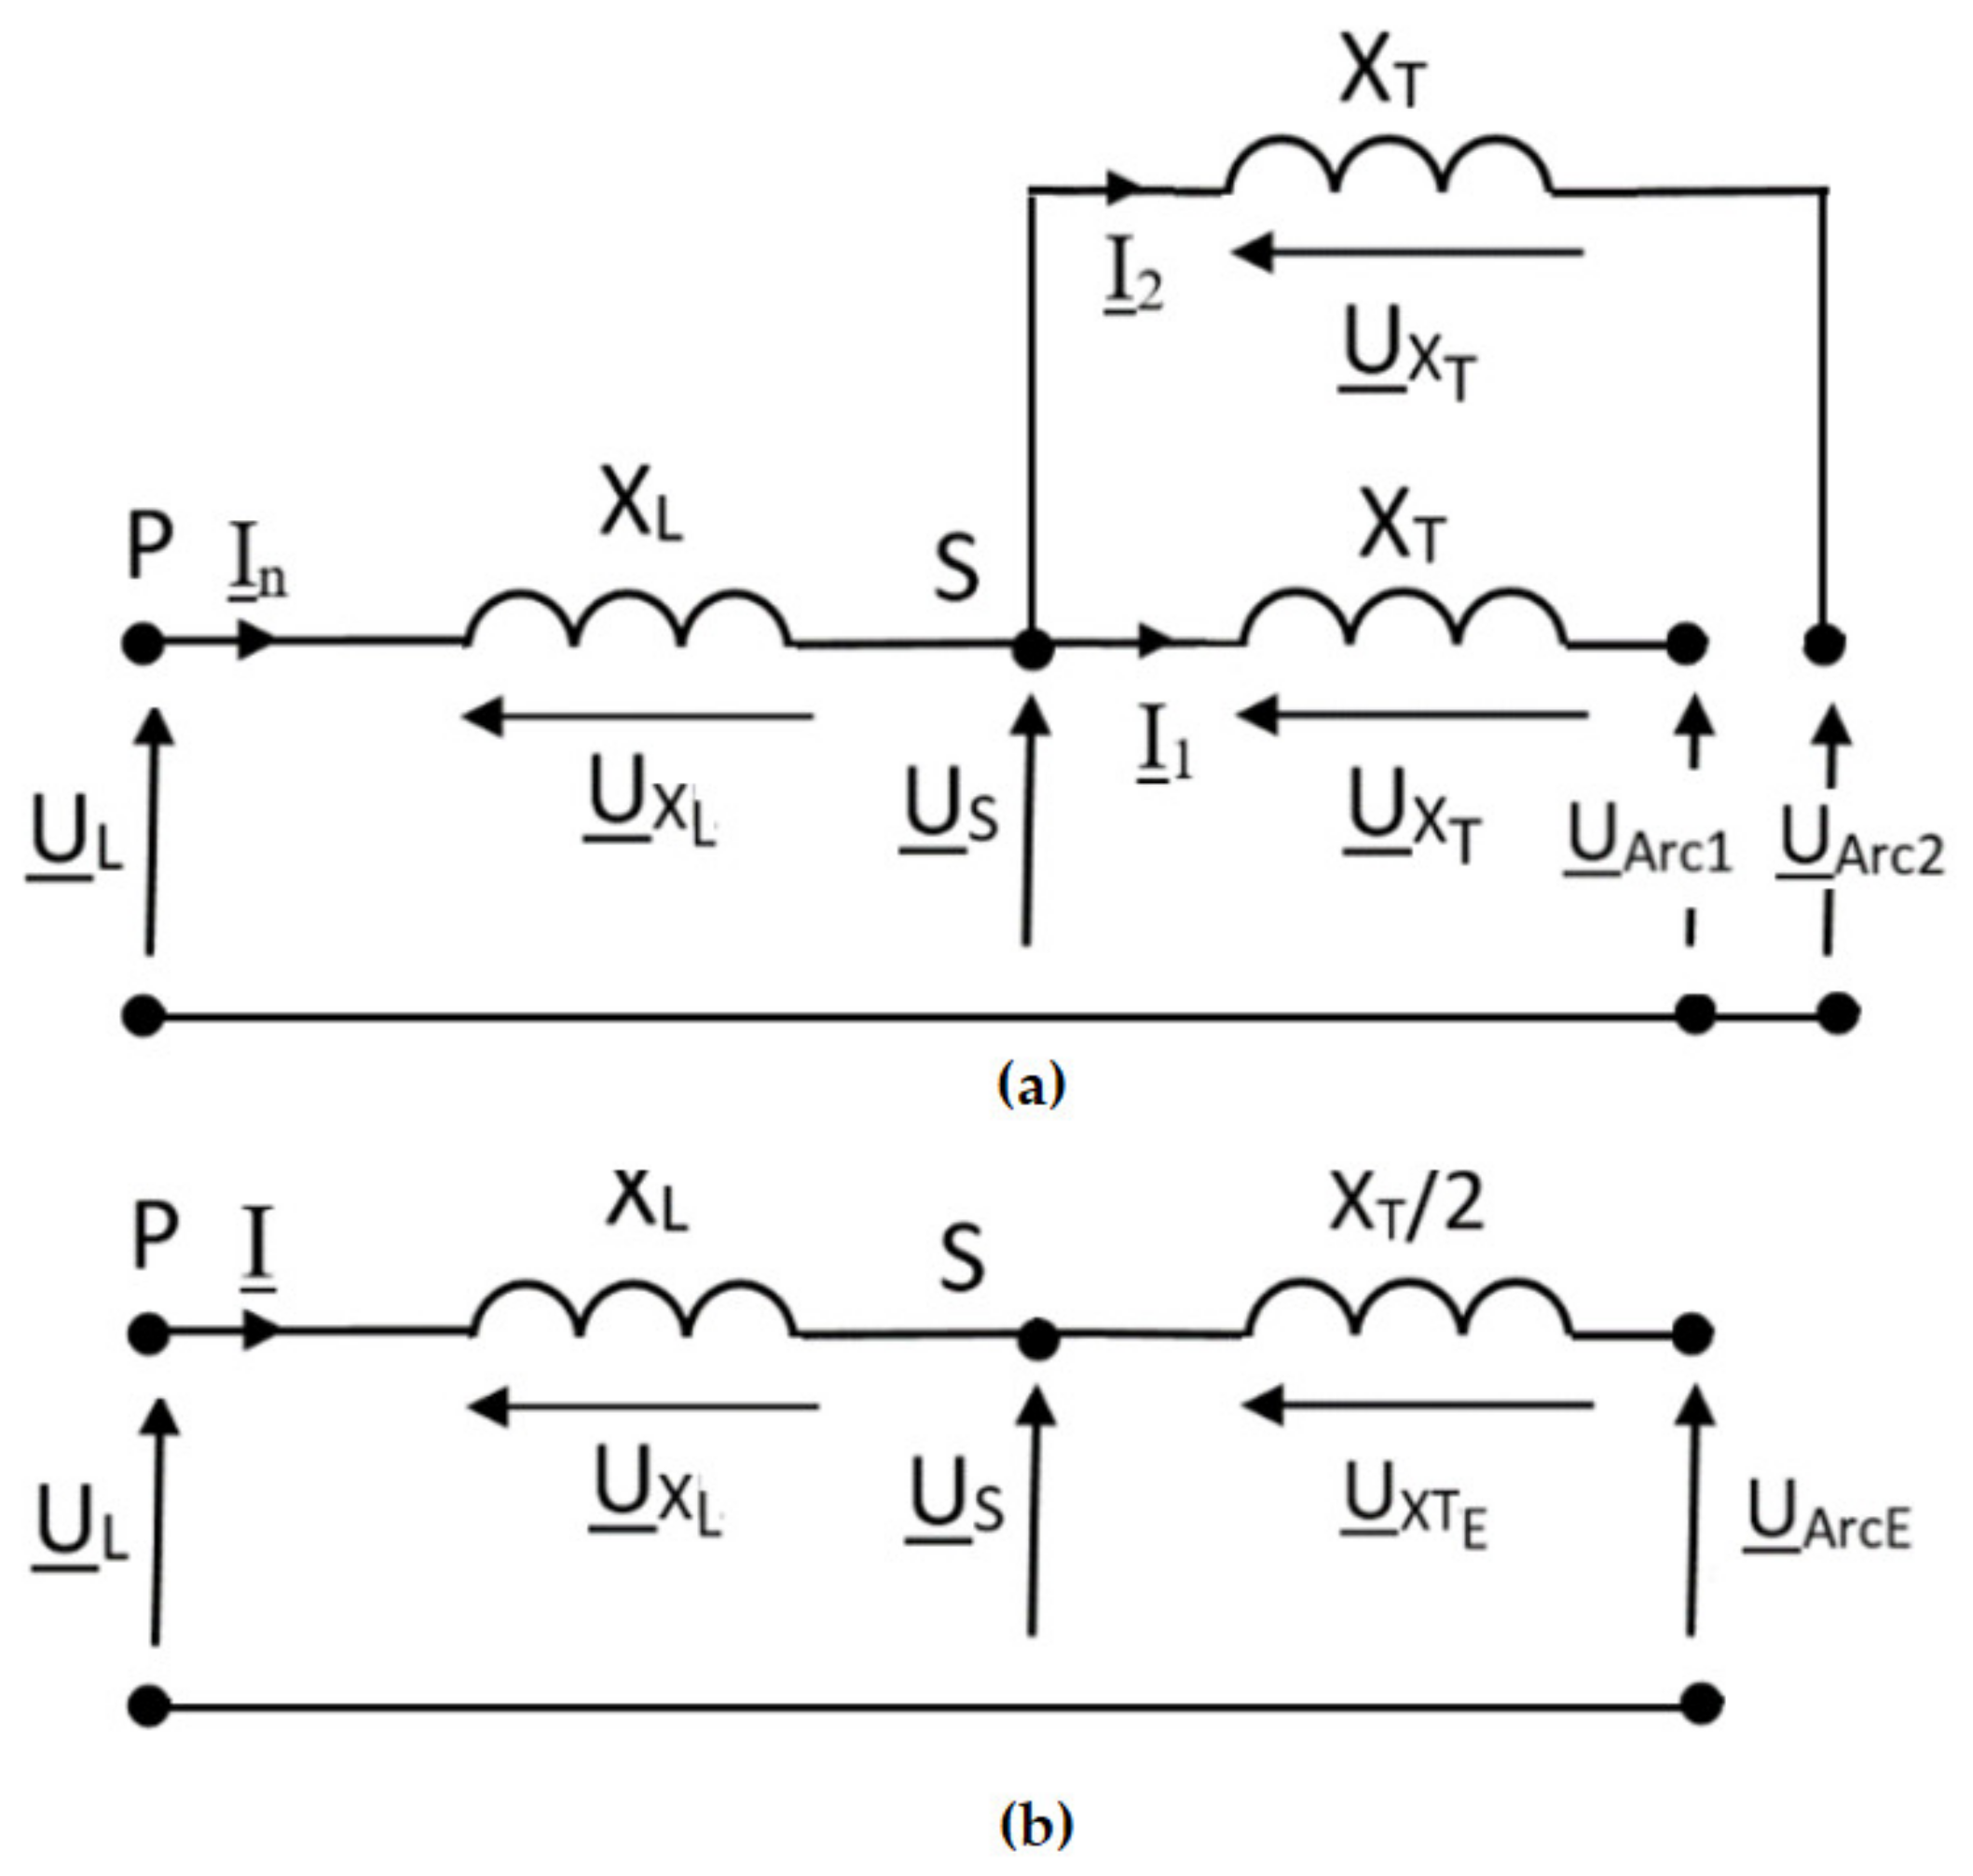
Figure 11 shows the power supply diagram for two parallel arc furnaces. The same power value of furnace transformers was assumed. Resistances RL and RT in the electric arc supply circuit were omitted.
The voltages on the “replacement electric arc furnace” for each of these conditions can be determined:
which is the same as its replacement reactance:
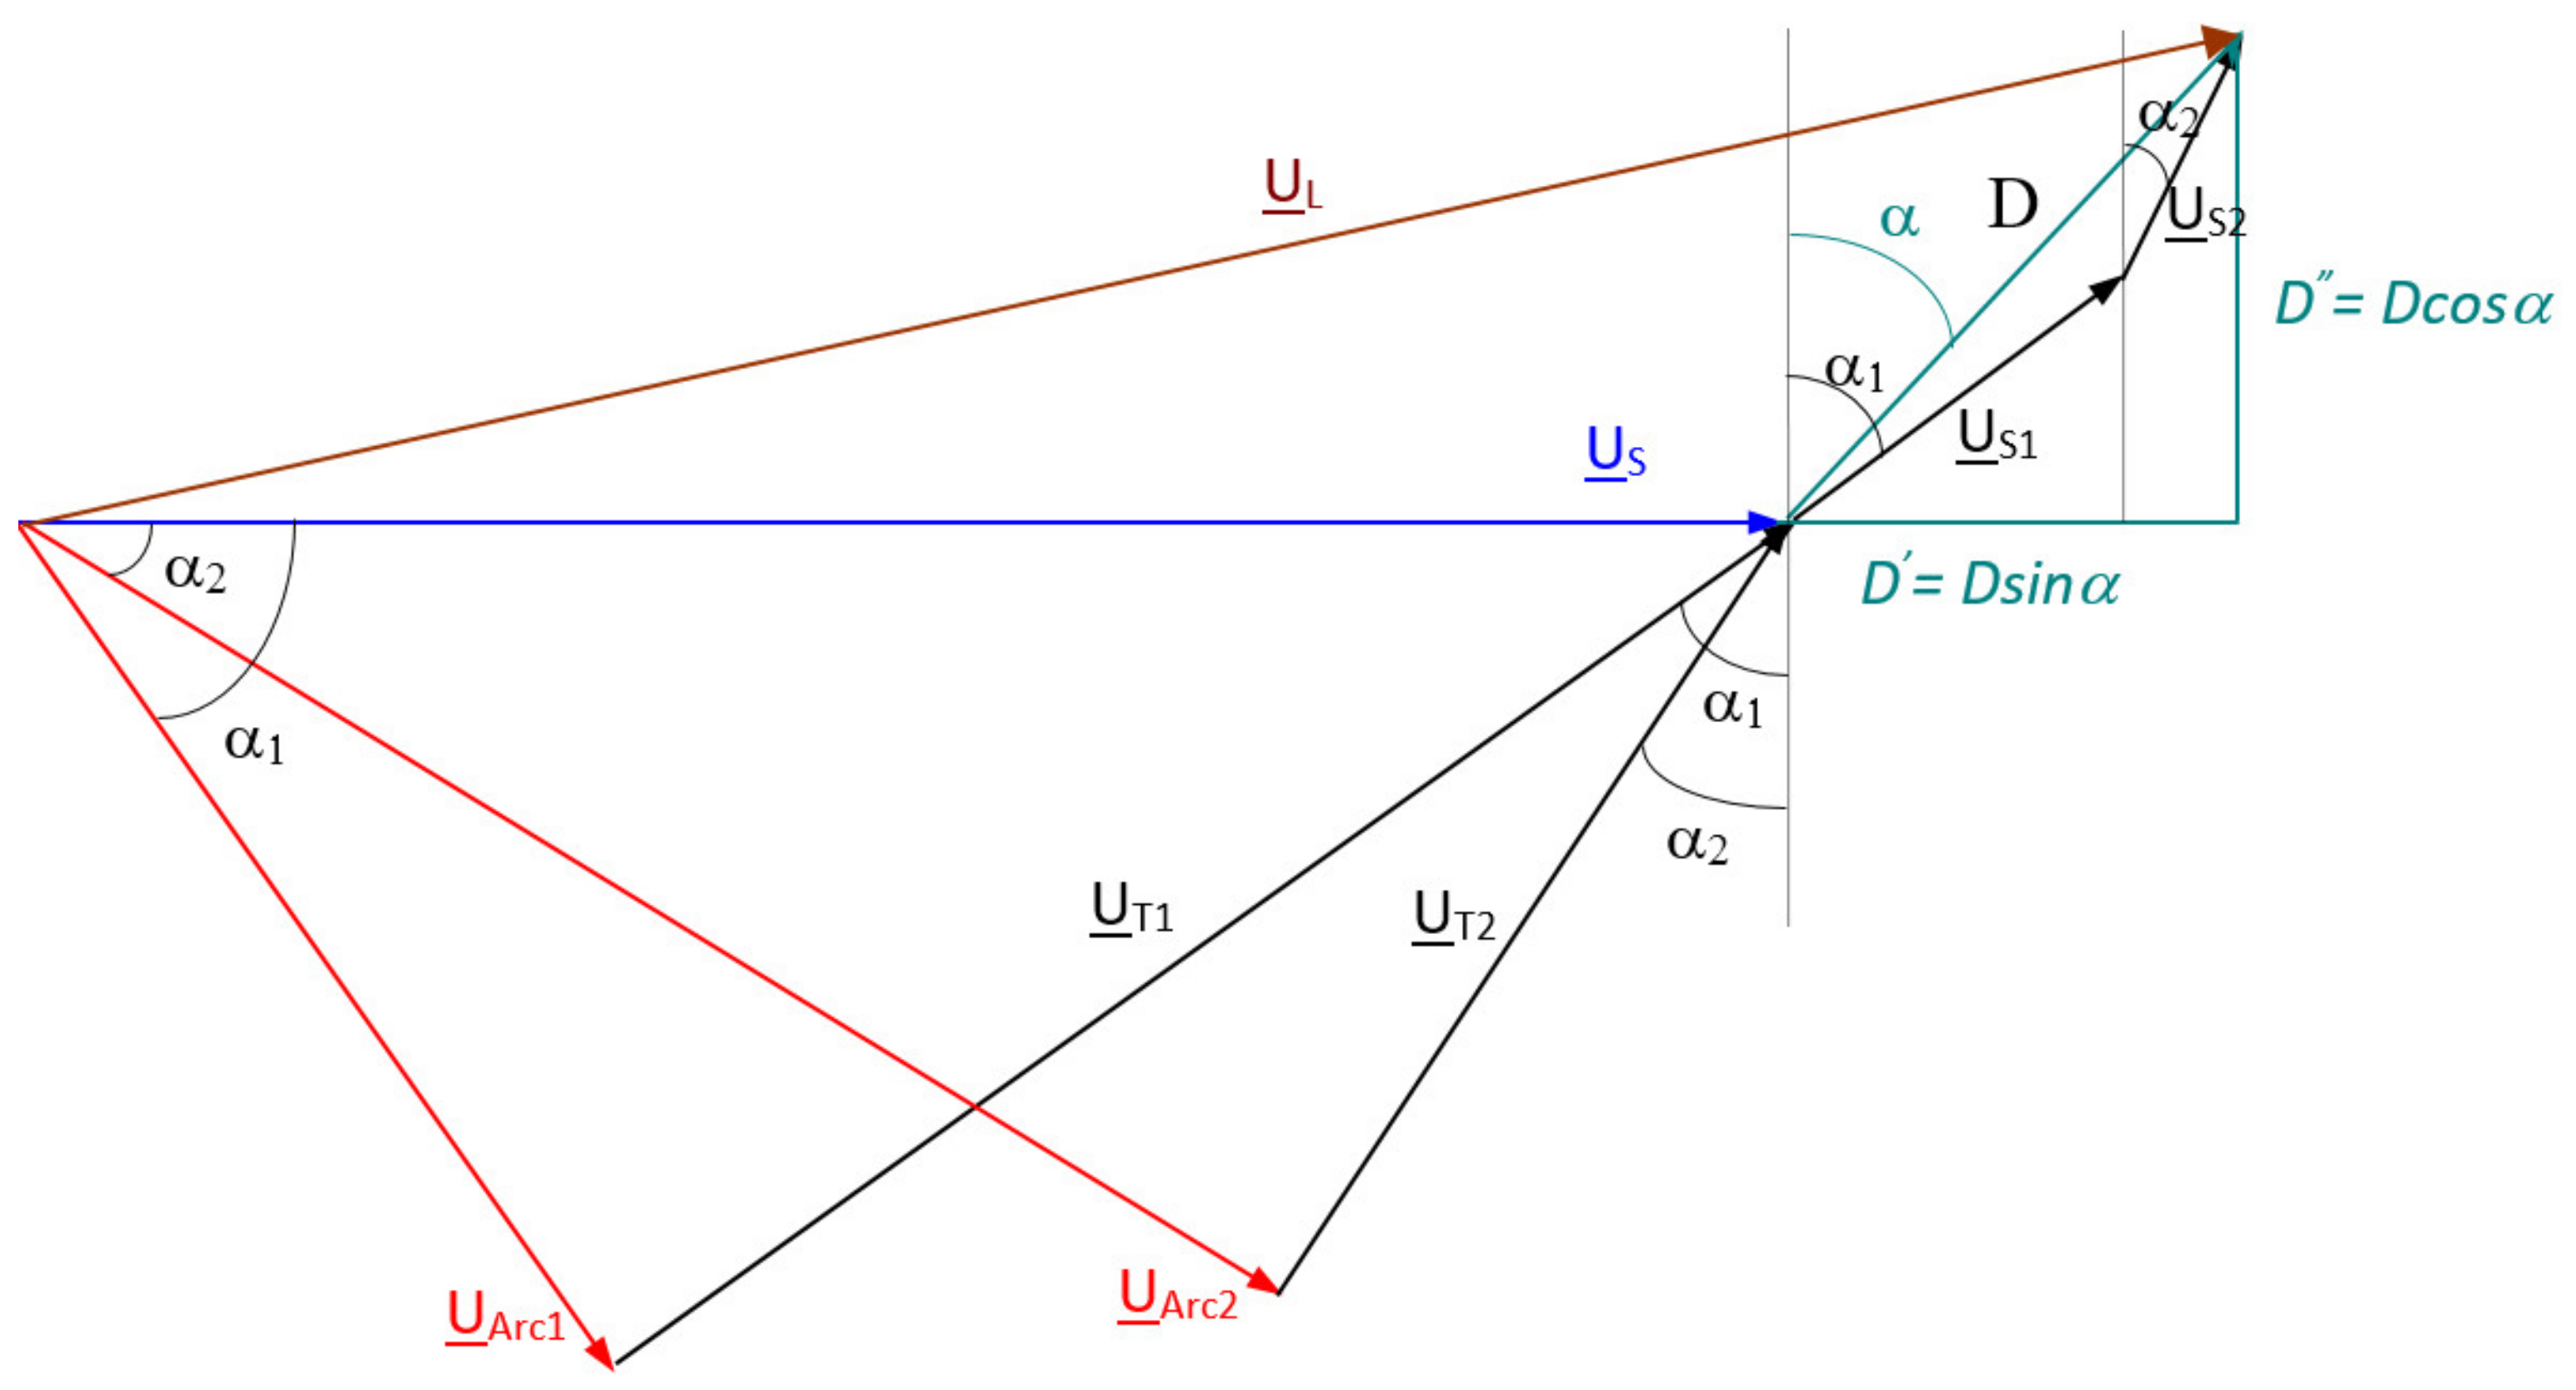
In case of different arc voltages in each furnace (e.g., UArcA in one furnace and UArcB in the other), the matter is more complicated. Changes of phase angles of voltages UArcA and UArcB must be adjusted to the unchanged value of the source voltage of the supply network (UL = 100%) and to maintain the same values of US modules on each of the furnaces operating in parallel and on the “replacement” furnace, i.e.,
Based on the vector diagram, as shown in Figure 12 the dependence can be written:
Substituting:
Assuming the dependencies:
and substituting them to Equations (18) and (19), we obtain Formula (19) in the form:
After omitting the expressions (XL/XT)2, the above formula is simplified to the form:
from which the first approximation of the tension on the steel rails can be determined:
Successive approximations to US are obtained by substituting to Equation (23) until a satisfactory accuracy is obtained, i.e., when the voltage is UL = 100% (with an accuracy of 0.000001%). Due to the fact that US is determined by the method of successive approximations (iterative method), the accuracy presented in the paper was adopted 0.000001%. For example, the US determined in the first approximation is US(1) = 97.80056145%. In the last step (with the accepted accuracy), the determined voltage is Us = 97.80876776%.
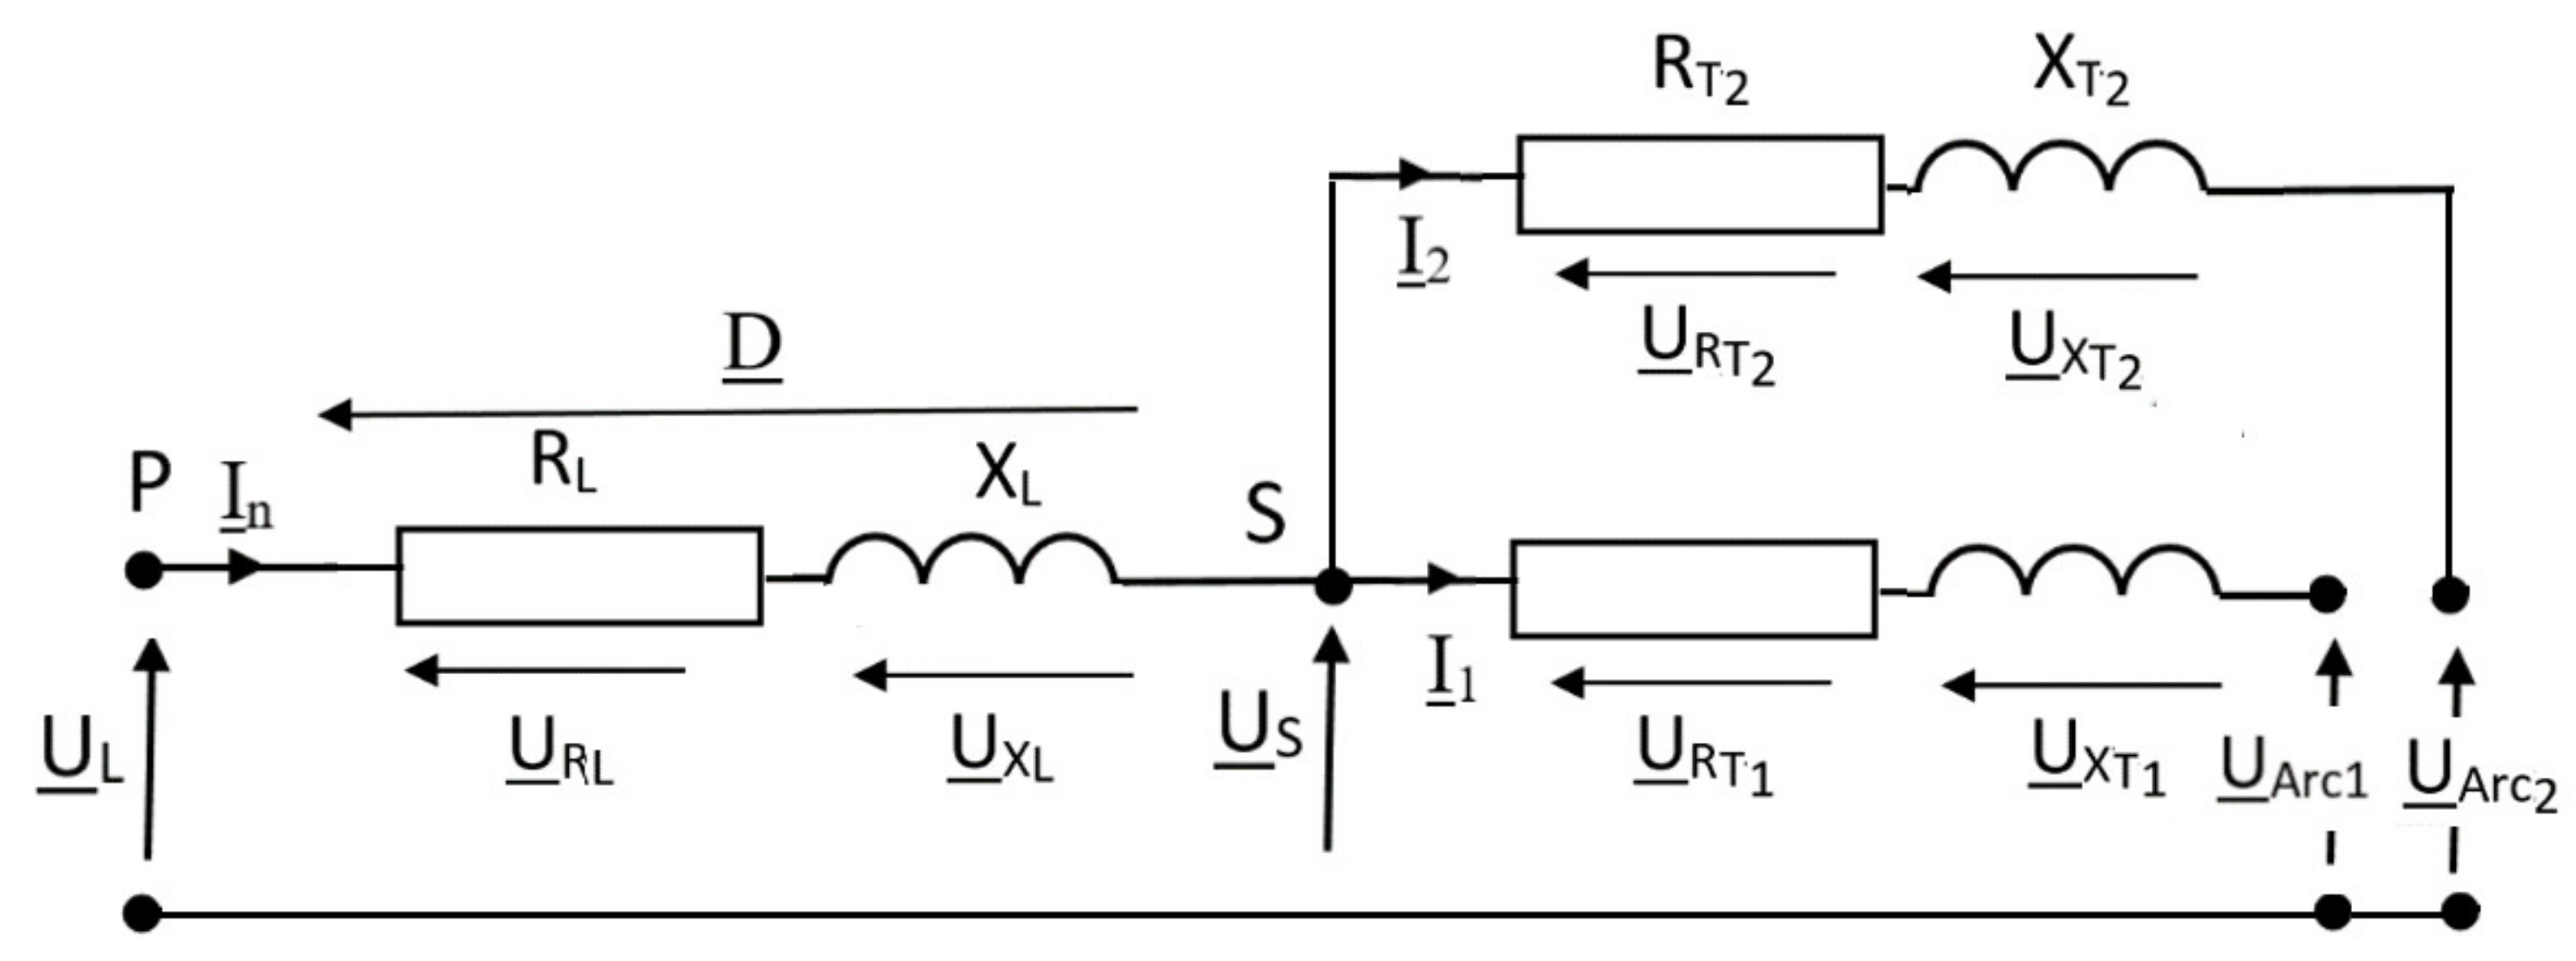
Figure 13 shows a diagram of the power supply system of a steelworks with two arc furnaces, taking into account the resistance in the electric arc supply circuit.
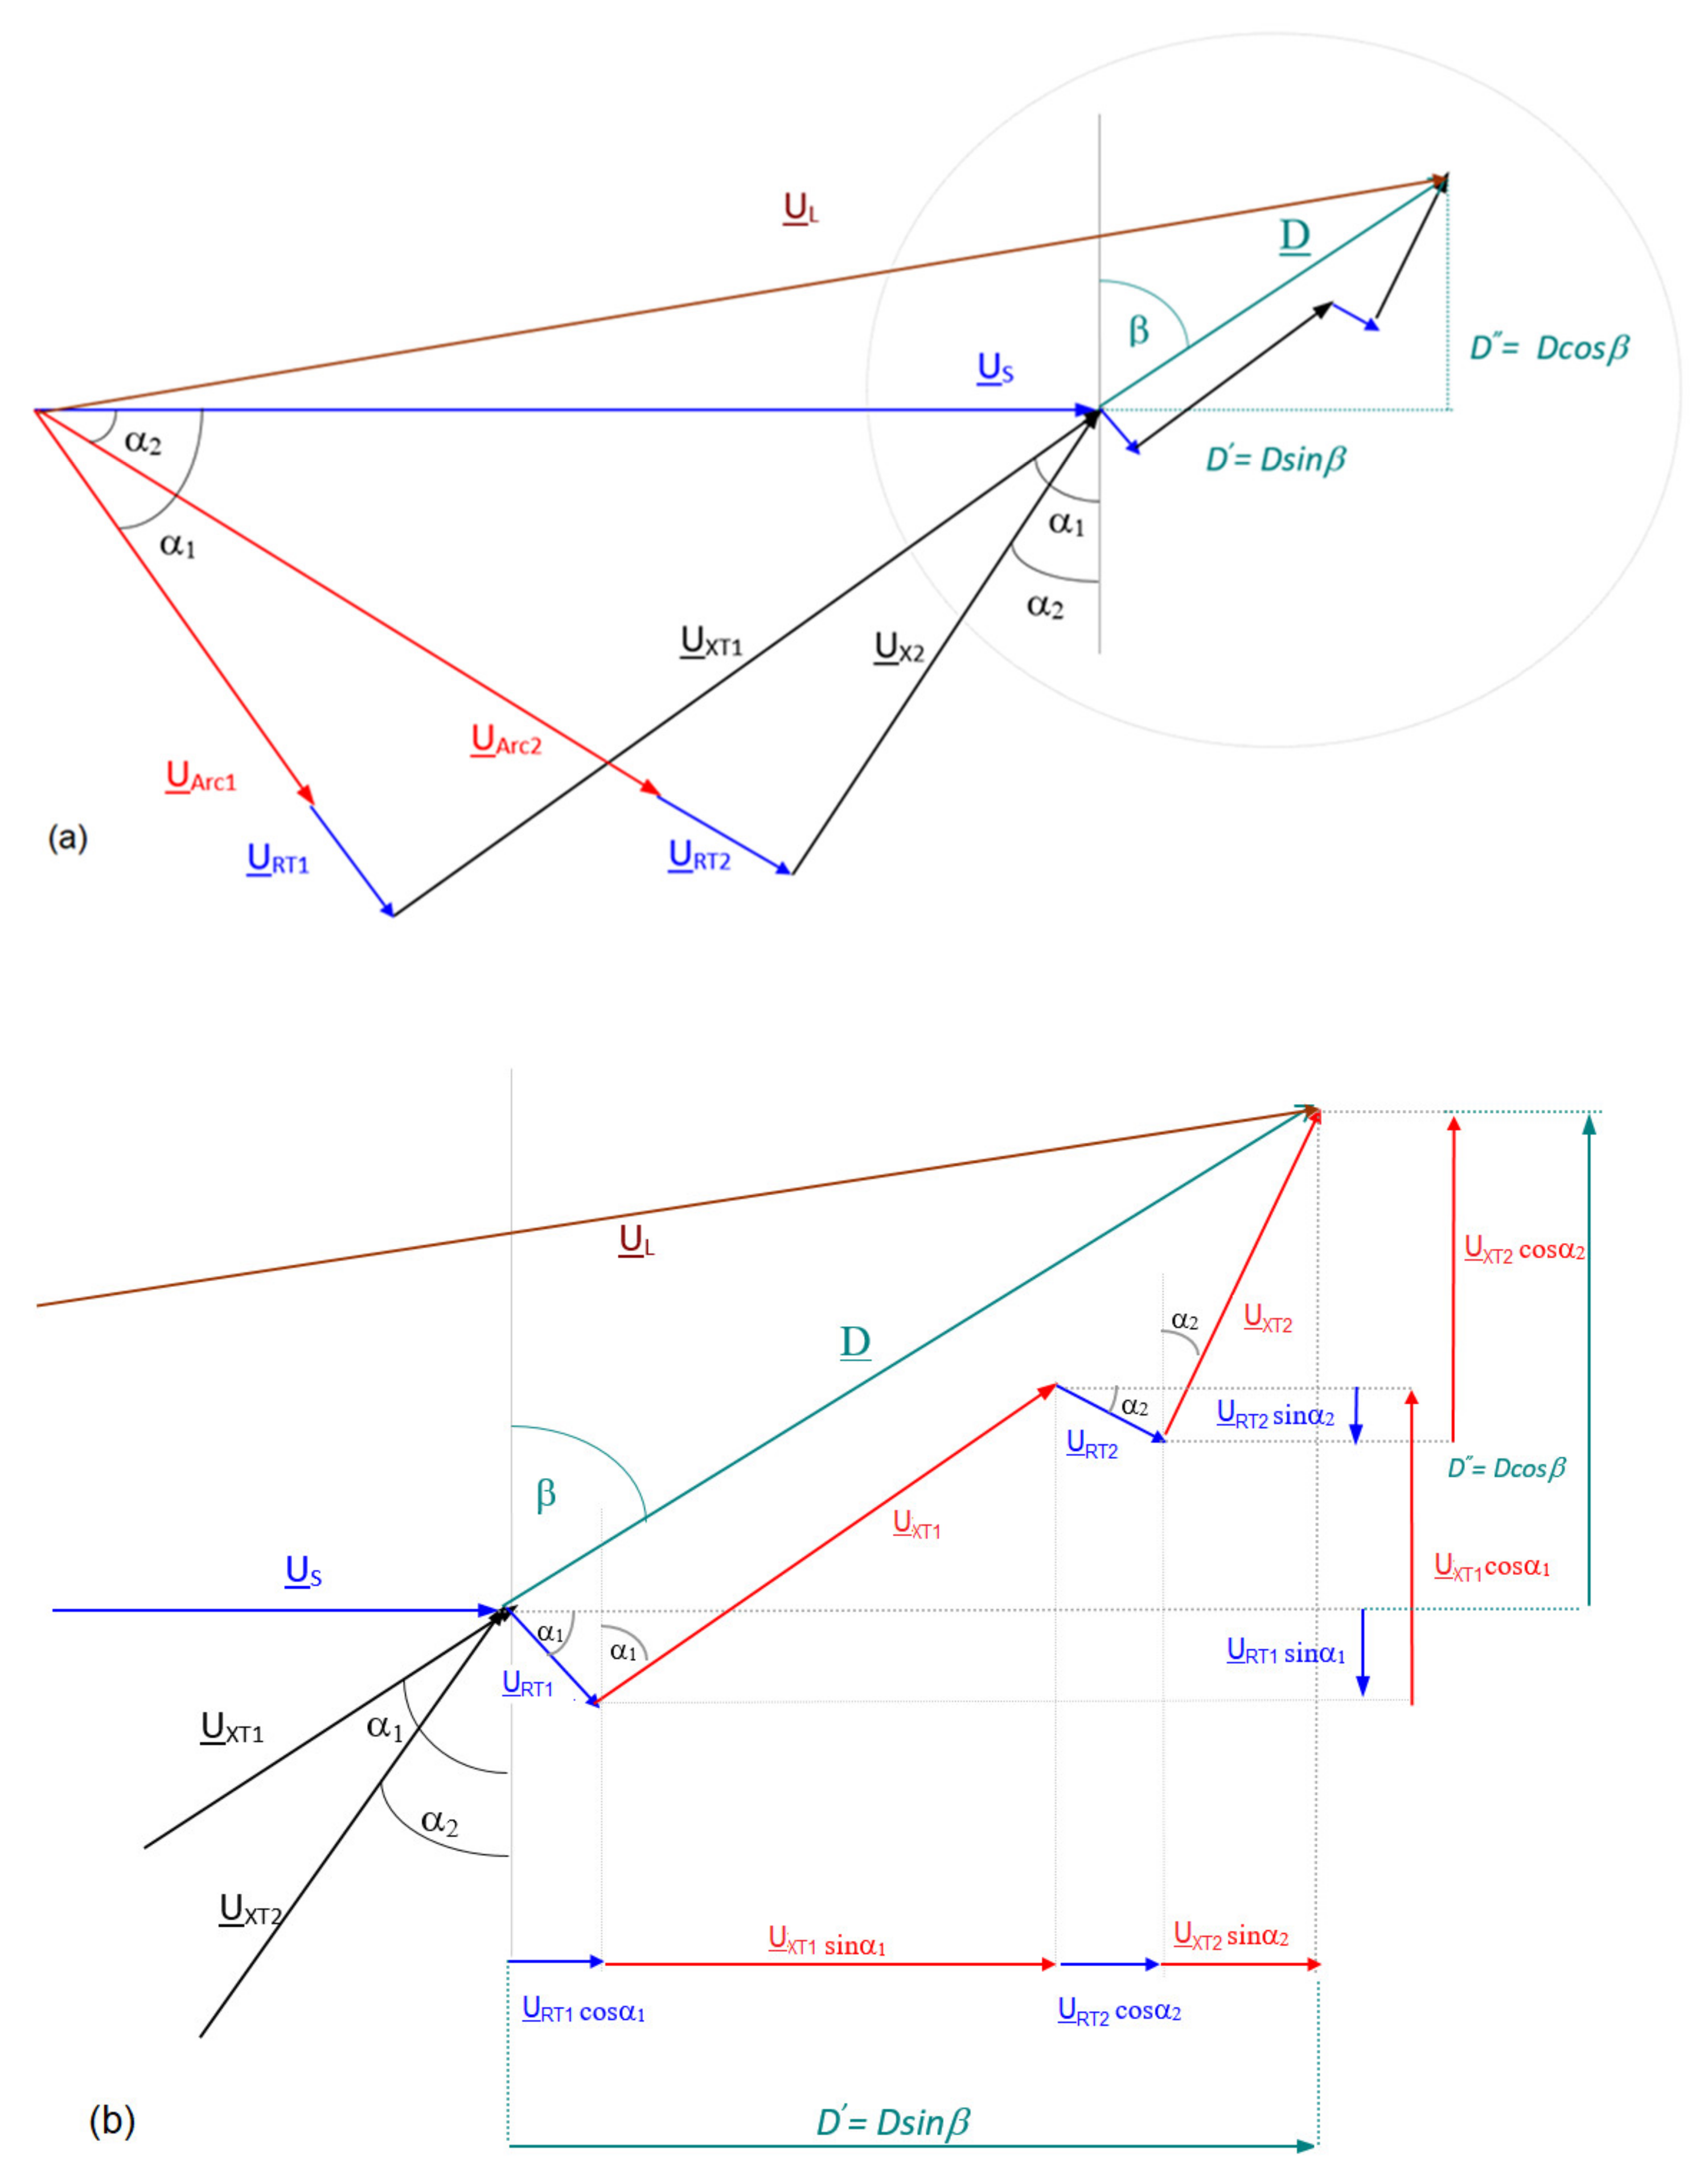
Based on the vector diagram presented in Figure 14, the following dependencies were determined:
hence:
we get (for RT1 = RT2 and XT1 = XT2):
The determined voltage US1 (in the first approximation—Equation (31) is substituted for the equation):
Then, the supply voltage UL for the first US approximation is determined. By correcting US in accordance with the relationship:
another approximation US is determined until the assumed accuracy of the supply voltage is obtained, e.g., UL = 100% + 0.000001%.
Based on the calculated voltages USAA, USBB, USAB, USBA, the average value of the voltage on the rails of the steel plant is:
and the mean of the squares of US voltages:
and standard deviation SD (US2):
Based on the knowledge of the standard deviation of the voltage in the operation of a single furnace SD(US1) and the standard deviation of the voltage in the operation of two furnaces SD(US2), it is possible to determine the coefficient of voltage fluctuation increase on the steel mill busbars caused by the connection of the second furnace—Equation (36).
The presented simulation tests were carried out for current changes between points A and B. It was assumed that these are the largest current changes occurring in the initial stage of smelting. Then, maximum voltage fluctuations arise due to voltage changes between the UA and the UB. During the melting of the scrap, the range of current changes decreases, which can be represented by a different current histogram, assuming that the current can assume the values of IC and ID, where IC = 1.1 IN and ID = 1.3 IN.
4. Verification of the Proposed Furnace Power Supply System with the Electric Arc Model
The proposed method of determining voltage fluctuations along with the adopted assumptions has been verified in industrial conditions. A series of measurements of indicators characterizing the power quality in the supply lines of arc furnaces were carried out. The measurements included weekly data logging cycles and periods for individual heats in electric arc furnaces. Steel plants with different supply conditions (different short-circuit power of the network) and different rated powers of furnace transformers were selected for the tests.
Depending on the research problem under consideration, the following are accepted—three-phase [45,46] or single-phase equivalent diagrams of the arc device with the power supply system [47,48,49,50]. In model studies of voltage fluctuations generated by arc furnaces, a single-phase equivalent diagram was adopted—Figure 4.
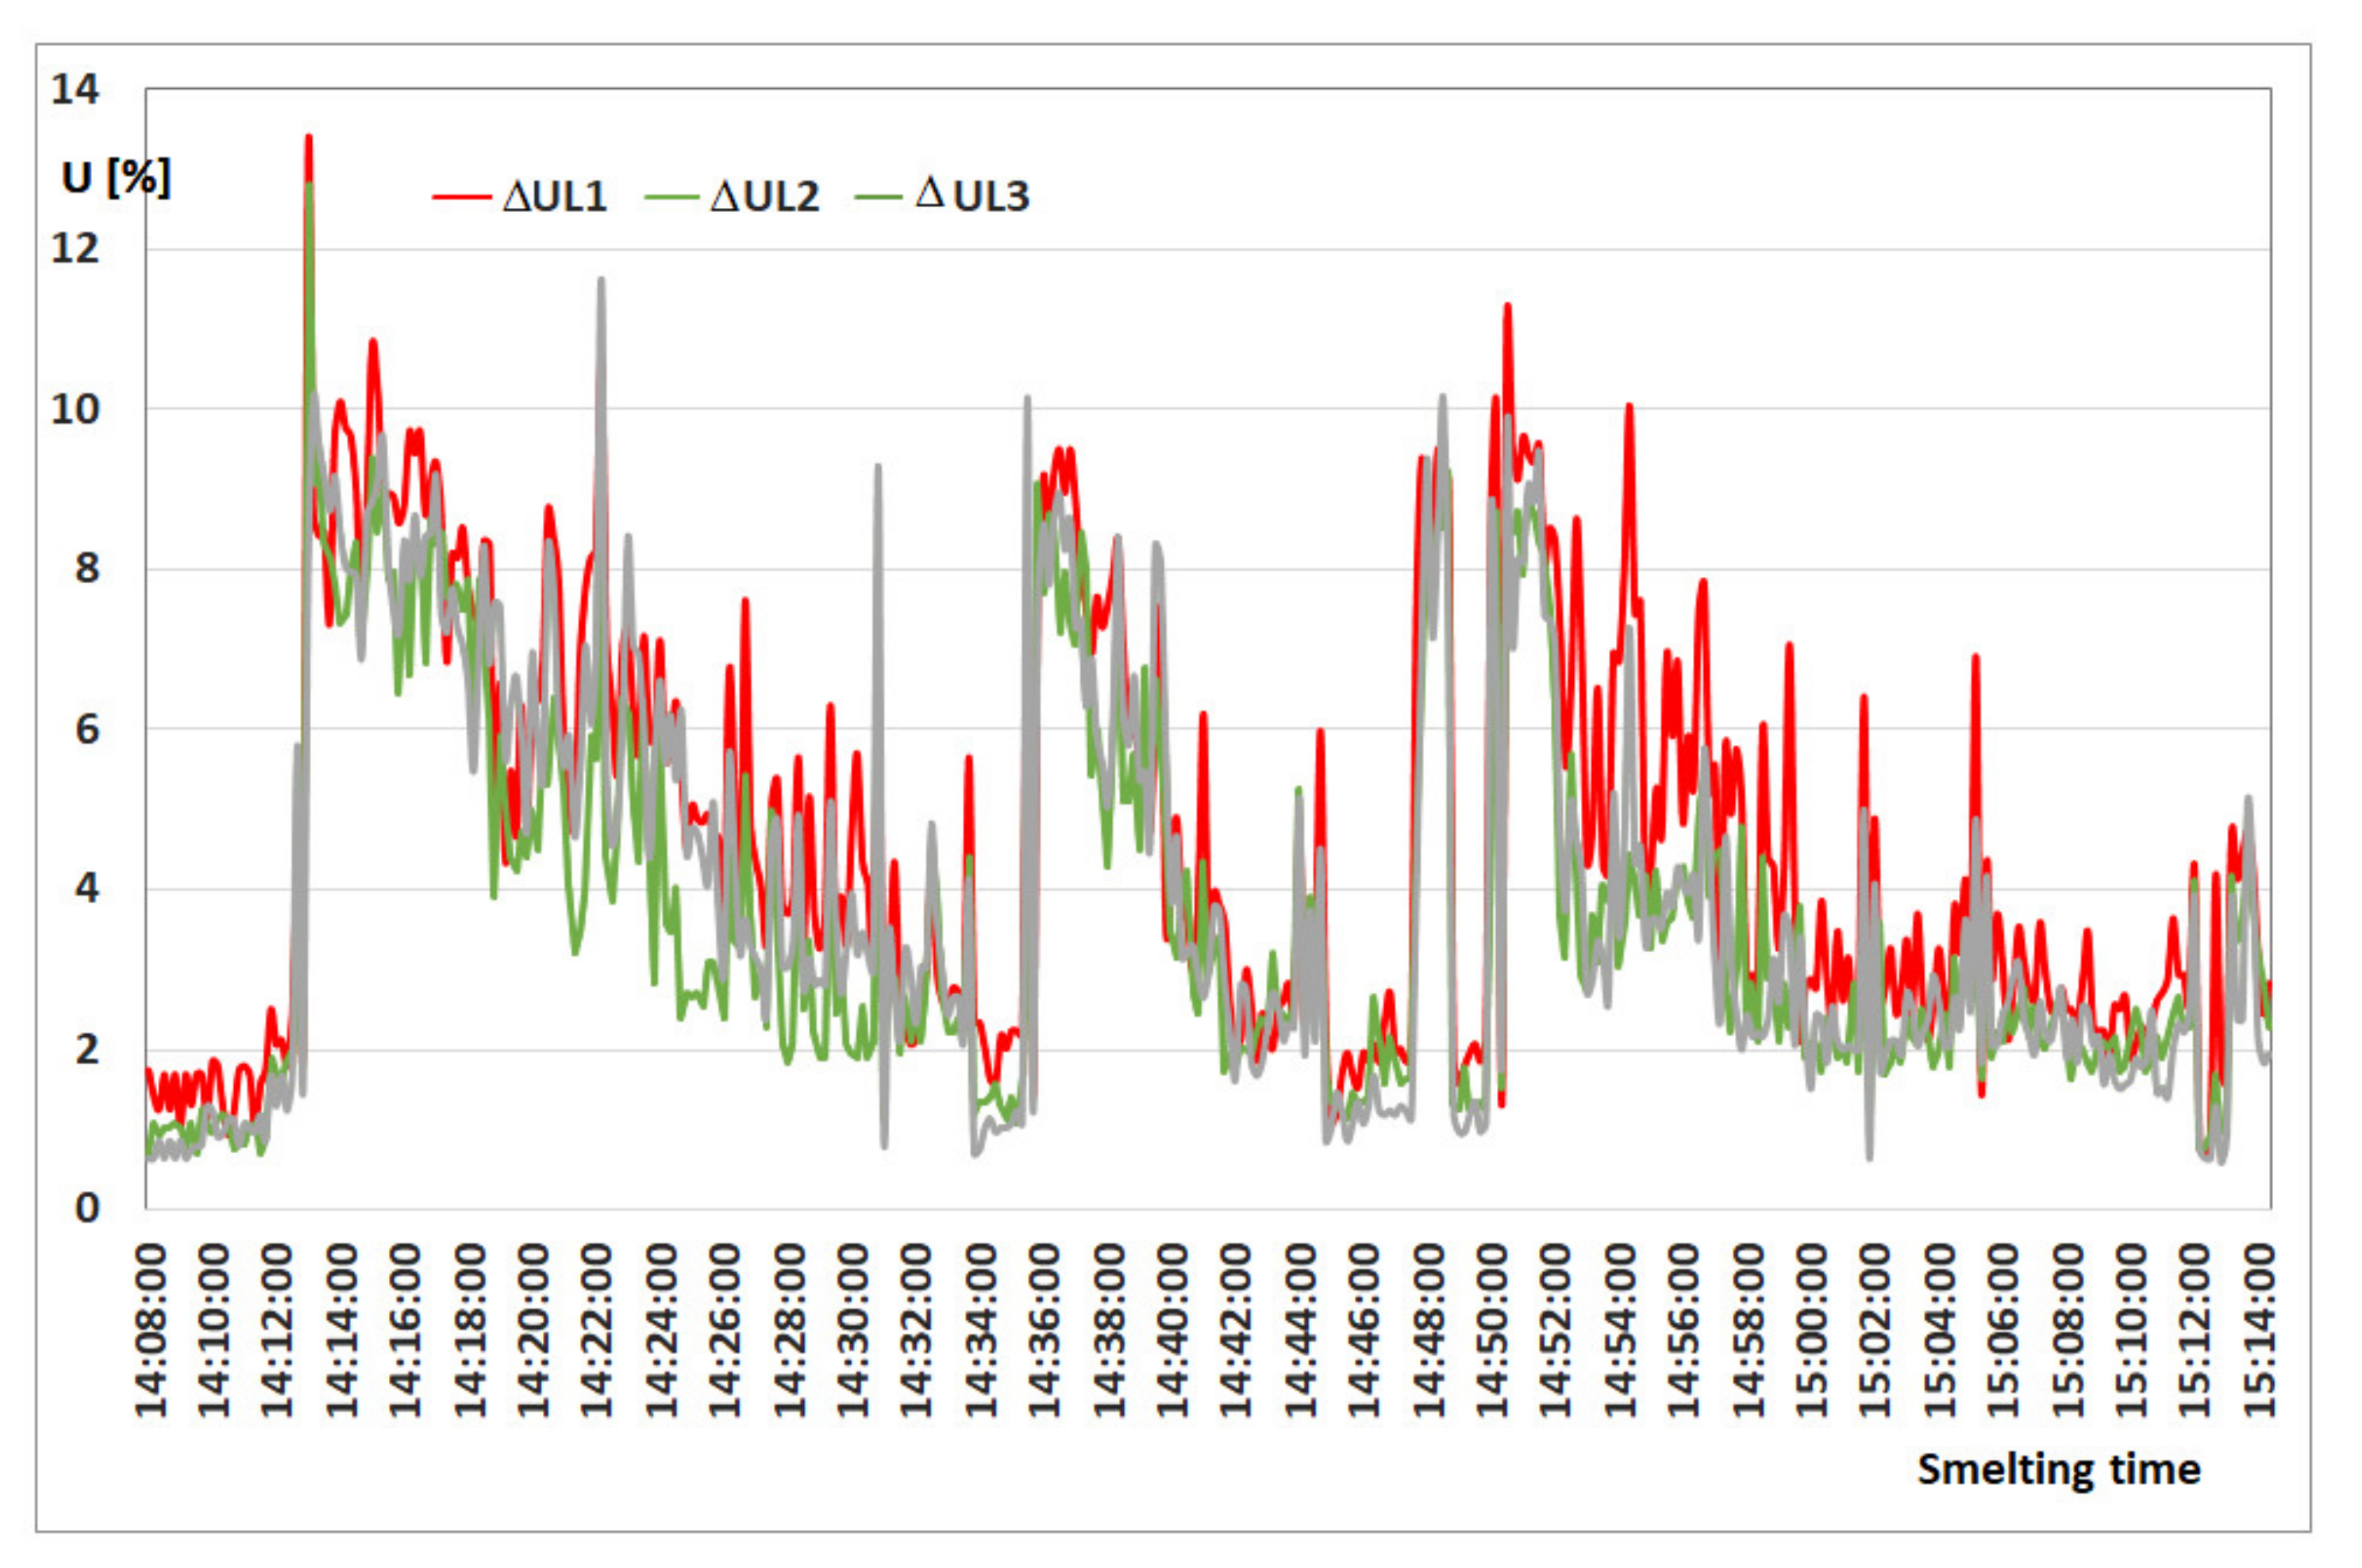
This is due to the high correlation of indicators characterizing voltage fluctuations in individual phases (ΔU, Pst). Figure 15 shows the voltage fluctuations recorded in all phases during one smelting in the arc furnace, where ΔUL1, ΔUL2, and ΔUL3 are the voltage fluctuations in the phases of the arc furnace supply line.
The correlation coefficients between voltage fluctuations recorded in individual phases are as follows:
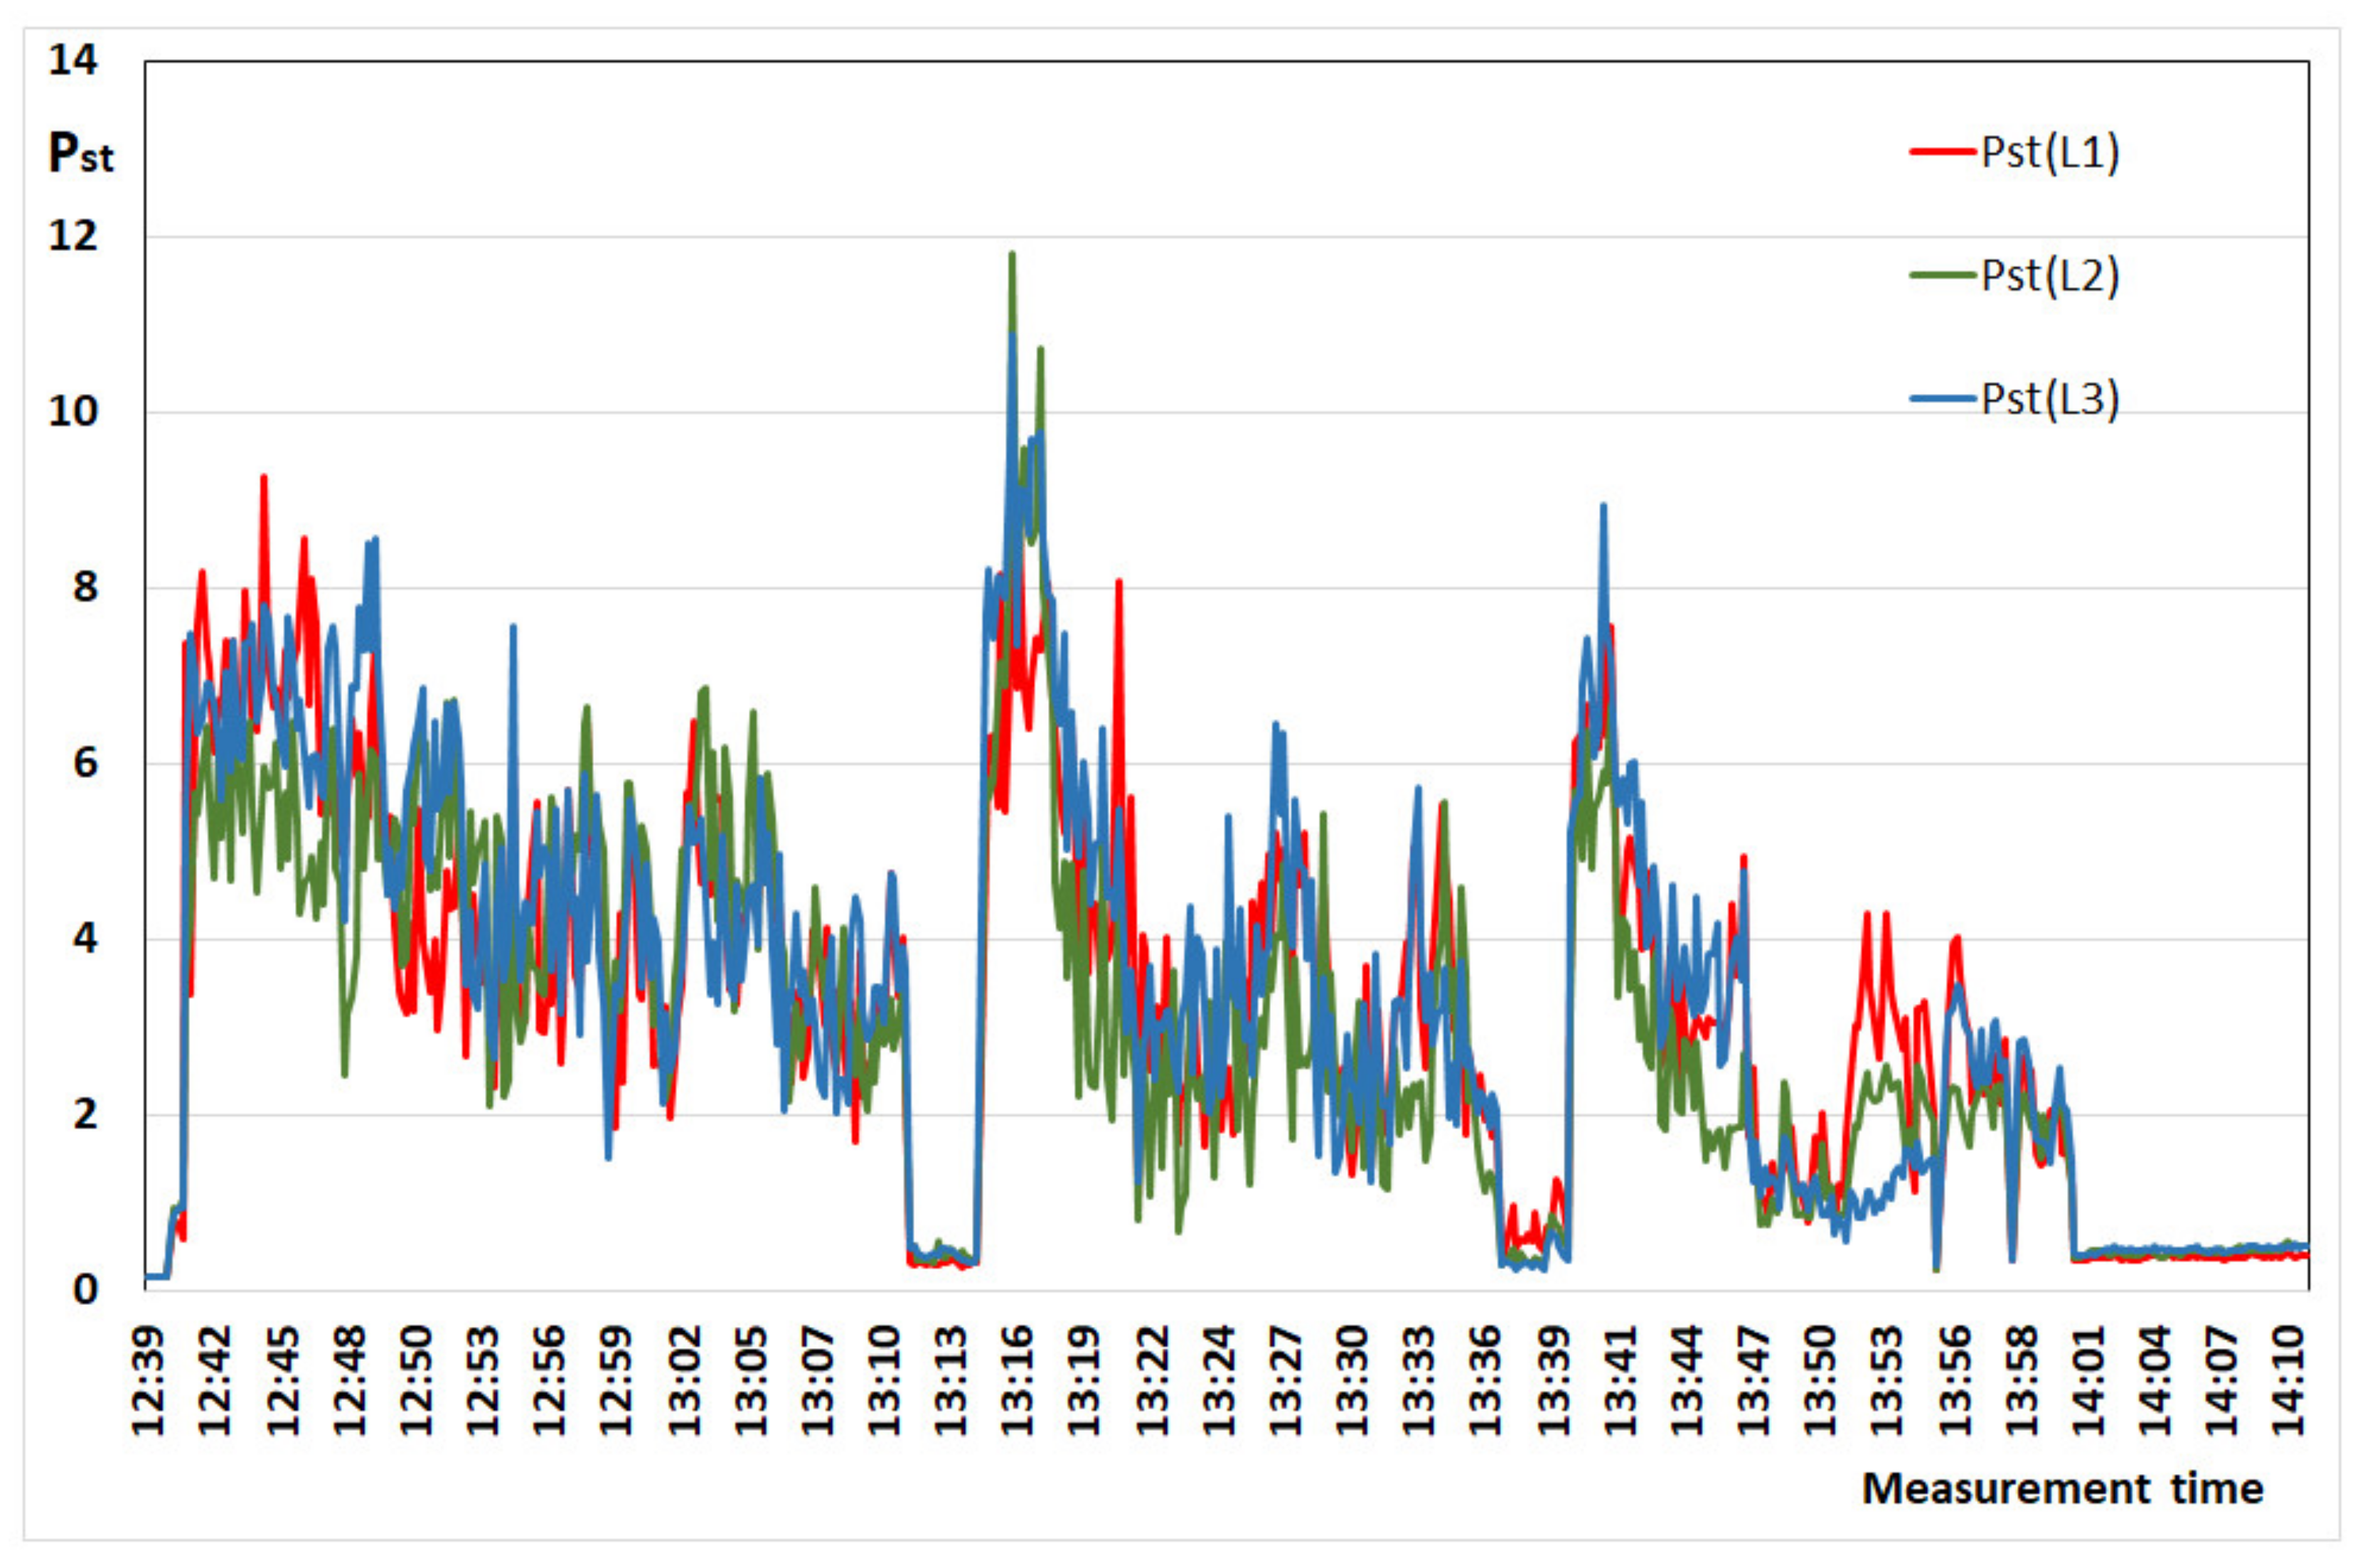
Another indicator, the changes of which registered in particular phases were analyzed, is the short-term flicker severity Pst. The short-term flicker severity Pst is directly related to voltage fluctuations, which result in the flicker phenomenon generated by lighting receivers.
The statistical analysis of the short-term flicker severity Pst was based on the data recorded during individual melts. Figure 16 shows the change of the Pst coefficient measured in the three phases of the steelworks supply network during one melt carried out in the arc furnace.
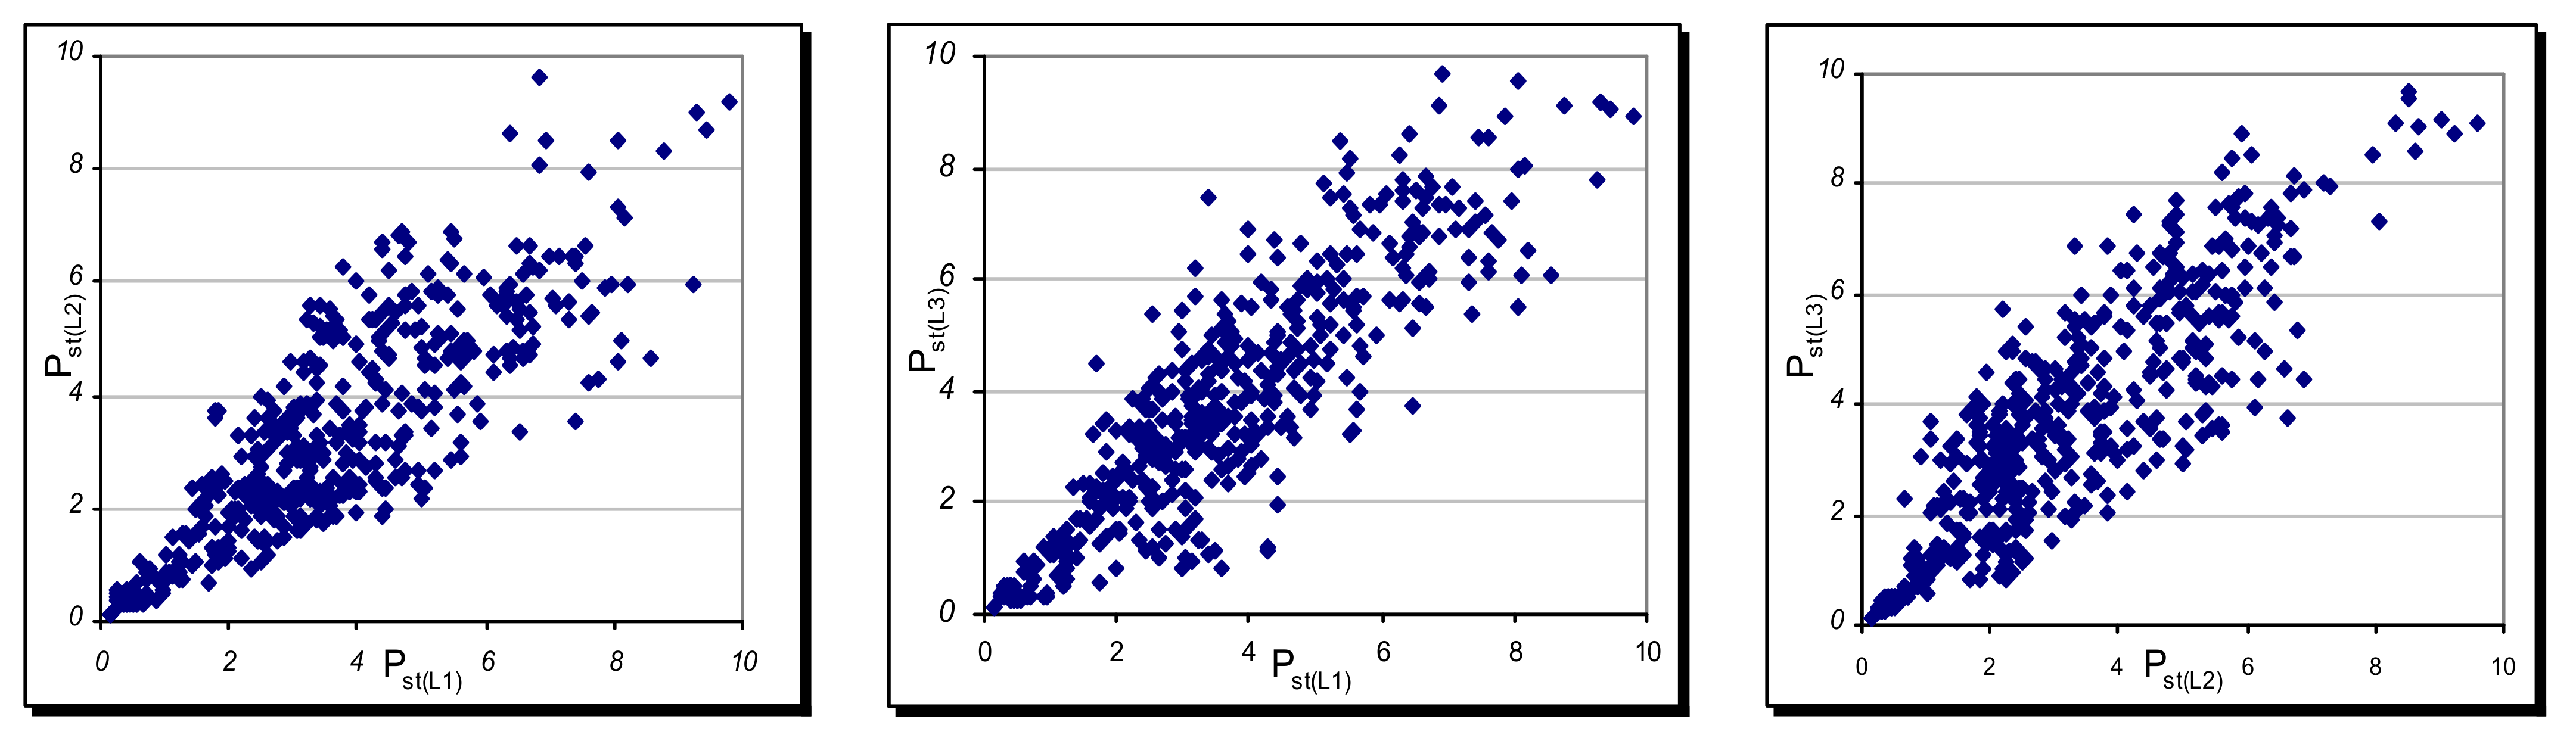
A short analysis of the obtained measurement results in three phases is presented below. The relationships between the indicators recorded in individual phases are shown in Figure 17.
The correlation coefficients between the indicators recorded in individual phases are as follows:
The correlation coefficients between the indicators measured in individual phases and their average value are slightly higher and amount to
It was limited to taking into account the results of measurements in the phase with the greatest voltage fluctuations, as it is adopted in Electricite de France [51].
Based on the determined correlation coefficients between voltage fluctuations in individual phases and a very large correlation of the short-term flicker severity, it was limited to model studies based on a single-phase scheme. In similar cases, Electricite de France [51] recommends taking into account the measurement results in the phase with the largest voltage fluctuations.
The electric arc is represented by the arc voltage UArc. The arc has been mapped using an ideal source of sinusoidal voltage with an amplitude dependent on the arc length, which is the fundamental harmonic of the arc voltage.
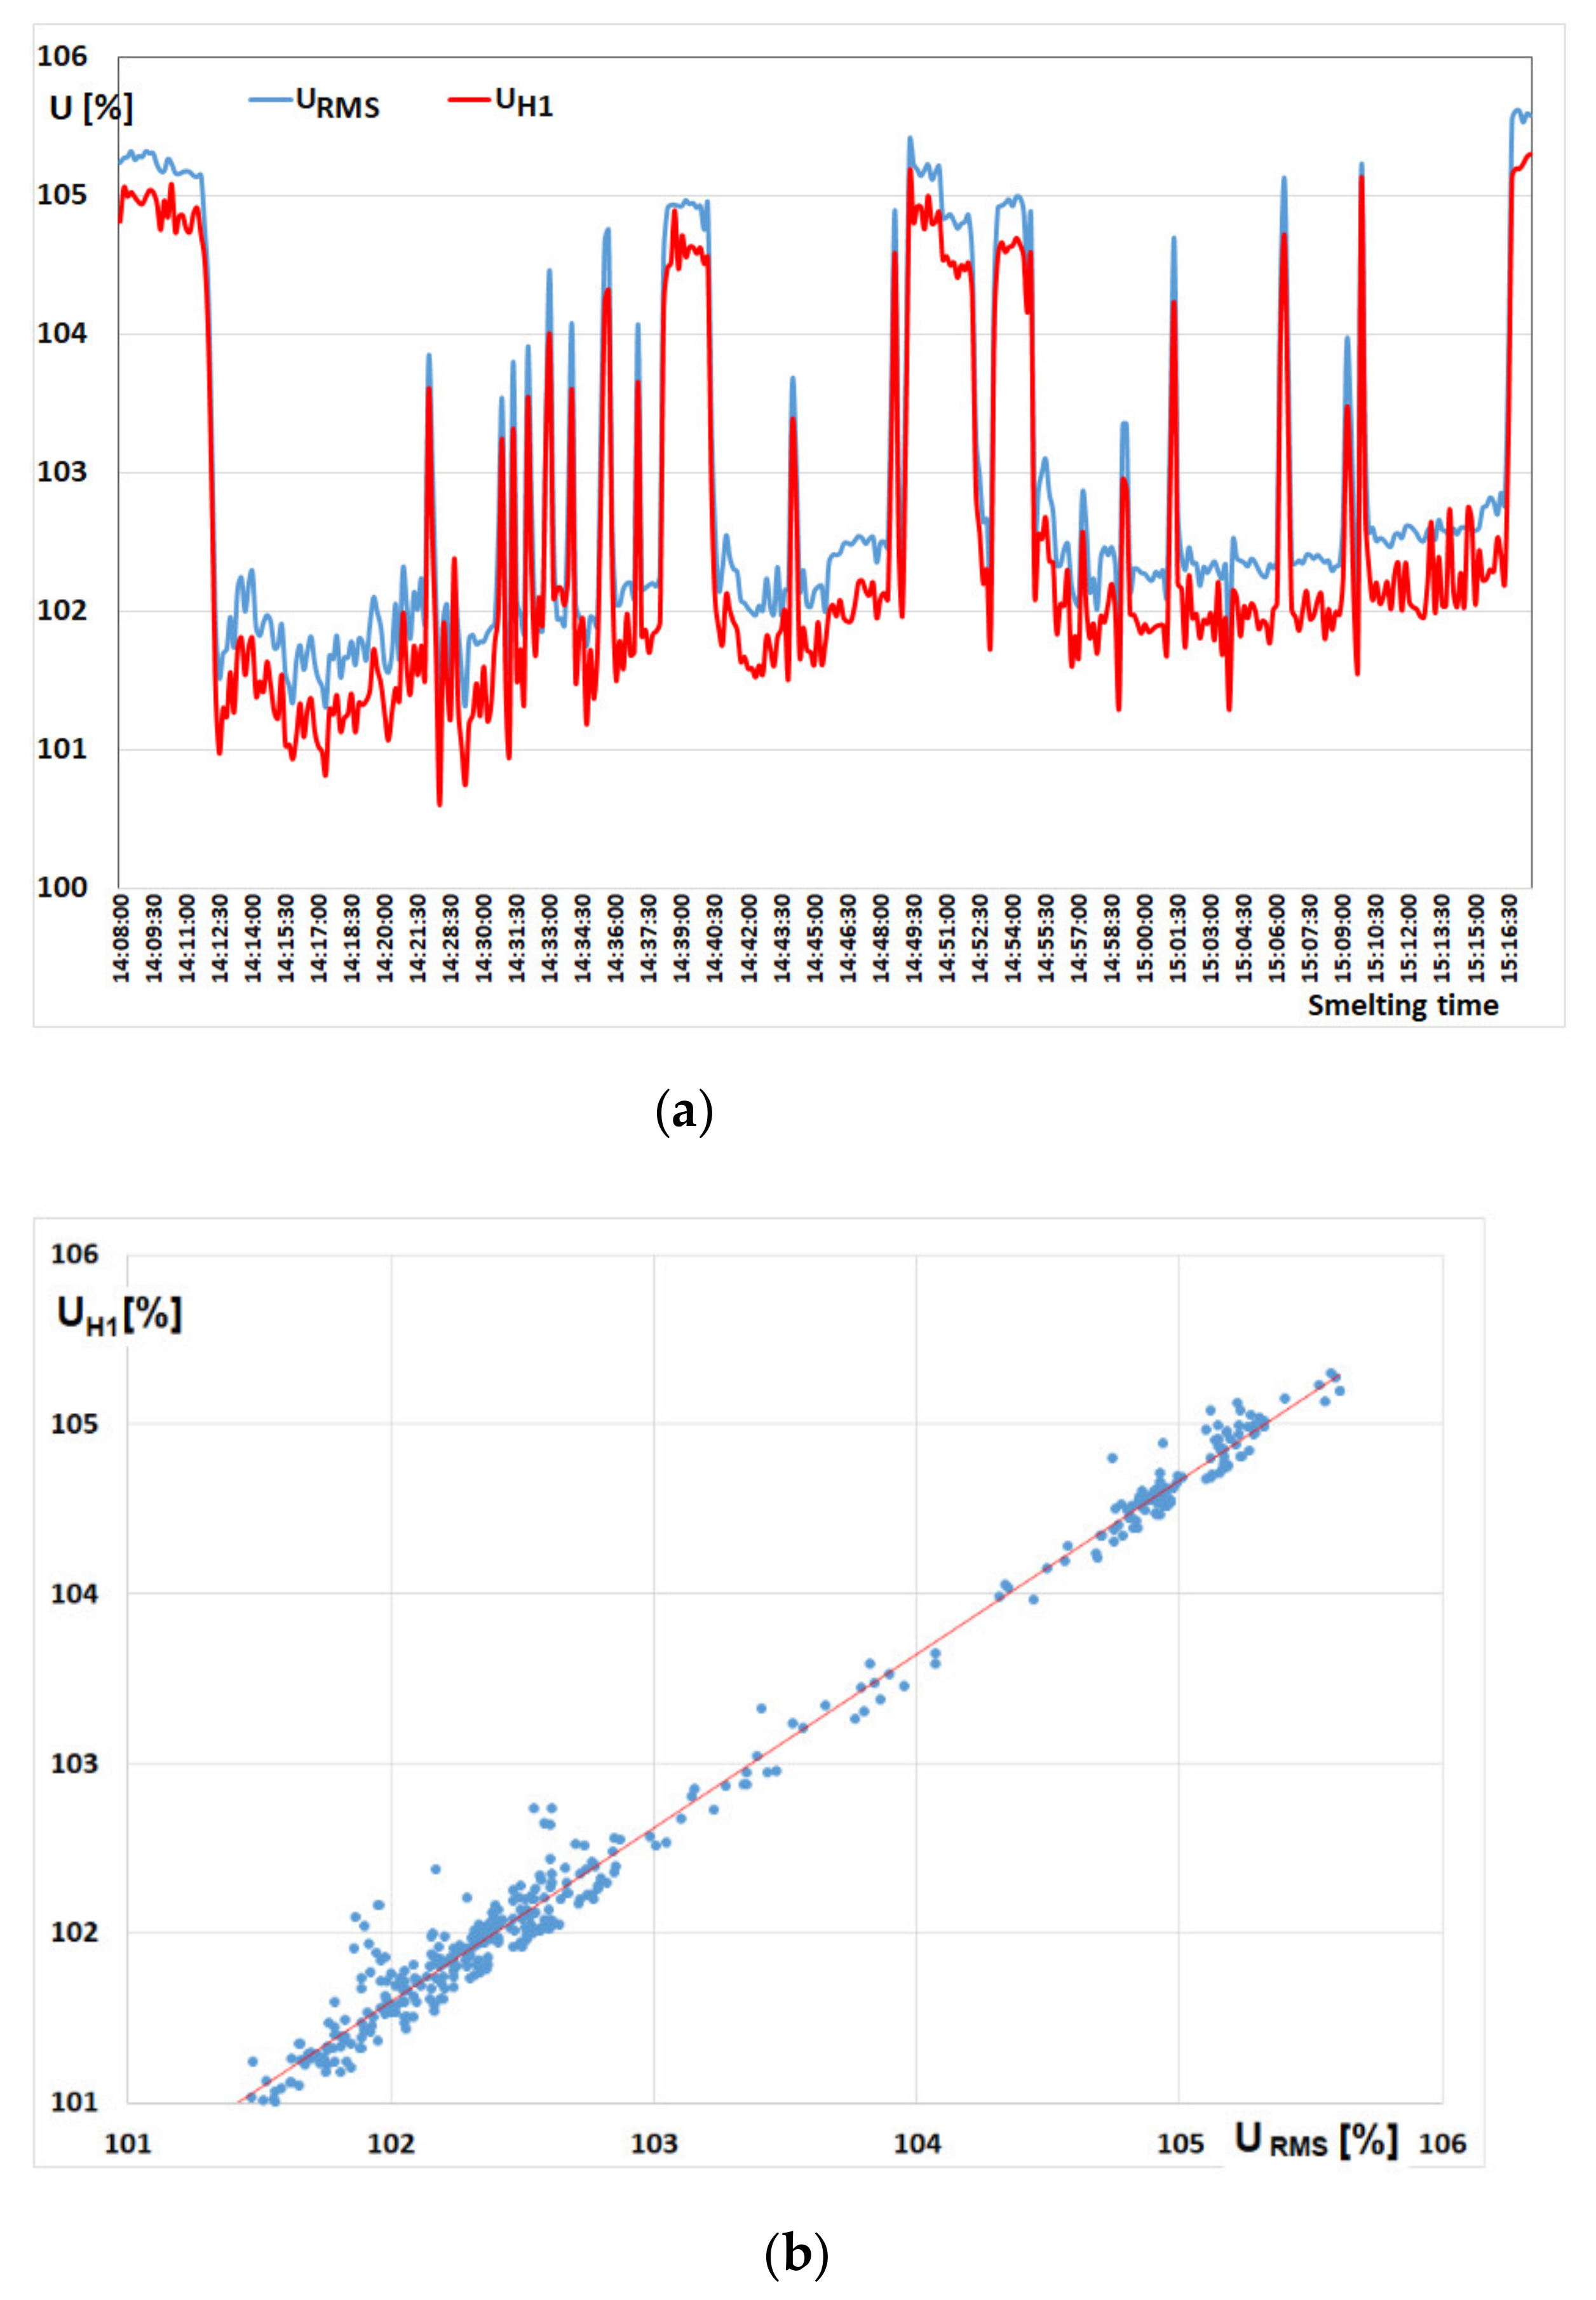
Figure 18a shows the changes in the RMS voltage URMS and the first harmonic of the voltage UH1. UH1 is the RMS (root mean square) value of the first voltage harmonic determined in a five-second interval. The correlation coefficient is respectively—Figure 18b:
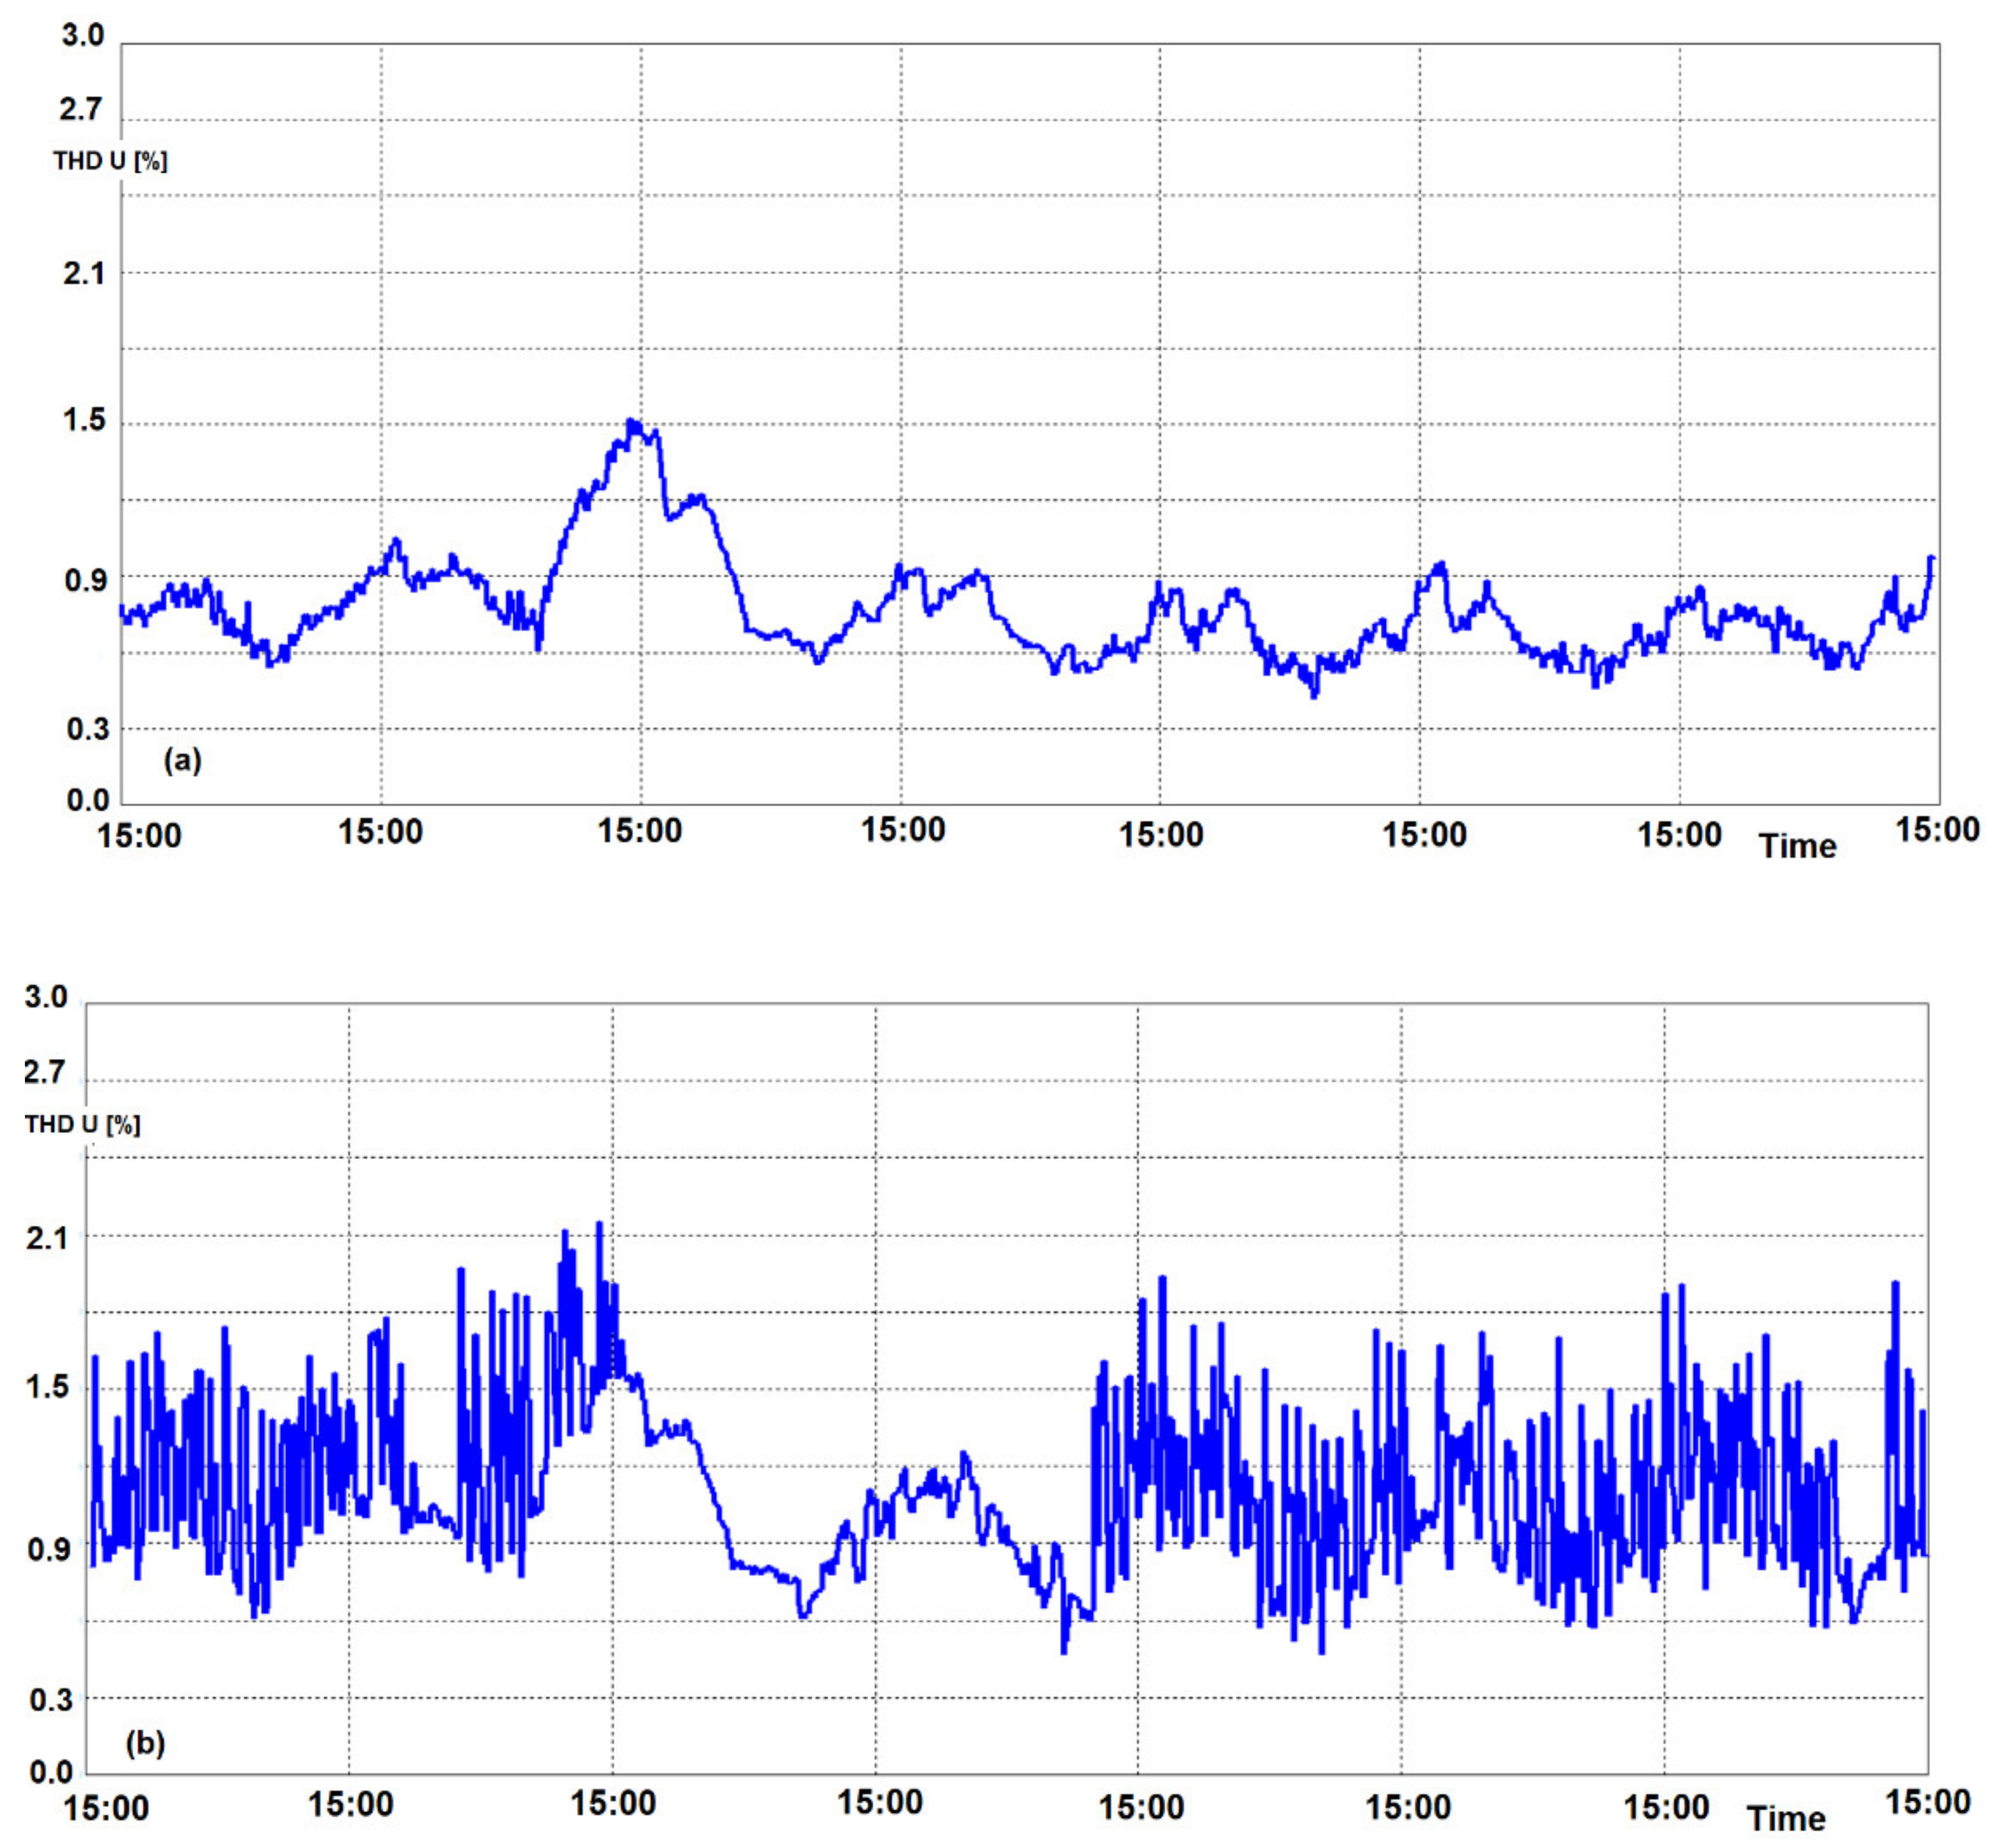
The amount of voltage distortion in the power line of the steel plant depends mainly on the short-circuit power of the supply network, the melting phase in the arc furnace, and the daily load on the power system. Figure 19 shows changes of total harmonic distortion (THD) recorded at the same time in points with different short-circuit powers in the supply network electric arc furnace. Figure 19a shows the THD changes for Scc/Sntr = 150 and Figure 19b for Scc/Sntr = 25.
The total harmonic distortion (THD) waveforms presented in Figure 19a,b show the influence of the power system on the voltage distortions in the mains supplying arc furnaces. In both cases, the THD limits according to [52,53] were not exceeded. In the case of significant short-circuit power of the network (Scc/Sntr = 150—Figure 19a), it can be assumed that the influence of the furnace on voltage distortion is negligible. Therefore, it seems to be a correct assumption for the adoption of the first harmonic of the arc voltage.
One of the assumptions in the model tests (especially for the initial phase of scrap melting) was the adoption of two-stage changes in the arc furnace current from IA to IB (symmetrically with respect to the scrap melting current of IM = 1.2 IN). The confirmation of the correctness of the adopted assumptions required a statistical analysis of voltage fluctuations.
The results of the statistical analysis of voltage fluctuations are presented below. The amplitude of voltage fluctuations ΔU is presented in percentages. According to the recommendations of the statistical analysis of measurement data, when the number of samples exceeds 20, grouping them into a distributive series should be used [54].
The grouping is aimed at systematizing the obtained results and reducing the impact of individual deviations of voltage fluctuations registered during the steel smelting process.
The resulting groups are called class intervals or otherwise classes, and the value representing each class is their center. The classes and the corresponding samples form a distributive series, which is obtained by determining the area of variability of a given feature, dividing it into classes and determining the number of samples in a given class [55].
The number of class intervals should not be less than 7 and greater than 15 and should satisfy the inequality [54]:
where:
n—sample size
m—number of classes
and the size of any of the class ranges should not be less than 5 [54].
When the multiplicity in a given class is lower than 5, adjacent classes can be joined, which, however, leads to a reduction in the degrees of freedom for the tested sample [55].
The set of consecutive amplitudes consists of n = 151 values, which have been classified into seven classes; according to the formula we get:
hence the assumption of seven class ranges.
For seven class intervals, the lengths of the intervals ΔU = 0.81 were selected according to the formula:
The use of class intervals in Table 2 as negative numbers is intended to denote amplitudes lower than the mean, and the class interval marked with zero corresponds to the middle class interval, i.e., its center (arithmetic mean) is close to zero.
For the analyzed data group, the basic statistical parameters are as follows:
- -
- Maximum value: 2.8361
- -
- Minimum value: −2.8077
- -
- Arithmetic mean: 0.012
- -
- Variance: 1.452
- -
- Standard deviation: 1.205
To verify the hypothesis that the voltage fluctuation distribution is a normal distribution, the χ2 Pearson compatibility test was performed.
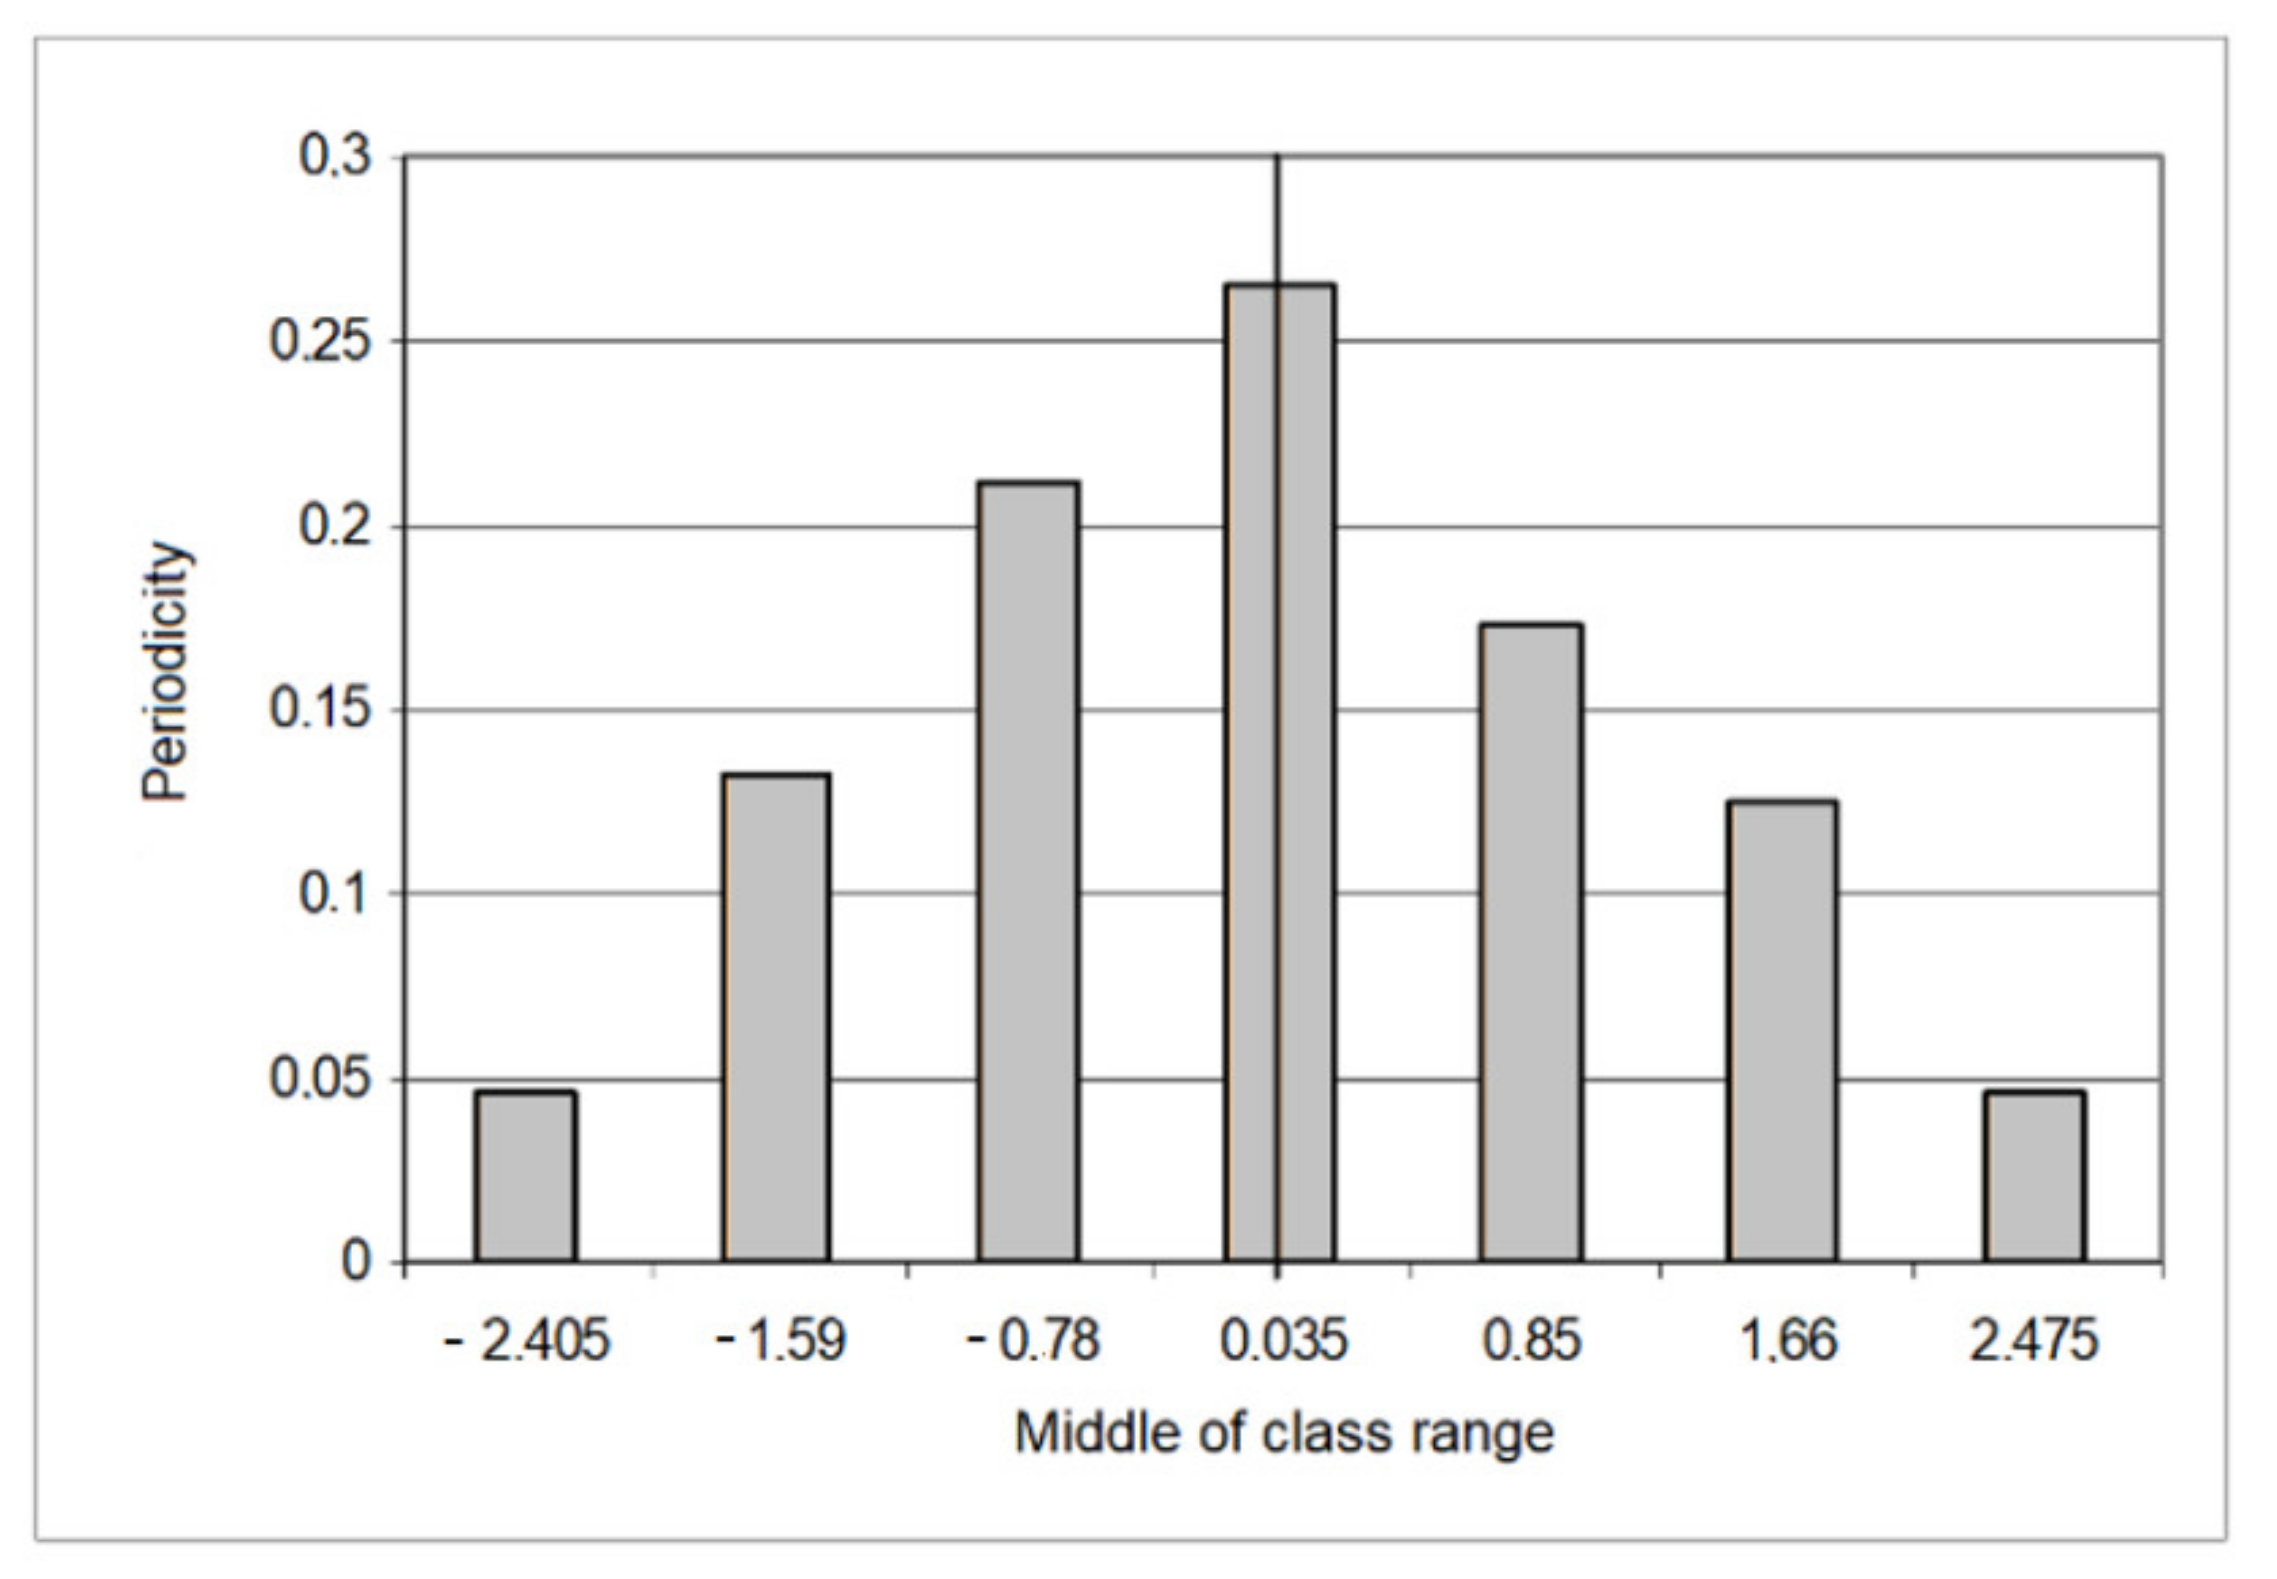
Table 2 summarizes the basic parameters characterizing the given class ranges, including class number, class range, center class, amount periodicity, cumulative amount, and cumulative periodicity characterizing the course, as shown in Figure 20.
The graphical representation of the prepared distribution series, presented in Table 2, by means of appropriate diagrams, allows for the convenient illustration of the obtained measurement results.
Figure 21 presents histograms of changes in the periodicity in classes in the middle of class range.
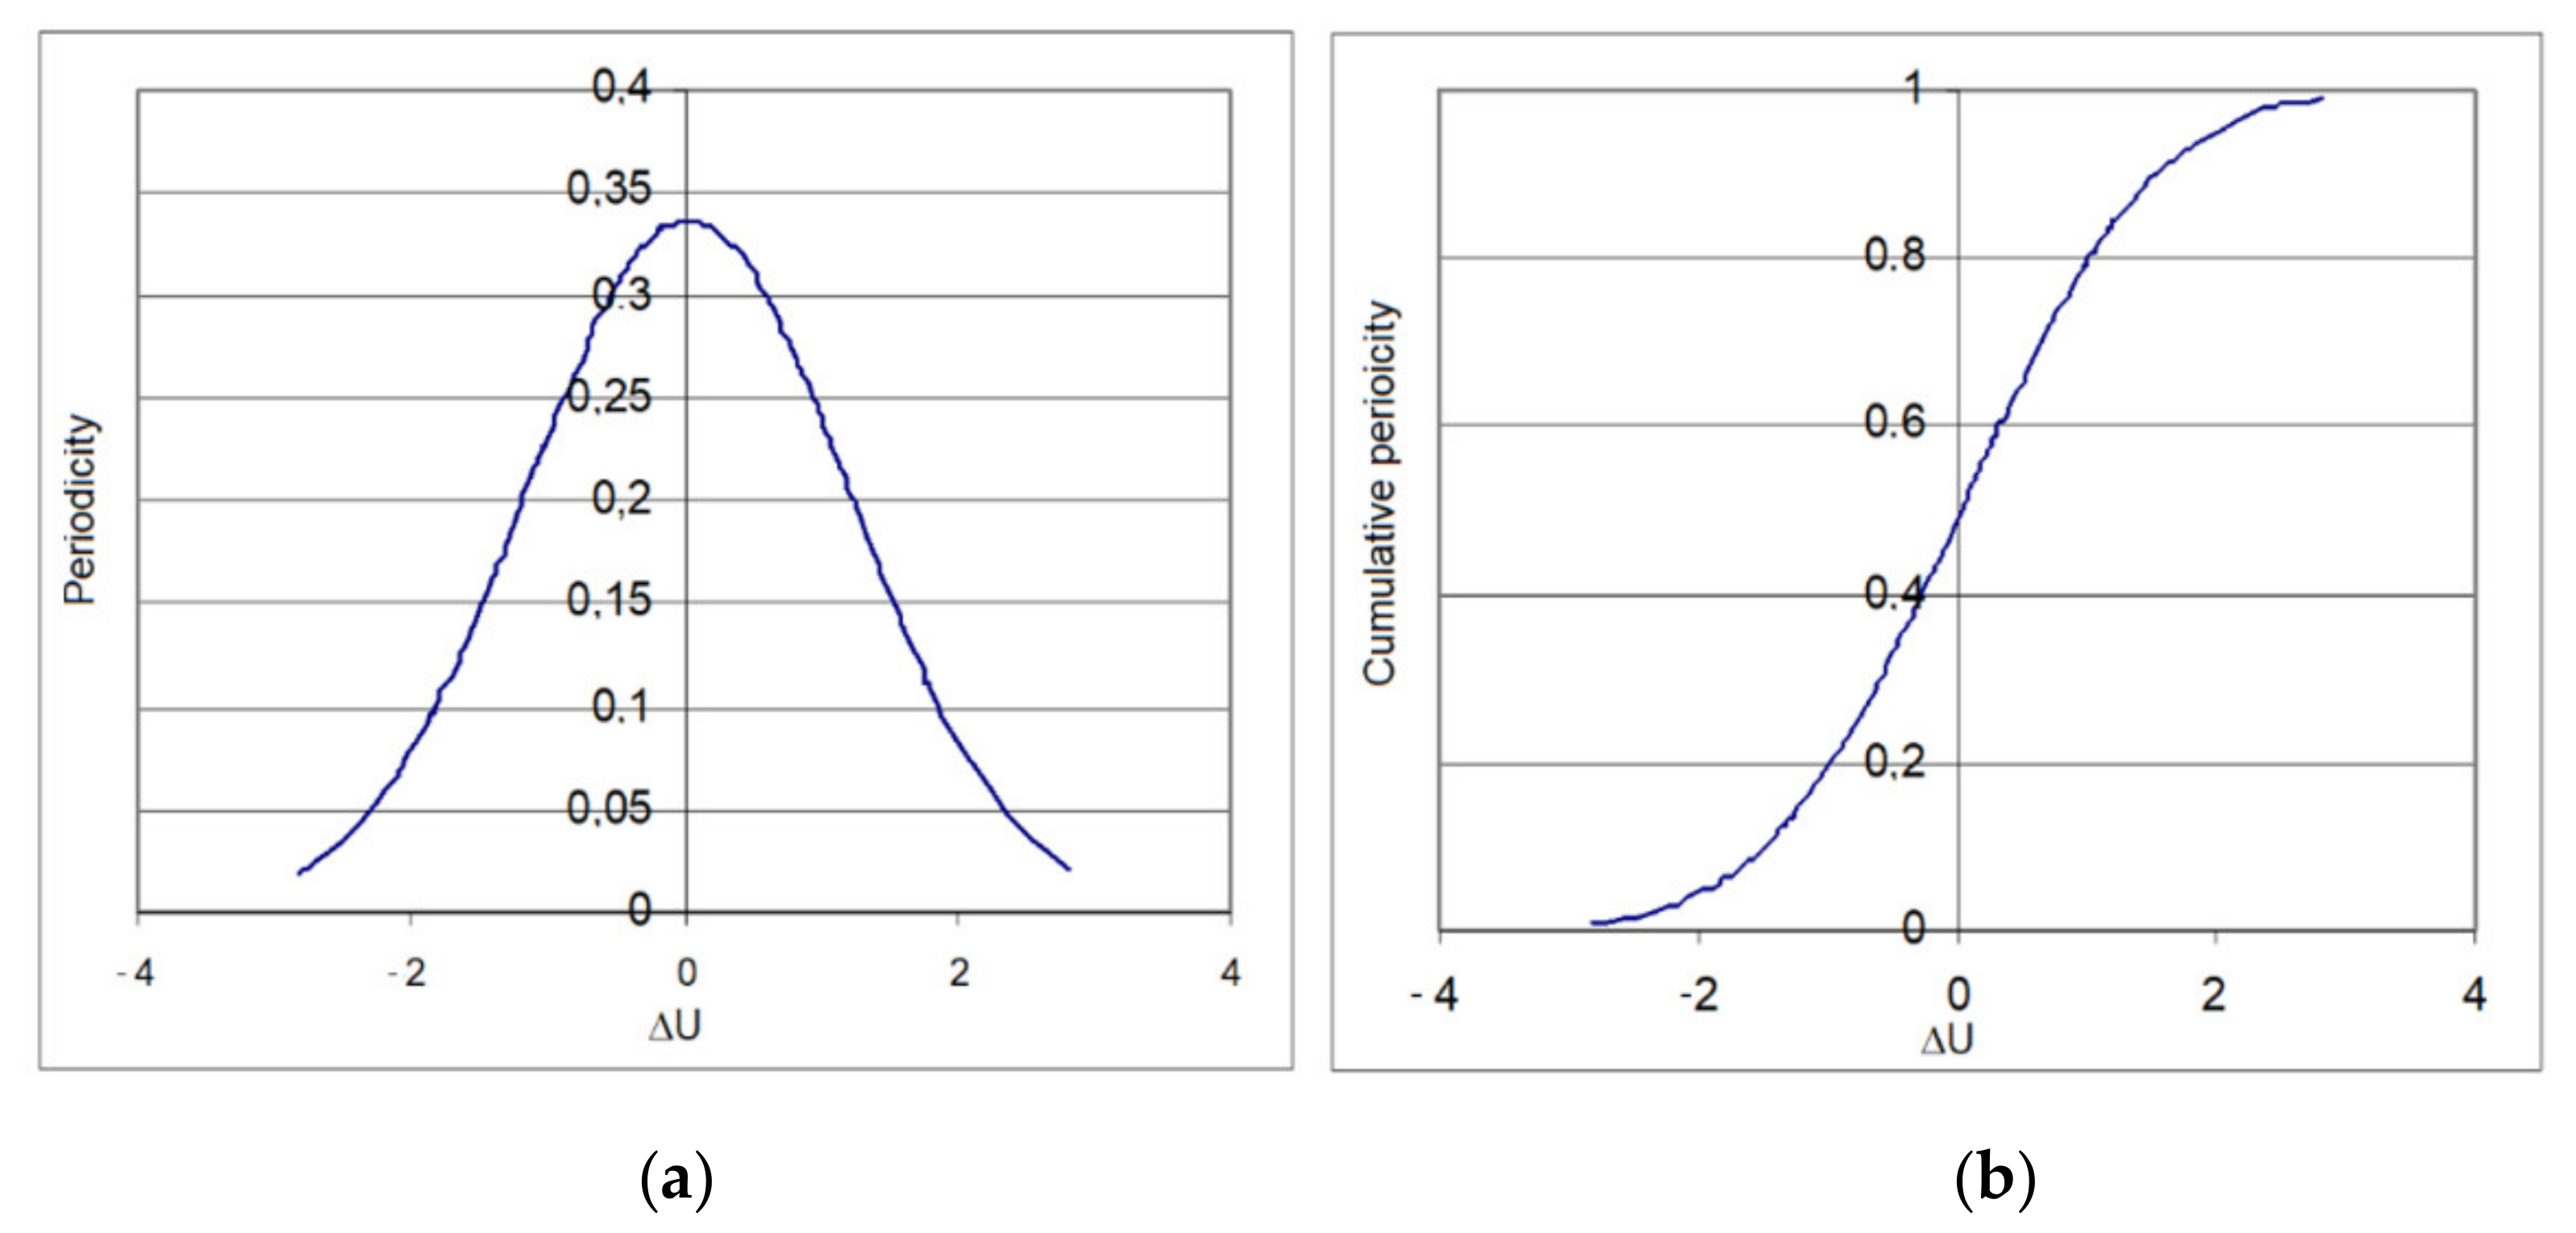
Figure 22 shows the periodicity expansion (a) and distribution function (b) based on the function approximation [56]:
where:
σ- standard deviation—deciding on the degree of flattening of the distribution curve.
μ- the mean value by locating the symmetrical normal distribution curve with respect to the x axis, which is a function of the probability density of the normal distribution.
As already mentioned, in order to find out whether the analyzed voltage fluctuation distribution is a normal distribution, the χ2 Pearson compatibility test was performed. On the basis of the sample, the parameters of the normal distribution were estimated—mean value and standard deviation.
The results necessary to determine the statistics are presented in tabular form (Table 3).
where:
Ui- values at the end of the right class range is the cumulative value of the distribution N(0.1) in point .
The values of the distribution function F(zi) were read from the tables of normal distribution and the probabilities pi calculated from the relationship: pi = F(zi) – (zi–1). The critical value χα2 = 9.49 was read from the chi-square tables for the adopted significance level α = 0.05 and n = 7 – 2 − 1 = 4 degrees of freedom. Since χ2 =2.51 < χα2 = 9.49, there is reason to reject the hypothesis that the analyzed voltage fluctuation distribution is a normal distribution.
The statistical analysis of voltage changes in the steelworks supply networks confirms the normal distribution of voltage fluctuations.
This means that the assumption of the furnace current changes according to the proposed histograms is correct.
5. Summary
The main disturbances generated by arc devices are voltage fluctuations. Voltage fluctuations caused by arc furnaces are characterized by high dynamics of changes. The value of the voltage fluctuations depends mainly on the melting phase in the arc furnace and on the short-circuit power of the network in relation to the power of the arc furnace transformer. The periodicity of voltage fluctuations (number of changes during a given time, e.g., a second) changes to a lesser extent.
Determining voltage fluctuations based on the analysis of voltage waveforms (oscillograms) enables one to assess the nature of their changes very accurately. The voltage fluctuations determined in this way can constitute a database for model research on the impact of arc furnaces on the power system.
The assessment of voltage fluctuations based on the analysis of time courses requires the use of specialized measuring equipment and specialized software for data analysis. For this reason, this method has significant limitations in practical engineering applications.
Arc furnaces are receivers that cause disturbances that will significantly affect the quality of electricity in the power system through which they are supplied. The main disturbance generated by arc furnaces are voltage fluctuations, which are characterized by rapid changes in amplitude and frequency. Voltage fluctuations are characterized by fast changes in amplitude and periodicity (a few changes in one second). The irregularity of changes in voltage fluctuations causes statistical parameters to be used to evaluate the fluctuations. The results of calculations of statistical indicators describing voltage disturbances and the results of measurements of energy quality parameters indicators are an attempt to detail the assessment of the impact of arc furnaces on the power system.
The main aim of the article was to present a method allowing the determination of voltage fluctuations in the operation of arc furnaces. The article analyzes the dependence of the short-circuit power of the SCC network in relation to the power of a furnace transformer and refers to the actual conditions of supplying arc furnaces.
Based on model studies and the analysis of the electric energy quality parameters recorded in the power supply networks, the following general conclusions were made:
- -
- The presented model, the statistic evaluation of voltage fluctuations generated by arc furnaces, and the presented results of measurements of energy quality parameters may constitute a theoretical and practical contribution to the development of new models of arc devices;
- -
- The proposed method makes it possible to determine the increase in voltage fluctuations when connecting successive arc devices for parallel operation;
- -
- Based on the proposed model tests, a preliminary assessment of changes in voltages and currents consumed by arc furnaces is necessary in the selection and design of compensation devices;
- -
- In the case of arc furnaces, only changes in one phase can be accepted for the analysis of voltage fluctuations and fluctuation of light;
- -
- On the basis of the analysis of measurement data, it can be concluded that there is a very high correlation between the flicker indicators and voltage fluctuations in individual phases;
- -
- For the determined significant correlation between changes in the flicker Pst indicators and changes in the amplitude of voltage fluctuations (where the correlation coefficient is rPstΔU = 0.906), both fast-changing voltage fluctuations and flicker indicators can be used to assess the impact of arc devices on the power system;
- -
- In the case of arc furnaces, where the frequency of voltage changes does not change significantly, the increase in the amplitude of voltage fluctuations is proportional to the increase in flicker indicators;
- -
- The result of adopting the disturbance analysis in one phase is the development of a single-phase diagram of the arc device replacement;
- -
- The recorded measurement data can be the basis for further research on the impact of arc furnaces on the power system.
Funding
This research received no external funding.
Abbreviations
The following nomenclatures are used in this manuscript:
| IM | arc furnace melting current |
| IN | nominal current |
| Plt | short-term flicker severity |
| Pst | short-term flicker severity |
| RL | power line resistance |
| RT | resistance high-current path with the furnace transformer |
| Scc | short-circuit power |
| SD(I) | standard deviation of current |
| ni* | cumulative amount |
| fi* | cumulative periodicity |
| SD(U) | standard deviation of current |
| Sntr | power of the furnace transformer |
| THD | total harmonic distortion |
| UArc | arc voltage |
| UH1 | RMS first voltage harmonic |
| UL | supply voltage |
| Umean | RMS voltage mean |
| UN | rated voltage |
| US | steelworks supply voltage |
| XL | power line reactance |
| XT | reactance high-current path with the furnace transformer |
| ΔIAB | arc furnace current fluctuations |
| ΔU | voltage fluctuations |
References
- Yan, Q.; Aoki, M. Suppression of voltage fluctuation by utilizing consumer-side energy storage devices in PV connected distribution system. IFAC-PaperOnLine 2018, 51, 432–437. [Google Scholar] [CrossRef]
- Albert, H.; Golovanov, N.; Elefterescu, L. Propagation of disturbances as voltage fluctuations in transmission networks. Probl. Energeticii Reg. 2016, 2016, 48–54. [Google Scholar]
- Yu, Y.; Ju, P.; Peng, Y.; Lou, B.; Huang, H. Analysis of dynamic voltage fluctuation mechanism in interconnected power grid with stochastic power disturbances. J. Mod. Power Syst. Clean Energy 2020, 8, 38–45. [Google Scholar] [CrossRef]
- Orgulan, A.; Sukič, P.; Ribič, J. A procedure for mitigating the light flicker in office LED lighting caused by voltage fluctuations. Energies 2019, 12, 3975. [Google Scholar] [CrossRef] [Green Version]
- Xinming, G.; Qunhai, H.; Tongzhen, W.; Jingyuan, Y. A local control strategy for distributed energy fluctuation suppression based on soft open point. Energies 2020, 13, 1520. [Google Scholar] [CrossRef] [Green Version]
- Lodetti, S.; Azcarate, I.; Gutierrez, J.J.; Leturiondo, L.A.; Redondo, K.; Saiz, P.; Estela, J.J.M.; Romero, J. Flicker of modern lightingtechnologies dueto rapid voltage changes. Energies 2019, 12, 865. [Google Scholar] [CrossRef] [Green Version]
- Hanzelka, Z. Electricity Supply Quality. RMS Voltagedisturbance, (Jakość Dostawy Energii Elektrycznej. Zaburzenia Wartości Skutecznej Napięcia); Wydawnictwa AGH: Kraków, Poland, 2013. (In Polish) [Google Scholar]
- Akkaya, S.; Salor, O. Enhanced spectral decomposition method for light flicker evaluation of incandescent lamps caused by electric arc furnaces. J. Fac. Eng. Archit. Gazi Univ. 2019, 34, 87–1005. [Google Scholar]
- Kiyoumarsi, A.; Ataei, M.; Hooshmand, R.; Kolagar, A.D. Electric arc furnace voltage flicker mitigation by applying a predictive method with closed loop control of the TCR/FC compensator. J. Electr. Eng. Technol. 2010, 5, 116–128. [Google Scholar] [CrossRef] [Green Version]
- García-Cerrada, A.; García-González, P.; Collantes, R.; Gómez, T.; Anzola, J. Comparison of thyristor-controlled reactors and voltage-source inverters for compensation of flicker caused by Arc furnaces. IEEE Trans. Power Deliv. 2000, 15, 1223–1231. [Google Scholar] [CrossRef] [Green Version]
- Bhonsle, D.C.; Kelkar, R.B. Analyzing power quality issues in electric arc furnace by modeling. Energy 2016, 115, 830–839. [Google Scholar] [CrossRef]
- Olczykowski, Z. Methods of determination of the voltage fluctuations and light flicker at simultaneous operation of three-phase arc furnaces. Electr. Power Qual. Util. 2003, 9, 47–58. [Google Scholar]
- Tang, L.; Kolluri, S.; McGranaghan, M.F. Voltage flicker prediction for two simultaneously operated AC arc furnaces. IEEE Trans. Power Deliv. 1997, 12, 985–992. [Google Scholar] [CrossRef] [Green Version]
- Brociek, W.; Grzywacz, T.; Wilanowicz, R. Propagation of higher harmonics of voltage and current in the power system at changing location of nonlinear load. In Proceedings of the 18th International Conference on Computational Problems of Electrical Engineering (CPEE), Kutna Hora, Czech Republic, 11–13 September 2017. [Google Scholar]
- Sarma, P.M.; Jayaram Kumar, S.V. Electric Arc furnace flicker mitigation in a steel plant using a Statcom. Int. J. Eng. Sci. Innov. Technol. 2013, 2, 227–231. [Google Scholar]
- Singh, A.; Singh, R.K.; Singh, A.K. Power quality issues of electric arc furnace and their mitigations—A review. Int. J. Adv. Eng. Res. Sci. 2017, 4, 237114. [Google Scholar] [CrossRef]
- IEC 61000-4-15: Electromagnetic Compatibility (EMC)—Testing and Measurement Techniques—Flickermeter—Functional and Design Specifications; International Electrotechnical Commission: Geneva, Switzerland, 2010.
- PN-T-01030:1996/A1, Kompatybilność Elektromagnetyczna (EMC); Terminologia; Developed on the Basis of IEC Publication 61000, Part 1: General, Section 1: Application and Interpretation of Fundamental Definitions and Terms; International Electrotechnical Commission: Geneva, Switzerland, 1999.
- Wąsowski, A. Adaptation of the Three-Phase Arc Device to the Power System (Dopasowanie Trójfazowego Urządzenia ŁUKOWEGO DO Systemu Elektroenergetycznego); Monograph, No, 131; Kazimierz Pulaski University of Technology and Humanities: Radom, Poland, 2009. (In Polish) [Google Scholar]
- Łukasik, Z.; Olczykowski, Z. Estimating the impact of arc furnaces on the quality of power in supply systems. Energies 2020, 13, 1462. [Google Scholar] [CrossRef] [Green Version]
- Xu, H.; Shao, Z.; Chen, F. Data-driven compartmental modeling method for harmonic analysis—A study of the electric arc furnace. Energies 2019, 12, 4378. [Google Scholar] [CrossRef] [Green Version]
- Lange, A.G.; Redlarski, G. Selection of C-type filters for reactive power compensation and filtration of higher harmonics injected into the transmission system by arc furnaces. Energies 2020, 13, 2330. [Google Scholar] [CrossRef]
- Kanálik, M.; Margitová, A.; Bena, L.; Kanáliková, A. Power system impedance estimation using a fast voltage and current changes measurements. Energies 2021, 14, 63. [Google Scholar] [CrossRef]
- Klempka, R. An arc furnace as a source of voltage disturbances—A statisticalevaluation of propagation in the supply network. Energies 2021, 14, 107. [Google Scholar] [CrossRef]
- Cernan, M.; Müller, Z.; Josef Tlusty, J.; Valouch, V. An improved SVC control for electric arc furnace voltage flicker mitigation. Int. J. Electr. Power Energy Syst. 2021, 129, 106831. [Google Scholar] [CrossRef]
- Liu, Y.J.; Chang, G.W.; Hong, R.C. Curve-fitting-based method for modeling voltage-current characteristic of an ac electric arc furnace. Electr. Power Syst. Res. 2010, 80, 572–581. [Google Scholar] [CrossRef]
- Janabi-Sharifi, F.; Jorjani, G. An adaptive system for modeling and simulation of electrical arc furnaces. Control. Eng. Pract. 2009, 17, 1202–1219. [Google Scholar] [CrossRef]
- Sadeghian, A.; Lavers, J.D. Dynamic reconstruction of nonlinear v–i characteristic in electric arc furnaces using adaptive neuro-fuzzy rule-based networks. Appl. Soft Comput. 2011, 11, 1448. [Google Scholar] [CrossRef]
- Mokhtari, H.; Hejri, M. A new three phase time-domain model for electric arc furnace using MATLAB. IEEE Asia-Pac. Transm. Distrib. Conf. Exhib. 2002, 3, 2078–2083. [Google Scholar]
- Alonso, M.A.P.; Donsion, M.P. An improved time domain arc furnace model for harmonic analysis. IEEE Trans. Power Deliv. 2004, 19, 367–373. [Google Scholar] [CrossRef]
- Horton, R.; Haskew, T.A.; Burch, R.F. A time-domain ac electric arc furnace model for flicker planning studies. IEEE Trans. Power Deliv. 2009, 24, 1450–1457. [Google Scholar] [CrossRef]
- Montanari, G.C.; Loggini, M.; Cavallini, A.; Pitti, L.; Zaninelli, D. Arc-furnace model for the study of flicker compensation in electrical networks. IEEE Trans. Power Deliv. 1994, 9, 2026. [Google Scholar] [CrossRef]
- Terzija, V.; Stanojevic, V. Power quality indicators estimation using robust Newton-typealgorithm. IETProc. Gen. Transm. Distrib. 2004, 151, 477–485. [Google Scholar] [CrossRef]
- Beites, L.F.; Mayordomo, J.G. Harmonics, Interharmonics and unbalances of arc furnaces: A new frequency domain approach. IEEE Trans. Power Deliv. 2001, 16, 661–668. [Google Scholar] [CrossRef]
- Emre Durna, E.; Gerçek, C.Ö.; Salor, Ö.; Ermis, M. Suppression of the second harmonic subgroup injected by an AC EAF: Design considerations and performance estimation of a shunt AP. Electronics 2018, 7, 53. [Google Scholar] [CrossRef] [Green Version]
- Garcia-Segura, R.; Castillo, J.V.; Martell-Chavez, F.; Longoria-Gandara, O.; Ortegon, J. Electric arc furnace modeling with artificial neural networks and arc length with variable voltage gradient. Energies 2017, 10, 1424. [Google Scholar] [CrossRef]
- Gajic, D.; Gajic, I.S.; Savic, I.; Georgieva, O.; Di Gennaro, S. Modelling of electrical energy consumption in an electric arc furnace using artificial neural networks. Energy 2016, 108, 132–139. [Google Scholar] [CrossRef]
- Ghiormez, L.; Panoiu, M.; Prostean, O. GUI for studying the parameters influence of the electric arc model for a three-phase electric arc furnace. In Proceedings of the IOP Conference Series: Materials Science and Engineering, Philadelphia, PA, USA, 21–23 October 2017; Volume 163, pp. 1–14. [Google Scholar]
- Lei, W.; Wang, Y.; Wang, L.; Cao, H. A fundamental wave amplitude prediction algorithm based on fuzzy neural network for harmonic elimination of electric arc furnace current. Math. Probl. Eng. 2015, 2015, 1–6. [Google Scholar] [CrossRef] [Green Version]
- Samet, H.; Farjah, E.; Zahra Sharifi, Z. A dynamic, nonlinear and time-varying model for electric arc furnace. Int. Trans. Electr. Energy Syst. 2015, 25, 2165–2180. [Google Scholar] [CrossRef]
- Varan, M.; Uyaroglu, Y. Elimination of harmonic induced viable bifurcations with tcsc for ac–fed electric arc furnaces. J. Electr. Eng. 2012, 5, 303–309. [Google Scholar] [CrossRef] [Green Version]
- Yakimov, I.; Maklakov, A.; Voronin, S.; Maklakova, E. Results of modeling operation of the high-speed regulator of non-contact secondary voltage of furnace transformer of the high-power arc steel furnace in constant primary current mode. Procedia Eng. 2017, 206, 1853–1860. [Google Scholar] [CrossRef]
- UIE. Guide to Quality of Electical Supply for Industrial Installations; Part 5; Flicker and Voltage Fluctuations; Power Quality Working Group WG 2: Paris, France, 1999. [Google Scholar]
- Arlt, D.; Eberlein, C. Network disturbances caused by Ultra High Power electric arc furnaces and possible reduction methods. In Proceedings of the Conference Electrical Power Quality and Utilisation, Cracow, Poland, 23–25 September 1997. [Google Scholar]
- Olczykowski, Z.; Wąsowski, A. Methods of voltage unbalance estimation in electric power networks. Electr. Power Qual. Util. 2006, XII, 71–76. [Google Scholar]
- Wciślik, M. Analytical models of the electric arc, (analityczne modele łuku elektrycznego). Przegląd Elektrotechniczny 2008, 84, 115–117. (In Polish) [Google Scholar]
- Grabowski, D. Selected Applications of Stochastic Approach in Circuit Theory; Monografia, Wydawnictwo Politechniki Śląskiej: Gliwice, Poland, 2015. [Google Scholar]
- Ghiormez, L.; Prostean, O.; Panoiu, M.; Panoiu, C. Artificial neural networks in predicting current in electric arc furnaces. In IOP Conference Series: Materials Science and Engineering, Proceedings of the International Conference on Applied Sciences (ICAS2013), Wuhan, China, 26–27 October 2013; IOP Publishing Ltd.: Bristol, UK, 2014; Volume 57. [Google Scholar]
- Khoshkhoo, H.; Sadeghi, S.H.; Moini, R.; Talebi, H.A. Anefficient power control scheme for electric arc furnace susing online estimation of flexible cable inductance. Comput. Math. Appl. 2011, 62, 4391–4401. [Google Scholar] [CrossRef] [Green Version]
- Spasojevic, L.; Papic, I.; Blazic, B.; Bostjan, B. A new approach to the modelling of electric arc furnaces with representative voltage samples. Int. Trans. Electr. Energy Syst. 2015, 25, 1173–1186. [Google Scholar] [CrossRef]
- Désquilbet, G. Les Fluctuations Rapides de Tension et le Phenomene de Papillotement des Lampes (Flicker); EDF.HR22/95/GD8.A; Electricite de France: Clamart, France, 1995. [Google Scholar]
- PN-EN50160:2014 Parameters of the Supply Voltage in the Public Power Networks; Polish Committee of Standardization: Warsaw, Poland, 2014.
- Rozporządzenie Ministra Gospodarki z dnia 4 maja 2007 r. w sprawie szczegółowych warunków funkcjonowania systemu elektroenergetycznego. 2007. Available online: http://isap.sejm.gov.pl/isap.nsf/DocDetails.xsp?id=wdu20070930623 (accessed on 29 March 2021). (In Polish)
- Bobrowski, D. Probabilistics in Technical Applications, (Probabilistyka w Zastosowaniach Technicznych); WNT: Warsaw, Poland, 1986. (In Polish) [Google Scholar]
- Sobczyk, M. Statistics, (Statystyka); Wydawnictwo Naukowe PAN: Warsaw, Poland, 1997. (In Polish) [Google Scholar]
- Maksymiuk, J.; Wohlmuth, F. Statistical Methods in Electrical Engineering (Metody Statystyczne w Inżynierii Elektrotechnicznej); Wydawnictwa Politechniki Warszawskiej: Warsaw, Poland, 1984. (In Polish) [Google Scholar]
Figure 1.
Voltage changes in the supply line to arc furnaces: voltage oscillogram (a), maximum values of the oscillogram (b), Urms voltage (c).
Figure 1.
Voltage changes in the supply line to arc furnaces: voltage oscillogram (a), maximum values of the oscillogram (b), Urms voltage (c).

Figure 2.
Voltage fluctuation changes in the arc furnace supply line in various phases of the melting of scrap.
Figure 2.
Voltage fluctuation changes in the arc furnace supply line in various phases of the melting of scrap.

Figure 3.
Voltage changes as a function of furnace current changes.

Figure 4.
Single-phase power supply scheme for an arc furnace.

Figure 5.
Voltage changes as a function of furnace current changes.

Figure 6.
Vector diagram of the currents and voltages of the arc furnace.

Figure 7.
Histograms of arc furnace current changes in various stages of melting scrap.

Figure 8.
Voltage fluctuations for different histograms of arc furnace current changes.

Figure 9.
Voltage change as a function of current changes the furnace without the resistance in the power supply circuit of an electric arc.
Figure 9.
Voltage change as a function of current changes the furnace without the resistance in the power supply circuit of an electric arc.

Figure 10.
Voltage change as a function of current changes the furnace with the resistance in the power supply circuit of an electric arc.
Figure 10.
Voltage change as a function of current changes the furnace with the resistance in the power supply circuit of an electric arc.

Figure 11.
Scheme of the supply system for the steel plant, (a) for two identical furnaces arched, (b) for a replacement electric arc furnace.
Figure 11.
Scheme of the supply system for the steel plant, (a) for two identical furnaces arched, (b) for a replacement electric arc furnace.

Figure 12.
Vector diagram of the currents and voltages of the arc furnace.

Figure 13.
Scheme of the power supply system of a steelworks with two arc furnaces including resistance.
Figure 13.
Scheme of the power supply system of a steelworks with two arc furnaces including resistance.

Figure 14.
Vector diagram of the arc furnace currents and voltages taking into account the resistance (a), marked area with a circle in the magnification (b).
Figure 14.
Vector diagram of the arc furnace currents and voltages taking into account the resistance (a), marked area with a circle in the magnification (b).

Figure 15.
Changes of voltage fluctuations ΔU(a) measured during one melt.

Figure 16.
Changes in the short-term flicker severity Pst recorded during one melt in the arc furnace.
Figure 16.
Changes in the short-term flicker severity Pst recorded during one melt in the arc furnace.

Figure 17.
Relationships between the short-term flicker severity Pst recorded in individual phases.

Figure 18.
Changes in the root mean square (RMS) voltage URMS and the first harmonic of the voltage UH1 (a) and relationships between URMS and UH1 (b).
Figure 18.
Changes in the root mean square (RMS) voltage URMS and the first harmonic of the voltage UH1 (a) and relationships between URMS and UH1 (b).

Figure 19.
Changes of total harmonic distortion (THD) recorded at the same time in points with different short-circuit powers: (a) Scc/Sntr = 150, (b) Scc/Sntr = 20.
Figure 19.
Changes of total harmonic distortion (THD) recorded at the same time in points with different short-circuit powers: (a) Scc/Sntr = 150, (b) Scc/Sntr = 20.

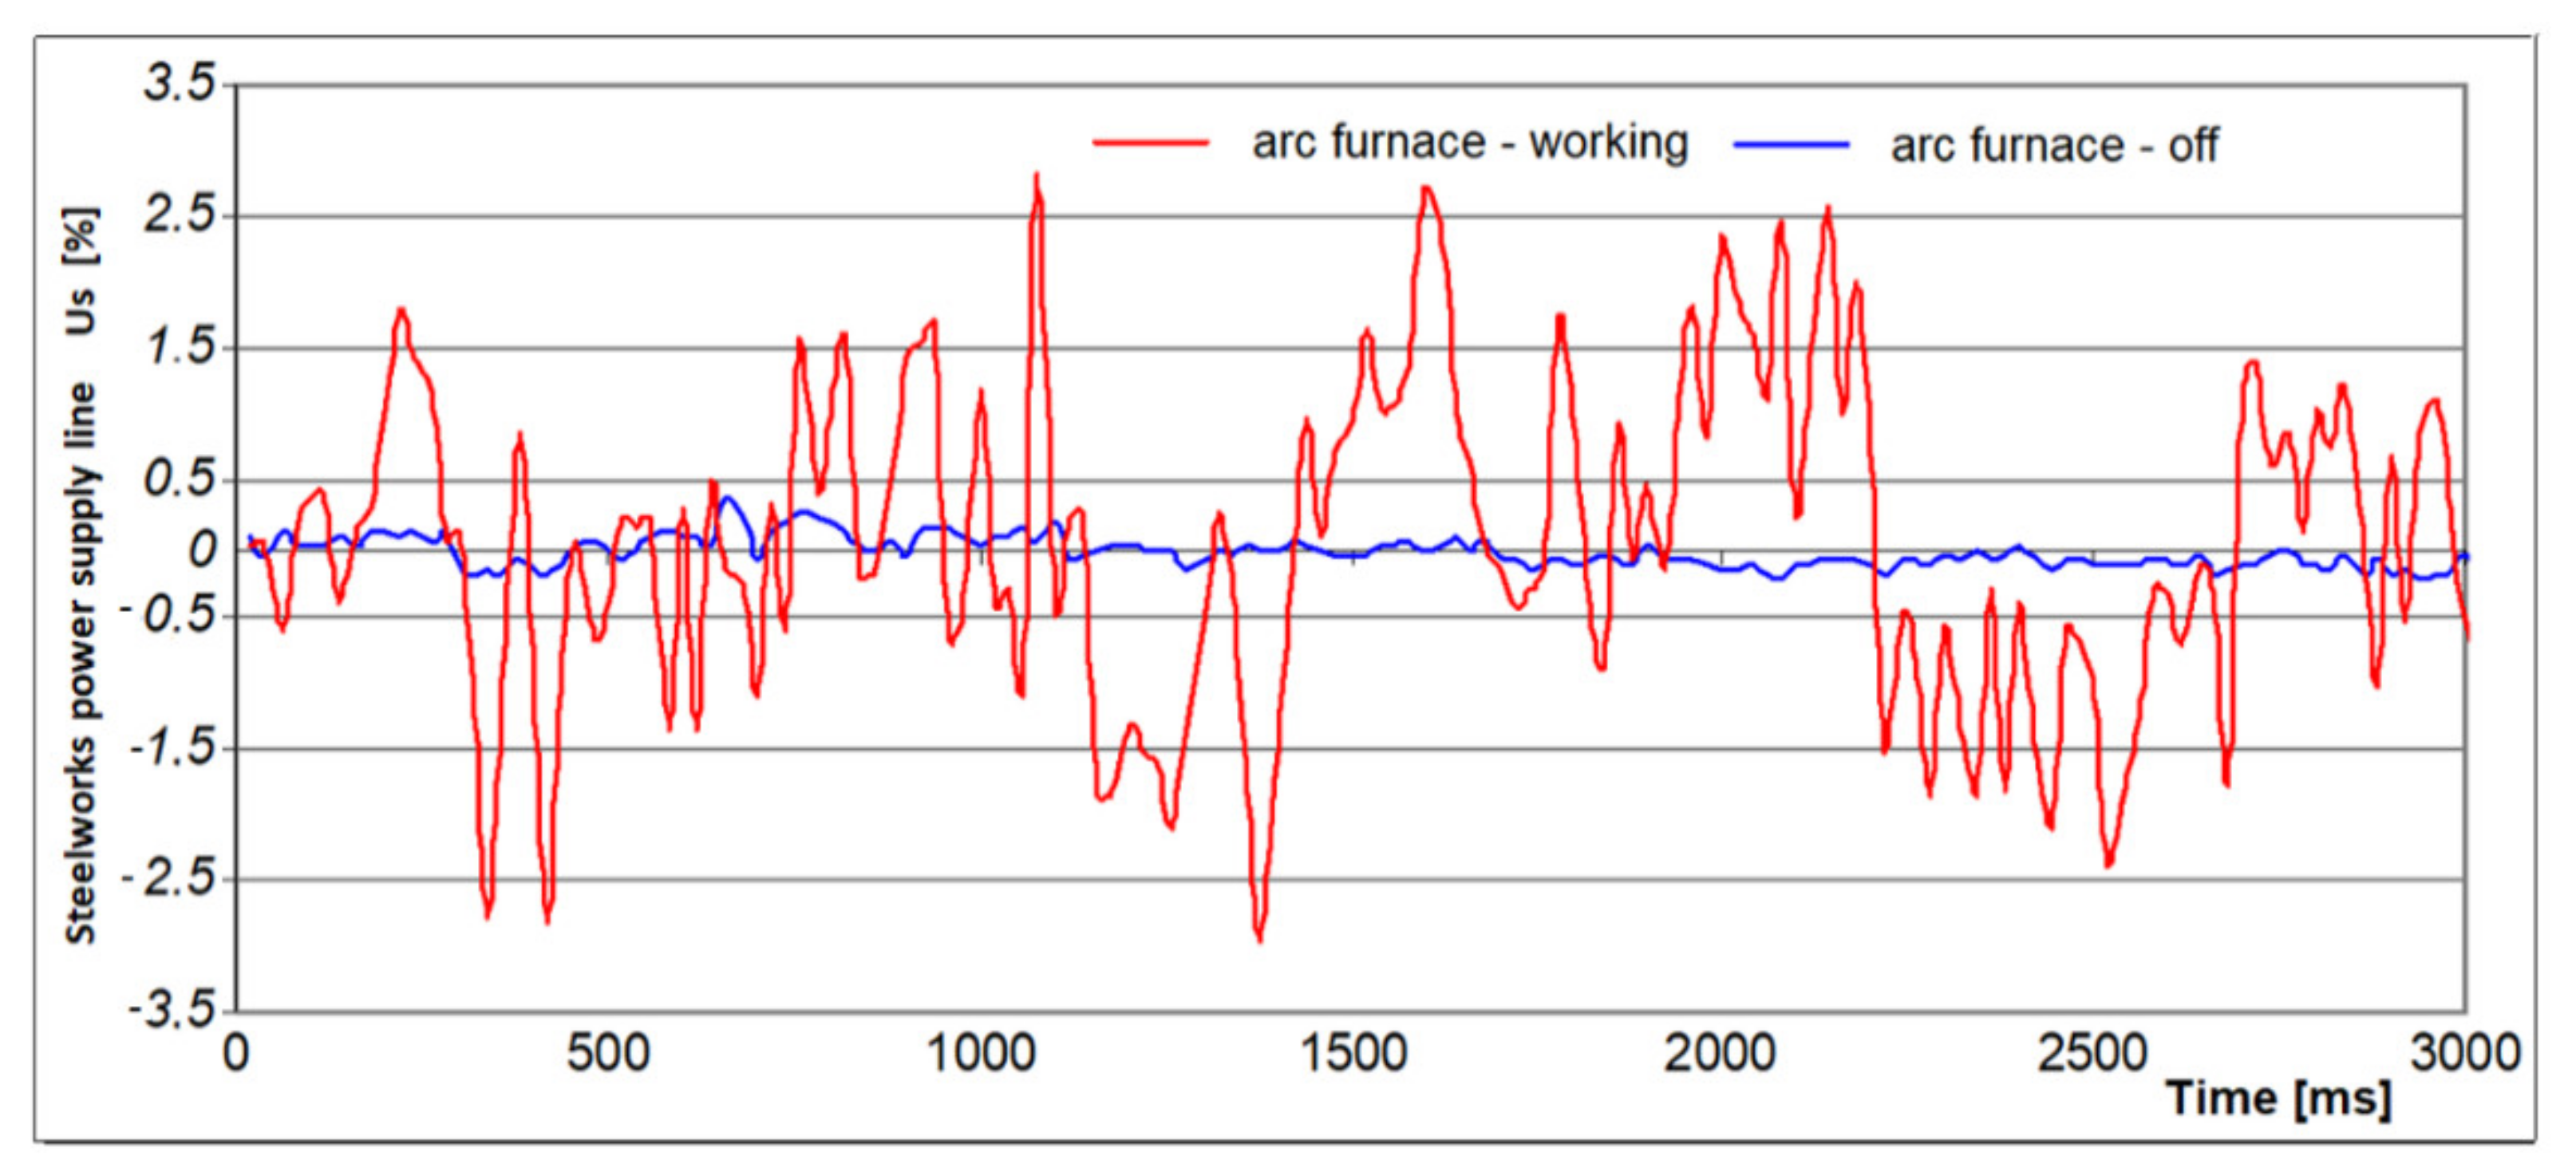
Figure 20.
Changes in voltage fluctuations with arc furnace on and off.

Figure 21.
Histograms of changes in the periodicity in the middle of class range.

Figure 22.
Periodicity expansion (a) and distribution function (b) as a function of voltage fluctuations.
Figure 22.
Periodicity expansion (a) and distribution function (b) as a function of voltage fluctuations.


Table 1.
Voltage fluctuations for different values of resistance in the electric arc supply line.
| Scc/Sntr = 120 | Scc/Sntr = 50 | Scc/Sntr = 20 | ||||||
|---|---|---|---|---|---|---|---|---|
| R = 0 | R = 0.1X | R = 0.3X | R = 0 | R = 0.1X | R = 0.3X | R = 0 | R = 0.1X | R = 0.3X |
| 0.601 | 0.624 | 0.652 | 1.492 | 1.523 | 1.599 | 3.892 | 3.992 | 4.082 |
Table 2.
Amount and periodicity of the resolving series and the cumulative resolving series of voltage fluctuations.
Table 2.
Amount and periodicity of the resolving series and the cumulative resolving series of voltage fluctuations.
| Class Number | Class Range | Center Class | Amount | Periodicity | Cumulative Amount | Cumulative Periodicity |
|---|---|---|---|---|---|---|
| i | - | U | ni | fi | ni* | fi* |
| −3 | −2.81; −2.00 | −2.405 | 7 | 0.0464 | 7 | 0.0464 |
| −2 | −1.99; −1.19 | −1.590 | 20 | 0.1325 | 27 | 0.1788 |
| −1 | −1.18; −0.38 | −0.780 | 32 | 0.2119 | 59 | 0.3907 |
| 0 | −0.37; 0.44 | 0.035 | 40 | 0.2649 | 99 | 0.6556 |
| 1 | 0.45; 1.25 | 0.850 | 26 | 0.1722 | 125 | 0.8278 |
| 2 | 1.26; 2.06 | 1.660 | 19 | 0.1258 | 144 | 0.9536 |
| 3 | 2.07; 2.88 | 2.475 | 7 | 0.0464 | 151 | 1.0000 |
ni* cumulative amount. fi* cumulative periodicity.
Table 3.
Statistical data for the χ2 Pearson test.
| Ui | ni | zi | F(zi) | pi | npi | (ni-pi)2/npi |
|---|---|---|---|---|---|---|
| −2.00 | 7 | −1.67 | 0.0436 | 0.04 | 6.58 | 0.026 |
| −1.19 | 20 | −1.00 | 0.1515 | 0.11 | 16.29 | 0.843 |
| −0.38 | 32 | −0.33 | 0.3623 | 0.21 | 31.83 | 0.001 |
| 0.44 | 40 | 0.36 | 0.6368 | 0.27 | 41.45 | 0.051 |
| 1.25 | 26 | 1.03 | 0.8485 | 0.21 | 31.97 | 1.114 |
| 2.06 | 19 | 1.70 | 0.9564 | 0.11 | 16.29 | 0.450 |
| 2.88 | 7 | 2.38 | 0.9918 | 0.04 | 6.58 | 0.026 |
| Sum | 151 | x | x | 1.00 | 151 | 2.511 |
Publisher’s Note: MDPI stays neutral with regard to jurisdictional claims in published maps and institutional affiliations. |
© 2021 by the author. Licensee MDPI, Basel, Switzerland. This article is an open access article distributed under the terms and conditions of the Creative Commons Attribution (CC BY) license (http://creativecommons.org/licenses/by/4.0/).
Share and Cite
MDPI and ACS Style
Olczykowski, Z. Modeling of Voltage Fluctuations Generated by Arc Furnaces. Appl. Sci. 2021, 11, 3056. https://0-doi-org.brum.beds.ac.uk/10.3390/app11073056
AMA Style
Olczykowski Z. Modeling of Voltage Fluctuations Generated by Arc Furnaces. Applied Sciences. 2021; 11(7):3056. https://0-doi-org.brum.beds.ac.uk/10.3390/app11073056
Chicago/Turabian StyleOlczykowski, Zbigniew. 2021. "Modeling of Voltage Fluctuations Generated by Arc Furnaces" Applied Sciences 11, no. 7: 3056. https://0-doi-org.brum.beds.ac.uk/10.3390/app11073056
Note that from the first issue of 2016, this journal uses article numbers instead of page numbers. See further details here.