
Parametric Analysis of a Polygeneration System with CO2 Working Fluid


Thermal Department, School of Mechanical Engineering, National Technical University of Athens, Zografou, Heroon Polytechniou 9, 15780 Athens, Greece
*
Author to whom correspondence should be addressed.
Appl. Sci. 2021, 11(7), 3215; https://0-doi-org.brum.beds.ac.uk/10.3390/app11073215
Submission received: 19 March 2021
/
Revised: 31 March 2021
/
Accepted: 1 April 2021
/
Published: 3 April 2021
(This article belongs to the Special Issue Current Status on Natural Working Fluids in Cooling, Heating and Power Systems)
Abstract
:The objective of the present work is the investigation of a novel polygeneration system for power, refrigeration and heating production at two temperature levels. The present system uses CO2 as the working fluid, which is an environmentally friendly fluid. The total configuration is a combination of a transcritical refrigeration cycle coupled to a Brayton cycle with recompression, which is fed by a biomass boiler. The examined system, at nominal operating conditions, produces refrigeration at 5 °C, and heating at 45 °C and 80 °C. Additionally, the system can be converted into a trigeneration system where the two heating outputs are produced at the same temperature level. The system was studied parametrically by changing the following seven critical parameters: turbine inlet temperature, high pressure, medium pressure, heat exchanger effectiveness, refrigeration temperature, heat rejection temperature and high heating temperature. In nominal operating conditions, the system energy and exergy efficiencies were 78.07% and 26.29%, respectively. For a heat input of 100 kW, the net power production was 24.50 kW, the refrigeration production was 30.73 kW, while the low and high heating production was 9.24 kW and 13.60 kW, respectively. The analysis was conducted with a developed model in Engineering Equation Solver.
1. Introduction
Renewable energy utilization is an important weapon for tackling critical energy problems such as fossil fuel depletion, global warming, increasing energy demand and increasing electricity prices [1,2,3]. Furthermore, trigeneration and polygeneration systems are highly efficient units that can produce numerous useful outputs simultaneously [4,5]. Thus, the concept of using renewable energy sources to feed polygeneration systems is a viable and environmentally friendly solution for future sustainable systems. Another important aspect of these systems is their use of environmentally friendly working fluids, which are usually natural fluids such as CO2, NH3, propane and butane [6]. However, these fluids present some limitations, which are related to performance, toxicity and flammability. CO2 seems to be the most promising fluid as it can operate both in transcritical and supercritical configurations and it is not toxic, not flammable and it is a cheap working fluid [7]. Moreover, there are alternative working fluids (not natural) that have zero ODP and a not so high GWP (<1000) that can be used, like R32, R245ca, R245fa, R365mfc and R1336mzz [8].
In the literature, there are many studies that examine polygeneration systems driven by renewable energy sources (solar, geothermal, biomass and wind) [9]. Al-Sulaiman [10] studied a system with an organic Rankine cycle (ORC), absorption heat pump and parabolic trough solar collectors, which presented a 20% exergy efficiency. A similar configuration was examined and optimized by Bellos and Tzivanidis [11], who found a global maximum exergy efficiency of 29.4% with an energy efficiency of about 150%. A trigeneration system driven by solar energy was studied by Eisavi et al. [12]. This system incorporated an ORC and a double-stage absorption heat pump and had 13% exergy efficiency and 96% energy efficiency. Mathkor et al. [13] investigated a unit for fresh-water, cooling and electricity production that was driven by a parabolic trough collector, which had an exergy efficiency of 42%. In another interesting work, Voeltzel et al. [14] examined a cogeneration unit for cooling and electricity production based on absorption technology. They conducted an experimental investigation and found the maximum electricity production was up to 0.7 kW, while the maximum cooling production was up to 8 kW.
The combination of solar and geothermal energy has been studied by Khalid et al. [15]. They studied a configuration with an ORC and absorption chiller, which had 76% energy efficiency and 7.3% exergy efficiency. Bellos et al. [16] studied a polygeneration system driven by solar energy and biomass. This system produced heating at two temperature levels, cooling and electricity. The energy efficiency was 51.3% and the exergy efficiency was 21.8%. Harrod et al. [17] studied the use of a trigeneration system with a Stirling engine as the primary mover, which was driven by biomass heat input. They found that the recovery of the engine waste heat was a promising idea for improving the system’s sustainability.
The next part of our literature review focused on trigeneration systems that use CO2 as the working fluid. Wang et al. [18] studied a Brayton power cycle with an ejector device for power and refrigeration production, which also produced heating from the turbine outlet heat. The system was driven by compound parabolic solar collectors and it showed 28.8% exergy efficiency and 53% energy efficiency. Xu et al. [19] studied the modification of the previous system with extraction, which resulted in a 22.5% exergy efficiency enhancement. Hou et al. [20] studied a complex cycle with CO2 as the main working fluid. This system was driven by methanol and it includes a typical air-Brayton cycle, which feeds heat to a CO2 cycle for power and refrigeration. The heating produced by this system is practically steam, which is created by the waste heat of the air-Brayton cycle. The system is optimized exergo-economically and the exergo-economic factor was found to be 28.23%. In another work, Misha and Singh [21] examined a trigeneration unit with parabolic trough solar collectors, supercritical CO2 Brayton cycle and a bottoming absorption cycle. They found that the optimum maximum temperature occurred at 650 K and in this case, the exergy efficiency was about 75% and the energy efficiency was about 45%. Balafkandeh et al. [22] optimized a biomass-driven trigeneration system with a CO2-Brayton cycle and an absorption chiller. They found maximum energy and exergy efficiencies at 43.7% and 47.8%, respectively. Interestingly, Fan et al. [23] studied a trigeneration system with a supercritical CO2 recompression Brayton cycle and a Rankine cycle with an ejector device. This unit was fed by heat from a nuclear reactor and it was optimized with a multi-objective optimization procedure. The exergy efficiency was found to be up to 69% and the trigeneration configuration had 9.2% higher exergy efficiency compared to the system with supercritical CO2, which produced only electricity. Additionally, an interesting optimization was performed by Yang et al. [24] for a CO2-based trigeneration system. They found that the optimum cooling to electricity ratio had to be in the range of 1.37 to 1.53. Lastly, Zare and Takleh [25] studied a geothermal-based trigeneration system with CO2. They studied two systems with a modified Brayton cycle with an ejector inside the system. They found that the use of an internal heat exchanger in place of the gas cooler led to enhancement in the performance and to a maximum exergy efficiency of 32%. Finally, the use of the CO2 transcritical cycle for storage issues can be applied in polygeneration systems as an alternative choice as has been suggested by Ayachi et al. [26].
Our literature review indicates that there is a lot of interest in trigeneration and polygeneration energy systems with renewable energy sources and natural refrigerants. In this direction, the present work investigates a novel polygeneration system for refrigeration, power and heating production at two temperature levels. This system includes a thermodynamic cycle that is practically, a combination of a mechanical compression power cycle and a recompression Brayton cycle. The unit is fed by biomass and the working fluid is CO2. To our knowledge, there are no other studies that have investigated a system such as the present one, which combines four useful products, a renewable energy source as the heat input (biomass in this case) and a natural refrigerant as the only working fluid. Thus, this work suggests a totally new, and source configuration. The system was examined in steady-state conditions and it was analyzed parametrically. The study was conducted by using a developed thermodynamic model in Engineering Equation Solver [27].
2. Material and Methods
2.1. The Examined System
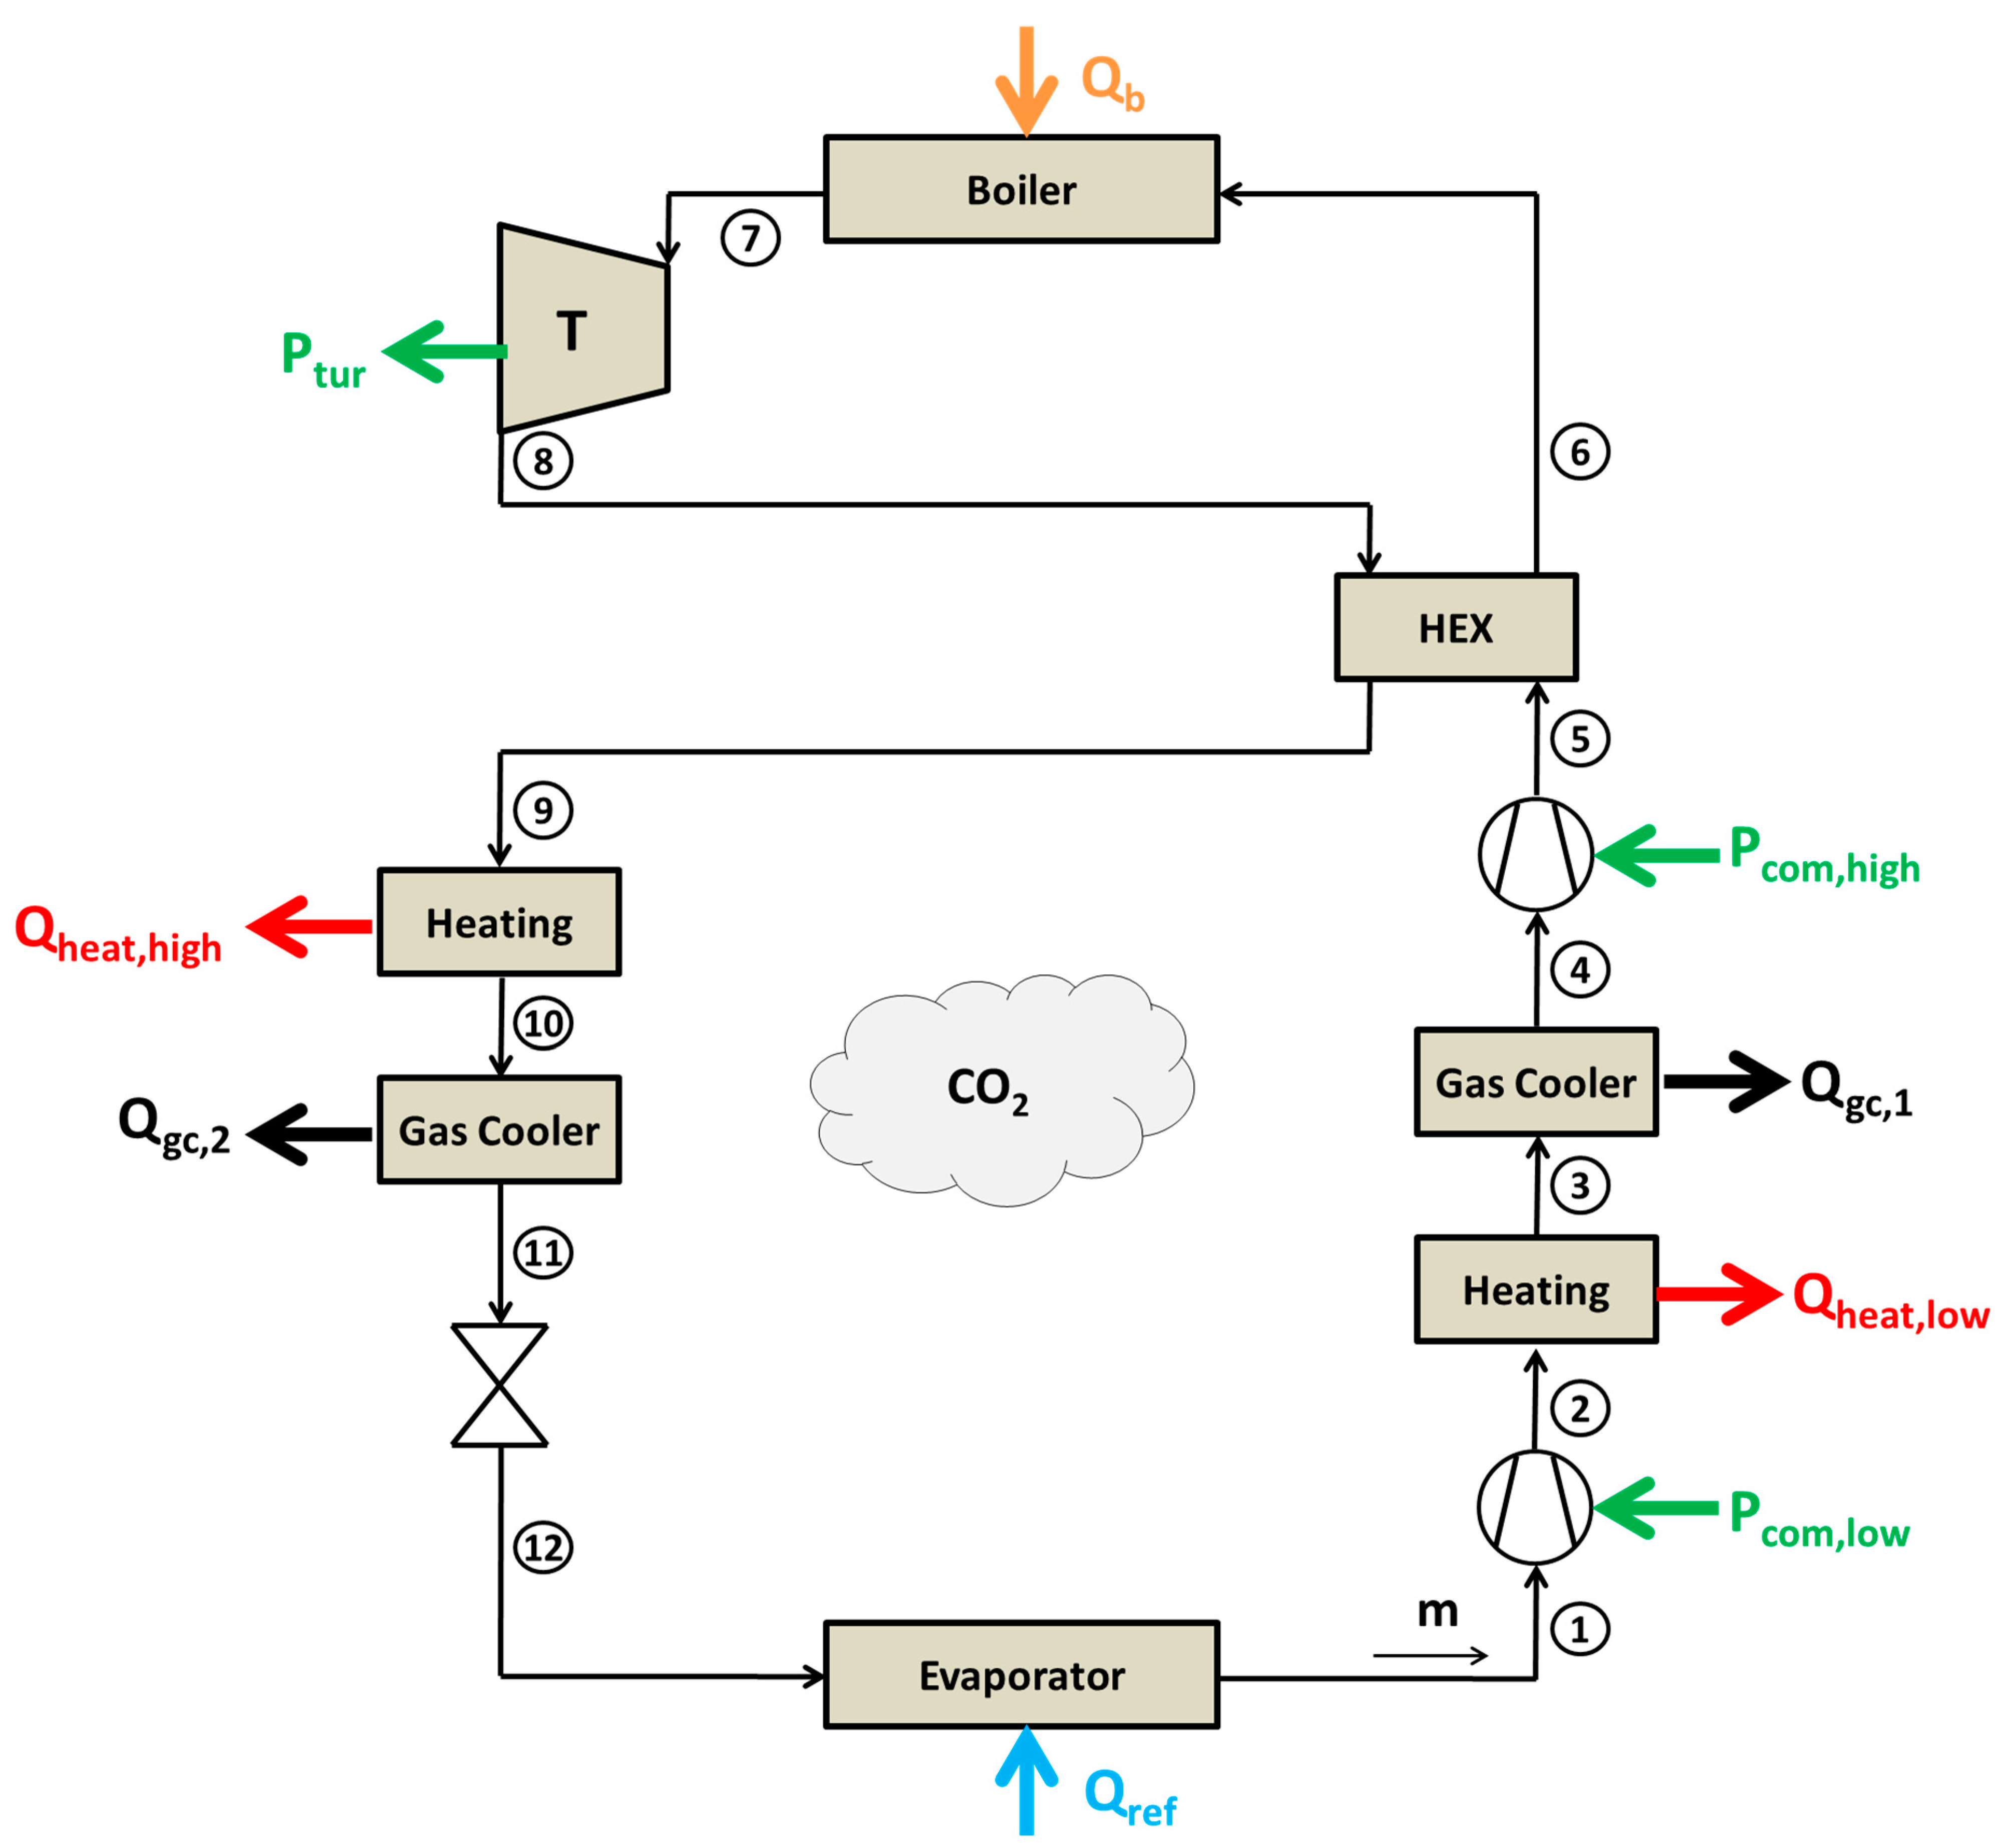
In this work, a polygeneration system was investigated as shown in Figure 1. A biomass boiler was used as the energy heat input and it gives the proper energy for the system operation. The working fluid in the examined thermodynamic cycle is CO2, which is an environmentally friendly fluid. This fluid has a relatively low critical point with the critical pressure being 73.8 bar and the critical temperature being 31.1 °C.
Refrigeration is produced from the evaporator and saturated vapor (quality equal to 100%) is produced (Figure 1, state point 1). This quantity is compressed from low pressure to medium pressure with the use of the compressor (state point 2). After this, a proper heat exchanger is used in order to produce low-temperature heating at 45 °C and state point 3 is selected as 50 °C in all the cases. Practically, a temperature difference of 5 °C [28] is used in order to ensure proper heat transfer. Moreover, a gas cooler is used in order to reject heat to the ambient and so the CO2 reaches state point 4. A second compressor re-compresses this quantity up to state point 5. The present configuration has intercooling in order to reduce the compressing work and to recover heating. Moreover, the recompression from state point 4 to state point 5 needs a small amount of work because state point 4 is close to the critical point of the CO2 (from the supercritical side) and so the density of the CO2 is relatively high, which reduces the pumping work.
After the second compressor, there is a heat exchanger in order to preheat the CO2 before the biomass boiler. So, the CO2 is warmed up to state point 6 and goes into the boiler where its temperature is increased up to the turbine inlet temperature (TIT) at state point 7. The turbine receives fluid of high pressure at state point 7 and expands it up to state point 8 (medium pressure), and so, work is produced. The heat exchanger reduces the temperature of the supercritical CO2 (state point 9) and the next step is the heat recovery in the high-temperature levels (state point 10). A pinch point of 5 °C was also applied in this device, and when the high heating temperature is 80 °C, for example, the temperature level in state point 10 is 85 °C in this case [28]. The gas cooler follows the heating device and heat is rejected to the ambient up to state point 11. A throttling valve is used to reduce the pressure from the medium to a low level. This device is assumed to be adiabatic, and so, the enthalpy is the same in its inlet and outlet. The state point after the valve (12) is the inlet in the evaporator and so the cycle closes.
A general overview of the present system can be performed by explaining the heat exchanges of the examined system with the ambient and the external sources. The examined system takes heat from a biomass boiler (Qb) at a high temperature (e.g., 700 °C) and there is a heat input in the evaporator (Qref), which is the refrigeration load in the lowest cycle temperature (e.g., 5 °C). The system rejects heat to the ambient in the gas coolers (Qgc,1 and Qgc,2) as it has a relatively low temperature of 35 °C, and so these heat rates are rejected and not reused. There are also the heating heat exchangers, which perform energy recovery, and consequently, heating production. More specifically, the (Qheat,low) is produced at 45 °C, while the (Qheat,high) is produced at a higher temperature (e.g., 80 °C). The compressors consume a part of the work that the turbine produces, while there is a net-work production from the system to the grid.
It should be noted that this study is a thermodynamic work and some parameters have been selected to have their ideal values. In this direction, the mechanical efficiencies were selected to be 100% and the heat exchange modeling from the heat exchanger to the ambient and to the heating production were done without taking the overall heat transfer coefficient into consideration.
An alternative design could be with a medium pressure lower than the critical pressure of the CO2, and in this case, the heat rejection in the ambient could be conducted with a condenser and at a lower temperature. However, this configuration would only operate in relatively cold conditions with an ambient temperature up to 25 °C. Thus, this work rejected heat in a supercritical pressure in order to avoid having restrictions and the system was designed to take advantage of this section by using the proper heat exchanger devices. Moreover, another option is to couple the turbine with the compressors in the same shaft in order to improve the overall performance of the systems, to reduce the cost and to develop a compact design.
2.2. Mathematical Formulation
This section includes the basic mathematical equations for the simulation of the suggested system. These equations are developed by the energy balance in the various devices. Firstly, the equations for the determination of the energy inputs/outputs are given:
The heat input (Qb) in the system can be written as:
The useful heat input in the system is written by using the energy balance in the boiler and with the use of the boiler efficiency (ηb):
The refrigeration production (Qref) in the evaporator is written as:
The low-heating production is calculated as:
The high-heating production is calculated as:
The turbine power production (Ptur) is given as:
The low compressor consumption (Pcom,low) is given as:
The high compressor consumption (Pcom,high) is given as:
The net power production of the system (Pnet) is calculated as:
The system energy efficiency (ηen) is given as:
The system exergy efficiency (ηex) is given as:
In the previous equation, the temperature levels are in Kelvin units and the reference temperature (T0) is selected as 298.15 K.
Moreover, the energy balance in the gas coolers can be written as below. The subscript “1” corresponds to the gas cooler between the two compressors and the subscript “20” indicates the gas cooler after the turbine.
The throttling valve reduces the CO2 pressure and this device is assumed to be adiabatic. This fact makes the process isenthalpic and more specifically:
The heat transfer in the heat exchanger can be described by the energy balance between the two streams and the heat exchanger’s effectiveness.
The process in the turbine is described by the isentropic efficiency which is defined as below:
For this work, the following formula was used to calculate the turbine isentropic efficiency [29]:
The process in the low-pressure compressor is described by the isentropic efficiency, which is defined below for the two compressors:
The following formula was used for calculating the low-pressure compressor isentropic efficiency [29]:
The process in the high-pressure compressor is described by the isentropic efficiency, which is defined below for the two compressors:
The following formula was used for calculating the high-pressure compressor isentropic efficiency [29]:
The selected formulas for the isentropic efficiencies for the compressors and the turbine are frequently chosen in the literature on CO2 as the working fluid [29].
2.3. Methodology
In this study, the polygeneration system was investigated in steady-state conditions with a developed model in Engineering Equation Solver (EES) [27]. The presented equations of Section 2.2 were used in the simulation of the present study. Treated wood was used, with a lower heating value (Hu) equal to 15,290 kJ kg−1 [30]. More specifically, the as-received fuel had 14.6% moisture, 4.44% ash, 41.68% C, 4.88% H, 33.39% O, 0.99% N and 0.07% S.
Table 1 shows the main data for the configuration that was examined. The system was firstly examined in nominal operating conditions (Section 3.1) and also it was studied parametrically (Section 3.2). The nominal values of the reference scenario are given in the table, and in all the cases, the heat input was constant at 100 kW. The parameters examined in the parametric study are the following: turbine inlet temperature, high pressure, medium pressure, heat exchanger effectiveness, refrigeration temperature, heat rejection temperature and high heating temperature. Moreover, the temperature level in the turbine inlet can be 700 °C or higher according to the literature [31].
3. Results and Discussion
3.1. Preliminary Analysis
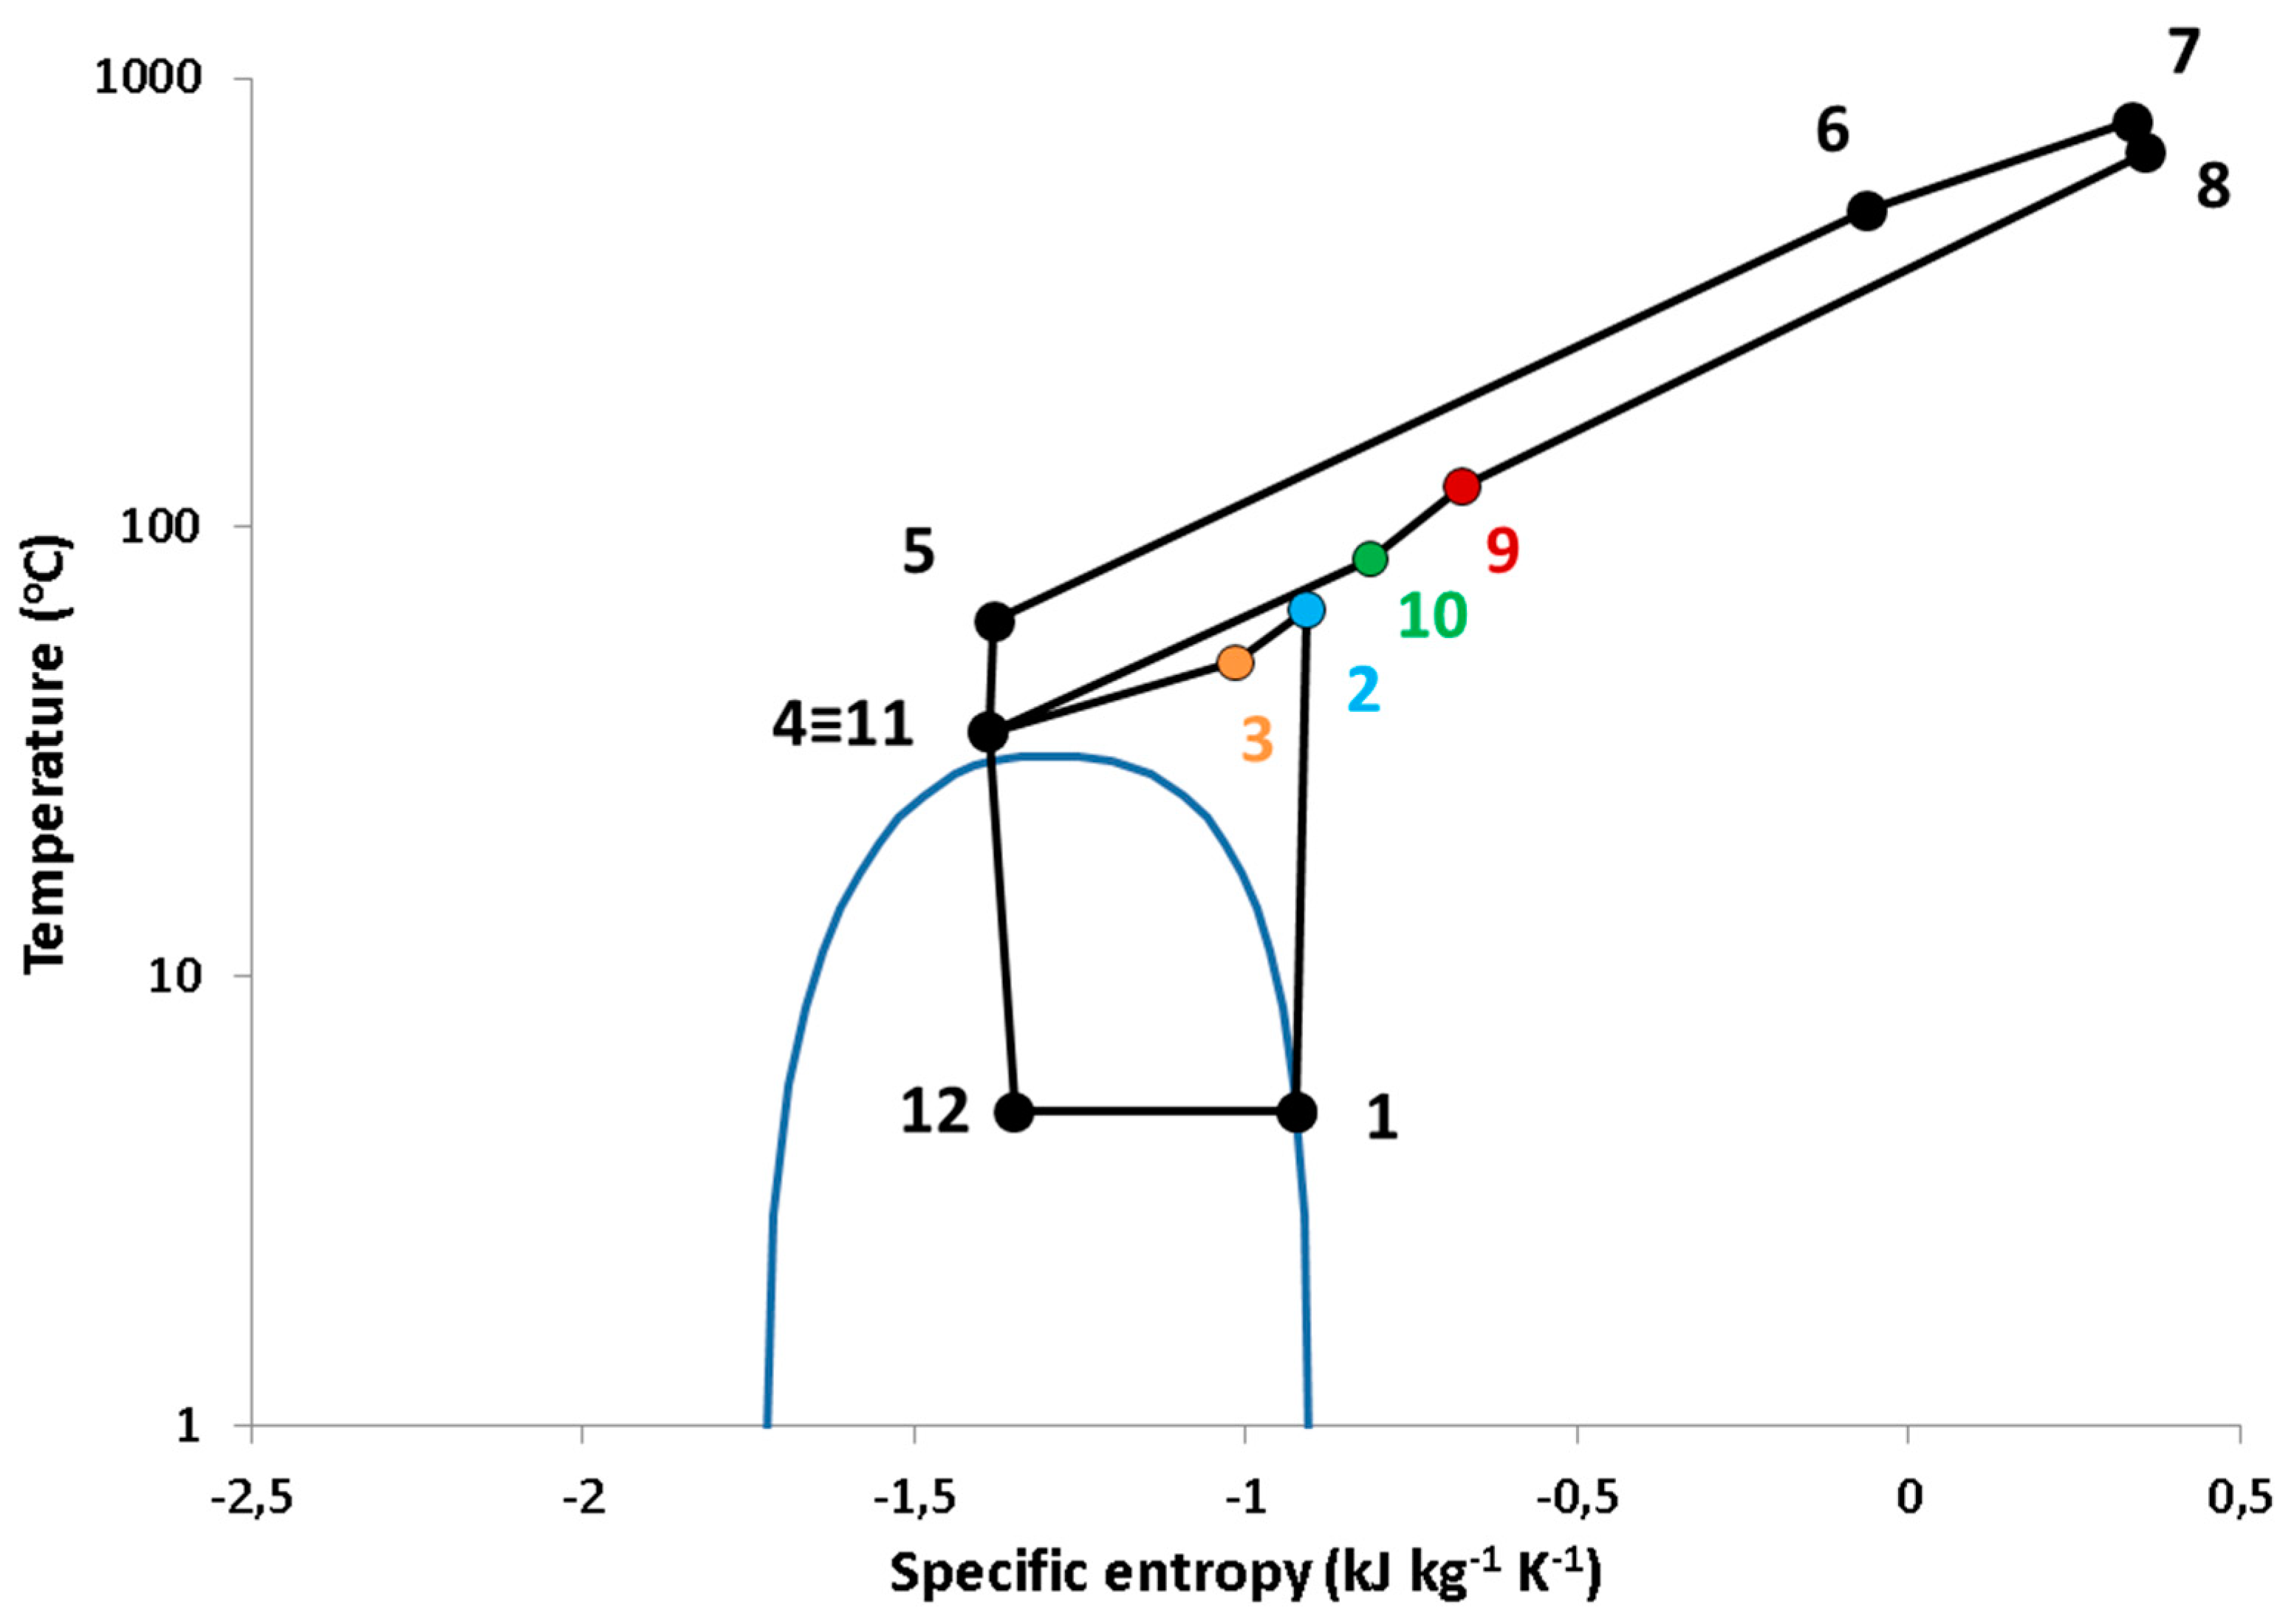
The first part of the present work was the preliminary study of the examined system for the nominal operating conditions. Figure 2 shows the thermodynamic state at various points in a pressure-specific enthalpy (p-h) diagram, while Figure 3 shows the temperature-specific entropy (T-s). The vertical axis of Figure 3 is a logarithmic axis with a ten-based logarithm. These figures show that the examined cycle is a combination of a Brayton power cycle (supercritical region) and a transcritical mechanical compression cycle. So, the total configuration is characterized as a transcritical thermodynamic cycle. Table 2 includes all the state points of the examined cycle and more specifically, the given properties are pressure, specific enthalpy, temperature and specific entropy.
Table 3 includes the main results for the operation in nominal operating conditions. These conditions were selected as typical conditions for producing adequate amounts of all the useful outputs. These conditions correspond to a system that is able to produce cooling and heating at two temperature levels for building applications (e.g., domestic hot water and heating purposes). In this scenario, the net power production was 24.50 kW, the cooling production was 30.73 kW, the heating production at 45 °C was 9.24 kW and the heating production at 80 °C was 13.60 kW. The system energy efficiency was 78.07% and the system exergy efficiency was 26.29%. Moreover, biomass consumption was calculated as 0.00654 kg s−1.
3.2. Parametric Analysis
Section 3.2 presents the parametric analysis of the investigated polygeneration system. Seven parameters were studied and the results are given in Figure 4, Figure 5, Figure 6, Figure 7, Figure 8, Figure 9, Figure 10, Figure 11, Figure 12, Figure 13, Figure 14, Figure 15, Figure 16 and Figure 17. For every parameter, two figures are given; one with the useful outputs’ variation and one with the energy/exergy efficiency variation.
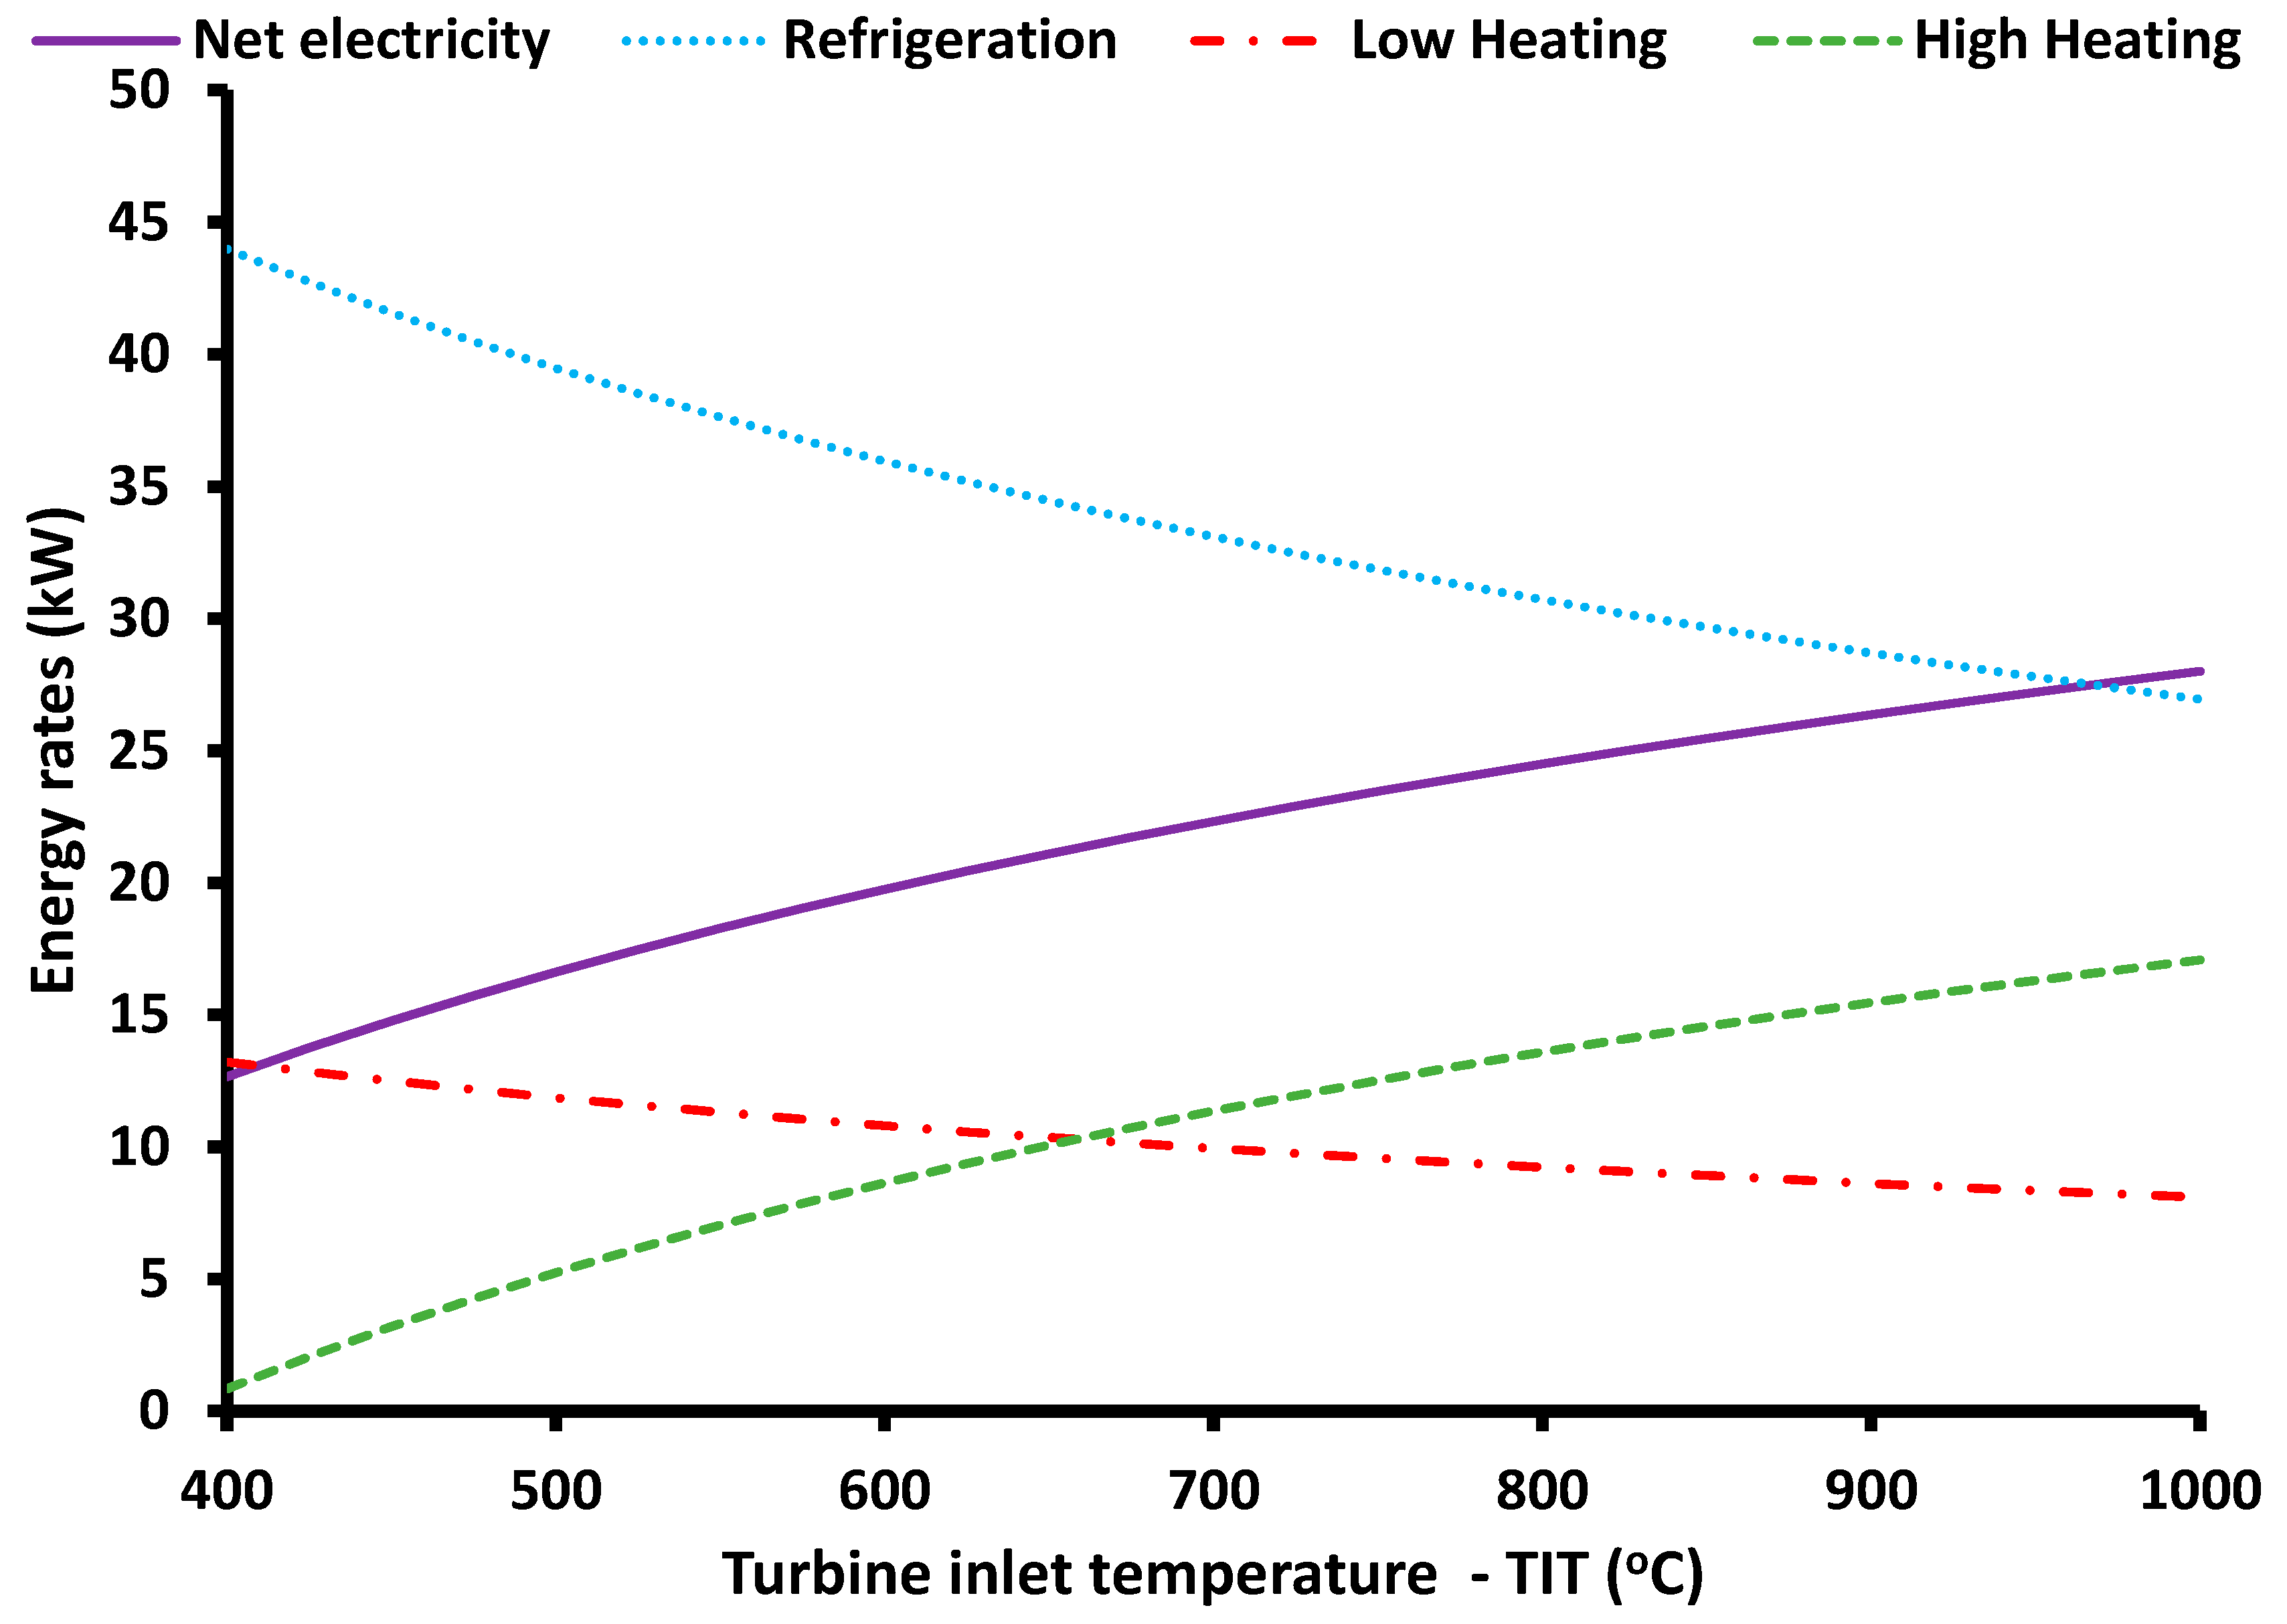
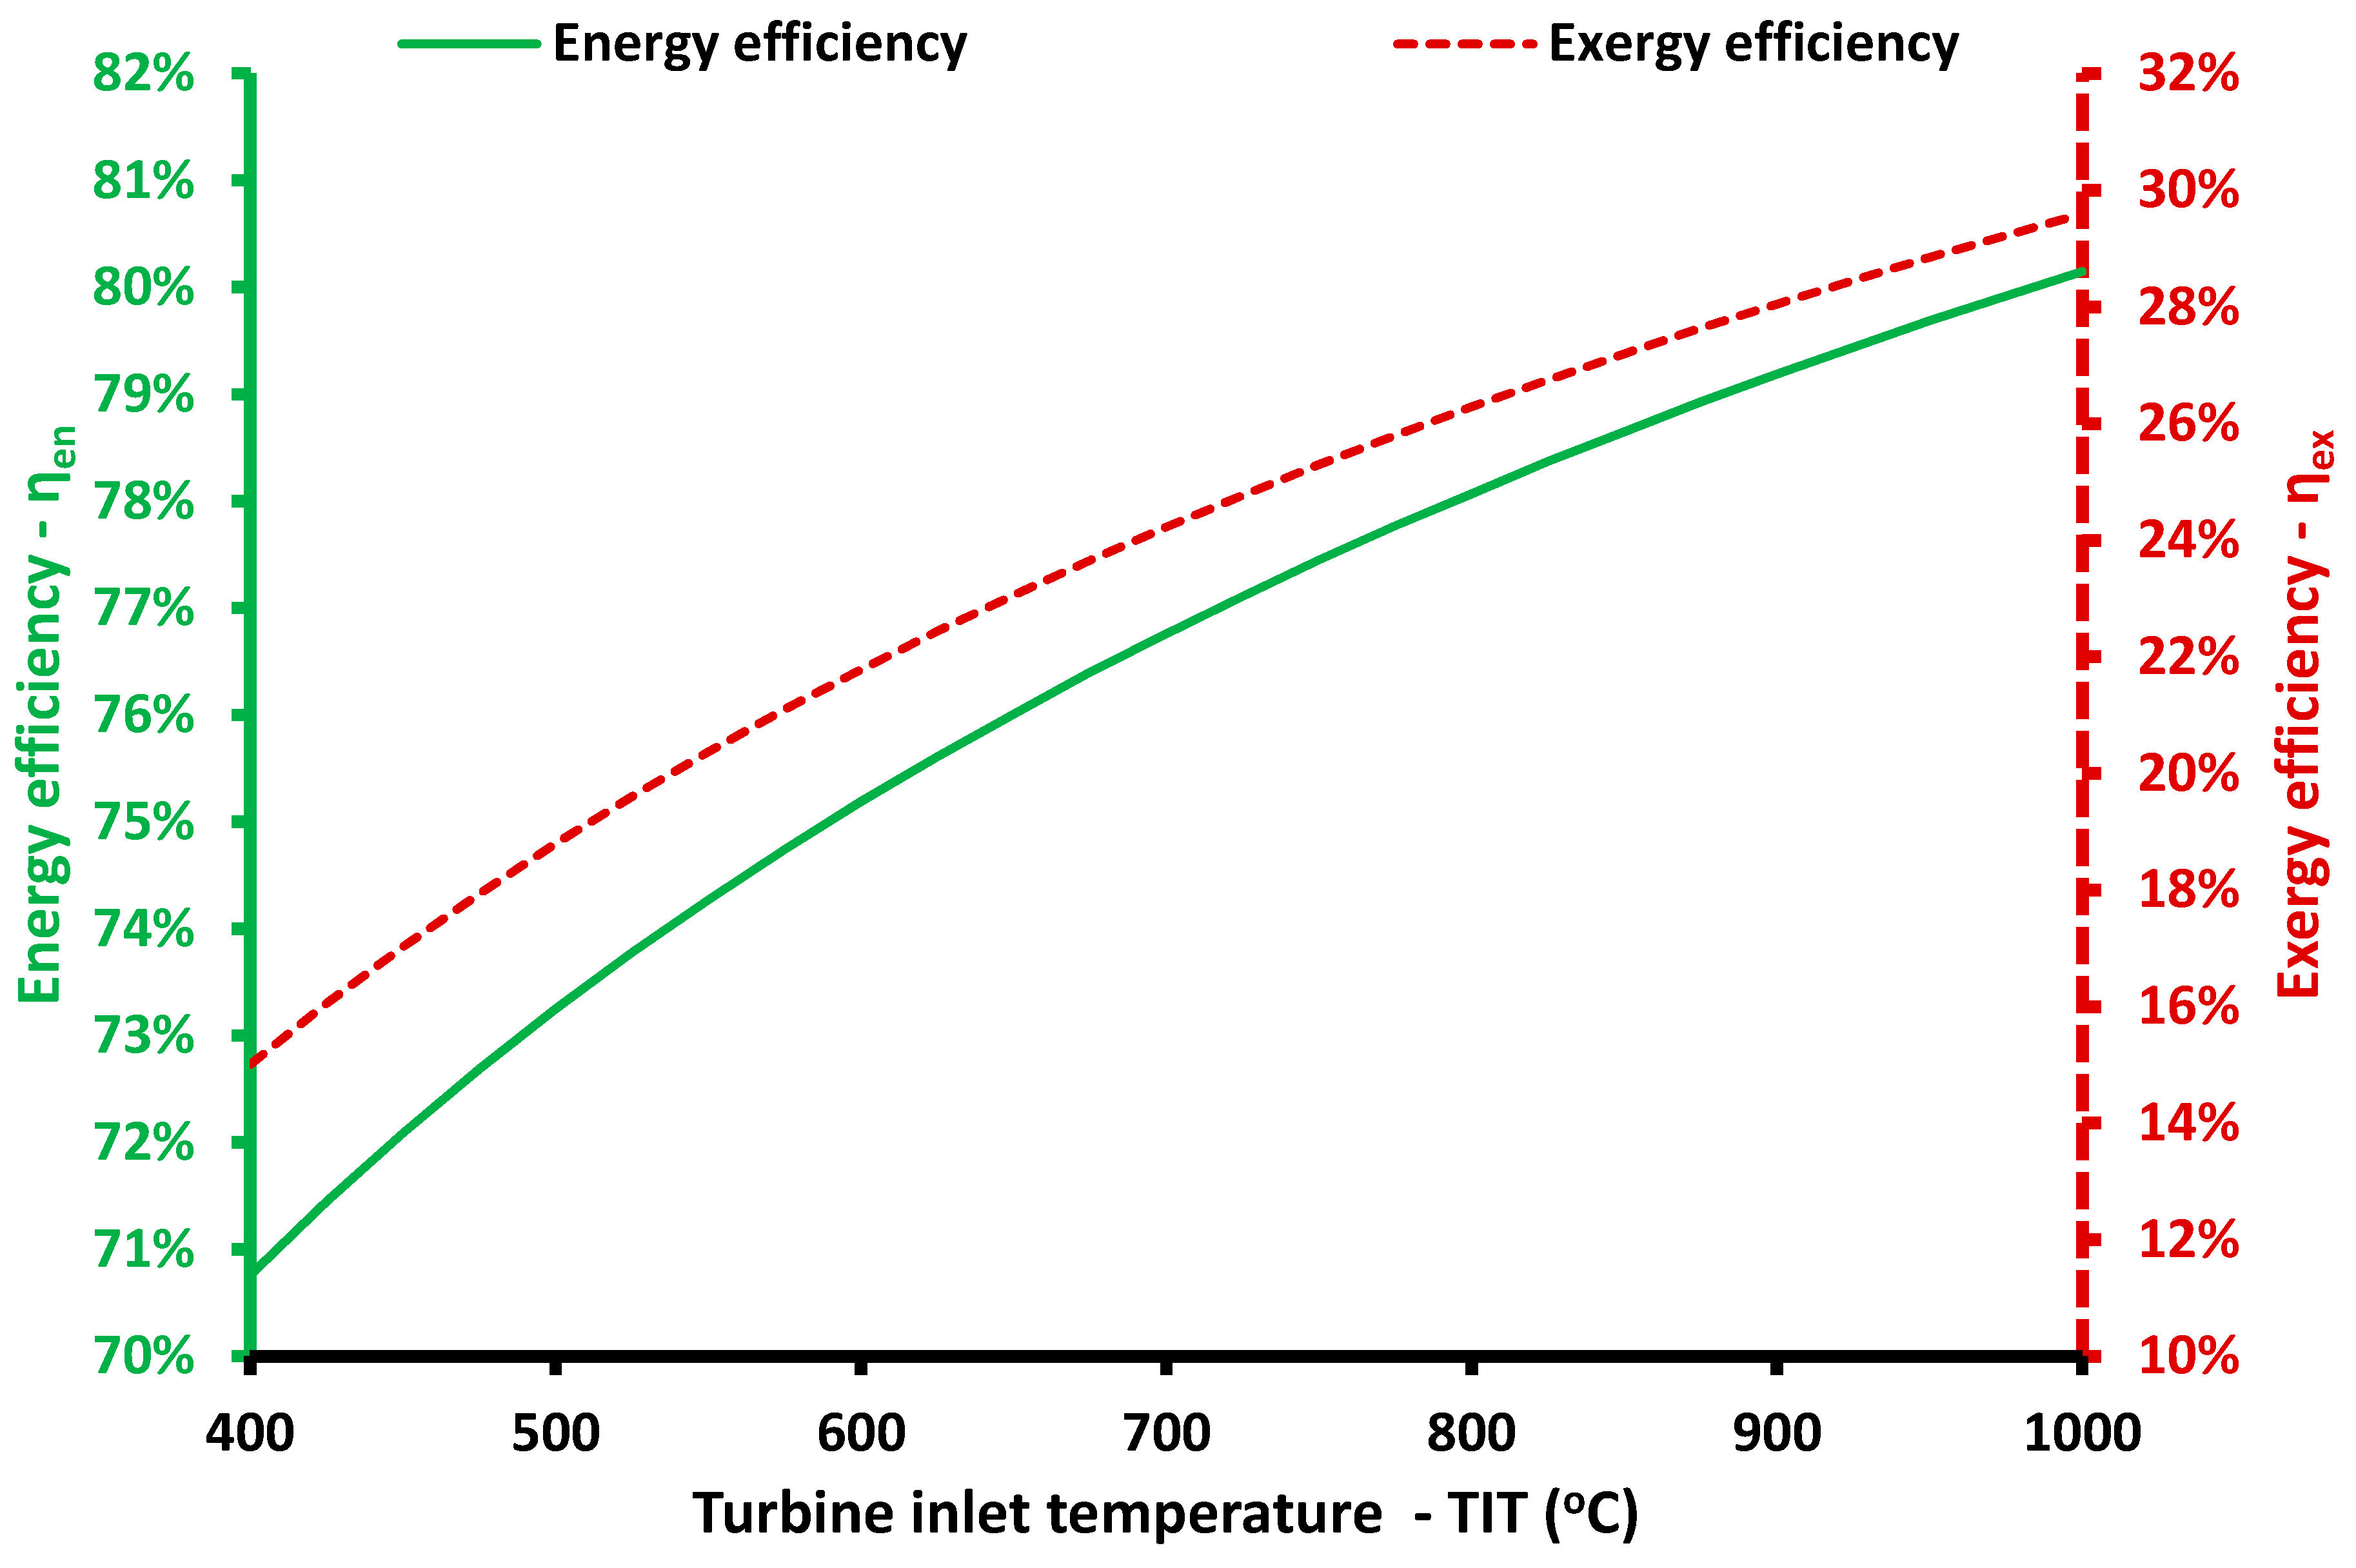
Figure 4 and Figure 5 show the system performance variation for the different values of the turbine inlet temperature (TIT). This parameter is a critical one for Brayton cycles and so it is also important for the present system. Figure 4 indicates that higher TIT increases power production and high heating, while it reduces the low heating and refrigeration production. Figure 5 proves that higher values of TIT increase both the energy and the exergy efficiency of the system. So, it is proved that higher TIT values are beneficial for the system performance, such as in the Brayton cycle where higher TIT increases the power production.
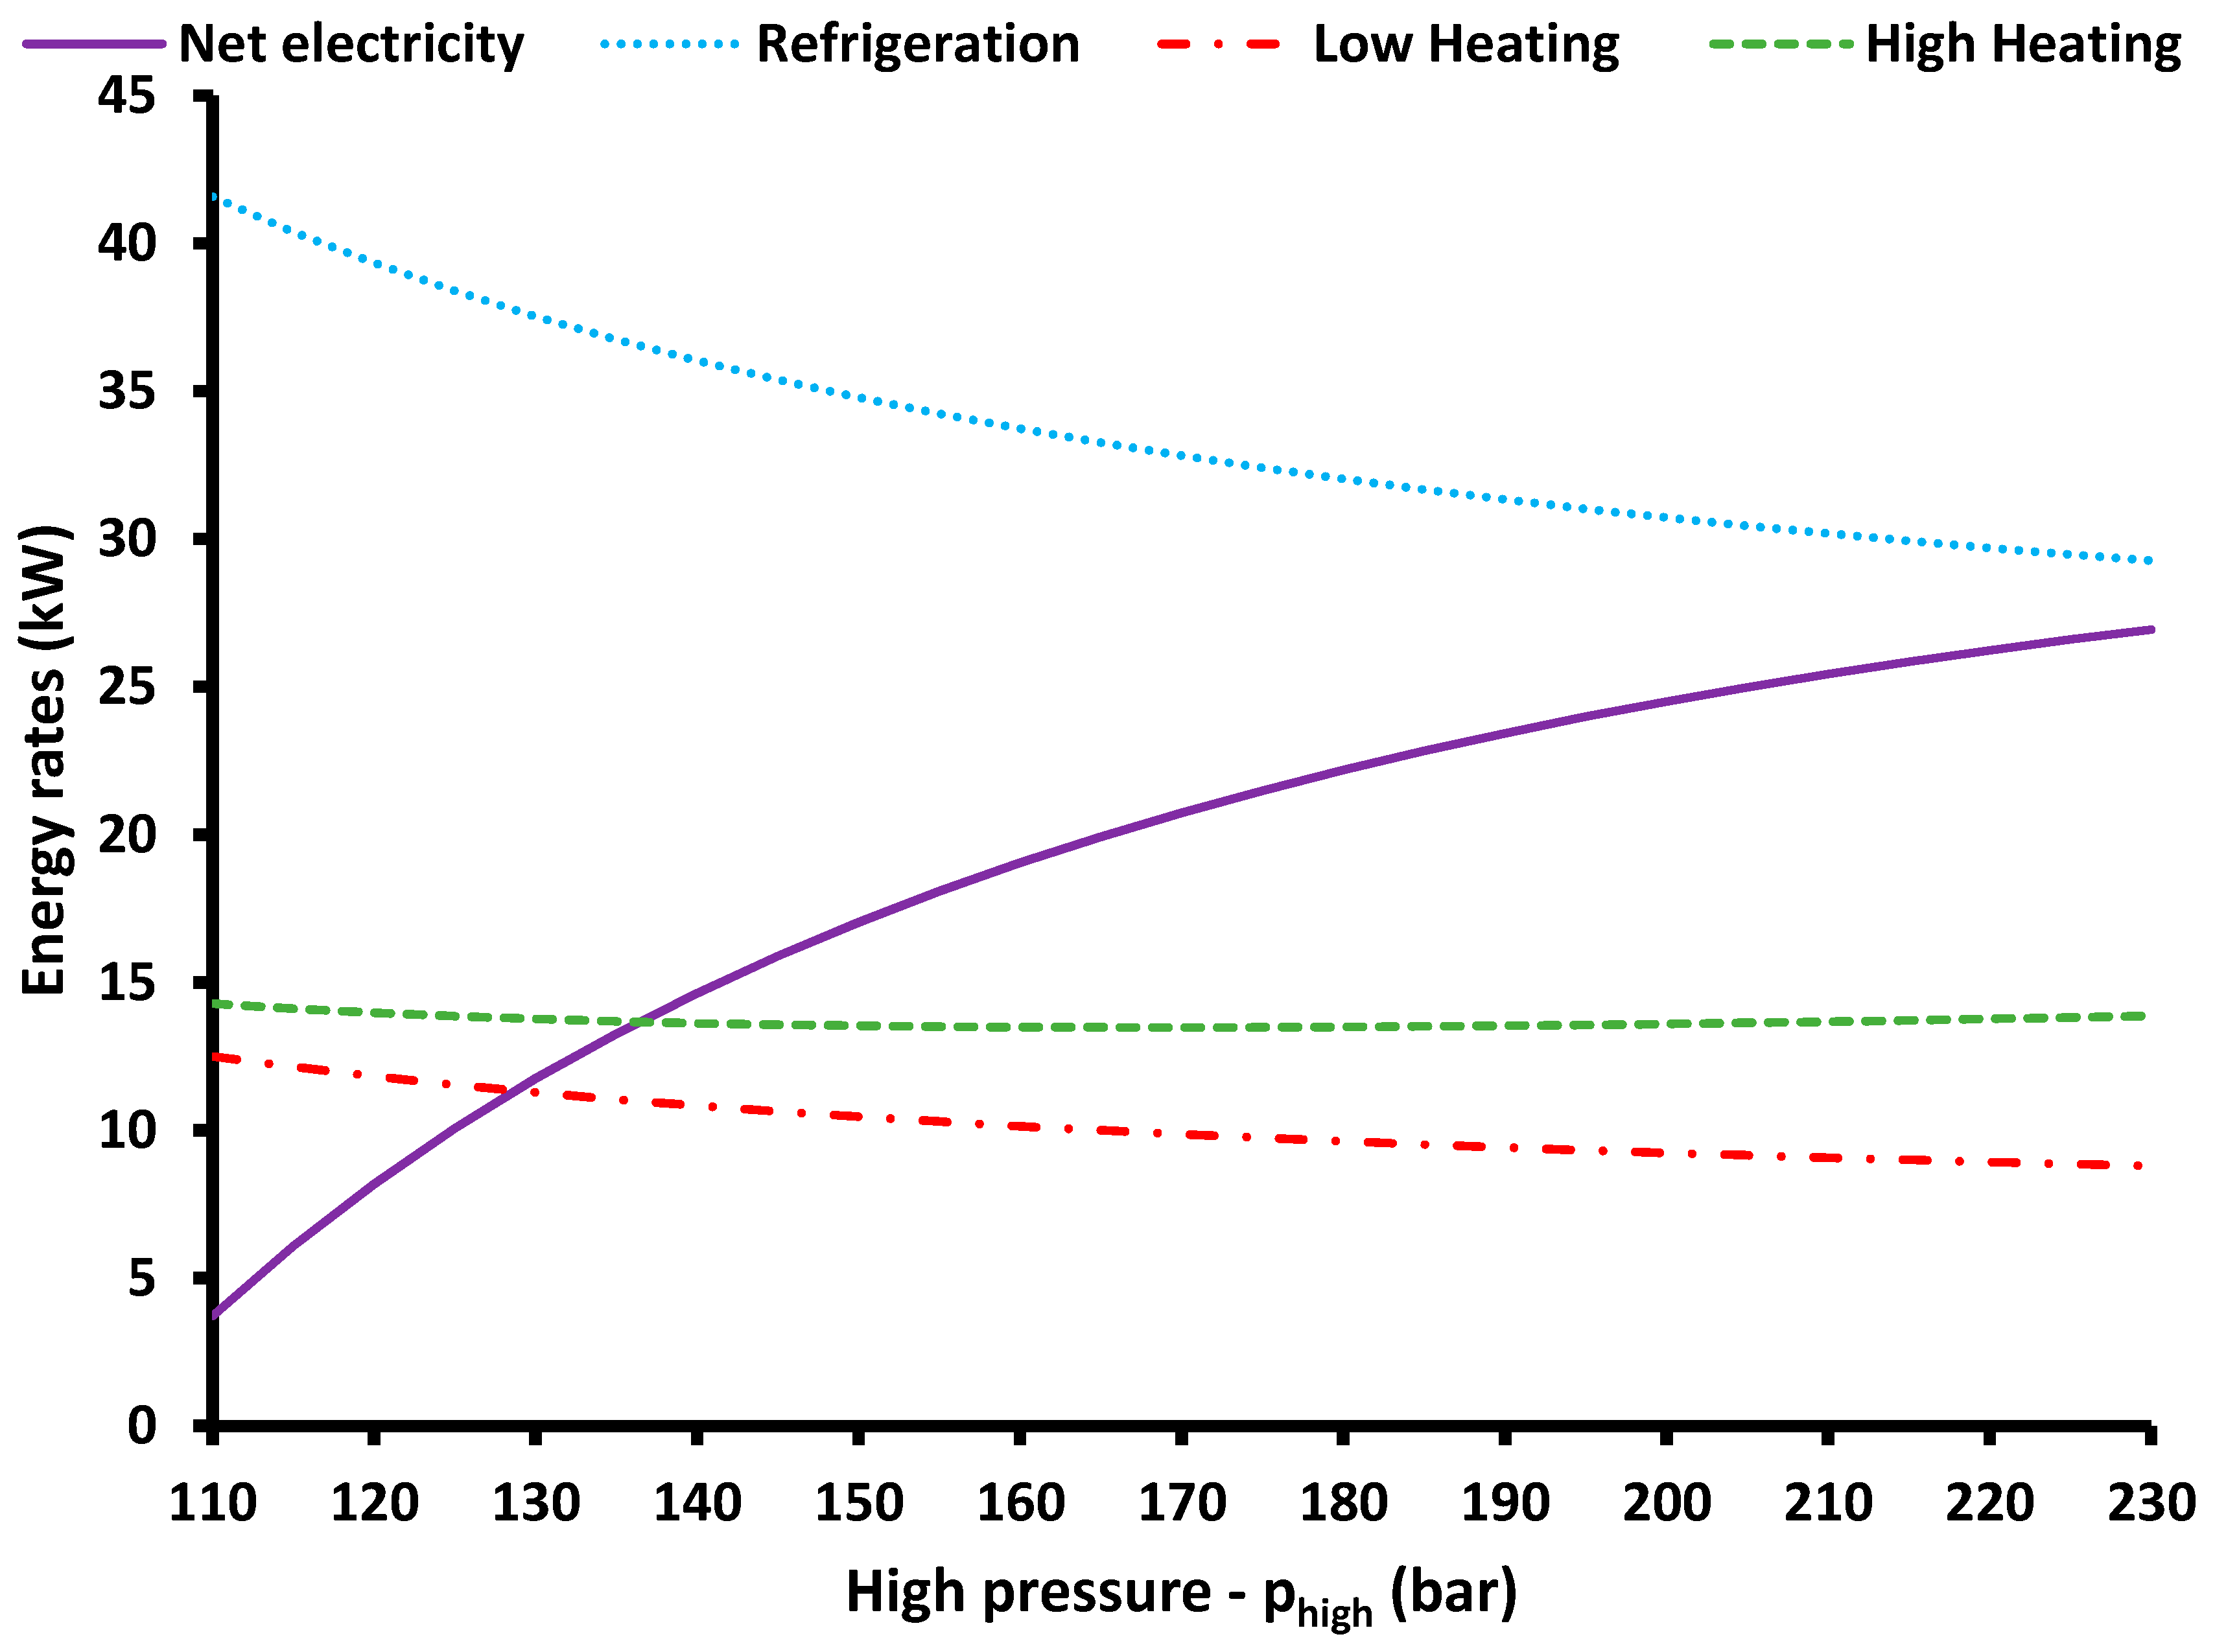
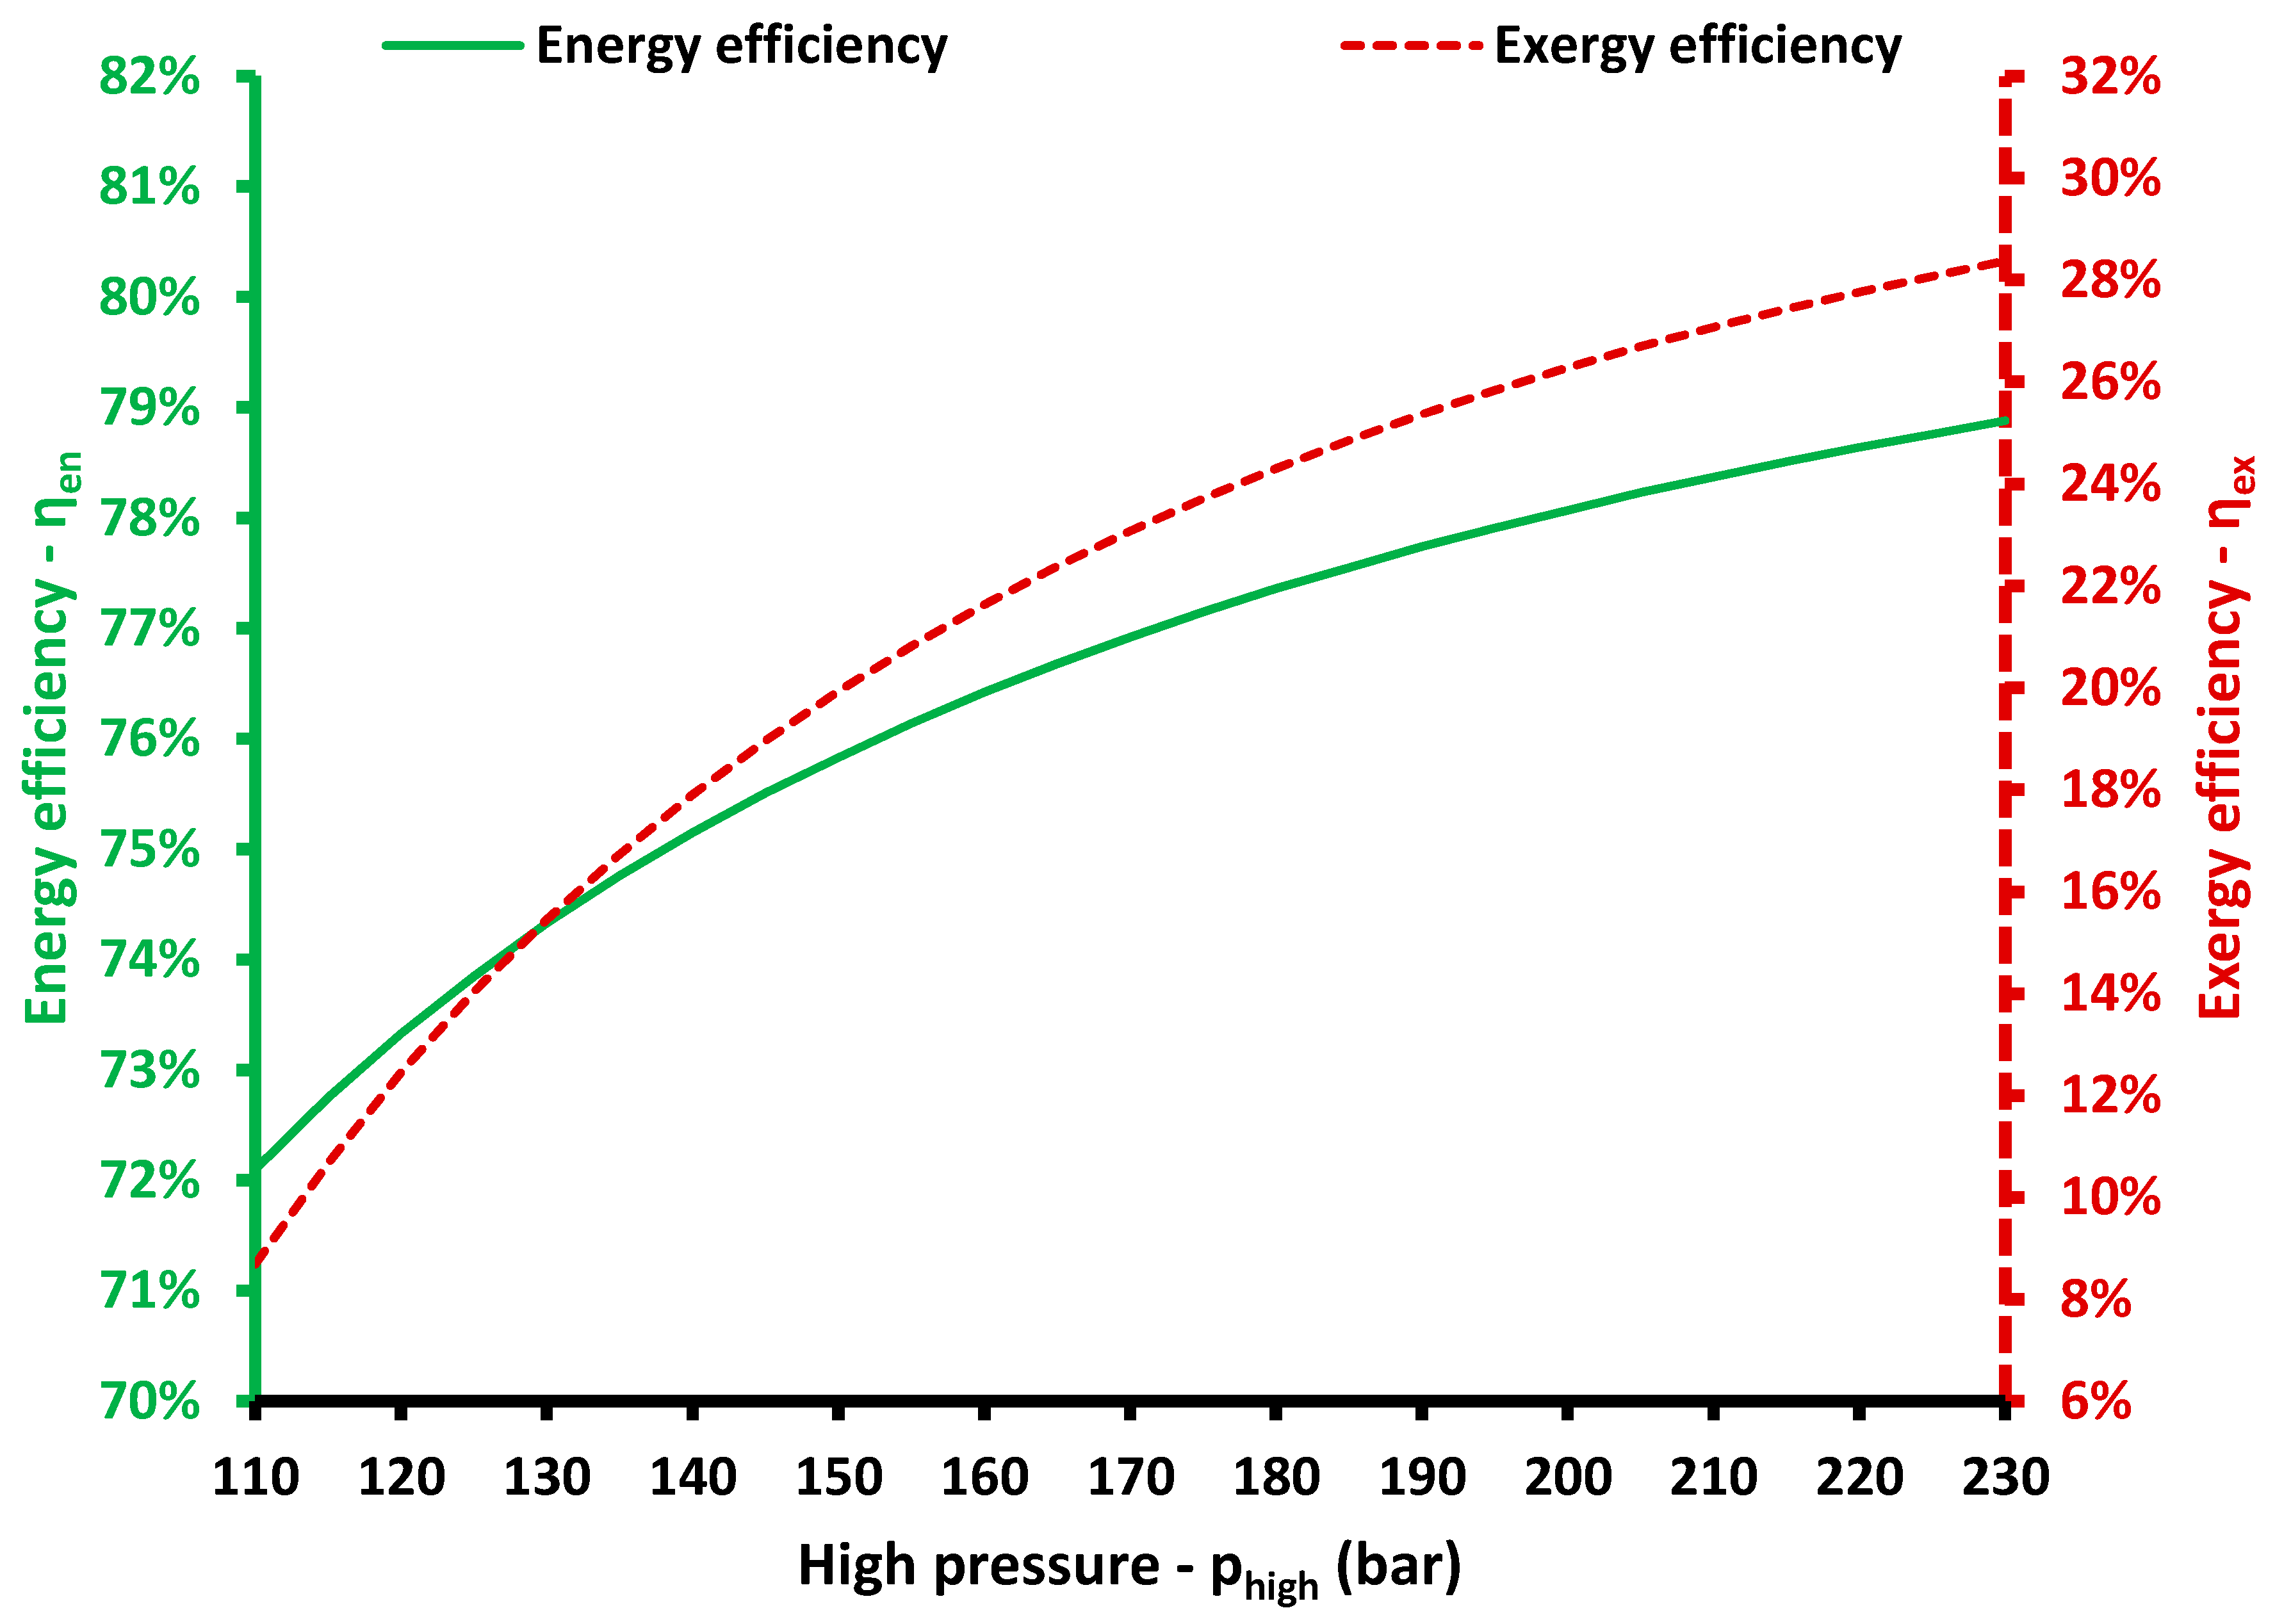
Figure 6 and Figure 7 illustrate the impact of the high-pressure level (or turbine inlet pressure) on the system performance. This is also a critical parameter for the system analysis and it is also used in Brayton cycle studies. Figure 6 shows that an increase in the high-pressure level only increases electricity production and the other useful outputs show a slight decrease. However, the increase in power production is relatively strong enough and both the energy and exergy efficiency show an increasing trend with the high-pressure increase according to Figure 7. The obtained results are reasonable because according to the general thermodynamic theory of the Brayton cycle, higher turbine inlet pressure leads to higher work production.
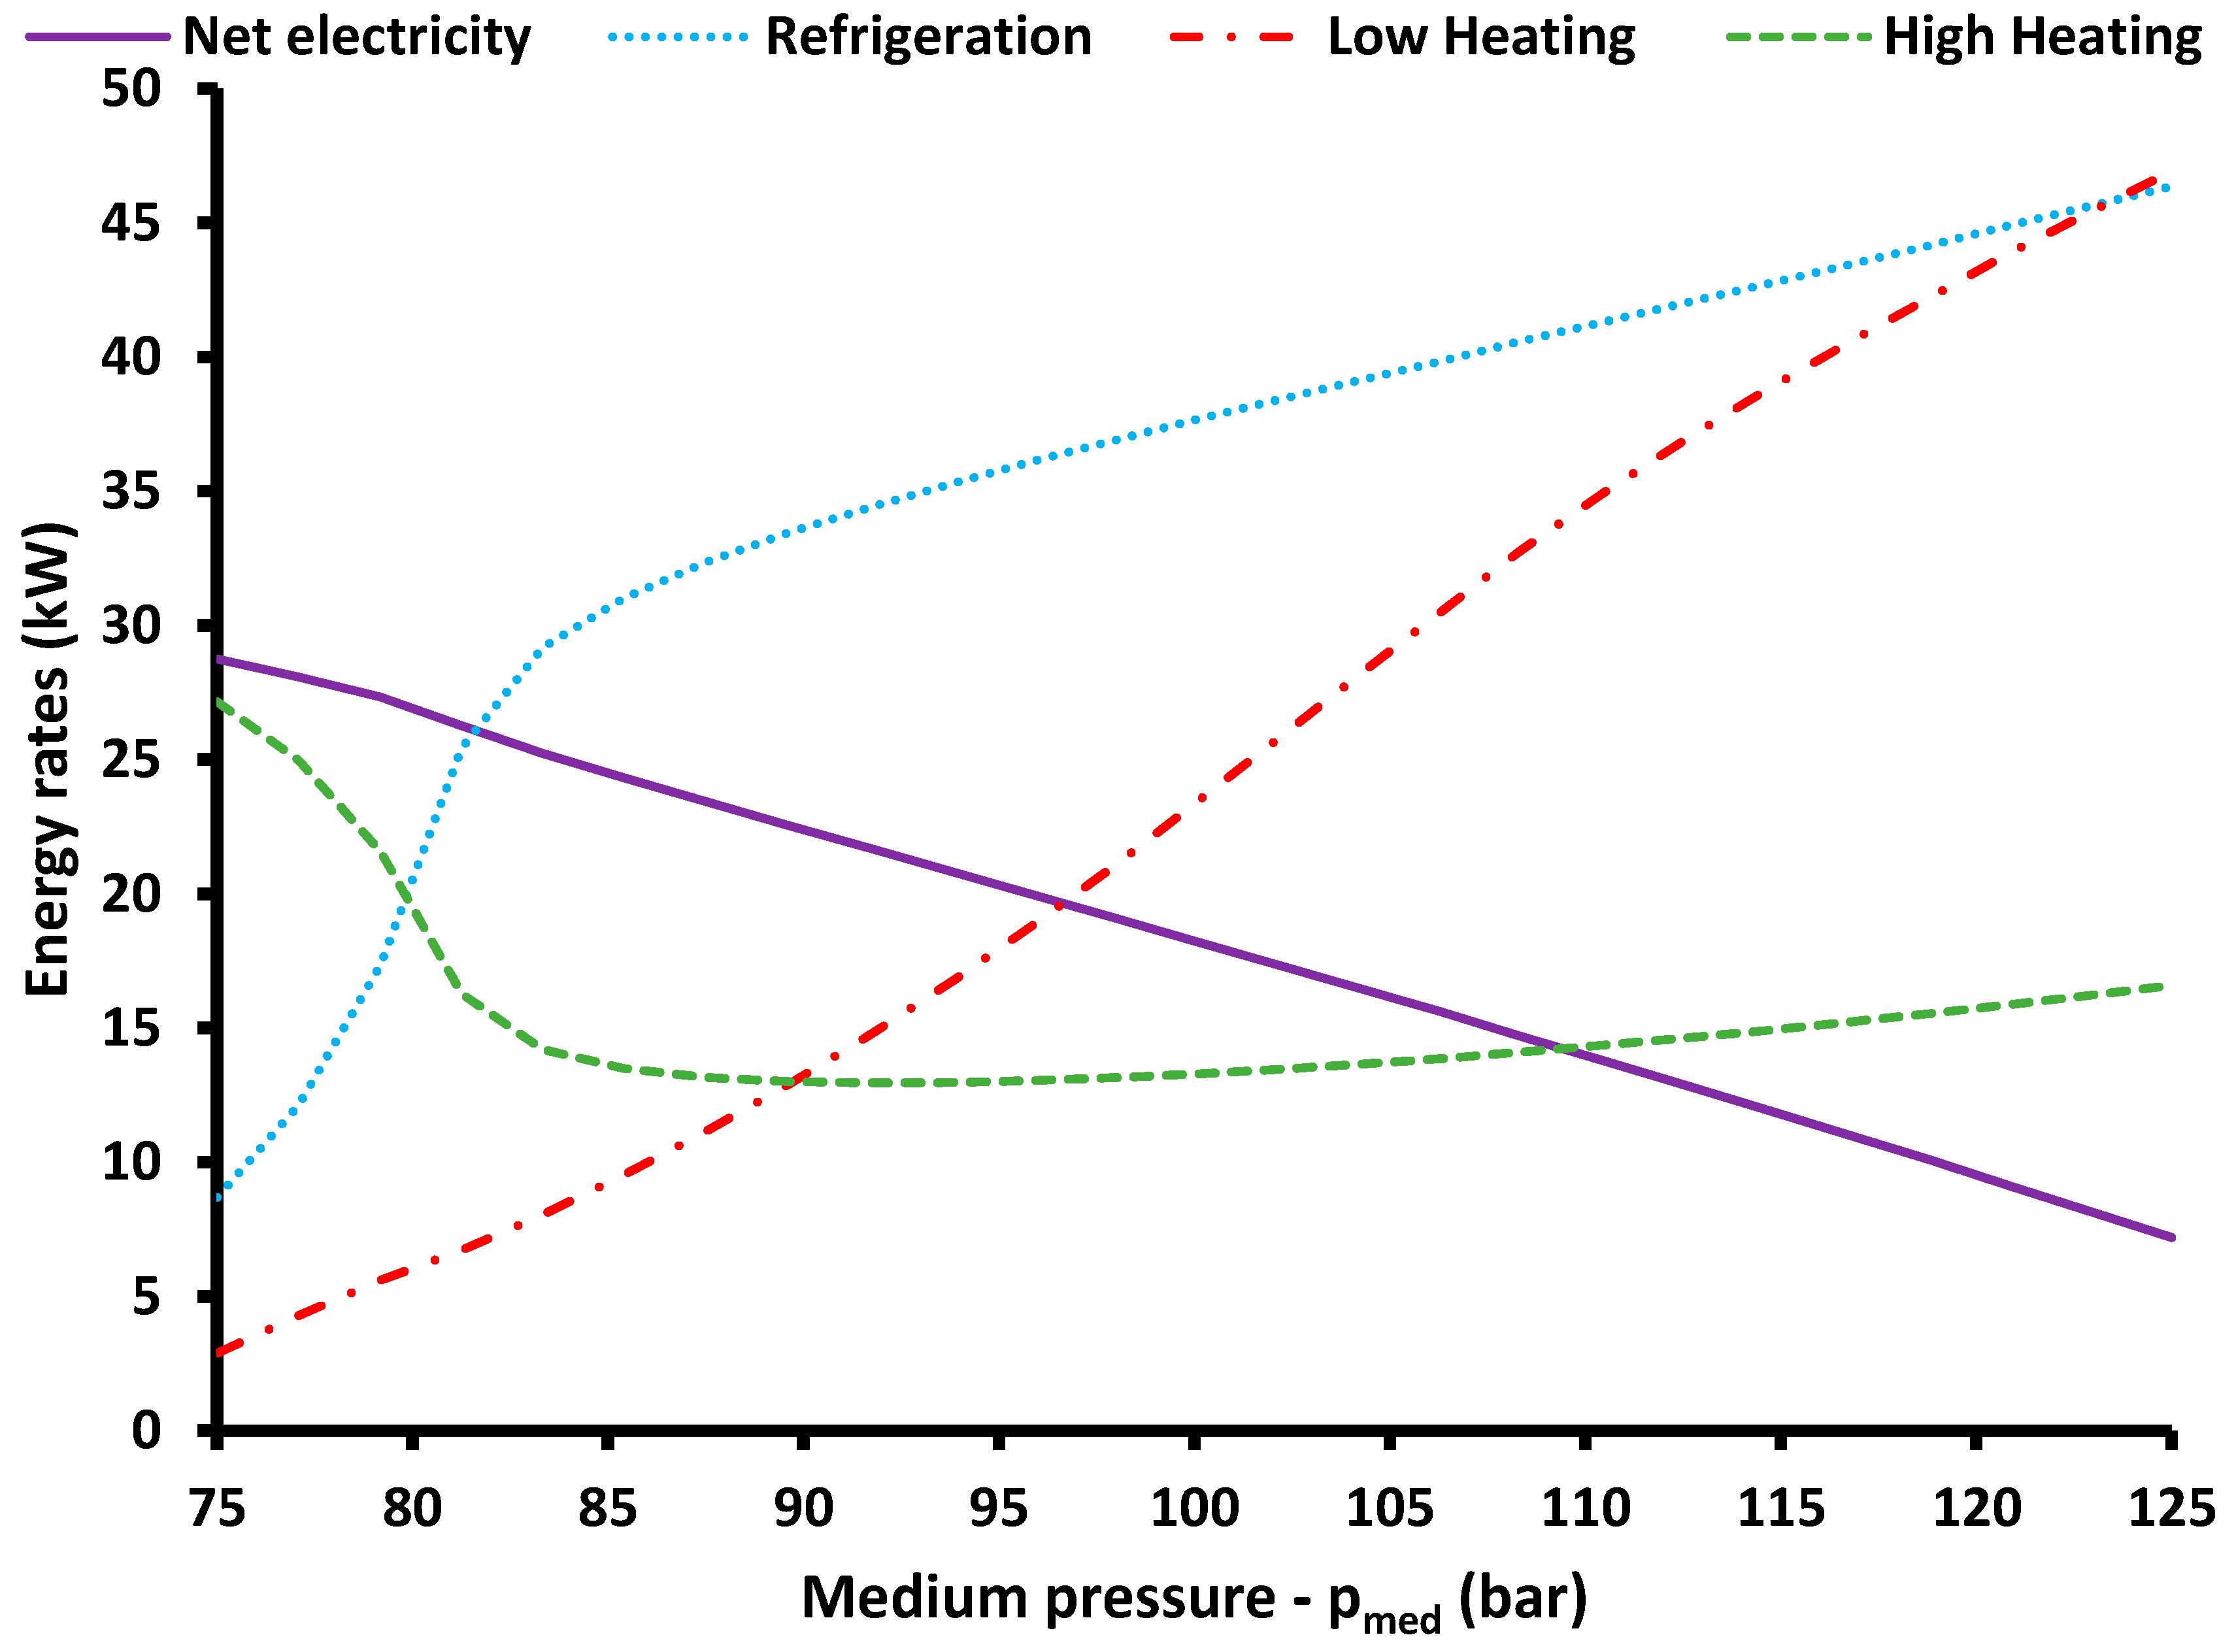
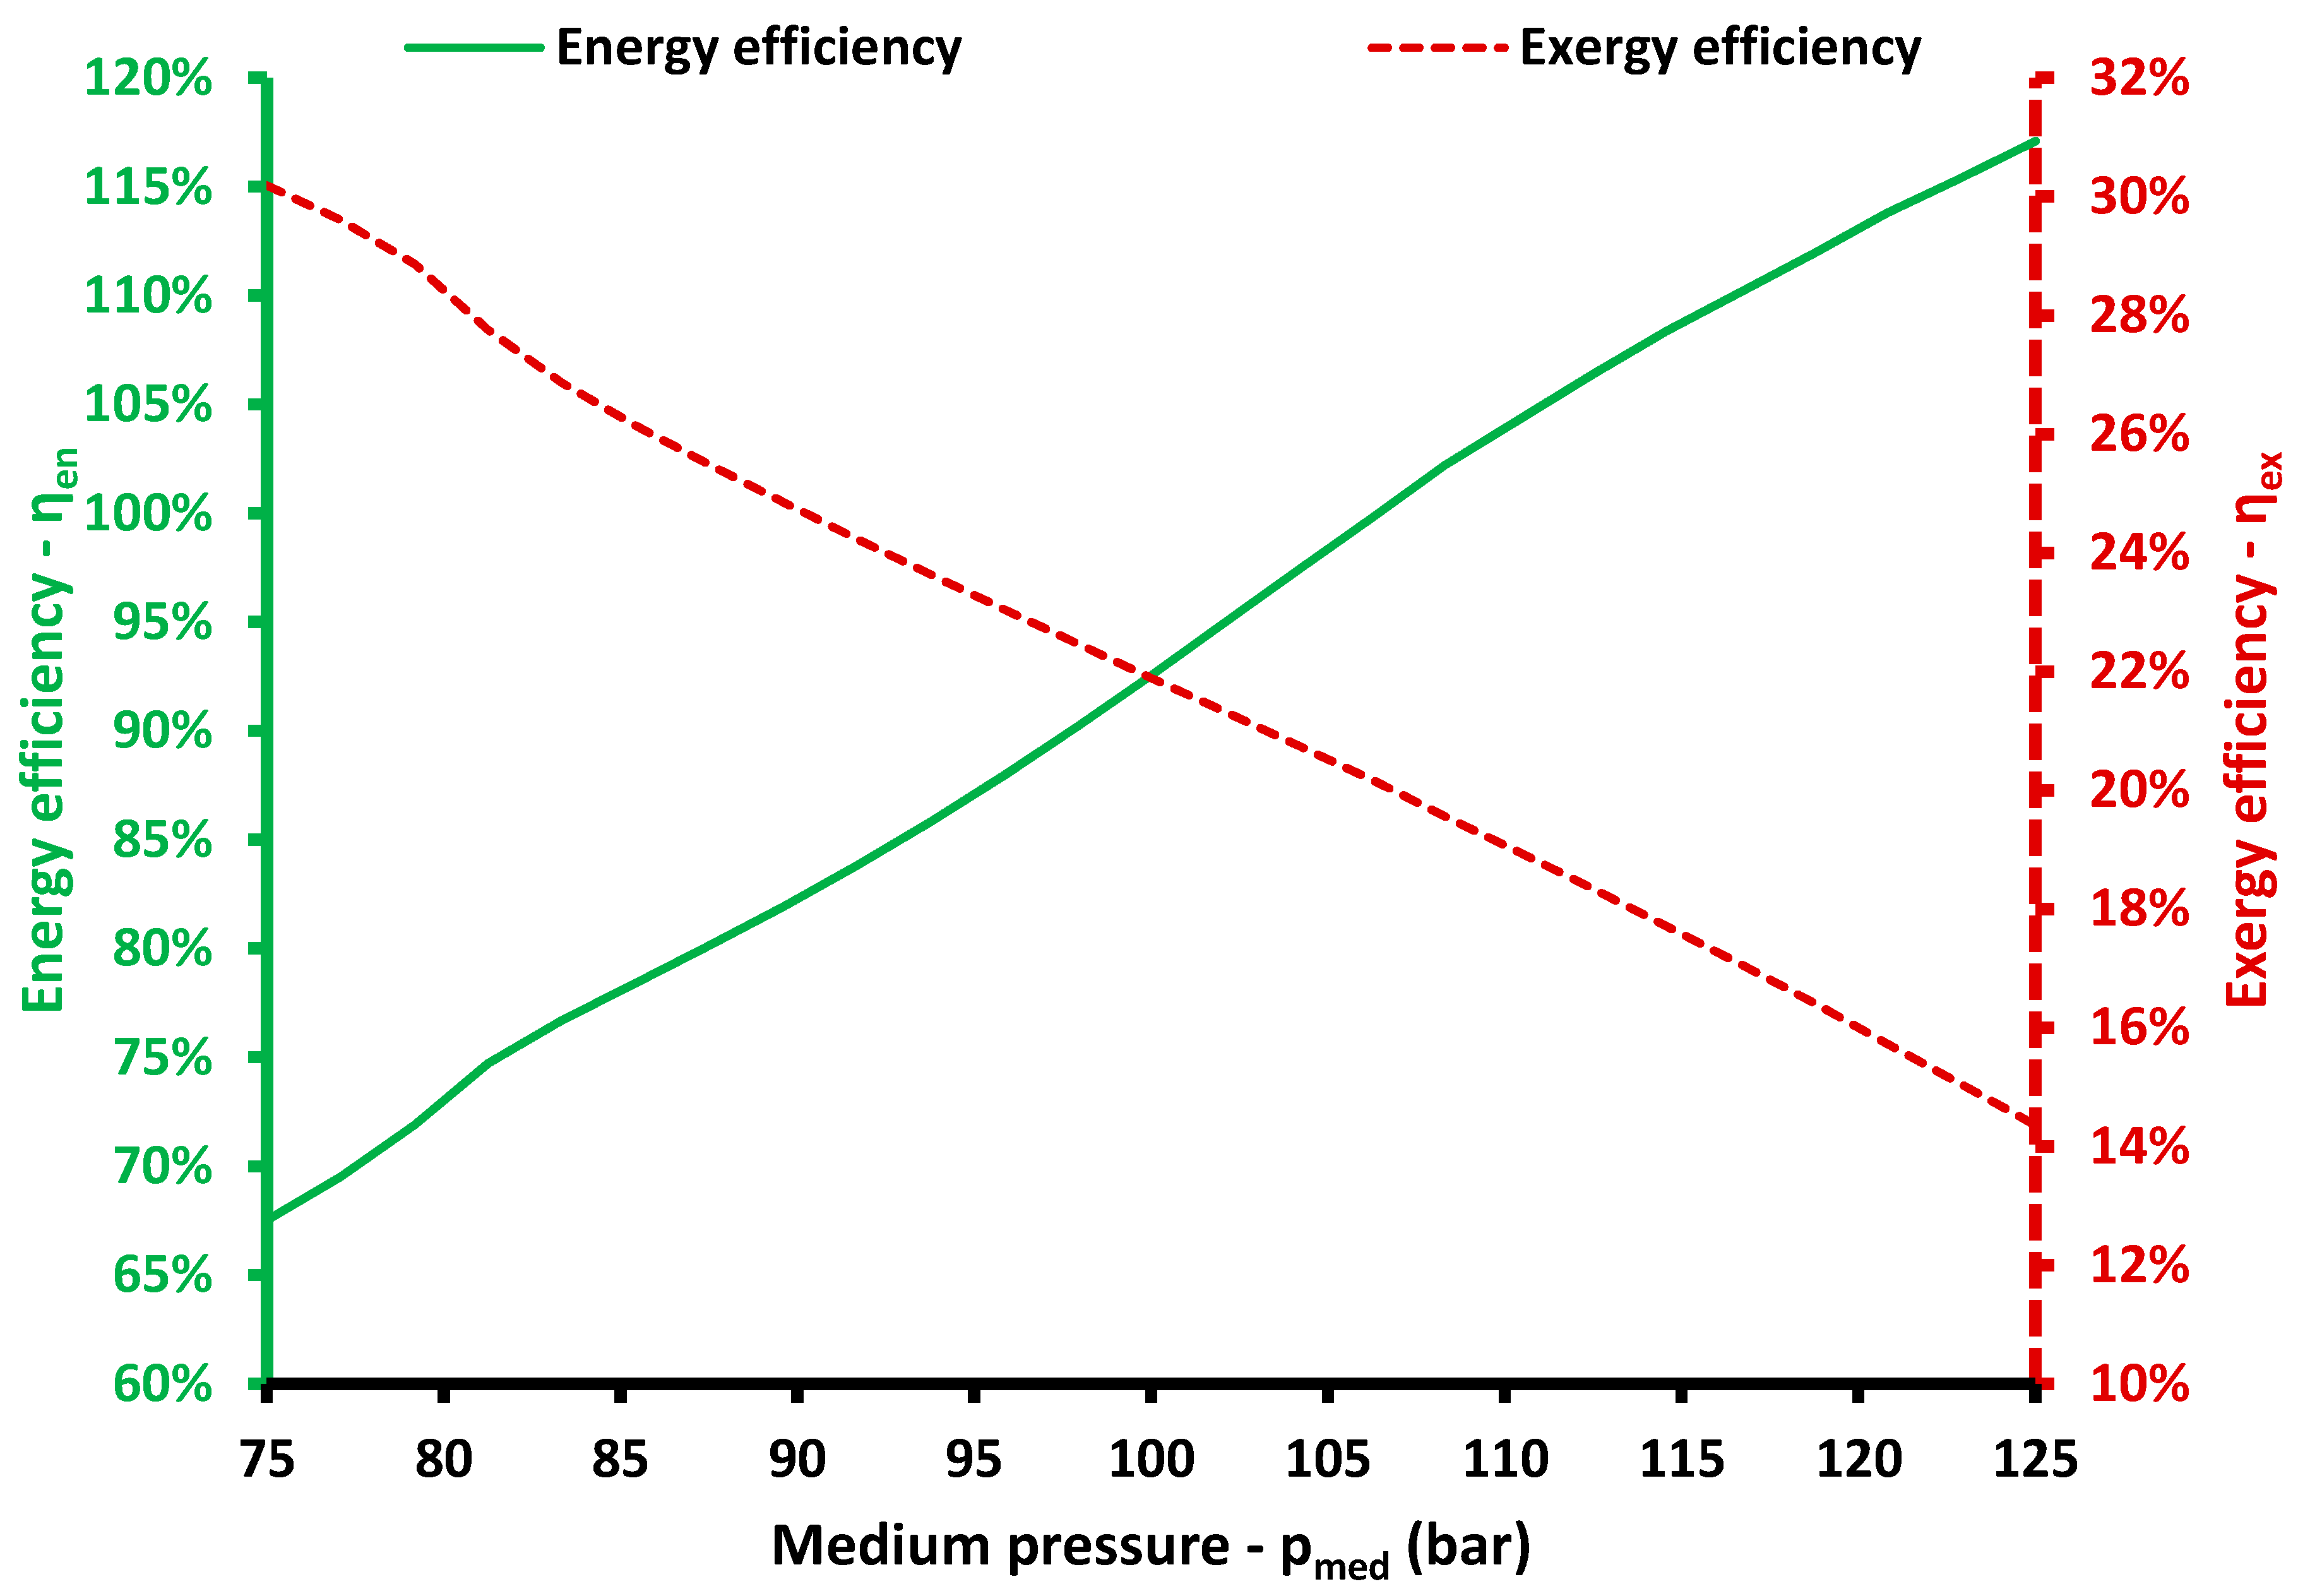
Figure 8 and Figure 9 exhibit the impact of the medium pressure on the results. This pressure level has to be over the CO2 critical pressure, which is 73.8 bar, and so the minimum examined value was 75 bar. Generally, values very close to the critical point were avoided because of stability problems in this area. The increase of medium pressure leads to a higher low-heating temperature level and to lower net electricity production. The refrigeration production increases at a great pace up to 85 bar and after this limit, at a slower pace. The high heating production reduces up to 81 bar at a great pace, and then at a slower pace, it was minimized approximately at 95 bar and after this limit, it presents a rough increase. The above-described behavior of the Figure 8 curves can be explained by the great deviation of the CO2 thermal properties with its pressure, in the cases with pressure levels close to the critical point (75–85 bar). Figure 9 indicates that the increase of the medium pressure leads to higher energy efficiency but to lower exergy efficiency. So, there is no global optimum value for this parameter and an intermediate value is maybe the optimum one. Moreover, different values of this parameter can be selected in order to adjust the useful output values (or fraction) according to the energy rate demands in every application.
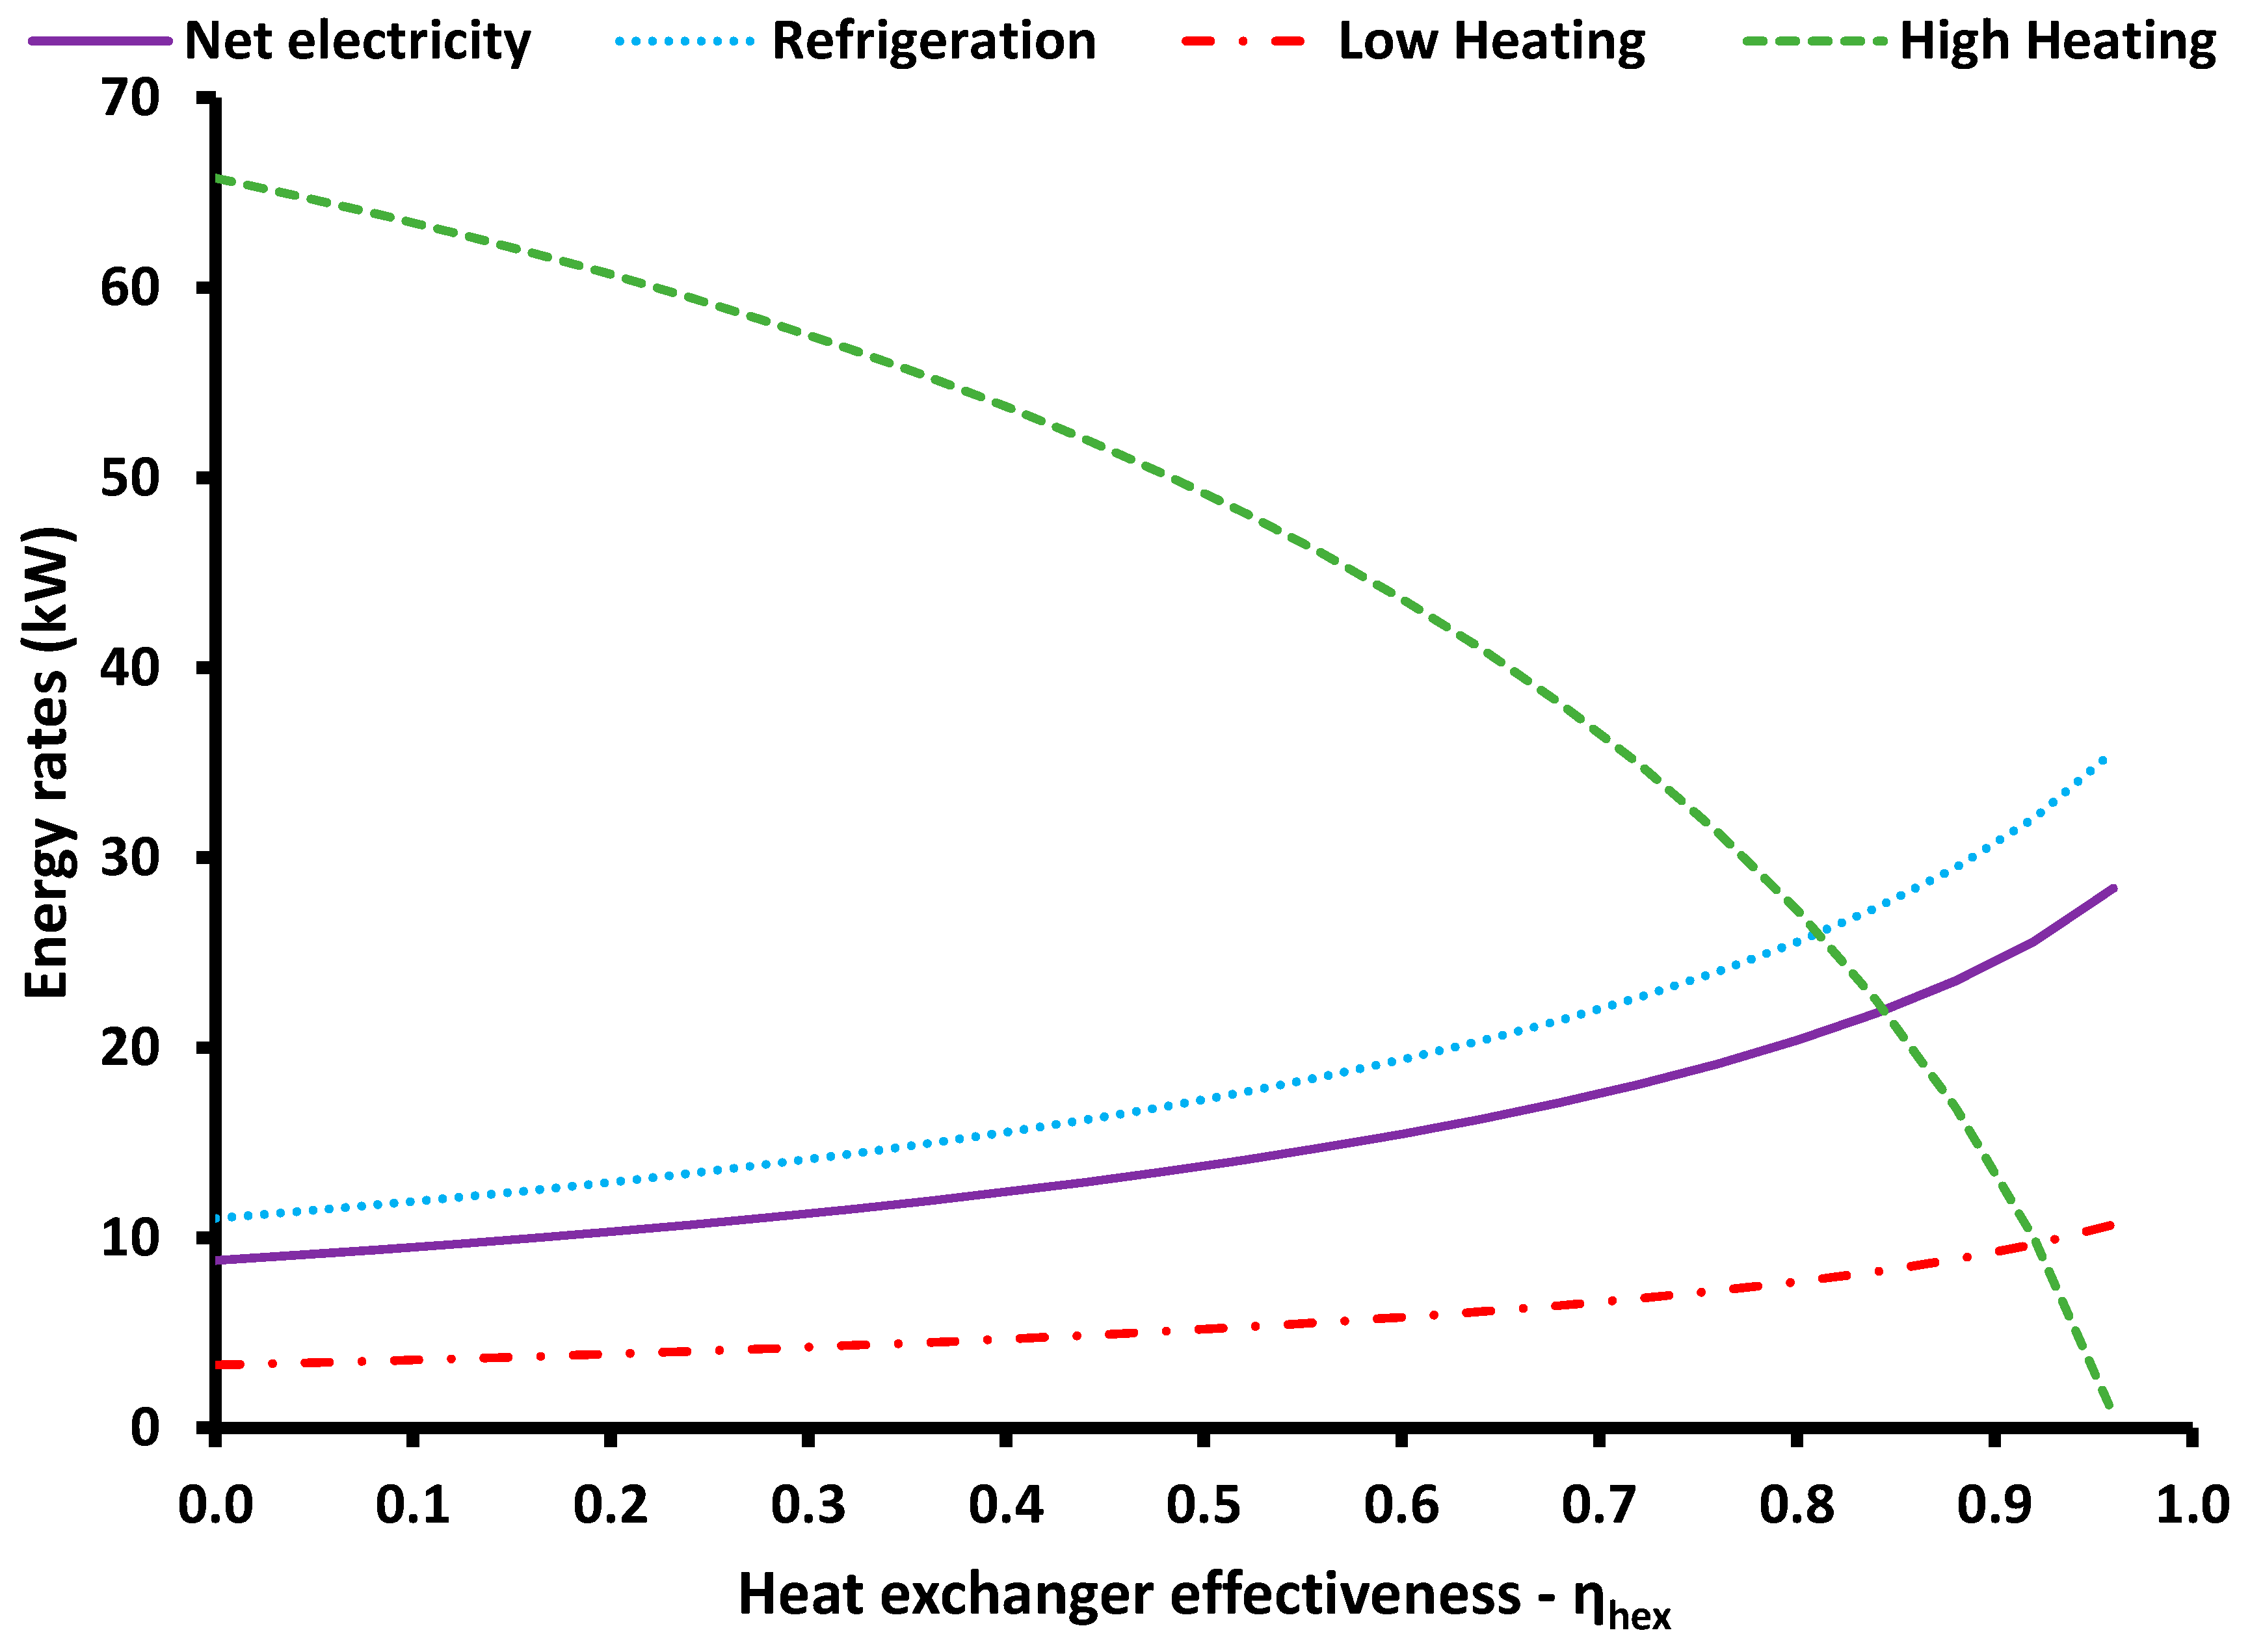
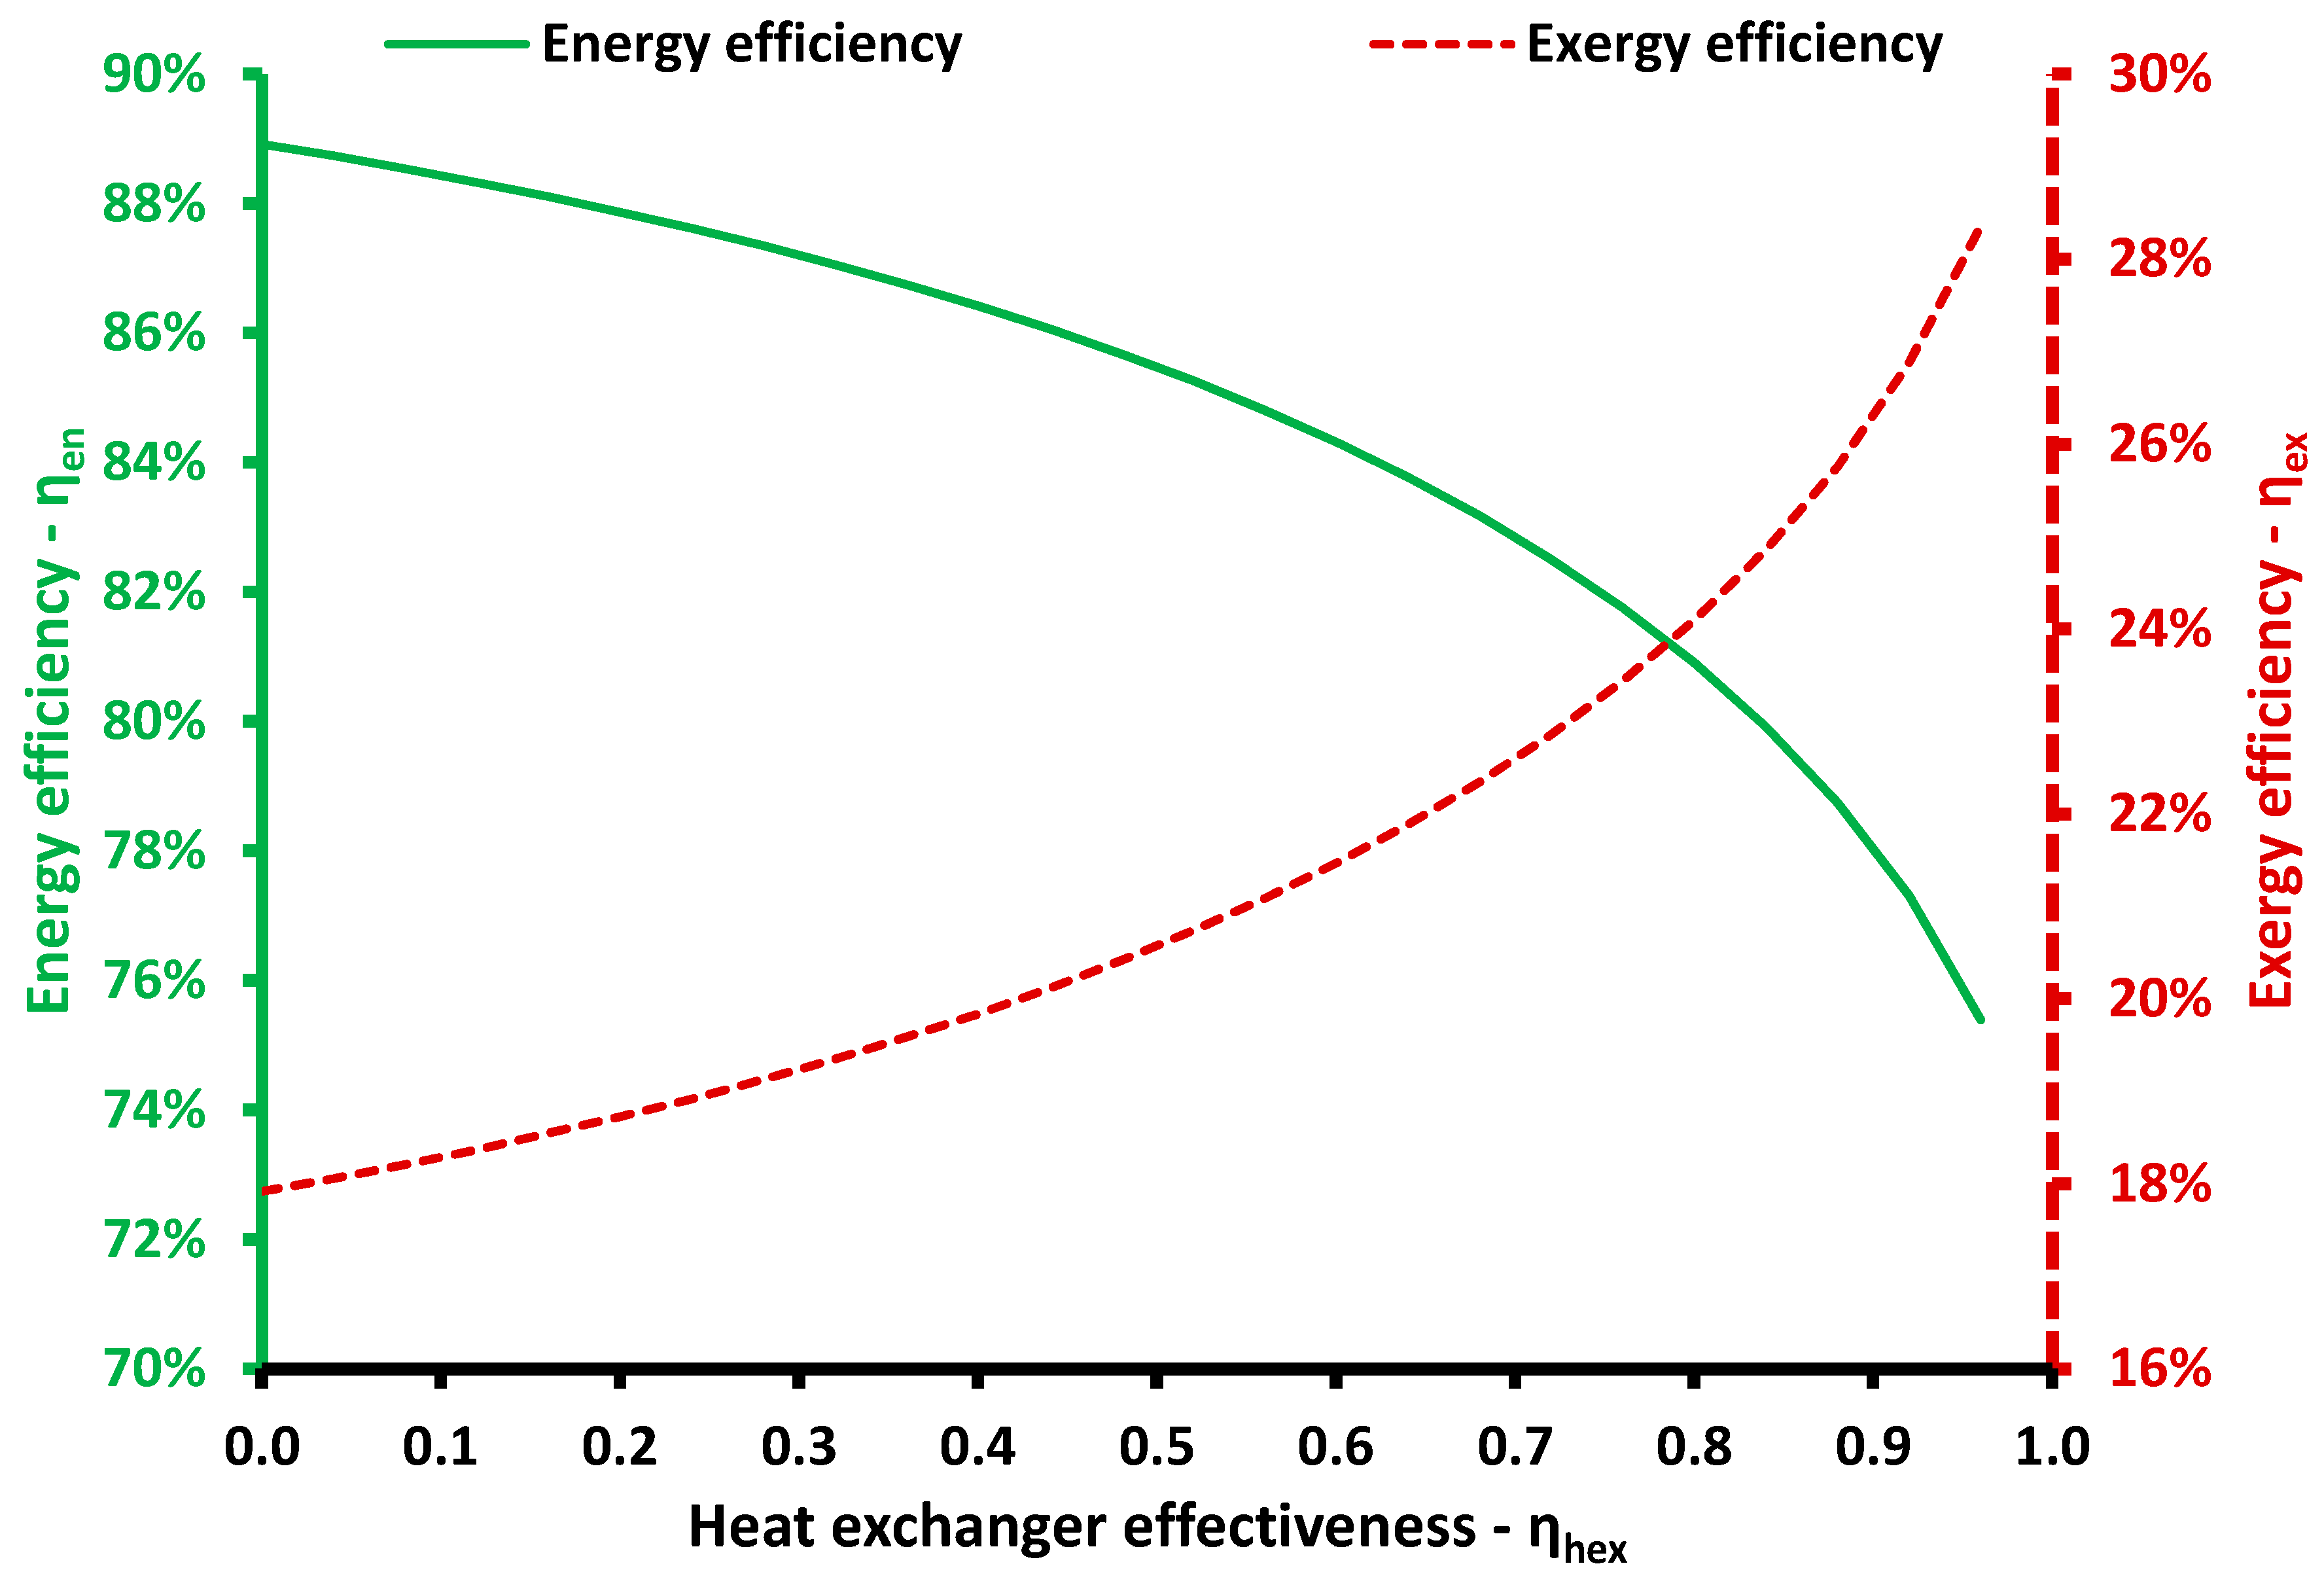
Figure 10 and Figure 11 illustrate the system behavior with the increase of the heat exchanger effectiveness. According to Figure 10, this parameter leads to higher electricity, refrigeration and low heating production but to lower high heating production. Practically, the higher effectiveness of the heat exchanger gives a lower margin for high heating production after the heat exchanger, and thus, this parameter has different behavior than the other parameters. Figure 11 shows that the exergy efficiency is enhanced by the improvement of the heat exchanger effectiveness but the energy efficiency is reduced with the increase of the effectiveness value.
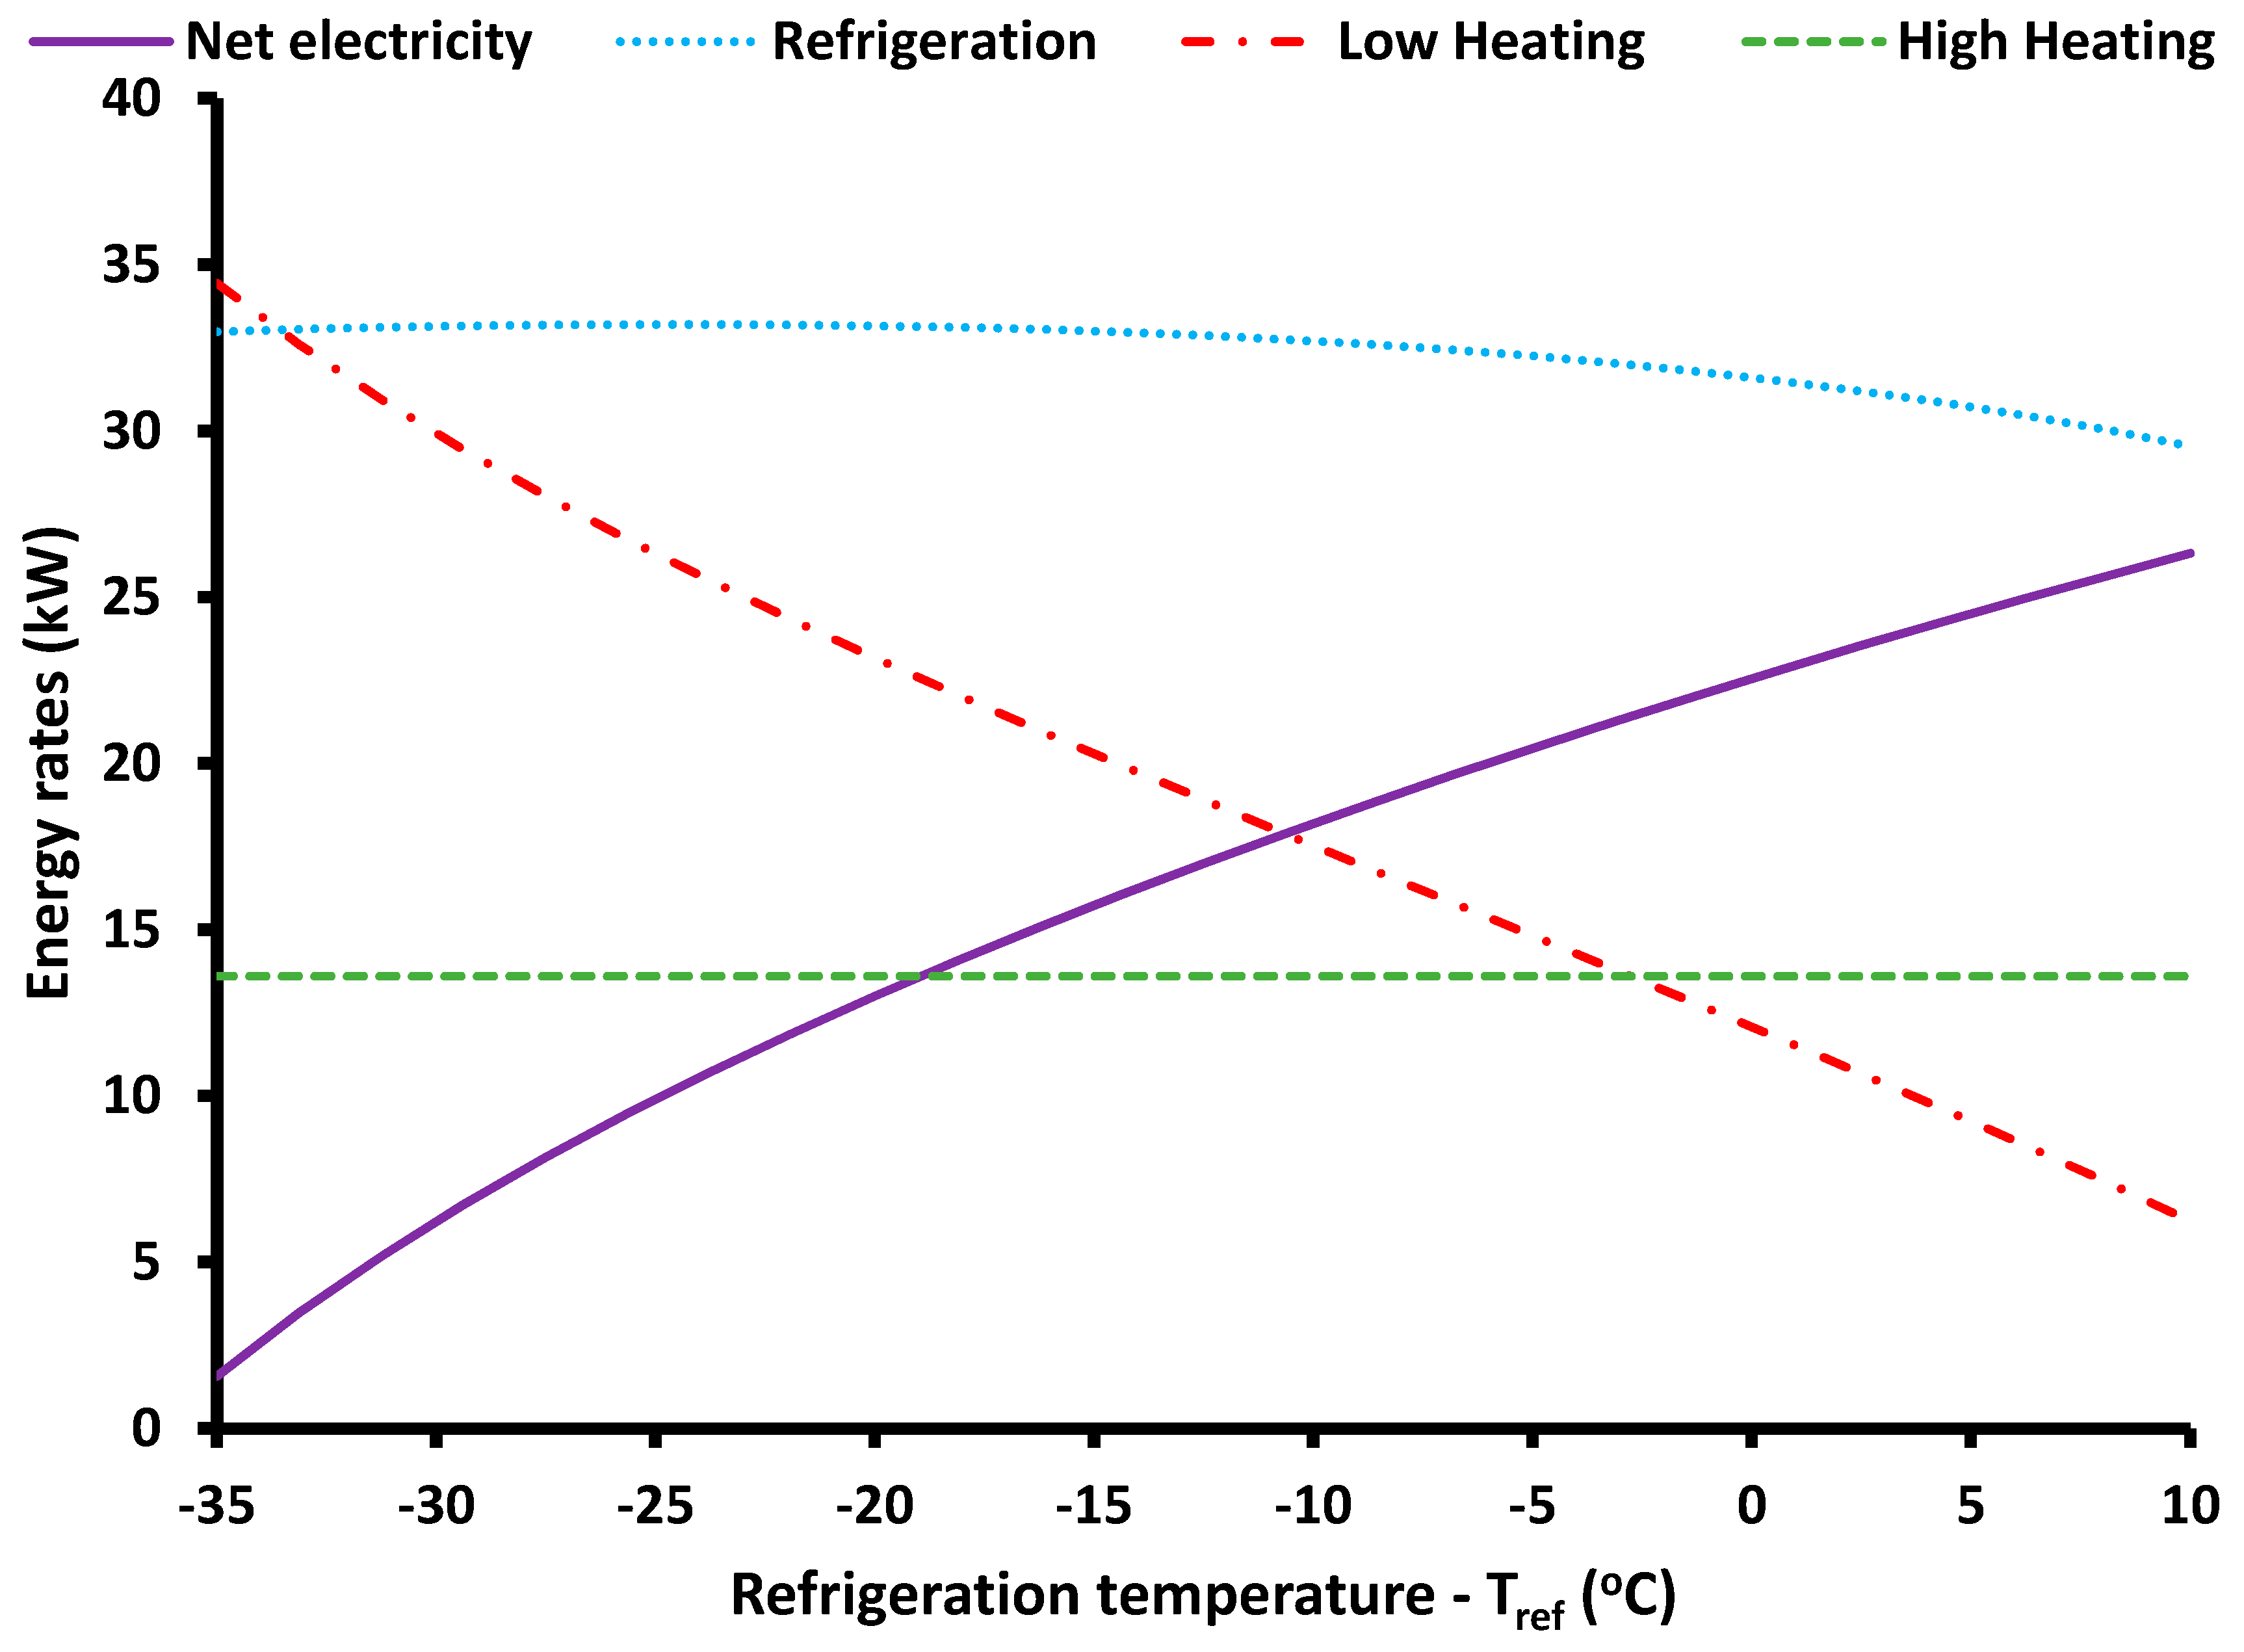
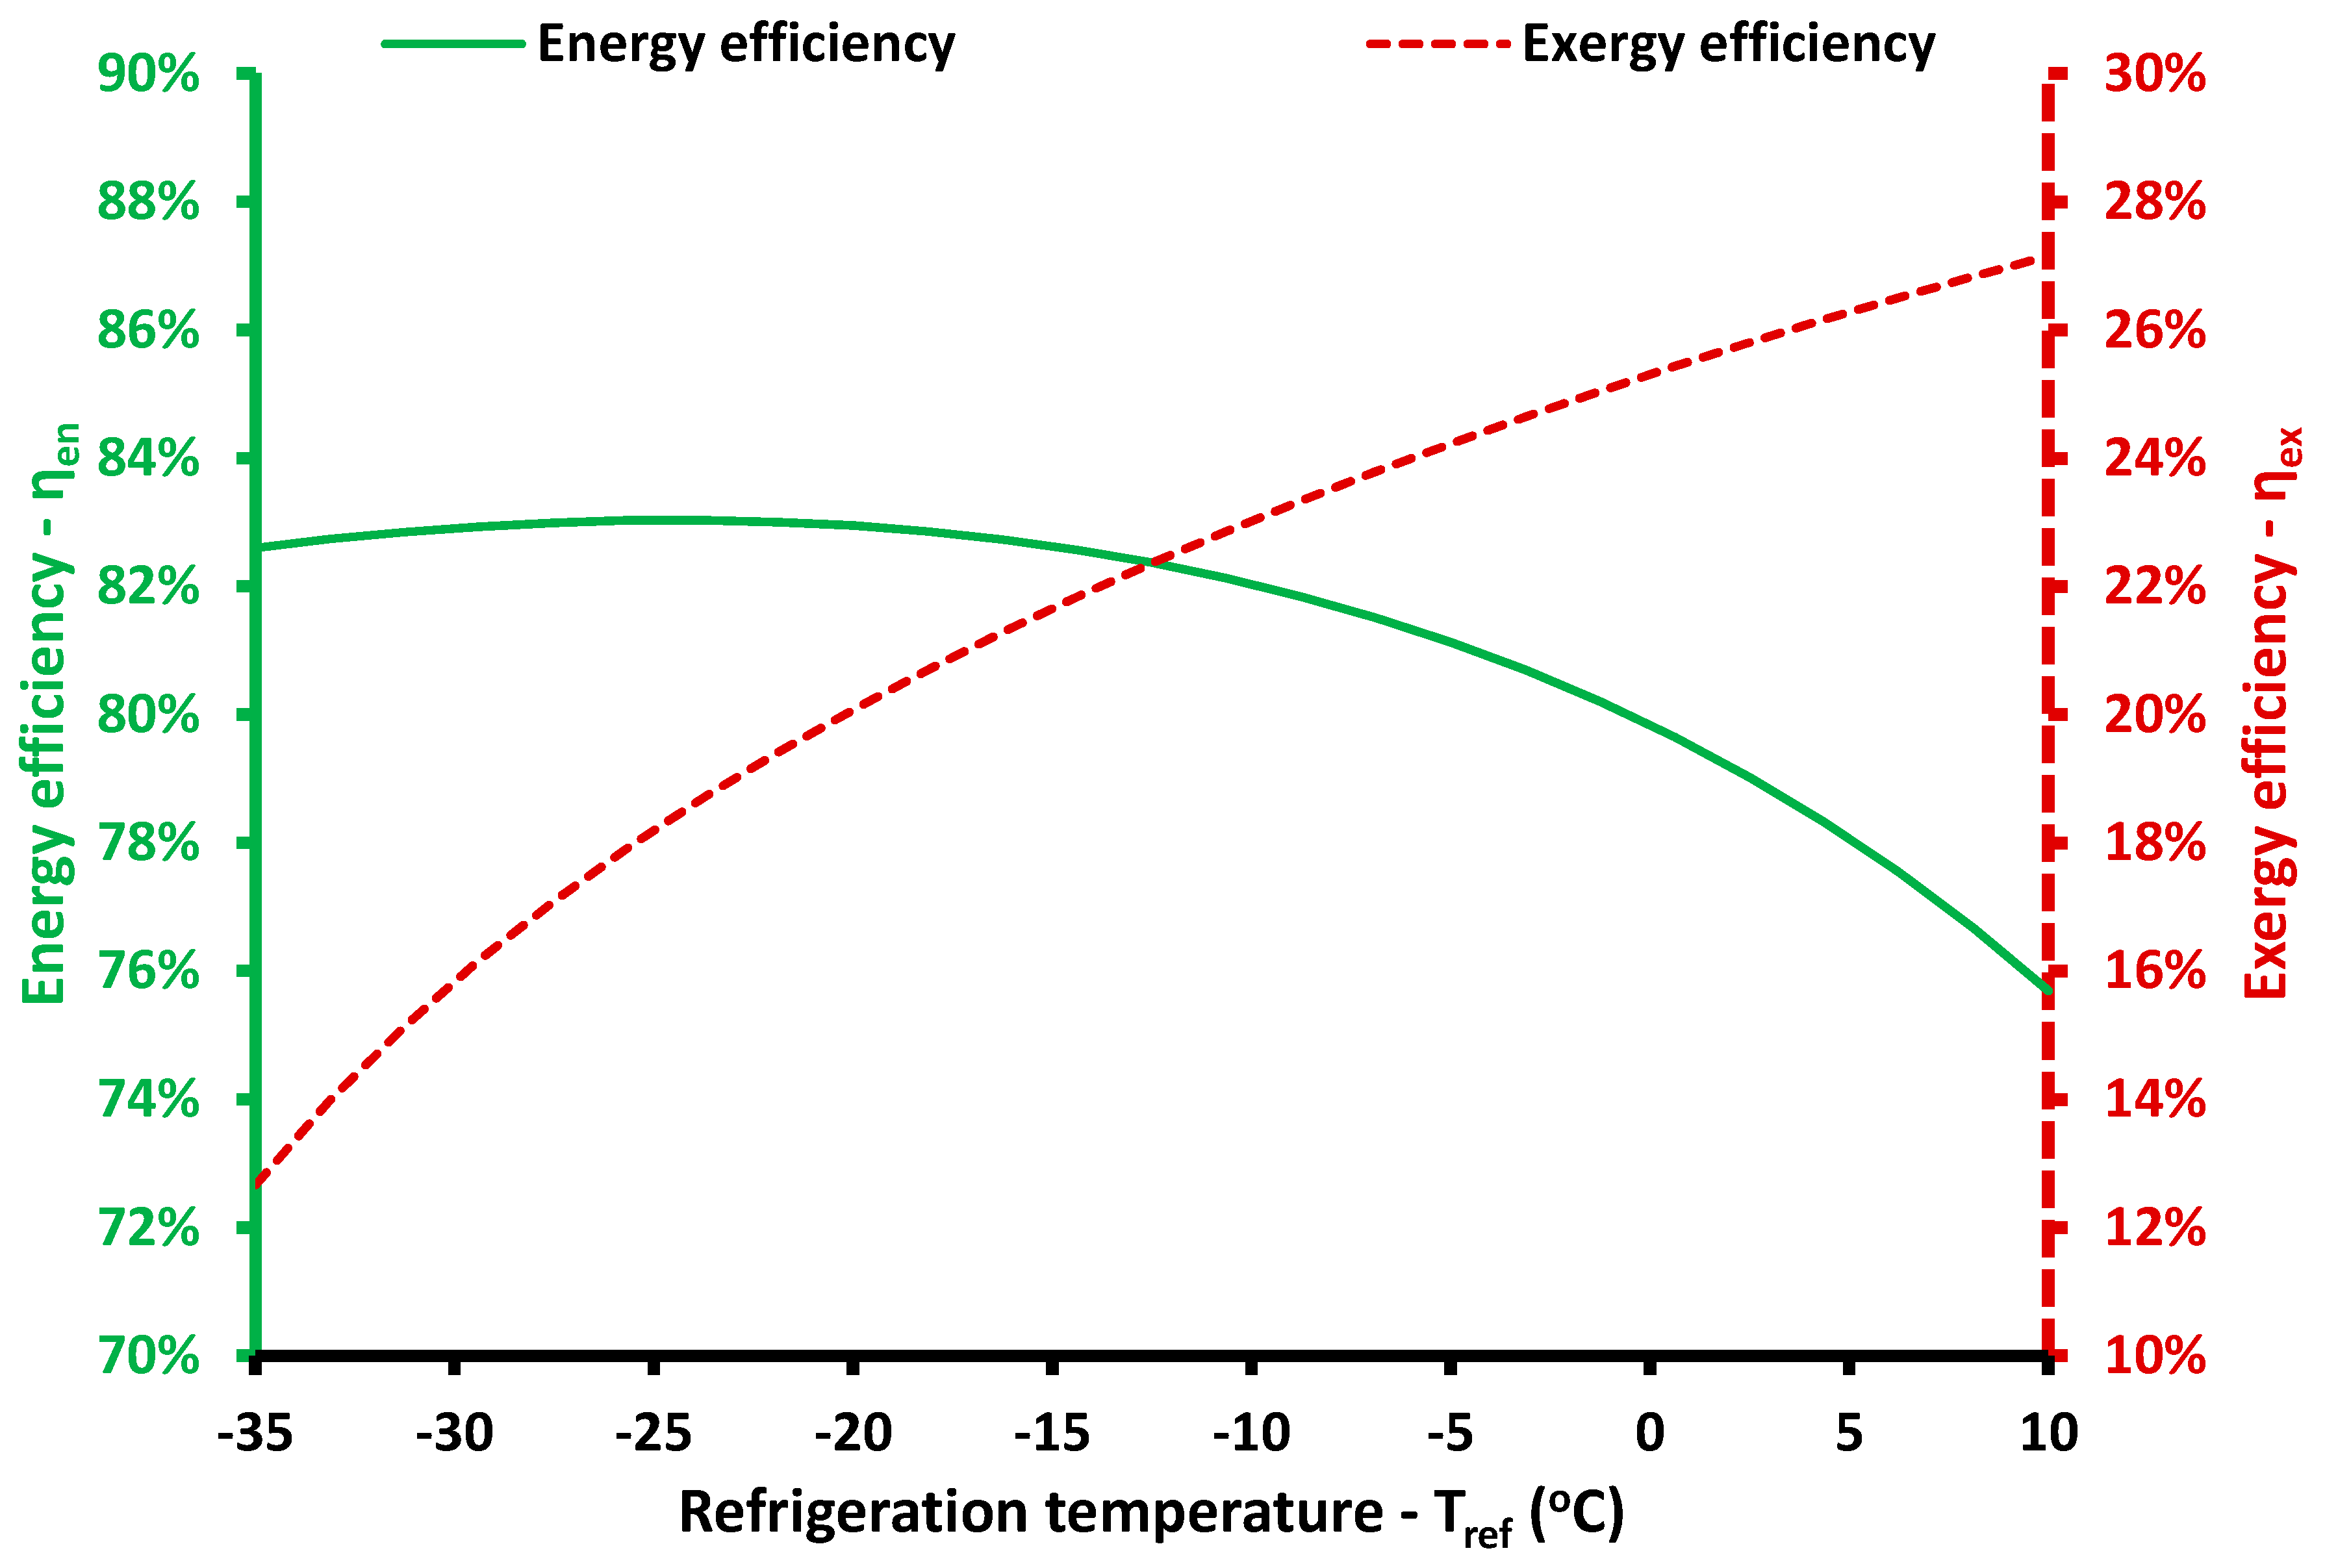
Figure 12 and Figure 13 give the system performance for different refrigeration temperature levels. Figure 12 shows that refrigeration production is not so affected by the refrigeration temperature, as well as the high heating production. On the other hand, it is obvious that a higher refrigeration temperature leads to a significant increase in electricity production and an important decrease in low heating production. Figure 13 indicates that a higher refrigeration temperature increases the system exergy efficiency, while the energy efficiency is maximized for refrigeration production at around −25 °C. Generally, the energy efficiency is not so variable in the range between −35 °C and −15 °C, while for higher refrigeration temperatures it shows a significant decrease. At this point, it is important to note that CO2 operation in temperatures as low as −35 °C is not a difficult task because CO2 is used in supermarket refrigeration applications where temperature levels of around −35 °C are usually applied.
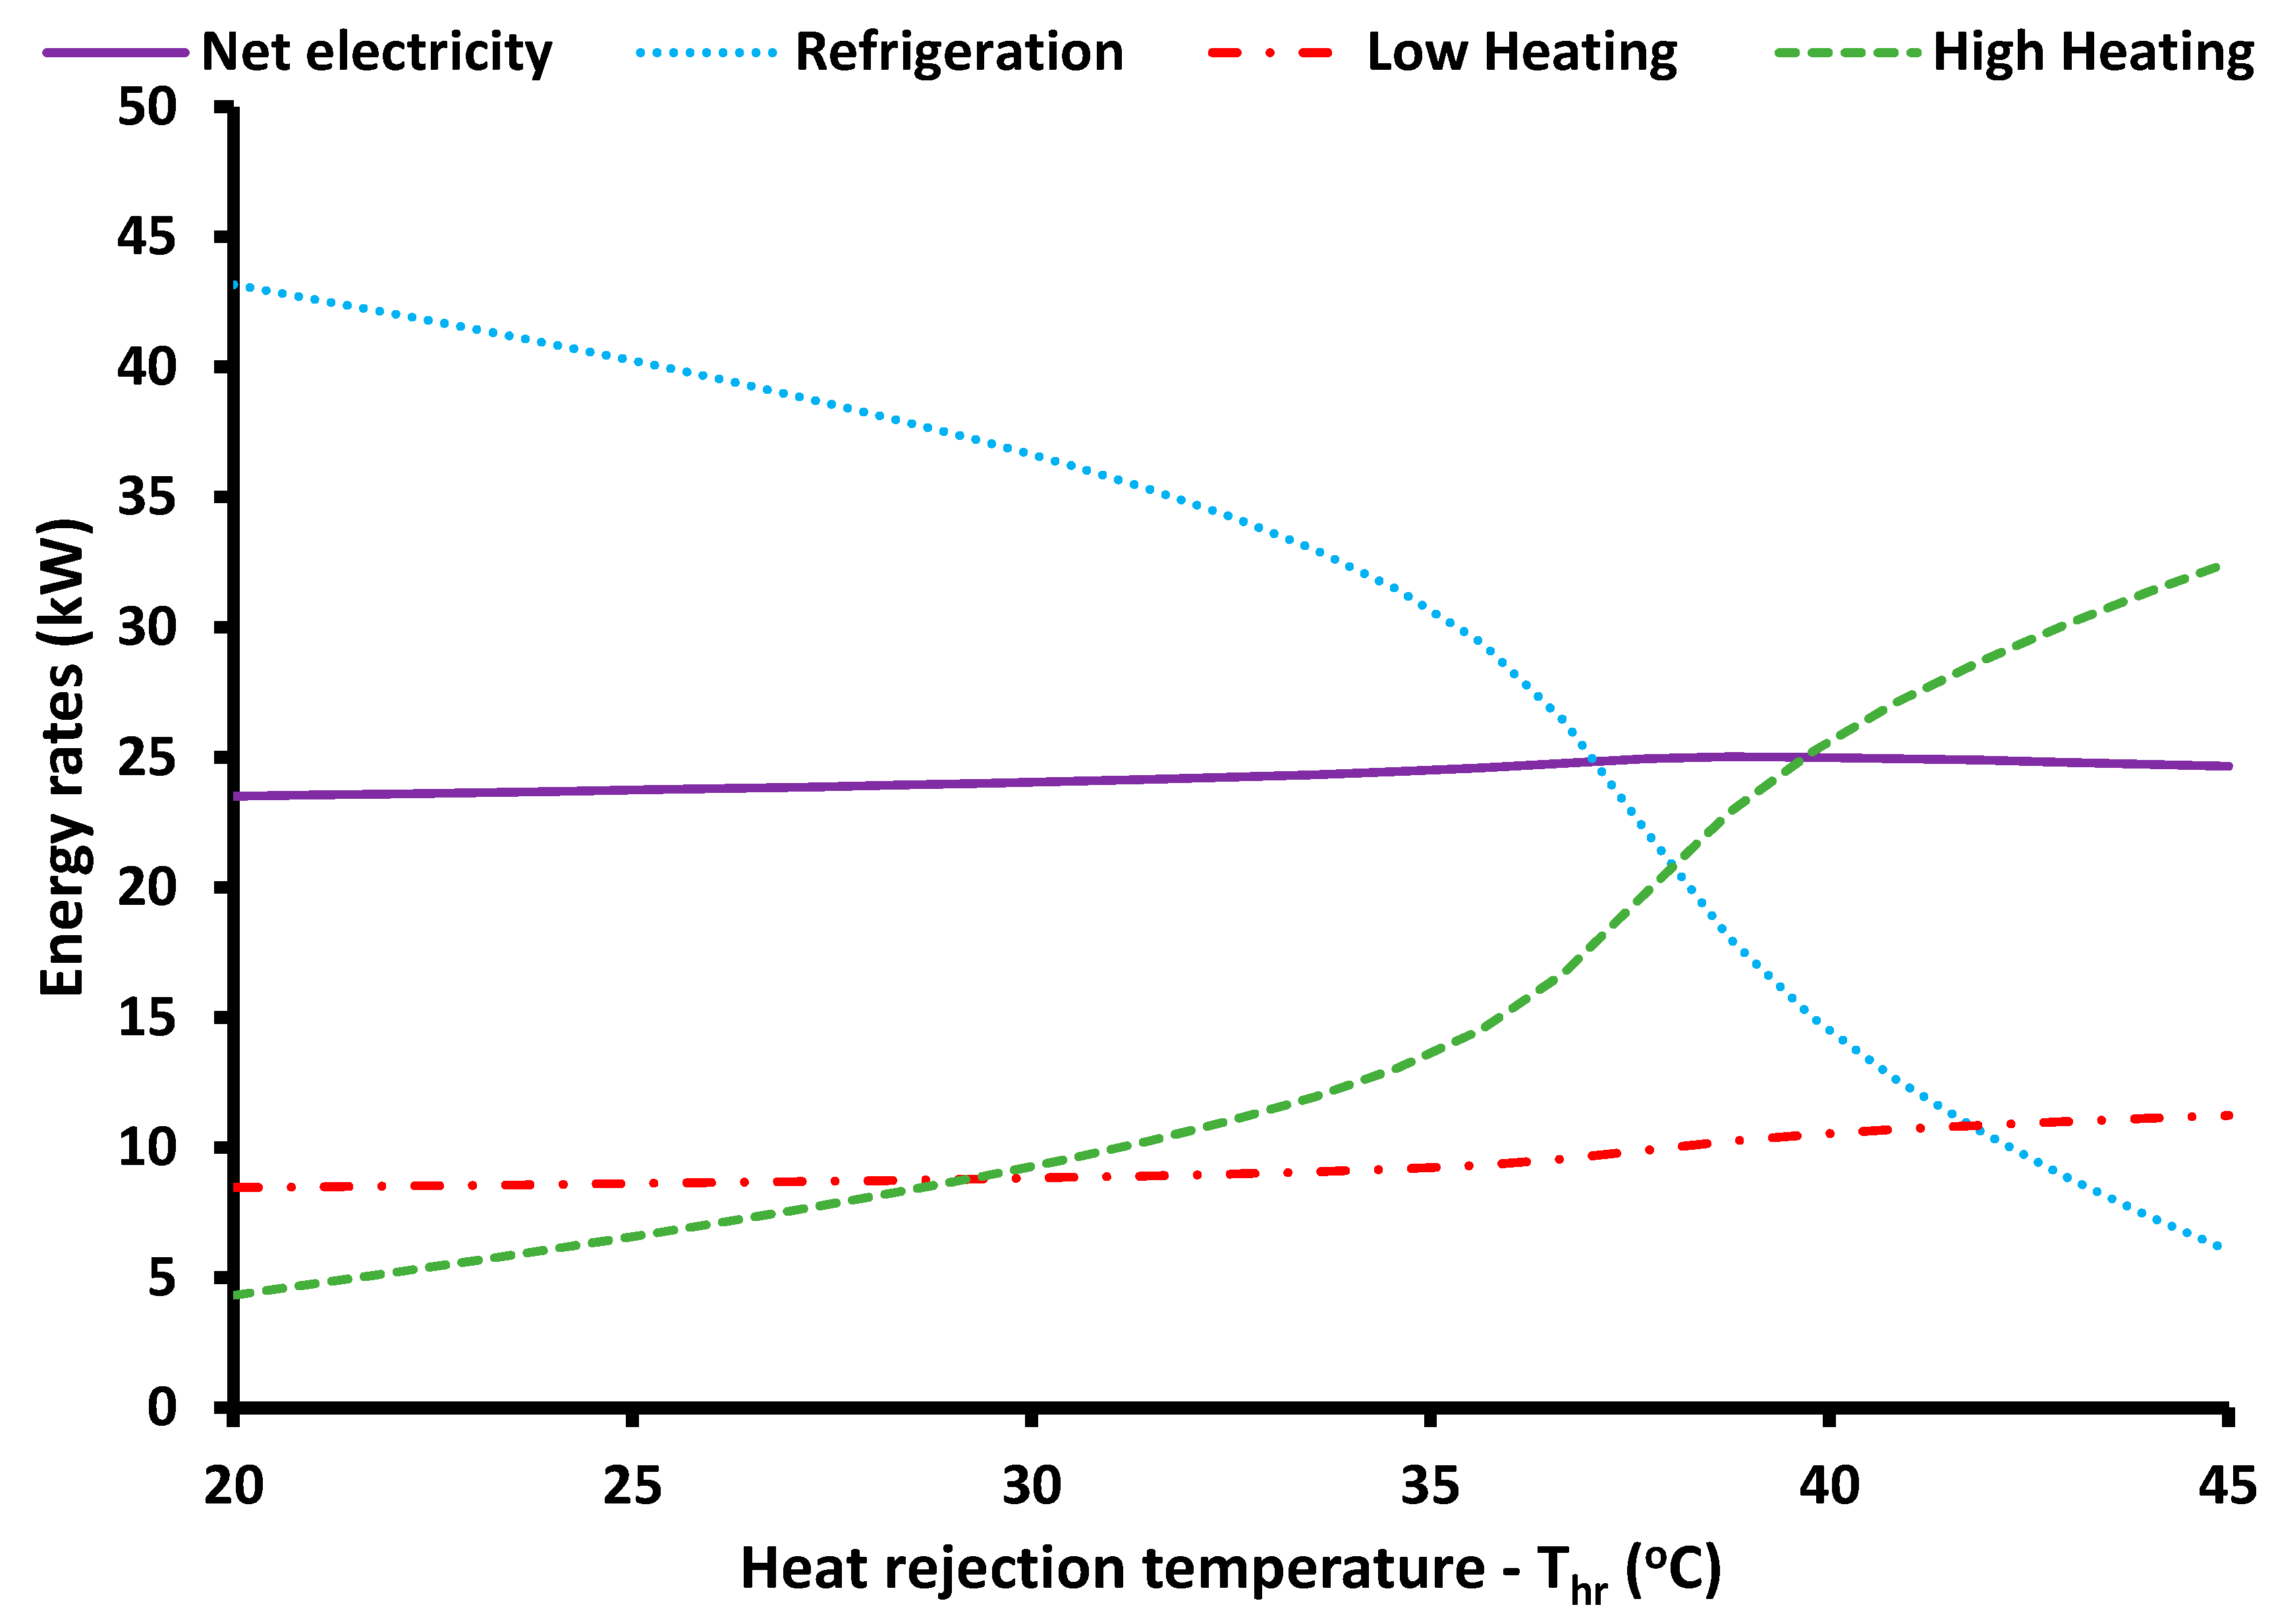
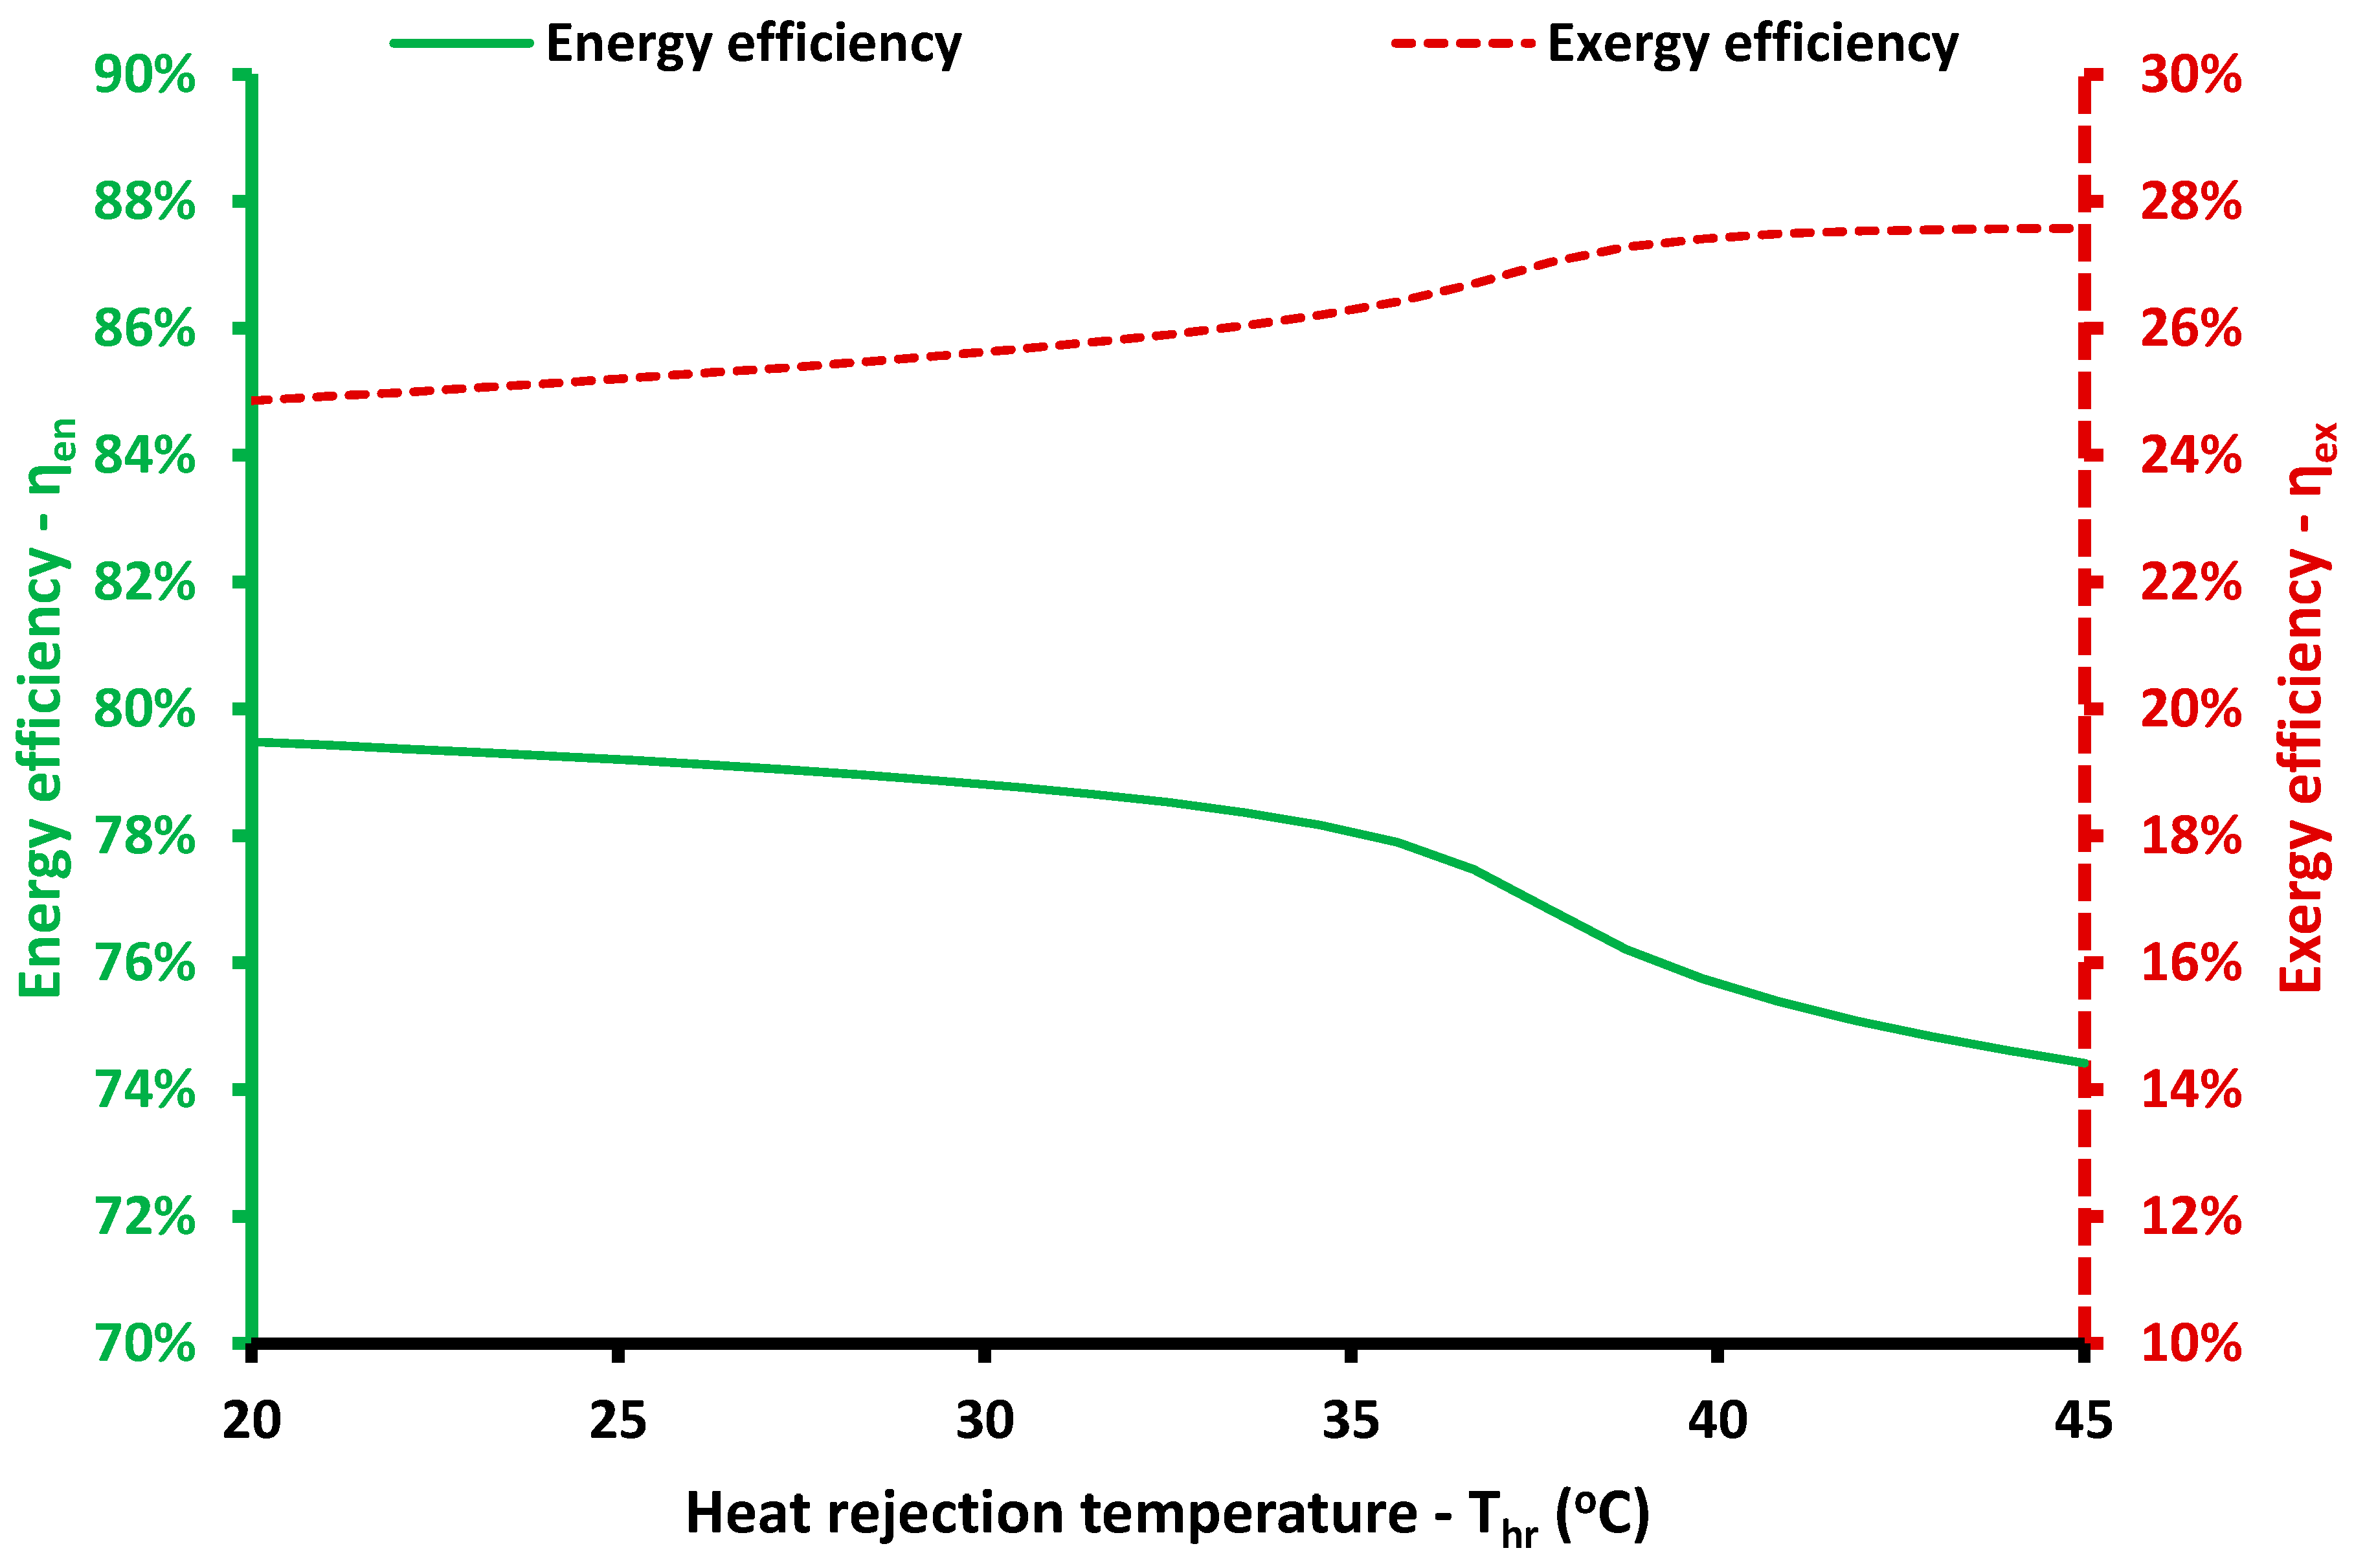
Figure 14 and Figure 15 show the system behavior with different heat rejection temperature levels. Practically, this parameter is the temperature level in the outlet of the gas cooler and it has to be 3 to 5 °C more than the ambient temperature. In this work, it was studied from 20 °C to 45 °C and in all cases, the medium pressure was more than the critical pressure. Figure 14 shows that the electricity and the low heating production increase sightly with the heat rejection increase. On the other hand, the high heating and the refrigeration show more intense behavior with the first increasing and the other reducing with the heat rejection temperature augmentation. The behavior of these curves is a bit strange after 35 °C because of the variation in the CO2 properties in this region (close to the critical point). Figure 15 shows that higher heat rejection temperatures lead to higher exergy efficiency and to lower energy efficiency.
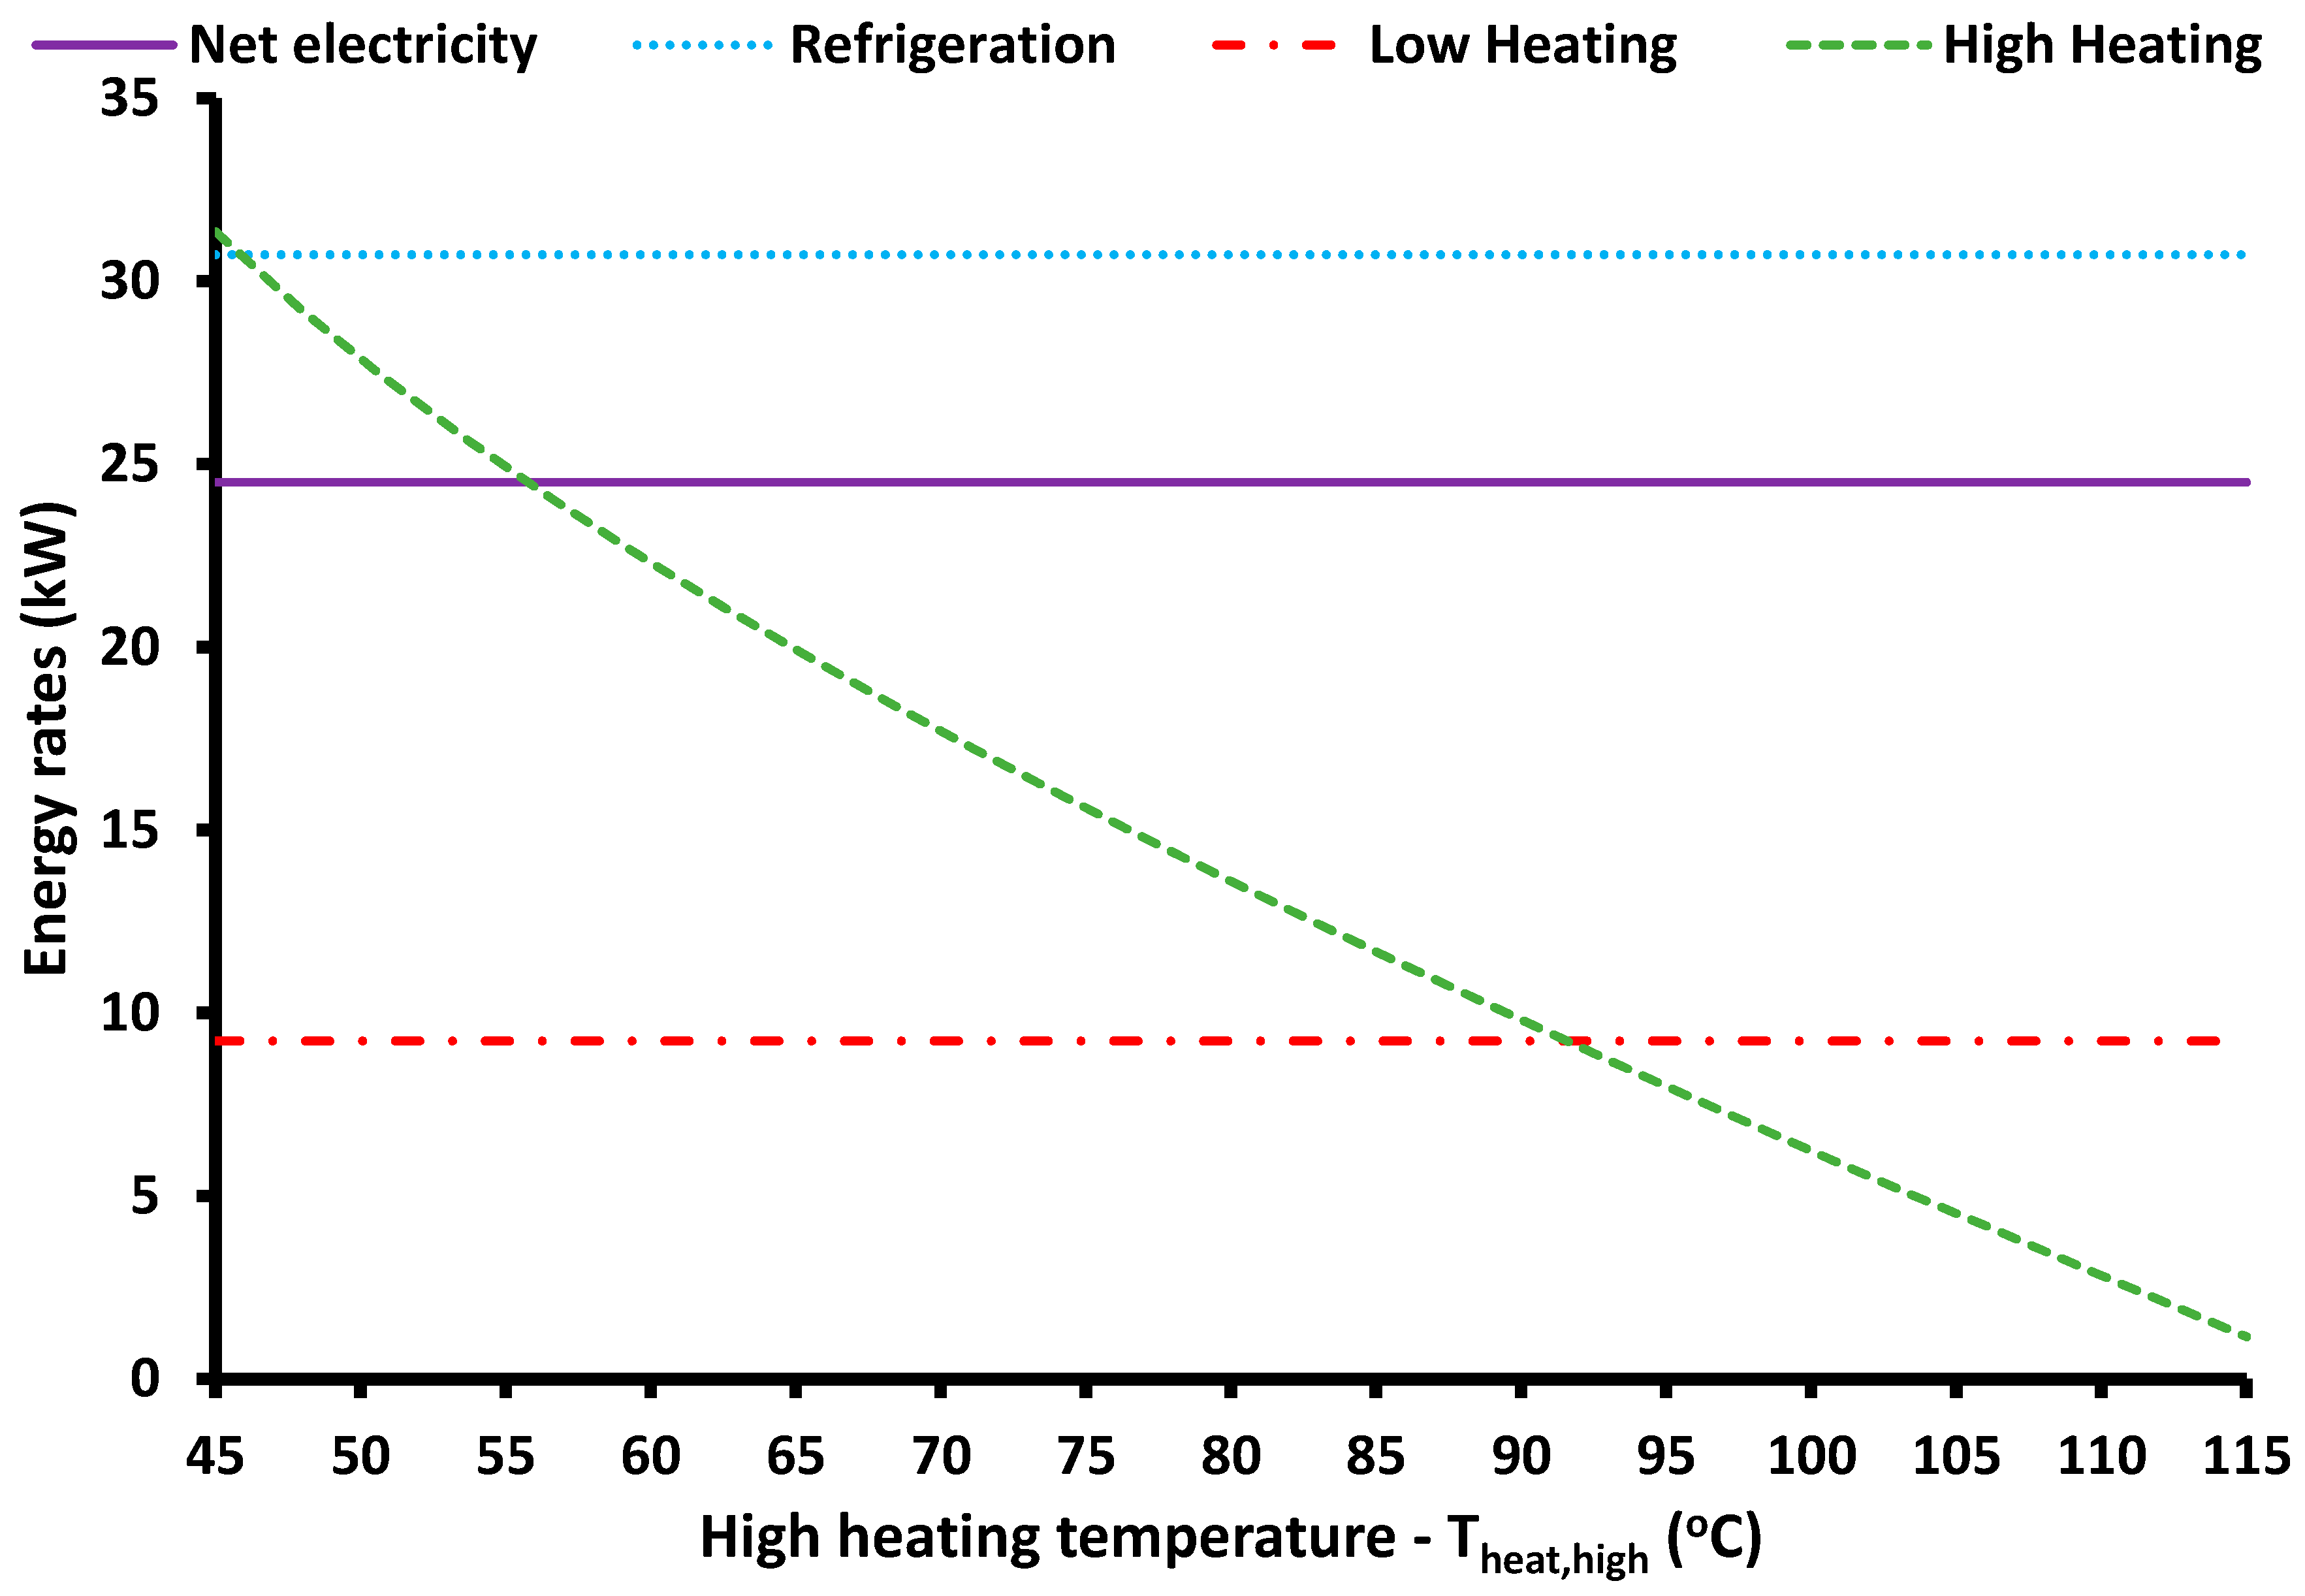
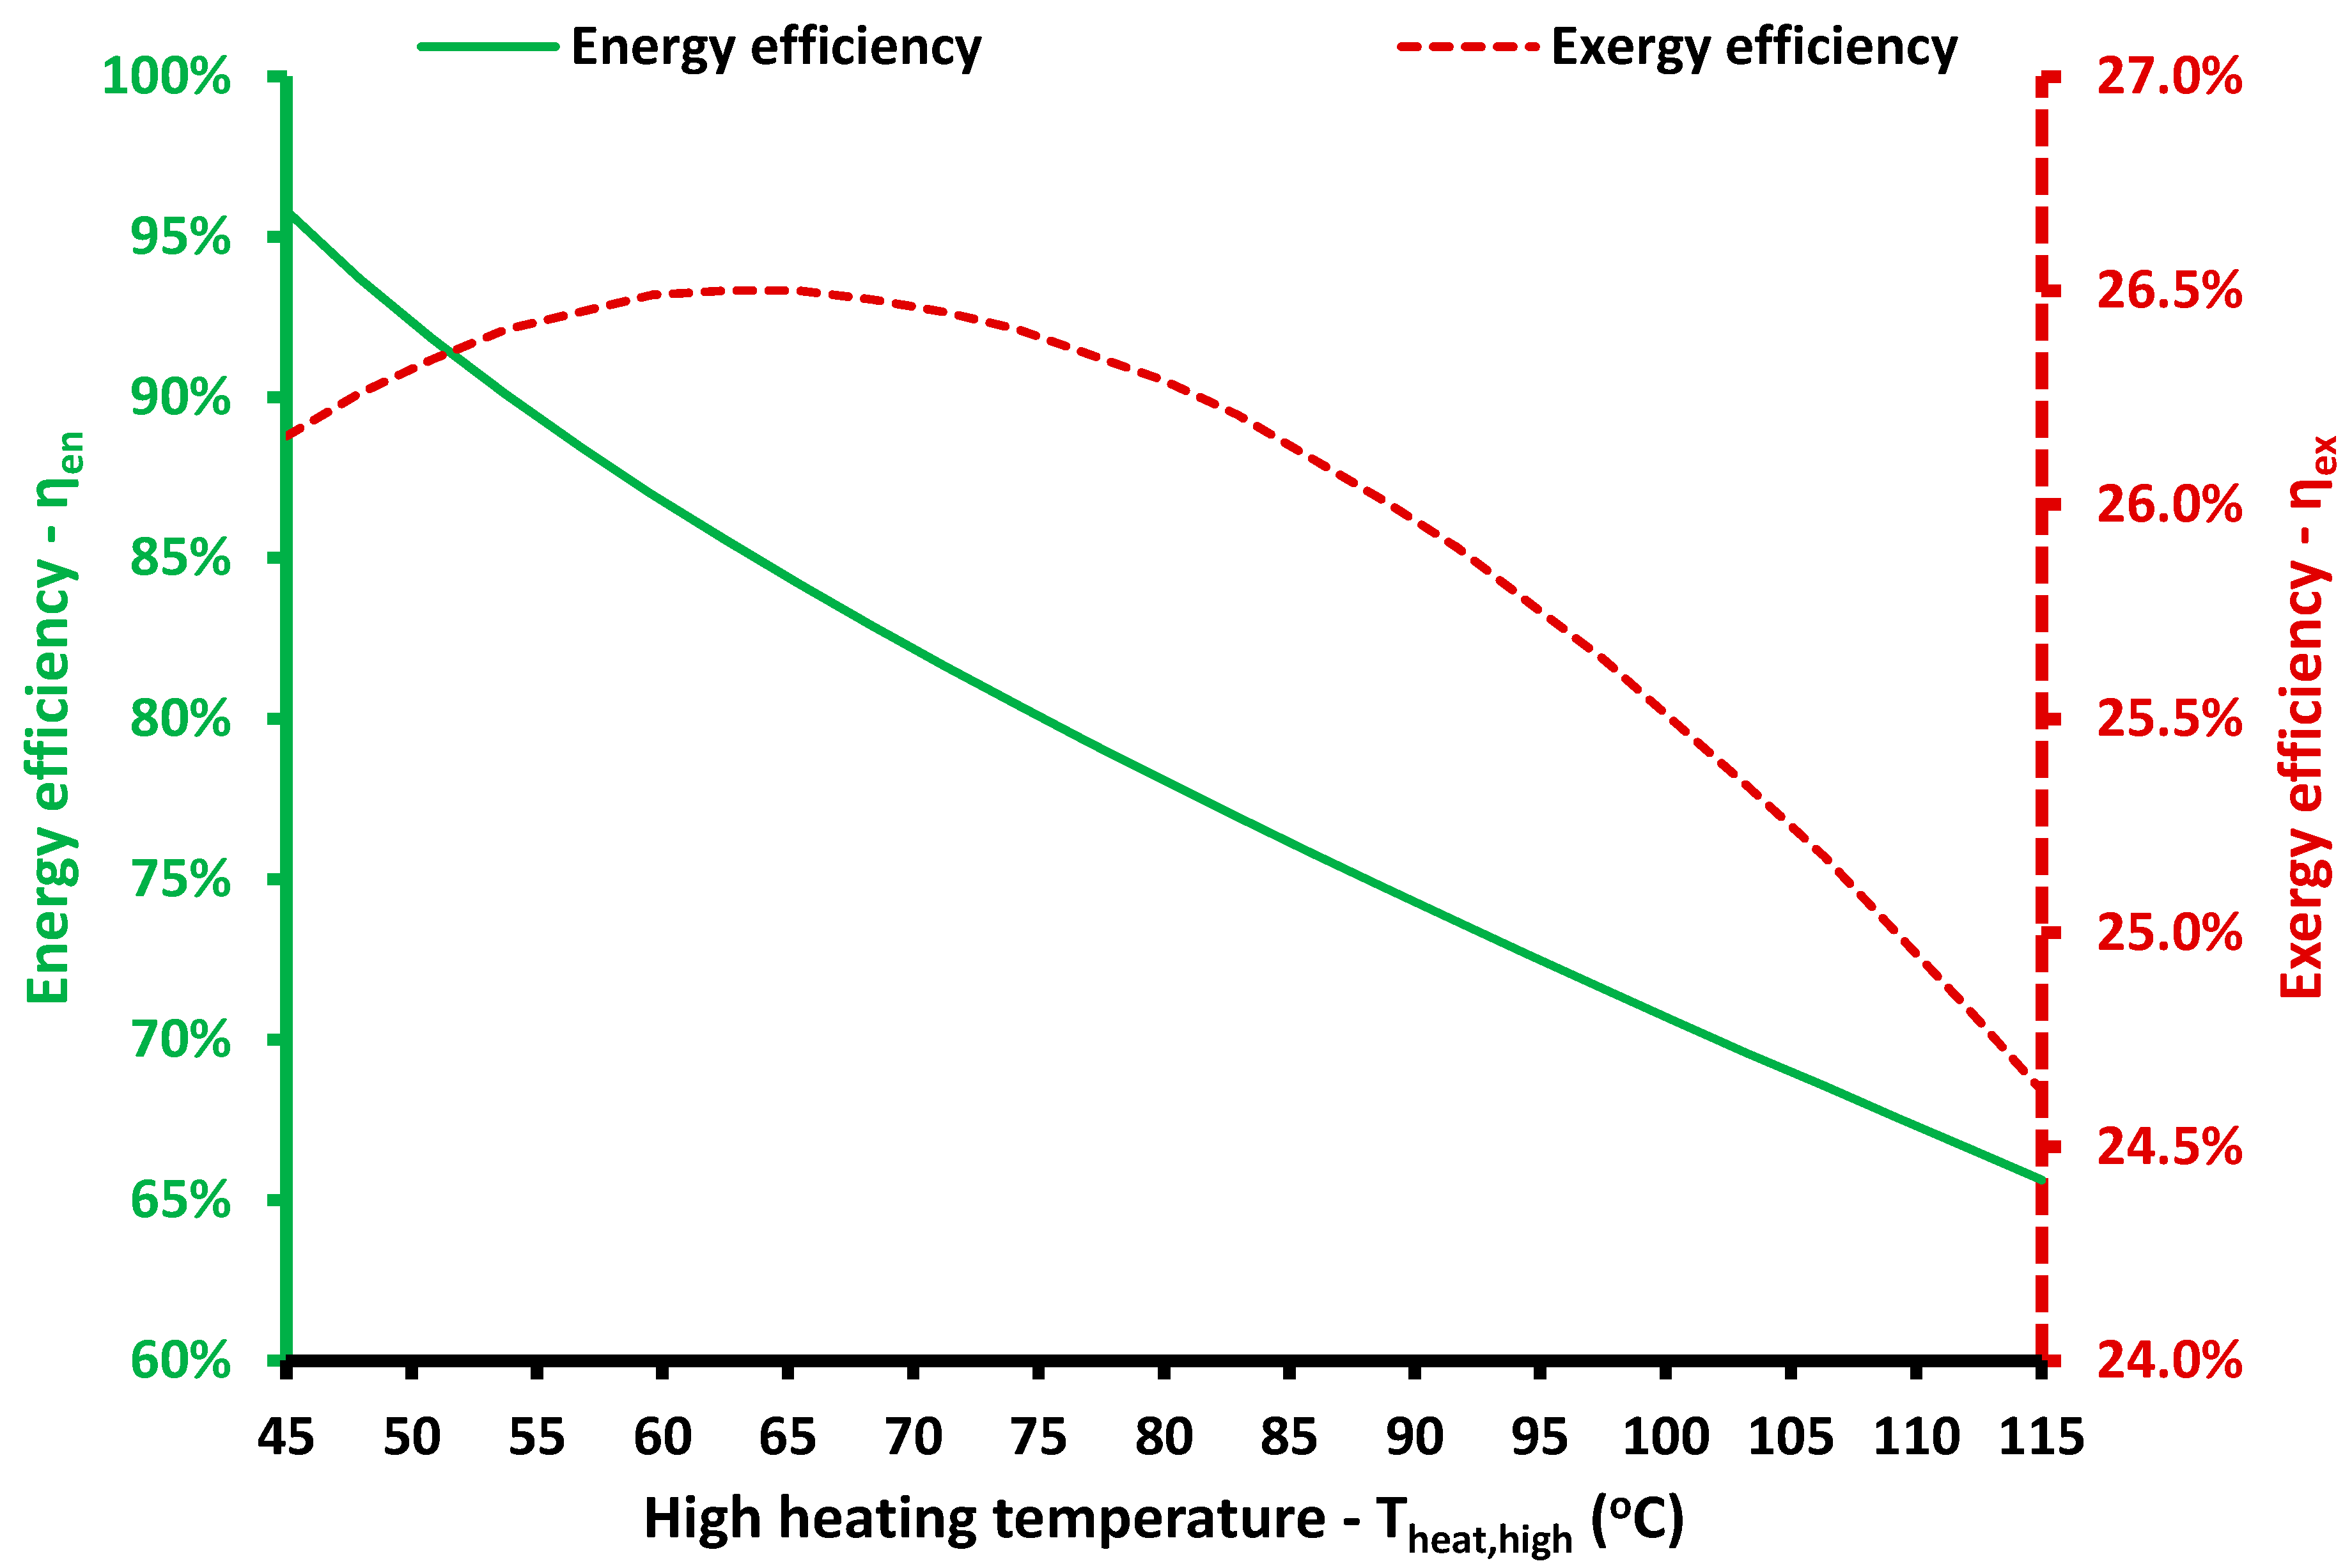
Figure 16 and Figure 17 present the system behavior for different values of the high heating temperature. Practically, all of the useful outputs are not affected and only the high heating temperature is decreased with the increase of its temperature level, as Figure 16 shows. Figure 17 indicates that the energy efficiency reduces with the increase in the high heating temperature while the exergy efficiency is maximized at 65.4 °C with a value of 26.5%, and in this case, the energy efficiency is 85.57%.
Table 4 summarizes the examined parameters, the range of the examined parameters and the range of the obtained results for the energy and exergy efficiency. It is important to note that the parameters that created the greatest variation in the energy efficiency were the medium pressure (67.51% to 117.10%) and the high heating temperature variation (65.63% to 95.83%). High energy efficiency values, which can be higher than 100%, are obtained by the proper management of the refrigeration input in the system. More specifically, the examined system acts simultaneously as a power cycle and a heat pump to produce four different useful outputs. With regard to the exergy efficiency, the high-pressure variation leads to great exergy efficiency deviation (8.69% to 28.38%) and the refrigeration temperature variation results in great variation in the exergy efficiency (12.67% to 27.16%).
Moreover, Table 5 includes the “derivative” of the efficiencies to the examined parameters. Practically, the global maximum minus the global minimum efficiency values are normalized to the nominal efficiency and are divided with the parameter range normalized to the nominal value. In the majority of the cases, the curves do not change trends (from positive to negative), and thus, this table includes useful results. In the cases where there is a maximization in an internal point, it is given in the comment column and in these cases, the calculated values are not so important but they are provided for reasons of completeness. These cases are the exergy efficiency with high heating production and the energy efficiency with the refrigeration temperature. Moreover, the majority of the cases indicate that there is a positive efficiency trend with increases of the parameters, although there are some cases with negative trends. All the trends are given in the “comments” columns, and also, they are obvious in the figures given in this section. The results indicate that the pressure levels have a very important impact on the efficiency indexes, and also, the (TIT) is a very important parameter.
3.3. Discussion
In this work, a novel polygeneration system with CO2 as the only working fluid was studied. This system is able to produce significant amounts of electricity, heating and refrigeration. Moreover, it has a relatively high performance. In nominal operating conditions (Section 3.1), the energy efficiency was 78.07% and the exergy efficiency was 26.29%. The values of the exergy efficiency are similar to those found in the literature, for example, 28.8% exergy efficiency was found in [18], and 22.5% was found in [19]. The exergy efficiency in [18] is a bit higher than in the present work but the energy efficiency was only 53%, which is much lower than the 78% found in the present study. Moreover, the parametric study (Section 3.2) and Table 4 indicate that the maximum possible exergy efficiency of the present system is 30.19%, so the suggested configuration is a highly efficient system. Moreover, previous studies [21,22] found energy efficiencies close to 45%, which is lower than those found in the present study. With regard to the exergy efficiency, some studies indicate relatively high values but it depends on the definition of exergy efficiency used in each case.
The examined system is a configuration that can operate with various heat inputs such as fuel, biomass, or solar energy. In particular, concentrating solar power is needed in order to achieve high values of the turbine inlet temperature and maybe solar tower or solar dishes. Moreover, the temperature levels of the heating and the refrigeration production can be varied in great ranges something that makes possible the use of the present system in various applications such as industries, buildings, hotels, hospitals, etc.
In the future, the present system could be optimized and examined in a specific application in steady-state or dynamic mode. Moreover, different heat sources can be studied and more specifically, the combination of solar energy and biomass can be investigated. A financial analysis should also be performed in order to determine the viability of the system.
4. Conclusions
The objective of this work was the investigation of a polygeneration system driven by a biomass boiler that uses only CO2 as the working fluid. This system produces electricity, refrigeration and heating at two temperature levels. The analysis was conducted with a developed model in Engineering Equation Solver. The most important conclusions of this work are summarized below:
- −
- In the nominal operating conditions, the system energy efficiency was 78.07% and the exergy efficiency 26.29%.
- −
- In the nominal operating conditions, the net power production was 24.50 kW, the cooling production was 30.73 kW, the heating production at 45 °C was 9.24 kW and the heating production at 80 °C was 13.60 kW.
- −
- The parameters that most affect the system energy efficiency are the medium pressure and the high heating temperature.
- −
- The parameters that most affect the system exergy efficiency are the high pressure and the refrigeration temperature.
- −
- The examined system can operate in a great range of heating and refrigeration temperatures, and so, it can be applied in numerous applications in the industrial and the building sector.
- −
- The variation of the pressure levels and of the (TIT) can lead to significant deviations in the system energy and exergy efficiencies.
In the future, the system can be examined with the combination of solar energy collectors and a biomass boiler. Moreover, financial analysis can be performed, as well as a life cycle investigation. Furthermore, another idea is to perform simulations of the present system with solar energy as the heat source with or without the biomass boiler. Also, a more applied study could be performed in the future by considering the mechanical efficiency in the turbo-machinery, as well as the reduction in the performance of the turbine in extremely high temperatures (close to 1000 °C) due to the use of cooling blades.
Author Contributions
E.B. investigation, software, writing and reviewing the original paper; C.T.: supervisions, writing and reviewing the original paper. Both authors have read and agreed to the published version of the manuscript.
Funding
This research is co-financed by Greece and the European Union (European Social Fund-ESF) through the Operational Programme “Human Resources Development, Education and Lifelong Learning” in the context of the project “Reinforcement of Postdoctoral Researchers-2nd Cycle” (MIS-5033021), implemented by the State Scholarships Foundation (ΙΚΥ).![Applsci 11 03215 g018]()

Institutional Review Board Statement
No ethical approval was required. The study was a simulation study; no participants were contacted and no human data have been used.
Informed Consent Statement
Not applicable.
Data Availability Statement
Data available after request.
Acknowledgments
The authors would like to thank the State Scholarships Foundation (ΙΚΥ) for its financial support (MIS-5033021).
Conflicts of Interest
The authors declare no conflict of interest.
Glossary
| h | Specific enthalpy, kJ kg−1 |
| Hu | Lower heating value, kJ kg−1 |
| m | CO2 mass flow rate, kg s−1 |
| mb | Fuel consumption rate, kg s−1 |
| P | Power rate, kW |
| PP | Pinch point, °C |
| Q | Heat rate, kW |
| s | Specific entropy, kJ kg−1 K−1 |
| T | Temperature, °C |
| TIT | Turbine inlet temperature, °C |
| T0 | Reference temperature, K |
| Greek Symbols | |
| ηen | Energy efficiency |
| ηex | Exergy efficiency |
| ηhex | Heat exchanger effectiveness |
| ψb | Fuel exergy factor |
| Subscripts and Superscripts | |
| b | Boiler |
| com | Compressor |
| is | Isentropic |
| heat | Heating |
| high | High |
| gc | Gas Cooler |
| low | Low |
| nom | Nominal |
| hr | Heat rejection |
| med | Medium |
| ref | Refrigeration |
| tur | Turbine |
| Abbreviations | |
| EES | Engineering Equation Solver |
| ORC | Organic Rankine cycle |
| Par | Parameter of the sensitivity analysis |
References
- Gullo, P. Impact and quantification of various individual thermodynamic improvements for transcritical R744 supermarket refrigeration systems based on advanced exergy analysis. Energy Convers. Manag. 2021, 229, 113684. [Google Scholar] [CrossRef]
- Bellos, E.; Tzivanidis, C. Alternative designs of parabolic trough solar collectors. Prog. Energy Combust. Sci. 2019, 71, 81–117. [Google Scholar] [CrossRef]
- Dincer, H.; Yüksel, S. Multidimensional evaluation of global investments on the renewable energy with the integrated fuzzy decision-making model under the hesitancy. Int. J. Energy Res. 2019, 43, 1775–1784. [Google Scholar] [CrossRef]
- Kasaeian, A.; Nouri, G.; Ranjbaran, P.; Wen, D. Solar collectors and photovoltaics as combined heat and power systems: A critical review. Energy Convers. Manag. 2018, 156, 688–705. [Google Scholar] [CrossRef] [Green Version]
- Kasaeian, A.; Bellos, E.; Shamaeizadeh, A.; Tzivanidis, C. Solar-driven polygeneration systems: Recent progress and outlook. Appl. Energy 2020, 264, 114764. [Google Scholar] [CrossRef]
- Bellos, E.; Tzivanidis, C. CO2 Transcritical Refrigeration Cycle with Dedicated Subcooling: Mechanical Compression vs. Absorption Chiller. Appl. Sci. 2019, 9, 1605. [Google Scholar] [CrossRef] [Green Version]
- Abas, N.; Kalair, A.R.; Khan, N.; Haider, A.; Saleem, Z.; Saleem, M.S. Natural and synthetic refrigerants, global warming: A review. Renew. Sustain. Energy Rev. 2018, 90, 557–569. [Google Scholar] [CrossRef]
- Scaccabarozzi, R.; Tavano, M.; Invernizzi, C.M.; Martelli, E. Comparison of working fluids and cycle optimization for heat recovery ORCs from large internal combustion engines. Energy 2018, 158, 396–416. [Google Scholar] [CrossRef]
- Dincer, I.; Zamfirescu, C. Renewable energy based multigeneration systems. Int. J. Energy Res. 2012, 36, 1403–1415. [Google Scholar] [CrossRef]
- Al-Sulaiman, F.A.; Dincer, I.; Hamdullahpur, F. Exergy modeling of a new solar driven trigeneration system. Sol. Energy 2011, 85, 2228–2243. [Google Scholar] [CrossRef]
- Bellos, E.; Tzivanidis, C. Parametric analysis and optimization of a solar driven trigeneration system based on ORC and absorption heat pump. J. Clean. Prod. 2017, 161, 493–509. [Google Scholar] [CrossRef]
- Eisavi, B.; Khalilarya, S.; Chitsaz, A.; Rosen, M.A. Thermodynamic analysis of a novel combined cooling, heating and power system driven by solar energy. Appl. Therm. Eng. 2018, 129, 1219–1229. [Google Scholar] [CrossRef]
- Mathkor, R.Z.; Agnew, B.; Al-Weshahi, M.A.; Latrsh, F. Exergetic Analysis of an Integrated Tri-Generation Organic Rankine Cycle. Energies 2015, 8, 8835–8856. [Google Scholar] [CrossRef]
- Voeltzel, N.; Phan, H.T.; Blondel, Q.; Gonzalez, B.; Tauveron, N. Steady and dynamical analysis of a combined cooling and power cycle. Therm. Sci. Eng. Prog. 2020, 19, 100650. [Google Scholar] [CrossRef]
- Khalid, F.; Dincer, I.; Rosen, M.A. Techno-economic assessment of a renewable energy based integrated multigeneration system for green buildings. Appl. Therm. Eng. 2016, 99, 1286–1294. [Google Scholar] [CrossRef]
- Bellos, E.; Vellios, L.; Theodosiou, I.-C.; Tzivanidis, C. Investigation of a solar-biomass polygeneration system. Energy Convers. Manag. 2018, 173, 283–295. [Google Scholar] [CrossRef]
- Harrod, J.; Mago, P.J.; Luck, R. Sizing analysis of a combined cooling, heating, and power system for a small office building using a wood waste biomass-fired Stirling engine. Int. J. Energy Res. 2012, 36, 64–74. [Google Scholar] [CrossRef]
- Wang, J.; Zhao, P.; Niu, X.; Dai, Y. Parametric analysis of a new combined cooling, heating and power system with transcritical CO2 driven by solar energy. Appl. Energy 2012, 94, 58–64. [Google Scholar] [CrossRef]
- Xu, X.X.; Liu, C.; Fu, X.; Gao, H.; Li, Y. Energy and exergy analyses of a modified combined cooling, heating, and power system using supercritical CO2. Energy 2015, 86, 414–422. [Google Scholar] [CrossRef]
- Hou, S.; Zhang, F.; Yu, L.; Cao, S.; Zhou, Y.; Wu, Y.; Hou, L. Optimization of a combined cooling, heating and power system using CO2 as main working fluid driven by gas turbine waste heat. Energy Convers. Manag. 2018, 178, 235–249. [Google Scholar] [CrossRef]
- Mishra, R.S.; Singh, H. Detailed parametric analysis of solar driven supercritical CO2 based combined cycle for power generation, cooling and heating effect by vapor absorption refrigeration as a bottoming cycle. Therm. Sci. Eng. Prog. 2018, 8, 397–410. [Google Scholar] [CrossRef]
- Balafkandeh, S.; Zare, V.; Gholamian, E. Multi-objective optimization of a tri-generation system based on biomass gasification/digestion combined with S-CO2 cycle and absorption chiller. Energy Convers. Manag. 2019, 200, 112057. [Google Scholar] [CrossRef]
- Fan, G.; Li, H.; Du, Y.; Zheng, S.; Chen, K.; Dai, Y. Preliminary conceptual design and thermo-economic analysis of a combined cooling, heating and power system based on supercritical carbon dioxide cycle. Energy 2020, 203, 117842. [Google Scholar] [CrossRef]
- Yang, Y.; Huang, Y.; Jiang, P.; Zhu, Y. Multi-objective optimization of combined cooling, heating, and power systems with supercritical CO2 recompression Brayton cycle. Appl. Energy 2020, 271, 115189. [Google Scholar] [CrossRef]
- Zare, V.; Takleh, H.R. Novel geothermal driven CCHP systems integrating ejector transcritical CO2 and Rankine cycles: Thermodynamic modeling and parametric study. Energy Convers. Manag. 2020, 205, 112396. [Google Scholar] [CrossRef]
- Ayachi, F.; Tauveron, N.; Tartière, T.; Colasson, S.; Nguyen, D. Thermo-Electric Energy Storage involving CO2 transcritical cycles and ground heat storage. Appl. Therm. Eng. 2016, 108, 1418–1428. [Google Scholar] [CrossRef]
- F-Chart Software, Engineering Equation Solver (EES). 2015. Available online: http://www.fchart.com/ees (accessed on 5 January 2021).
- Vasquez Padilla, R.; Soo Too, Y.C.; Benito, R.; Stein, W. Exergetic analysis of supercritical CO2 Brayton cycles integrated with solar central receivers. Appl. Energy 2015, 148, 348–365. [Google Scholar] [CrossRef]
- Dai, B.; Liu, S.; Zhu, K.; Sun, Z.; Ma, Y. Thermodynamic performance evaluation of transcritical carbon dioxide refrigeration cycle integrated with thermoelectric subcooler and expander. Energy 2017, 122, 787–800. [Google Scholar] [CrossRef]
- Ptasinski, K.J.; Prins, M.J.; Pierik, A. Exergetic evaluation of biomass gasification. Energy 2007, 32, 568–574. [Google Scholar] [CrossRef]
- Chen, R.; Romero, M.; González-Aguilar, J.; Rovense, F.; Rao, Z.; Liao, S. Design and off-design performance comparison of supercritical carbon dioxide Brayton cycles for particle-based high temperature concentrating solar power plants. Energy Convers. Manag. 2021, 232, 113870. [Google Scholar] [CrossRef]
Figure 1.
The examined polygeneration system with CO2 working fluid.

Figure 2.
Pressure-specific enthalpy (p-h) diagram for the examined polygeneration system in nominal operating conditions.
Figure 2.
Pressure-specific enthalpy (p-h) diagram for the examined polygeneration system in nominal operating conditions.

Figure 3.
Temperature-specific entropy (T-s) diagram for the studied polygeneration system in nominal operating conditions (logarithmic vertical axis).
Figure 3.
Temperature-specific entropy (T-s) diagram for the studied polygeneration system in nominal operating conditions (logarithmic vertical axis).

Figure 4.
Useful energy products for different values of the turbine inlet temperature.

Figure 5.
Energy and exergy efficiencies for different values of the turbine inlet temperature.

Figure 6.
Useful energy products for different values of the high pressure.

Figure 7.
Energy and exergy efficiencies for different values of the high pressure.

Figure 8.
Useful energy products for different values of the medium pressure.

Figure 9.
Energy and exergy efficiencies for different values of the medium pressure.

Figure 10.
Useful energy products for different values of the heat exchanger effectiveness.

Figure 11.
Energy and exergy efficiencies for different values of the heat exchanger effectiveness.

Figure 12.
Useful energy products for different values of the refrigeration temperature.

Figure 13.
Energy and exergy efficiencies for different values of the refrigeration temperature.

Figure 14.
Useful energy products for different values of the heat rejection temperature.

Figure 15.
Energy and exergy efficiencies for different values of the heat rejection temperature.

Figure 16.
Useful energy products for different values of the high heating temperature.

Figure 17.
Energy and exergy efficiencies for different values of the high heating temperature.


Table 1.
Information about the examined configuration.
| Parameter | Symbol | Value |
|---|---|---|
| Heat input | Qb | 100 kW |
| Boiler efficiency | ηb | 95% |
| Lower heating value | Hu | 15290 kJ kg−1 |
| Pitch point in heat exchangers | PP | 5 °C |
| Exergy factor of the fuel | ψb | 1.119 |
| Low heating temperature | Theat,low | 45 °C |
| Nominal high heating temperature | Theat,high | 80 °C |
| Nominal high pressure | Phigh | 200 bar |
| Nominal medium pressure | Pmed | 85 bar |
| Nominal refrigeration temperature | Tref | 5 °C |
| Nominal turbine inlet temperature | TIT | 700 °C |
| Nominal heat exchanger effectiveness | ηhex | 90% |
| Nominal heat rejection temperature | Thr | 35 °C |
Table 2.
Thermodynamic state-points in nominal operating conditions.
| State-Points | Pressure-P | Temperature-T | Specific Enthalpy-h | Specific Entropy-s |
|---|---|---|---|---|
| (bar) | (°C) | (kJ kg−1) | (kJ kg−1 K−1) | |
| 1 | 39.7 | 5.0 | −79.3 | −0.923 |
| 2 | 85.0 | 65.4 | −45.2 | −0.907 |
| 3 | 85.0 | 50.0 | −80.9 | −1.015 |
| 4 | 85.0 | 35.0 | −197.9 | −1.388 |
| 5 | 200.0 | 61.8 | −177.7 | −1.379 |
| 6 | 200.0 | 508.8 | 477.3 | −0.062 |
| 7 | 200.0 | 800.0 | 844.2 | 0.337 |
| 8 | 85.0 | 679.0 | 695.3 | 0.356 |
| 9 | 85.0 | 123.5 | 40.2 | −0.673 |
| 10 | 85.0 | 85.0 | −12.3 | −0.812 |
| 11 | 85.0 | 35.0 | −197.9 | −1.388 |
| 12 | 39.7 | 5.0 | −197.9 | −1.349 |
Table 3.
Results for the nominal operating conditions.
| Parameter | Symbol | Value |
|---|---|---|
| Heat input | Qb | 100 kW |
| Net power production | Pnet | 24.50 kW |
| Refrigeration production | Qref | 30.73 kW |
| Low-heating production | Qheat,low | 9.24 kW |
| High heating production | Qheat,high | 13.60 kW |
| System energy efficiency | ηen | 78.07% |
| System exergy efficiency | ηex | 26.29% |
| Fuel consumption | mb | 0.00654 kg s−1 |
| Turbine power production | Ptur | 38.55 kW |
| Low compressor consumption | Pcom,low | 8.82 kW |
| High compressor consumption | Pcom,high | 5.23 kW |
| First gas cooler heat rejection | Qgc,1 | 30.31 kW |
| Second gas cooler heat rejection | Qgc,2 | 48.07 kW |
Table 4.
The impact of the examined parameters on the energy and exergy efficiencies.
| Parameters | Energy Efficiency | Exergy Efficiency | ||||
|---|---|---|---|---|---|---|
| Symbol | Min | Max | Min | Max | Min | Max |
| TIT (°C) | 400 | 1000 | 70.76% | 80.15% | 15.01% | 29.60% |
| Phigh (bar) | 110 | 230 | 72.10% | 78.88% | 8.69% | 28.38% |
| Pmed (bar) | 75 | 125 | 67.51% | 117.10% | 14.36% | 30.19% |
| ηhex (−) | 0.00 | 0.96 | 75.39% | 88.92% | 17.92% | 28.36% |
| Tref (°C) | −35 | 10 | 75.69% | 83.03% | 12.67% | 27.16% |
| Thr (°C) | 20 | 45 | 74.42% | 79.48% | 24.86% | 27.57% |
| Theat,high (°C) | 45 | 115 | 65.63% | 95.83% | 24.63% | 26.50% |
Table 5.
Ratios of the efficiency difference to the parameter range (sensitivity analysis).
| Parameter (Par) | Comments (ηen) | Comments (ηex) | ||
|---|---|---|---|---|
| TIT | 14.03% | 64.75% | Positive trend | Positive trend |
| Phigh | 14.47% | 124.83% | Positive trend | Positive trend |
| Pmed | 107.98% | 102.36% | Positive trend | Negative trend |
| ηhex | 16.25% | 37.23% | Negative trend | Positive trend |
| Tref | 1.04% | 6.12% | Maximum point | Positive trend |
| Thr | 9.07% | 14.43% | Negative trend | Positive trend |
| Theat,high | 44.21% | 8.13% | Negative trend | Maximum point |
Publisher’s Note: MDPI stays neutral with regard to jurisdictional claims in published maps and institutional affiliations. |
© 2021 by the authors. Licensee MDPI, Basel, Switzerland. This article is an open access article distributed under the terms and conditions of the Creative Commons Attribution (CC BY) license (https://creativecommons.org/licenses/by/4.0/).
Share and Cite
MDPI and ACS Style
Bellos, E.; Tzivanidis, C. Parametric Analysis of a Polygeneration System with CO2 Working Fluid. Appl. Sci. 2021, 11, 3215. https://0-doi-org.brum.beds.ac.uk/10.3390/app11073215
AMA Style
Bellos E, Tzivanidis C. Parametric Analysis of a Polygeneration System with CO2 Working Fluid. Applied Sciences. 2021; 11(7):3215. https://0-doi-org.brum.beds.ac.uk/10.3390/app11073215
Chicago/Turabian StyleBellos, Evangelos, and Christos Tzivanidis. 2021. "Parametric Analysis of a Polygeneration System with CO2 Working Fluid" Applied Sciences 11, no. 7: 3215. https://0-doi-org.brum.beds.ac.uk/10.3390/app11073215
Note that from the first issue of 2016, this journal uses article numbers instead of page numbers. See further details here.