Article

Human Dental Pulp Stem Cell Osteogenic Differentiation Seeded on Equine Bone Block with Graphene and Melatonin

by
Rosa Mancinelli
1,†,
Ester Sara Di Filippo
1,†,
Margherita Tumedei
2,†,
Mariangela Marrone
1,
Antonella Fontana
3,
Valeria Ettorre
3,
Silvia Giordani
4,
Michele Baldrighi
5,
Giovanna Iezzi
2,*,
Adriano Piattelli
2,6,7,8 and
Stefania Fulle
1
1
Department of Neuroscience Imaging and Clinical Sciences, University “G. d’Annunzio” Chieti-Pescara, 66100 Chieti, Italy
2
Department of Medical, Oral and Biotechnological Sciences, University “G. D’Annunzio” of Chieti-Pescara, 66100 Chieti, Italy
3
Department of Pharmacy, University “G. D’Annunzio” of Chieti-Pescara, 66100 Chieti, Italy
4
School of Chemical Sciences, Dublin City University, Glasnevin, D09 E432 Dublin 9, Ireland
5
Nano Carbon Materials, Italian Institute of Technology, via Morego 30, 16163 Genova, Italy
6
Biomaterials Engineering, Catholic University of San Antonio de Murcia (UCAM), Av. de los Jerónimos, Guadalupe, 135 30107 Murcia, Spain
7
Fondazione Villaserena per la Ricerca, 65121 Città Sant’Angelo, Italy
8
Casa di Cura Villa Serena del Dott. L. Petruzzi, 65121 Città Sant’Angelo, Italy
*
Author to whom correspondence should be addressed.
Equally contribution.
Submission received: 6 March 2021 / Revised: 30 March 2021 / Accepted: 30 March 2021 / Published: 3 April 2021
(This article belongs to the Special Issue Recent Advances and Challenges in Tissue Engineering)

Abstract

:
Equine bone blocks have osteogenic effects promoting bone regeneration with biocompatibility and osteoconductivity capacity. Human dental pulp stem cells (hDPSCs) can differentiate into osteoblasts enhancing biomineralization with such scaffolds. Melatonin is able to improve bone health and mediate bone formation. Collagenated equine bone blocks were coated with ammonia-functionalized graphene-oxide (G-N) at two different concentrations (2 μg/mL, G-N2; and 10 μg/mL, G-N10). The homogeneity of G-N coating was checked by Raman spectroscopy, whereas thermogravimetric analysis (TGA) allowed us to quantify the amount of G-N deposited on the blocks. The aim of this study was to investigate in vitro the effect of G-N-coated collagenated equine bone blocks on the proliferation and differentiation of hDPSCs with the addition of a melatonin. This evaluation was determined after 7, 14, and 21 days of culture by the expression of specific microRNAs, RUNX2 and SMAD5 gene expression, osteocalcin levels, and histological analysis. The results showed that equine blocks G-N2 and G-N10 and melatonin gave an optimal cell adhesion as shown by histological analysis, and an increase in the hDPSCs osteogenic potential as confirmed by microRNA and gene expression with an increase in osteocalcin levels. This study suggests that equine bone blocks coated with G-N2 and G-N10 and melatonin promote the osteogenic process.

1. Introduction

The clinical treatment of large-size bone defects requires an interdisciplinary approach of bone regeneration techniques to restore the anatomical, physical, and functional conditions after acquired trauma, infection, neoplasm, or surgical resection [1]. The procedure by autologous bone grafts represents the gold standard way for bone regeneration due to their self-capabilities of osteoconduction, osteoinduction, and osteogenesis [2,3].
The osteoconduction process is a physiological mechanism based on the new bone formation on a biomaterials and scaffolds surface. This property is associated to the sub-strain of the bone healing process by a space-maintaining capacity in fractures or damaged hard tissue defects [4]. These components represent key factors able to enhance the integration of the graft, to promote the remodeling of the bone substitute and to induce the new bone formation [5]. The osseointegration of the bone graft is characterized by necessary components such as osteogenic progenitor cell differentiation, secretion of osteoconductive matrices, and release of osteoinductive growth factors conveyed by organized blood clot [5,6]. On the contrary, the autologous bone graft approach is related to considerable increase in surgical procedures and a higher postoperative patient morbidity, in favor of new-generation biomaterials with heterologous and synthetic origin and biomaterials’ bioactive coating [7]. Human dental pulp stem cells (hDPSCs) represent an easy-access reliable source of multipotent mesenchymal stem cells (MSCs). The hDPSCs are able to differentiate into osteoblasts and can be seeded on a bioscaffold and successfully applied for tissue engineering of bone defects [8,9,10]. The treatment of severe defects of the jaws requires bone regeneration while the augmentation procedures with bone substitutes and barrier membranes are indicated for localized ridge atrophy [11,12]. The gold standard of graft materials for bone regeneration is autologous bone, due to osteogenic, osteoinductive, and osteoconductive properties. The application of natural substitutes such as allografts and xenografts seems to be an alternative [13,14]. The using of xenografts is common and may have a “similar” structure of the component being replaced. Equine bone has been proposed as a bone substitute alone or in combination with other materials [15].
Bone blocks are proposed for large bone defect treatment due to their biocompatibility and osteoconductivity properties. Plenty of techniques have demonstrated that equine bone derived materials have osteogenic effects and promote bone regeneration acting as little resorbable scaffolds [16,17,18,19].
Our previous results showed that equine bone blocks enhanced hDPSCs differentiation [20]. Melatonin (N-acetyl-5-methoxytryptamine) is a natural hormone able to improve bone health because it targets the overall remodeling process through its dual actions on osteoblasts and osteoclasts and is an important mediator in bone formation [21,22,23,24]. Moreover, the association of melatonin combined with xenografts induced in dog jaws models the promotion of osteointegration with higher bone-to-implant contact compared to the scaffold alone [25]. There are various phases to the bone remodeling process that include the activation of osteoclast precursors to initiate bone resorption, followed by the activation of osteoblasts to form and mineralize new bone matrix [26].
In our previous study, we demonstrated that equine bone block enhanced hDPSC differentiation and the effect was further enhanced by the simultaneous presence of an equine bone block and 100 µM of melatonin that stimulated early stages of cell differentiation. This study led us to conclude that hDPSCs/equine bone blocks and melatonin seemed to be an effective biocompatible system useful for bone tissue engineering due to the osteogenic results obtained [20]. Graphene-oxide (GO) enriched materials have raised a growing interest in many research areas, due to the capacity of GO to promote cell adhesion, proliferation, and differentiation [27,28,29]. The GO was demonstrated to be able to guarantee the viability and to enhance osteogenic differentiation of stem cells when compared with traditional substrates or scaffolds [27,28,29,30]. miRNAs are regulators of bone development influencing the progression of differentiation through regulating Bone Morphogenetic Protein (BMP) signaling [31] targeting both SMAD5, a transcription factor that activates early osteoblast differentiation markers and RUNX2 which influences downstream genes for the osteoblast phenotype [32,33] and affects osteocalcin expression [34]. BMP2 signaling appears to release osteo-specific mRNAs from miRNA inhibition, upregulating only a small number of miRNAs early in differentiation and downregulating the vast majority [35]. There is some overlap of miRNAs from the cardiogenesis, myogenesis, neurogenesis, and hematopoiesis pathways. miR-133 and miR-135 act in concert to regulate osteoblastogenesis in MSCs. MiR-133a and miR-135 inhibit differentiation [36].
The purpose of the present in vitro study was to investigate the osteoregenerative potential of ammonia-functionalized graphene-oxide (G-N)-coated equine bone substitute materials and melatonin on hDPSC. The innovative aspect of the present study was to assess the potential osteoinductive properties of these new hybrid materials and therefore their ability to improve bone regeneration. The idea to coat the equine bone block with G-N rather than with simple GO was born by the aim to enrich with amino groups the graphene-oxide coating in order to mimic proteins (due to the simultaneous presence of carboxylic and amine moieties on the graphitic surface), widely present in the extracellular matrix during bone formation. Furthermore, in a recent study, the use of amine-functionalized graphene filler for different biomedical applications evidenced the promotion of cell conductivity and consequently better cell growth and proliferation [37]. Sharma et al. reported that the amine-functionalized graphene used in combination with bone cement has been reported in vivo as an excellent healing agent for fractured bone, as evident from the calcination in just 20 days against no healing in the control [37]. Melatonin was associated with a G-N-enriched equine bone block in order to evaluate a possible synergic effect due to the capacity of melatonin to activate the differentiated cells, i.e., osteoclasts—to initiate bone resorption—and osteoblasts. The osteoregenerative potential of these association was evaluated following different measurements. The degree of proliferation and mostly of differentiation of hDPSC was determined by the isolation, quantification, and expression of microRNAs, particularly miR-133a/b, miR-135a, miR-206, miR-29b, and miR-let-7b, which are proper markers of bone growth promotion. Furthermore, real-time PCR analysis was performed to analyze the expression of RUNX2 and SMAD5 genes, bone formation-linked transcriptional factors. Finally, the levels of osteocalcin, released in the culture medium, were assessed to evaluate the bone turnover stage and histological analyses.

2. Materials and Methods

2.1. Ammonia Graphene-Oxide (G-N) Equine Bone Block Coating

The experiments were performed using Sp Blocks (OsteoBiol, Tecnoss®, Torino, Italy), which are cancellous blocks of heterologous bone (dimensions: 10 × 10 × 10 mm) produced with an exclusive Tecnoss process which avoids ceramization of the hydroxyapatite crystals. A quantity of 25 mL of homogeneous dispersion of ammonia-functionalized graphene-oxide (G-N) (Merck KGaA, Darmstadt, Germany) in water at various concentrations (2, 10 μg/mL) was prepared by ultrasonicating for 15 min and centrifuging at 5500 rpm for 5 min in order to ensure good dispersion. Then 250 μL of this solution were dropped on the bone block and spin coated at 500 rpm for 30 s, and 1300 rpm for 60 s. At the end of the procedure, uniformly coated collagenated bone blocks were obtained, defined G-N2 and G-N10 based on the concentrations of G-N used for the coating.
Thermal gravimetric analysis was performed with a TA Q500 thermogravimetric analyzer. A fragment was cut from the equine bone blocks, loaded in a Pt pan and heated to 900 at 10 °C/min in air atmosphere after equilibrating the sample at 100 °C.
Raman spectra were acquired using a Horiba Jobin Yvon HR 800 UV LabRam Raman microscope, using as light source the built-in 632 nm laser. The spectra were normalized on the intensity of the main hydroxyapatite scattering band (about 965 cm−1).
UV spectroscopy of GO and G-N was performed using a Jasco V-570 UV-vis-NIR spectrophotometer instrument. Samples were prepared by diluting the commercial sample to the elected concentration.

2.2. hDPSCs Extraction and Cell Cultures

Human DPSCs were extracted from third molar teeth and characterized at the Department of Experimental Medicine, Section of Histology and Embryology, Second University of Naples (Naples, Italy) according to Iaculli et al., 2017 [8]. The utilization of dental pulps was approved by the Internal Ethical Committee (Second University Ethical Committee) and the donors provided written informed consent before participating in the present study. After sorting the persistence of negativity for CD45 and positivity for CD34, it was clearly demonstrated that these cells were of mesenchymal origin. Moreover, the population was found to be CD90+ /CD133+, evidencing that the cell population was still undifferentiated, as well as potentially multipotent. Therefore, hDPSCs were stored at −80 °C. Once defrosted, cells were put in culture with a growth medium (GM) composed as follows: Dulbecco’s modified eagle medium high glucose (#ECB7501L, Euroclone, Milan, Italy), 10% fetal bovine serum (FBS, #ECS0180L, Euroclone, Milan, Italy), 1% penicillin/streptomycin 100X (#ECB3001D, Euroclone, Milan, Italy), 1% glutamine (#ECB3000D, Euroclone, Milan, Italy), and incubated at 37 °C and 5% CO2. To induce the osteogenic differentiation, hDPSCs were cultured in the differentiation medium (DM) for 7, 14, and 21 days. The DM medium was constituted by the Dulbecco’s modified eagle medium high glucose + 10% FBS + 1% mL Pen/Strep + 1% L-Glutamine with the supplementation of 100 nM dexametasone (#D4902, Sigma–Aldrich, Milan, Italy), 100 nM beta-glycerol phosphate (#50020, Sigma–Aldrich, Milan, Italy), and 50 µM ascorbic acid (#A92902, Sigma–Aldrich, Milan, Italy).

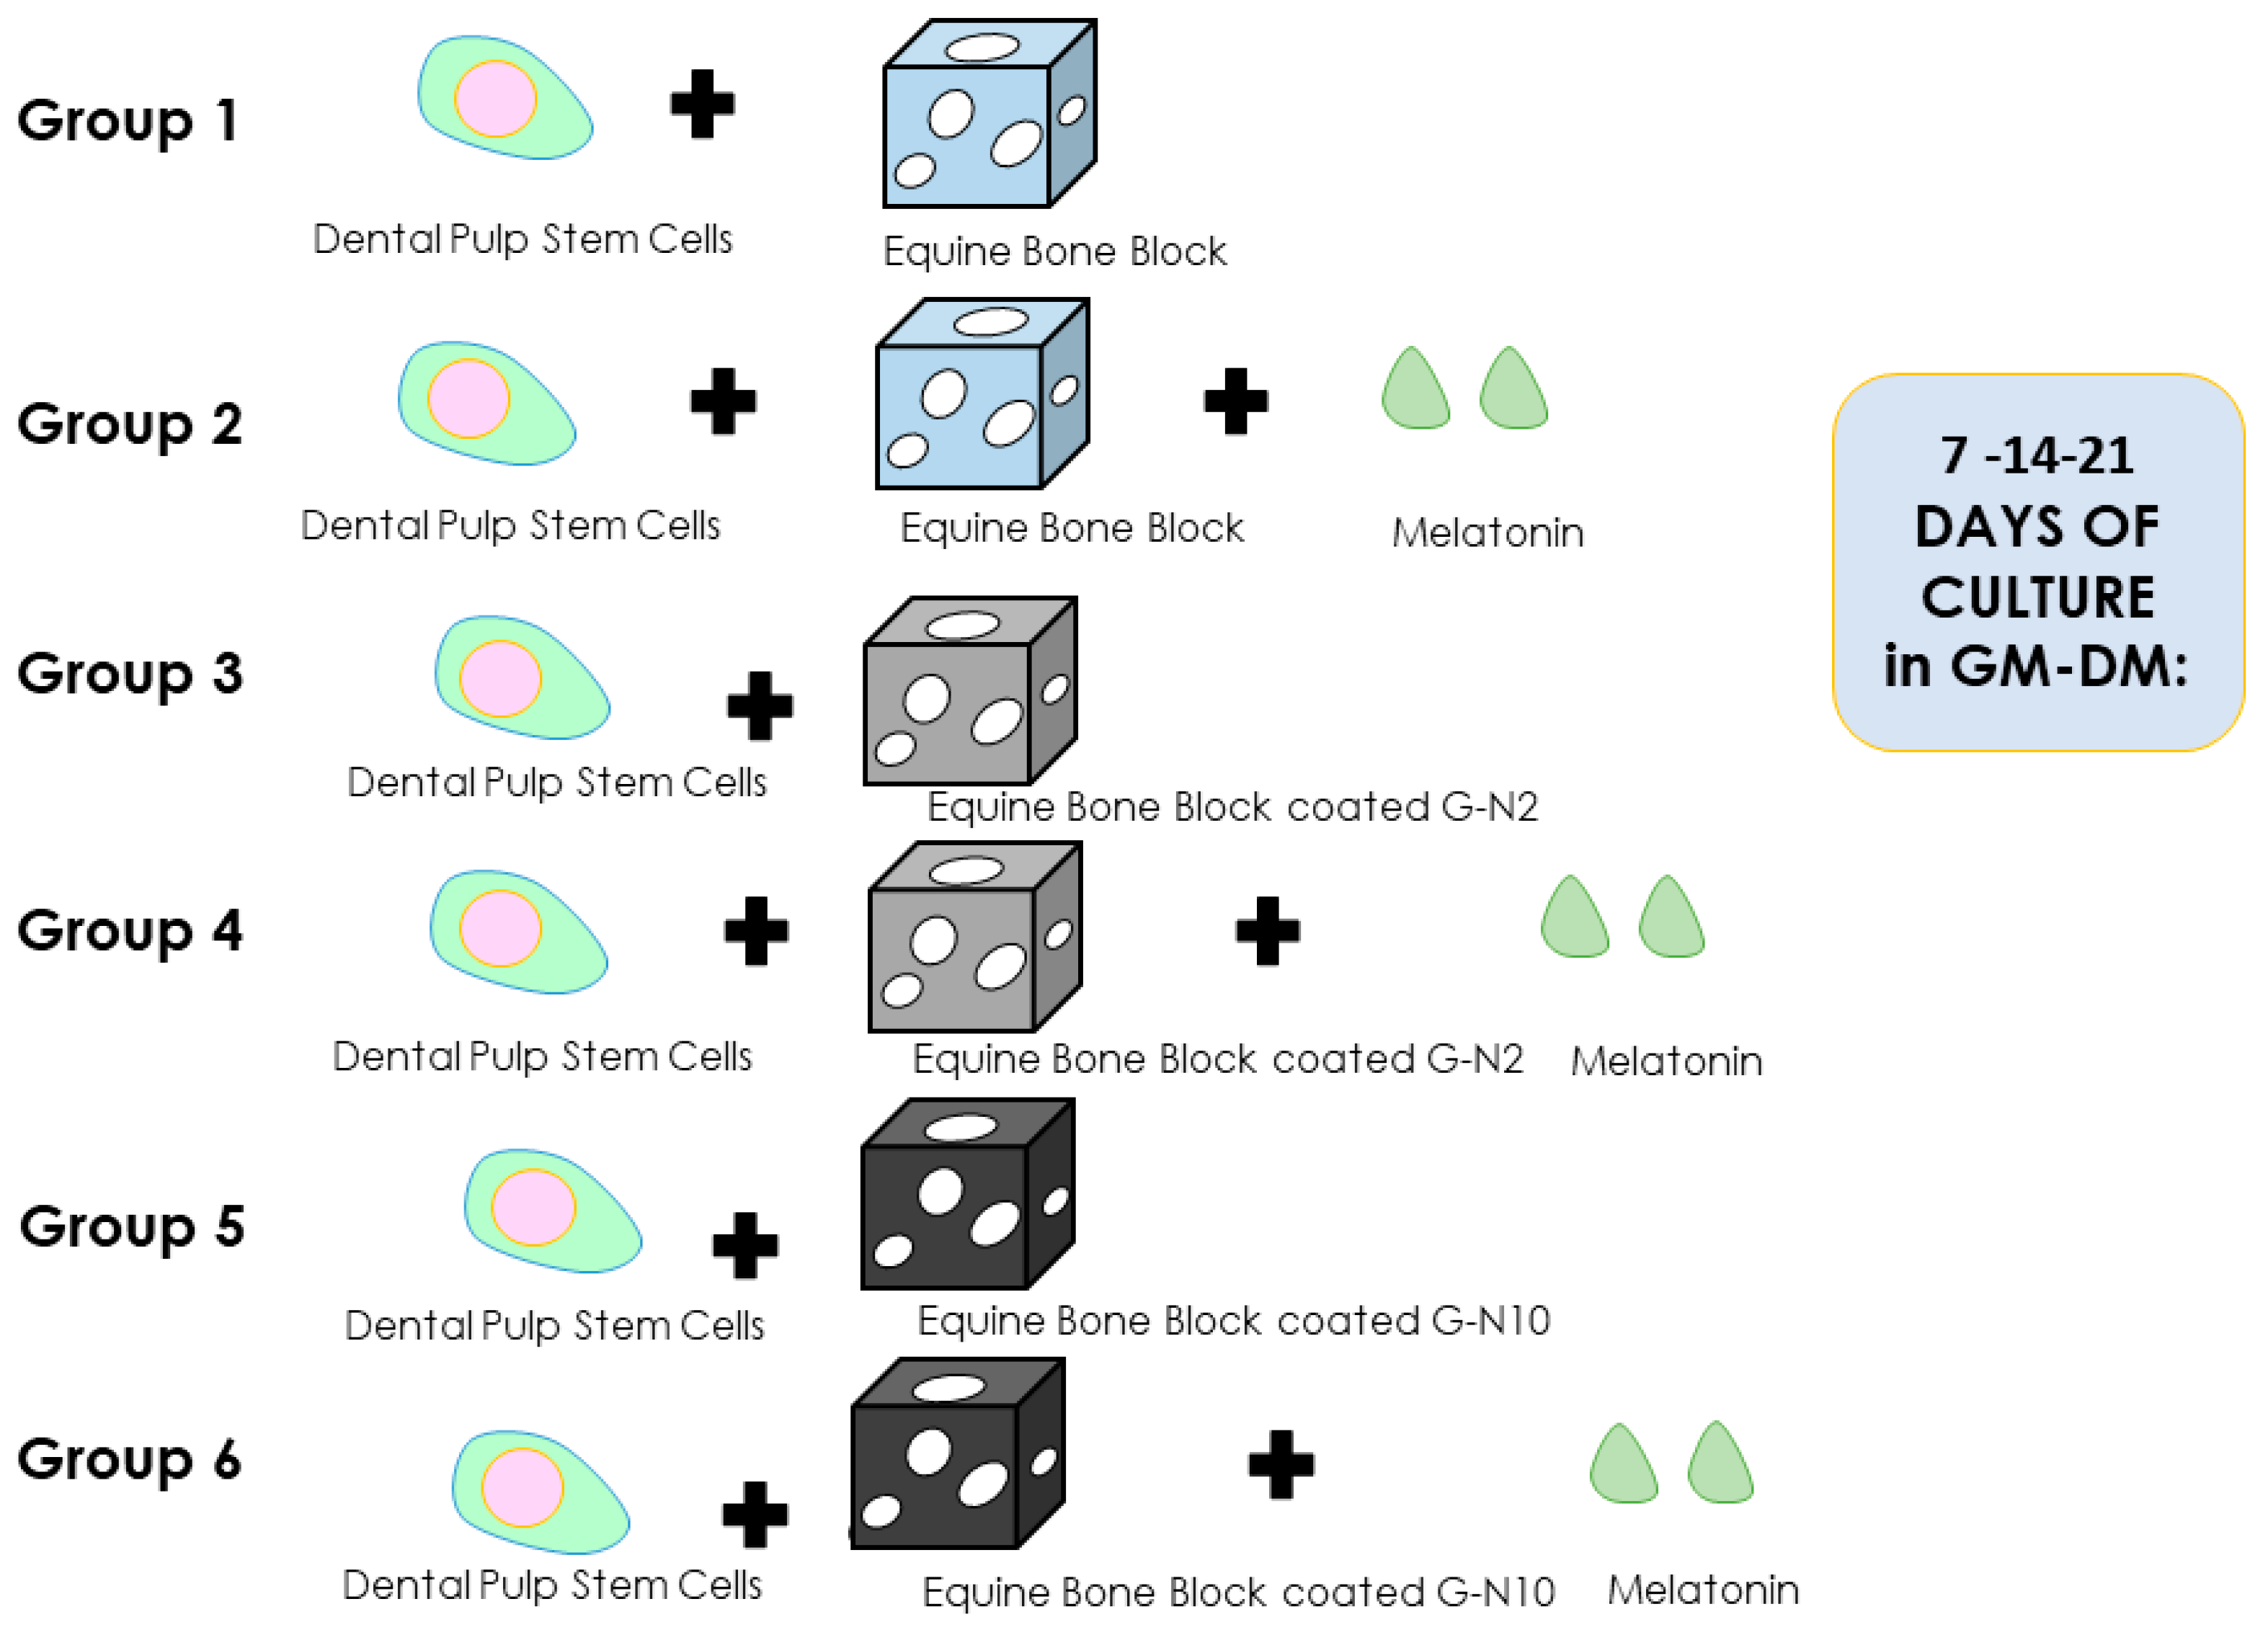
2.3. Experimental Study Design

The purpose of the following investigation was the analysis of G-N2- and G-N10-coated equine bone graft and melatonin effects on hDPSC proliferation and differentiation in an osteogenic pattern. The design of the study is shown in Figure 1. Human DPSCs were plated in three different time points: An amount of ~40.000 cells were placed for 7, ~20.000 cells set for 14, and ~10.000 cells for 21 days of culture. After 24 h, G-N2 and G-N10 bone blocks, previously sterilized, were placed in the presence of DM or GM with the addition of HEPES (#H4034 Sigma–Aldrich, Milan, Italy) at the concentration of 15 nM. In some experimental conditions (#M5250, Sigma–Aldrich, Milano, Italy) 100 µM of melatonin was added due to its specific properties in bone formation and stimulation. Melatonin was freshly prepared in 100% ethanol in order to avoid an immediate decomposition, according to the guidelines. The procedure was set up as following described:
  • Group 1: hDPSCs + equine bone block (Ctrl);
  • Group 2: hDPSCs + equine bone block + melatonin (Ctrl + Mel);
  • Group 3: hDPSCs + equine bone block G-N-coated 2 μg/mL (G-N2);
  • Group 4: hDPSCs + equine bone block G-N-coated 2 μg/mL + melatonin (G-N2 + Mel);
  • Group 5: hDPSCs + equine bone block G-N-coated 10 μg/mL (G-N10);
  • Group 6: hDPSCs + equine bone block G-N-coated 10 μg/mL + melatonin (G-N10 + Mel).
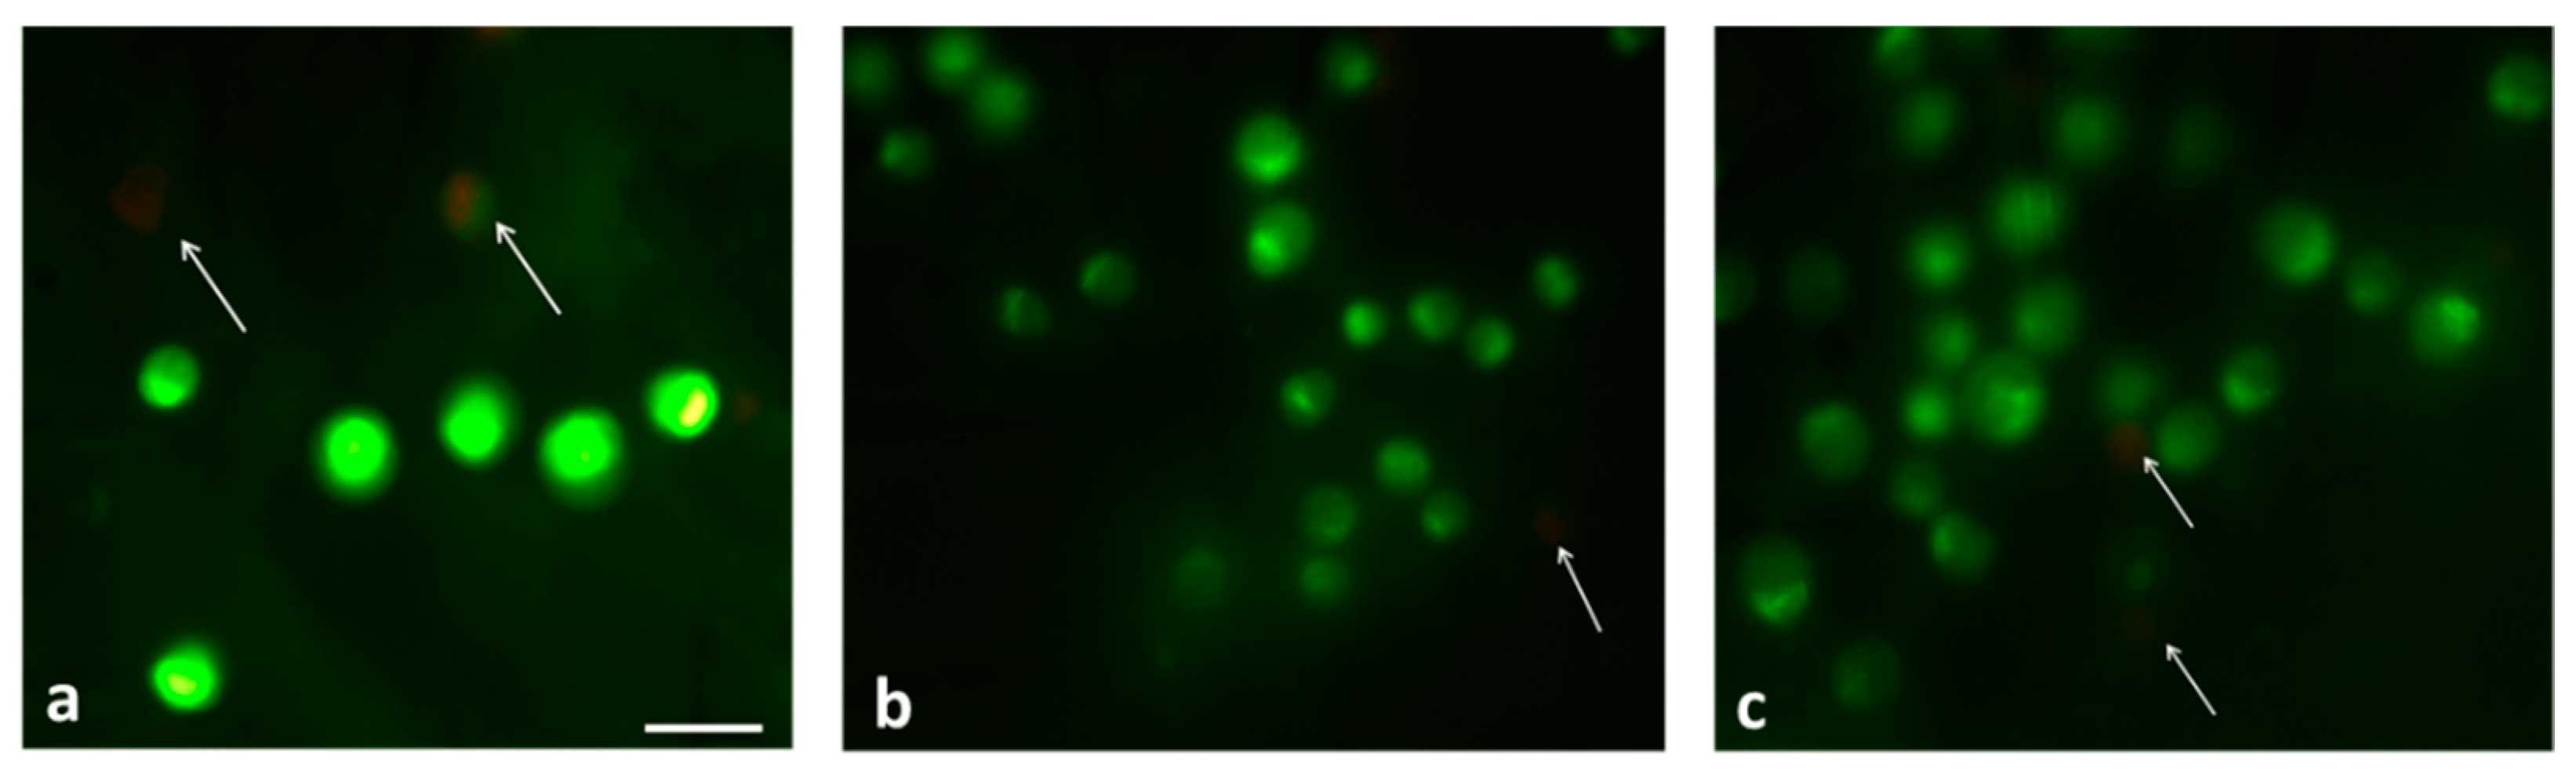
After 7, 14, and 21 days of culture, cells were detached and harvested in order to evaluate miRNAs (miR-133a/b, miR-135a, miR-206, miR-29b, and miR-let-7b) and gene expression of RUNX2 and SMAD5, and osteocalcin levels.

2.4. Live/Dead Test

The evaluation of the hDPSCs’ viability in the presence of G-N2/G-N10 bone blocks was assessed performing the live/dead test (Live/Dead BacLight™, Molecular Probes, Eugene, OR, USA). The test was performed in accordance with the manufacturer’s instructions. This method was based on the use of a mixture of two fluorochromes, SYNTO9 and propidium iodide, emitting fluorescence at two different wavelengths (green and red, respectively). Around 100,000 cells were plated on uncoated and G-N2/G-N10 bone blocks and the day after, 5 μL of the dye mixture (3 μL SYNTO9 and 2 μL propidium iodide) was added to each sample. After 15 min of incubation in the dark, a slide was directly positioned on samples and observed by a fluorescence microscope [38]. If the cell envelope was intact, the passage of only SYNTO9 that linked to the DNA determined a green fluorescence staining (470–550 nm). If the cell membrane was partially damaged, both propidium iodide and SYNTO9 could enter the cell, with a resulting red fluorescence (630–650 nm) [39]. At the end of the assay, 40× photos of uncoated and G-N2/G-N10 bone blocks were acquired.

2.5. RNA Isolation and Quantification

A MiRNeasy Micro kit was used for the total RNA extraction (#217084, Qiagen, Germantown, MD, USA). For each time point and experimental condition, cells were harvested and suspended in 700 μL of QIAzol Lysis Reagent and homogenized by vortexing for 1 min. The tubes containing the homogenate were put on the benchtop at room temperature (15–25 °C) for 5 min. Then 140 μL of chloroform was added to the tubes containing the homogenate and shaken vigorously for 15 s. They were centrifuged for 15 min at 12,000× g at 4 °C and after centrifugation, the sample separates into 3 phases. The upper aqueous phase containing RNA was transferred to a new collection tube and 1.5 volumes of 100% ethanol was added and mixed. Next, 700 μL of the sample was pipetted up into an RNeasy MinElute spin column in a 2-mL collection tube. The samples were centrifugated at ≥10,000 rpm for 15 s at room temperature and the flow through was discarded. The latter step was repeated twice. Then 500 μL of 80% ethanol was put onto the RNeasy MinElute spin column and centrifuged for 2 min at ≥10,000 rpm to wash the spin column membrane. The RNeasy MinElute spin column was placed into a new 2-mL collection tube and centrifuged at full speed for 5 min to dry the membrane. The RNeasy MinElute spin column was placed in a new 1.5-mL collection tube and 14 μL of RNase-free water was added directly to the center of the spin column membrane. To elute the RNA, samples were centrifuged for 1 min at full speed. The RNA concentrations were determined using a spectrophotometric quantification.

2.6. Quantitative Real-Time PCR for MicroRNAs Expression

Retro-transcription was carried out according to the Applied Biosystem’s High Capacity cDNA Reverse Transcription kit, (#4368814, Applied Biosystem, Life Technologies, Monza-Italy). Quantitative real-time PCR was performed using the TaqMan probes and the specific TaqMan Universal Master Mix II, no UNG, in 96-well plates (#4440040, Applied Biosystem, Life Technologies, Monza-Italy) with an Applied Biosystem PRISM 7900 HT Sequence Detection System, in triplicate. MiR-16 was used as the endogenous control. The specific miRNA sequence probes used (Applied Biosystem) were:
-
has-miR-133a (UUUGGUCCCCUUCAACCAGCUG; #002246);
-
has-miR-133b (UUUGGUCCCCUUCAACCAGCUA; #002247);
-
hsa-miR-135a-5p (UAUGGCUUUUUAUUCCUAUGUGA; #000460);
-
hsa-miR-206 (UGGAAUGUAAGGAAGUGUGUGG; #000510);
-
hsa-miR- 29b (CUGGUUUCACAUGGUGGCUUAG; # 002166);
-
hsa-miR-let-7b (UGAGGUAGUAGGUUGUGUGGUU; #002619);
-
hsa-miR-16-5p (UAGCAGCACGUAAAUAUUGGCG; # 000391).
The relative quantification of miRNAs targets was carried out using the ΔCt formula, according to the Ct method. The more values were close to zero, the more they were upregulated. Three independent experiments were performed in triplicates, for each condition and time points.

2.7. Gene Expression Analysis

For cDNA synthesis 1 μg of total RNA was directly processed with High-Capacity cDNA Archive kits (Applied Biosystems), in accordance with the manufacturer’s instructions. Quantitative real-time PCR was carried out for the relative quantification of gene expression of RUNX2 (runt-related transcription factor 2) and SMAD5 (SMAD family member 5), HDAC4, COL5a3 versus glyceraldehyde-3-phosphate dehydrogenase (GAPDH) gene, using TaqMan technology on an ABI Prism 9700ht Sequence Detection System instrument, connected to Sequence Detector Software (SDS, version 2.0) for data collection and analysis.

2.8. Osteocalcin Levels Measurement

Immunoenzymatic assays to quantify the osteocalcin levels were measured in hDPSCs at 14 and 21 days both in the GM and DM of all study groups. The measurement was performed using the Micro Vue Bone Osteocalcin EIA (#8002, Quidel, San Diego, CA, USA) in accordance with the guidelines. Briefly, 1· wash buffer (dilution of 10· wash buffer 1:10 with deionized water) was prepared, and standards and controls with 0.5 mL 1· wash buffer were reconstituted. For the assay procedure, 25 µL of reconstituted standards, controls, and samples were put into assay wells and 125 µL of anti-osteocalcin was added to assay wells. After incubation of 120 ± 10 min at 20–25 °C, enzyme conjugate with 1X wash buffer was prepared, and 150 µL of it was added into assay wells and incubated for 60 ± 5 min at 20–25 °C. Finally, 150 µL of substrate solution was added and incubated for 35–40 min at 20–25 °C. Thus, 150 µL of stop solution was supplemented. Optical density was read at 405 nm; the assay results were analyzed using a 4-parameter curve fit y = (A − D)\(1+(x\C)B) + D. Data were referred to 105 cells.

2.9. Histological Evaluations

After 7 days of culture, a histological analysis was performed to evaluate the cell adhesion. The specimens of the different study groups (Figure 6) were immersed in a fixative solution of 10% buffered formalin at pH 7.2 with 0.1 M of sodium phosphate, for 4 h at room temperature. The specimens were processed to obtain thin ground sections with the Precise 1 Automated System (Assing, Rome, Italy). The specimens were dehydrated in an ascending series of alcohol rinses and embedded in a glycolmethacrylate resin (Techonovit 7200 VLC; Kulzer, Wehrheim, Germany). After polymerization, the specimens were sectioned with a high-precision diamond disc to about 150 mµ and ground down to about 30 mµ with a specially designed grinding machine. The slides were stained with toluidine blue and acid fuchsin. The slides were observed under transmitted light microscopy (Laborlux S, Leitz, Wetzlar, Germany). The histomorphometry was performed using a light microscope (Laborlux S, Leitz, Wetzlar, Germany) connected to a high-resolution video camera (3CCD JVC KYF55B), and interfaced to a monitor and personal computer. This optical system was associated with a digitizing pad (Matrix Vision GmbH) and a histometry software package with image capturing capabilities (Image- Pro Plus 4.5; Media Cybernetics Inc., Milan, Italy).

2.10. Statistical Analysis

The Software StatPlus6 (Analystsoft, Walnut CA, USA) was used for data analysis. Parametrical methods were used after having verified the existence of the required assumptions. The factors under investigation were the time elapsed, the presence of G-N2 and G-N10, and their combination with melatonin for genes and miRNAs expression levels. Data were expressed as means and standard deviation of the recorded values obtained from 3 different experiments. The statistical significance among multiple samples was determined with the one-way ANOVA analysis of variance with Bonferroni’s multiple comparison tests and Tukey’s multiple comparison tests. All statistical tests were performed via GraphPad Prism Software, version 7 (GraphPad Software, La Jolla, CA, USA).

3. Results

3.1. Chemico-Physical Characterization of Ammonia Graphene-Oxide-Coated Collagenated Bone Block

In order to characterize G-N, we performed a UV-VIS spectroscopy analysis, whereas, in order to assess the chemico-physical properties of G-N-coated bone blocks, Raman spectroscopy and thermogravimetric analysis (TGA) were conducted.

3.2. UV-VIS Spectroscopy

If compared with GO spectrum (Figure S1 Supplementary Material, red line), [40] the UV-VIS absorption spectrum of the stable suspension of G-N (Figure S1 Supplementary Material, black line) reveals similar adsorption bands with a slight red shift from 230 to 250 nm, because of the introduction of amine-terminal groups [41].

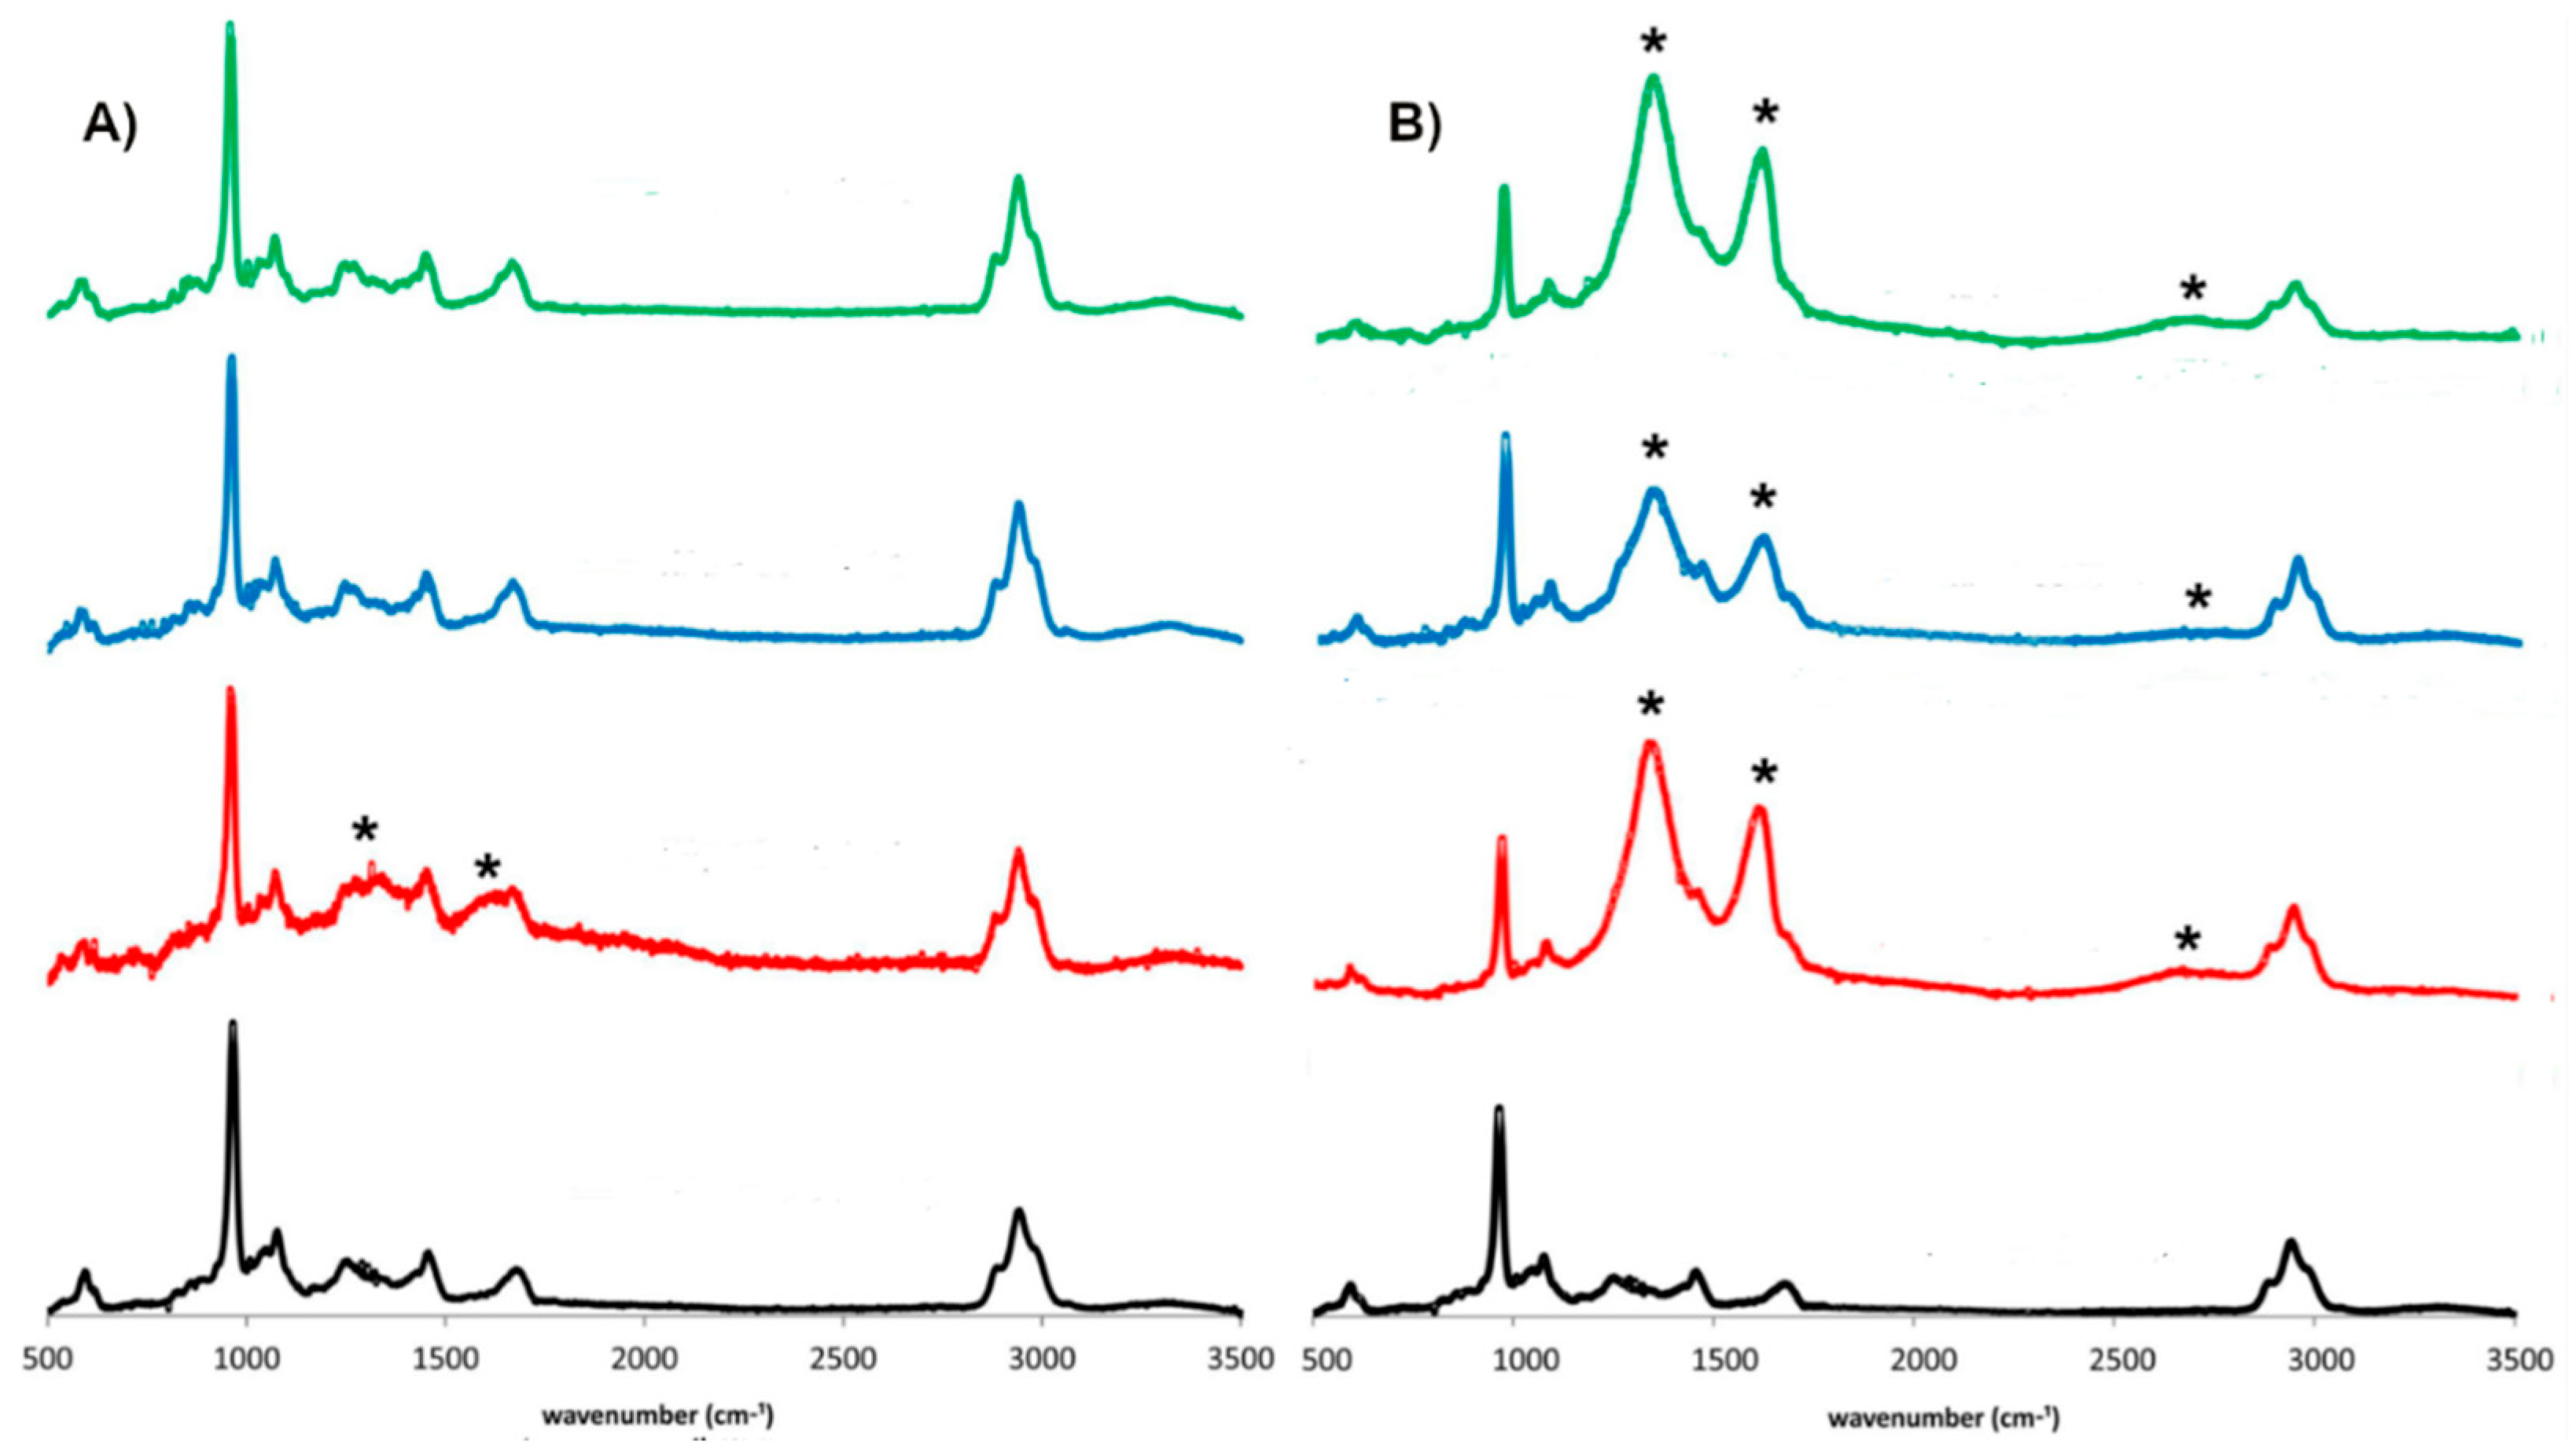
3.3. Raman Spectroscopy
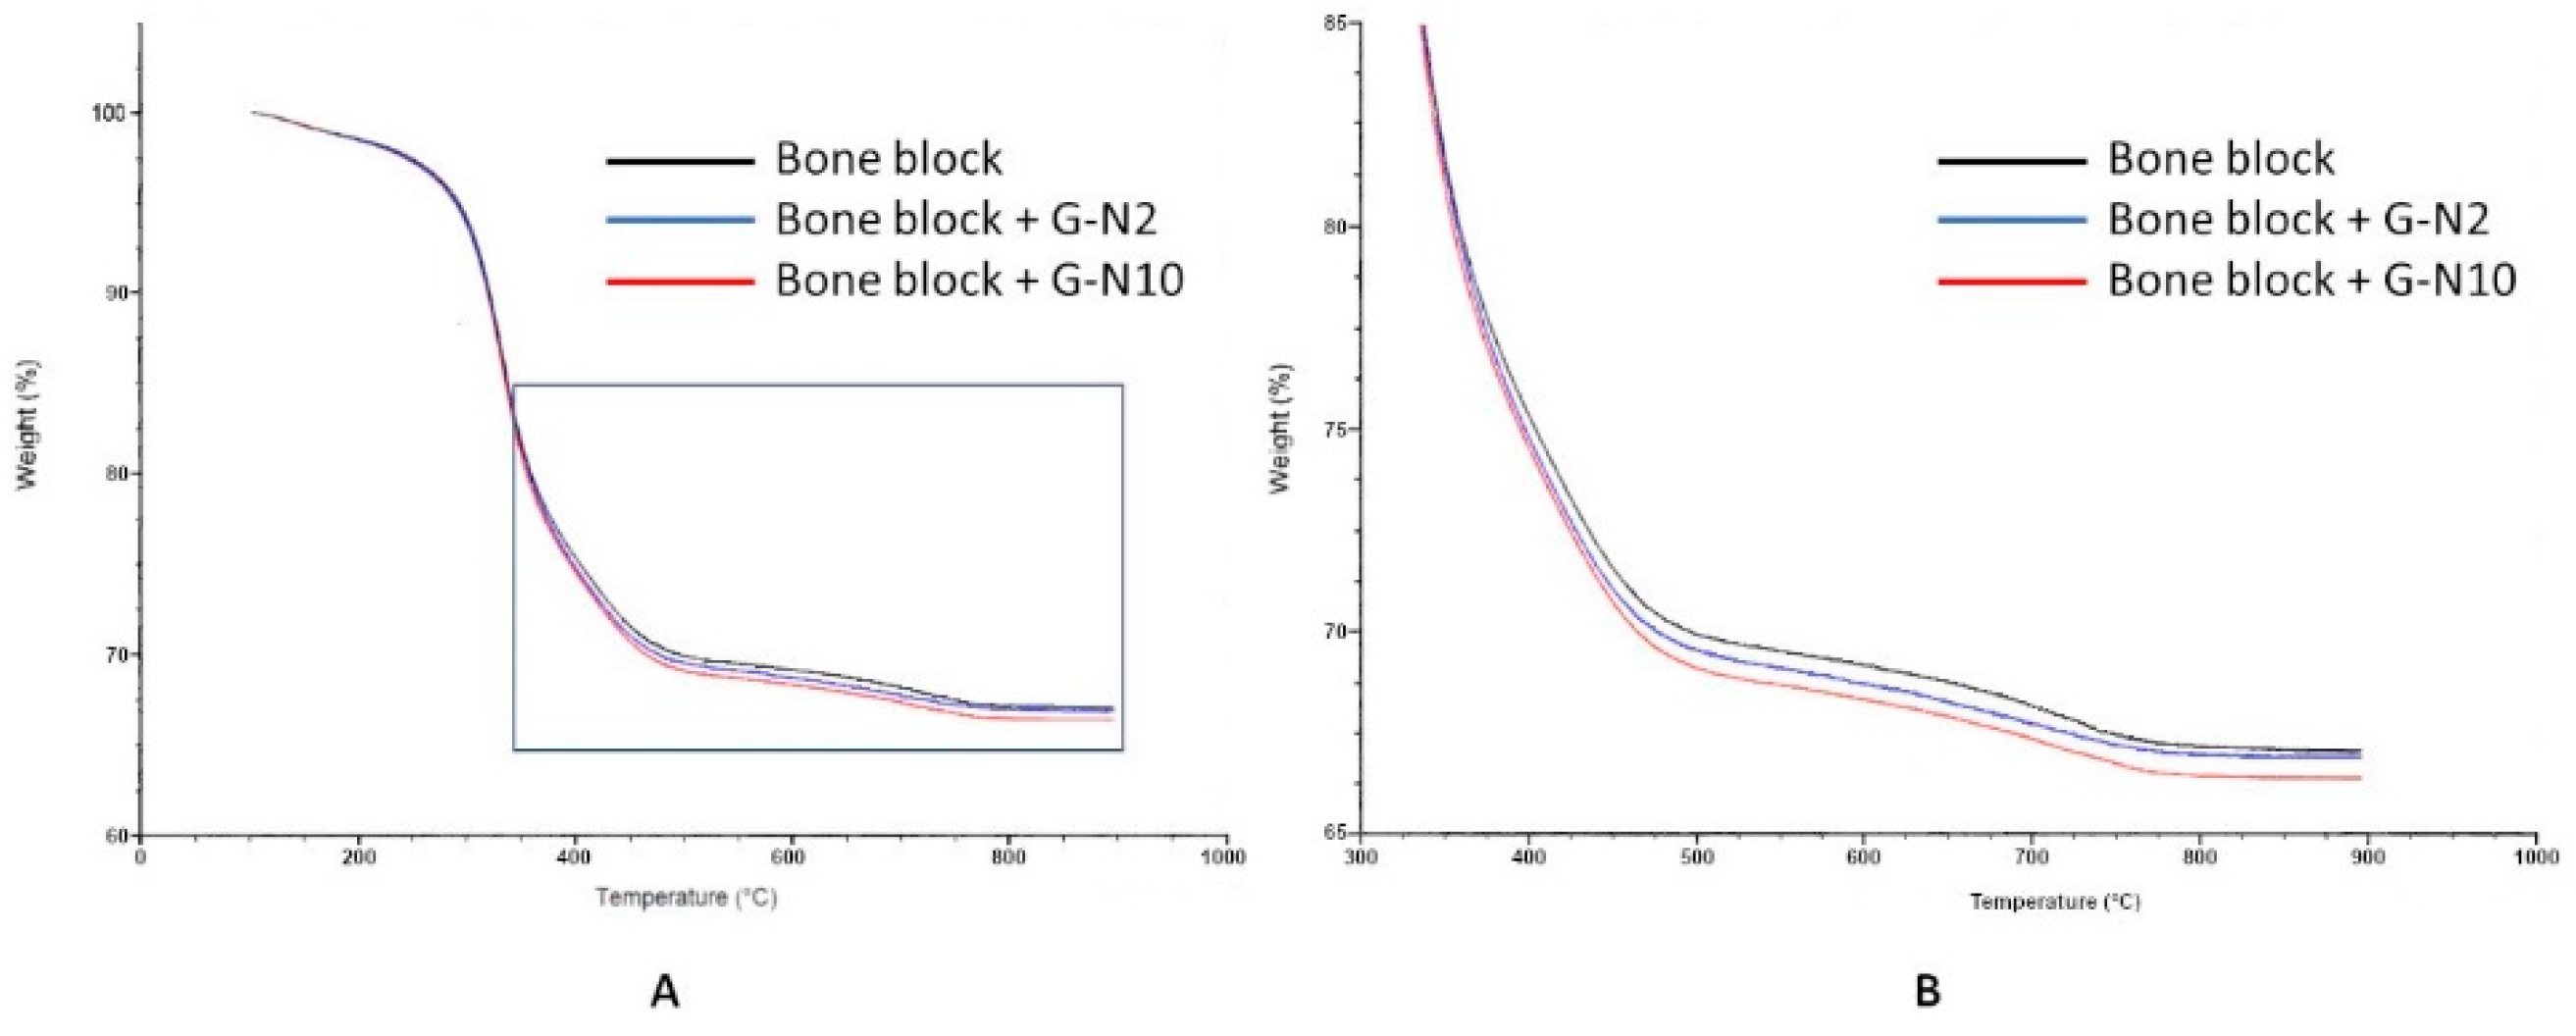
The major bands in Raman spectra of bone tissue correspond to mineral and organic constituents. The mineral part of the spectrum is dominated by the phosphate (PO43−) internal vibration mode at 961 cm−1 and in the range of 587–604 cm−1. The phosphate vibration in the region 1035–1048 cm−1 is not well visible and overlaps with that of carbonate at 1073 and 1103 cm−1. The major bands assigned to the organic components of spongy bone tissue are: 1200–1320 cm−1 (amide III), 1595–1700 cm−1 (amide I), 1400–1470 cm−1, and 2800–3100 cm−1 (bending and stretching modes of C–H groups, respectively) [42]. Most of the peaks in the spectra of the samples are the Raman signatures of hydroxyapatite (black spectra in Figure 2). Due to the low loading of G-N, it was not possible to see by Raman measurements clear evidence of the presence of graphitic material in the bone block treated with the 2-μg/mL G-N solution (G-N2). Only in the red spectrum, relative to a point in the sample, it is possible to find evidence of the presence of graphitic material (marked with *) on the bone block. The sample treated with 10-μg/mL G-N instead shows clearly the presence of graphitic material. Specifically, in the 10 μg/mL G-N-coated bone block (G-N10) the signs of graphitic materials are represented by the three characteristic bands of graphene-oxide: The G band at 1580, the D band at 1350, and the 2690 cm−1 (Figure 2) [43,44].

3.4. TGA Analysis

Thermogravimetric analysis (TGA) was used to quantify the percentage of G-N that coats the bone blocks. TGA shows a progressive decreasing of the sample weight during combustion (Figure 3); the bone block suffered from a weight loss lower than that of the coated bone blocks. By increasing the concentration G-N from 2 to 10 μg/mL, a proportional increase of weight loss has been observed. This trend demonstrates that an increase of the concentration of G-N is connected to the amount of combustible material that coats the bone block. The weight loss in the range from room temperature to 200 °C is due to the evaporation of physisorbed water, while the weight loss between 200 and 500 °C is associated with the decomposition of collagen molecules. The slight loss between 500 and 700 °C, which increased in G-N-coated bone blocks, is the result of the combustion of the residual organic component [45].
Starting from the differences in weight loss of the samples, a preliminary evaluation of the percentage of G-N present in the bone block has been done. The sample treated with the 2-μg/mL G-N solution retained the 0.13% w of G-N, while the sample treated with the 10-μg/mL G-N solution retained the 0.71% w of G-N. Despite these amounts being relatively low, they are well above the sensitivity of the instrument. Three different measurements were performed for each sample.

3.5. Cell Viability Assessment on Blocks

In order to assess the viability of hDPSCs on equine bone blocks and G-N2/G-N10 bone blocks, the live/dead test was performed after 24 h. This test evidenced whether the cell envelope was intact or not by following the treatment with the two fluorochromes, SYNTO9 and propidium iodide. The viable cells were stained in green fluorescence, while dead cells were stained in red fluorescence. As shown in Figure 4, all bone blocks, including the G-N2- (Figure 4b) and G-N10 (Figure 4c)-coated bone blocks, showed cells in wellness and viability.

3.6. Gene Expression

The degree of differentiation was evaluated through the expression of Runx2 and Smad5, key factor transcriptions associated with osteogenic differentiation. For this purpose, real-time PCR analysis was performed for SMAD5 and RUNX2 after 7, 14, and 21 days of culture, in both GM and DM conditions. Data derived from three different experiments (each n = 3) were presented as ΔCt means ± standard deviation (Table 1). The more positive the values, the more the genes were downregulated; the more negative the values, the more they were upregulated.
The hDPSCs cultured after 7 days in GM showed an increase in SMAD5 gene expression in G-N2 + Mel in respect to Ctrl + Mel. After 14 days in GM, no statistically significant differences were found. After 21 days, both G-N2 and G-N10 and G-N2 + Mel, and G-N10 + Mel gave a significant increase in SMAD5 gene expression in respect to Ctrl and Ctrl + Mel, respectively. The hDPSCs cultured after 7 days in DM showed a decreased gene expression of SMAD5 in the presence of coated bone blocks and coated bone blocks with melatonin. Conversely, after 14 days in DM, both coated bone blocks and coated bone blocks with melatonin gave a statistically significant increase of SMAD5. After 21 days, G-N10 gave a significant increase in SMAD5 gene expression in respect to Ctrl while G-N2 + Mel gave a decrease in respect to Ctrl + Mel.
The hDPSCs cultured after 7 days in GM showed a gene expression of RUNX2 that significantly increased in the presence of G-N10 and G-N2 + Mel compared to Ctrl and Ctrl + Mel, respectively. After 14 days, both G-N2 and G-N2 + Mel significantly decreased RUNX2 gene expression while G-N10 + Mel increased it. After 21 days, both G-N and G-N + Melatonin gave a significant increase in RUNX2 gene expression compared to Ctrl and Ctrl + Mel, respectively. In the hDPSCs cultured after 7 days in DM, no statistically significant differences were found in RUNX2 gene expression, while after 14 days both G-N and G-N + Melatonin gave a significant increase in RUNX2 gene expression compared to Ctrl and Ctrl + Mel, respectively. After 21 days in DM the effect of G-N10 + Mel decreased RUNX2 expression in respect to Ctrl + Mel.

3.7. MicroRNAs Expression

The degree of differentiation was evaluated through the expression of miRNAs characterizing the osteogenesis miR-133a and b, miR-135a, miR-206, miR-29b, and miR-let-7b associated with osteogenic differentiation. For this purpose, the expression of miR-133a, miR-133b, miR-135a, miR-206, miR-29b, and miR-let-7b was evaluated after 7, 14, and 21 days of hDPSCs culture in both GM and DM (Table 2).
At 7, 14, and 21 days of culture in both GM and DM, the downregulation of miR-133a in the presence of both G-N2 and G-N10 and in the presence of bone blocks plus melatonin compared to the relevant Ctrl was observed. MiR-133b was strongly downregulated after 7 days of culture in GM in the presence of G-N10 and G-N10 plus melatonin. Moreover, in DM conditions, the presence of G-N10 plus melatonin downregulated miR-133b. At 14 days in both GM and DM, miR-133b expression was regulated among the various conditions in a not statistically significant way. Instead, at 21 days in both GM and DM, miR-133b was downregulated both in the presence of G-N2 and G-N10 plus melatonin compared to Ctrl plus melatonin. The expression of miR-135a at 7 days of culture in GM and DM was downregulated in the presence of G-N2 coating, whereas DM was strongly downregulated in the presence of G-N10 plus melatonin. At 14 days, only in the DM condition was a significant downregulation of miR-135a observed in both G-N2 and G-N10 in the presence or absence of melatonin compared to Ctrl. MiR-206, only at 14 days in GM, was downregulated in the presence of G-N2 and G-N10 in respect to Ctrl. At 7 days, miR-29b was upregulated in GM in the presence of G-N10 and G-N10 plus melatonin, while it was downregulated in the presence of G-N2 plus melatonin. At 7 days in DM, miR-29b was downregulated in the presence of G-N2 and G-N2 plus melatonin, while it continued to be upregulated in the presence of G-N10 plus melatonin compared to Ctrl. At 14 days in GM, miR-29b was upregulated in the presence of G-N2 and G-N10, and remained upregulated in G-N2 plus Melatonin compared to Ctrl. Conversely, in DM, in the presence of G-N10, it was downregulated. At 21 days, miR-29b in the GM condition was downregulated in the presence of both G-N10 and G-N10 plus melatonin, while in the presence of G-N2 it was upregulated. In DM, miR-29b was upregulated in the presence of G-N2 and G-N10 and G-N10 plus melatonin compared to Ctrl. MiR-let-7b strongly increased in the groups treated with G-N10 and G-N10 plus melatonin, mainly at 7 days of both GM and DM culture. At 14 days in DM, in the presence of G-N10 plus melatonin MiR-let-7b was downregulated compared to Ctrl. At 21 days, in both GM and DM, miR-let-7b was strongly upregulated in the presence of G-N2 compared to Ctrl and G-N10 plus melatonin compared to Ctrl + Mel. Moreover, at 21 days in DM, miR-let-7b was found downregulated in G-N2 compared to Ctrl.

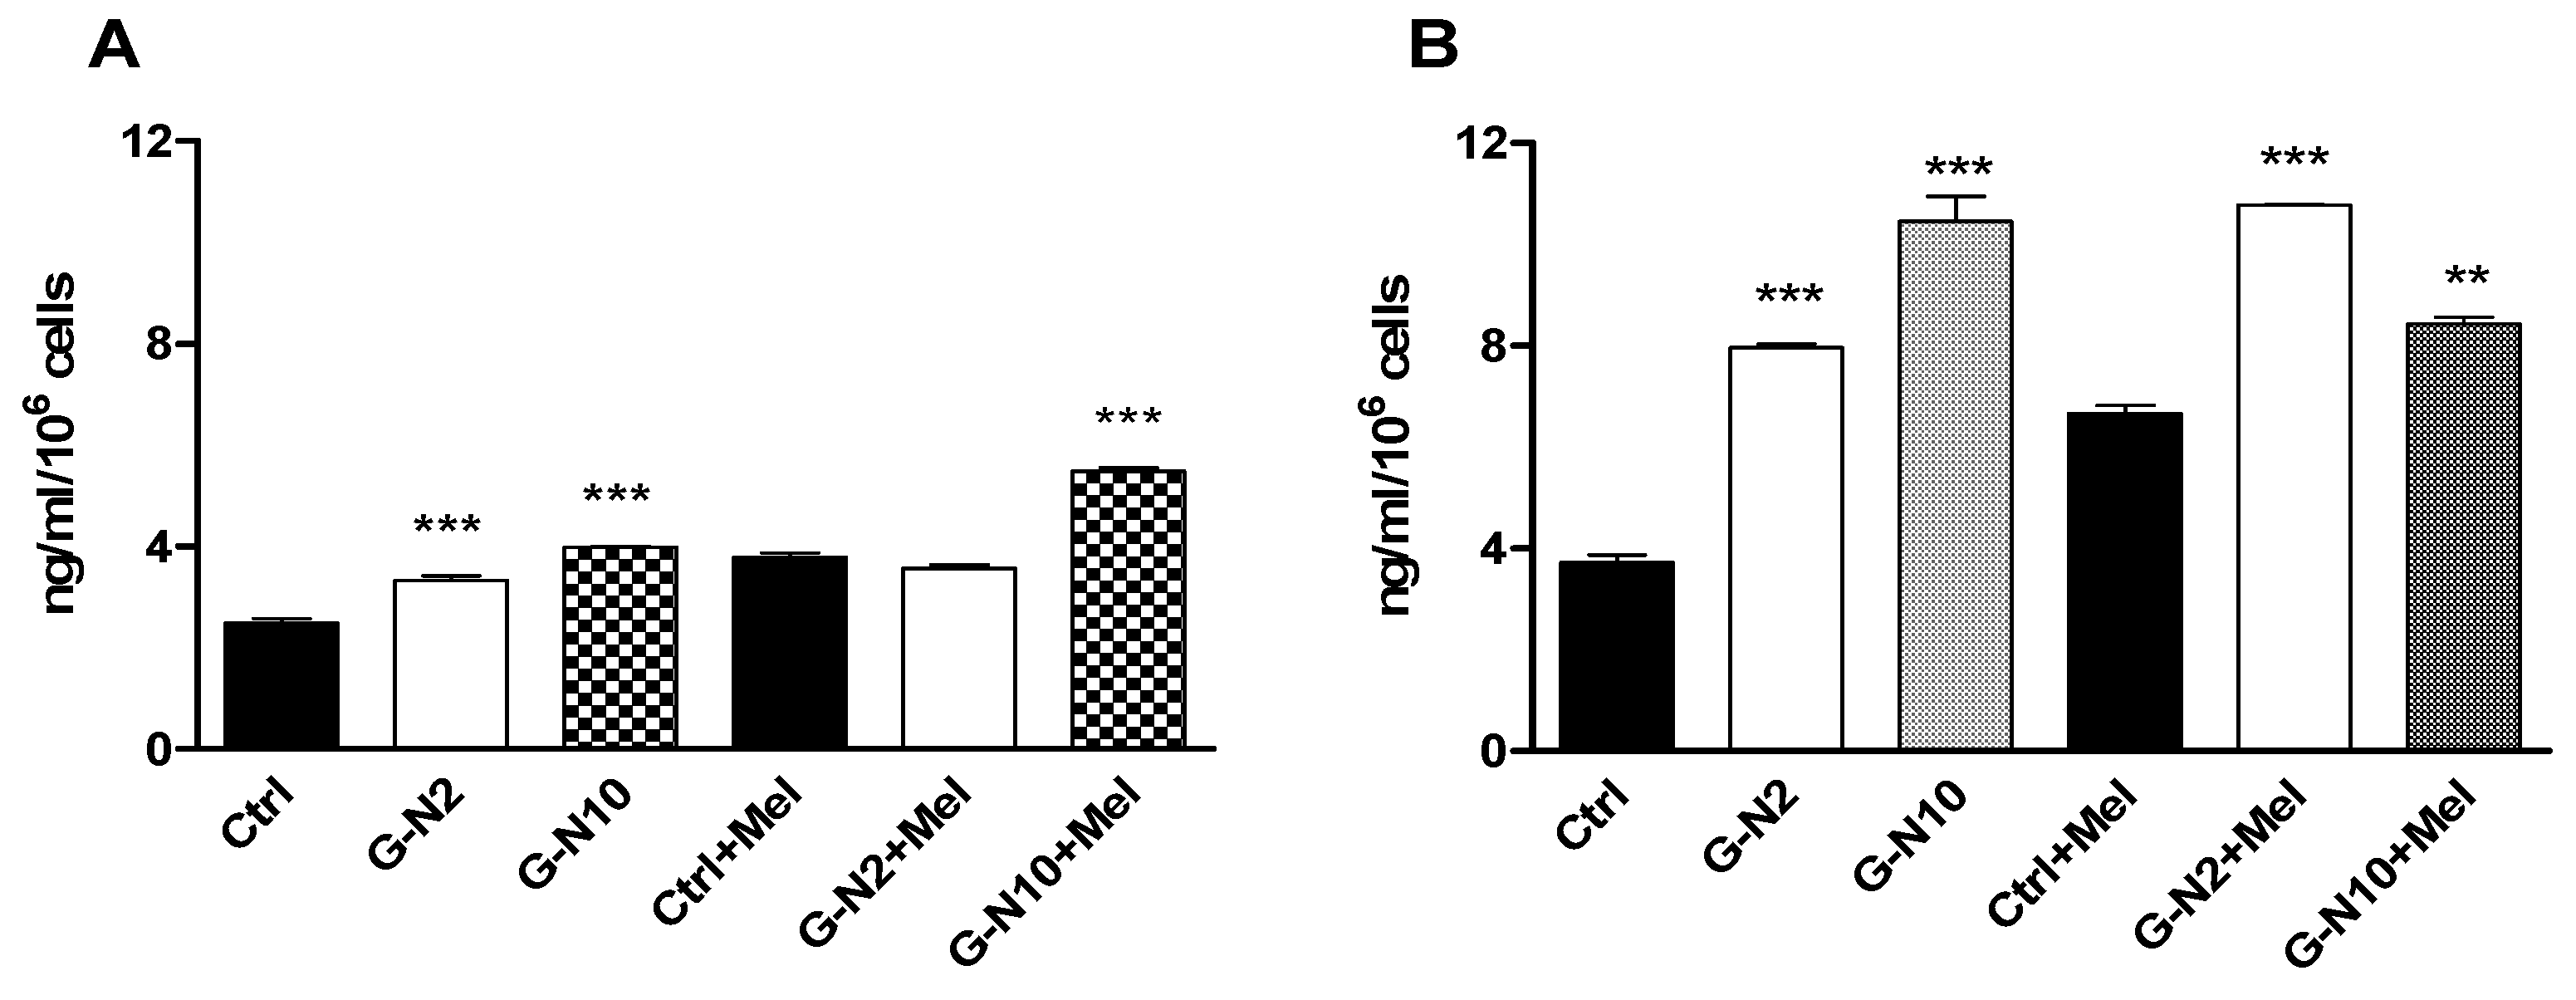
3.8. Osteocalcin Assay

The osteocalcin levels, a late marker of differentiation, were assessed in media after 14 and 21 days of culture in both GM and DM conditions (Figure 5). After 14 days of culture in both GM (panel A) and DM (panel B), hDPSCs showed a statistically significant increase in osteocalcin level in all experimental conditions compared to their respective control conditions (with the exception of G-N2 + Mel in GM). After 21 days of cultivation, osteocalcin levels did not change among the experimental conditions investigated (data not shown).

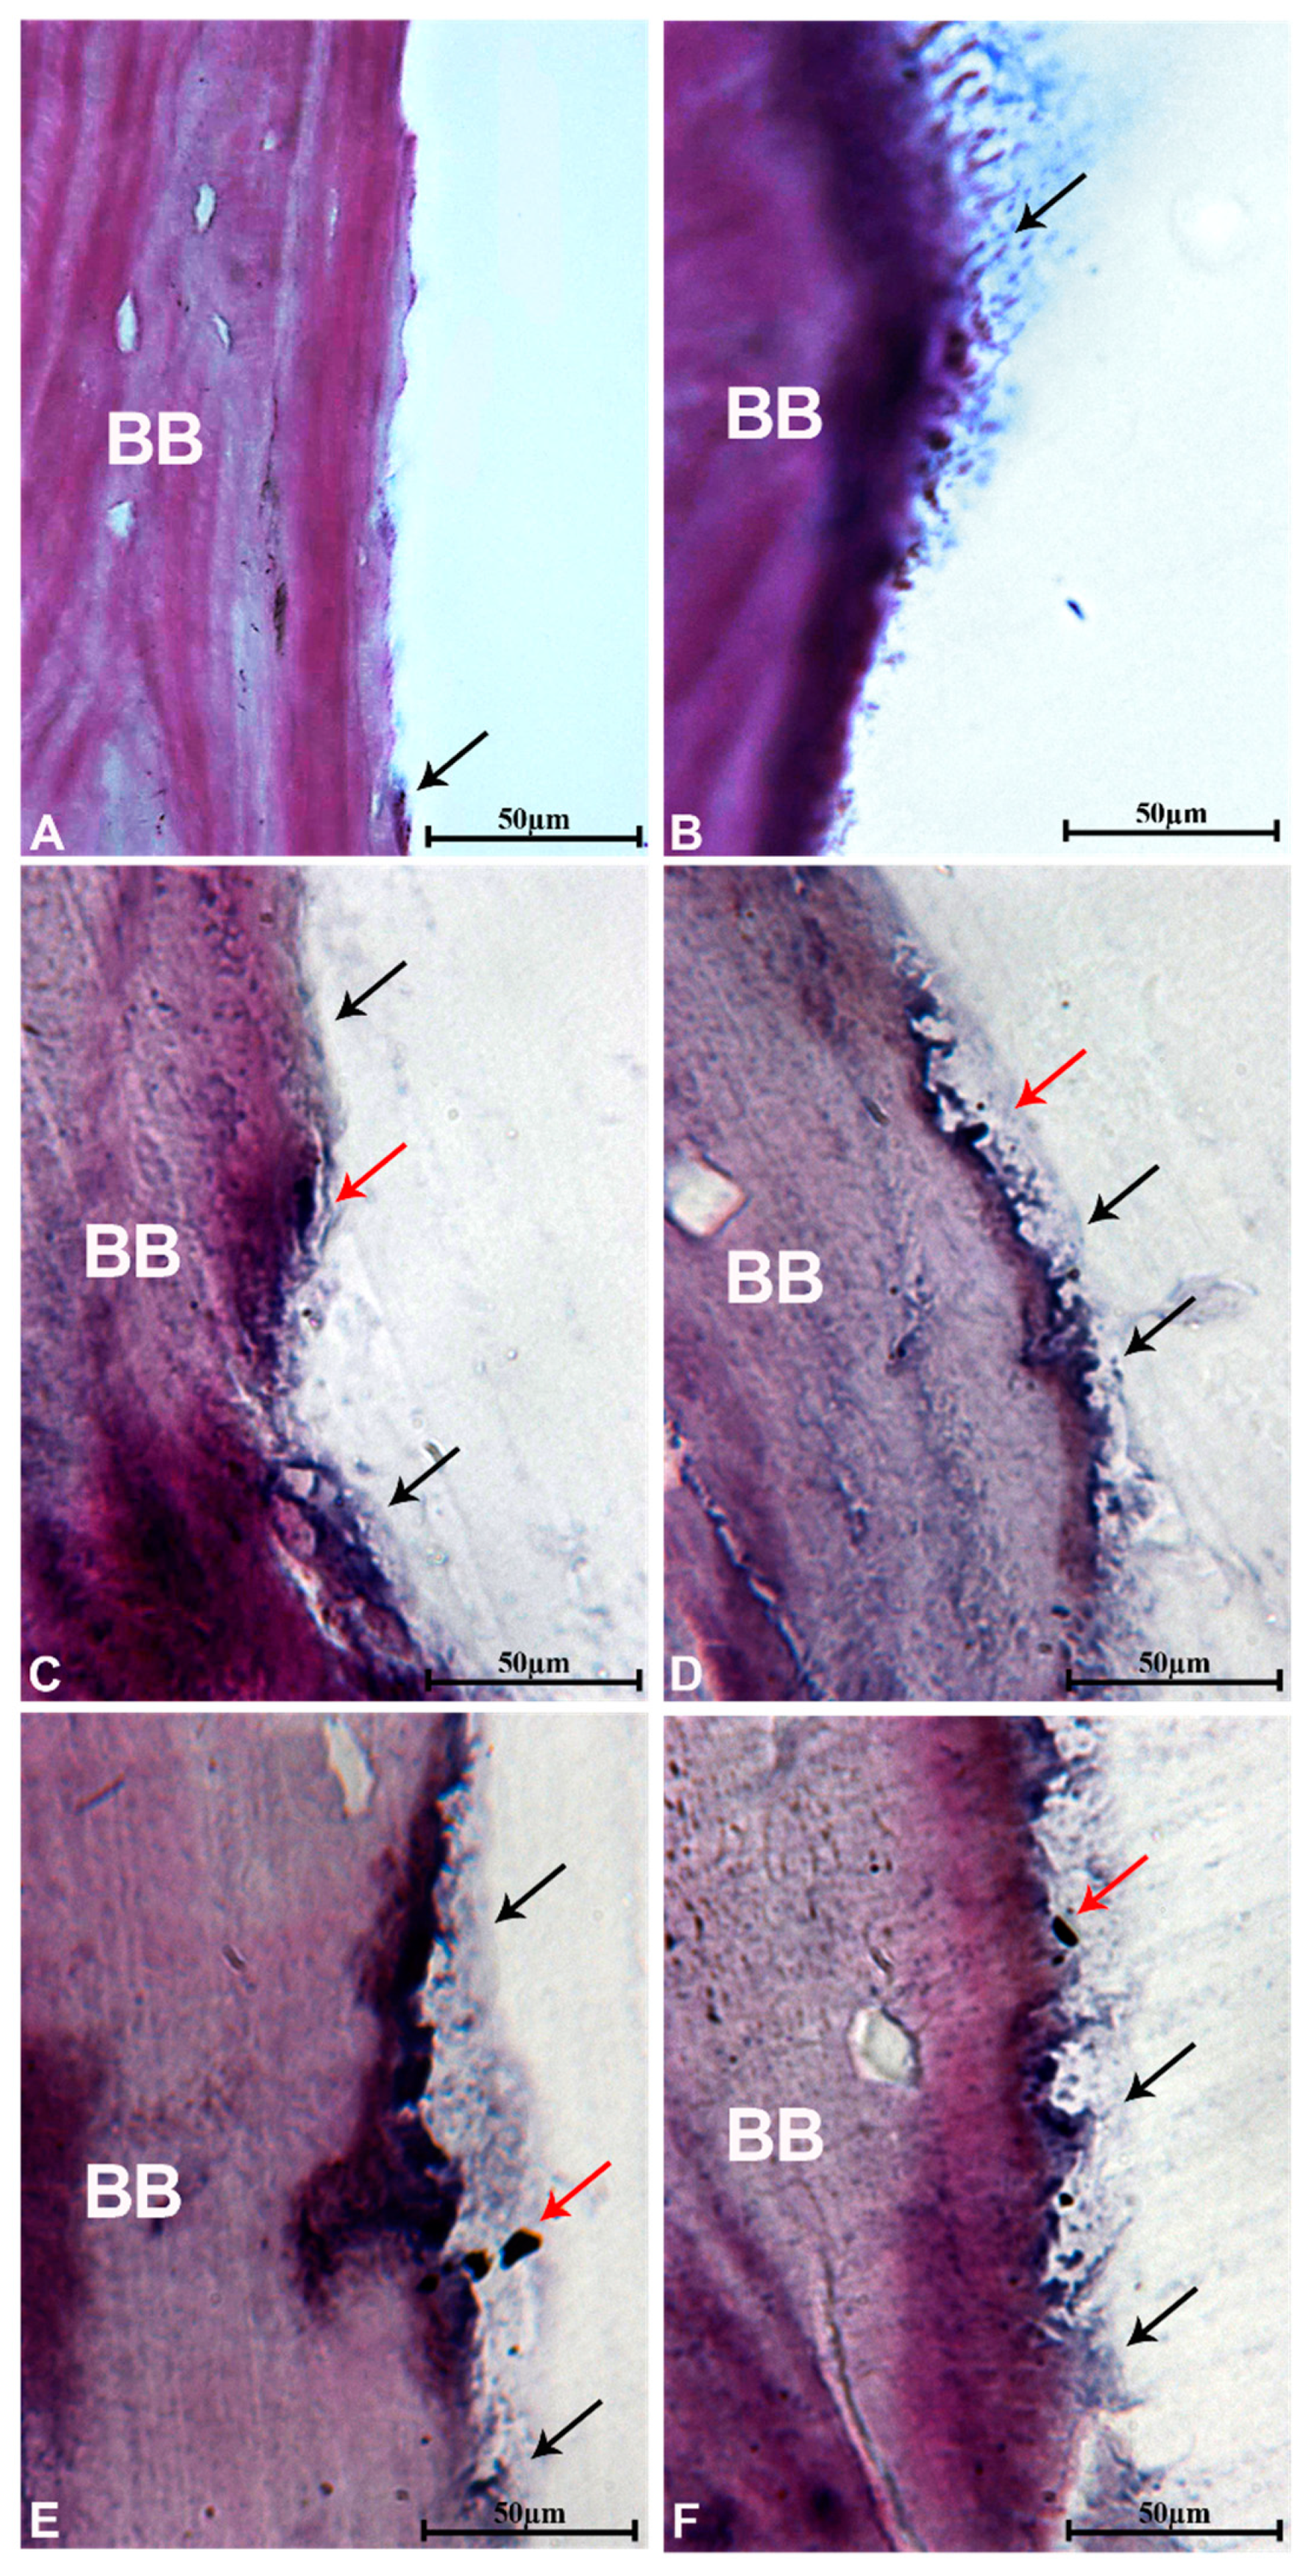
3.9. Histological Evaluation

Histologic section of hDPSCs seeded on the bone blocks without melatonin (Figure 6A) and on the bone blocks with G-N2 (Figure 6C) and G-N10 (Figure 6E) at seven days of culture showed the presence of a thin layer of cells attached to the surface of the bone block in contact with the plastic Petri dish. The block was cut perpendicular to the dish to obtain a clear histological observation of whole sides of the field. A higher quantity of cells was observed on the side in contact with the dish and in the region perpendicular to the dish; a fewer quantity of cells was observed in the upper portion of the block parallel to the plate. (Figure 6A,B). In the groups without melatonin it was possible to observe a discontinuous cell layer.
Histologic section of hDPSCs seeded on the bone block with melatonin (Figure 6B) and on the bone block with G-N2–G-N10 and melatonin (Figure 6D,F) showed a uniform and greater cellular layer. In particular, in the test sample with G-N10 (Figure 6F) it was possible to observe a continuous cell layer.
In all conditions, the addition of melatonin improved cell contact to the biomaterial surface (Figure 6B,D,F) when compared with the respective groups without melatonin (Figure 6A,C,E).
G-N10–G-N2 bone blocks (Figure 6A,C) showed a better contact to the biomaterial surface with the addition of melatonin than in the groups without melatonin (Figure 6D,F).
The cells were observable in all the samples, especially in the G-N10 bone block (Figure 6F) with melatonin where the toluidine blue staining confirmed the presence of cells and their colonization of the bone block.

4. Discussion

Raman and TGA measurements proved the presence of ammonia-functionalized graphene-oxide, G-N, on the equine bone block. In particular, the amount of G-N was directly dependent on the concentration of G-N in the dispersion used for the coating protocol. The coating was demonstrated to be relatively homogenous, especially for the more concentrated sample. Mesenchymal stem cells (MSCs) are multipotent osteogenic stem cells that are induced to differentiate into osteoblasts via BMP signaling [46]. So far, most of the miRNAs characterized in osteogenesis appear to maintain the MSC-state [46], which is lost upon BMP2 signaling [35].
MiR-133 functions by targeting p27 (a cell cycle regulator), Hox10a, and RUNX2, which induces expression of alkaline phosphatase and osteocalcin, and miR-135 targets SMAD5, which activates expression of early osteoblast differentiation markers [35]. p27 is upregulated in response to BMP2, which downregulates miR-133 and miR-135, and SMAD5 together with C/EBPb can bind to RUNX2 and increase its transcriptional activity [47]. RUNX2, along with osteocalcin and b-catenin, is essential for osteoblast formation [46]. It was found out that miR-133a at 7 days in GM is so downregulated that it is not measurable in some experimental points. Indeed, we found that in GM in the presence of G-N10 plus melatonin miR-133a was not expressed, while in G-N2 and G-N10 it was downregulated in these conditions compared to Ctrl. A similar outcome was shown by the miR-133b expression in GM condition, at 7 days, which resulted so strongly downregulated for G-N2 and G-N2 + Mel that it was not detectable in some experimental points, indeed for G-N10 and G-N10 + Mel which is statistically significantly downregulated compared to Ctrl. MiR-135 was highly downregulated in all time point experimental GM/DM conditions in the presence of G-N2 and G-N10. Our results achieved on hDPSCs cultured in DM show the downregulation of miR-133a after 7, 14, and 21 days of hDPSCs. MiR-133b was strongly downregulated after 7 days of culture in GM in the presence of G-N10 plus melatonin. Furthermore, the downregulation seemed to rely on the type of functionalized block with a decreasing expression from equine bone blocks to G-N10 bone blocks. The expression of miR-135a was undetermined at 7 and 14 days of culture in DM in the presence of G-N10 + Mel, but at 21 days we observed a downregulation trend dependent on the presence of both G-N and melatonin. Taken together, these data suggest that the downregulation observed for miR-133a, miR-133b, and miR-135, which normally inhibits osteoblast differentiation, strongly supports the differentiation process through the activation of RUNX2 and SMAD5. Another inhibitor of osteogenesis is miR-206 (also involved in myogenesis), which was highly expressed in the osteoprogenitor cells of the perichondrium and was significantly downregulated on initiation of osteogenesis. Inose and collaborators [47] showed that knockdown of miR-206 in primary mouse osteoblasts was sufficient to induce differentiation, while over-expression of miR-206 inhibited differentiation and affected bone formation rate, leading to decreased bone mass independent of a shift from osteogenesis to myogenesis. As osteogenesis proceeds, more miRNAs are upregulated, with maximal expression peaking during the mineralization stage when non-collagen proteins that facilitate the last step in terminal differentiation are secreted [48].
After 14 days of hDPSCs culture in GM, miR-206 was downregulated in the G-N2- and G-N10-coated bone blocks with and without melatonin compared to Ctrl. At 7 and 21 days, no statistically significant differences in the distinct experimental conditions were underlined. miR-29b also targets HDAC4, which decreases RUNX2 expression via deacetylation [48]. MiR-29b expression was upregulated at 7 and 14 days of hDPSCs GM culture in the presence of G-N10 with and without melatonin compared to Ctrl; while in DM we found an upregulation only for G-N10 plus melatonin compared to Ctrl, at 7 days. At 14 days a statistically significant modulation was not found, except an upregulation for the G-N10 condition without melatonin in the GM condition. Instead at 14 days in DM, mir-29b was downregulated in G-N10 with and without melatonin. Finally, at 21 days of both GM and DM, it was possible to notice a statistically significant upregulation in the presence of G-N2 bone blocks compared to Ctrl. Instead, in DM in the presence of G-N10 plus melatonin, mir-29b was upregulated in G-N10 with melatonin compared to Ctrl. These results suggest that the osteogenic stimulation action of miR-29b could begin later than other miRNAs, as it is a promoter of the later osteogenesis. This latter result could be explained considering that maybe the G-N2 is related to a differentiation caused by the presence of both blocks and melatonin. Conversely, the G-N10 plus melatonin, at 7 and 21 days in DM, drove the cells to a late or terminal differentiation stage. MiR-let-7b in vitro significantly promoted osteogenesis and counteracted adipogenesis of MSCs, by targeting high-mobility group AT-hook 2 (HMGA2) expression. Wei and colleagues [49] detected the dynamic miRNA expression pattern in femurs of mice and found that miR-let-7 is a positive regulator of bone development. Gain and loss of-function analysis showed that miR-let-7 can promote osteogenic differentiation, suppress adipogenesis of human adipose-derived mesenchymal stem cells in vitro, and enhance bone formation in vivo as shown by the detection of expression of RUNX2, BSP, OC, and Col1a1 (late marker of osteogenesis), as well as ALP and OPN (early marker of osteogenesis). Results on miR-let-7b expression on hDPSCs cultured in GM and DM at 7 days demonstrate an increasing upregulation trend in the presence of both bone blocks and melatonin. MiR-let-7b expression at 7 days in GM was statistically significantly upregulated in the presence of both G-N2 and G-N10 conditions compared to Ctrl. At 7 days in DM, in the presence of G-N10 with and without melatonin, miR-let-7b was upregulated compared to Ctrl. At 21 days of hDPSCs culture in both GM and DM, miR-let-7b was statistically significantly upregulated in the presence of the G-N2 bone blocks alone, compared to Ctrl, even if in G-N10 GM condition it was upregulated with melatonin. However, overall, the data collected show an upregulation of miR-let-7b, confirming its role in enhancing the differentiation process of hDPSCs.
The activation of the osteogenic signaling described above was also confirmed in our study by the increased upregulation of SMAD5 and RUNX2 in the presence of G-N-coated equine bone block and melatonin. Similarly, both RUNX2 and SMAD5 were upregulated in the differentiation condition at 14 days while in the growth condition at 21 days. This discrepancy could be due to the lack of the effect of differentiation factors present in differentiation medium. Moreover, it is feasible to suppose a temporal wave of gene expression as the signaling was activated at 14 days, while at 21 days it was extinguished. Noteworthy, the G-N-coated bone block and melatonin seemed to have a similar outcome without an additive effect. This outcome let us suppose that bone blocks and melatonin could lead to a push towards the ostegenic process through RUNX2. The gene expression behavior showed by SMAD5 strengthened the hypothesis of an osteogenic process mediated by RUNX2 which targeted SMAD5 downstream.
Osteocalcin, representing a late-stage marker of differentiation, was assessed. Our data showed that after 14 days of culture osteocalcin levels were significantly increased both in the presence of G-N and G-N plus melatonin both in growth and differentiation conditions. This outcome clearly confirms that the presence of the bone block or melatonin are a key factor for pushing hDPSCs towards the differentiation process. The histological analysis was performed through a specific technique able to provide a section of the hard tissues, metals, or non-demineralized tissues, and polymerized with methacrylate resin [50]. This approach is able to provide a descriptive evaluation based on the evident contact of the cell with the surface of the biomaterial [50]. This technique took advantage of the absence of the composition alteration of the biomaterial and its original structure [50]. The histological sections of the samples revealed the cellular proliferation features of the hDPSC seeded on equine scaffolding. At 7 days, the early contact to the biomaterial surface of hDPSC in the presence of both bone blocks and bone blocks plus melatonin was observed, demonstrating that one of the first important stages of the osteoconduction occurred. Moreover, the histological evidence that the hDPSCs engrafted with the bone block demonstrates that this scaffold was highly biocompatible and osteogenic. The heterogeneity of scaffold surface and composition is a constant characteristic of all xenografts and biomaterials, while the role of the scaffold system is to mimic the tissue organization of the native bone interface [51,52]. In fact, this biomimetic characteristic reflects the morpho-structural and anatomical properties of the native host bone, and it is described in literature as more effective to improve the new bone formation in osteochondral and bone defects [53,54,55]. The functionalization of biomimetic hybrid biomaterials and membranes through non-covalent graphene-oxide and bioactive molecules was previously described [27,29,40], while this approach was effective to obtain a biological and mechanical enhancement of the scaffold with no chemical and thermal alteration of the complexes [27,40]. In confirmation of a previous study [27], no graphene-oxide dispersion was reported in the in the bulk solution.
In all conditions of the present investigation, the addition of melatonin improved the cell contact to the biomaterial surface when compared with the relevant groups without melatonin. G-N2 and G-N10 showed a better contact to the scaffold surface with the addition of Melatonin than in the groups without melatonin. These data suggested that equine bone blocks coated with G-N2 and G-N10 and melatonin promoted the osteogenic process.

5. Conclusions

hDPSCs, equine bone blocks, ammonia-functionalized graphene-oxide, and melatonin seemed to represent a promising useful tool in bone regeneration. The present data seemed to suggest that the bone blocks, synergized by the simultaneous presence of a little investigated graphene-oxide derivative, such as ammonia-functionalized graphene-oxide and melatonin, stimulated the early stages of cell differentiation. The obtained results demonstrated that microRNAs play a pivotal role in the differentiation of mesenchymal stem cells in an osteogenic pattern, regulating the expression of fundamental transcription factors for bone regeneration. The present research clearly showed that equine bone blocks and melatonin have a positive effect on hDPSC differentiation. Data obtained by RUNX2 and SMAD5 gene expression, along with miRNAs results, seem to suggest that the two components do not have an additive effect, but probably melatonin acts on a previous stage compared to bone blocks on the same pathway. In conclusion, the already effective nature of equine scaffolding in enhancing the osteogenic process on hDPSC is greatly improved due to the presence of a scarcely studied ammonia-functionalized graphene-oxide and the positive role of melatonin.

Supplementary Materials

The following are available online at https://0-www-mdpi-com.brum.beds.ac.uk/article/10.3390/app11073218/s1, Figure S1: Normalized UV-VIS spectra of GO (red line) and ammonia-functionalized graphene, G-N (black line).

Author Contributions

Conceptualization, M.T., S.F., and A.P.; methodology, M.M., R.M., E.S.D.F., S.F., G.I., and S.G.; software, R.M., E.S.D.F., S.F., and G.I.; validation, R.M., E.S.D.F., S.F., G.I., V.E., M.M., and M.B.; resources, M.T., A.P., and S.F.; writing—original draft preparation, R.M. and E.S.D.F.; writing—review and editing, S.G., A.F., and S.F.; supervision, S.G., A.F., and S.F.; funding acquisition, S.F. and A.P. All authors have read and agreed to the published version of the manuscript.

Funding

This research was funded by University “G. d’Annunzio” of Chieti-Pescara local research grants to A.P. and S.F., and was carried out with the financial support from the University “G. d’Annunzio” of Chieti-Pescara and MIUR (FAR 2017, 2018 and 2019) to A.F.

Institutional Review Board Statement

Human DPSCs were kindly donated to us for this study by Prof Papaccio. The hDPSCs were extracted from third molar teeth and characterized at the Department of Experimental Medicine, Section of Histology and Embryology, Second University of Naples (Naples, Italy). The utilization of dental pulps was approved by the Internal Ethical Committee (Second University Ethical Committee).

Informed Consent Statement

Not applicable.

Data Availability Statement

The data reported in the manuscript related to support the findings of this study are available from the corresponding author upon request.

Acknowledgments

The authors would like to acknowledge Professor Gianpaolo Papaccio, Department of Experimental Medicine, Section of Histology and Embryology, Second University of Naples (Naples, Italy), and his research group, for the extraction and characterization of the stem cells which were used in the present study. Furthermore, the authors thank the company Tecnoss s.r.l. (Giaveno- Italy) for kindly donating the OsteoBiol Sp Blocks used in this study.

Conflicts of Interest

The authors declare no conflict of interest.

References

  1. Drosse, I.; Volkmer, E.; Capanna, R.; Biase, P.D.; Mutschler, W.; Schieker, M. Tissue Engineering for Bone Defect Healing: An Update on a Multi-Component Approach. Injury 2008, 39, S9–S20. [Google Scholar] [CrossRef]
  2. Cassetta, M.; Perrotti, V.; Calasso, S.; Piattelli, A.; Sinjari, B.; Iezzi, G. Bone Formation in Sinus Augmentation Procedures Using Autologous Bone, Porcine Bone, and a 50:50 Mixture: A Human Clinical and Histological Evaluation at 2 Months. Clin. Oral Implant Res. 2015, 26, 1180–1184. [Google Scholar] [CrossRef]
  3. Becker, W.; Urist, M.; Becker, B.E.; Jackson, W.; Party, D.A.; Bartold, M.; Vincenzzi, G.; De Georges, D.; Niederwanger, M. Clinical and Histologic Observations of Sites Implanted with Intraoral Autologous Bone Grafts or Allografts. 15 Human Case Reports. J. Periodontol. 1996, 67, 1025–1033. [Google Scholar] [CrossRef]
  4. Albrektsson, T.; Johansson, C. Osteoinduction, Osteoconduction and Osseointegration. Eur. Spine J. 2001, 10, S96–S101. [Google Scholar]
  5. Sculean, A.; Nikolidakis, D.; Nikou, G.; Ivanovic, A.; Chapple, I.L.C.; Stavropoulos, A. Biomaterials for Promoting Periodontal Regeneration in Human Intrabony Defects: A Systematic Review. Periodontology 2000 2015, 68, 182–216. [Google Scholar] [CrossRef]
  6. Kim, Y.-K.; Yun, P.-Y.; Kim, S.-G.; Lim, S.-C. Analysis of the Healing Process in Sinus Bone Grafting Using Various Grafting Materials. Oral Surg. Oral Med. Oral Pathol. Oral Radiol. Endodontol. 2009, 107, 204–211. [Google Scholar] [CrossRef] [PubMed]
  7. Jakoi, A.M.; Iorio, J.A.; Cahill, P.J. Autologous Bone Graft Harvesting: A Review of Grafts and Surgical Techniques. Musculoskelet. Surg. 2015, 99, 171–178. [Google Scholar] [CrossRef] [PubMed]
  8. Iaculli, F.; Di Filippo, E.S.; Piattelli, A.; Mancinelli, R.; Fulle, S. Dental Pulp Stem Cells Grown on Dental Implant Titanium Surfaces: An in Vitro Evaluation of Differentiation and MicroRNAs Expression. J. Biomed. Mater. Res. Part B Appl. Biomater. 2017, 105, 953–965. [Google Scholar] [CrossRef] [PubMed]
  9. Motamedian, S.R.; Tabatabaei, F.S.; Akhlaghi, F.; Torshabi, M.; Gholamin, P.; Khojasteh, A. Response of Dental Pulp Stem Cells to Synthetic, Allograft, and Xenograft Bone Scaffolds. Int. J. Periodontics Restor. Dent. 2017, 37, 49–59. [Google Scholar] [CrossRef] [Green Version]
  10. Graziano, A.; d’Aquino, R.; Laino, G.; Papaccio, G. Dental Pulp Stem Cells: A Promising Tool for Bone Regeneration. Stem Cell Rev. 2008, 4, 21–26. [Google Scholar] [CrossRef] [Green Version]
  11. Del Fabbro, M.; Testori, T.; Francetti, L.; Weinstein, R. Systematic Review of Survival Rates for Implants Placed in the Grafted Maxillary Sinus. J. Prosthet. Dent. 2005, 94, 266. [Google Scholar] [CrossRef]
  12. Tumedei, M.; Savadori, P.; Del Fabbro, M. Synthetic Blocks for Bone Regeneration: A Systematic Review and Meta-Analysis. Int. J. Mol. Sci. 2019, 20, 4221. [Google Scholar] [CrossRef] [PubMed] [Green Version]
  13. Scarano, A.; Degidi, M.; Iezzi, G.; Pecora, G.; Piattelli, M.; Orsini, G.; Caputi, S.; Perrotti, V.; Mangano, C.; Piattelli, A. Maxillary Sinus Augmentation with Different Biomaterials: A Comparative Histologic and Histomorphometric Study in Man. Implant Dent. 2006, 15, 197–207. [Google Scholar] [CrossRef] [PubMed]
  14. Hasan, A.; Byambaa, B.; Morshed, M.; Cheikh, M.I.; Shakoor, R.A.; Mustafy, T.; Marei, H.E. Advances in Osteobiologic Materials for Bone Substitutes. J. Tissue Eng. Regen. Med. 2018, 12, 1448–1468. [Google Scholar] [CrossRef] [PubMed]
  15. Tetè, S.; Zizzari, V.L.; Vinci, R.; Zara, S.; Di Tore, U.; Manica, M.; Cataldi, A.; Mortellaro, C.; Piattelli, A.; Gherlone, E. Equine and Porcine Bone Substitutes in Maxillary Sinus Augmentation: A Histological and Immunohistochemical Analysis of VEGF Expression. J. Craniofac. Surg. 2014, 25, 835–839. [Google Scholar] [CrossRef]
  16. Felice, P.; Piana, L.; Checchi, L.; Corvino, V.; Nannmark, U.; Piattelli, M. Vertical Ridge Augmentation of an Atrophic Posterior Mandible with an Inlay Technique and Cancellous Equine Bone Block: A Case Report. Int. J. Periodontics Restor. Dent. 2013, 33, 159–166. [Google Scholar] [CrossRef]
  17. Barone, A.; Toti, P.; Menchini-Fabris, G.-B.; Felice, P.; Marchionni, S.; Covani, U. Early Volumetric Changes after Vertical Augmentation of the Atrophic Posterior Mandible with Interpositional Block Graft versus Onlay Bone Graft: A Retrospective Radiological Study. J. Cranio-Maxillofac. Surg. 2017, 45, 1438–1447. [Google Scholar] [CrossRef]
  18. Orsini, G.; Scarano, A.; Piattelli, M.; Piccirilli, M.; Caputi, S.; Piattelli, A. Histologic and Ultrastructural Analysis of Regenerated Bone in Maxillary Sinus Augmentation Using a Porcine Bone–Derived Biomaterial. J. Periodontol. 2006, 77, 1984–1990. [Google Scholar] [CrossRef]
  19. Scarano, A.; Carinci, F.; Assenza, B.; Piattelli, M.; Murmura, G.; Piattelli, A. Vertical Ridge Augmentation of Atrophic Posterior Mandible Using an Inlay Technique with a Xenograft without Miniscrews and Miniplates: Case Series: Vertical Ridge Augmentation of Atrophic Posterior Mandible. Clin. Oral Implant. Res. 2011, 22, 1125–1130. [Google Scholar] [CrossRef]
  20. Tumedei, M.; Mancinelli, R.; Di Filippo, E.S.; Marrone, M.; Iezzi, G.; Piattelli, A.; Fulle, S. Osteogenic Potential of Human Dental Pulp Stem Cells Co-Cultured with Equine Bone Substitute Combined with Melatonin. Int. J. Periodontics Restor. Dent. 2021. accepted. [Google Scholar]
  21. Roth, J.A.; Kim, B.-G.; Lin, W.-L.; Cho, M.-I. Melatonin Promotes Osteoblast Differentiation and Bone Formation. J. Biol. Chem. 1999, 274, 22041–22047. [Google Scholar] [CrossRef] [PubMed] [Green Version]
  22. Allegra, M.; Reiter, R.J.; Tan, D.-X.; Gentile, C.; Tesoriere, L.; Livrea, M.A. The Chemistry of Melatonin’s Interaction with Reactive Species: Melatonin, a Radical Scavenger. J. Pineal Res. 2003, 34, 1–10. [Google Scholar] [CrossRef] [PubMed]
  23. Sethi, S.; Radio, N.M.; Kotlarczyk, M.P.; Chen, C.-T.; Wei, Y.-H.; Jockers, R.; Witt-Enderby, P.A. Determination of the Minimal Melatonin Exposure Required to Induce Osteoblast Differentiation from Human Mesenchymal Stem Cells and These Effects on Downstream Signaling Pathways: Chronic Melatonin Induces Osteoblast Formation. J. Pineal Res. 2010, 49, 222–238. [Google Scholar] [CrossRef]
  24. Gómez-Moreno, G.; Aguilar-Salvatierra, A.; Boquete-Castro, A.; Guardia, J.; Piattelli, A.; Perrotti, V.; Delgado-Ruiz, R.A.; Calvo-Guirado, J.L. Outcomes of Topical Applications of Melatonin in Implant Dentistry: A Systematic Review. Implant Dent. 2015, 24, 25–30. [Google Scholar] [CrossRef]
  25. Calvo-Guirado, J.L.; Gómez-Moreno, G.; Barone, A.; Cutando, A.; Alcaraz-Baños, M.; Chiva, F.; López-Marí, L.; Guardia, J. Melatonin plus Porcine Bone on Discrete Calcium Deposit Implant Surface Stimulates Osteointegration in Dental Implants. J. Pineal Res. 2009, 47, 164–172. [Google Scholar] [CrossRef]
  26. Maria, S.; Witt-Enderby, P.A. Melatonin Effects on Bone: Potential Use for the Prevention and Treatment for Osteopenia, Osteoporosis, and Periodontal Disease and for Use in Bone-Grafting Procedures. J. Pineal Res. 2014, 56, 115–125. [Google Scholar] [CrossRef] [PubMed]
  27. De Marco, P.; Zara, S.; De Colli, M.; Radunovic, M.; Lazović, V.; Ettorre, V.; Di Crescenzo, A.; Piattelli, A.; Cataldi, A.; Fontana, A. Graphene Oxide Improves the Biocompatibility of Collagen Membranes in an in Vitro Model of Human Primary Gingival Fibroblasts. Biomed. Mater. 2017, 12, 055005. [Google Scholar] [CrossRef] [PubMed]
  28. Guazzo, R.; Gardin, C.; Bellin, G.; Sbricoli, L.; Ferroni, L.; Ludovichetti, F.S.; Piattelli, A.; Antoniac, I.; Bressan, E.; Zavan, B. Graphene-Based Nanomaterials for Tissue Engineering in the Dental Field. Nanomaterials 2018, 8, 349. [Google Scholar] [CrossRef] [PubMed] [Green Version]
  29. Radunovic, M.; De Colli, M.; De Marco, P.; Di Nisio, C.; Fontana, A.; Piattelli, A.; Cataldi, A.; Zara, S. Graphene Oxide Enrichment of Collagen Membranes Improves DPSCs Differentiation and Controls Inflammation Occurrence. J. Biomed. Mater. Res. A 2017, 105, 2312–2320. [Google Scholar] [CrossRef] [PubMed]
  30. Tahriri, M.; Del Monico, M.; Moghanian, A.; Tavakkoli Yaraki, M.; Torres, R.; Yadegari, A.; Tayebi, L. Graphene and Its Derivatives: Opportunities and Challenges in Dentistry. Mater. Sci. Eng. C Mater. Biol. Appl. 2019, 102, 171–185. [Google Scholar] [CrossRef]
  31. Jing, D.; Hao, J.; Shen, Y.; Tang, G.; Li, M.-L.; Huang, S.-H.; Zhao, Z.-H. The Role of MicroRNAs in Bone Remodeling. Int. J. Oral Sci. 2015, 7, 131–143. [Google Scholar] [CrossRef] [Green Version]
  32. Harada, S.; Rodan, G.A. Control of Osteoblast Function and Regulation of Bone Mass. Nature 2003, 423, 349–355. [Google Scholar] [CrossRef] [PubMed]
  33. Lian, J.B.; Stein, G.S.; Javed, A.; van Wijnen, A.J.; Stein, J.L.; Montecino, M.; Hassan, M.Q.; Gaur, T.; Lengner, C.J.; Young, D.W. Networks and Hubs for the Transcriptional Control of Osteoblastogenesis. Rev. Endocr. Metab. Disord. 2006, 7, 1–16. [Google Scholar] [CrossRef] [PubMed]
  34. Shookhoof, J.M.; Gallicano, G.A. The Emerging Role of microRNAs in Adult Stem Cells; Stem Cell Biology and Regenerative Medicine; Phinney, D.G., Ed.; Springer: Cham, Switzerland, 2011. [Google Scholar]
  35. Li, Z.; Hassan, M.Q.; Volinia, S.; van Wijnen, A.J.; Stein, J.L.; Croce, C.M.; Lian, J.B.; Stein, G.S. A MicroRNA Signature for a BMP2-Induced Osteoblast Lineage Commitment Program. Proc. Natl. Acad. Sci. USA 2008, 105, 13906–13911. [Google Scholar] [CrossRef] [PubMed] [Green Version]
  36. Zhang, Y.; Xie, R.L.; Croce, C.M.; Stein, J.L.; Lian, J.B.; van Wijnen, A.J.; Stein, G.S. A Program of MicroRNAs Controls Osteogenic Lineage Progression by Targeting Transcription Factor Runx2. Proc. Natl. Acad. Sci. USA 2011, 108, 9863–9868. [Google Scholar] [CrossRef] [Green Version]
  37. Sharma, R.; Kapusetti, G.; Bhong, S.Y.; Roy, P.; Singh, S.K.; Singh, S.; Balavigneswaran, C.K.; Mahato, K.K.; Ray, B.; Maiti, P.; et al. Osteoconductive Amine-Functionalized Graphene–Poly(Methyl Methacrylate) Bone Cement Composite with Controlled Exothermic Polymerization. Bioconjug. Chem. 2017, 28, 2254–2265. [Google Scholar] [CrossRef] [PubMed]
  38. Boaretti, M.; Castellani, F.; Merli, M.; Lucidi, C.; Lleo, M.M. Presence of Multiple Bacterial Markers in Clinical Samples Might Be Useful for Presumptive Diagnosis of Infection in Cirrhotic Patients with Culture-Negative Reports. Eur. J. Clin. Microbiol. Infect. Dis. 2016, 35, 433–441. [Google Scholar] [CrossRef] [PubMed] [Green Version]
  39. Berney, M.; Hammes, F.; Bosshard, F.; Weilenmann, H.-U.; Egli, T. Assessment and Interpretation of Bacterial Viability by Using the LIVE/DEAD BacLight Kit in Combination with Flow Cytometry. Appl. Environ. Microbiol. 2007, 73, 3283–3290. [Google Scholar] [CrossRef] [PubMed] [Green Version]
  40. Ettorre, V.; De Marco, P.; Zara, S.; Perrotti, V.; Scarano, A.; Di Crescenzo, A.; Petrini, M.; Hadad, C.; Bosco, D.; Zavan, B.; et al. In Vitro and in Vivo Characterization of Graphene Oxide Coated Porcine Bone Granules. Carbon 2016, 103, 291–298. [Google Scholar] [CrossRef]
  41. Zhao, Q.; Chen, D.; Li, Y.; Zhang, G.; Zhang, F.; Fan, X. Rhodium Complex Immobilized on Graphene Oxide as an Efficient and Recyclable Catalyst for Hydrogenation of Cyclohexene. Nanoscale 2013, 5, 882–885. [Google Scholar] [CrossRef]
  42. Kozielski, M.; Buchwald, T.; Szybowicz, M.; Błaszczak, Z.; Piotrowski, A.; Ciesielczyk, B. Determination of Composition and Structure of Spongy Bone Tissue in Human Head of Femur by Raman Spectral Mapping. J. Mater. Sci. Mater. Med. 2011, 22, 1653–1661. [Google Scholar] [CrossRef] [PubMed] [Green Version]
  43. Ferrari, A.C.; Meyer, J.C.; Scardaci, V.; Casiraghi, C.; Lazzeri, M.; Mauri, F.; Piscanec, S.; Jiang, D.; Novoselov, K.S.; Roth, S.; et al. Raman Spectrum of Graphene and Graphene Layers. Phys. Rev. Lett. 2006, 97. [Google Scholar] [CrossRef] [PubMed] [Green Version]
  44. Ferrari, A.C.; Robertson, J. Interpretation of Raman Spectra of Disordered and Amorphous Carbon. Phys. Rev. B 2000, 61, 14095–14107. [Google Scholar] [CrossRef] [Green Version]
  45. Ellingham, S.T.D.; Thompson, T.J.U.; Islam, M. Thermogravimetric Analysis of Property Changes and Weight Loss in Incinerated Bone. Palaeogeogr. Palaeoclimatol. Palaeoecol. 2015, 438, 239–244. [Google Scholar] [CrossRef]
  46. Gangaraju, V.K.; Lin, H. MicroRNAs: Key Regulators of Stem Cells. Nat. Rev. Mol. Cell Biol. 2009, 10, 116–125. [Google Scholar] [CrossRef] [PubMed] [Green Version]
  47. Inose, H.; Ochi, H.; Kimura, A.; Fujita, K.; Xu, R.; Sato, S.; Iwasaki, M.; Sunamura, S.; Takeuchi, Y.; Fukumoto, S.; et al. A MicroRNA Regulatory Mechanism of Osteoblast Differentiation. Proc. Natl. Acad. Sci. USA 2009, 106, 20794–20799. [Google Scholar] [CrossRef] [Green Version]
  48. Li, Z.; Hassan, M.Q.; Jafferji, M.; Aqeilan, R.I.; Garzon, R.; Croce, C.M.; van Wijnen, A.J.; Stein, J.L.; Stein, G.S.; Lian, J.B. Biological Functions of MiR-29b Contribute to Positive Regulation of Osteoblast Differentiation. J. Biol. Chem. 2009, 284, 15676–15684. [Google Scholar] [CrossRef] [Green Version]
  49. Wei, J.; Li, H.; Wang, S.; Li, T.; Fan, J.; Liang, X.; Li, J.; Han, Q.; Zhu, L.; Fan, L.; et al. Let-7 Enhances Osteogenesis and Bone Formation While Repressing Adipogenesis of Human Stromal/Mesenchymal Stem Cells by Regulating HMGA2. Stem Cells Dev. 2014, 23, 1452–1463. [Google Scholar] [CrossRef] [Green Version]
  50. Piattelli, A.; Scarano, A.; Quaranta, M. High-Precision, Cost-Effective Cutting System for Producing Thin Sections of Oral Tissues Containing Dental Implants. Biomaterials 1997, 18, 577–579. [Google Scholar] [CrossRef]
  51. Spalazzi, J.P.; Doty, S.B.; Moffat, K.L.; Levine, W.N.; Lu, H.H. Development of Controlled Matrix Heterogeneity on a Triphasic Scaffold for Orthopedic Interface Tissue Engineering. Tissue Eng. 2006, 12, 3497–3508. [Google Scholar] [CrossRef]
  52. Edgar, L.; McNamara, K.; Wong, T.; Tamburrini, R.; Katari, R.; Orlando, G. Heterogeneity of Scaffold Biomaterials in Tissue Engineering. Materials 2016, 9, 332. [Google Scholar] [CrossRef] [PubMed] [Green Version]
  53. Aghaloo, T.L.; Tencati, E.; Hadaya, D. Biomimetic Enhancement of Bone Graft Reconstruction. Oral Maxillofac. Surg. Clin. N. Am. 2019, 31, 193–205. [Google Scholar] [CrossRef] [PubMed]
  54. Scarano, A.; Lorusso, F.; Staiti, G.; Sinjari, B.; Tampieri, A.; Mortellaro, C. Sinus Augmentation with Biomimetic Nanostructured Matrix: Tomographic, Radiological, Histological and Histomorphometrical Results after 6 Months in Humans. Front. Physiol. 2017, 8, 565. [Google Scholar] [CrossRef] [PubMed] [Green Version]
  55. Hoornaert, A.; Maazouz, Y.; Pastorino, D.; Aparicio, C.; de Pinieux, G.; Fellah, B.H.; Ginebra, M.-P.; Layrolle, P. Vertical Bone Regeneration with Synthetic Biomimetic Calcium Phosphate onto the Calvaria of Rats. Tissue Eng. Part C Methods 2019, 25, 1–11. [Google Scholar] [CrossRef] [Green Version]
Figure 1. Design of the study.
Applsci 11 03218 g001
Figure 2. Raman spectroscopy of collagenated blocks coated with graphene-oxide (G-N) at concentrations of (A) 2 (G-N2) and (B) 10 μg/mL (G-N10). The black spectra correspond to the uncoated bone block. The red, blue, and green spectra correspond to spectra recorded in three different points of the G samples. The Y-axis represents Raman intensity in arbitrary units, whereas * refers to recognized graphitic material bands (i.e., the G band at 1580, the D band at 1350, and the 2690 cm−1).
Applsci 11 03218 g002
Figure 3. Thermogravimetric analysis (TGA) analysis of an uncoated bone block (black line) and bone blocks coated with G-N at concentrations of 2 (blue line) and 10 μg/mL (red line). (B) is the enlargement of the squared spectra of (A).
Applsci 11 03218 g003
Figure 4. Images of human dental pulp stem cells (hDPSCs) seeded on equine bone blocks, uncoated (a), G-N2 (b), and G-N10 (c), acquired with a fluorescence microscope (40·), scale bar 50 µM. The pictures show that cells are mostly alive (green spots) after 24 h, while only few of them, indicated by the arrows, are dead (red spots). The evaluation of the hDPSC viability was assessed using the live/dead test (Live/Dead BacLight™, Molecular Probes, Eugene, OR, USA).
Applsci 11 03218 g004
Figure 5. Osteocalcin assay. The graphs show the osteocalcin levels measured in hDPSC culture media after 14 days in both growth medium (GM) (panel (A)) and differentiation medium (DM) (panel (B)). The data derived from three different experiments (each n = 3) are expressed in ng/ml/106 cells as means ± standard deviation (** p < 0.001; *** p < 0.0001).
Applsci 11 03218 g005
Figure 6. (AF) Histological evaluation: (A) Histologic section of bone block (B) seeded with hDPSC. The sample showed a discontinuous cell layer (arrow) (toluidine blue and acid fuchsin, 1000×). (B) Histologic section of bone block (B) seeded with hDPSC and melatonin. The sample showed a continuous cell layer (arrow). (Toluidine blue and acid fuchsin, 1000×). (C) Histologic section of G-N2-coated bone block (B) seeded with hDPSC. The sample showed a discontinuous cell layer (black arrows); in a small portion, a residue of graphene G-N2 (red arrow) was detected. (Toluidine blue and acid fuchsin 1000×). (D) Histologic section of G-N2-coated bone block (B) seeded with hDPSC and melatonin. The sample showed a continuous cell layer (black arrows) and in one point a thick residue of G-N was observed (red arrow) (toluidine blue and acid fuchsin, 1000×). (E) Histologic section of G-N10-coated bone block (B) seeded with hDPSC. G-N particles (red arrow) appeared both in contact and distant from the block surface. In some areas (black arrows) cells on the surface could be observed. (Toluidine blue and acid fuchsin, 1000×). (F) Histologic section of G-10-coated bone block (B) seeded with hDPSC and melatonin. G-N particles were present in contact (red arrow) with the surface and a thin cellular layer (black arrow) on the surface was present (toluidine blue and acid fuchsin, 1000×).
Applsci 11 03218 g006
Table 1. Gene expression data.
Gene SymbolDaysGrowth MediumDifferentiation Medium
CTRLG-N2G-N10CTRL + MELG-N2 + MELG-N10 + MELCTRLG-N2G-N10CTRL
ù + MEL
G-N2 + MELG-N10 + MEL
SMAD576.7 ± 0.0926.9 ± 0.036.52 ± 0.046.58 ± 0.0076.2 ± 0.007 ***6.42 ± 0.056.18 ± 0.066.8 ± 0.014 ***6.46 ± 0.07 * ##6.01 ± 0.066.56 ± 0.06 ***7.06 ± 0.012 ***
145.5 ± 0.056 ± 0.035.4 ± 0.086 ± 0.055.8 ± 0.035.6 ± 0.17.4 ± 0.16.6 ± 0.006 ***5.8 ± 0.08 ***6.4 ± 0.0356 ± 0.01 ***6.15 ± 0.015 ***
217.2 ± 0.026.3 ± 0.1 ***6.7 ± 0.04 * ##7.2 ± 0.076.2 ± 0.02 ***6 ± 0.04 ***8.25 ± 0.038.4 ± 0.148 ± 0.05 **8.1 ± 0.068.4 ± 0.025 **8.3 ± 0.05
RUNX277.1 ± 0.087.1 ± 0.0176.6 ± 0.08 ***6.6 ± 0.136.2 ± 0.04 ***6.55 ± 0.0926.2 ± 0.016 ± 0.035.8 ± 0.046.1 ± 0.65.7 ± 0.065.9 ± 0.05
145.36 ± 0.0155.6 ± 0.04 **5.26 ± 0.075.2 ± 0.075.53 ± 0.036 ***4.96 ± 0.035 ***8.5 ± 0.066.1 ± 0.02 ***6 ± 0.07 ***6.5 ± 0.095.5 ± 0.07 ***5.7 ± 0.1 ***
216.5 ± 0.056 ± 0.0 ***6 ± 0.01 ***6.7 ± 0.0076.2 ± 0.02 ***6 ± 0.04 ***7.4 ± 0.0757.6 ± 0.087.25 ± 0.047.25 ± 0.0077.4 ± 0.097.7 ± 0.035 ***
Data derived from three different experiments (each n = 3) were presented as ΔCt means ± standard deviation. ΔCt (Ct gene of interest–Ct GAPDH). Glyceraldehyde-3-phosphate dehydrogenase (GAPDH) was used as the housekeeping gene to normalize gene levels. One-way ANOVA tests were applied for statistical differences among the experimental conditions in growth medium or differentiation medium (* p < 0.01; ** p < 0.001; *** p < 0.0001) and Tukey’s test was applied for pairwise comparisons (G-N2 and G-N10 vs. Ctrl; G-N2 + Mel and G-N10 + Mel vs. Ctrl + Mel, ## p < 0.0001) when statistical significance tests where equal were represented one time.
Table 2. miRNA expression data.
miR SymbolDaysGrowth MediumDifferentiation Medium
CTRLG-N2G-N10CTRL + MELG-N2 + MELG-N10 + MELCTRLG-N2G-N10CTRL + MELG-N2 + MELG-N10 + MEL
miR-133a711.6 ± 0.212.5 ± 0.4 **12.8 ± 0.1 ***13.1 ± 0.113.1 ± 0.2---10.9 ± 0.0511.6 ± 0.710.6 ± 0.110.8 ± 0.89.7 ± 0.312.3 ± 0.1 *
1411.2 ± 0.211.5 ± 0.711.9 ± 1.0111.3 ± 0.712.1 ± 0.311.3 ± 0.89 ± 0.310.7 ± 0.111.5 ± 0.5 *10 ± 0.211.7 ± 0.912.3 ± 0.8 **
2111.3 ± 0.211.5 ± 0.712.7 ± 0.811.3 ± 0.712.5 ± 0.312.3 ± 0.112.2 ± 0.0512.2 ± 0.613.2 ± 0.611.6 ± 0.411.9 ± 0.211.7 ± 0.5
miR-133b710.1 ± 0.412.3 ± 0.2---11.4 ± 0.813 ± 0.8---11.4 ± 0.0511.9 ± 0.411.9 ± 0.211.7 ± 0.612.4 ± 0.02---
1411 ± 0.412 ± 0.412.2 ± 1.311.2 ± 0.112.3 ± 0.412.8 ± 0.811.1 ± 0.611.5 ± 0.811.5 ± 0.810.8 ± 0.211.1 ± 0.912.5 ± 0.8
2112.6 ± 0.412.4 ± 0.412.8 ± 0.0511.5 ± 0.712.7 ± 0.212.6 ± 0.111.8 ± 0.0512 ± 0.910.5 ± 0.510.5 ± 0.312.2 ± 0.1 *14.4 ± 0.4 ***
miR-135a711 ± 0.512.7 ± 0.1 *12.3 ± 0.611.1 ± 0.112.4 ± 0.812.4 ± 0.411.2 ± 0.0513.4 ± 0.7 ***12.2 ± 0.111.8 ± 0.110.4 ± 0.4 *---
1410.2 ± 0.110.9 ± 0.711.03 ± 0.210.6 ± 1.110.6 ± 0.610.8 ± 0.312 ± 0.1------12.2 ± 0.2------
2112.1 ± 0.511.7 ± 0.312.3 ± 0.512.5 ± 0.612.2 ± 0.212.1 ± 0.410.9 ± 0.512 ± 1.0412.8 ± 0.6 *11.8 ± 0.612.1 ± 0.511.3 ± 0.7
miR-206710.8 ± 0.812 ± 0.111.8 ± 1.111.4 ± 0.812 ± 0.711 ± 0.311.9 ± 0.611.9 ± 0.912.4 ± 0.211.7 ± 0.811.2 ± 0.511.6 ± 0.6
149.9 ± 0.212.1 ± 0.4 ***11.5 ± 0.6 **11.7 ± 0.411.4 ± 0.412.4 ± 0.311.5 ± 0.311.1 ± 0.0411.2 ± 0.411.6 ± 0.711 ± 0.811.9 ± 0.3
2112 ± 0.912.6 ± 0.511.3 ± 0.812.5 ± 0.711.5 ± 0.111.8 ± 0.312 ± 0.811.3 ± 0.512.3 ± 1.111.4 ± 0.411.8 ± 0.211.2 ± 0.07
miR-29b73.1 ± 0.22.7 ± 0.22.4 ± 0.1 **2.4 ± 0.053 ± 0.2 **1.9 ± 0.1 *4.62 ± 0.024.99 ± 0.04 **4.85 ± 0.14.14 ± 0.034.87 ± 0.02 ***3.81 ± 0.08 **
142.9 ± 0.22.5 ± 0.11.7 ± 0.3 ***1.9 ± 0.21.6 ± 0.12.1 ± 0.23 ± 0.33.4 ± 0.053.9 ± 0.2 **2.7 ± 0.12.9 ± 0.13.3 ± 0.2 *
213.3 ± 0.082.5 ± 0.1 ***3.8 ± 0.2 **2.6 ± 0.12.6 ± 0.13 ± 0.04 **2.9 ± 0.062.7 ± 0.04 **2.7 ± 0.09 *3 ± 0.062.9 ± 0.042.6 ± 0.07 ***
miR-let-7b7−1.8 ± 0.02−3.1 ± 0.3 ***−3.7 ± 0.2 ***−1.7 ± 0.1−4.6 ± 0.3 ***−5 ± 0.2 ***−1.46 ± 0.07−1.80 ± 0.03−2.03 ± 0.14 **−1.51 ± 0.14−1.8 ± 0.12−1.96 ± 0.06 *
14−2.3 ± 2− 2.02 ± 0.2−2.3 ± 0.3−2.5 ± 0.1−2.5 ± 0.2−3 ± 0.3−1.3 ± 0.07−1.5 ± 0.08−1.6 ± 0.2− 2.1 ± 0.08− 1.7 ± 0.08 *−1.6 ± 0.1 **
21−2.1 ± 0.1−2.6 ± 0.1 ***−1.9 ± 0.1−2.1 ± 0.1−2.2 ± 0.04−2.4 ± 0.08 *−1.4 ± 0.05−1.7 ± 0.07 ***−0.7 ± 0.06 ***−1.05 ± 0.08−1.04 ± 0.08− 1.6 ± 0.05 ***
Data derived from three different experiments (each n = 3) were presented as ΔCt means ± standard deviation. ΔCt (Ct miRNA of interest–Ct miR-16). miR-16 was used as housekeeping gene to normalize miRNA levels. The one-way ANOVA analysis of variance with Tukey’s multiple comparison test was applied. (Ctrl vs. G-N2; Ctrl vs. G-N10; Ctrl + Mel vs. G-N2 + Mel; Ctrl + Mel vs. G-N10 + Mel; * p < 0.05; ** p < 0.01; *** p < 0.001). --- means undetermined data.
Publisher’s Note: MDPI stays neutral with regard to jurisdictional claims in published maps and institutional affiliations.

