Indoor Acoustic Requirements for Autism-Friendly Spaces


1
Engineering and Architecture Department, University of Trieste, 34127 Trieste; Italy
2
Faculty of Science and Technology, Free University of Bozen, 39100 Bolzano, Italy
*
Author to whom correspondence should be addressed.
Appl. Sci. 2021, 11(9), 3942; https://0-doi-org.brum.beds.ac.uk/10.3390/app11093942
Submission received: 26 March 2021
/
Revised: 17 April 2021
/
Accepted: 26 April 2021
/
Published: 27 April 2021
(This article belongs to the Special Issue Human-Centred Design of the Built Environments: Latest Advances and Prospects)
Abstract
:The architecture of spaces for people on the autistic spectrum is evolving toward inclusive design, which should fit the requirements for independent, autonomous living, and proper support for relatives and caregivers. The use of smart sensor systems represents a valuable support to internal design in order to achieve independent living for impaired people. Accordingly, these devices can monitor or prevent hazardous situations, ensuring security and privacy. Acoustic sensor systems, for instance, could be used in order to realize a passive monitoring system. The correct functioning of such devices needs optimal indoor acoustic criteria. Nevertheless, these criteria should also comply with dedicated acoustic requests that autistic individuals with hearing impairment or hypersensitivity to sound could need. Thus, this research represents the first attempt to balance, integrate, and develop these issues, presenting (i) a wide literature overview related to both topics, (ii) a focused analysis on real facility, and (iii) a final optimization, which takes into account, merges, and elucidates all the presented unsolved issues.
1. Introduction
Autistic people, their families, or caregivers need design processes capable of overcoming the difficulties of everyday life. In 2020, the Center for Disease Control and Prevention reported that approximately 1 out of 54 children in the U.S. is diagnosed with an Autism Spectrum Disorder, in accordance with 2016 data [1]. In 2018, the European project “Autistic Spectrum Disorder” evaluated the prevalence of ASD individuals in approximately 0.62–0.70% of the population in the European Union, although estimates of 1–2% have been made in the latest large-scale surveys [2]. In Asia, a systematic review in six Asian countries reported that the prevalence of individuals with ASD from 1980 to present was 14.8 individuals per 10,000 [3].
A percentage of 31% of ASD children present an intellectual disability (intelligence quotient [IQ] < 70), 25% are in the borderline range (IQ 71–85), and 44% present IQ higher levels (i.e., IQ > 85) [4]. Over the next decade, an estimated 500,000 teens (50,000 each year) will enter adulthood and thus into a period of life where the school-based autism services are usually not provided [5].
Parents, professional caregivers, doctors, teachers, etc. offer dedicated assistance to ASD individuals and, most of the time, this support is needed 24 h a day. Special education services are the costliest resources per individual, followed by tutorial support. Accordingly, the cost of caring for autistic Americans reached $268 billion in 2015 and it will rise up to $461 billion by 2025 in the absence of more-effective interventions and lifelong supports [6]. In Europe, the estimate economic burden per individual for six months has been estimated to vary in a range from 797 € to 11,189 €. Other health and social services are an important part of the costs paid directly by individuals on the spectrum and caregivers. As an example, the cost of hiring a caregiver for six months is estimated within a range from 307.68 € to 4467.41 € [7].
It is therefore of paramount social and economic importance to study and implement alternative solutions offering the right support to everyday life for autistic people, from childhood to adulthood.
For children, teenagers, and adults, the autistic spectrum presents various levels of severity, from minimal to more acute forms, often accompanied by a diagnosis of mental retardation or other co-morbidities [8]. Sudden variation in behaviors are very common and even more common in people who also feature learning disabilities [9]. These facts often occur when individuals may not partially or completely understand what is happening around them and it may also be associated with a number of other factors including anxiety, stress, and sensory processing differences [10]. Self-injurious behavior might be presented as head banging on walls or other surfaces, hand or arm biting, hair pulling, eye gouging, face or head slapping, skin picking, scratching or pinching, or forceful head shaking.
Autism is based on observable behaviors, described in the two available diagnostic manuals edited by the World Health Organization [11] and the United States of America [12]. Depending on the severity of the level of required care, most individuals should be assisted by specialized and dedicated staff, which entails the costs that families and care facilities have to bear [13]. As they reach adulthood, high functioning people (HFA) without intellectual disabilities can aspire to independent living projects, if adequately supported by care facilities, living, and working environments adapted to their needs [14]. Research has shown that work activities that encourage independence reduce the symptoms of autism and increase daily life skills [15].
Current technologies available for autistic people may feature wearable (bracelets and smartwatches) and portable media (smartphones and tablets) used to prevent crises; additionally, environmental sensors capable of monitoring different living conditions may be utilized. The smart systems should be able to recognize any anomalous events or moments of crisis and, for this reason, it should be designed ad hoc on the needs of each user. Technology can therefore become an important aid, whether they are in a situation of total need of care, or in situations of lower level of intervention (semi-independence) [16]. For example, an integrated sensor system could represent a chance to support autistic people and their families or caregivers [17]. This system may reduce the cost of dedicated personnel, offer some rest to the families, and increase the sense of autonomy.
Thus, in order to employ technological solutions to help and support autistic individuals and whoever takes care of them, it is of primary importance to study their peculiarities, related to their relationships and attitudes with indoor spaces. Passive monitoring systems can help to live as autonomously as possible in environments designed and built to meet their needs [18]. For example, a possible form of smart assistance could be offered by integrated sound sensor systems capable of capturing and analyzing noisy events linked both to the occurrence of normal domestic accidents (e.g., falling from a staircase) and to the manifestation of critical events related to some behaviors (e.g., banging head against a wall) [19]. For the above-mentioned reasons, it is evident how sound sensors are very useful and therefore worthy of investigation.
Accordingly, the use of sound detection devices implies that the acoustic field in the rooms is adequate and suitable for their implementation [20]. In order to facilitate the use of these sensors, the acoustic characteristics of the indoor spaces in which these systems can be inserted should be studied, but at the same time, the acoustic requests essential by autistic people have to be considered.
Therefore, the aim of this research was to understand how to combine the acoustic necessities imposed by sensors and the acoustic indoor requirements presented by autistic people with hearing impairments or hypersensitivity to sound.
2. Materials and Methods
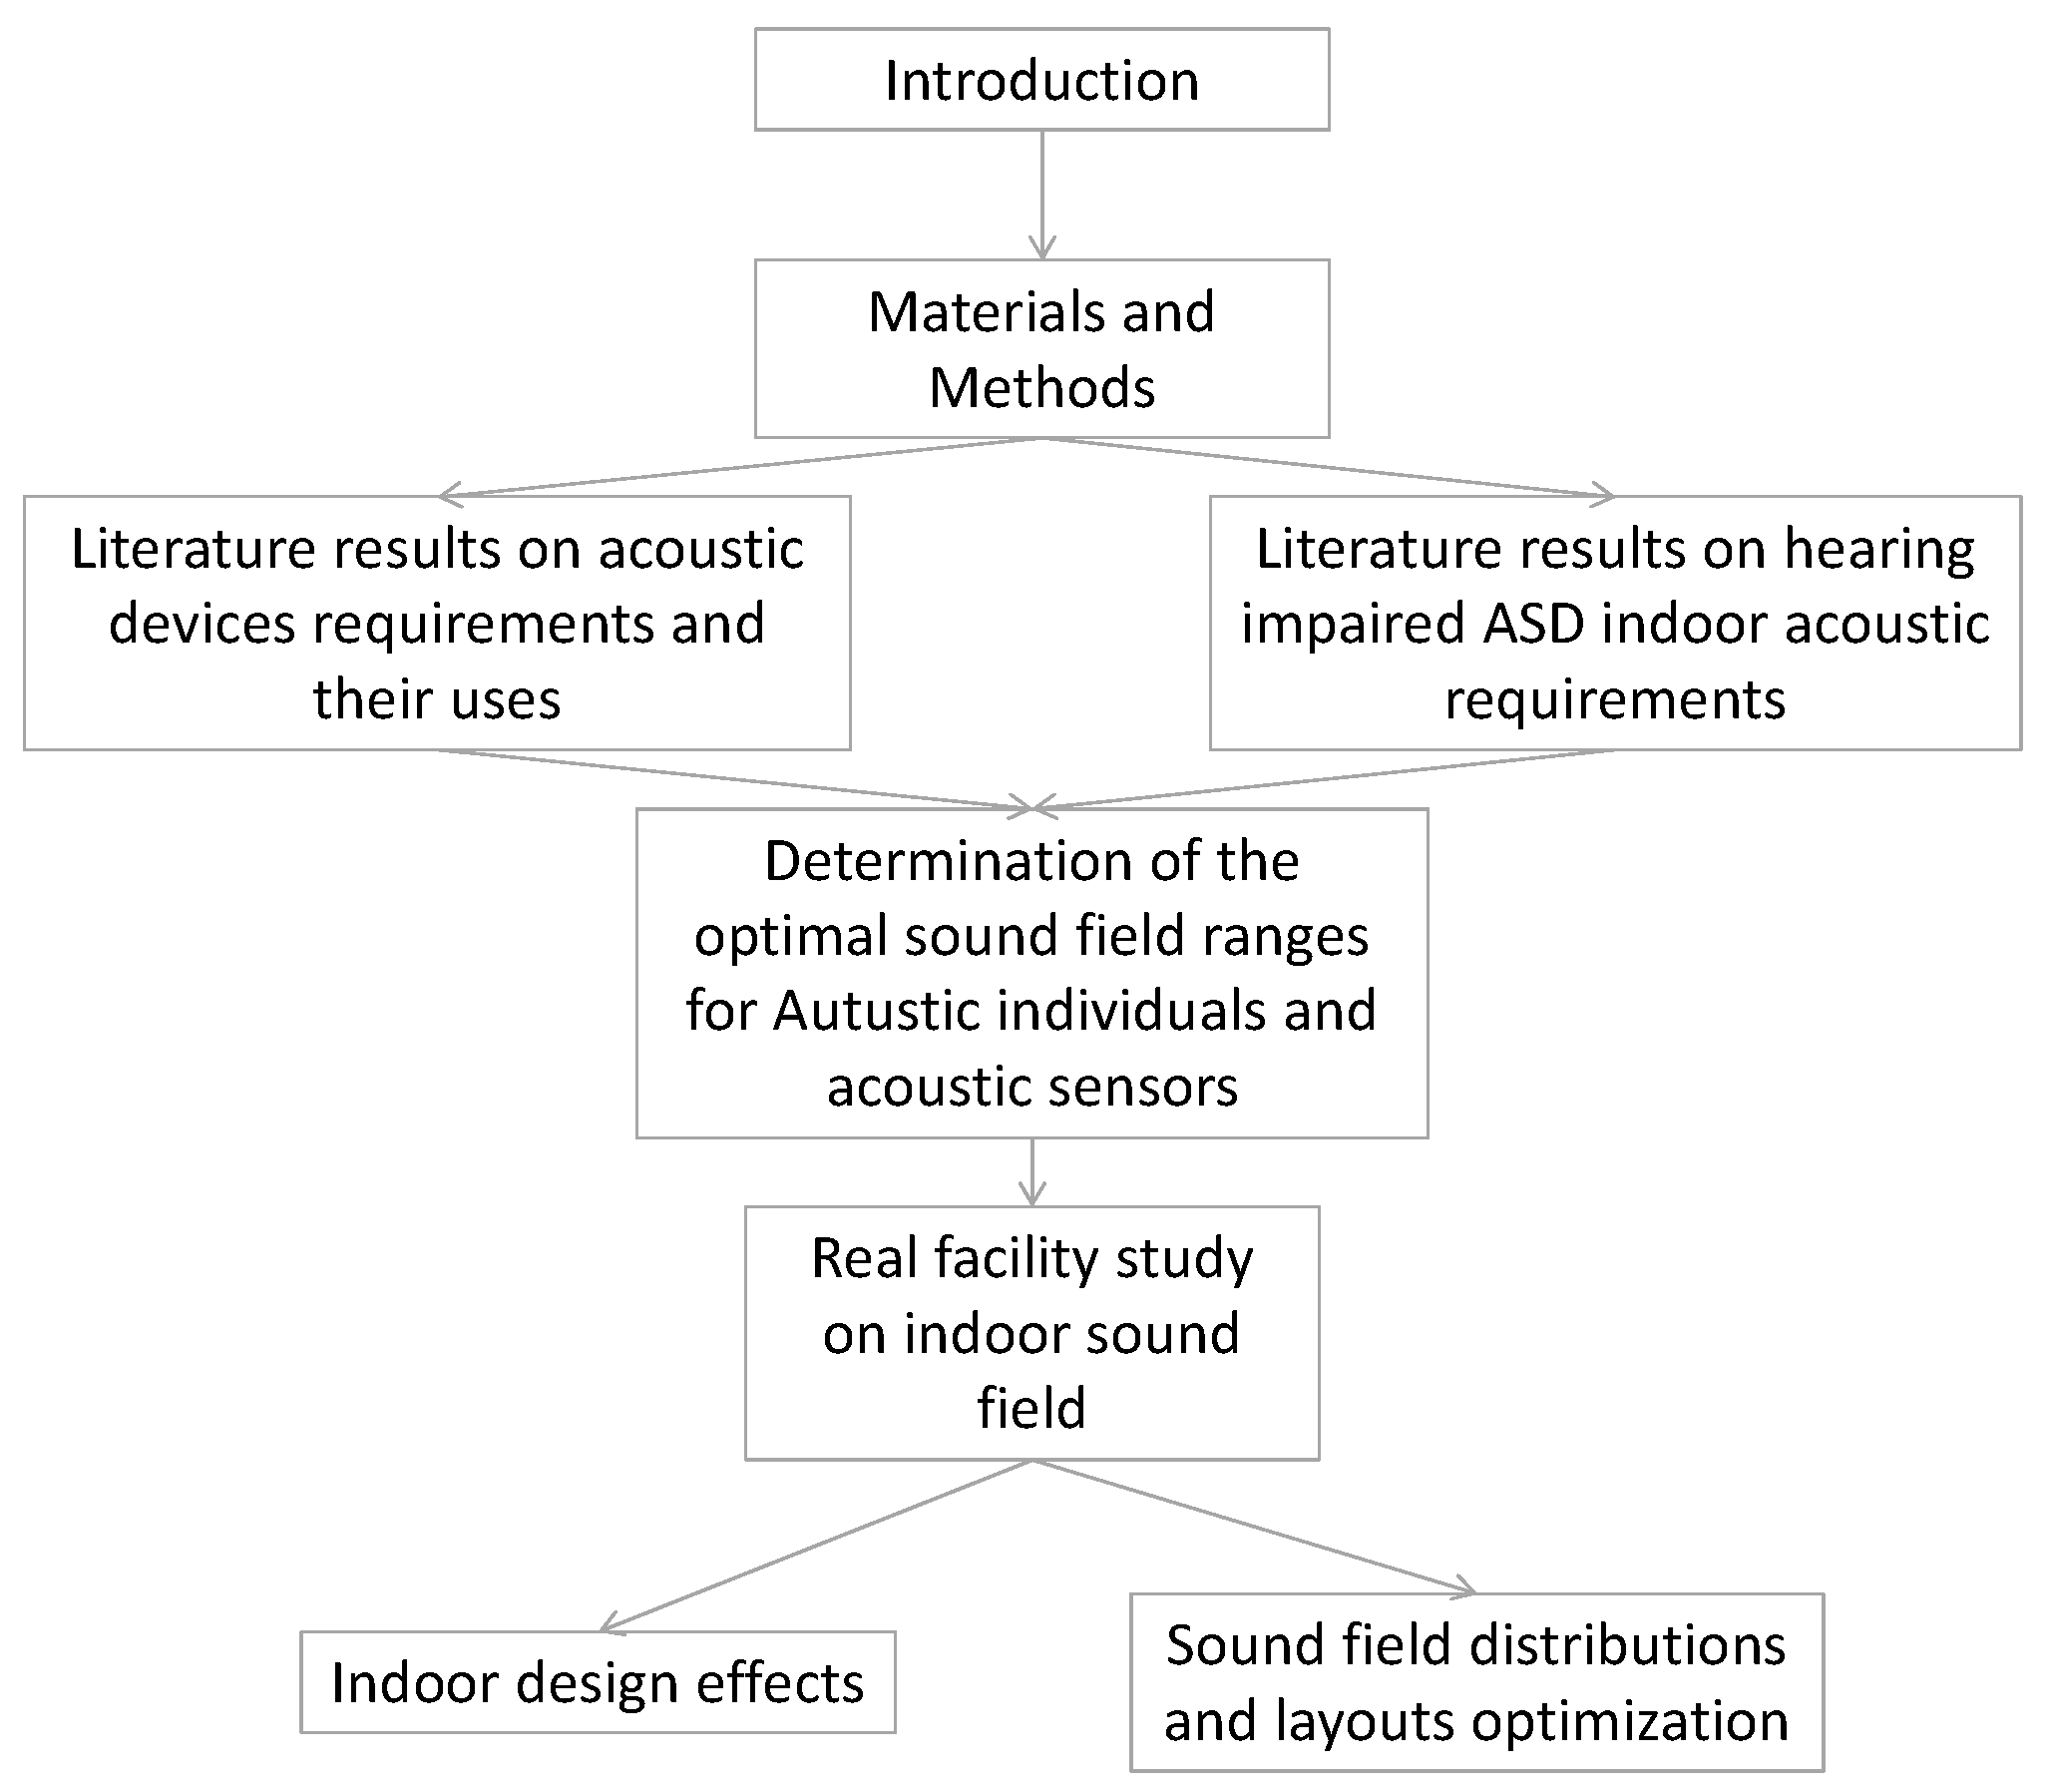
A dedicated literature overview is presented, focusing at the same time on devices sound field requests and acoustic indoor requirements for living spaces of autistic people with hearing impairments or hypersensitivity to sound. With these results in mind, a real case study featuring a daily care facility dedicated to ASD individuals, with apartments for autonomous living projects, was analyzed. Measurements of reverberation time performed on all interesting rooms are depicted and obtained values were compared to the suggested ones in the literature. Then, in order to comply with them, an optimization process is presented. Measured values were used for the calibration of acoustic 3D models. These will be useful to customize the indoor built environment and to study different sound fields due to positions and the shape variations of sound absorbing elements. Thus, using this approach, a dedicated discussion is addressed on sound field distribution, related to sensors and ASD people requirements for different configurations of typical rooms. A flowchart of the research approach is provided in Figure 1.
2.1. Literature Results on Acoustic Devices Requirements and Their Uses
At present, the most widely used devices for indoor monitoring include infra-red sensors, open/closed detectors, weather stations, kinematic sensors, webcams, and microphones for sound and speech recognition [21]. Sound and voice recognition systems represent a good compromise between privacy and support [22]. They can monitor sound levels without “being seen”, featuring the option to whether to record signals or not.
Sound and speech recognition technologies are classified as acoustic event detection (AED) and sound source recognition systems (SSR). AED is designed to detect anomalous acoustic events and were first developed only to assist video surveillance monitoring [23]. They are based on sound signal peculiarities, which can be composed of many different time or spectral characteristics, amplitude levels (consequently different signal-to-noise ratio), and durations. The detection algorithms are based on pre-processing techniques, necessary to detect potential alarm signals [24]. These systems are mainly used for “security” in outdoor environments or large spaces (garages, airports, stations, etc.).
SSR are devices that have been recently developed. They permit the switch from a help button-driven request to an immediate sending of a distress call by means of the use of people’s own voice or a specific event recognition. These technologies are becoming increasingly popular today, especially thanks to the development of home automation techniques within smart homes [25].
Sensors can provide information about a person’s posture and movement or detect falls, etc. [26]. Smart homes are therefore useful to monitor activities or to help with cognitive or physical disabilities in daily events [27]. In this case, they would make it possible to monitor situations of annoyance or nervousness such as sudden noises coming from outside (a loud horn or an individual screaming from the street), or from nearby environments (neighbor’s noise, etc.) and trigger the appropriate mechanism, if the individual suffers emotional stress related to these factors [28].
Nowadays, there are many available solutions of acoustic recognition algorithms [29]. The involved systems feature one or more microphones or are even embedded in robots, permitting them to follow individuals very closely. As far as voice command is concerned, these systems are able to analyze and recognize many characteristics including intensity, timbre, rhythm, and level [30]. This permits to distinguish whether to send an early warning to the caregivers or not.
Such systems therefore permit non-autonomous people to maintain control of their environment, activities, health, well-being, and sense of dignity [31]. Many of the above-presented studies identify disabled people as the main stakeholders, in particular when they are able to look after themselves, but they may need help when facing some difficult tasks or any situations of risk, danger, and accident. Recognition systems can also be implemented in order to emit reassurance signals (voices, music, light variation) in order to avoid crises and panic.
Most problems encountered during the implementation phases are related to the background noise and indoor reverberation conditions [32]. Accordingly, recognition performance decreases significantly as devices are located away from the user’s mouth (e.g., when positioned on the ceiling), due to reverberation increasing, and background noise effect (masking) [33].
Indoor sound environment may be characterized by many objective parameters. One of the most important is the measure of the energy decay in time (reverberation time RT). This parameter depends on the sound-absorbing characteristics of the finishing and on the volume of the room. Reverberation time is short for very sound absorbent rooms or small close environments and increases proportionally to volume or the decrease in the presence of sound absorbing materials [34]. For the acoustic qualification of a room, it is also essential to study the distribution of sound energy during decay (i.e., whether this energy is concentrated near the source or, conversely, a significant portion of it arrives with a significant delay compared to the direct sound) [35]. The ratio between early and late sound reflections is represented by the parameter clarity index (C50). This is an objective qualification of the clarity of speech. Indeed, late reflections are unfavorable for speech comprehension; anyway, if this delay does not exceed a certain time limit (50 ms), the reflections will contribute positively to the speech clarity.
In addition, the percentage ratio between early sound reflections (between 0 and 50 ms) and overall sound energy of the impulse response is defined in terms of definition (D50).
Few studies have focused on the determination of the optimal sound field conditions related to the use of this sound device within the built environment. Lecouteux et al. [27] reported that for reverberation time, the range comprised from 0.5 s to 0.7 s represents the optimal conditions for the use of sound sensors in small environments; Petrick et al. [36] demonstrated that strong disturbances are caused by reflections in most typical indoor living area for sounds at frequencies below 250 Hz and above 2500 Hz. The identified optimal reverberation time represents the combination of the requirements of good intelligibility and sufficient intensity level, depending on the listening conditions. A value of 0.5 s at medium-high frequencies is characteristic of a normally furnished residential environment [37].
Among all the other parameters, C50 and D50 represent further paramount room acoustic indicators used to determine the quality of environments suitable for sensor installation [38,39]. Parada et al. [40] showed that the full frequency-band of C50 is the most relevant measurement of sound energy to predict phenomena recognition in terms of correlation and mutual information. Sehr et al. [41] explained the high correlation between the word accuracy and the definition D50, pointing out that if a value of 0.7 is verified in a room, the sound intelligibility will be very good. These indexes represent the ratio between the energy associated with direct sound and the one associated with the first and subsequent reflections [42]. Therefore, C50 and D50 are certainly useful for the qualification of the indoor sound field. They permit correctly location of the acoustic recognition sensors inside a room because they are influenced by room position. However, these parameters are not commonly used as the RT, which, on the other hand, does not vary significantly because of room location. In conclusion, some ranges have been found, but no studies on indoor sound field distribution are available as well as information on device position selection.
2.2. Literature Results on Hearing Impaired ASD Indoor Acoustic Requirements
In everyday life, people without cognitive impairment can process various practice situations through pre-acquired mental schemes [43]. The process of selecting the arrangement to correctly manage a situation is the basis of normal understanding. Thanks to this schematic memory, it is possible to recognize the world as “familiar”. Anything that does not correspond to the already measured experiential data is recognized as “extraneous”; this is a very quick process. If most situation details fit well into a pattern, attention is immediately driven by unknown ones. Conversely, if most details are not familiar at all, a new pattern is processed [44]. Each pattern can also be considered as a large network of memories with potential associative connections. When events follow our expectations, some previously acquired memories reach the peripheral consciousness and arouse the sensation of having already happened. Thus, it is possible to react. This cognitive process is responsible for everyday normal living.
People on the autism spectrum may be characterized by severe and generalized impairment in some areas of cognitive development including hyper- or hypo-reactivity to sensory stimuli or unusual interest in particular details of the environment [45]. For high functioning individuals (HFA) without intellectual disability, significant difficulties in the process of social inference can be verified and, in particular, this dysfunction can occur when they have to choose which information has to be taken into account [13]. However, the qualitative compromises of these conditions should not lead to their isolation, but rather to search for new approaches, which, thanks to the support of targeted design and appropriate technology, will also permit the development of autonomy and increase their sense of self-esteem and competence [46].
Autistic people can present high sound sensitivity [14]. A survey conducted on 168 Canadian families with 3–16 years old children on the spectrum [47] demonstrated that the 87% of the respondents reported that their children were sensitive to noise. This co-morbidity is related to great difficulties in focusing concentration on a single auditory stimulus (e.g., someone’s voice), like noise from ventilation, doors opening, someone coughing, cars in transit, etc. Their brains seem to treat all sounds with the same intensity and thus importance [15]. If they try to separate the background noise from the direct sound, they often fail. Accordingly, their brain processes all the perceived noise stimuli featuring the same importance, trying to understand the meanings of all the sounds at the same time [48].
On the other hand, autistic individuals can also present low sound sensitivity: in this case, a “too quiet” environment could mean the absence of inputs. Thus, they will feel the need to increase the sensory experience, for example, by tapping their fingers insistently [49].
Therefore, the acoustic conditions of the indoor and outdoor environment are paramount aspects that should be considered [50]. Avoiding the mitigation of household noises from appliances and equipment could force them to use anti-noise headphones in order to decrease sensory stimulation, distraction, and discomfort [51,52].
Nevertheless, it should also be considered that sometimes, they can also be the noise source. Accordingly, some of them can be particularly active at night time and turn on sound sources such as the TV or stereo, or use showers or water services, causing noise in neighboring rooms [53]. This means that spaces for ASD people should be designed considering the acoustics, in accordance with their profile and individual needs [54]. The diversity of neurological conditions means that the design of an intelligent home or intelligent space cannot be randomly decided, but should respond precisely to the needs and wishes of the individual who will use it [55]. From all the above-mentioned results, one can conclude that autistic individuals often present sensorineural hearing features.
2.3. Determination of the Optimal Sound Field Ranges for Autistic Individuals and Acoustic Sensors
Ranges for hearing impaired individuals can be found, but research related to indoor sound field distribution is neither available focused on individuals, nor on procedures or approaches explaining how and where to select the speakers and listeners’ positions.
In this view, studies not directly related to ASD individuals are available so far and can be used as reference. The American Speech Language Hearing Association [56] recommends 0.4 s as the reverberation time for unoccupied rooms for children with hearing loss and children with auditory learning difficulties or hearing disabilities. The UK Building Bulletin 102 [57] contains the maximum mid-frequency reverberation time requirements for newly-built environments and refurbishments. For spaces intended for users with special hearing or communication needs, the recommended reverberation time is RT ≤ 0.4 s, averaged from the 125 Hz to 4 kHz octave bands. The American National Standards Institute [58] recommends a reverberation time of RT < 0.7 s for schools in the octave frequency band of 500 Hz, 1000 Hz, and 2000 Hz. For the health care sector, Braam [59] suggested RT values in the range between 250 Hz and 2000 Hz of between 0.4 and 0.7 s. Marshall [60] pointed out that the speech intelligibility in a room is excellent, if C50 ≥ 2 dB and D50 > 0.6. Furthermore, Griesinger [61] clearly related C50 with vowel recognitions. These data are also confirmed by Ansay and Zanin [62] and Shield and Dockrell [63], where it is also highlighted that a good clarity and definition are not necessarily related to a room destination, but are valid in any situations. For this reason, in this research, those values were considered the best ones to be used.
The study of the peculiarities above described suggests that the best approach is not to “standardize” acoustic characteristics, but rather to use “user-centered design” approaches [64]. Once the space has been designed, taking into account for the customizations for each user, smart technology can support in a non-invasive way, permitting the reduction in anxiety, daily stress, psychological hazards [26], and solving important issues such as autonomy, dignity, security, and privacy [65].
2.4. Real Facility Study on Indoor Sound Field
In order to apply the literature results, in the present research, a real facility was identified and chosen as a case study. Rooms are furnished taking into consideration only hazardous issues, and walls and floors are realized without considering indoor acoustic problems.
Seven different rooms designed for daily-care and apartment groups dedicated to ASD people have been investigated by means of on-site acoustic measurements. Furthermore, by means of numerical simulations, an in-depth investigation and a parametric study have been developed, respectively, focused on indoor sound field and on furniture and sound absorbing panels distribution.
The selected structure, inaugurated in 2019, is composed by three floors of 2700 m2 each. After a major renovation, it became a multipurpose center used for both semi-residential and residential spaces for autistic people. The structure houses a day center for adults and an experimental afternoon center for adolescents, some skills labs, an art workshop, a gym, a conference center, a music room, a canteen, a large kitchen for workshops, and also relaxing and hosting areas for parents.
The structure overall design was the product of a doctoral dissertation [66]. The issues of sound insulation and the need to prepare the rooms in such a way that both guests and caregivers are adequately protected from an acoustic point of view were widely considered. As an example, particularly sensitive zones such as those related to individual therapy clinics are located in separate areas from the rest of the building and from the outside. Likewise, noisy spaces such as the gymnasium, soft rooms, and activity rooms such as music and art are located as not to interfere with the therapy and living areas. This structure, particularly recent and suitably designed, therefore represents the ideal starting point for this study.
The selected therapy rooms for the analysis are as follows (Figure 2a–d):
- −
- therapy room no. 1: 10 m2,
- −
- therapy room no. 2: 21 m2,
- −
- therapy room no. 3: 6 m2,
- −
- therapy room no. 4: 12 m2.
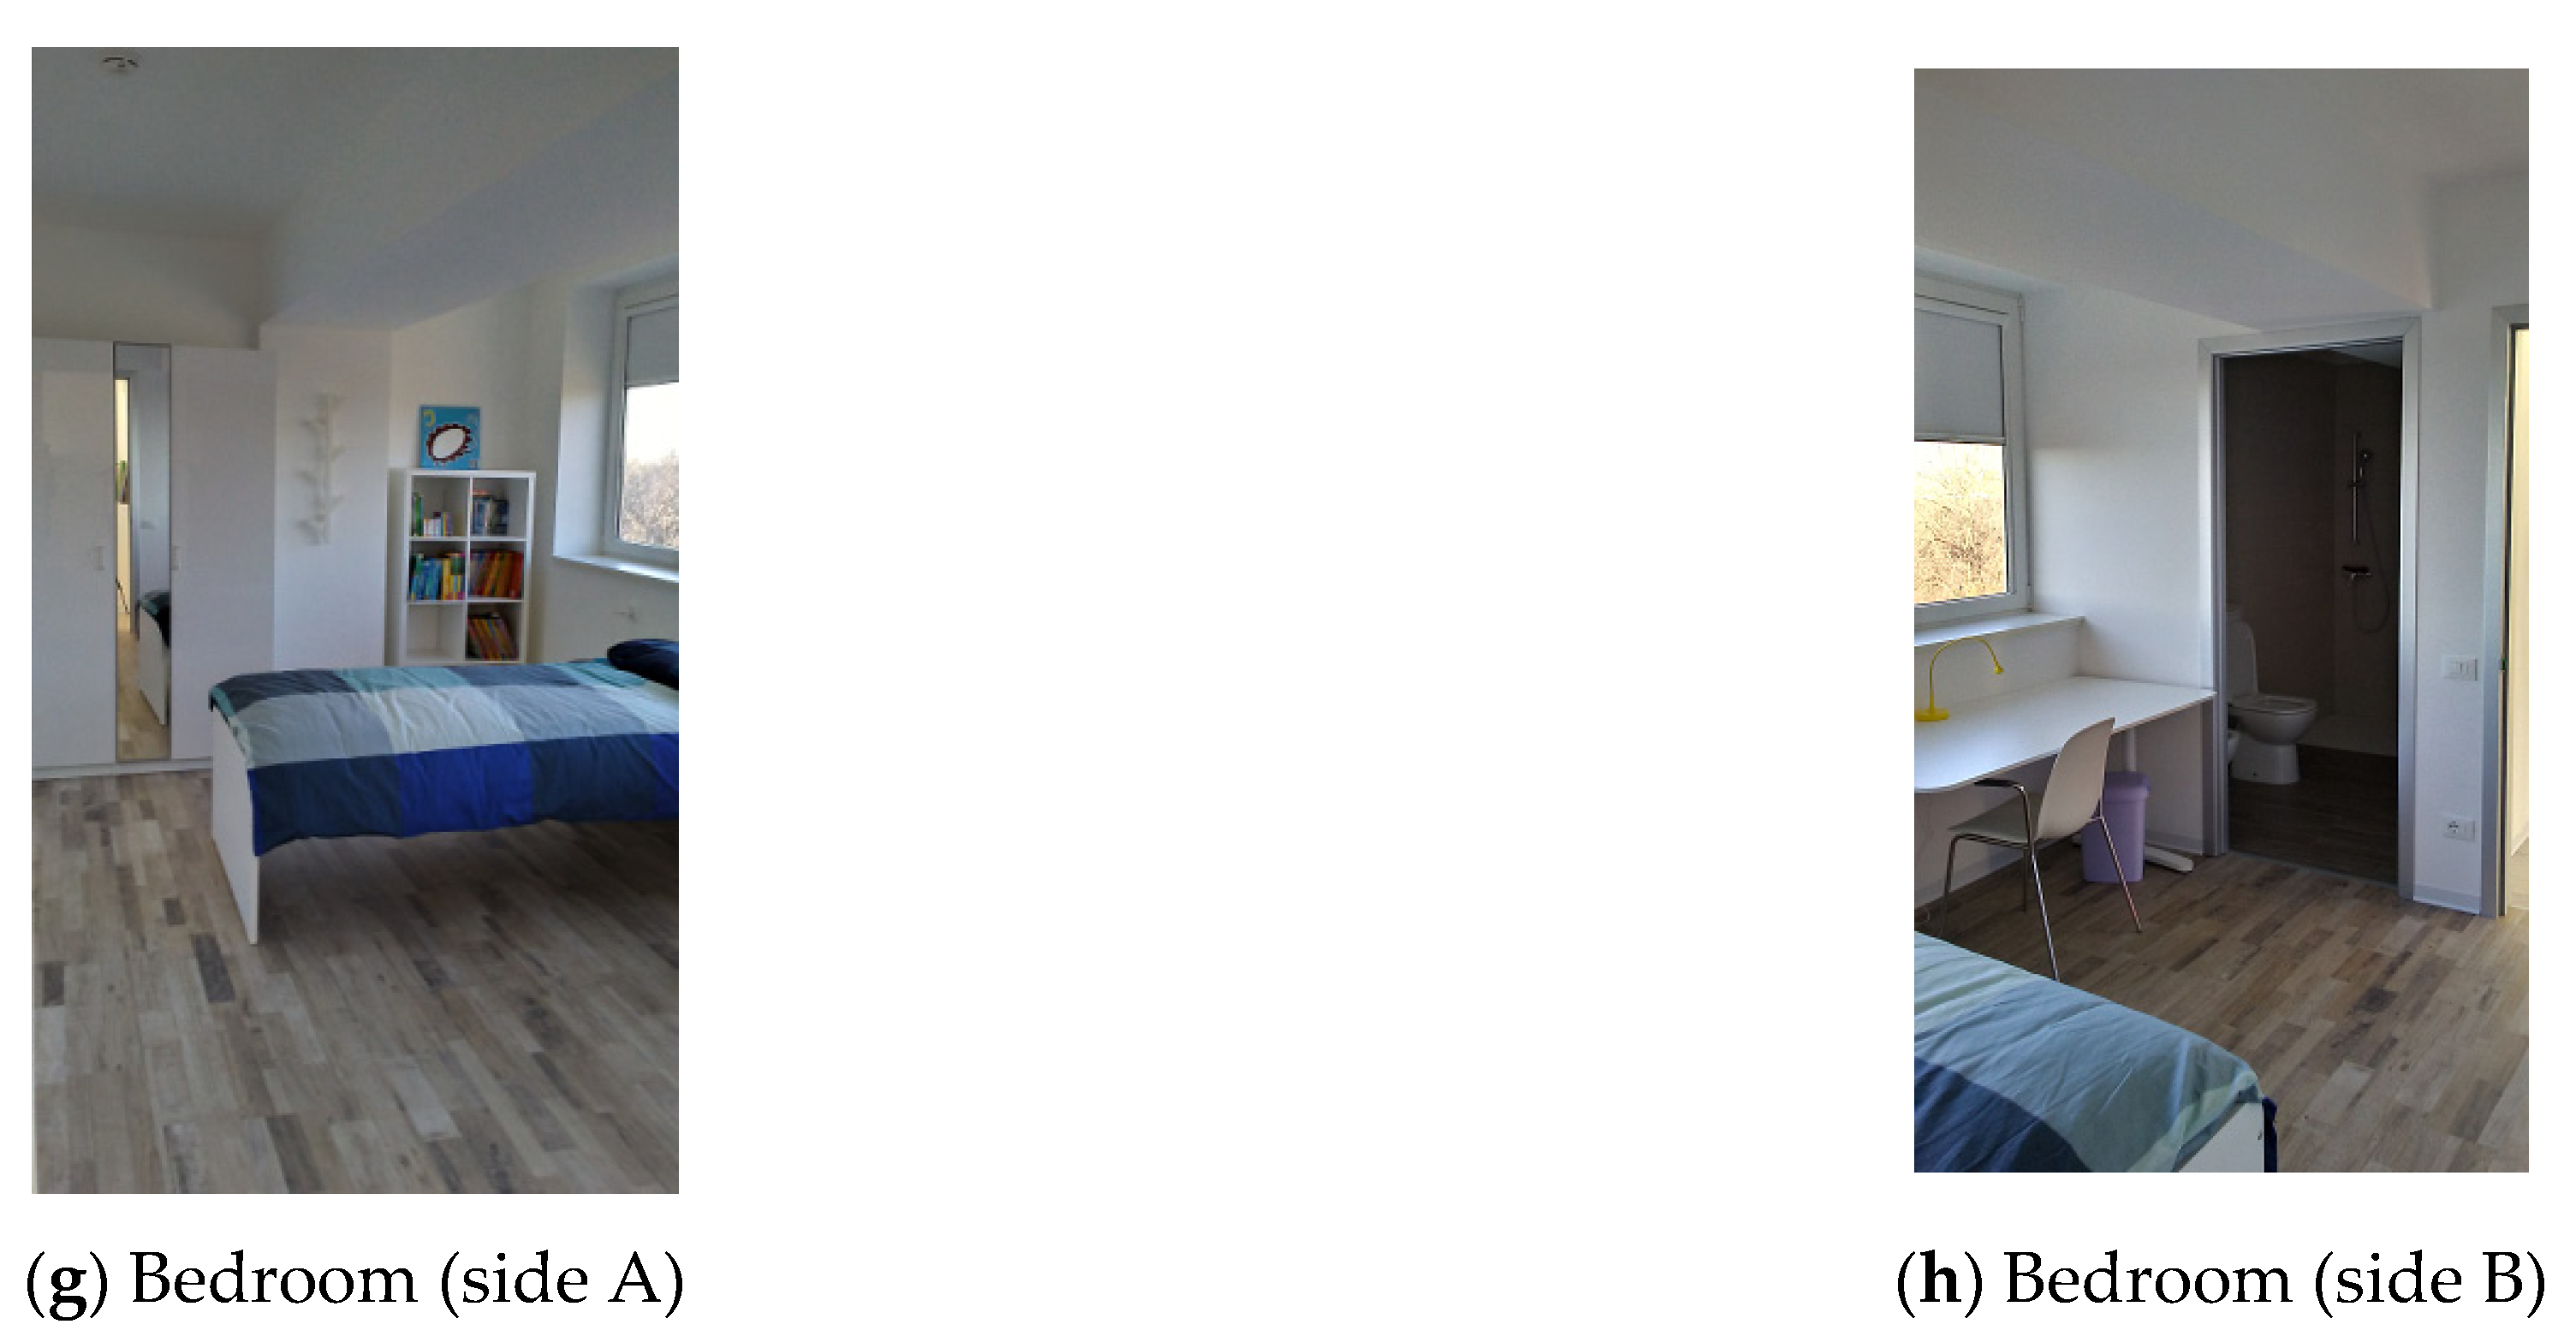
Furthermore, three other environments were taken into account: a soft room of 12 m2 dedicated as aa multisensory environment for the well-being of children and adults (Figure 2e), an atelier of 76 m2 for an art workshop (Figure 2f), and a bedroom of 16 m2 related to residential apartments (Figure 2g–h).
Rooms for individual therapy present different sizes, featuring (i) an entrance door and no window, (ii) very few pieces of furniture (a table and two chairs and few toys), (iii) lights, and (iv) few sound absorbing panels located on the ceiling. Some therapy rooms also feature glasses behind whom parents or other staff can attend therapy sessions. Rooms are realized using prefabricated traditional sandwich panels (pre-painted sheet metal/insulating material/pre-painted sheet metal type) and are located in an area of the building, which is particularly insulated from external noise (no windows) and from noise coming from inside (Figure A1, Appendix A).
These spaces need to be very quiet because this is one of the important user requirements. Inside each therapy space, a single operator works with a single individual and thus it is of paramount importance that nothing disturbs the quiet relationship and that acoustic requirements related to speech clarity and definition are fulfilled.
The soft room is located inside the day-center, equipped with impact resistant layering on the walls (up to about 2.10 m height), resilient flooring, and soft cubes, useful both for playing and limiting patients in particular moments of venting and crisis. In this room, the insertion of acoustic sensors may be useful to recognize events (screams, blows) and activate a process of help request (i.e., alert an additional operator and simultaneously trigger a process of audio-visual support).
The atelier (or art room) is a very large room used for collective works, wherein to host many guests and operators. Here, the main need for voice recognition devices would be to identify a help request coming from the operators, for example, through keyword detection. At the same time, a good distribution of the sound field coupled with a very high clarity and definition of the speech make it possible for ASD individuals to understand caregivers clearly.
The typical room in the residential apartments is 9 to 12 m2 large (hosting one or two individuals) and features large windows and a private bathroom. Guests can spend the night alone, while the operator remains in a neighboring room. For this reason, the main need for voice recognition devices is to identify a help request made by the operator, for example, through a keyword detection. At the same time, clarity and definition values need to be very high, featuring very small variation of the indoor sound field, in order to avoid that intelligibility alters when changing position.
In order to investigate the indoor sound field in every room, impulse response measures were conducted, in accordance with ISO 3382-1 standard [67] using, where possible, six positions for receivers and two positions of dodecahedral noise source, equipped with logarithmic sine sweep. In smaller rooms (therapy room no. 3), only four receiver positions and one source position were used. Results permit the analysis of the acoustic field in terms of indoor sound distribution, reverberation time, clarity and definition, in accordance with the indications in the literature. During measurements, tables, chairs, furniture, and other facilities in the rooms were not removed, doors and windows were closed, and electrical equipment was turned off. The receiver positions were set at 1.6 m from the ground and the measurement results were obtained using sound receiving points located at appropriate distance from the boundary surfaces, in accordance with [68]. However, the very local effect of interference between incident and reflected sound is not fully appreciable by means of present acoustic simulations. Anyway, we can consider valid the areal sound field near the sensor.
Then, 3D acoustic simulations were used to study possible alternative or optimized configurations. To this aim, measured RT values (T30) were used to calibrate the 3D models, which then permit the calculation of C50 and D50. The 3D acoustic ray tracing method was used and calibration was carried out fitting the partitions’ sound absorbing coefficients until results were similar to the measured ones.
Standard deviation was then computed by means of Equation (1):
where xi is the measured value and μ is the average of all measured values.
Furthermore, the mean difference was calculated (Equation (2)):
2.5. Indoor Design Effects
By means of this investigation, it is possible to understand if the studied facility complies with the defined ranges and if the indoor sound field distribution is suitable for the positioning of the sensors and individuals. Then, it is conceivable to foresee and insert acoustic interventions usable to optimize indoor environments for both autistic people and sensor positioning requirements. Indoor spaces characterized by different areas, volume, and destinations were simulated and it is possible to use them as starting points for a general definition of acoustic design principles. Different spaces were further investigated from an acoustic point of view: rooms with medical and civil destination (small size room: therapy room no. 4 and bedroom) and the activity room (large size room: atelier).
The influence of the indoor design and of the furniture positions on the indoor sound field are shown and analyzed by means of numerical simulations, considering the acoustic sensors and ASD individuals’ combinations of needs. Thus, four configurations were developed and studied:
- (i)
- empty room;
- (ii)
- furnished room;
- (iii)
- sound absorbing areas positioned only on the ceiling; and
- (iv)
- sound absorbing areas positioned partially on the corners and partially on the ceiling. This configuration may eventually be split into two variations in order to achieve better spatial distribution: (iv,a) where sound absorbing areas are distributed along the perimeter between side walls and ceiling, and (iv,b) where sound absorbing areas are distributed partially on the corners and partially on the ceiling.
3. Results and Discussion
From the above-mentioned literature review (Section 2.1 and Section 2.2), the range RT = 0.4 ÷ 0.7 s (mean values for the octave frequency bands of 500 Hz, 1000 Hz, and 2000 Hz) appears to be optimal for both the application of microphones and for subjects particularly sensitive to auditory stimuli. From the point of view of C50, the literature also suggests aiming at C50 ≥ 2 dB (same RT frequency range), while for D50, the selected range is, as for RT, the one comprising all the found limits: D50 ≥ 0.7. Graphical results are reported in Figure 3, where the grey rectangles highlight the chosen reference ranges.
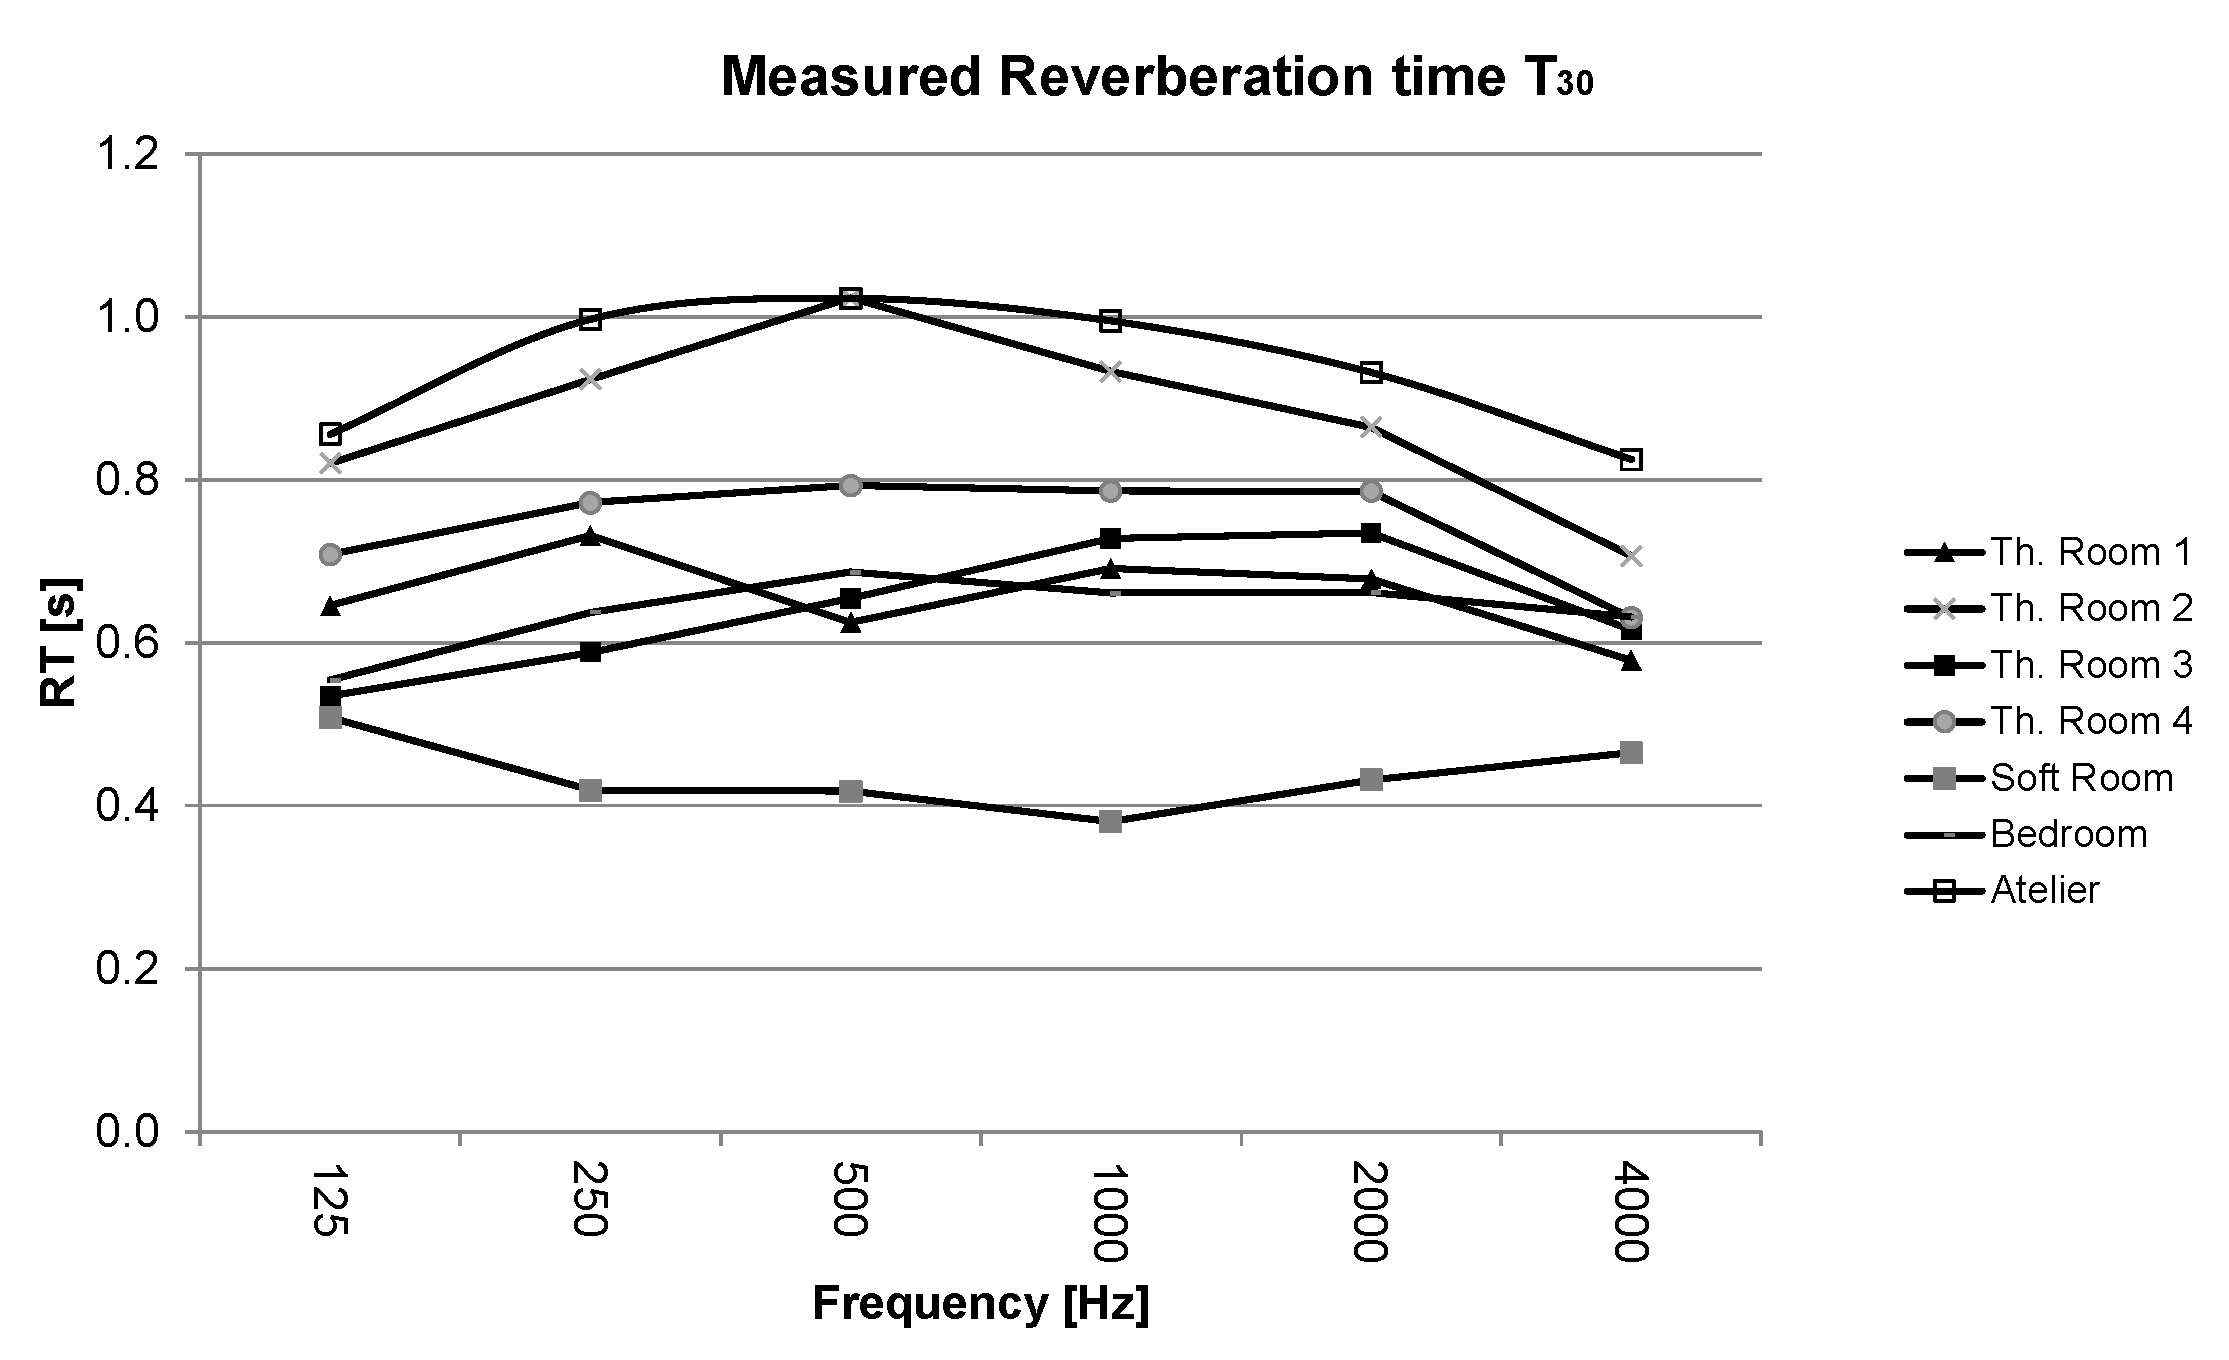
The measured RT frequency trends (average of six positions) for each room are reported in Figure 4. As above-mentioned, these values were used to calibrate 3D models. In Table A1, the measurement accuracy is depicted, highlighting very small variations in the tested results. The RT frequency trend in each analyzed room was quite linear only for a specific room (Soft room); small rooms (Th. Room nos. 1, 3, 4, and bedroom) presented RT frequency values between 0.5 and 0.8 s; the largest rooms (Th. Room no. 2 and atelier) depicted a volcano-shape pattern with higher values (RT > 1 s) at 500 Hz. In terms of arithmetic (RT) and logarithmic (C50 and D50) mean values, three out of seven rooms resulted in being out of the optimal considered ranges for the reverberation time parameter. It is worthy to remark here that every room was equipped with some sound absorbing panels.
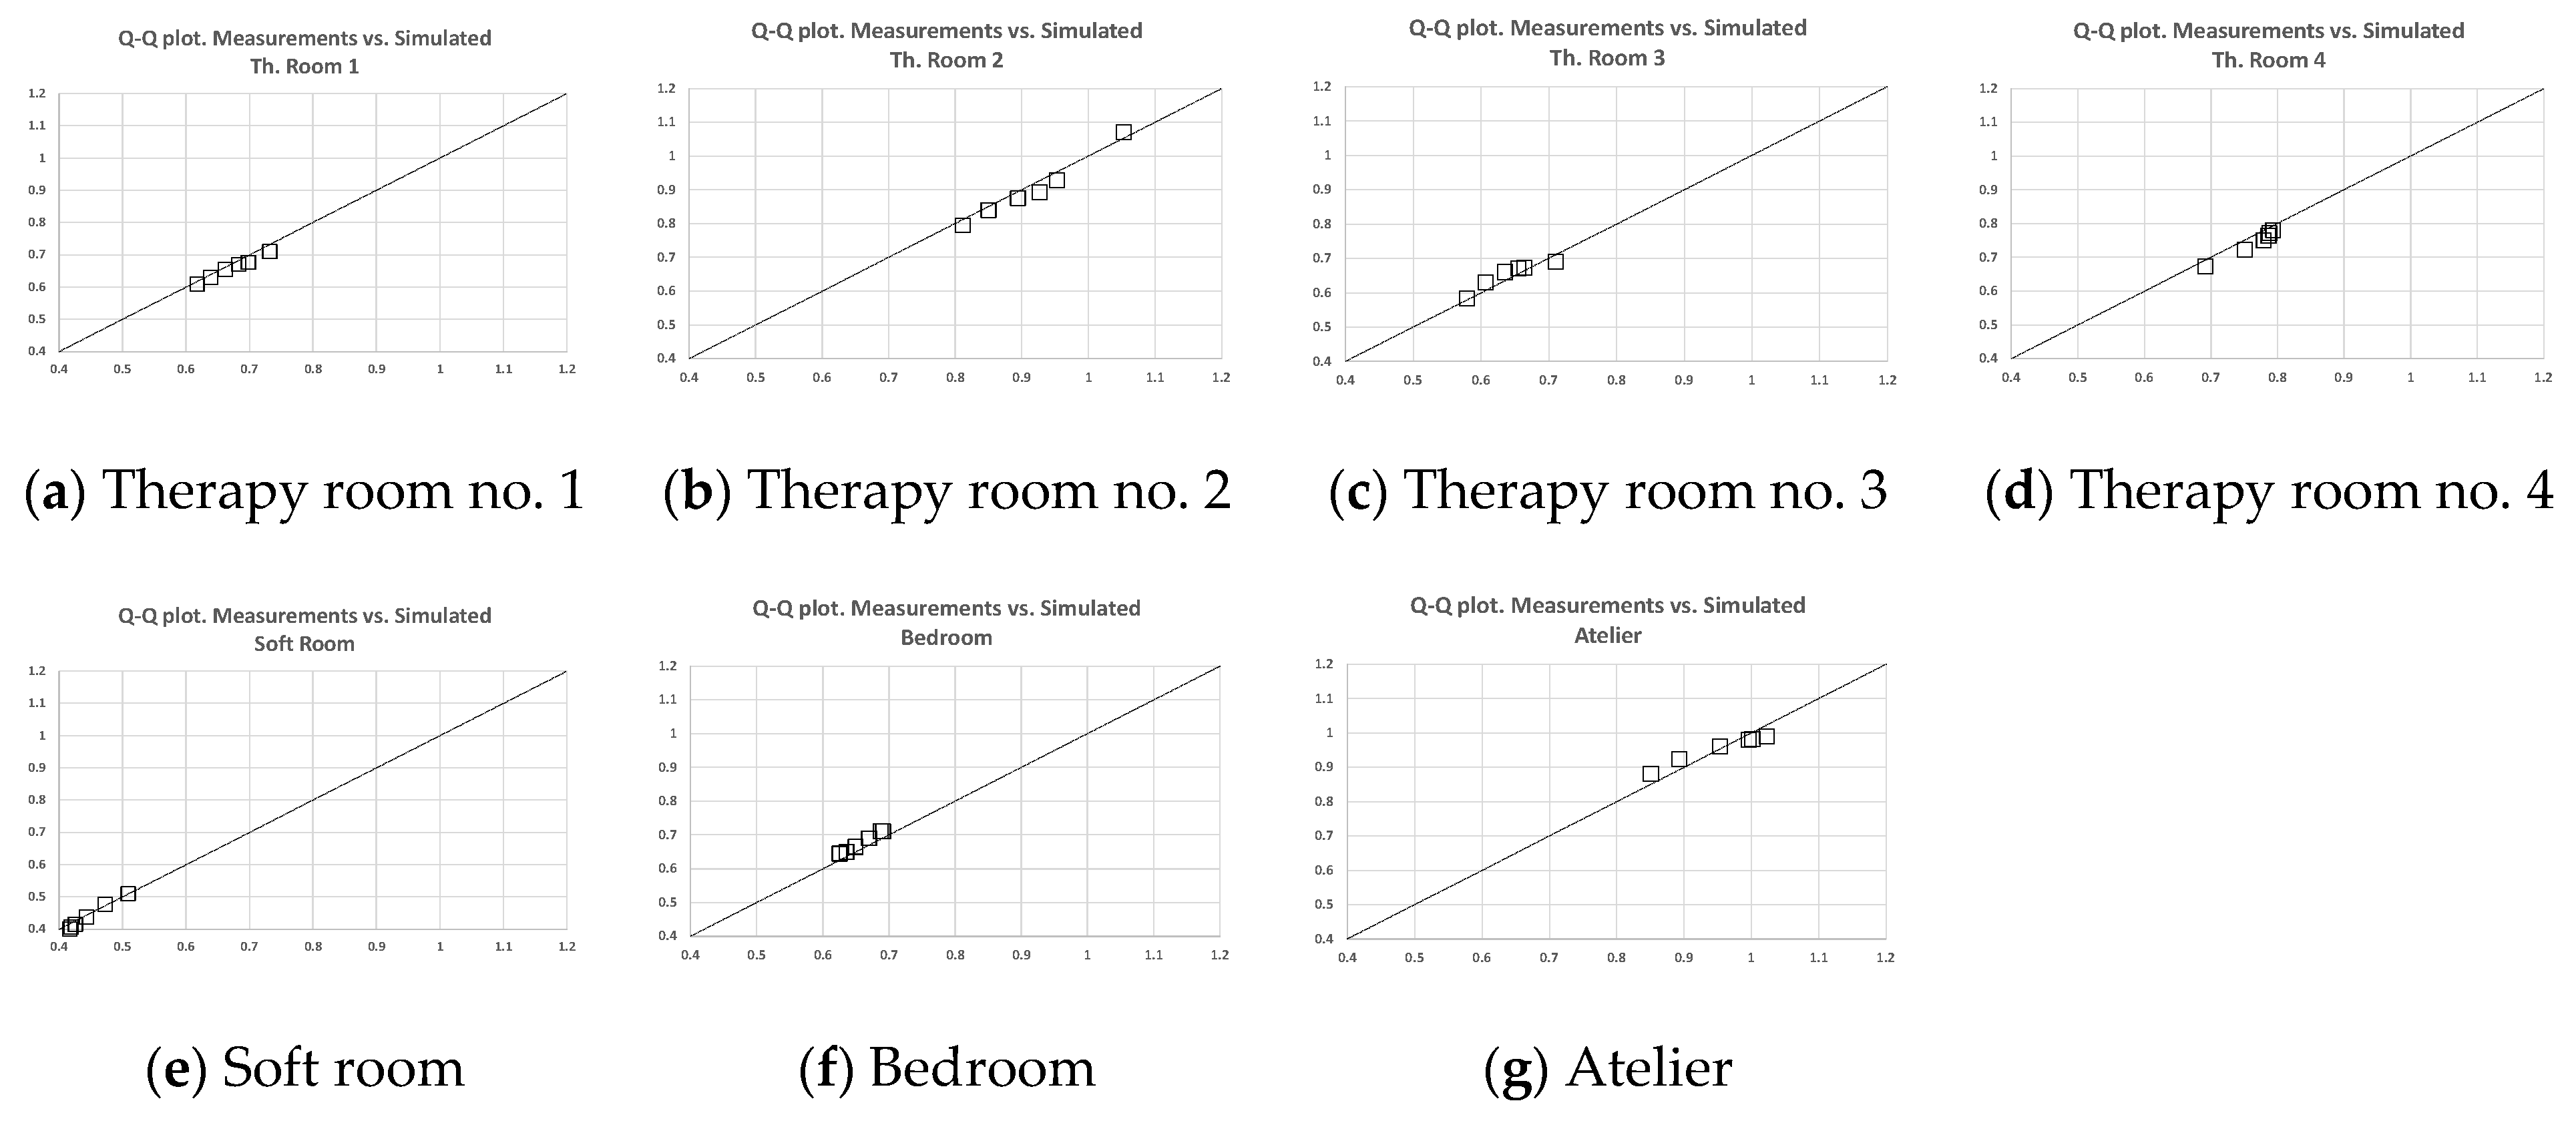
In Appendix A, Figure A2a–g describes the room models considered for the acoustic simulations, furnished as in the real conditions, while, in Figure A3a–g, the results in terms of the Q–Q plots referring to reverberation time (octaves bands) are reported, demonstrating a very good agreement between the measured results and simulated ones. The calibration of 3D models permits the consideration of also clarity C50 and definition D50. The results in terms of the averaged values related to the frequency range 250 ÷ 2500 Hz of all the investigated parameters are reported in Table 1. Results are listed considering the average of all receiver positions for RT, while values were retrieved at a distance of 2 m from the source for C50 and D50. This range was chosen in accordance with the work of Kertész and Turunen [34].
It is evident how some rooms do not respect the selected ranges depicted in Figure 3 and thus some measured environments should be acoustically improved to achieve better indoor acoustic comfort.
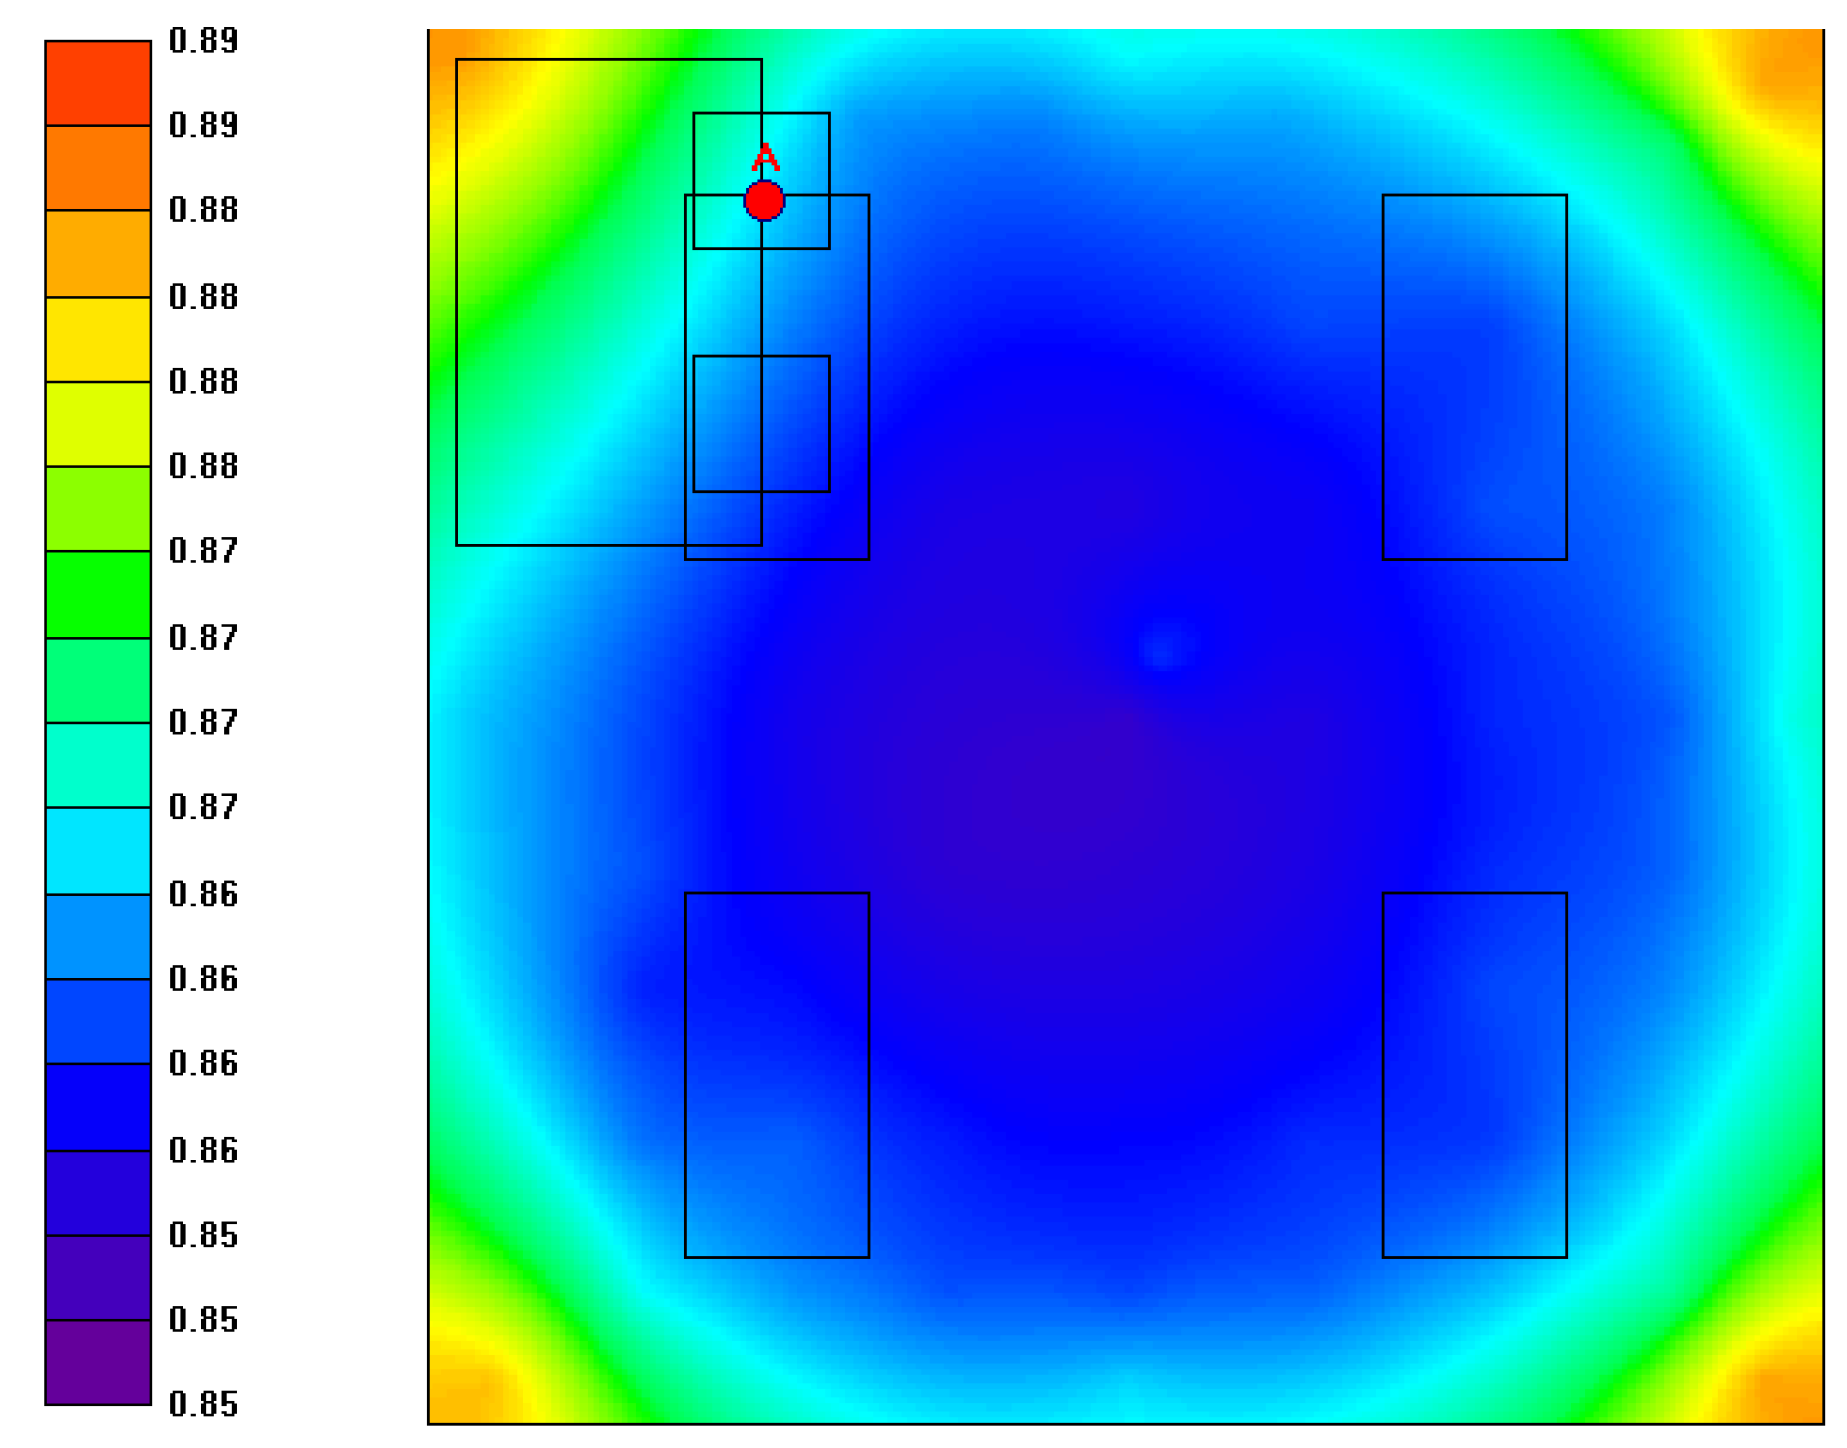
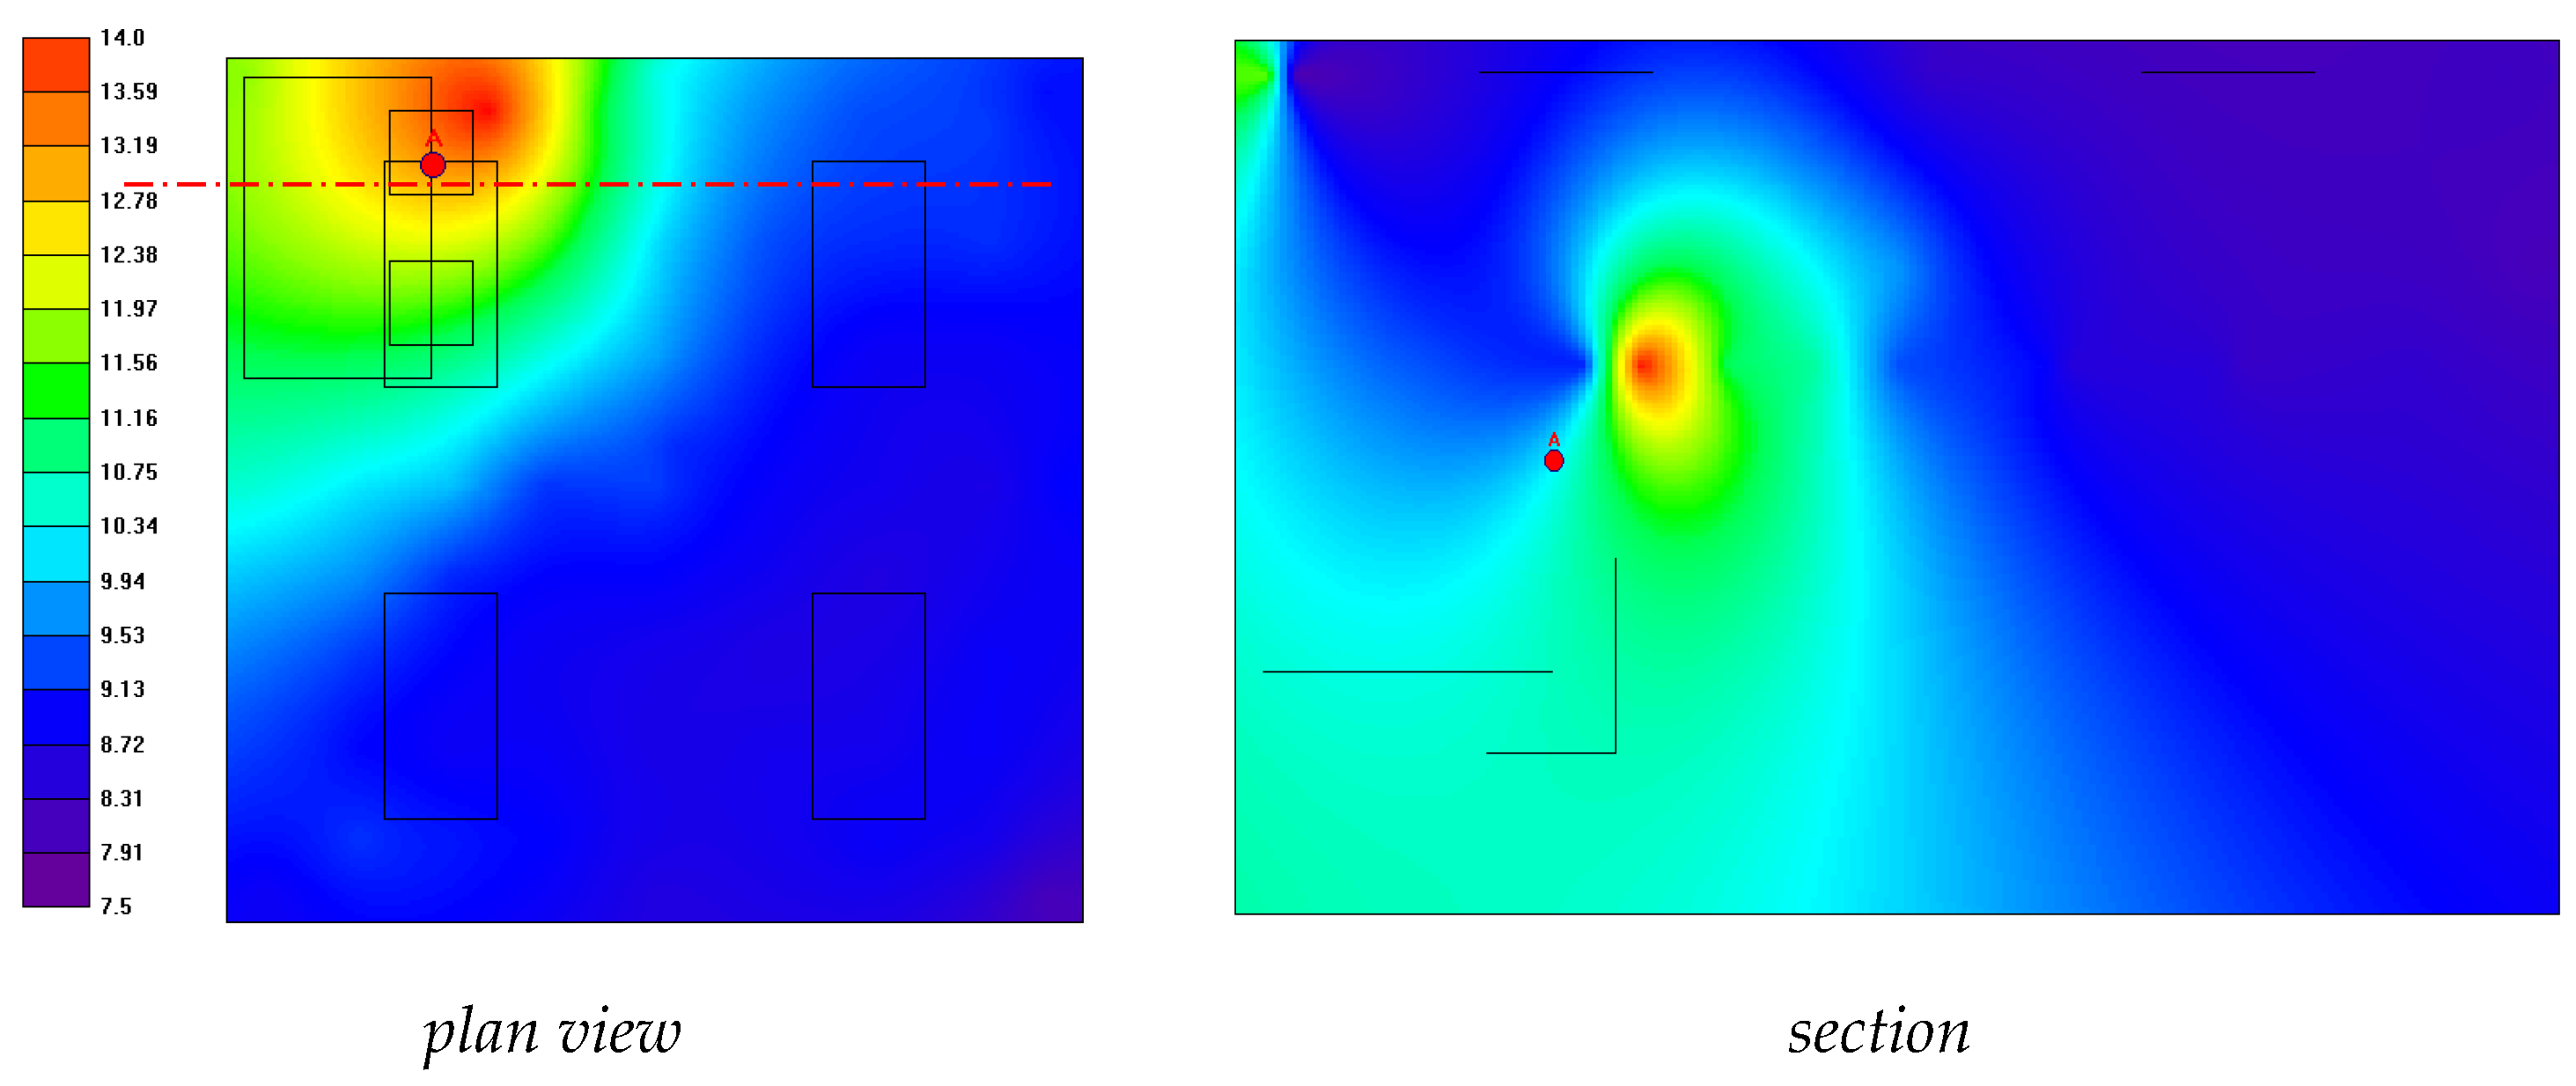
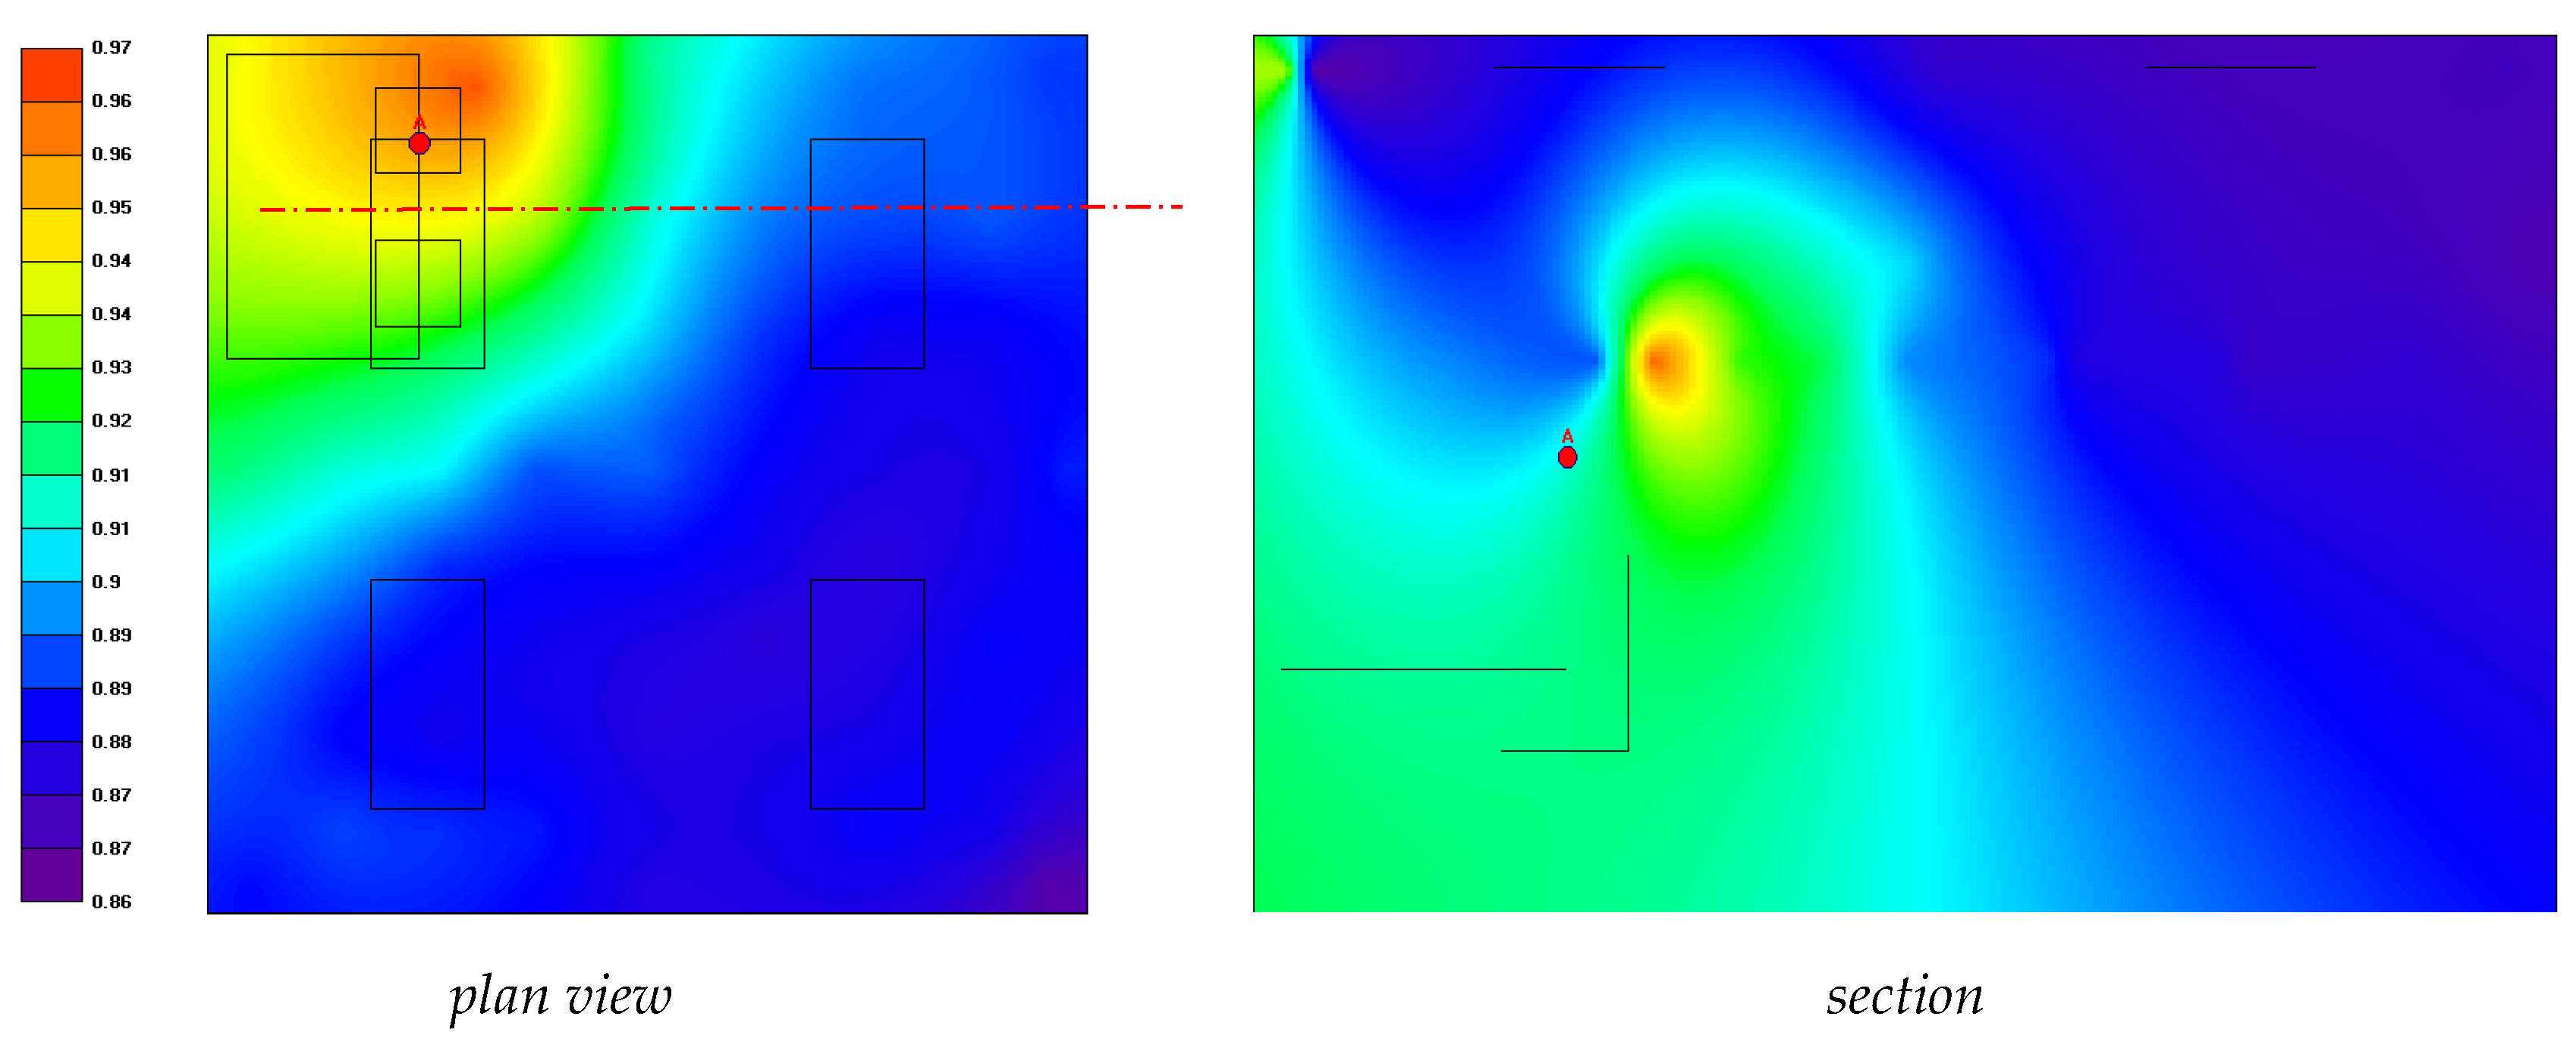
By means of 3D simulations, the indoor sound field distribution related to the objective parameters could be investigated, permitting the search for focusing phenomena, other scattering issues, and the material distribution inside rooms. These events may affect operative sensor conditions and speech clarity and definition. Accordingly, if reverberation increases, the difficulty in identifying and recognizing a sound signal will rise. For example, the spatial distribution of the reverberation time included in therapy room no. 2 (Figure 5) shows how the corner positions do not represent the optimal device locations. Even if corners could embody good places where no obstacles to such furnishings, chandeliers, curtains, or other objects are present, they are unfortunately the room points where reverberation is higher and different from the source area. The sound field analysis of C50 and D50 (Figure 6 and Figure 7) shows that the optimal positions for the acoustic recognition devices are located in the proximity of the spaces most likely to be occupied by users (e.g., on top of a table, near the center of the ceiling or walls, etc.). This means that placing sensors adjacent to the ceiling is not the best choice because of the reverberation increasing. Preferably, an installation of several devices is suggested. Since simulations demonstrate that corner positions have to be avoided, central points on vertical partitions have to be preferred. At the same time, the definition of the most probable caregiver–individual position inside the room is helpful to select the correct layout. This is to ensure that autistic individuals will not suffer from indoor sound field focalization or huge variations when moving around in a room or echo and/or annoying reverberant phenomena.
Furthermore, it is possible to highlight that reverberation time does not change sensibly when varying position and height within the room. Thus, this parameter cannot be sufficient to choose appropriate positions for sensors and to describe optimal indoor acoustic conditions for autistic individuals. Conversely, C50 and D50 also provide variation along the z-axis. For this reason, they are essential for the determination of final sensors and the individuals’ locations. Accordingly, they provide very useful indications on the best sound field within rooms, thus highlighting where it is better to sit or place individuals on the spectrum.
The same results obtained for therapy room no. 2 can be applied to therapy room no. 4. Conversely, the atelier may require the application of several devices in order to better acquire soundwaves.
The soft room presents the lowest values of reverberation time because of the contained “soft” furnishing, composed of sound-absorbing materials like polyurethane foams. Spatial distribution of reverberation time and definition at 1000 Hz frequency band (Figure 8) were quite good and it can be highlighted that when corner focusing is still present, the phenomenon is very limited. This means that the indoor sound field can be considered homogenous. In this case, the absence of furnishing accessories and the possible movement of the user inside the room will not affect the sensor positioning. For the same reason, when individuals are stepping around in the room, they do not perceive sensible clarity and definition alterations because no JND was found (Figure 8).
From this investigation, it can be concluded that even if some rooms fairly fulfil the acoustic requirements in terms of RT, C50, and D50 (Figure 3, Table 1), they failed to correctly host both devices and individuals because of the sound field distribution issues. Thus, dedicated optimization is needed.
Most of the analyzed rooms need to be studied in order to optimize reverberation for both the requirements of acoustic sensors and autistic people. In order to improve the values of the objective parameters (RT, C50, and D50), sound absorption units can be increased by using suitable walls and ceiling finishing materials, or appropriate furnishing accessories.
The living space acoustics can be controlled by the insertion of sound absorbing elements of various types, but in the case of autistic users, it could be helpful to follow the fundamental concept of “simplicity” [69,70]. In few words, this implies the reduction in the furnishing accessories in the rooms and avoiding the insertion of suspended sound absorbing elements such as buffers.
Rooms with long reverberation times, characterized by acoustically highly reflective surfaces, are particularly unsuitable for many types of individuals with hearing impairment: some ASD children, for example, will find the room distressing; children with hearing problems may also perceive the noise as painful because reverberation and poor acoustic definition and clarity is amplified by their hearing aids [71].
Therefore, available solutions have to be sorted in order to meet the individuals’ needs and attitudes, avoiding traditional choices and carefully analyzing acoustic interventions. For example, thick textured curtains hanging from windows may represent sound absorbing elements in the room. The placement of sound absorbing panels (such as micro-perforated or open cells material panels) may alter the wall’s appearance. Accordingly, individuals on the spectrum could dislike discontinuity related to vertical walls [72,73]. Beds, cushions, armchairs and sofas are commonly present within the environments of autistic people and they represent intrinsically sound absorbing elements; the implementation of these furnishing accessories in terms of sound absorbing surfaces could then be considered.
The possible inclusion of all of these elements in the indoor environment should therefore be studied in advance, in order to optimize the indoor acoustic characteristics of the room and to define the possible addition of sound absorbing units.
Sound Field Distribution and Layout Optimization
The first investigated case was the therapy room (small room, medical space), wherein, excluding the presence of sound absorbing furniture, carpets, or curtains, the sound absorbing units can be increased only by using ceiling elements or positioning sound absorbing panels on the upper part of the walls (Figure A4). Configurations (i) and (ii) have already been discussed in Section 3.
If an entire ceiling is chosen as a sound absorbing surface (configuration iii), the reverberation time of the room decreases at 1000 Hz from 0.87 s (Figure 5) to 0.62 s (Figure 9, right) as a mean value; thus, the indoor sound field fulfills the optimal range for sensor devices, but it fails to comply with the best ASD individuals’ requirements (0.4 s). Consequently, more sound absorbing surfaces are needed. Using frequency representations and considering for the sake of brevity 250 Hz representing low frequencies and 1000 Hz for mid-high ones (Figure 9), it is possible to highlight that corners present wave focusing in both cases. From the subjective point of view, no sensible difference with regard to JND was assessed in the blue and light blue areas. Conversely, when stepping inside green, yellow, and red ones, RT varied and one JND could be verified.
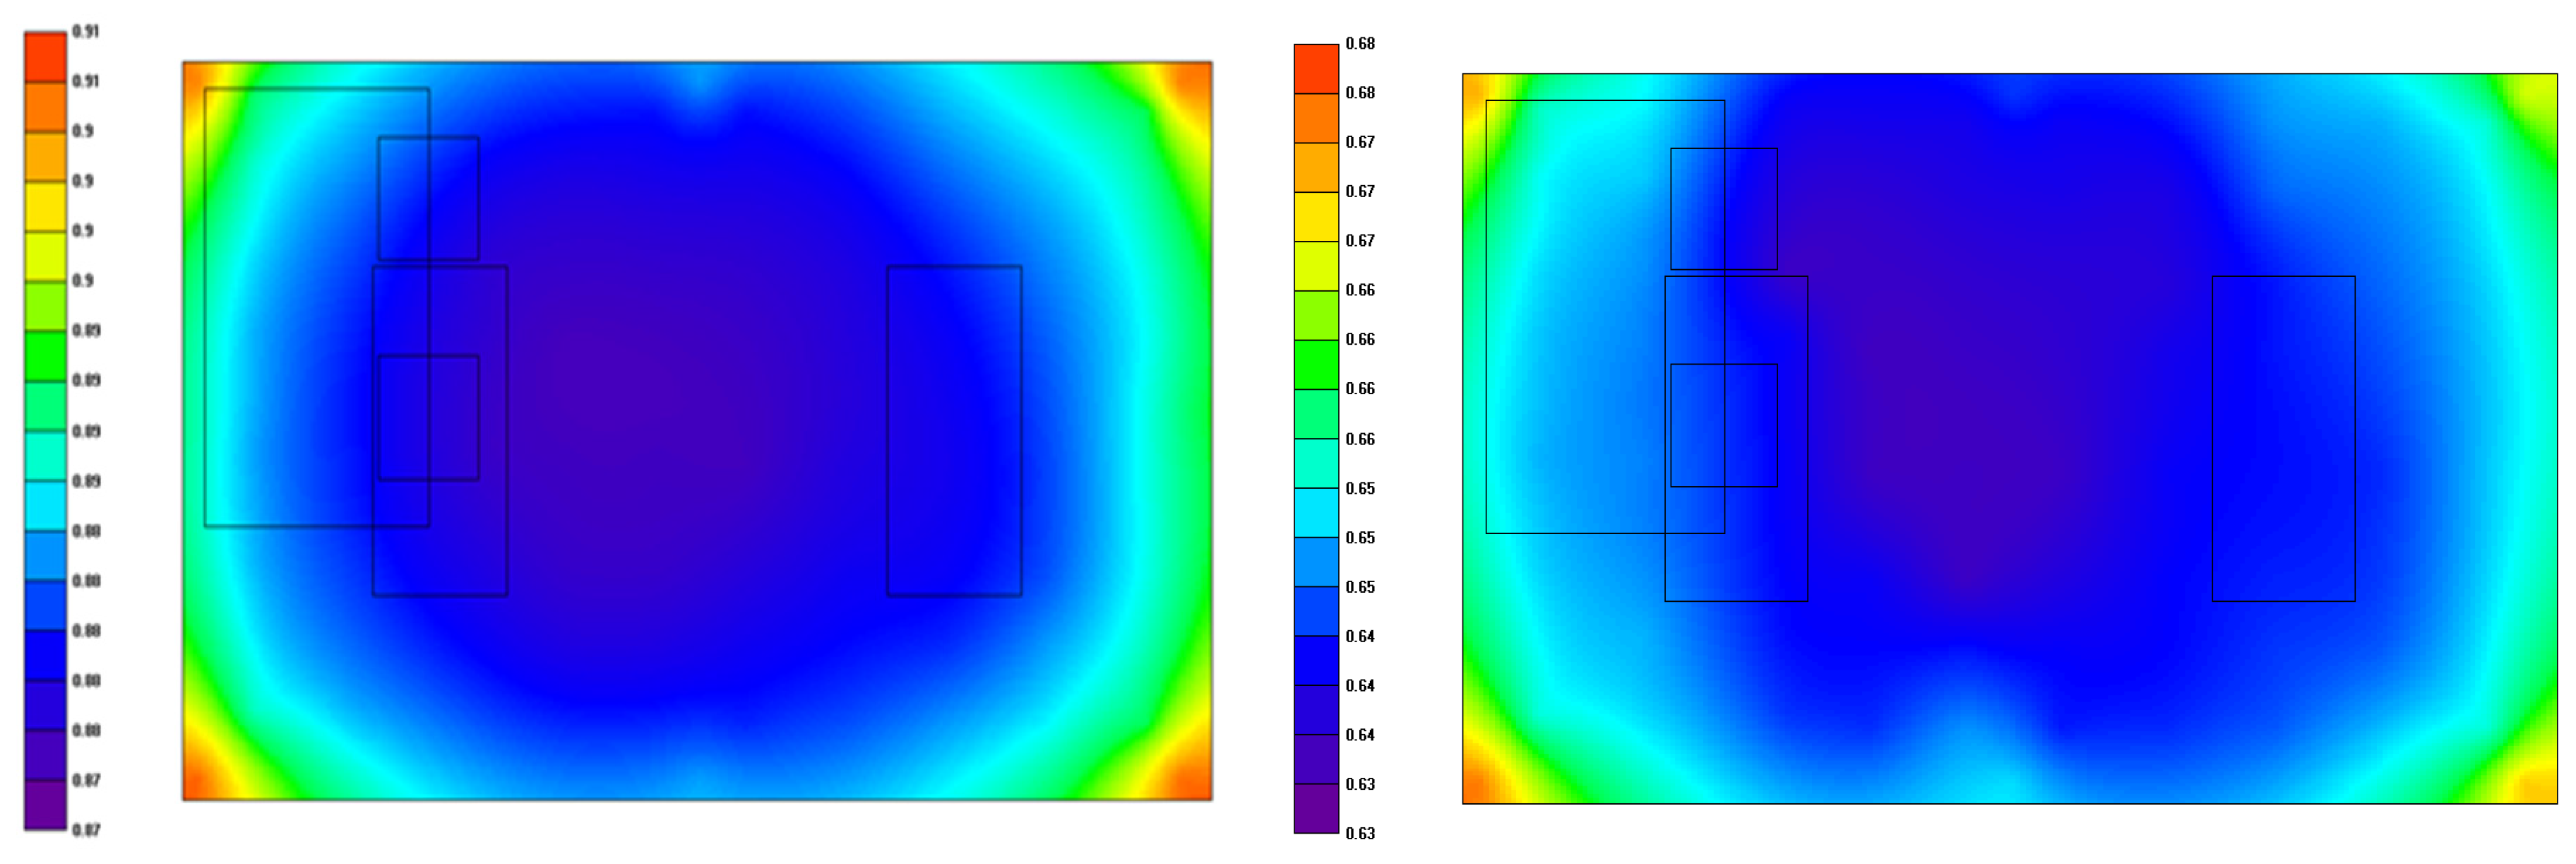
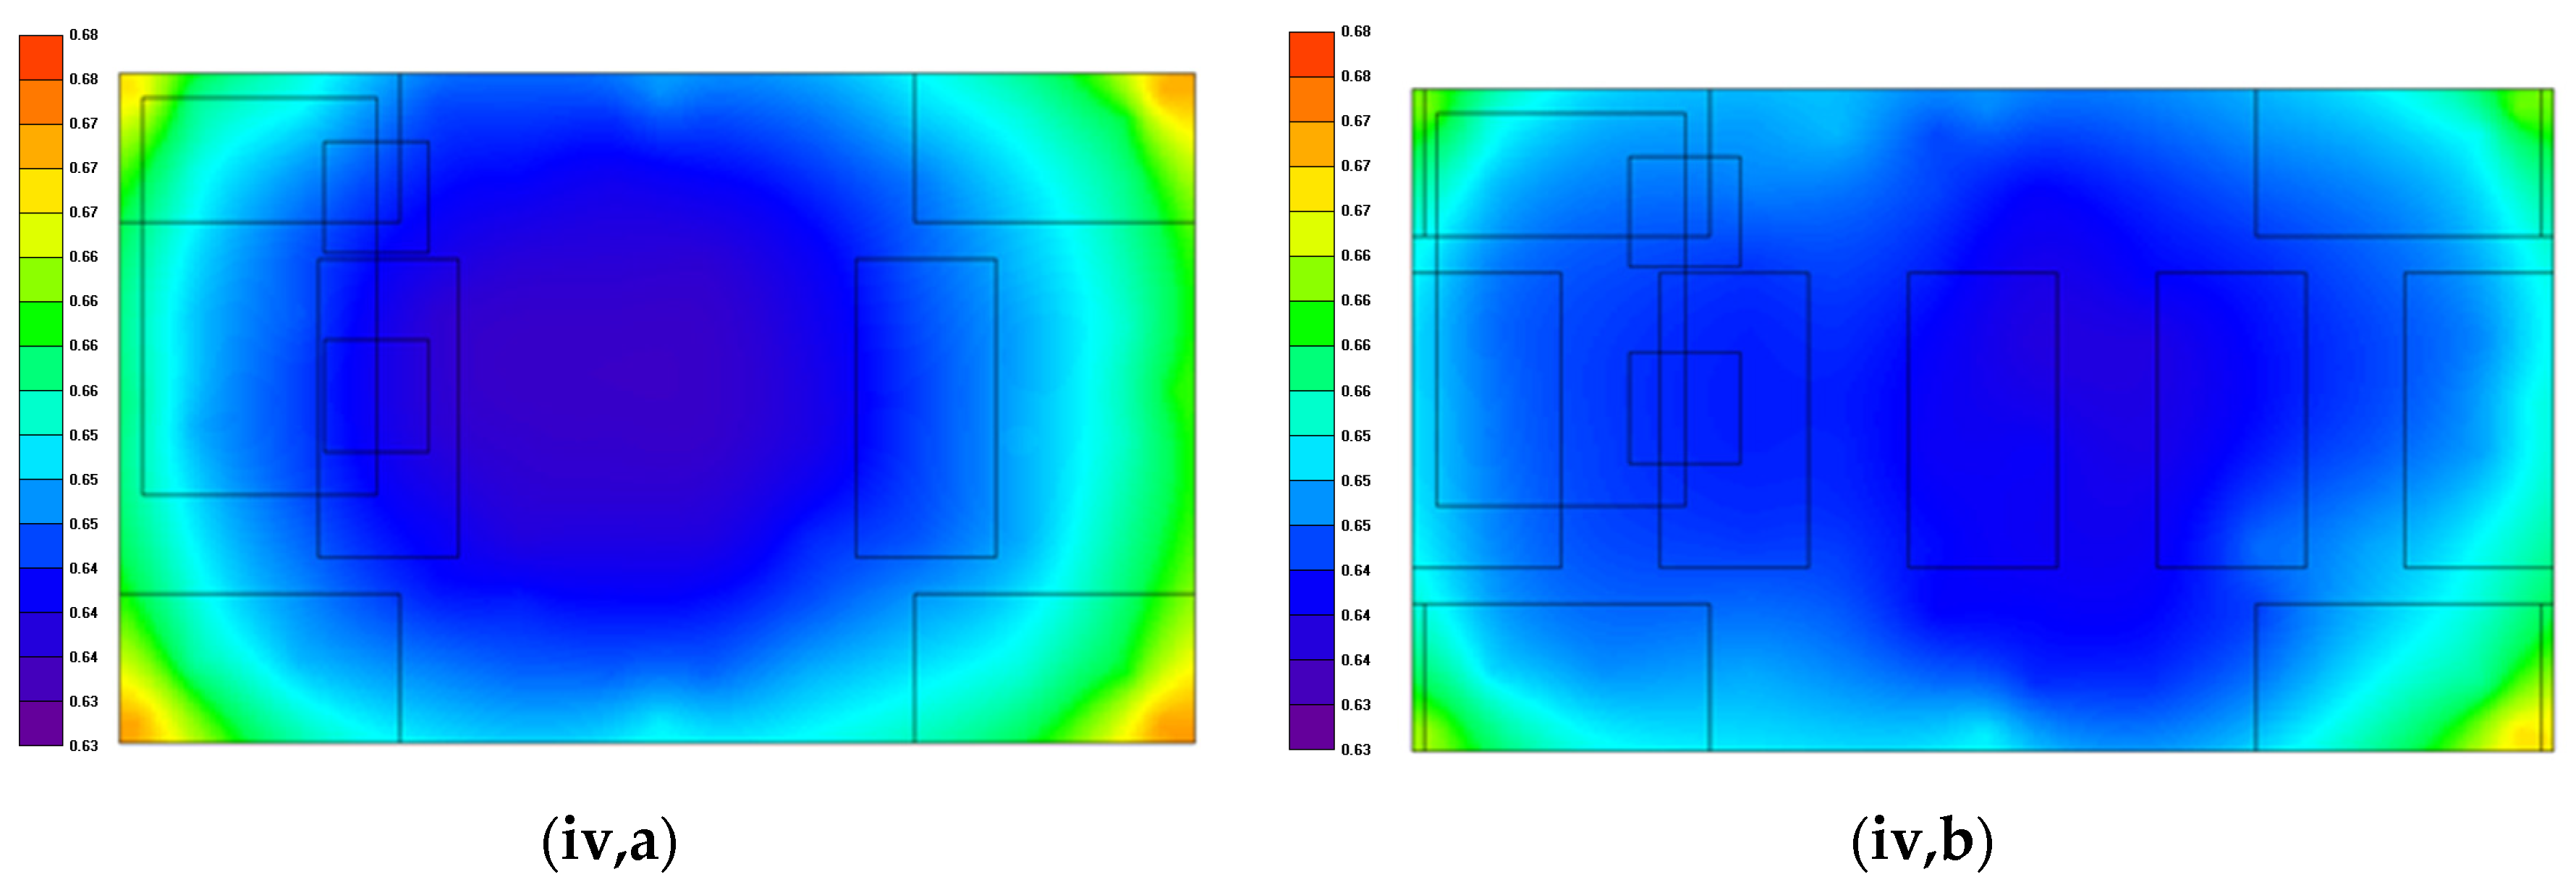
In order to achieve better spatial performance using the same amount of sound absorbing surface, more distributed configurations are required. For this room, two variations of configuration (iv) have been proposed in order to verify if different configurations are to be chosen or if they provide similar results. Thus, in Appendix A, Figure A4 depicts the (iv,a) and (iv,b) sound absorbing area layouts and Figure A5 shows the results for configurations (iv,a) and (iv,b) for the reverberation time parameter at 250 Hz. Figure 10 presents the results at 1000 Hz. For the sake of brevity, only RT mapping is represented while C50 and D50 are reported in tables.
A more distributed application of sound absorbing material eliminates focusing effects in corners and improves the sensor range and individuals’ perception. However, different spatial allocations can create visual discontinuities, which should comply with the individual requests of continuity and simplicity. For this reason, an acoustic neutral masking surface could be needed to hide the sound absorbing panels.
It is worthy to highlight that in these configurations, the reverberation time does not denote any significant variation in most available areas; thus, the two configurations provide the same effects. For this reason, in the following, only one configuration will be investigated as configuration (iv).
Table 2 shows the comparison of the analyzed configurations for therapy room no. 4 in terms of C50 and D50 (average of the frequency range 250–2500 Hz, retrieved at 2 m from the source). As it is possible to notice, the values of these parameters increased when moving from configuration (ii) (Table 1) to (iii) and presented non-significant variations in configurations (iv,a) and (iv,b).
The second case is represented by the bedroom (small room). The difficulties are related to the presence of large windows, doors, and furnishing accessories that could be sound reflecting (desks, wardrobes, shelves) and sound absorbing (bed, curtains). Their position affects the layout of the sound absorbing elements and, consequently, the insertion of the microphone sensors.
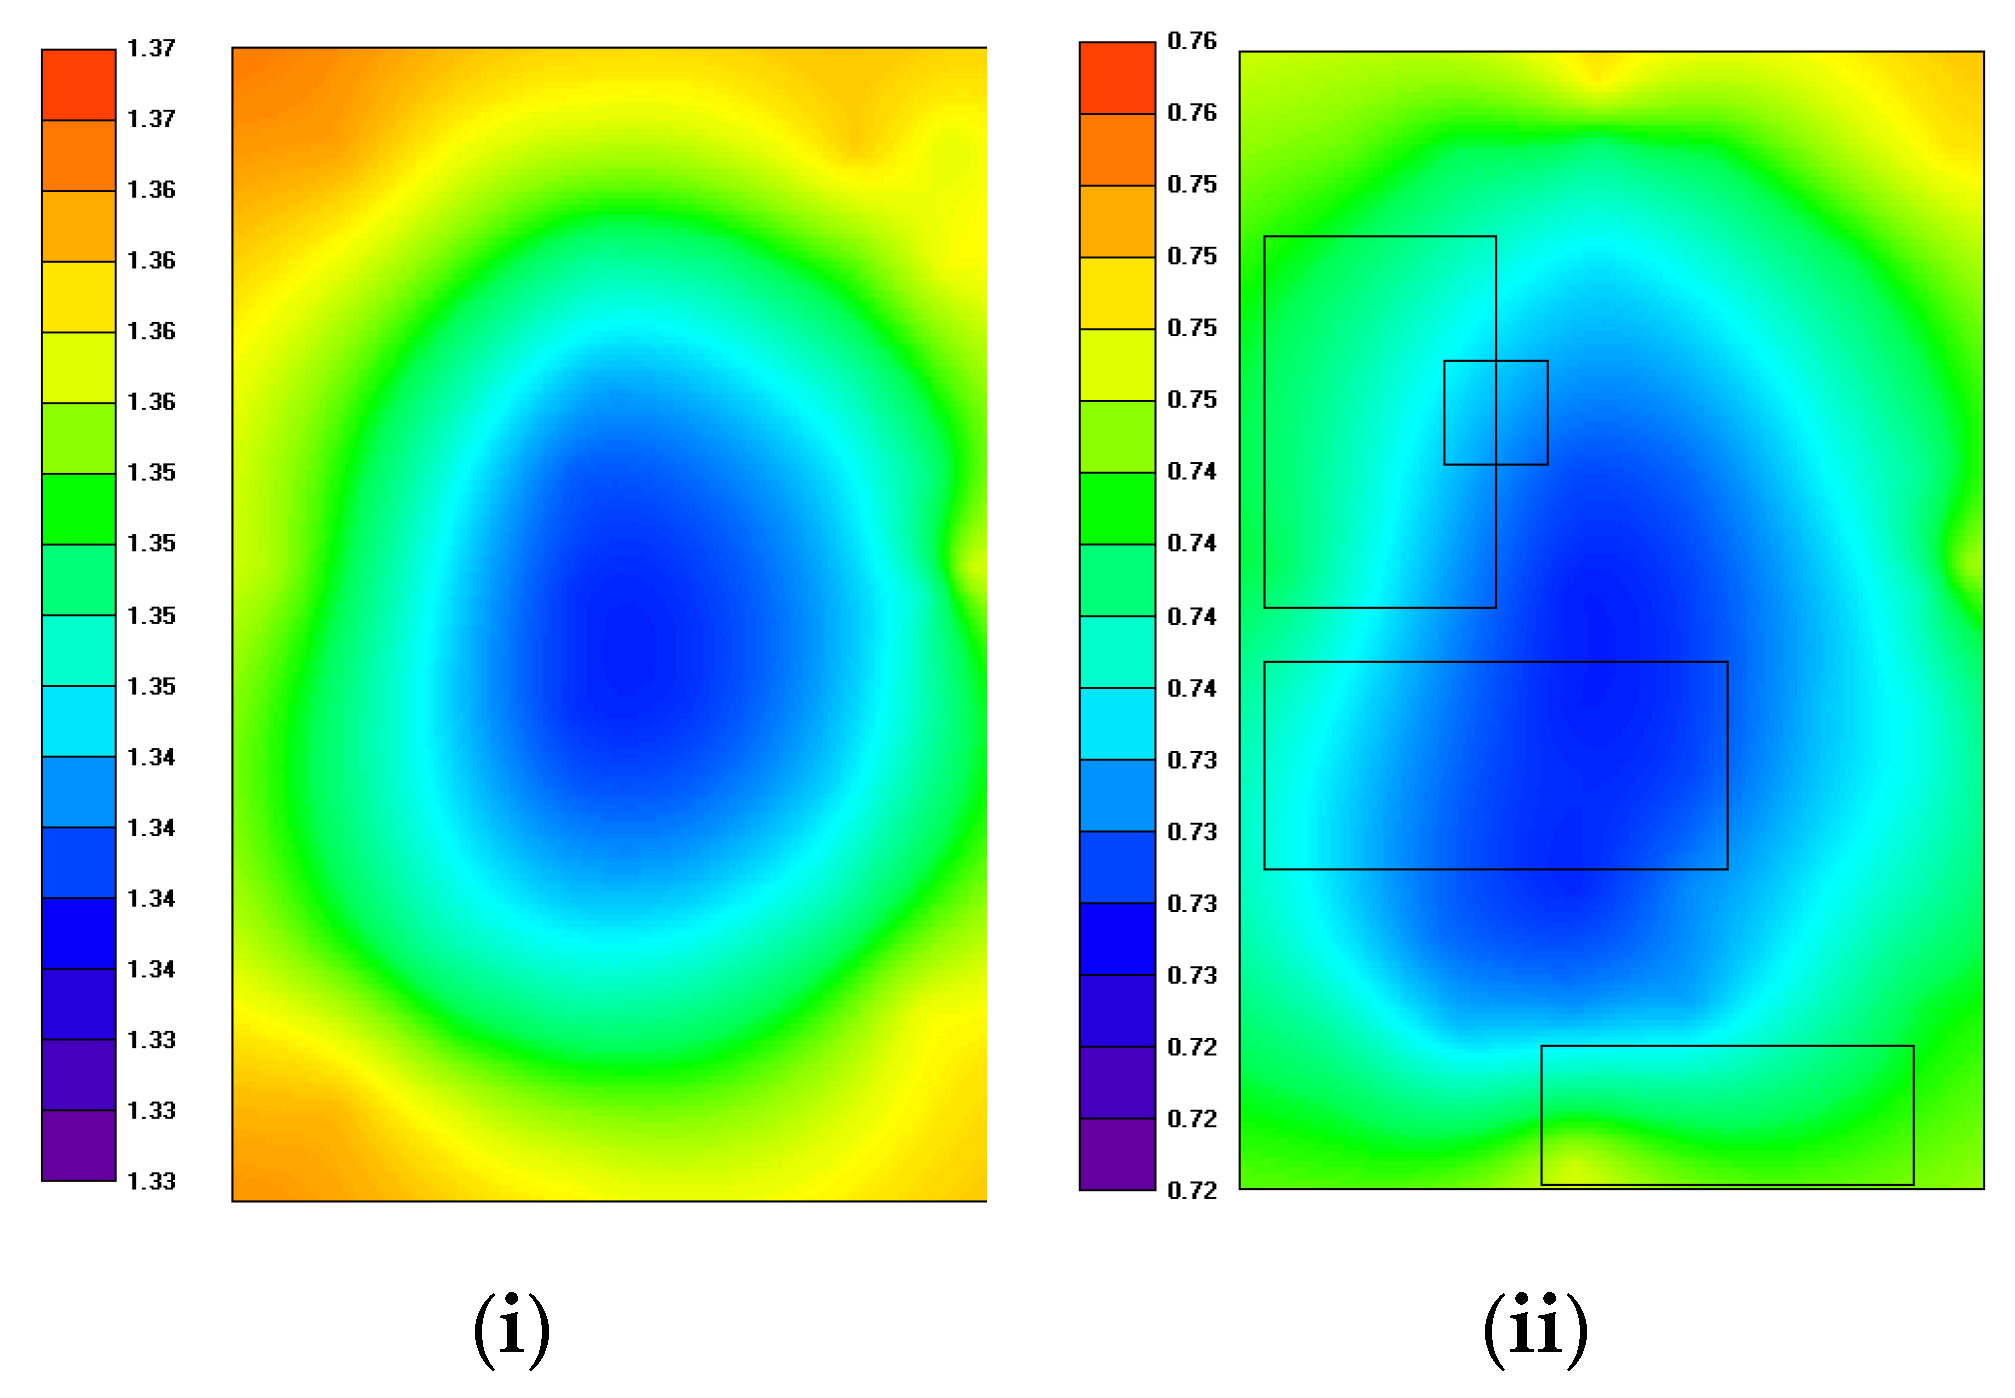
Diverse conditions can be analyzed as described above. In Figure A6 of Appendix A, configurations (i) and (ii) are described. From the simulation, it is possible to retrieve a mean reverberation time value for the empty room at about 1.3 s at the 1000 Hz frequency. As expected, the inclusion of furnishing accessories in the room (a desk, a wardrobe, and a bedroom with winter blanket and pillow) led to a lower reverberation time (RT = 0.7 s at 1000 Hz). Figure 11 shows the comparison in terms of the indoor distribution of the reverberation time at high frequency (in Appendix A, Figure A7 depicts the reverberation time at 250 Hz and Figure A8 the configurations outlines).
In this case, the presence of a very large window and the absence of sound absorbing elements on the ceiling create an uneven acoustic field. The sound focusing in the corner remains rather marked at low frequency. The need to add sound absorbing units is mandatory for both the insertion of acoustic sensors and for autistic individuals’ purposes. Accordingly, one JND variation was verified in both sound field distribution. Simulations demonstrate that a ceiling sound absorbing surface could be sufficient to improve reverberation time at low frequencies. As described, it can also be placed inside the room in different ways. Appendix A, Figure 8, reports the modeled room for the following configurations: (iii) with sound absorbing surface distributed only on the ceiling and (iv) with the sound absorbing surface distributed partially on corners and partially on the ceiling. Figure 12 shows the comparison of the spatial distribution of the reverberation time parameter at 1000 Hz for the modeled configurations (in Appendix A, Figure A9, the acoustic field distribution at 250 Hz is reported). Table 3 shows the comparison of the analyzed setup for the bedroom in terms of C50 and D50 (average of the frequency range 250–2500 Hz, retrieved at 2 m from the source). In this room, it could be highlighted that values increased, changing from configuration (i) to (iii) and provided non-significant variations for configurations (iii) and (iv). Accordingly, no JND variations were found.
The quality of indoor sound field distribution at the low and high frequency range improves if the sound absorbing material is located only on the ceiling. The sound focus in corners decreases significantly, but these positions do not represent the best locations for sound detection devices. These facts demonstrate how configurations (iii) and (iv) suit the requirements of both autistic individuals and sensors, avoiding corners.
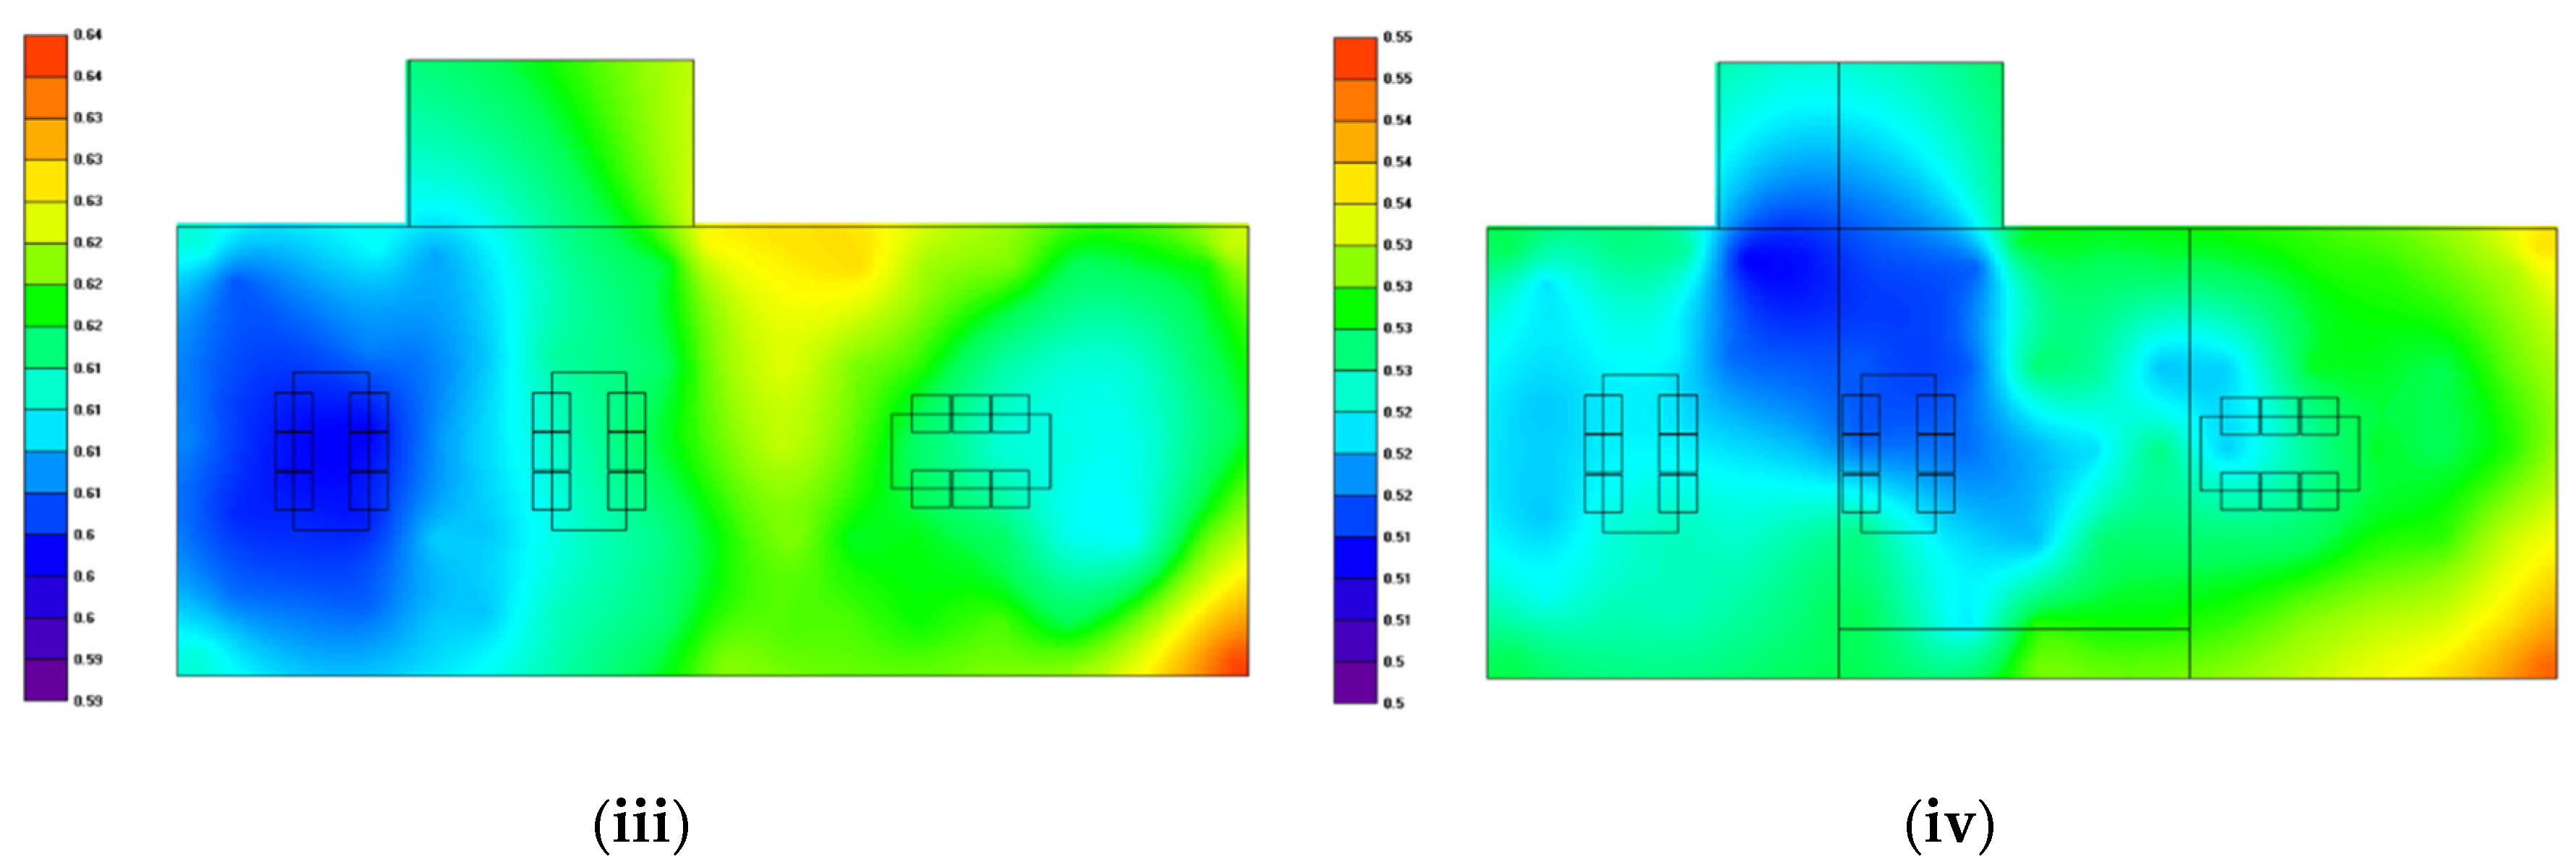
The last case is illustrated by the atelier (large room). In Appendix A, configurations (i), (ii), (iii), and (iv) models are reported in Figure A10. The reverberation time for configuration (i) was about 2.9 s at 1000 Hz and decreased at about 0.9 s when inserting pieces of furniture as configuration (ii) (Figure 13). For a complete description of the low frequency, readers may refer to Appendix A, Figure A11.
Figure 14 shows the spatial distribution comparison of the reverberation time parameter at 1000 Hz. For a better understanding of low frequency range, in Appendix A, the sound field distribution is reported (Figure A12).
Comparing the same sound absorbing areas, it is possible to highlight that the reverberation decreased to 0.62 s in configuration (iii) and to 0.52 s in the (iv) one. In addition, sound focusing in corners decreased in the latter case. In configuration (iii), one JND was assessed while in (iv), no JND variations were found, thus no subjective sensible indoor sound field differences were present.
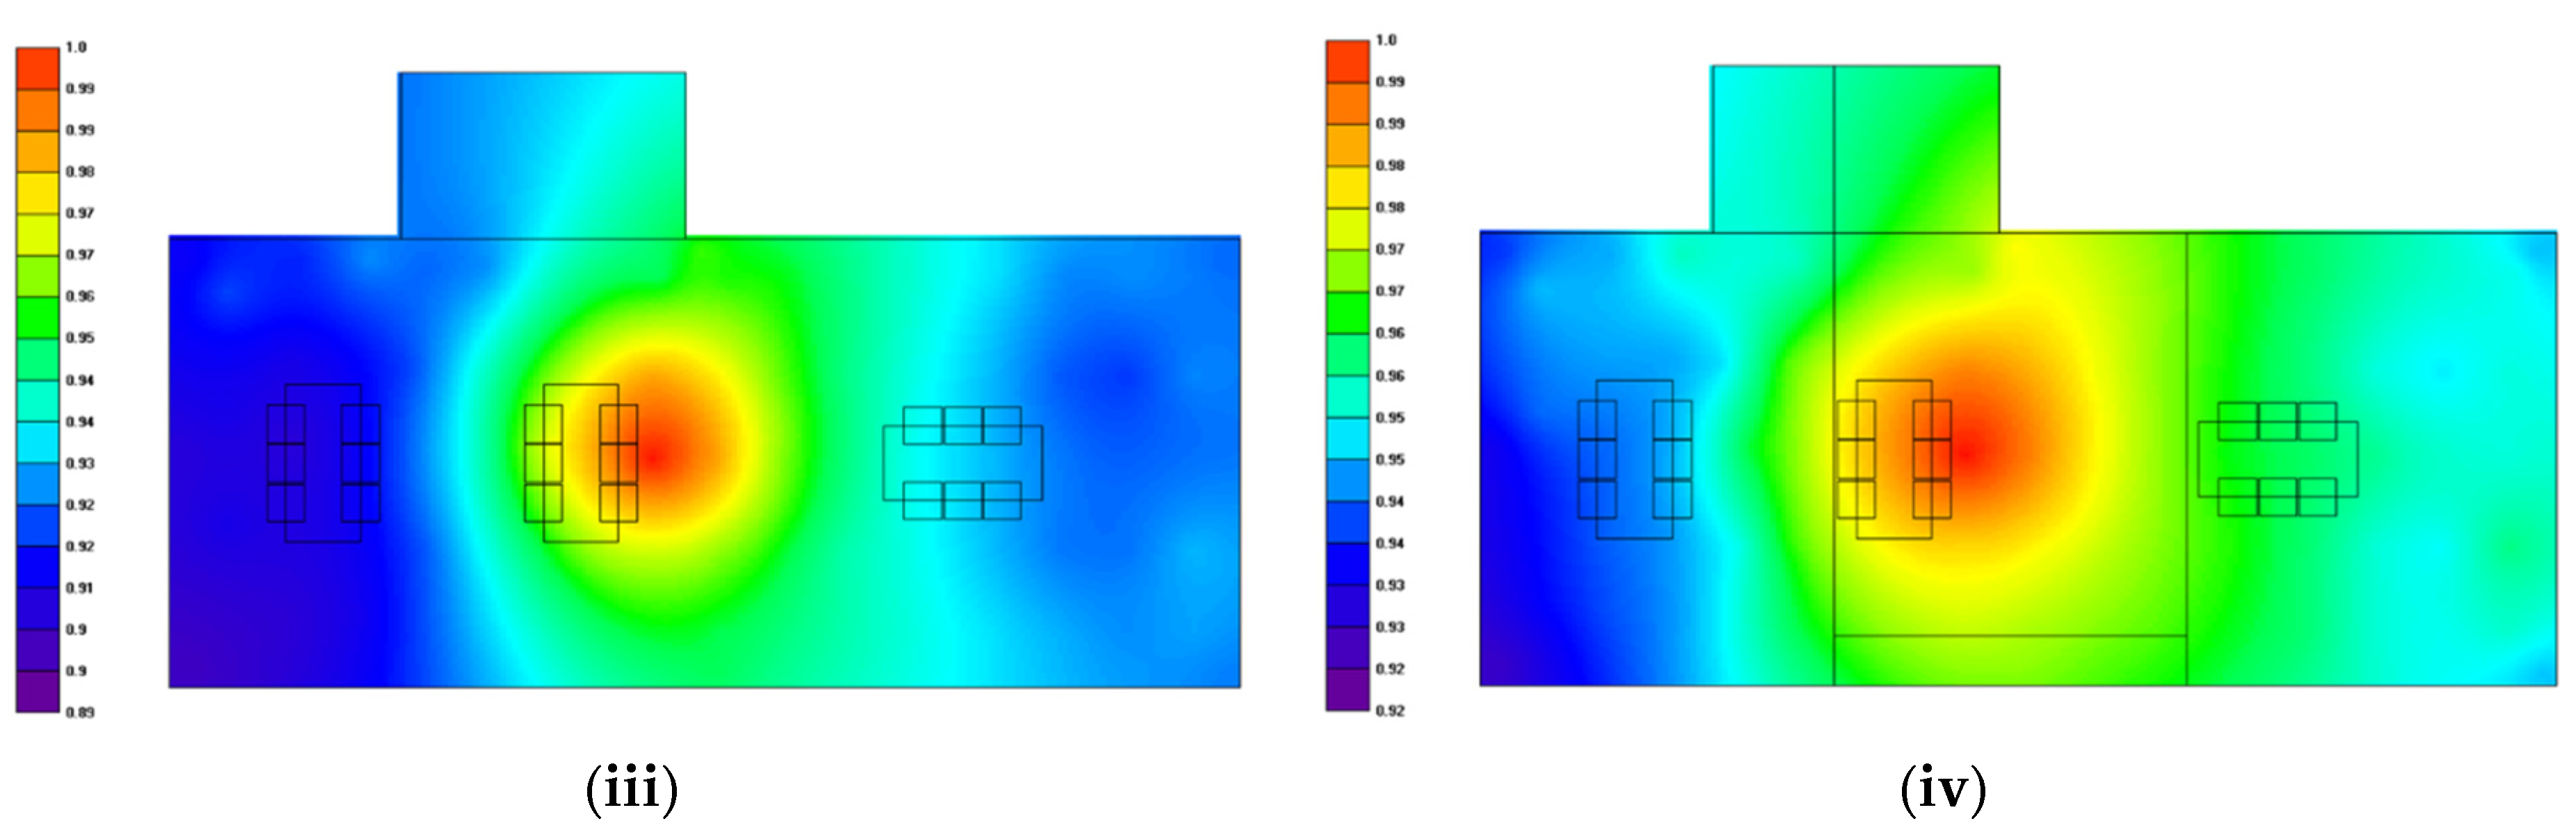
On the other hand, definition (Figure 15 and Figure 16) and as a consequence, clarity did not increase significantly thanks to the furniture. For this purpose, sound absorbing material insertions are needed. Figure 15 shows the distributions of D50 for configurations (i) and (ii) at 1000 Hz, while Figure 16 shows the comparison in terms of D50 at 1000 Hz for configurations (iii) and (iv).
In the case of a large size room such as the atelier, the quality of the indoor sound field distribution improves if the sound absorbing material is distributed both on corner positions and on the ceiling. From the point of view of subjective perception, 10 JND occurs in (i) configuration, four in (ii), two in (iii), and only one in (iv). This demonstrates how good improvements in indoor sound field quality can be provided. In this case, the material discontinuities on the ceiling and corners could be masked in order to prevent individual dislikes.
4. Conclusions
Recent statistics highlight how autism diagnoses have been growing in years; their life expectancy demonstrates that they could be strongly dependent on parents and care facilities for a very long period of life. Indoor environmental assistive technology matched with inclusive design represents a valid support in order to achieve autonomy for them, their families, and caregivers. The sound field can be implemented to best accommodate the needs of autistic people with hearing impairment or hypersensitivity to sound and at the same time, the requirements of the noise sensors.
In this work, the use of (i) a wide literature review, (ii) measurements and investigations on real premise, and (iii) the use of 3D acoustic simulations, demonstrate that the indoor sound field, achievable with furniture or with sound absorbing materials distribution, has to be optimized from the point of view of acoustic sensors and the needs of autistic users. To this aim, in order to achieve better acoustic spatial requirements, it is first imperative to evaluate in detail what are the likes and dislikes of individuals on the autistic spectrum. Then, it is important to estimate the positioning modalities and locations of the necessary sound absorbing surfaces. At the same time, the size of the room influences the decision process.
Therefore, from a vast literature review, important results are identified and could be resumed as follows:
- the literature presents many lacks on the autistic individuals’ indoor sound field requirements. However, the literature only provides some ranges for sound devices;
- in the present literature, no indoor acoustic requirements have been found to be dedicated to autistic individuals. Some works deal with hearing and learning impaired people’s necessities; and
- no indoor sound field distribution study is present nor for sound sensors, neither for individuals on the autism spectrum.
Given the above-mentioned conclusions, this research is able to provide the following new findings:
- ✓
- reverberation time RT, clarity C50, and D50 are the identified acoustic objective parameters, capable to consider both the sensors and individuals’ indoor requirements. The best ranges for indoor sound field, considering both the requirements for sound devices and ASD individuals are in the octave frequency range of 500 Hz, 1000 Hz, and 2000 Hz: 0.4 s ≤ RT ≤ 0.7 s; C50 ≥2 dB; D50 ≥ 0.7;
- ✓
- sound absorbing areas affect sensor positioning, visual aspects, indoor requirements, and sound field distribution. For this reason, for small rooms, regardless of the destination (medical, residential, etc.), a continuous absorbing ceiling is to be preferred in comparison to discrete surfaces. In the case of large rooms, the opposite has to be favored. If individuals dislike interruptions, a covering sound absorbing surface should be used; and
- ✓
- indoor sound field distribution influences the position selection of both sound sensors and individuals and has to be optimized in advance: (i) Just noticeable difference analysis showed that it is possible to provide homogeneous indoor sound fields, suitable for both the requirements for sensors and autistic people; (ii) acoustic sensors do not have to be placed in corners, but close to the spaces most likely to be occupied by users (e.g., on the center of the ceiling or walls, close to a piece of furniture, etc.).
Author Contributions
F.B. developed the research. F.B. and M.C. defined the methods and comparisons. M.C. and F.B. performed the numerical simulations and the experimental measures. G.S., A.G., and M.C. overviewed the research. F.B. and M.C. wrote the paper. All authors have read and agreed to the published version of the manuscript.
Funding
This research was funded by the European Interreg SENSHome project, ITAT 1088 CUP: I54I18000310006.
Acknowledgments
The authors also wish to thank Autism-Europe (https://www.autismeurope.org/about-autism/acceptable-language/ accessed on 16 March 2021) for the suggestions on language acceptability use and ProgettoAutismo FVG (Friuli Italy) for their wonderful collaboration.
Conflicts of Interest
The authors declare no conflict of interest.
Appendix A

Table A1.
Accuracy of the measurements.
| Th. Room 1 | Th. Room 2 | Th. Room 3 | Th. Room 4 | Soft room | Bedroom | Atelier | ||||||||
|---|---|---|---|---|---|---|---|---|---|---|---|---|---|---|
| σ | Mean | σ | Mean | σ | Mean | σ | Mean | σ | Mean | σ | Mean | σ | Mean | |
| 100 | 0.025 | 0.018 | 0.040 | 0.029 | 0.084 | 0.060 | 0.101 | 0.072 | 0.054 | 0.039 | 0.103 | 0.073 | 0.128 | 0.142 |
| 125 | 0.024 | 0.017 | 0.010 | 0.007 | 0.029 | 0.021 | 0.054 | 0.039 | 0.026 | 0.019 | 0.078 | 0.055 | 0.024 | 0.099 |
| 160 | 0.085 | 0.060 | 0.206 | 0.146 | 0.006 | 0.005 | 0.087 | 0.062 | 0.093 | 0.066 | 0.107 | 0.076 | 0.080 | 0.063 |
| 200 | 0.067 | 0.048 | 0.023 | 0.017 | 0.107 | 0.076 | 0.018 | 0.013 | 0.047 | 0.033 | 0.018 | 0.013 | 0.145 | 0.241 |
| 250 | 0.146 | 0.103 | 0.091 | 0.065 | 0.021 | 0.015 | 0.100 | 0.071 | 0.064 | 0.046 | 0.098 | 0.070 | 0.156 | 0.249 |
| 315 | 0.040 | 0.028 | 0.043 | 0.031 | 0.027 | 0.019 | 0.025 | 0.018 | 0.023 | 0.017 | 0.035 | 0.025 | 0.075 | 0.164 |
| 400 | 0.063 | 0.045 | 0.285 | 0.202 | 0.025 | 0.018 | 0.006 | 0.004 | 0.091 | 0.064 | 0.052 | 0.037 | 0.059 | 0.083 |
| 500 | 0.013 | 0.009 | 0.173 | 0.122 | 0.019 | 0.014 | 0.057 | 0.040 | 0.038 | 0.027 | 0.050 | 0.036 | 0.060 | 0.072 |
| 630 | 0.000 | 0.000 | 0.001 | 0.001 | 0.036 | 0.026 | 0.017 | 0.012 | 0.002 | 0.002 | 0.060 | 0.043 | 0.052 | 0.032 |
| 800 | 0.031 | 0.022 | 0.025 | 0.018 | 0.036 | 0.026 | 0.002 | 0.002 | 0.036 | 0.026 | 0.021 | 0.015 | 0.089 | 0.080 |
| 1000 | 0.027 | 0.019 | 0.018 | 0.013 | 0.047 | 0.033 | 0.007 | 0.005 | 0.035 | 0.025 | 0.051 | 0.036 | 0.091 | 0.102 |
| 1250 | 0.017 | 0.012 | 0.086 | 0.061 | 0.028 | 0.020 | 0.023 | 0.016 | 0.008 | 0.006 | 0.006 | 0.004 | 0.050 | 0.092 |
| 1600 | 0.009 | 0.007 | 0.025 | 0.018 | 0.013 | 0.009 | 0.021 | 0.015 | 0.018 | 0.013 | 0.023 | 0.016 | 0.025 | 0.017 |
| 2000 | 0.023 | 0.017 | 0.006 | 0.004 | 0.035 | 0.025 | 0.016 | 0.011 | 0.044 | 0.031 | 0.038 | 0.027 | 0.038 | 0.058 |
| 2500 | 0.017 | 0.012 | 0.025 | 0.018 | 0.000 | 0.000 | 0.045 | 0.032 | 0.064 | 0.046 | 0.004 | 0.003 | 0.051 | 0.031 |
| 3150 | 0.026 | 0.019 | 0.007 | 0.005 | 0.063 | 0.045 | 0.005 | 0.004 | 0.026 | 0.019 | 0.001 | 0.001 | 0.031 | 0.029 |
| 4000 | 0.052 | 0.037 | 0.016 | 0.012 | 0.019 | 0.014 | 0.008 | 0.006 | 0.043 | 0.031 | 0.028 | 0.020 | 0.035 | 0.049 |
| 5000 | 0.005 | 0.004 | 0.27 | 0.012 | 0.016 | 0.012 | 0.016 | 0.012 | 0.039 | 0.028 | 0.035 | 0.025 | 0.017 | 0.034 |
Figure A1.
Individual therapy area at the daily care center.

Figure A2.
(a–g). Images of the rooms recreated for the acoustic simulation program.

Figure A3.
(a–g) Two populations of Q–Q plots of measured reverberation time.

Figure A4.
Therapy room no. 4, configurations. (iv,a) Sound absorbing surfaces (yellow pattern) distributed along the perimeter between side walls and ceiling. (iv,b) Sound absorbing surfaces (yellow pattern) distributed partially on corners and partially on the ceiling.
Figure A4.
Therapy room no. 4, configurations. (iv,a) Sound absorbing surfaces (yellow pattern) distributed along the perimeter between side walls and ceiling. (iv,b) Sound absorbing surfaces (yellow pattern) distributed partially on corners and partially on the ceiling.

Figure A5.
Reverberation time for therapy room no. 4 for configurations: (iv,a) and (iv,b). Spatial distribution at 250 Hz.
Figure A5.
Reverberation time for therapy room no. 4 for configurations: (iv,a) and (iv,b). Spatial distribution at 250 Hz.

Figure A6.
Bedroom configurations: (i) empty room, (ii) room with furniture.

Figure A7.
Reverberation time for bedroom for configurations: (i) empty room, (ii) room with furniture. Spatial distribution at 250 Hz.
Figure A7.
Reverberation time for bedroom for configurations: (i) empty room, (ii) room with furniture. Spatial distribution at 250 Hz.

Figure A8.
Bedroom configurations: (iii) with sound absorbing surface distributed only on the ceiling, (iv) with sound absorbing surface between the distributed corners formed by side walls and ceiling and partially on the ceiling.
Figure A8.
Bedroom configurations: (iii) with sound absorbing surface distributed only on the ceiling, (iv) with sound absorbing surface between the distributed corners formed by side walls and ceiling and partially on the ceiling.

Figure A9.
Reverberation time for bedroom for configurations: (iii) with sound absorbing surface distributed only on the ceiling, (iv) with sound absorbing surface distributed partially on corners and partially on ceiling. Spatial distribution at 250 Hz.
Figure A9.
Reverberation time for bedroom for configurations: (iii) with sound absorbing surface distributed only on the ceiling, (iv) with sound absorbing surface distributed partially on corners and partially on ceiling. Spatial distribution at 250 Hz.

Figure A10.
Atelier configurations: (i) empty room, (ii) room with furniture, atelier configurations: (iii) with sound absorbing surface distributed only on the ceiling, (iv) with sound absorbing surface between the distributed corners formed by side walls and ceiling and partially on the ceiling.
Figure A10.
Atelier configurations: (i) empty room, (ii) room with furniture, atelier configurations: (iii) with sound absorbing surface distributed only on the ceiling, (iv) with sound absorbing surface between the distributed corners formed by side walls and ceiling and partially on the ceiling.

Figure A11.
Reverberation time for atelier for configurations: (i) empty room, (ii) room with furniture. Spatial distribution at 250 Hz.
Figure A11.
Reverberation time for atelier for configurations: (i) empty room, (ii) room with furniture. Spatial distribution at 250 Hz.

Figure A12.
Reverberation time for atelier for configurations (iii) with sound absorbing surface distributed only on the ceiling, (iv) with sound absorbing surface distributed partially on corners and partially on ceiling. Spatial distribution at 250 Hz.
Figure A12.
Reverberation time for atelier for configurations (iii) with sound absorbing surface distributed only on the ceiling, (iv) with sound absorbing surface distributed partially on corners and partially on ceiling. Spatial distribution at 250 Hz.

References
- Christensen, D.L.; Maenner, M.J.; Bilder, D.; Constantino, J.N.; Daniels, J.; Durkin, M.S.; Fitzgerald, R.T.; Kurzius-Spencer, M.; Pettygrove, S.D.; Robinson, C.; et al. Prevalence and Characteristics of Autism Spectrum Disorder among 4-year-old Children—Early Autism and Developmental Disabilities Monitoring Network, Seven Sites, United States, 2010–2014. MMWR Surveill. Summ. 2019, 68, 1–19. [Google Scholar] [CrossRef] [Green Version]
- Bejarano-Martín, Á.; Canal-Bedia, R.; Magán-Maganto, M.; Fernández-Álvarez, C.; Martín-Cilleros, M.V.; Sánchez-Gómez, M.C.; García-Primo, P.; Rose-Sweeney, M.; Boilson, A.; Linertová, R.; et al. Correction to: Early Detection, Diagnosis and Intervention Services for Young Children with Autism Spectrum Disorder in the European Union (ASDEU): Family and Professional Perspectives. J. Autism. Dev. Disord. 2019, 50, 3380–3394. [Google Scholar] [CrossRef]
- Sun, X.; Allison, C. A review of the prevalence of autism spectrum disorder in Asia. Res. Autism. Spectr. Disord. 2010, 4, 156–167. [Google Scholar] [CrossRef]
- Christensen, D.L.; Baio, J.; Naarden Braun, K.V.; Bilder, D.; Charles, J.; Constantino, J.N.; Daniels, J.; Durkin, M.S.; Fitzgerald, R.T.; Kurzius-Spencer, M.; et al. Prevalence and Characteristics of Autism Spectrum Disorder Among Children Aged 8 Years—Autism and Developmental Disabilities Monitoring Network, 11 Sites, United States, 2012. Surveill. Summ. 2016, 65, 1–23. [Google Scholar] [CrossRef] [Green Version]
- Roux, A.M.; Shattuck, P.T.; Cooper, B.P.; Anderson, K.A.; Wagner, M.; Narendorf, S.C. Postsecondary employment experiences among young adults with an autism spectrum disorder. J. Am. Acad. Child Adolesc. Psychiatry 2013, 52, 931–939. [Google Scholar] [CrossRef] [Green Version]
- The Autism Employment Gap Report. Available online: https://www.autism.org.uk (accessed on 16 March 2021).
- Leigh, J.P.; Du, J. Brief Report: Forecasting the Economic Burden of Autism in 2015 and 2025 in the United States. J. Autism. Dev. Disord. 2015, 45, 4135–4139. [Google Scholar] [CrossRef]
- Rimland, B.; Edelson, S.M. Brief report: A pilot study of auditory integration training in autism. J. Autism. Dev. Disord. 1995, 25, 61–70. [Google Scholar] [CrossRef]
- Addison, M. Finding the Causes of Challenging Behaviour: Part 2; Challenging Behaviour Foundation: Chatham, UK, 2013. [Google Scholar]
- Minshawi, N.F.; Hurwitz, S.; Fodstad, J.C.; Biebl, S.; Morriss, D.H.; McDougle, C.J. The association between self-injurious behaviors and autism spectrum disorders. Psychol. Res. Behav. Manag. 2014, 7, 125–136. [Google Scholar] [CrossRef] [Green Version]
- WHO. ICD-10. In International Statistical Classification of Deaseases and Related Health Problems, 10th ed.; World Health Organisation: Geneva, Switzerland, 2010. [Google Scholar]
- American Psychiatric Association. DSM-V Diagnostic and Statistical Manual of Mental Disorders, 5th ed.; American Psychiatric Association: Washington, DC, USA, 2013. [Google Scholar]
- Taylor, J.L.; Smith, L.E.; Mailick, M.R. Engagement in vocational activities promotes behavioral development for adults with autism spectrum disorders. J. Autism. Dev. Disord. 2014, 44, 1447–1460. [Google Scholar] [CrossRef] [PubMed]
- Kargas, N.; Lopez, B.; Vasudevi, R.; Morris, P. The Relationship Between Auditory Processing and Restricted, Repetitive Behaviors in Adults with Autism Spectrum Disorders. J. Autism. Dev. Disord. 2015, 45, 658–668. [Google Scholar] [CrossRef] [Green Version]
- Panerai, S.; Tasca, D.; Ferri, R.; D’Arrigo, V.; Elia, M. Executive Functions and Adaptive Behaviour in AutismSpectrum Disorders with and without Intellectual Disability. PsyCh J. 2014, 2014, 941809. [Google Scholar] [CrossRef] [Green Version]
- Wolbring, G.; Leopatra, V. Sensors: Views of staff of a disability service organization. J. Pers. Med. 2013, 3, 23–39. [Google Scholar] [CrossRef] [Green Version]
- Burleson, W.; Newman, N.; Brotman, R. Empowering Independent Living for People with Autism: Designing Supportive, Low-Cost, Interactive E-Health Environments. In Persuasive Technology. Design for Health and Safety; Bang, M., Ragnemalm, E.L., Eds.; Springer: Berlin/Heidelberg, Germany, 2012. [Google Scholar] [CrossRef]
- Chuah, M.; Di Blasio, M. Smartphone based autism social alert system. In Proceedings of the 2012 8th International Conference on Mobile Ad-hoc and Sensor Networks (MSN), Chengdu, China, 14–16 December 2012. [Google Scholar]
- Cook, D.J.; Youngblood, M.; Heierman, E.; Gopalratnam, K.; Rao, S.; Litvin, A.; Khawaja, F. MavHome: An agent-based smart home. In Proceedings of the First IEEE International Conference on Pervasive Computing and Communications, 2003. (PerCom 2003), Fort Worth, TX, USA, 26–26 March 2003. [Google Scholar]
- Schafer, E.C.; Wright, S.; Anderson, C.; Jones, J.; Pitts, K.; Bryant, D.; Watson, M.; Box, J.; Neve, M.; Mathews, L.; et al. Assistive technology evaluations: Remote-microphone technology for children with Autism Spectrum Disorder. J. Commun. Disord. 2016, 64, 1–17. [Google Scholar] [CrossRef] [PubMed]
- Robles, R.J.; Ki, T. Applications, Systems and Methods in Smart Home Technology: A Review. Int. J. Adv. Sci. Tec. 2010, 15, 37–48. [Google Scholar]
- Fleury, A.; Noury, N.; Vacher, M.; Glasson, H.; Seri, J.F. Sound and speech detection and classification in a Health smart home. Annu. Int. Conf. IEEE Eng. Med. Biol. Soc. 2008, 2008, 4644–4647. [Google Scholar]
- Pagin, D. Localization and Recognition of Sound Events by Means of Microphone Arrays. Master’s Thesis, University of Padua Department of Information Engineering, Padova, Italy, 2016. [Google Scholar]
- Dufaux, A. Detection and Recognition of Impulsive Sound Signals. Ph.D. Thesis, Institute of Microtechnology University of Neuchatel Switzerland, Neuchatel, Switzerland, 2001. [Google Scholar]
- Foster, P.; Sigtia, S.; Krstulovic, S.; Barker, J.; Plumbley, M.D. Chime home: A dataset for sound source recognition in a domestic environment. In Proceedings of the 2015 IEEE Workshop on Applications of Signal Processing to Audio and Acoustics (WASPAA), New Paltz, NY, USA, 18–21 October 2015. [Google Scholar]
- Dewsbury, G.; Linskell, J. Smart home technology for safety and functional independence: The UK experience. Neurorehabilitation 2011, 28, 249–260. [Google Scholar] [CrossRef]
- Lecouteux, B.; Vacher, M.; Portet, F. Distant Speech Recognition for Home Automation: Preliminary Experimental Results in a Smart Home. In Proceedings of the 2011 6th Conference on Speech Technology and Human-Computer Dialogue (SpeD), Brasov, Romania, 18–21 May 2011. [Google Scholar]
- Portet, F.; Vacher, M.; Golanski, C.; Roux, C.; Meillon, B. Design and Evaluation of a Smart Home Voice Interface for the Elderly: Acceptability and Objection Aspects; Springer: London, UK, 2011. [Google Scholar]
- Chang, C.; Chang, Y. Application of Abnormal Sound Recognition System for Indoor Environment. In Proceedings of the 2013 9th International Conference on Information, Communications & Signal Processing, Tainan, Taiwan, 10–13 December 2013. [Google Scholar]
- Zhang, H.; McLoughlin, I.; Song, Y. Robust sound event recognition using convolutional neural networks. In Proceedings of the 2015 IEEE International Conference on Acoustics, Speech and Signal Processing (ICASSP), South Brisbane, QLD, Australia, 19–24 April 2015. [Google Scholar]
- Janvier, M.; Alameda-Pineda, X.; Girin, L.; Horaud, R. Sound-Event Recognition with a Companion Humanoid. In Proceedings of the 2012 12th IEEE-RAS International Conference on Humanoid Robots (Humanoids 2012), Osaka, Japan, 29 November–1 December 2012. [Google Scholar]
- Biagetti, G.; Crippa, P.; Falaschetti, L.; Orcioni, S.; Turchetti, C. Speaker Identification in Noisy Conditions Using Short Sequences of Speech Frames; Springer International Publishing AG: Basel, Switzerland, 2018. [Google Scholar]
- Yoshioka, T.; Sehr, A.; Delcroix, M.; Kinoshita, K.; Maas, R.; Nakatani, T.; Kellermann, W. Making Machines Understand Us in Reverberant Rooms [Robustness against reverberation for automatic speech recognition]. IEEE Signal Process. Mag. 2012, 29, 114–126. [Google Scholar] [CrossRef]
- Cremer, L.; Muller, H.A. Principles and Applications of Room Acoustic; Applied Sciences Publishers: London, UK, 1982. [Google Scholar]
- Beranek, L. Music, Acoustics, and Architecture. Bull. Am. Acad. Arts Sci. 1992, 45, 25–46. [Google Scholar] [CrossRef]
- Petrick, R.; Lohde, K.; Wolff, M.; Hoffmann, R. The harming part of room acoustics in automatic speech recognition. In Proceedings of the INTERSPEECH 2007, Antwerp, Belgium, 27–31 August 2007; pp. 1094–1097. [Google Scholar]
- Cox, T.; D’Antonio, P. Acoustic Absorbers and Diffusers, 3rd ed.; CRC Press: Boca Raton, FL, USA, 2016. [Google Scholar]
- Tsilfidis, A.; Mporas, I.; Mourjopoulos, J.; Fakotakis, N. Automatic speech recognition performance in different room acoustic environments with and without dereverberation preprocessing. Comput. Speech Lang. 2013, 27, 380–395. [Google Scholar] [CrossRef]
- Kinoshita, K.; Delcroix, M.; Yoshioka, T.; Nakatani, T. The reverb challenge: A common evaluation framework for dereverberation and recognition of reverberant speech. In Proceedings of the IEEE Workshop on Applications of Signal Processing to Audio and Acoustics, New Paltz, NY, USA, 20–23 October 2013. [Google Scholar]
- Parada, P.; Sharma, D.; Lainez, J.; Barreda, D.; Waterschoot, T.V.; Naylor, P.A. A Single-Channel Non-Intrusive C50 Estimator Correlated With Speech Recognition Performance. IEEE/ACM Trans. Audio Speech Lang. Process. 2016, 24, 719–732. [Google Scholar] [CrossRef] [Green Version]
- Sehr, A.; Habets, E.; Maas, R.; Kellermann, W. Towards a better understanding of the effect of reverberation on speech recognition performance. In Proceedings of the IWAENC 2010, Tel Aviv, Israel, 30 August–2 September 2010. [Google Scholar]
- Fajt, S.; Krhen, M.; Marušić, T. Method of Evaluating the Quality of Room Acoustics Based on Energy Relations of Sound. Tehnički Glasnik 2014, 8, 222–228. [Google Scholar]
- Scott, S.K. How might we conceptualize speech perception? The view from neurobiology. J. Phon. 2003, 31. [Google Scholar] [CrossRef]
- Pisoni, D.B.; Luce, P.A. Acoustic-phonetic representation in word recognition. Cognition 1987, 25, 21–52. [Google Scholar] [CrossRef] [Green Version]
- Bogdashina, O. Sensory Perceptual Issues in Autism and Asperger Syndrome, Second Edition: Different Sensory Experiences—Different Perceptual Worlds; Jessica Kingsley Publishers: London, UK, 2016. [Google Scholar]
- Wali, L.J.; Sanfilippo, F. A review of the state of the art of assistive technology for people with ASD in the workplace and in everyday life. In Digital Transformation for a Sustainable Society in the 21st Century; Springer: Cham, Switzerland, 2019. [Google Scholar] [CrossRef]
- Nagib, W.; Williams, A. Creating “therapeutic landscapes” at home: The experiences of families of children with autism. Health Place 2018, 52, 46–54. [Google Scholar] [CrossRef]
- Kanakri, S.M.; Shepley, M.; Varni, J.W.; Tassinary, L.G. Noise and autism spectrum disorder in children: An exploratory survey. Res. Dev. Disabil. 2017, 63, 85–94. [Google Scholar] [CrossRef] [PubMed]
- Marco, E.J.; Hinkley, L.B.N.; Hill, S.S.; Nagarajan, S.S. Sensory Processing in Autism: A Review of Neurophysiologic Findings. Pediatr. Res. 2011, 69, 48R–54R. [Google Scholar] [CrossRef]
- Ahrentzen, S.; Steele, K. At Home with Autism: Designing for the Spectrum; Policy Press: Bristol, UK, 2016; ISBN 978-1-44730-797-6. [Google Scholar]
- Mostafa, M. Architecture for autism: Built environment performance in accordance to the autism ASPECTSS™ design index. Des. Princ. Pract. 2015, 8, 55–71. [Google Scholar] [CrossRef]
- Mostafa, M. Housing Adaptation for Adults with Autistic Spectrum Disorder. Open House Int. 2010, 35, 37–48. [Google Scholar] [CrossRef]
- Braddock, G.; Rowell, J. Making Homes That Work. A Resource Guide for Families Living with Autism Spectrum Disorder + Co-occurring Behaviors; Creative Housing Solutions and Rowell Brokaw Architects: Eugene, OR, USA, 2011. [Google Scholar]
- Balisha, U. Autism Friendly Design, Didapress Dipartimento di Architettura; Università degli Studi di Firenze: Firenze, Italy, 2017; ISBN 978-88-9608-096-2. [Google Scholar]
- De Giovanni, G. Architecture for Autism, Esempi Di Architettura, 2nd ed.; Edizioni Scientifiche: Naples, Italy, 2015; ISBN 978-88-6975-062-5. [Google Scholar]
- American Speech-Language-Hearing Association. Acoustics in Educational Settings: Position Statement and Guidelines; American Speech-Language-Hearing Association: Rockville, MD, USA, 1995; Volume 37, pp. 15–19. [Google Scholar]
- Stationery Office (Great Britain). Designing for disabled children and children with special educational needs Guidance for mainstream and special schools. Build. Bull. 2008, 102, 194. [Google Scholar]
- American National Standards Institute. Acoustical Performance Criteria, Design Requirements, and Guidelines for Schools, Part 1: Permanent Schools (No. ANSI S12.60-2010); American National Standards Institute: Melville, NY, USA, 2010. [Google Scholar]
- Braam, I. Wat zeg je? Geluid Probleem! Hoofdrapport: Akoestiek in de Zorgsector; Hogeschool van Arnhem en Nijmegen: Arnhem, The Netherlands, 2006. [Google Scholar]
- Marshall, L.G. An acoustics measurement program for evaluating auditoriums based on the early/late sound energy ratio. J. Acoust. Soc. Am. 1994, 96, 2251–2261. [Google Scholar] [CrossRef]
- Griesinger, D. Physiologically based measures for clarity and engagement. In Proceedings of the International Symposium on Room Acoustics, Toronto, ON, Canada, 9–11 June 2013. [Google Scholar]
- Ansay, S.; Zannin, P.H.T. Using the Parameters of Definition, D50, and Reverberation Time, RT, to Investigate the Acoustic Quality of Classrooms. Can. Acous. 2016, 44, 6–11. [Google Scholar]
- Shield, B.M.; Dockrell, J.E. The effects of noise on children at school: A review. Build. Acoust. 2003, 10, 97–106. [Google Scholar] [CrossRef]
- Abras, C.; Maloney-Krichmar, D.; Preece, J. User-Centered Design. In Encyclopedia of Human-Computer Interaction; Bainbridge, W., Ed.; Sage Publications: Thousand Oaks, CA, USA, 2004. [Google Scholar]
- Pahnke, J.; Lundgren, T.; Hursti, T.; Hirvikoski, T. Outcomes of an acceptance and commitment therapy-based skills training group for students with high-functioning autism spectrum disorder: A quasi-experimental pilot study. Autism 2014, 18, 953–964. [Google Scholar] [CrossRef]
- Porro, L. Strutture per le Persone con Disturbi Dello Spettro Autistico. Indirizzi per la Progettazione e la Valutazione Della Qualità Edilizia, In Italian. Ph.D. Thesis, Sapienza University Di Roma, Roma, Italy, 2018. [Google Scholar]
- ISO. ISO 3382-1. In Acoustics—Measurement of Room Acoustic Parameters—Part 1: Performance Spaces; ISO: Geneva, Switzerland, 2009. [Google Scholar]
- Bradley, J.S.; Reich, R.; Norcross, S.G. A just noticeable difference in C50 for speech. App. Acous. 1999, 58, 99–108. [Google Scholar] [CrossRef]
- Meng, Z.; Zhao, F.; He, M. The Just Noticeable Difference of Noise Length and Reverberation Perception; Communication University of China: Beijing, China, 2006. [Google Scholar]
- Brand, A.; Gaudion, K.; Myerson, J. Exploring Sensory Preferences: Living Environments for Adults with Autism; Helen Hamlyn Centre for Design, Royal College of Art: London, UK, 2012; ISBN 978-1-907342-49-3. [Google Scholar]
- Humphreys, S. Autism and Architecture Slide Show of the Event “The Autism Show, the National Event for Autism (Including Asperger Syndrome). Available online: http://www.researchautism.net/publicfiles/pdf/Simon%20Humphreys%20Autism%20Show%202016.pdf (accessed on 28 August 2020).
- James, M. Forest School and Autism: A Practical Guide; Jessica Kingsley Publishers: London, UK, 2018. [Google Scholar]
- Schrank, S.; Ekici, D. Healing Spaces, Modern Architecture, and the Body; Routledge: London, UK, 2017; ISBN 978-1-4724-7083-6. [Google Scholar]
Figure 1.
Flowchart of the research approach.

Figure 2.
(a–h). Pictures of the tested rooms.


Figure 3.
Grey rectangles highlight the chosen ranges in this work. Arrows indicate the range or points associated with selected literature papers (highlighted with squared brackets), used as support.
Figure 3.
Grey rectangles highlight the chosen ranges in this work. Arrows indicate the range or points associated with selected literature papers (highlighted with squared brackets), used as support.

Figure 4.
Measured reverberation time (T30) for different rooms.

Figure 5.
Simulated RT for therapy room no. 2: spatial distribution at 1000 Hz (graduation range from purple = 0.85 s to red = 0.89 s).
Figure 5.
Simulated RT for therapy room no. 2: spatial distribution at 1000 Hz (graduation range from purple = 0.85 s to red = 0.89 s).

Figure 6.
Simulated C50 for therapy room no. 2: spatial distribution at 1000 Hz (graduation range from purple = 7.5 to red = 14). The red line marks the section plan.
Figure 6.
Simulated C50 for therapy room no. 2: spatial distribution at 1000 Hz (graduation range from purple = 7.5 to red = 14). The red line marks the section plan.

Figure 7.
Simulated D50 for therapy room no. 2: spatial distribution at 1000 Hz (graduation range from purple = 0.85 to red = 0.97). The red line marks the section plan.
Figure 7.
Simulated D50 for therapy room no. 2: spatial distribution at 1000 Hz (graduation range from purple = 0.85 to red = 0.97). The red line marks the section plan.

Figure 8.
Simulated RT for the soft room: spatial distribution at 1000 Hz for reverberation time (left-graduation range from purple = 0.36 s to red = 0.38 s) and definition (right-graduation range from purple = 0.98 to red = 1).
Figure 8.
Simulated RT for the soft room: spatial distribution at 1000 Hz for reverberation time (left-graduation range from purple = 0.36 s to red = 0.38 s) and definition (right-graduation range from purple = 0.98 to red = 1).

Figure 9.
Reverberation time for therapy room no. 4, configuration (iii) for spatial distribution at 250 Hz (left-graduation range from purple = 0.87 s to red = 0.91 s) and at 1000 Hz (right-graduation range from purple = 0.62 s to red = 0.68 s).
Figure 9.
Reverberation time for therapy room no. 4, configuration (iii) for spatial distribution at 250 Hz (left-graduation range from purple = 0.87 s to red = 0.91 s) and at 1000 Hz (right-graduation range from purple = 0.62 s to red = 0.68 s).

Figure 10.
Reverberation time for therapy room no. 4 for configurations: (iv,a) (left-graduation range from purple = 0.63 s to red = 0.68 s and (iv,b) (right-graduation range from purple = 0.63 s to red = 0.68 s). Spatial distribution at 1000 Hz.
Figure 10.
Reverberation time for therapy room no. 4 for configurations: (iv,a) (left-graduation range from purple = 0.63 s to red = 0.68 s and (iv,b) (right-graduation range from purple = 0.63 s to red = 0.68 s). Spatial distribution at 1000 Hz.

Figure 11.
Reverberation time for bedroom for configurations: (i) empty room (left-graduation range from purple = 1.33 s to red = 1.37 s), (ii) room with furniture (right-graduation range from purple = 0.72 s to red = 0.76 s). Spatial distribution at 1000 Hz.
Figure 11.
Reverberation time for bedroom for configurations: (i) empty room (left-graduation range from purple = 1.33 s to red = 1.37 s), (ii) room with furniture (right-graduation range from purple = 0.72 s to red = 0.76 s). Spatial distribution at 1000 Hz.

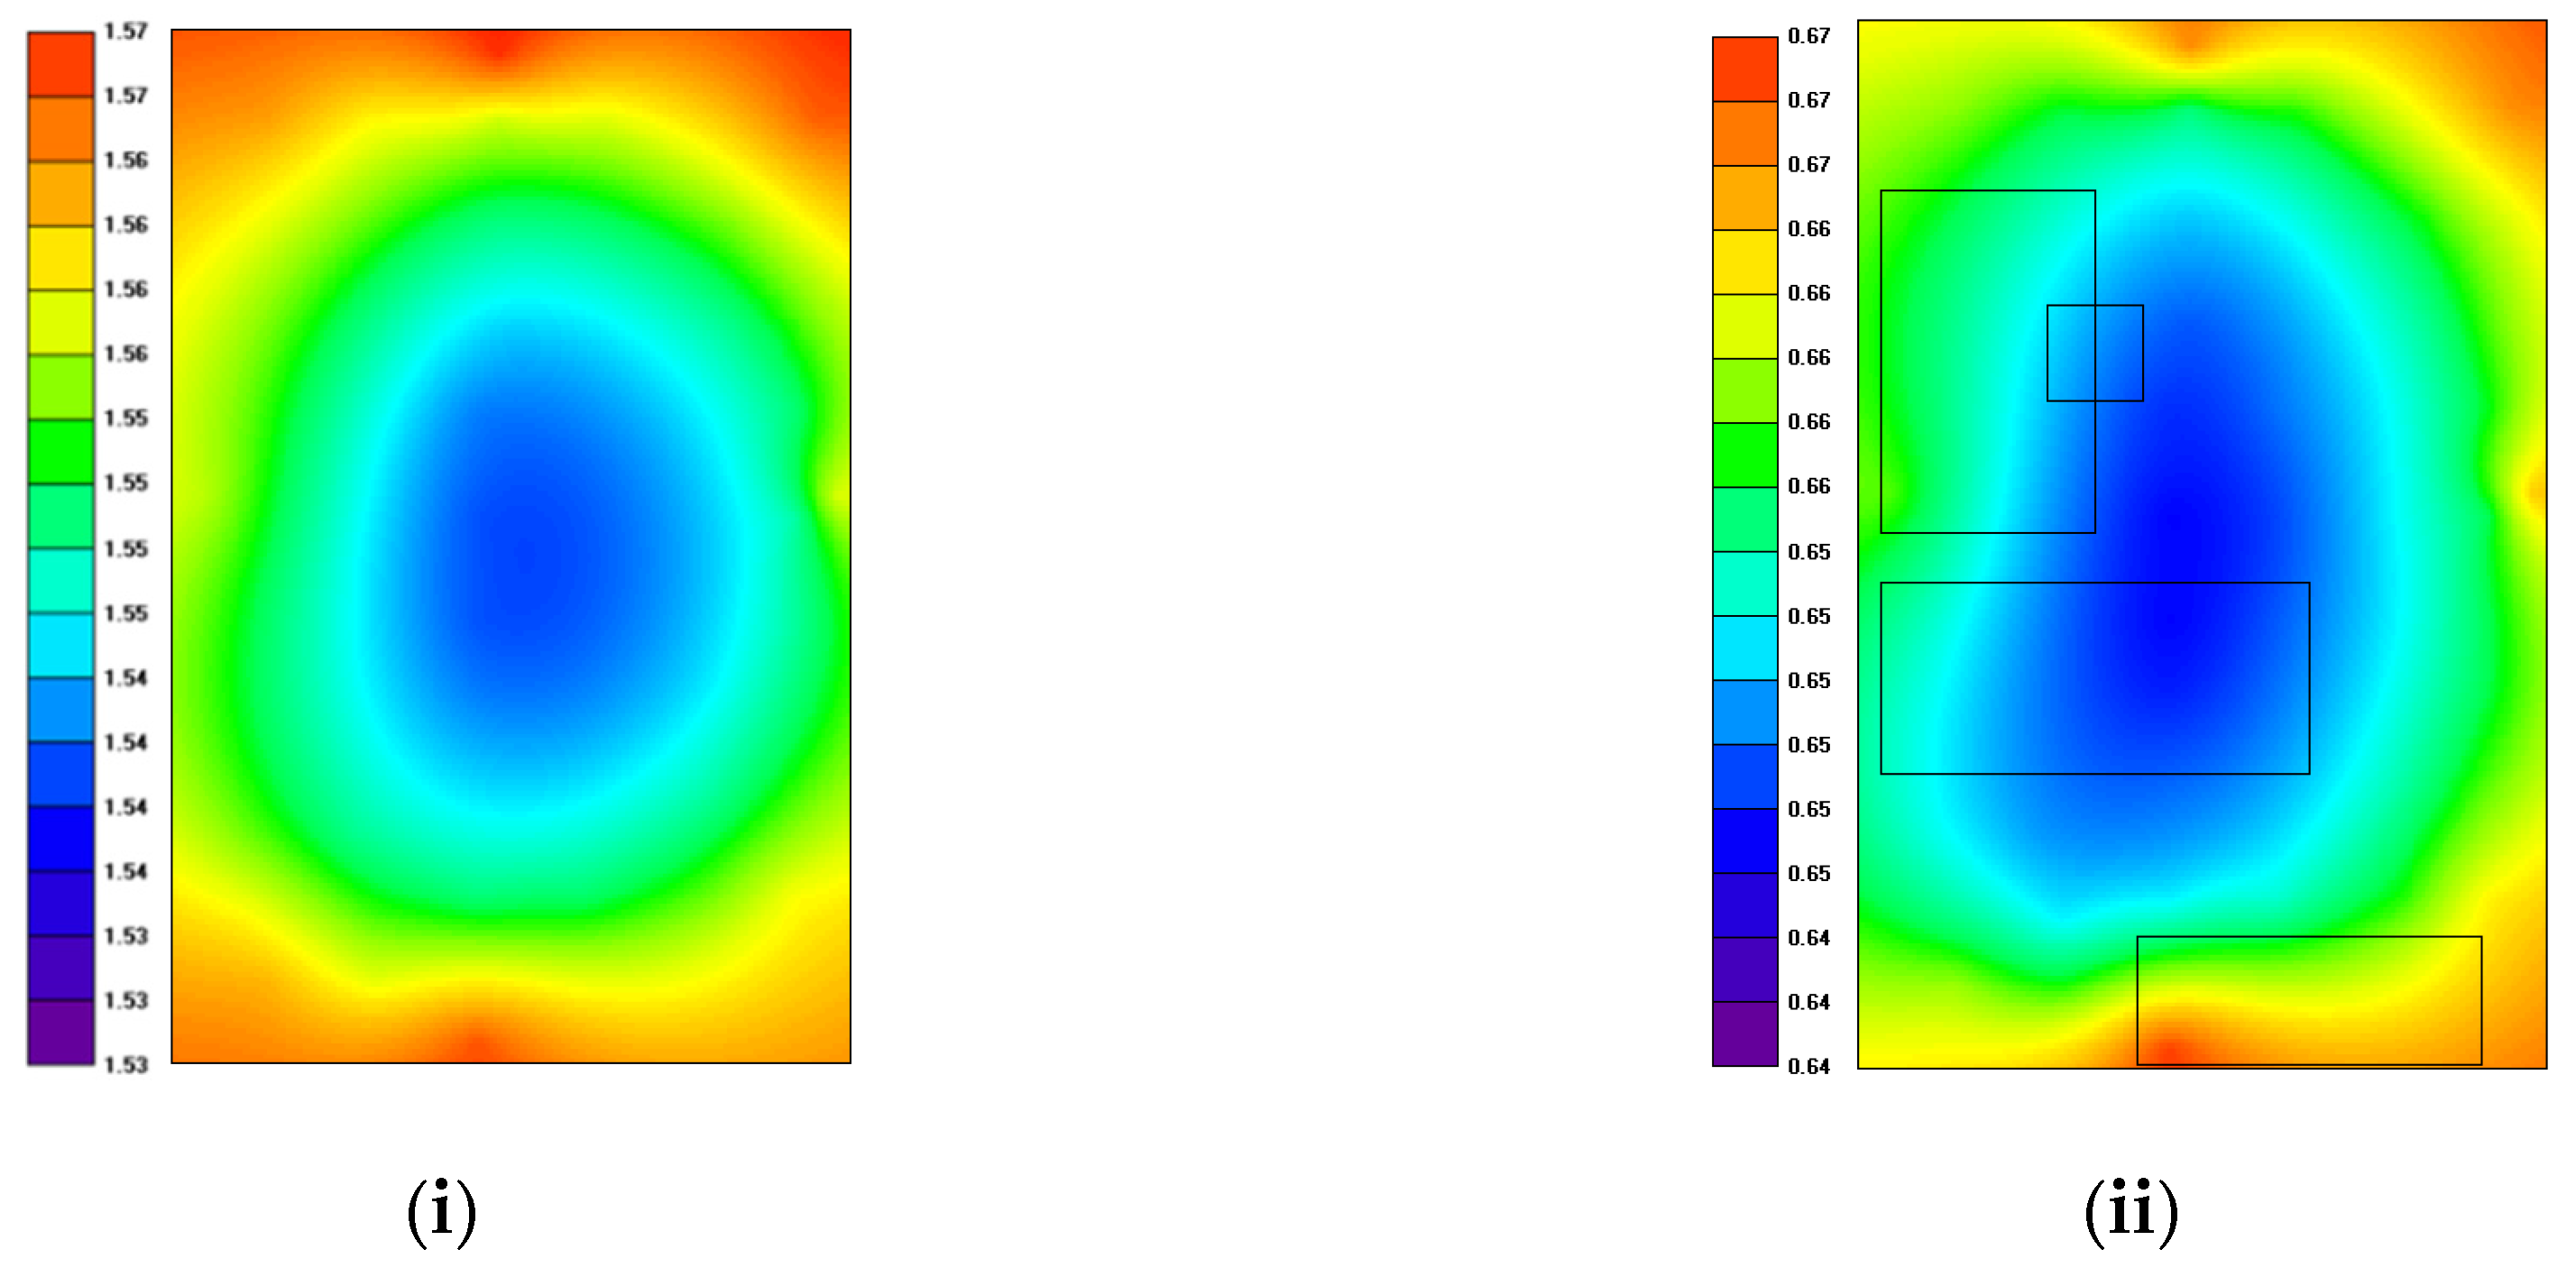
Figure 12.
Reverberation time for bedroom for configurations: (iii) with sound absorbing surface distributed only on the ceiling (left-graduation range from purple = 0.64 s to red = 0.67 s), (iv) with sound absorbing surface distributed partially on corners and partially on ceiling (right-graduation range from purple = 0.7 s to red = 0.73 s). Spatial distribution at 1000 Hz.

Figure 13.
Reverberation time for atelier for configurations: (i) empty room (left graduation range from purple = 2.06 s to red = 2.98 s), (ii) room with furniture (right-graduation range from purple = 0.97 s to red = 1.03 s). Spatial distribution at 1000 Hz.
Figure 13.
Reverberation time for atelier for configurations: (i) empty room (left graduation range from purple = 2.06 s to red = 2.98 s), (ii) room with furniture (right-graduation range from purple = 0.97 s to red = 1.03 s). Spatial distribution at 1000 Hz.

Figure 14.
Reverberation time for atelier for configurations (iii) with sound absorbing surface distributed only on the ceiling (left-graduation range from purple = 0.59 s to red = 0.64 s), (iv) with sound absorbing surface distributed partially on corners and partially on ceiling (right-graduation range from purple = 0.5 s to red = 0.55 s). Spatial distribution at 1000 Hz.

Figure 15.
Definition D50 for atelier for configurations (i) empty room (left-graduation range from purple = 0.44 to red = 0.96), (ii) room with furniture (right-graduation range from purple = 0.81 to red = 1). Spatial distribution at 1000 Hz.
Figure 15.
Definition D50 for atelier for configurations (i) empty room (left-graduation range from purple = 0.44 to red = 0.96), (ii) room with furniture (right-graduation range from purple = 0.81 to red = 1). Spatial distribution at 1000 Hz.

Figure 16.
Definition D50 for atelier for configurations (iii) with the sound absorbing surface distributed only on the ceiling (left-graduation range from purple = 0.89 o red = 1 s), (iv) with the sound absorbing surface distributed partially on corners and partially on the ceiling (right-graduation range from purple = 0.92 to red = 1). Spatial distribution at 1000 Hz.

Table 1.
Arithmetic (RT) and logarithmic (C50 and D50) average acoustic parameters for each room (250 ÷ 2500 Hz frequency range).
Table 1.
Arithmetic (RT) and logarithmic (C50 and D50) average acoustic parameters for each room (250 ÷ 2500 Hz frequency range).
| Th. Room 1 | Th. Room 2 | Th. Room 3 | Th. Room 4 | Soft Room | Bedroom | Atelier | |
|---|---|---|---|---|---|---|---|
| RT [s] | 0.66 | 0.88 | 0.64 | 0.75 | 0.44 | 0.64 | 0.94 |
| C50 (dB) | 3.8 | 3.5 | 5.6 | 4.5 | 3.9 | 6.9 | 5.1 |
| D50 [-] | 0.69 | 0.67 | 0.77 | 0.72 | 0.70 | 0.92 | 0.65 |
Table 2.
Comparison of the analyzed setup for therapy room no. 4 in terms of C50 and D50 indexes.
| Configuration (iii) | Configuration (iv,a) | Configuration (iv,b) | ||||
|---|---|---|---|---|---|---|
| Frequency | 250 Hz | 1000 Hz | 250 Hz | 1000 Hz | 250 Hz | 1000 Hz |
| C50 (dB) | 10 | 14.5 | 8 | 12 | 8.5 | 13 |
| D50 | 0.9 | 0.96 | 0.8 | 0.95 | 0.85 | 0.95 |
Table 3.
Comparison of the analyzed setup for the bedroom in terms of the C50 and D50 indexes.
| Configuration (i) | Configuration (ii) | Configuration (iii) | Configuration (iv) | |||||
|---|---|---|---|---|---|---|---|---|
| Frequency | 250 Hz | 1000 Hz | 250 Hz | 1000 Hz | 250 Hz | 1000 Hz | 250 Hz | 1000 Hz |
| C50(dB) | 4.7 | 5.5 | 10.35 | 9.95 | 11 | 10.7 | 10.6 | 10 |
| D50 | 0.74 | 0.78 | 0.92 | 0.91 | 0.92 | 0.92 | 0.92 | 0.9 |
Publisher’s Note: MDPI stays neutral with regard to jurisdictional claims in published maps and institutional affiliations. |
© 2021 by the authors. Licensee MDPI, Basel, Switzerland. This article is an open access article distributed under the terms and conditions of the Creative Commons Attribution (CC BY) license (https://creativecommons.org/licenses/by/4.0/).
Share and Cite
MDPI and ACS Style
Bettarello, F.; Caniato, M.; Scavuzzo, G.; Gasparella, A. Indoor Acoustic Requirements for Autism-Friendly Spaces. Appl. Sci. 2021, 11, 3942. https://0-doi-org.brum.beds.ac.uk/10.3390/app11093942
AMA Style
Bettarello F, Caniato M, Scavuzzo G, Gasparella A. Indoor Acoustic Requirements for Autism-Friendly Spaces. Applied Sciences. 2021; 11(9):3942. https://0-doi-org.brum.beds.ac.uk/10.3390/app11093942
Chicago/Turabian StyleBettarello, Federica, Marco Caniato, Giuseppina Scavuzzo, and Andrea Gasparella. 2021. "Indoor Acoustic Requirements for Autism-Friendly Spaces" Applied Sciences 11, no. 9: 3942. https://0-doi-org.brum.beds.ac.uk/10.3390/app11093942
Note that from the first issue of 2016, this journal uses article numbers instead of page numbers. See further details here.