Article

The Use of the ROS Scavenger Cysteine as a Surface Ligand of Metal Nanoclusters and Its Bactericidal Elimination Effect

1
Dharma Husada Nursing Academy, Kediri 64114, Indonesia
2
School of Biomedical Engineering, College of Biomedical Engineering, Taipei Medical University, Taipei 11031, Taiwan
3
School of Nursing, College of Nursing, Taipei Medical University, Taipei 11031, Taiwan
4
Faculty of Nursing and Midwivery, Nahdlatul Ulama University of Surabaya, Surabaya 60243, Indonesia
5
Graduate Institute of Nanomedicine and Medical Engineering, College of Biomedical Engineering, Taipei Medical University, Taipei 11031, Taiwan
6
Taoyuan Municipal Nankan Senior High School, Taoyuan 33850, Taiwan
7
International Ph.D. Program in Biomedical Engineering, College of Biomedical Engineering, Taipei Medical University, Taipei 11031, Taiwan
*
Author to whom correspondence should be addressed.
Submission received: 26 March 2021 / Revised: 26 April 2021 / Accepted: 28 April 2021 / Published: 30 April 2021

Abstract

:
The bactericidal effects of fluorescent metal nanoclusters have impeded their bacterial bioimaging applications due to the reactive oxygen species (ROS) generation that is induced by the nanoclusters in bacteria to cause bacterial death. Herein, an ROS scavenger of cysteine was exploited as a surface ligand to prepare cysteine-conjugated gold nanoclusters (Cys–AuNCs) and cysteine-conjugated silver nanoclusters (Cys–AgNCs) using a facile hydrothermal approach. The structural and optical characterizations demonstrated successful syntheses of Cys–AuNCs and Cys–AgNCs. With the same weight concentration, the bactericidal effect increased in the order of Cys–AuNCs, Cys–AgNCs, and silver nanoparticles (AgNPs), according to the results of the bacterial growth curves. Furthermore, based on the results of the standard colony-counting method, the Cys–AuNCs revealed the best biocompatibility compared to those of the Cys–AgNCs and AgNPs in Escherichia coli (E. coli). The superior biocompatibility of the Cys–AuNCs can be attributed to the use of the ligand of cysteine as an ROS scavenger to reduce ROS in E. coli. Electron paramagnetic resonance (EPR) analyses indicated that the use of the ROS scavenger cysteine as the surface ligand of the Cys–AuNCs eliminated the ROS production induced by the Cys–AuNCs in E. coli. The biocompatible Cys–AuNCs were also confirmed as a fluorescent probe using confocal microscopy. Highly biocompatible Cys–AuNCs could be a potential fluorescent probe in the application of bacterial bioimaging.

1. Introduction

Nanomaterials, including metals, semiconductors, and insulators, have been intensively investigated for their applications in medicine, energy, and electronics due to their superior chemical and physical properties [1,2,3,4,5,6,7,8,9,10,11,12]. Among the different nanomaterials, metallic nanoclusters with tunable fluorescence, easy surface modification, and precise structure have been extensively applied in bioimaging, sensing, and therapy [13,14,15,16,17,18,19,20]. For example, gold nanoclusters (AuNCs) conjugated with the ligand of glucose have been developed as a fluorescent molecular contrast agent for the specific targeting of glucose transporters that are overexpressed in brain cancer cells [21]. Hemoglobin-conjugated AuNCs have been explored for the rapid sensing of three haptoglobin phenotypes in plasma, namely, Hp 1-1, Hp 2-1, and Hp 2-2, because the fluorescent AuNCs combined with various haptoglobin phenotypes have caused their fluorescence changes in the intensity and the peak position [22]. Nanoclusters composed of gold or copper as a metal core and ovalbumin, pepsin, trypsin, or glutathione as the ligands have been used to create an ultrafast sensor that provides a clear distinction between Gram-positive and Gram-negative bacteria [23]. Radiofrequency-responsive AuNCs that are obtained via the reduction of Au(I)-thiolate complex using L-glutathione under the template polymer have been manufactured to improve the synergistic therapy of tumor ablation and artery embolization [24]. Silver nanoclusters (AgNCs) that are conjugated with specific DNA sequences as the highly fluorescent probes have been proposed for the specific, sensitive, and one-step immunoassay of bivalent anti-digoxigenin antibodies [25]. Achievements in the designs of fluorescent metal nanoclusters with various surface ligands as the probes have shown enormous potential for biomedical applications.
In comparison with traditional organic fluorescent dyes, fluorescent metal nanoclusters produce broad emission spectra, large Stokes shifts, and long imaging times for bioimaging [26,27,28,29,30]. However, recent studies of ultra-small nanoclusters have been confirmed to produce antimicrobial activity [31,32,33,34,35]. For example, 6-mercaptohexanoic-acid-conjugated AuNCs have displayed wide-spectrum antibacterial activity against both Gram-positive and Gram-negative bacteria due to their high interaction with bacteria to induce intracellular reactive oxygen species (ROS) generation to consequently kill bacteria [36]. Quaternary-ammonium-conjugated AuNCs have been prepared as antibacterial agents to combat methicillin-resistant Staphylococcus aureus (S. aureus) and multidrug-resistant Escherichia coli (E. coli) because AuNCs with a positive surface charge can improve their electrostatic adsorption onto the bacterial cell membrane and further enter into the bacteria to increase ROS production to kill bacteria [37]. Moreover, brightly fluorescent melamine-DNA-conjugated AgNCs have exhibited higher antimicrobial activities against Gram-negative E. coli and Gram-positive S. aureus than those of DNA–AgNCs alone [38]. The great advancements for the uses of fluorescent metal nanoclusters as antibacterial agents have importantly impacted the challenge against bacteria due to their increases in ROS generation in bacteria.
The bactericidal effects of fluorescent metal nanoclusters have obstructed their bioimaging applications in bacteria owing to the cause of bacterial death. To address the issue of ROS production induced by metal nanoclusters in bacteria, the ROS scavenger cysteine was utilized as a ligand for the syntheses of cysteine-conjugated gold nanoclusters (Cys–AuNCs) and cysteine-conjugated silver nanoclusters (Cys–AgNCs) using a facile hydrothermal approach. Furthermore, the structural and optical properties of Cys–AuNCs and Cys–AgNCs were characterized using transmission electron microscopy (TEM), ultraviolet–visible (UV–Vis) spectroscopy, fluorescence spectroscopy, and Fourier transform infrared (FTIR) spectroscopy. Antibacterial activities of Cys–AuNCs, Cys–AgNCs, and AgNPs were respectively investigated against E. coli. Moreover, E. coli incubated with Cys–AgNCs, Cys–AuNCs, and AgNPs were separately cultured on LB agar plates and their viabilities were also calculated. Electron paramagnetic resonance (EPR) spectroscopy was applied to detect the precise free radicals and species with unpaired electrons induced by Cys–AgNCs and Cys–AuNCs in E. coli. The detailed mechanism of the ligand of cysteine as an ROS scavenger was investigated for the elimination of ROS caused by Cys–AgNCs and Cys–AuNCs in E. coli. To demonstrate the bacterial bioimaging application, confocal microscopy was employed with the use of Cys–AuNCs as a fluorescence probe for E. coli.

2. Materials and Methods

2.1. Chemicals

Tetrachloroauric (III) acid (99.9%), silver nitrate (AgNO3, 99.9999% trace metals basis), sodium hydroxide (NaOH, ≥98.0%), lysogeny broth (Miller), paraformaldehyde, and 5,5-dimethyl-1-pyrroline N-oxide (DMPO, for ESR spectroscopy) were purchased from Sigma-Aldrich (St. Louis, MO, USA). L-cysteine (>99%) was purchased from Acros Organics (Morris, NJ, USA). Kanamycin was purchased from BioShop Canada Inc. (Burlington, ON, Canada). Agar powder (bacteriological grade) was purchased from Bioman Scientific Co., Ltd. (New Taipei City, Taiwan).

2.2. Synthesis of the Cysteine-Conjugated Gold Nanoclusters

Cys–AuNCs were synthesized using a facile hydrothermal approach. To synthesize the Cys–AuNCs, a cysteine aqueous solution (3 mL, 50 mM) was added to HAuCl4 aqueous solution (3 mL, 10 mM) in a water bath at 40 °C under stirring at 340 rpm. During the reaction, the yellow color of the reactant solution was converted to a milky appearance. After reacting for 24 h in the dark, a milky solution containing Cys–AuNCs was synthesized using the facile hydrothermal approach. For the purification, the Cys–AuNC solution was centrifuged at 15,000 rpm for 10 min. The supernatant was carefully eliminated without disturbing the pallet of Cys–AuNCs. Consequently, the pallet of Cys–AuNCs was redispersed in deionized water (6 mL) using sonification. The purification processes were repeated three times to wash out the residual cysteine that did not conjugate onto the Cys–AuNCs. After purification, the Cys–AuNC solution was stored at 4 °C in the dark for further experiments.

2.3. Synthesis of the Cysteine-Conjugated Silver Nanoclusters

To synthesize the Cys–AgNCs, a cysteine aqueous solution (5 mL, 75 mM) was added to a AgNO3 aqueous solution (5 mL, 10 mM) in a water bath at 40 °C under stirring at 340 rpm. After reacting for 24 h in the dark, a NaOH aqueous solution (10 µL, 0.1 M) was added to the reactant solution and then the reactant solution with the NaOH aqueous solution was kept in a water bath at 40 °C under stirring at 340 rpm. After reacting for an additional 24 h in the dark, a Cys–AgNC solution was obtained using the facile hydrothermal approach. For the purification, the Cys–AgNC solution was centrifuged at 12,000 rpm for 20 min. After the centrifugation, the supernatant was carefully removed to avoid disturbing the pallet of Cys–AgNCs. The precipitate of Cys–AgNCs was redispersed in deionized water (10 mL) using sonification. The purification processes were repeated three times to wash out the unconjugated cysteine. The purified Cys–AgNCs were stored at 4 °C in the dark for further experiments.

2.4. Bacterial Growth Curve Analysis

To prepare the lysogeny broth (LB) medium, 25 g of LB broth (Miller) was added into 1000 mL of sterilized water. The LB medium was then autoclaved for 20 min at 121 °C. After autoclaving, 1 mL Kanamycin (50 mg/mL) was added to the LB medium. E. coli (150 µL) was cultured with the LB medium (3 mL) in a shaker at 170 rpm at 37 °C. In the LB medium, the amount of E. coli was evaluated using the optical density at the wavelength of 600 nm (OD600). In this work, E. coli with an OD600 of 1.0 was measured to be 8 × 10⁸ colony-forming units per milliliter (CFU/mL). For the E. coli growth curve analysis, the E. coli solution with an OD600 of 0.1 (1.5 mL, 8 × 10⁷ CFU/mL) was added to a round-bottomed tube with 1.5 mL of a Cys–AuNC or Cys–AgNC solution. Each of the Cys–AuNC and Cys–AgNC solutions with various concentrations (2.8, 1.4, 0.7, 0.35, and 0.175 mg/mL) were applied for the E. coli growth curve analysis. After incubation with the Cys–AuNCs or Cys–AgNCs, the E. coli solution was cultured in a shaker at 170 rpm at 37 °C and then the OD600 value was measured every 30 min for 3 h.

2.5. Assessment of the Total Number of Bacteria Using Plate Count Agar

After incubation with the Cys–AuNCs and Cys–AgNCs, plate count agar was applied to assess the E. coli growth. To prepare the medium of the LB agar plate, 25 g LB broth and 15 g agar powder were added into 1000 mL sterilized water and then the LB broth and agar powder were stirred until completely dissolved in the sterilized water. Then, the medium of LB agar plate was autoclaved for 20 min at 121 °C. After autoclaving, 1 mL Kanamycin (50 mg/mL) was added to the medium of the LB agar plate. To prepare the LB agar plates, the medium of the LB agar plate was added to the Petri dishes (120 × 20 mm) and then the LB agar plates were cooled overnight. The agar plates were stored at 4 °C for further experiments. To assess the growth of E. coli, the Cys–AuNC and Cys–AgNC solutions (1.5 mL, 0.175 mg/mL) were each added into E. coli solutions (1.5 mL, 8 × 10⁷ CFU/mL) in round-bottomed tubes in a shaker at 170 rpm at 37 °C. After culturing for 3 h, the E. coli solutions that were incubated with the Cys–AuNCs and Cys–AgNCs were each diluted by 10,000 times. For the plate count agar, 40 µL of E. coli solution containing Cys–AuNCs or Cys–AgNCs was loaded onto the agar plate. Sterilized glass plating beads were applied for the dispersion of E. coli over the surface of the agar plate. After the homogenous distribution of E. coli solution, all the glass beads were removed and the agar plate was placed in the incubator at 37 °C overnight.

2.6. Bacterial Imaging Using Confocal Fluorescence Microscopy

To prepare the samples for confocal fluorescence microscopy, the bacteria of E. coli cultured in LB solution (3 mL, 8 × 10⁷ CFU/mL) were added to a round-bottomed tube and were then centrifuged at 4000 rpm for 5 min. After the removal of the supernatant, 3 mL of Cys–AuNCs or Cys–AgNCs (0.175 mg/mL) was added to the round-bottomed tube containing E. coli. In the round-bottomed tube, E. coli were incubated with Cys–AuNCs or Cys–AgNCs in a shaker at 170 rpm at 37 °C for 30 min. After incubation, the E. coli solution was centrifuged at 4000 rpm for 5 min and then the supernatant was removed. The precipitate of E. coli was redispersed in 3 mL of sterilized water. The washing processes were repeated three times. Afterward, 1.5 mL of the bacterial solution was transferred into an Eppendorf tube with paraformaldehyde (4%) and then kept in the dark for 15 min. For the control sample (incubation with sterilized water), the E. coli solution was incubated with Hoechst 33342 solution (1 μg/mL) and paraformaldehyde (4%) and then kept in the dark for 15 min. Afterward, the bacteria were seeded onto a microscope slide and further fixed with an antifade reagent. Ultimately, the microscope slide seeded with bacteria was covered by a glass coverslip and protected from the light for the following microscopy experiments. Bacteria on the microscope slides were observed using confocal microscopy (Leica TCS SP5, Wetzlar, Germany) with an oil immersion objective. A 405 nm laser (Argon laser, 100 mW) (Leica TCS SP5, Wetzlar, Germany) was selected to excite all samples. For better image contrast, the Hoechst 33342 channel was assigned a false blue color, the control sample channel was assigned a false green color, and the Cys–AuNC channel was assigned a false red color.

2.7. Measurement of the Absolute Quantum Yields Using an Integrating Sphere

To measure the absolute fluorescence quantum yields of the Cys–AuNCs and Cys–AgNCs, a JASCO FP-8500 spectrofluorometer (Easton, MD, USA) and a JASCO ILF-835 integrating sphere unit (Easton, MD, USA) were utilized. Rhodamine B was applied to correct the excitation spectrum before obtaining the absolute quantum yield calculations. The fluorescence quantum yields were determined using the following equation:
Fluorescence Quantum Yield = Sf/(SexSex’),
where Sf is the area under the corrected fluorescence spectrum of Cys–AuNCs or Cys–AgNCs solution obtained with the excitation wavelength, Sex is the area under the corrected spectrum of the excitation light through a solvent of water, and Sex is the area under the corrected spectrum of the unabsorbed excitation light that passes through the Cys–AuNCs or Cys–AgNCs solution.

3. Results and Discussion

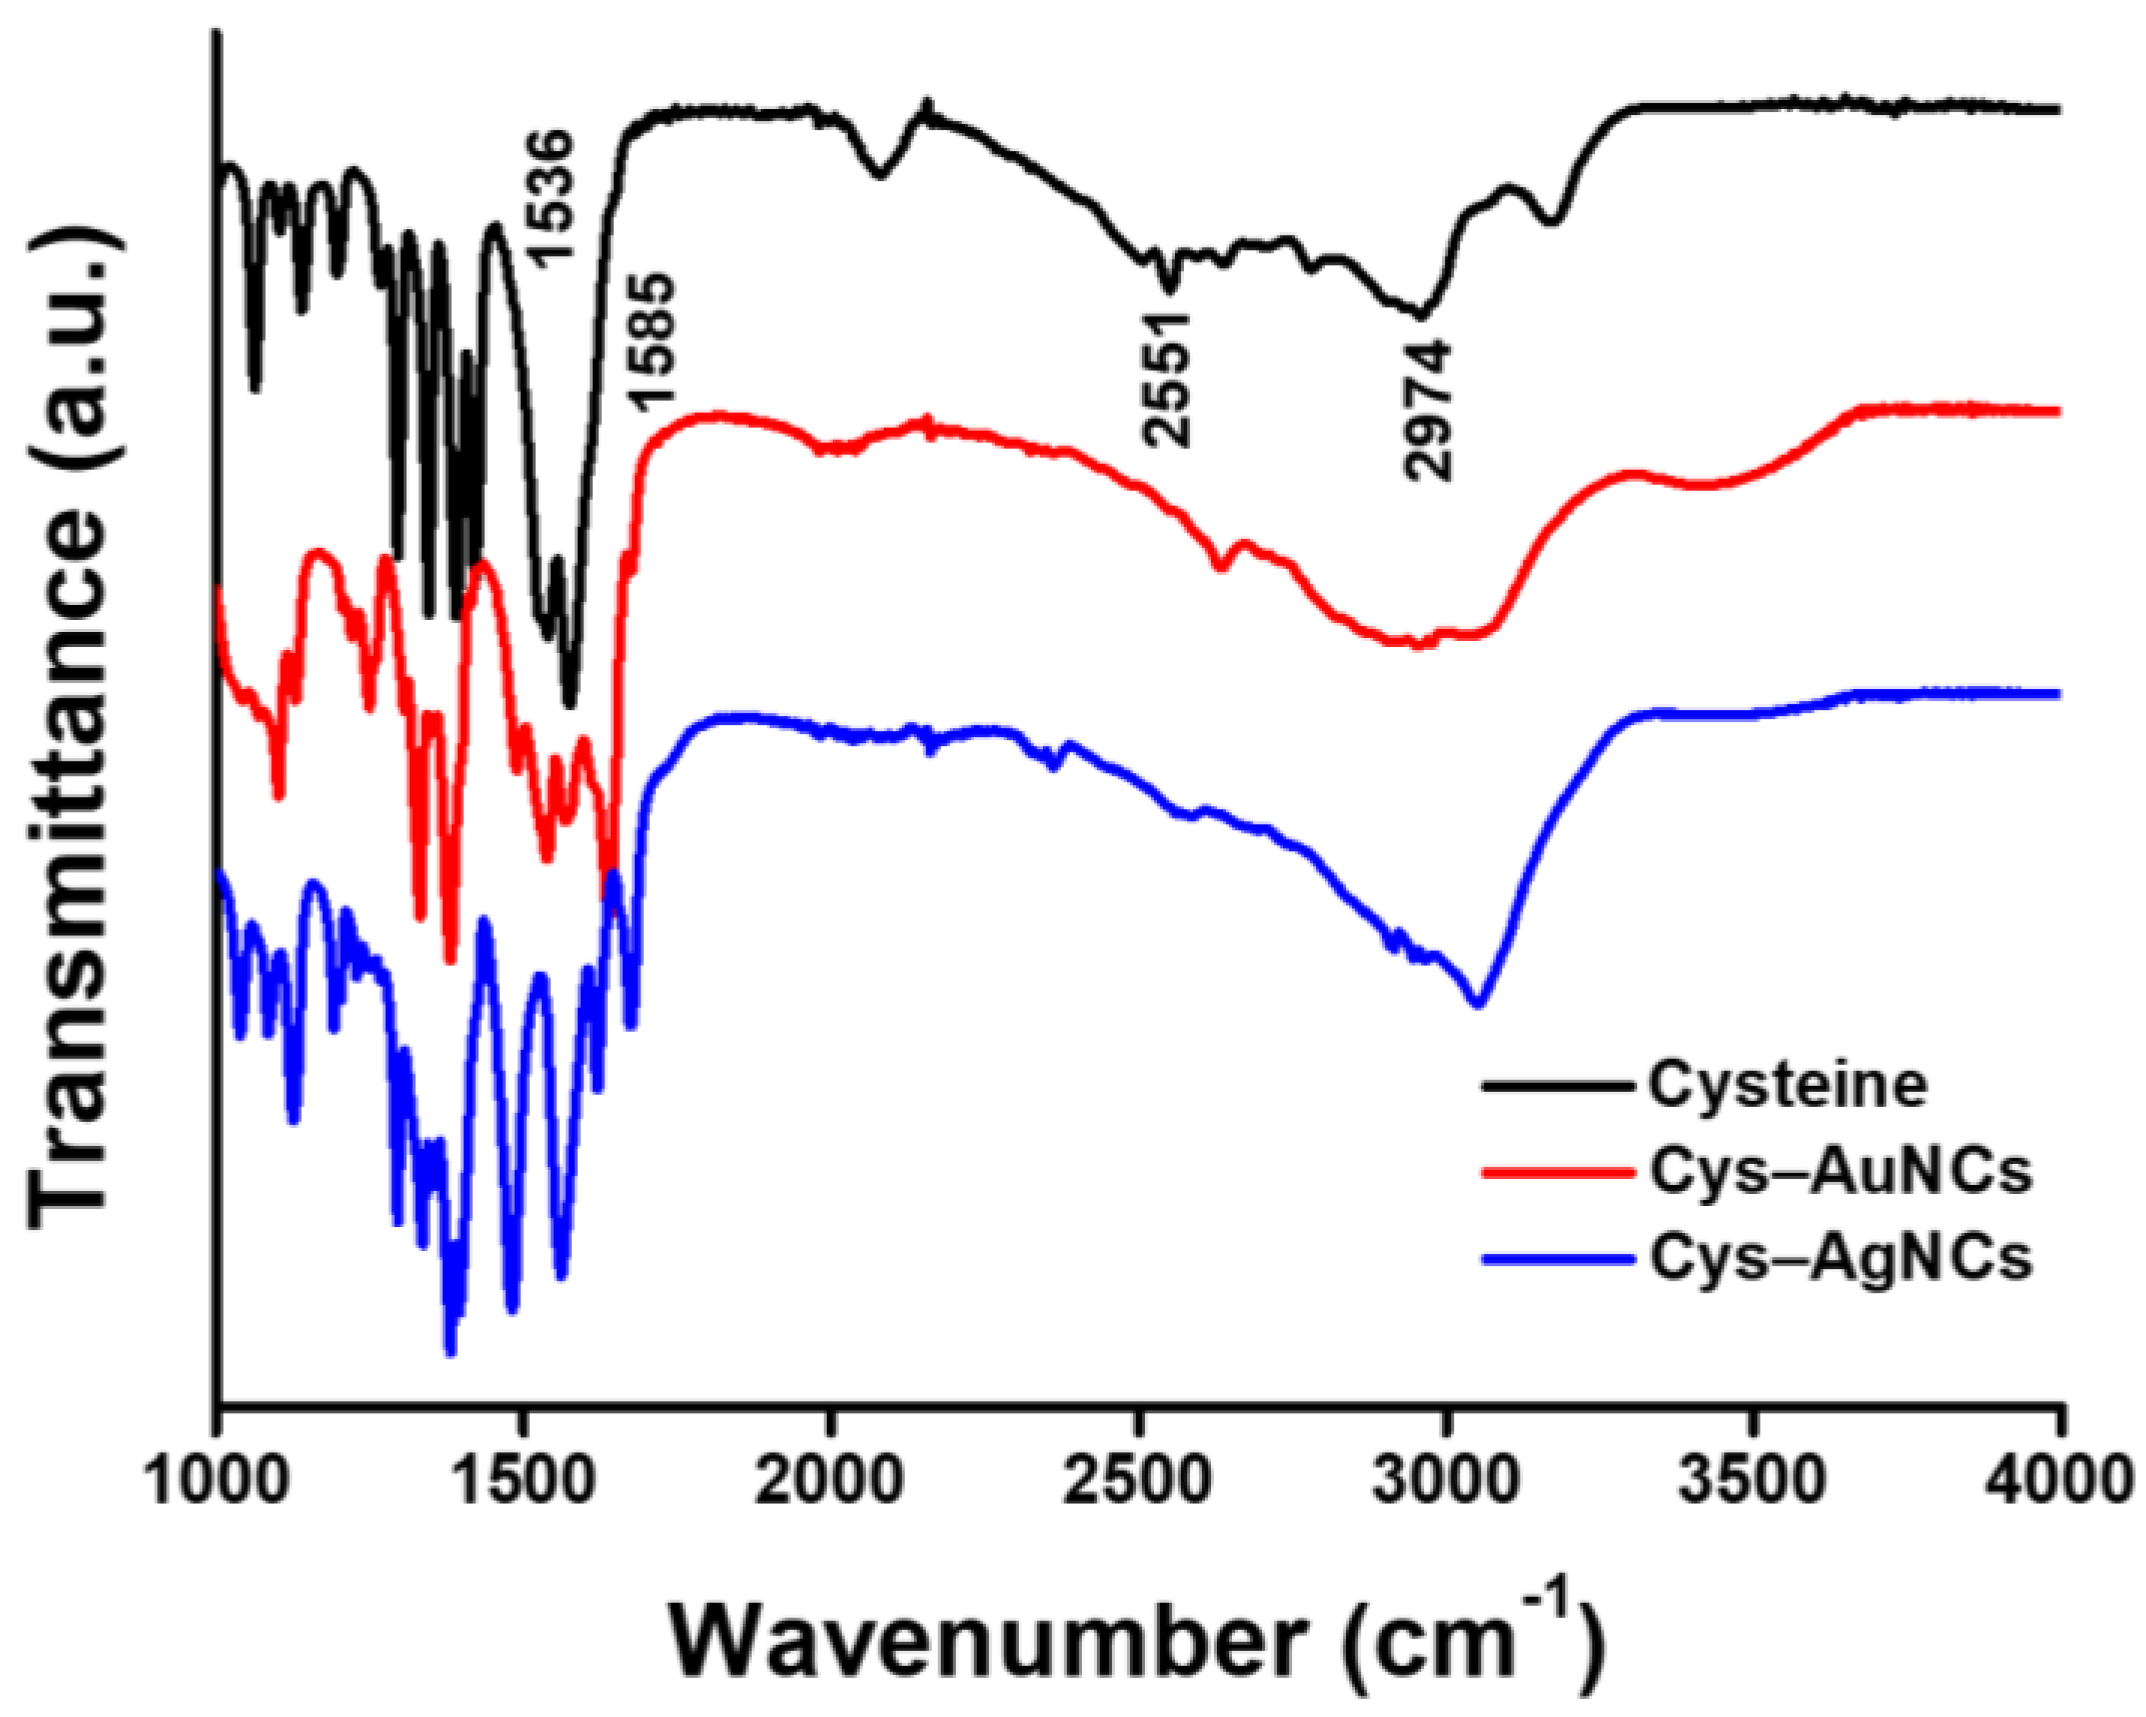
3.1. Structural and Optical Characterizations of the Cys–AuNCs and Cys–AgNCs

To demonstrate the successful preparations of Cys–AuNCs and Cys–AgNCs, the sizes and shapes were characterized using transmission electron microscopy (TEM) (Hitachi HT-7700, Tokyo, Japan). As shown in Figure 1a, the Cys–AuNCs exhibited an approximately spherical shape. In the TEM image of Figure 1b, the Cys–AgNCs also revealed a roughly spherical shape. Furthermore, the sizes of the Cys–AuNCs and Cys–AgNCs were each measured based on 100 nanoclusters in the TEM images of Figure 1a,b. The size distributions of the Cys–AuNCs and Cys–AgNCs are respectively shown in the histograms of Figure 1c,d, and their Gaussian fitting curves were also simulated, as shown in Figure 1c,d. According to the Gaussian fitting curves, the average sizes of the Cys–AuNCs and Cys–AgNCs were respectively calculated to be 3.9 ± 0.021 and 4.7 ± 0.038 nm.
To further characterize the optical properties, UV–Vis spectra and fluorescence spectra of the Cys–AuNCs and Cys–AgNCs were separately examined using UV–Vis spectroscopy (JASCO V-770 Spectrophotometer, Easton, MD, USA) and fluorescence spectroscopy (JASCO spectrofluorometer FP-8500, Easton, MD, USA). As shown in Figure 2a, the UV–Vis absorption spectrum of the Cys–AuNCs revealed the lack of surface plasmon absorption of the gold nanoparticles at a wavelength of ≈520 nm. Similarly, the absorption spectrum of the Cys–AgNCs showed the disappearance of the surface plasmon absorption of the silver nanoparticles at a wavelength of ≈450 nm. The disappearances of the surface plasmon absorptions of metallic nanoparticles can be attributed to the metallic nanoclusters containing high oxidation states of metallic ions, which resulted in the shortage of free electrons for the generation of coherent oscillations [39,40]. Moreover, the fluorescence spectra were examined to demonstrate the successful syntheses of the Cys–AuNCs and Cys–AgNCs. As shown in Figure 2b, the fluorescence spectrum of the Cys–AuNCs exhibited a maximum intensity at 575 nm when using an excitation wavelength of 360 nm. The large Stokes shift (215 nm) of the Cys–AuNCs revealed their promising application as a fluorescent probe in bioimaging. The left inset in Figure 2b shows the orange-red fluorescence of the Cys–AuNCs under irradiation using a hand-held UV lamp. For the Cys–AgNCs, the fluorescence spectrum exhibited a maximum intensity at 438 nm using an excitation wavelength of 364 nm. The right inset in Figure 2b shows the blue fluorescence of Cys–AgNCs under irradiation from a hand-held UV lamp. Furthermore, the fluorescence quantum yields of the Cys–AuNCs and Cys–AgNCs were respectively measured to be 7.2 and 0.98% using an integrating sphere. According to previous studies, the fluorescences of the Cys–AuNCs and Cys–AgNCs were validated because of the ligand–metal charge transfer between the thiolate ligand and the core of the AuNCs [41,42,43].
To further confirm that the cysteine conjugated with the AuNCs, the cysteine, Cys–AuNCs, and Cys–AgNCs were characterized using Fourier transform infrared (FTIR) spectroscopy (Thermo Scientific Nicolet iS10, Waltham, MA, USA). s shown in Figure 3, the characteristic IR bands of cysteine were obtained, including a broad stretching band of NH3+ (≈2974 cm−1), a stretching band of SH (≈2551 cm−1), an asymmetric stretching band of COO (≈1585 cm−1), and a bending vibration of NH (≈1536 cm−1). After the conjugations of the cysteine and metallic nanoclusters, the characteristic IR bands of the cysteine in the Cys–AuNCs and Cys–AgNCs presented a small shift compared to those of cysteine due to the change in the dipole moment of the cysteine conjugated onto metallic nanoclusters [44]. Most importantly, the stretching band of SH of the cysteine vanished because Au–S and Ag–S covalent bonds were generated in both the Cys–AuNCs and Cys–AgNCs [45,46]. Overall, the results from the TEM images, UV–Vis absorption spectra, fluorescence spectra, and FTIR analyses indicated that the fluorescent Cys–AuNCs and Cys–AgNCs were successfully synthesized using the facile hydrothermal approaches.

3.2. Bacterial Viability Assays of the Cys–AuNCs and Cys–AgNCs

For application as a fluorescent probe, nanoclusters have to be highly biocompatible in bacteria. To investigate the bacterial viabilities, the Cys–AuNCs and Cys–AgNCs with various concentrations were respectively incubated with E. coli. As shown in Figure 4, without incubation with the Cys–AuNCs, Cys–AgNCs, or silver nanoparticles (AgNPs), the OD600 value of the E. coli solution was measured to be ≈1.00 (the curve of E. coli) after culturing for 180 min. Furthermore, as seen in Figure 4a, the bacterial growth curves revealed that the bactericidal effect was increased with the concentrations of the Cys–AuNCs. The OD600 values of the E. coli solutions incubated with the Cys–AuNCs at different concentrations, namely, 0.175, 0.35, 0.7, 1.4, and 2.8 mg/mL, were respectively found to be 0.99, 0.93, 0.92, 0.82, and 0.63 after culturing for 180 min. Moreover, as seen in Figure 4b, the bacterial growth curves of E. coli also demonstrated that the antibacterial effect of the Cys–AgNCs increased with the concentrations. The OD600 values of the E. coli solutions incubated with the Cys–AgNCs at various concentrations, namely, 0.175, 0.35, 0.7, 1.4, and 2.8 mg/mL, were respectively detected to be 0.80, 0.65, 0.59, 0.30, and 0.11 after culturing for 180 min. The antibacterial effects of the Cys–AuNCs and Cys–AgNCs can be attributed to the ROS generation that was induced by the Cys–AuNCs and Cys–AgNCs for the inactivation of the E. coli [47]. In comparison with the Cys–AuNCs (0.175 mg/mL), the Cys–AgNCs (0.175 mg/mL) produced a higher bactericidal effect because the release of the silver ions from the Cys–AgNCs enhanced the ROS production and inhibited the growth of the E. coli [48]. To examine the release of the silver ions, AgNPs (0.175 mg/mL) with an average size of 18.5 nm were incubated with the E. coli. As shown in Figure 4c, with the incubation of AgNPs, there was no obvious growth of E. coli after culturing for 180 min. With the same concentration (0.175 mg/mL), the Cys–AgNCs expressed a lower bactericidal effect compared to that of the AgNPs because the cysteine ligand of the Cys–AgNCs could be applied as an ROS scavenger to decrease the ROS generation. The generation of ROS was quenched using cysteine on the surface of the Cys–AuNCs, resulting in its oxidized form, cystine [49,50]. Most importantly, compared to the E. coli solution, the growth curve of the E. coli incubated with the Cys–AuNCs (0.175 mg/mL) presented no significant change, as shown in Figure 4a. The results indicated that the Cys–AuNCs (0.175 mg/mL) exhibited superior biocompatibility in the E. coli. due to the use of the cysteine ligand as an ROS scavenger.
To further investigate the bactericidal activity, the E. coli incubated with the same concentration of the Cys–AgNCs, Cys–AuNCs, and AgNPs (0.175 mg/mL) were each cultured on LB agar plates. As shown in Figure 5a, the colonies of the E. coli incubated with sterilized water, Cys–AgNCs, Cys–AuNCs, and AgNPs were calculated to be 2.02 × 10⁹, 1.95 × 10⁹, 1.68 × 10⁹, and 0 CFU/mL, respectively. Moreover, the viabilities of the E. coli incubated with the Cys–AgNCs, Cys–AuNCs, and AgNPs were separately calculated to be 97%, 81%, and 1%. Based on the results of the standard colony-counting method, the Cys–AuNCs exhibited superior biocompatibility in the E. coli and the AgNPs revealed high bactericidal activity in the E. coli. Therefore, the superior biocompatible Cys–AuNCs were demonstrated as being a potential fluorescent probe for biomedical applications in bacteria.

3.3. ROS Generation of the E. coli Incubated with the Cys–AuNCs and Cys–AgNCs

To further evaluate the ROS generation, EPR spectroscopy with a spin trap of DMPO was applied for the measurement and characterization of free radicals and other species with unpaired electrons. As shown in Figure 6a, there was no significant ROS generation for the E. coli solution. In Figure 6b, for the E. coli incubated with the Cys–AuNCs (0.175 mg/mL), there was also no obvious ROS generation, which corresponds to the high biocompatibility of the Cys–AuNCs with E. coli. However, as shown in Figure 6c, for the E. coli incubated with the Cys–AgNCs (0.175 mg/mL), the EPR spectra revealed the spin adduct (DMPO-OH) with a characteristic 1:2:2:1 quartet of EPR lines [51]. The reason for this can be ascribed to the hydroxyl radicals generated from the incubation of the E. coli with the Cys–AgNCs, which interacted with the nitrogen nucleus and a proton present on the spin trap of the DMPO. Overall, the results of the EPR analyses demonstrated that the high biocompatibility of the Cys–AuNCs can be attributed to the use of the cysteine ligand as an ROS scavenger to eliminate the ROS after the incubation of the E. coli with the Cys–AuNCs.

3.4. Fluorescence Imaging of the Cys–AuNCs in the E. coli

The fluorescence quantum yield of the Cys–AuNCs was measured to be 7.2% by employing an integrating sphere. To evaluate the application of the Cys–AuNCs as a fluorescence probe in the E. coli, the confocal microscope images of the E. coli were examined after incubation with the Cys–AuNCs. As shown in the confocal images of Figure 7, Hoechst 33342 was first applied to stain the E. coli. The blue pseudocolor was observed from the rod-shaped E. coli. For the merged image, the fluorescence of Hoechst 33342 was homogeneously distributed in the E. coli. Moreover, for the control experiment, there was no detectable fluorescence from the E. coli. In comparison with the incubation of the E. coli with the Cys–AuNCs, the red pseudocolor was observed from the rod-shaped E. coli, as shown in the merged image of the E. coli incubated with the Cys–AuNCs. The results of the confocal microscope images indicated that the biocompatible Cys–AuNCs could be a promising fluorescent probe for bioimaging application.

4. Conclusions

Cysteine ligands were successfully utilized for the preparation of Cys–AuNCs and Cys–AgNCs via a facile hydrothermal approach. The structural and optical properties of the Cys–AuNCs and Cys–AgNCs were demonstrated using TEM, UV–Vis spectroscopy, fluorescence spectroscopy, and FTIR spectroscopy. The bacterial growth curves indicated that the OD600 values of the E. coli solutions incubated with the Cys–AuNCs, Cys–AgNCs, and AgNPs were respectively measured to be 0.99, 0.80, and 0 after culturing for 180 min. The results of the standard colony-counting method also demonstrated that the viabilities of the E. coli incubated with the Cys–AgNCs, Cys–AuNCs, and AgNPs were separately calculated to be 97%, 81%, and 1%. For the EPR spectra, there was also no obvious ROS generation from the E. coli incubated with the Cys–AuNCs, but ROS generation was detected from the E. coli incubated with the Cys–AgNCs. For bioimaging, the biocompatible Cys–AuNCs were also demonstrated to be a suitable fluorescent probe in confocal microscopy. Overall, the high biocompatibility of the Cys–AuNCs can be ascribed to the cysteine surface ligand of the Cys–AuNCs that was applied as an ROS scavenger to eliminate the ROS induced by the Cys–AuNCs in the E. coli.

Author Contributions

Conceptualization, D.I.K., M.A., D.S.A., E.Q.R., D.R., M.K., and T.-R.K.; methodology, D.I.K.; validation, D.I.K., P.-H.H., and Y.-H.L.; investigation, D.I.K., P.-H.H., Y.-H.L., and S.-C.L.; writing—original draft preparation, D.I.K. and T.-R.K.; writing—review and editing, D.I.K. and T.-R.K.; supervision, D.I.K.; project administration, T.-R.K.; funding acquisition, T.-R.K. All authors have read and agreed to the published version of the manuscript.

Funding

This work was financially supported by MOST 109-2113-M-038-005-MY2, Taipei Medical University, and the Higher Education Sprout Project from the Ministry of Education (MOE) in Taiwan.

Acknowledgments

We would like to acknowledge Chun-Chih Liu, Ting-Hao Wang, and Chi-Ming Lee for their excellent technical support at the TMU Core Facility Center.

Conflicts of Interest

The authors declare no conflict of interest.

References

  1. Kuo, T.R.; Chen, W.T.; Liao, H.J.; Yang, Y.H.; Yen, H.C.; Liao, T.W.; Wen, C.Y.; Lee, Y.C.; Chen, C.C.; Wang, D.Y. Improving hydrogen evolution activity of earth-abundant cobalt-doped iron pyrite catalysts by surface modification with phosphide. Small 2017, 13, 1603356. [Google Scholar] [CrossRef] [PubMed]
  2. Mutalik, C.; Hsiao, Y.-C.; Chang, Y.-H.; Krisnawati, D.I.; Alimansur, M.; Jazidie, A.; Nuh, M.; Chang, C.-C.; Wang, D.-Y.; Kuo, T.-R. High uv-vis-nir light-induced antibacterial activity by heterostructured TiO2-FeS2 nanocomposites. Int. J. Nanomed. 2020, 15, 8911. [Google Scholar] [CrossRef] [PubMed]
  3. Kuo, T.-R.; Liao, H.-J.; Chen, Y.-T.; Wei, C.-Y.; Chang, C.-C.; Chen, Y.-C.; Chang, Y.-H.; Lin, J.-C.; Lee, Y.-C.; Wen, C.-Y. Extended visible to near-infrared harvesting of earth-abundant FeS2-TiO2 heterostructures for highly active photocatalytic hydrogen evolution. Green Chem. 2018, 20, 1640–1647. [Google Scholar] [CrossRef]
  4. Hsiao, Y.-C.; Jheng, P.-R.; Nguyen, H.T.; Chen, Y.-H.; Manga, Y.B.; Lu, L.-S.; Rethi, L.; Chen, C.-H.; Huang, T.-W.; Lin, J.-D.; et al. Photothermal-irradiated polyethyleneimine–polypyrrole nanopigment film-coated polyethylene fabrics for infrared-inspired with pathogenic evaluation. ACS Appl. Mater. Interfaces 2021, 13, 2483–2495. [Google Scholar] [CrossRef]
  5. Lu, K.-Y.; Jheng, P.-R.; Lu, L.-S.; Rethi, L.; Mi, F.-L.; Chuang, E.-Y. Enhanced anticancer effect of ROS-boosted photothermal therapy by using fucoidan-coated polypyrrole nanoparticles. Int. J. Biol. Macromol. 2021, 166, 98–107. [Google Scholar] [CrossRef]
  6. Burnouf, T.; Chen, C.-H.; Tan, S.-J.; Tseng, C.-L.; Lu, K.-Y.; Chang, L.-H.; Nyambat, B.; Huang, S.-C.; Jheng, P.-R.; Aditya, R.N. A bioinspired hyperthermic macrophage-based polypyrrole-polyethylenimine (ppy-pei) nanocomplex carrier to prevent and disrupt thrombotic fibrin clots. Acta Biomater. 2019, 96, 468–479. [Google Scholar] [CrossRef]
  7. Chen, Y.-P.; Xu, L.; Tang, T.-W.; Chen, C.-H.; Zheng, Q.-H.; Liu, T.-P.; Mou, C.-Y.; Wu, C.-H.; Wu, S.-H. Sting activator c-di-gmp-loaded mesoporous silica nanoparticles enhance immunotherapy against breast cancer. ACS Appl. Mater. Interfaces 2020, 12, 56741–56752. [Google Scholar] [CrossRef]
  8. Mutalik, C.; Wang, D.Y.; Krisnawati, D.I.; Jazidie, A.; Yougbare, S.; Kuo, T.R. Light-activated heterostructured nanomaterials for antibacterial applications. Nanomaterials 2020, 10, 643. [Google Scholar] [CrossRef] [Green Version]
  9. Yougbare, S.; Mutalik, C.; Krisnawati, D.I.; Kristanto, H.; Jazidie, A.; Nuh, M.; Cheng, T.M.; Kuo, T.R. Nanomaterials for the photothermal killing of bacteria. Nanomaterials 2020, 10, 1123. [Google Scholar] [CrossRef]
  10. Liu, C.H.; Wong, S.H.; Tai, C.J.; Tai, C.J.; Pan, Y.C.; Hsu, H.Y.; Richardson, C.D.; Lin, L.T. Ursolic acid and its nanoparticles are potentiators of oncolytic measles virotherapy against breast cancer cells. Cancers 2021, 13, 136. [Google Scholar] [CrossRef]
  11. Huang, T.W.; Ho, Y.C.; Tsai, T.N.; Tseng, C.L.; Lin, C.; Mi, F.L. Enhancement of the permeability and activities of epigallocatechin gallate by quaternary ammonium chitosan/fucoidan nanoparticles. Carbohydr. Polym. 2020, 242, 116312. [Google Scholar] [CrossRef]
  12. Yougbaré, S.; Chou, H.-L.; Yang, C.-H.; Krisnawati, D.I.; Jazidie, A.; Nuh, M.; Kuo, T.-R. Facet-dependent gold nanocrystals for effective photothermal killing of bacteria. J. Hazard. Mater. 2021, 407, 124617. [Google Scholar] [CrossRef]
  13. Weng, B.; Lu, K.-Q.; Tang, Z.; Chen, H.M.; Xu, Y.-J. Stabilizing ultrasmall Au clusters for enhanced photoredox catalysis. Nat. Commun. 2018, 9, 1543. [Google Scholar] [CrossRef] [Green Version]
  14. Li, C.-H.; Kuo, T.-R.; Su, H.-J.; Lai, W.-Y.; Yang, P.-C.; Chen, J.-S.; Wang, D.-Y.; Wu, Y.-C.; Chen, C.-C. Fluorescence-guided probes of aptamer-targeted gold nanoparticles with computed tomography imaging accesses for in vivo tumor resection. Sci. Rep. 2015, 5, 15675. [Google Scholar] [CrossRef]
  15. Fahmi, M.Z.; Ou, K.L.; Chen, J.K.; Ho, M.H.; Tzing, S.H.; Chang, J.Y. Development of bovine serum albumin-modified hybrid nanoclusters for magnetofluorescence imaging and drug delivery. RSC Adv. 2014, 4, 32762–32772. [Google Scholar] [CrossRef]
  16. Jin, R.C.; Zeng, C.J.; Zhou, M.; Chen, Y.X. Atomically precise colloidal metal nanoclusters and nanoparticles: Fundamentals and opportunities. Chem. Rev. 2016, 116, 10346–10413. [Google Scholar] [CrossRef] [PubMed]
  17. Liu, L.C.; Corma, A. Metal catalysts for heterogeneous catalysis: From single atoms to nanoclusters and nanoparticles. Chem. Rev. 2018, 118, 4981–5079. [Google Scholar] [CrossRef] [PubMed] [Green Version]
  18. Yang, B.B.; Xu, J.Y.; Bin, D.; Wang, J.; Zhao, J.Z.; Liu, Y.X.; Li, B.X.; Fang, X.N.; Liu, Y.; Qiao, L.; et al. Amorphous phosphatized ruthenium-iron bimetallic nanoclusters with Pt-like activity for hydrogen evolution reaction. Appl. Catal. B Environ. 2021, 283, 119583. [Google Scholar] [CrossRef]
  19. Wang, J.J.; Hu, Y.J.; Yu, X.X.; Zhuang, X.M.; Wang, Q.; Jiang, N.J.; Hu, J.Y. Recyclable and ultrasensitive sers sensing platform: Deposition of atomically precise Ag-152 nanoclusters on surface of plasmonic 3d ZnO-nc/aunp arrays. Appl. Surf. Sci. 2021, 540, 148324. [Google Scholar] [CrossRef]
  20. Guo, M.L.; Chi, J.T.; Zhang, C.; Wang, M.L.; Liang, H.; Hou, J.Y.; Ai, S.Y.; Li, X.Y. A simple and sensitive sensor for lactose based on cascade reactions in Au nanoclusters and enzymes co-encapsulated metal-organic frameworks. Food Chem. 2021, 339, 127863. [Google Scholar] [CrossRef]
  21. Cheng, T.M.; Chu, H.L.; Lee, Y.C.; Wang, D.Y.; Chang, C.C.; Chung, K.L.; Yen, H.C.; Hsiao, C.W.; Pan, X.Y.; Kuo, T.R.; et al. Quantitative analysis of glucose metabolic cleavage in glucose transporters overexpressed cancer cells by target-specific fluorescent gold nanoclusters. Anal. Chem. 2018, 90, 3974–3980. [Google Scholar] [CrossRef]
  22. Tan, S.-H.; Yougbaré, S.; Chu, H.-L.; Kuo, T.-R.; Cheng, T.-M. Hemoglobin-conjugated gold nanoclusters for qualitative analysis of haptoglobin phenotypes. Polymers 2020, 12, 2242. [Google Scholar] [CrossRef] [PubMed]
  23. Sheini, A. A point-of-care testing sensor based on fluorescent nanoclusters for rapid detection of septicemia in children. Sens. Actuators B Chem. 2021, 328, 129029. [Google Scholar] [CrossRef]
  24. Li, L.; Guo, X.P.; Peng, X.L.; Zhang, H.S.; Liu, Y.M.; Li, H.; He, X.J.; Shi, D.W.; Xiong, B.; Zhao, Y.B.; et al. Radiofrequency-responsive dual-valent gold nanoclusters for enhancing synergistic therapy of tumor ablation and artery embolization. Nano Today 2020, 35, 12. [Google Scholar] [CrossRef]
  25. Li, C.; Yang, W.T.; Yuan, R.; Xu, W.J. Antibody-responsive signal-off fluorescence of DNA-harbored silver nanoclusters for direct, rapid and sensitive immunoassay. Sens. Actuators B Chem. 2019, 301, 127148. [Google Scholar] [CrossRef]
  26. Kaur, N.; Aditya, R.N.; Singh, A.; Kuo, T.-R. Biomedical applications for gold nanoclusters: Recent developments and future perspectives. Nanoscale Res. Lett. 2018, 13, 1–12. [Google Scholar] [CrossRef] [Green Version]
  27. Sangubotla, R.; Lakshmi, B.A.; Kim, S.; Kim, J. Bio-inspired green fluorescent gold-naringin nanoclusters as a dual-functional optical probe for bio-imaging and intracellular sensing applications. Appl. Surf. Sci. 2020, 510, 145417. [Google Scholar] [CrossRef]
  28. Niu, Q.Q.; Gao, P.F.; Yuan, M.J.; Zhang, G.M.; Zhou, Y.; Dong, C.; Shuang, S.M.; Zhang, Y. Development of sensing method for mercury ions and cell imaging based on highly fluorescent gold nanoclusters. Microchem. J. 2019, 146, 1140–1149. [Google Scholar] [CrossRef]
  29. Raju, S.; Joseph, M.M.; Kuttanpillai, R.P.; Padinjarathil, H.; Usha, P.G.N.; Nair, S.T.T. Polysaccharide enabled biogenic fabrication of ph sensing fluorescent gold nanoclusters as a biocompatible tumor imaging probe. Microchim. Acta 2020, 187, 246. [Google Scholar] [CrossRef]
  30. Mutas, M.; Strelow, C.; Kipp, T.; Mews, A. Specific binding and internalization: An investigation of fluorescent aptamer-gold nanoclusters and cells with fluorescence lifetime imaging microscopy. Nanoscale 2018, 10, 20453–20461. [Google Scholar] [CrossRef] [PubMed] [Green Version]
  31. Yougbare, S.; Chang, T.-K.; Tan, S.-H.; Kuo, J.-C.; Hsu, P.-H.; Su, C.-Y.; Kuo, T.-R. Antimicrobial gold nanoclusters: Recent developments and future perspectives. Int. J. Mol. Sci. 2019, 20, 2924. [Google Scholar] [CrossRef] [Green Version]
  32. Chang, T.-K.; Cheng, T.-M.; Chu, H.-L.; Tan, S.-H.; Kuo, J.-C.; Hsu, P.-H.; Su, C.-Y.; Chen, H.-M.; Lee, C.-M.; Kuo, T.-R. Metabolic mechanism investigation of antibacterial active cysteine-conjugated gold nanoclusters in escherichia coli. ACS Sustain. Chem. Eng. 2019, 7, 15479–15486. [Google Scholar] [CrossRef]
  33. Hui, S.H.; Liu, Q.Q.; Huang, Z.Z.; Yang, J.; Liu, Y.M.; Jiang, S. Gold nanoclusters-decorated zeolitic imidazolate frameworks with reactive oxygen species generation for photoenhanced antibacterial study. Bioconjugate Chem. 2020, 31, 2439–2445. [Google Scholar] [CrossRef] [PubMed]
  34. Nakal-Chidiac, A.; Garcia, O.; Garcia-Fernandez, L.; Martin-Saavedra, F.M.; Sanchez-Casanova, S.; Escudero-Duch, C.; San Roman, J.; Vilaboa, N.; Aguilar, M.R. Chitosan-stabilized silver nanoclusters with luminescent, photothermal and antibacterial properties. Carbohydr. Polym. 2020, 250, 116973. [Google Scholar] [CrossRef] [PubMed]
  35. Chen, Y.J.; Ren, L.T.; Sun, L.X.; Bai, X.; Zhuang, G.Q.; Cao, B.; Hu, G.Q.; Zheng, N.F.; Liu, S.J. Amphiphilic silver nanoclusters show active nano-bio interaction with compelling antibacterial activity against multidrug-resistant bacteria. NPG Asia Mater. 2020, 12, 56. [Google Scholar] [CrossRef]
  36. Zheng, K.; Setyawati, M.I.; Leong, D.T.; Xie, J. Antimicrobial gold nanoclusters. ACS Nano 2017, 11, 6904–6910. [Google Scholar] [CrossRef] [PubMed]
  37. Xie, Y.; Liu, Y.; Yang, J.; Liu, Y.; Hu, F.; Zhu, K.; Jiang, X. Gold nanoclusters for targeting methicillin-resistant staphylococcus aureus in vivo. Angew. Chem. Int. Ed. 2018, 57, 3958–3962. [Google Scholar] [CrossRef]
  38. Eun, H.; Kwon, W.Y.; Kalimuthu, K.; Kim, Y.; Lee, M.; Ahn, J.O.; Lee, H.; Lee, S.H.; Kim, H.J.; Park, H.G.; et al. Melamine-promoted formation of bright and stable DNA-silver nanoclusters and their antimicrobial properties. J. Mater. Chem. B 2019, 7, 2512–2517. [Google Scholar] [CrossRef]
  39. Tang, Q.; Hu, G.; Fung, V.; Jiang, D.-e. Insights into interfaces, stability, electronic properties, and catalytic activities of atomically precise metal nanoclusters from first principles. Acc. Chem. Res. 2018, 51, 2793–2802. [Google Scholar] [CrossRef] [PubMed]
  40. Muhammed, M.A.H.; Verma, P.K.; Pal, S.K.; Kumar, R.A.; Paul, S.; Omkumar, R.V.; Pradeep, T. Bright, NIR-Emitting Au23 from Au25: Characterization and applications including biolabeling. Chem. Eur. J. 2009, 15, 10110–10120. [Google Scholar] [CrossRef]
  41. Luo, Z.; Yuan, X.; Yu, Y.; Zhang, Q.; Leong, D.T.; Lee, J.Y.; Xie, J. From aggregation-induced emission of Au (i)–thiolate complexes to ultrabright Au (0)@ Au (i)–thiolate core–shell nanoclusters. J. Am. Chem. Soc. 2012, 134, 16662–16670. [Google Scholar] [CrossRef] [PubMed]
  42. Zheng, J.; Zhou, C.; Yu, M.; Liu, J. Different sized luminescent gold nanoparticles. Nanoscale 2012, 4, 4073–4083. [Google Scholar] [CrossRef] [PubMed]
  43. Hsu, P.-H.; Yougbaré, S.; Kuo, J.-C.; Krisnawati, D.I.; Jazidie, A.; Nuh, M.; Chou, P.-T.; Hsiao, Y.-C.; Kuo, T.-R. One-pot synthesis of thiol-modified liquid crystals conjugated fluorescent gold nanoclusters. Nanomaterials 2020, 10, 1755. [Google Scholar] [CrossRef] [PubMed]
  44. Ma, X.; Guo, Q.; Xie, Y.; Ma, H. Green chemistry for the preparation of l-cysteine functionalized silver nanoflowers. Chem. Phys. Lett. 2016, 652, 148–151. [Google Scholar] [CrossRef]
  45. Nieto-Ortega, B.; Bürgi, T. Vibrational properties of thiolate-protected gold nanoclusters. Acc. Chem. Res. 2018, 51, 2811–2819. [Google Scholar] [CrossRef]
  46. Xie, J.; Zheng, Y.; Ying, J.Y. Protein-directed synthesis of highly fluorescent gold nanoclusters. J. Am. Chem. Soc. 2009, 131, 888–889. [Google Scholar] [CrossRef]
  47. Zheng, K.; Setyawati, M.I.; Leong, D.T.; Xie, J. Surface ligand chemistry of gold nanoclusters determines their antimicrobial ability. Chem. Mater. 2018, 30, 2800–2808. [Google Scholar] [CrossRef]
  48. Wang, S.; Wang, Y.; Peng, Y.; Yang, X. Exploring the antibacteria performance of multicolor Ag, Au, and Cu nanoclusters. ACS Appl. Mater. Interfaces 2019, 11, 8461–8469. [Google Scholar] [CrossRef]
  49. Sakimoto, K.K.; Wong, A.B.; Yang, P. Self-photosensitization of nonphotosynthetic bacteria for solar-to-chemical production. Science 2016, 351, 74–77. [Google Scholar] [CrossRef] [Green Version]
  50. Zhang, H.; Liu, H.; Tian, Z.; Lu, D.; Yu, Y.; Cestellos-Blanco, S.; Sakimoto, K.K.; Yang, P. Bacteria photosensitized by intracellular gold nanoclusters for solar fuel production. Nat. Nanotech. 2018, 13, 900–905. [Google Scholar] [CrossRef]
  51. Jackson, S.K.; Thomas, M.P.; Smith, S.; Madhani, M.; Rogers, S.C.; James, P.E. In vivo epr spectroscopy: Biomedical and potential diagnostic applications. Faraday Discuss. 2004, 126, 103–117. [Google Scholar] [CrossRef] [PubMed]
Figure 1. TEM images of the (a) Cys–AuNCs and (b) Cys–AgNCs. Histograms of the nanocluster size distributions and Gaussian fitting curves of the (c) Cys–AuNCs and (d) Cys–AgNCs.
Applsci 11 04095 g001
Figure 2. (a) UV–Vis absorption spectra of the Cys–AuNCs (black) and Cys–AgNCs (red). (b) Fluorescence spectra of the Cys–AuNCs (black) and Cys–AgNCs (red). The insets illustrate the orange-red fluorescence of the Cys–AuNCs (left) and blue fluorescence of the Cys–AgNCs (right) under irradiation from a hand-held UV lamp.
Applsci 11 04095 g002
Figure 3. FTIR spectra of the cysteine (black), Cys–AuNCs (red), and Cys–AgNCs (blue).
Applsci 11 04095 g003
Figure 4. Growth curves of the E. coli incubated with (a) Cys–AuNCs, (b) Cys–AgNCs, and (c) AgNPs. OD600 indicates the optical density of a sample measured at a wavelength of 600 nm. All data are presented as means ± SD, n = 3 per group.
Applsci 11 04095 g004
Figure 5. (a) Photographs of the growth of the E. coli that were incubated with sterilized water (control) and the Cys–AuNCs, Cys–AgNCs, and AgNPs on LB agar plates. (b) The viabilities of the E. coli that were separately incubated with sterilized water (control) and the Cys–AuNCs, Cys–AgNCs, and AgNPs. In the control experiment, the viability of the E. coli incubated with sterilized water was set to 100%. All data are presented as means ± SD, n = 3 per group.
Applsci 11 04095 g005
Figure 6. EPR spectra of the (a) E. coli solution, (b) Cys–AuNCs, and (c) Cys–AuNCs.
Applsci 11 04095 g006
Figure 7. Confocal microscopic images of the E. coli. The blue and red pseudocolors represent the fluorescent signals of Hoechst 33342 and the Cys–AuNCs, respectively. In the control experiment, only sterilized water was added to the E. coli. The scale bars represent 2.5 μm.
Applsci 11 04095 g007
Publisher’s Note: MDPI stays neutral with regard to jurisdictional claims in published maps and institutional affiliations.

