
Automatic Scaffolding Workface Assessment for Activity Analysis through Machine Learning

 ,
,
Abstract
:1. Introduction
2. Literature Review
2.1. Ergonomics Posture
2.2. Safety Management
2.3. Productivity Improvement
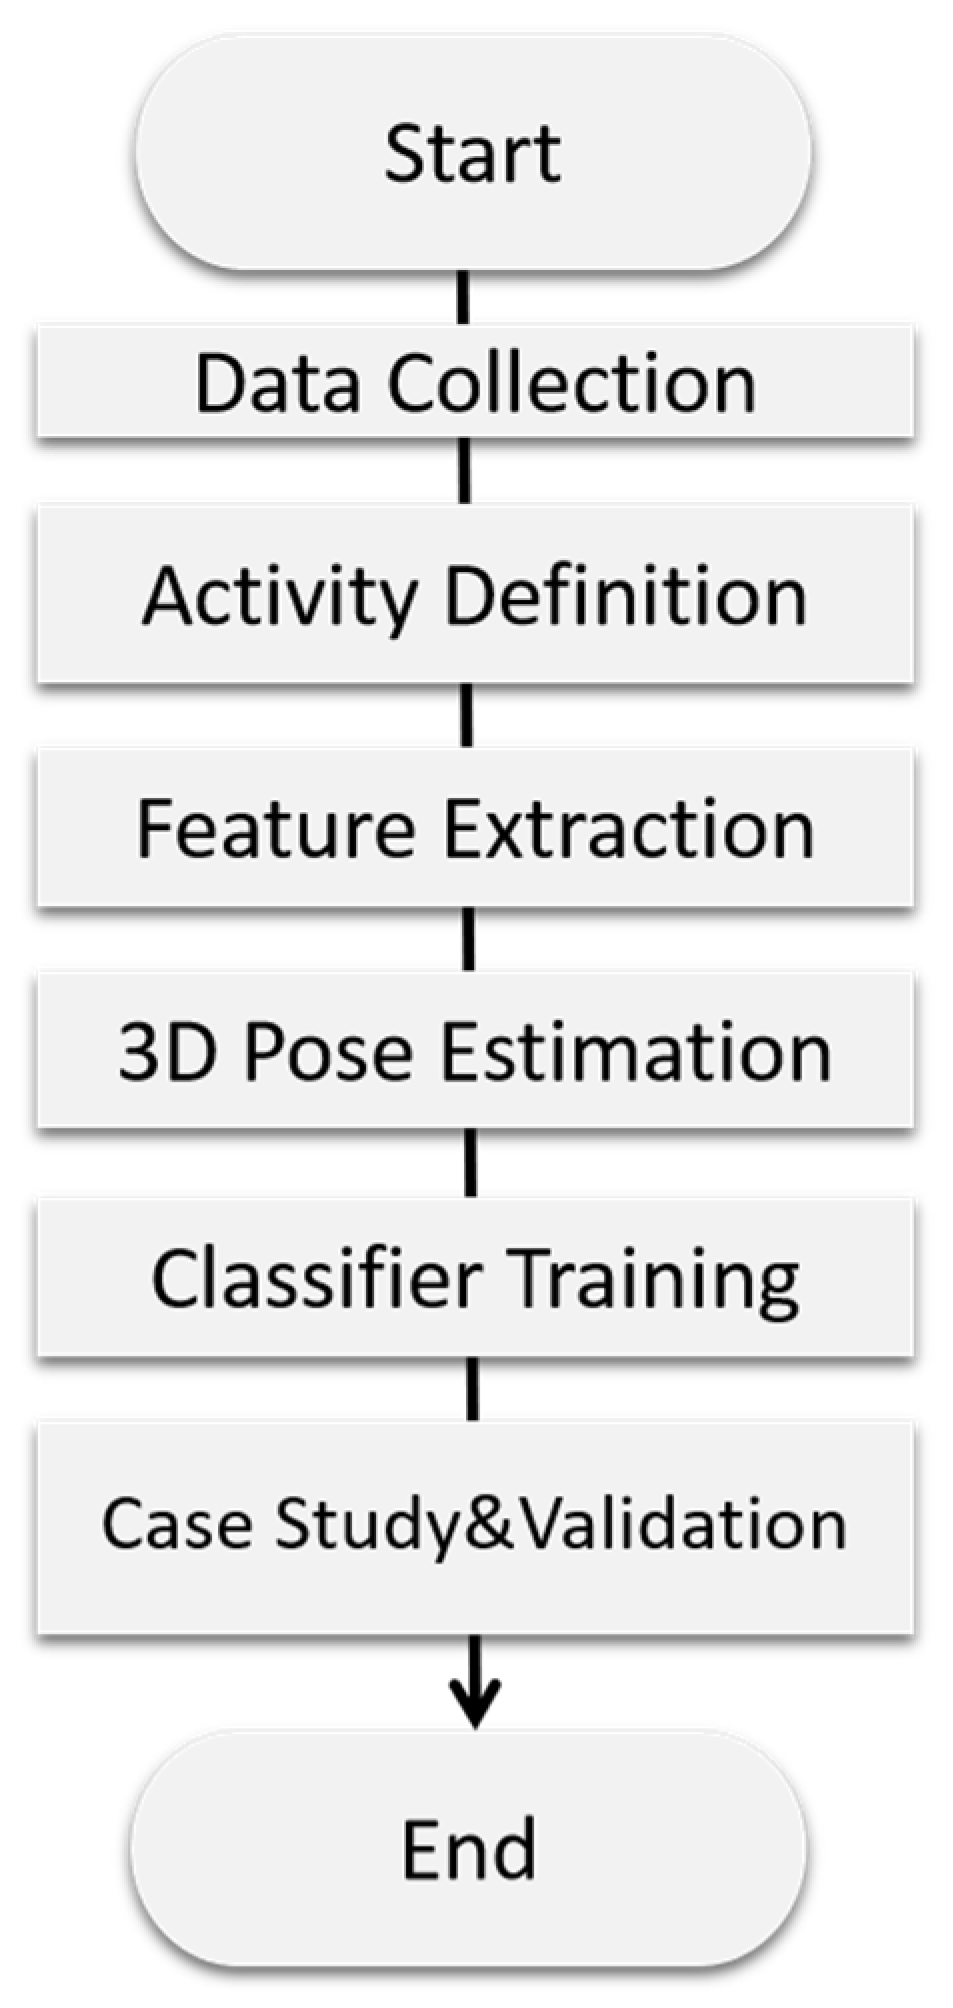
3. Research Design
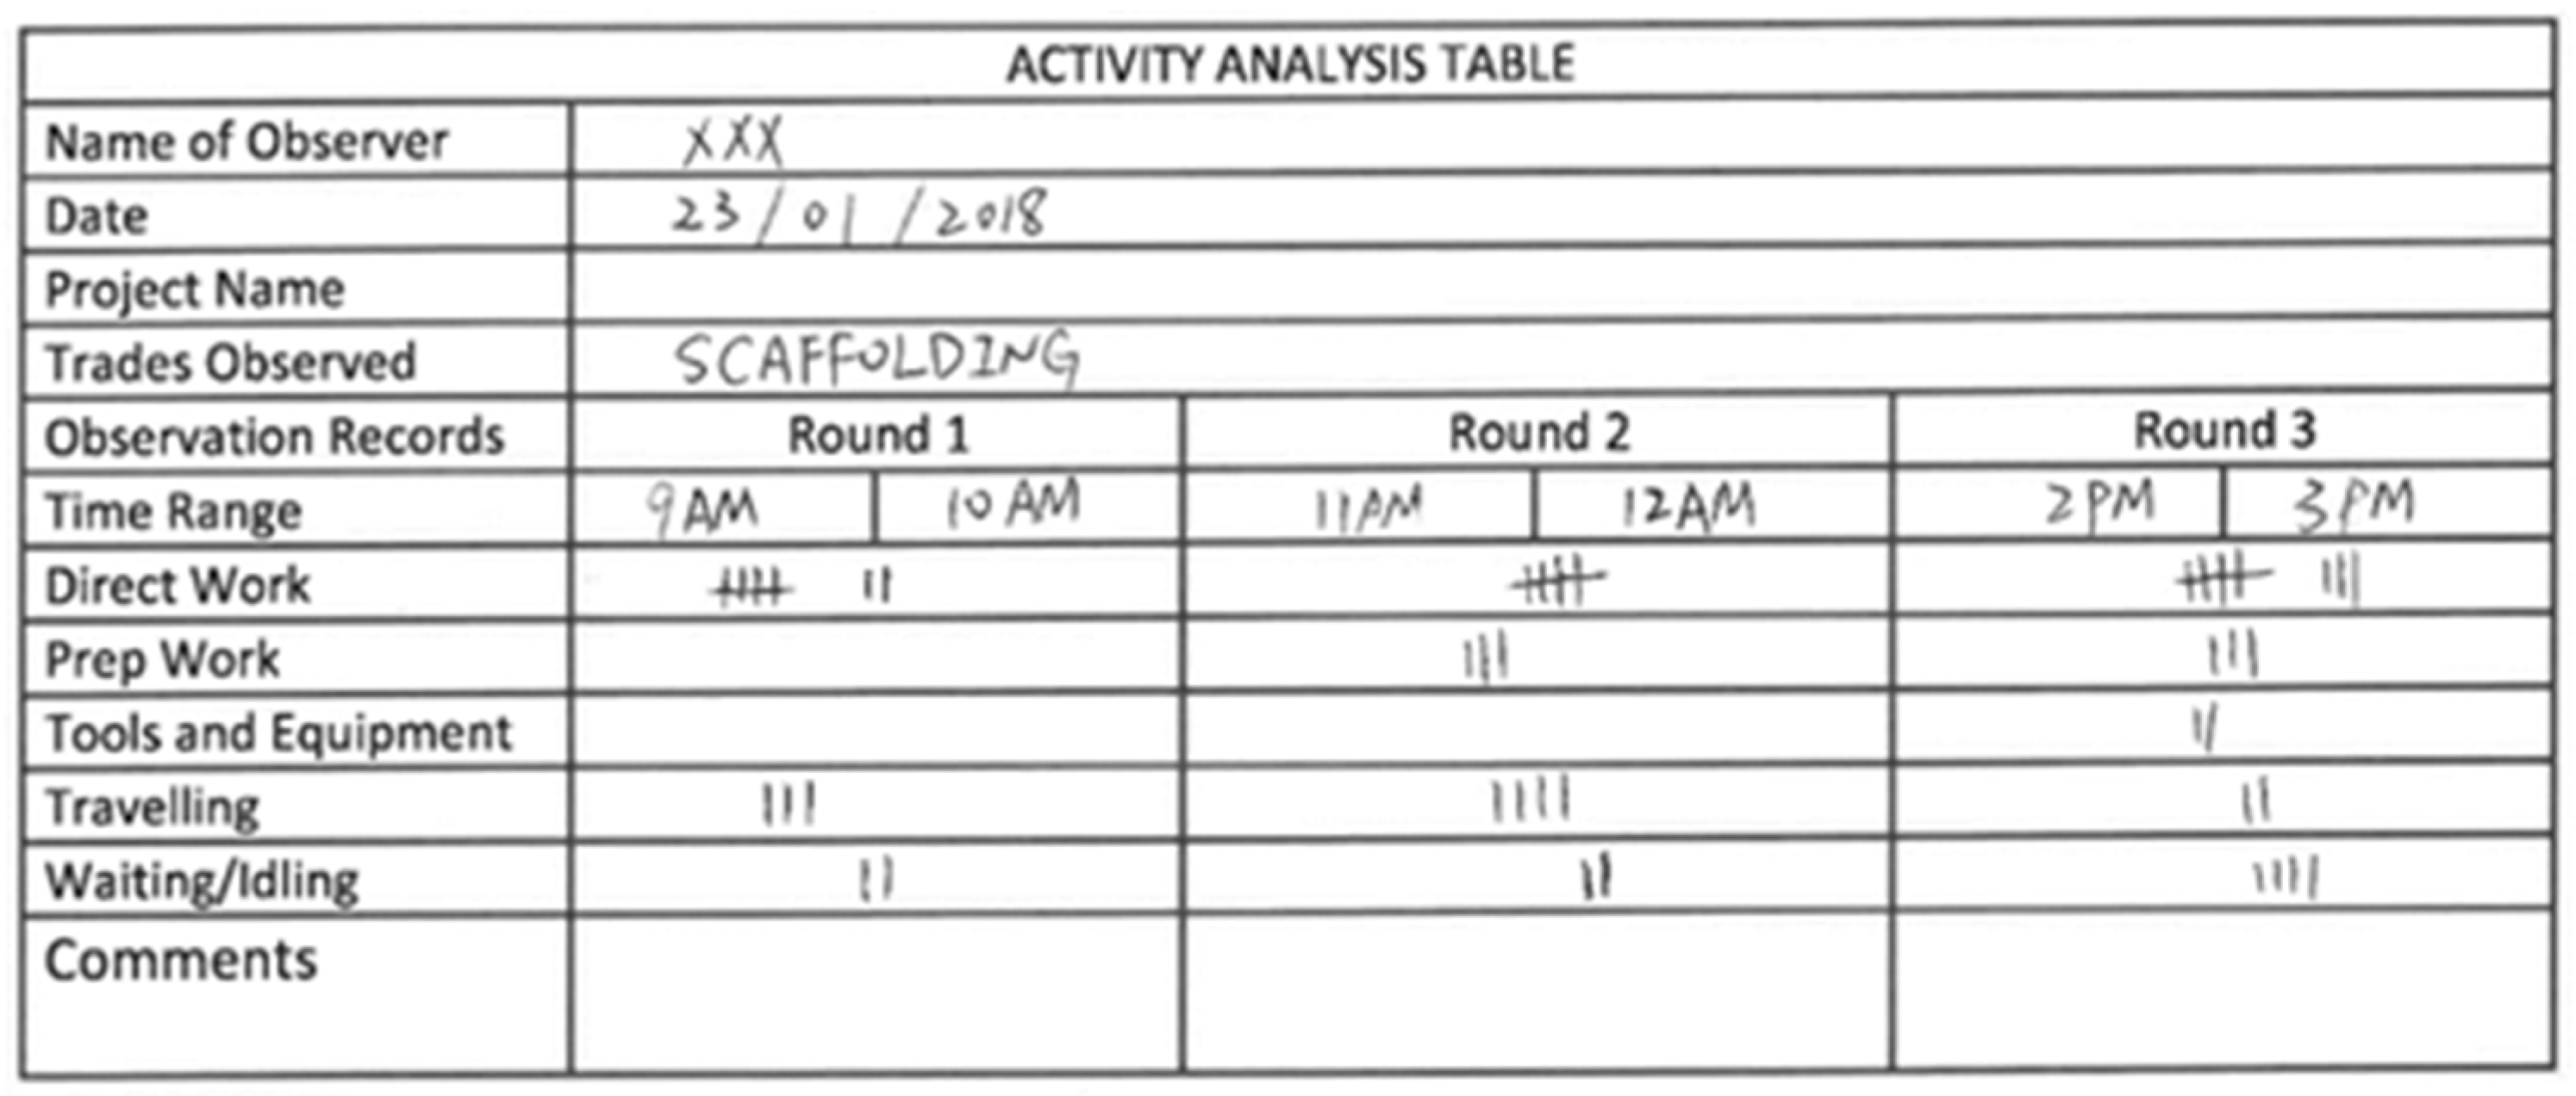
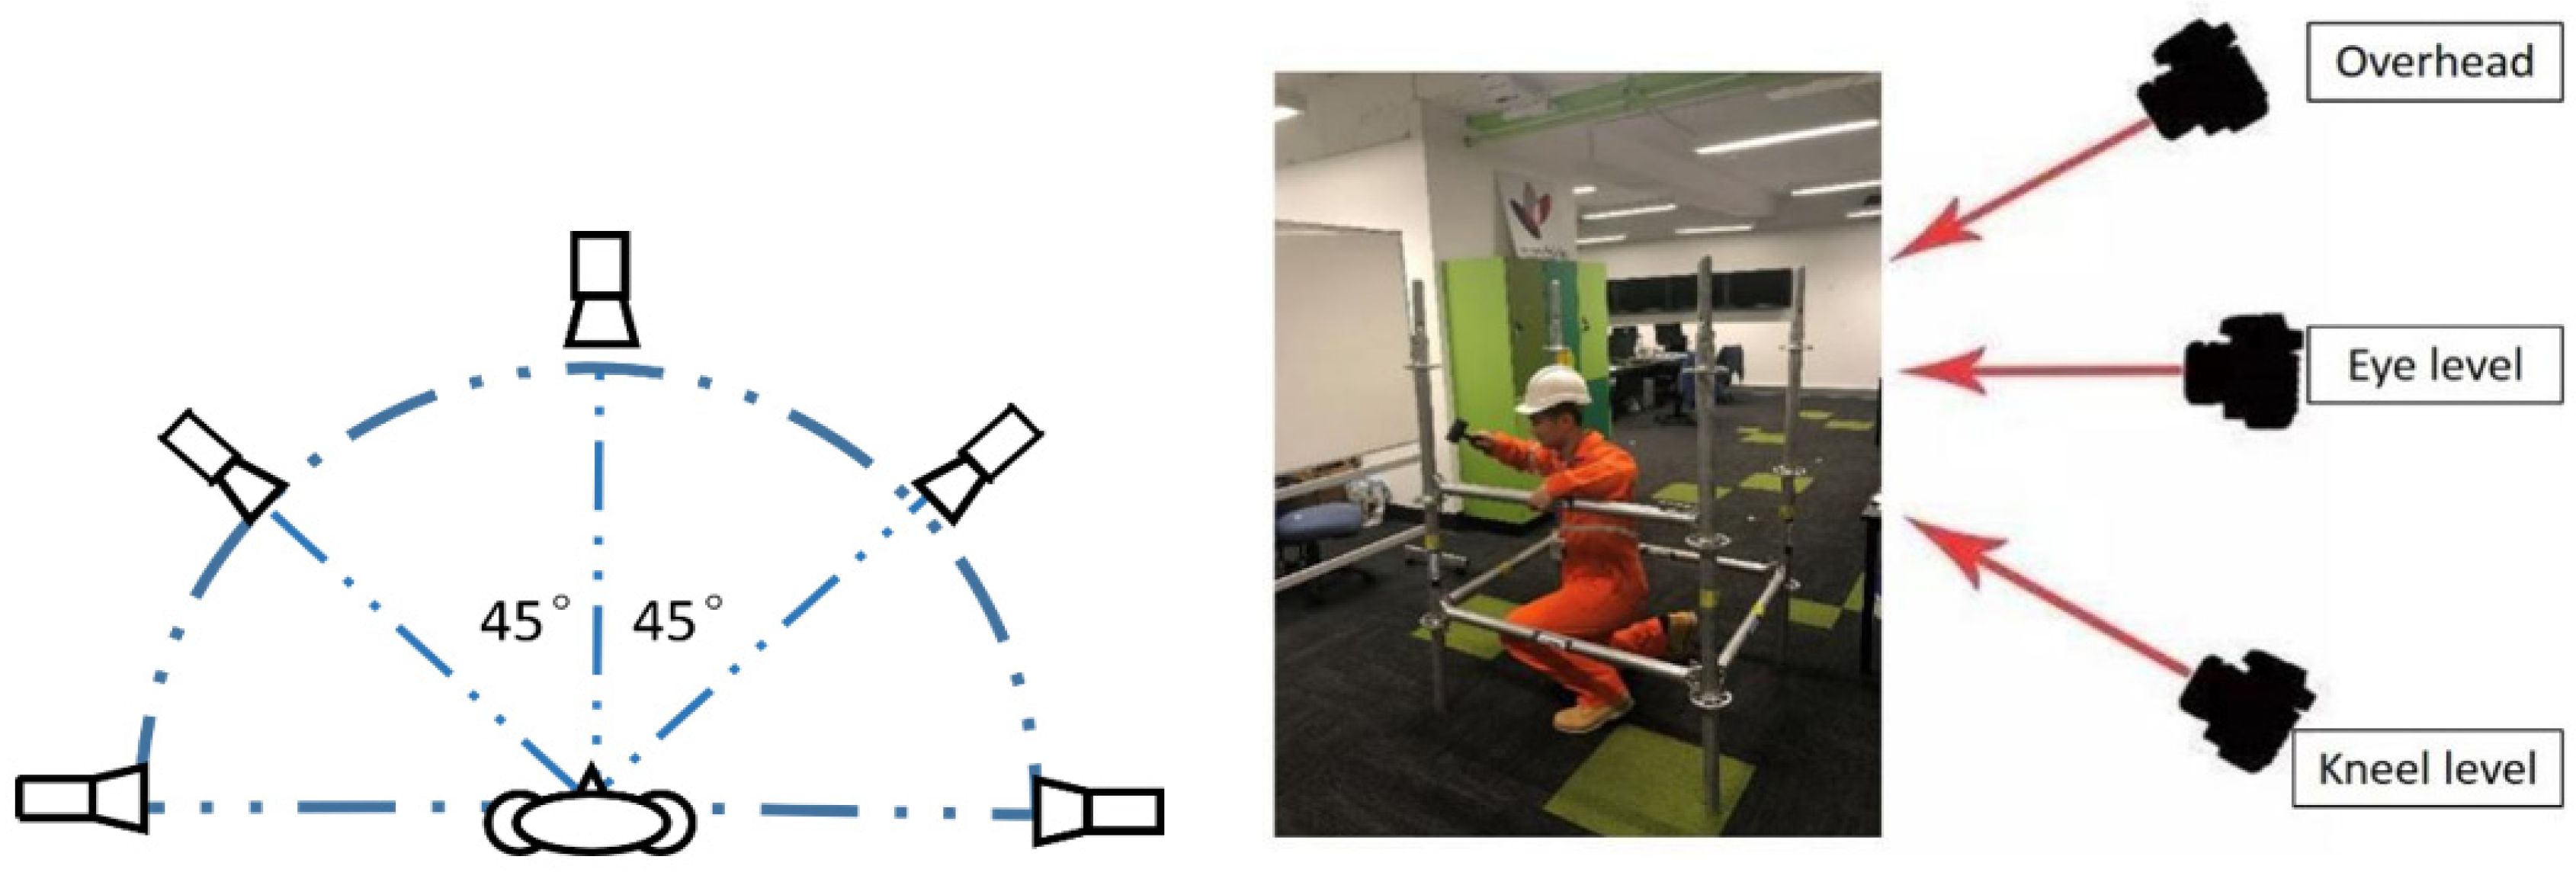
3.1. Using a 2D Ordinary Video Camera for Data Collection
Intra-Class Variation
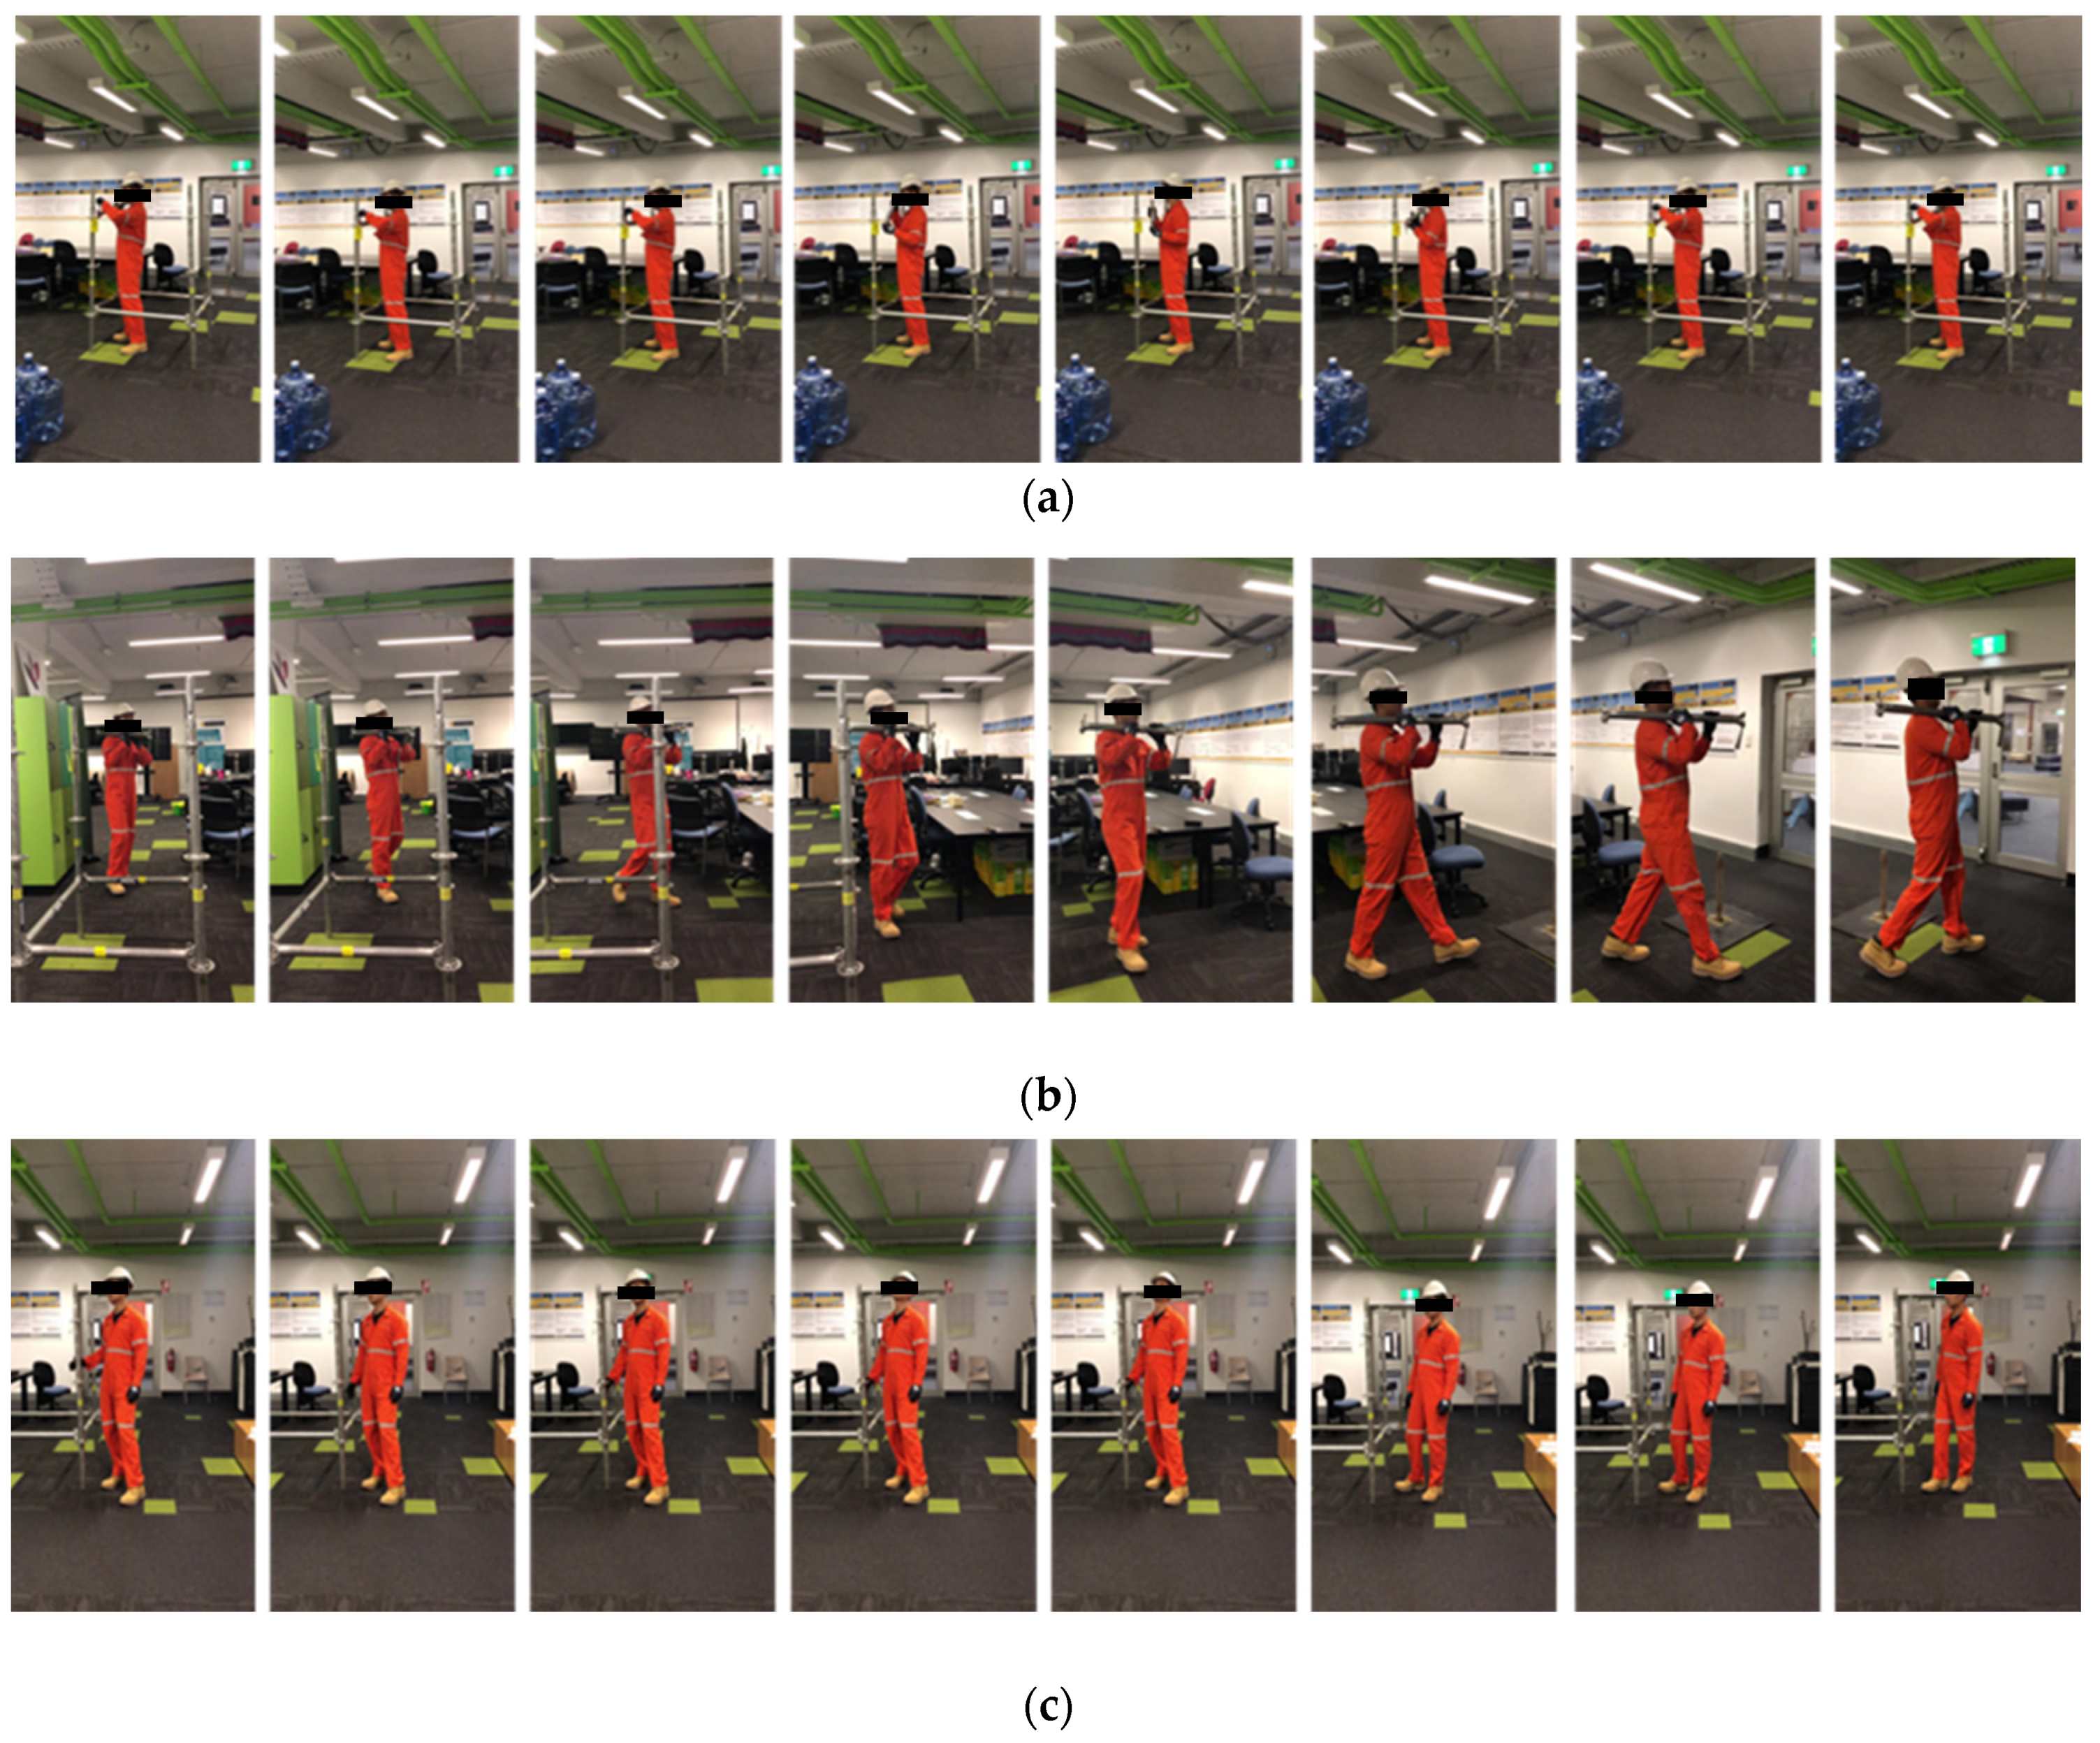
3.2. Activity Definition
- Direct work: the real process of contributing to a unit being constructed [20,79]. Additionally, from the thinking of lean construction, direct work is the process that adds value to construction work, which employers are willing to pay for [80]. For scaffolding operations, the part of scaffold erecting conforms to the feature of direct work;
- Essential contributory work: the activities not directly set up but necessary to establish the construction unit. This category involves transporting materials and tools, receiving instructions, necessary communication between coworkers and so on. One typical essential contributory work for scaffolding work is scaffold transporting;
- Ineffective work: the activities that contribute nothing to production probably due to inefficient material or labor supply and poor communication. These representative activities include idling or waiting;
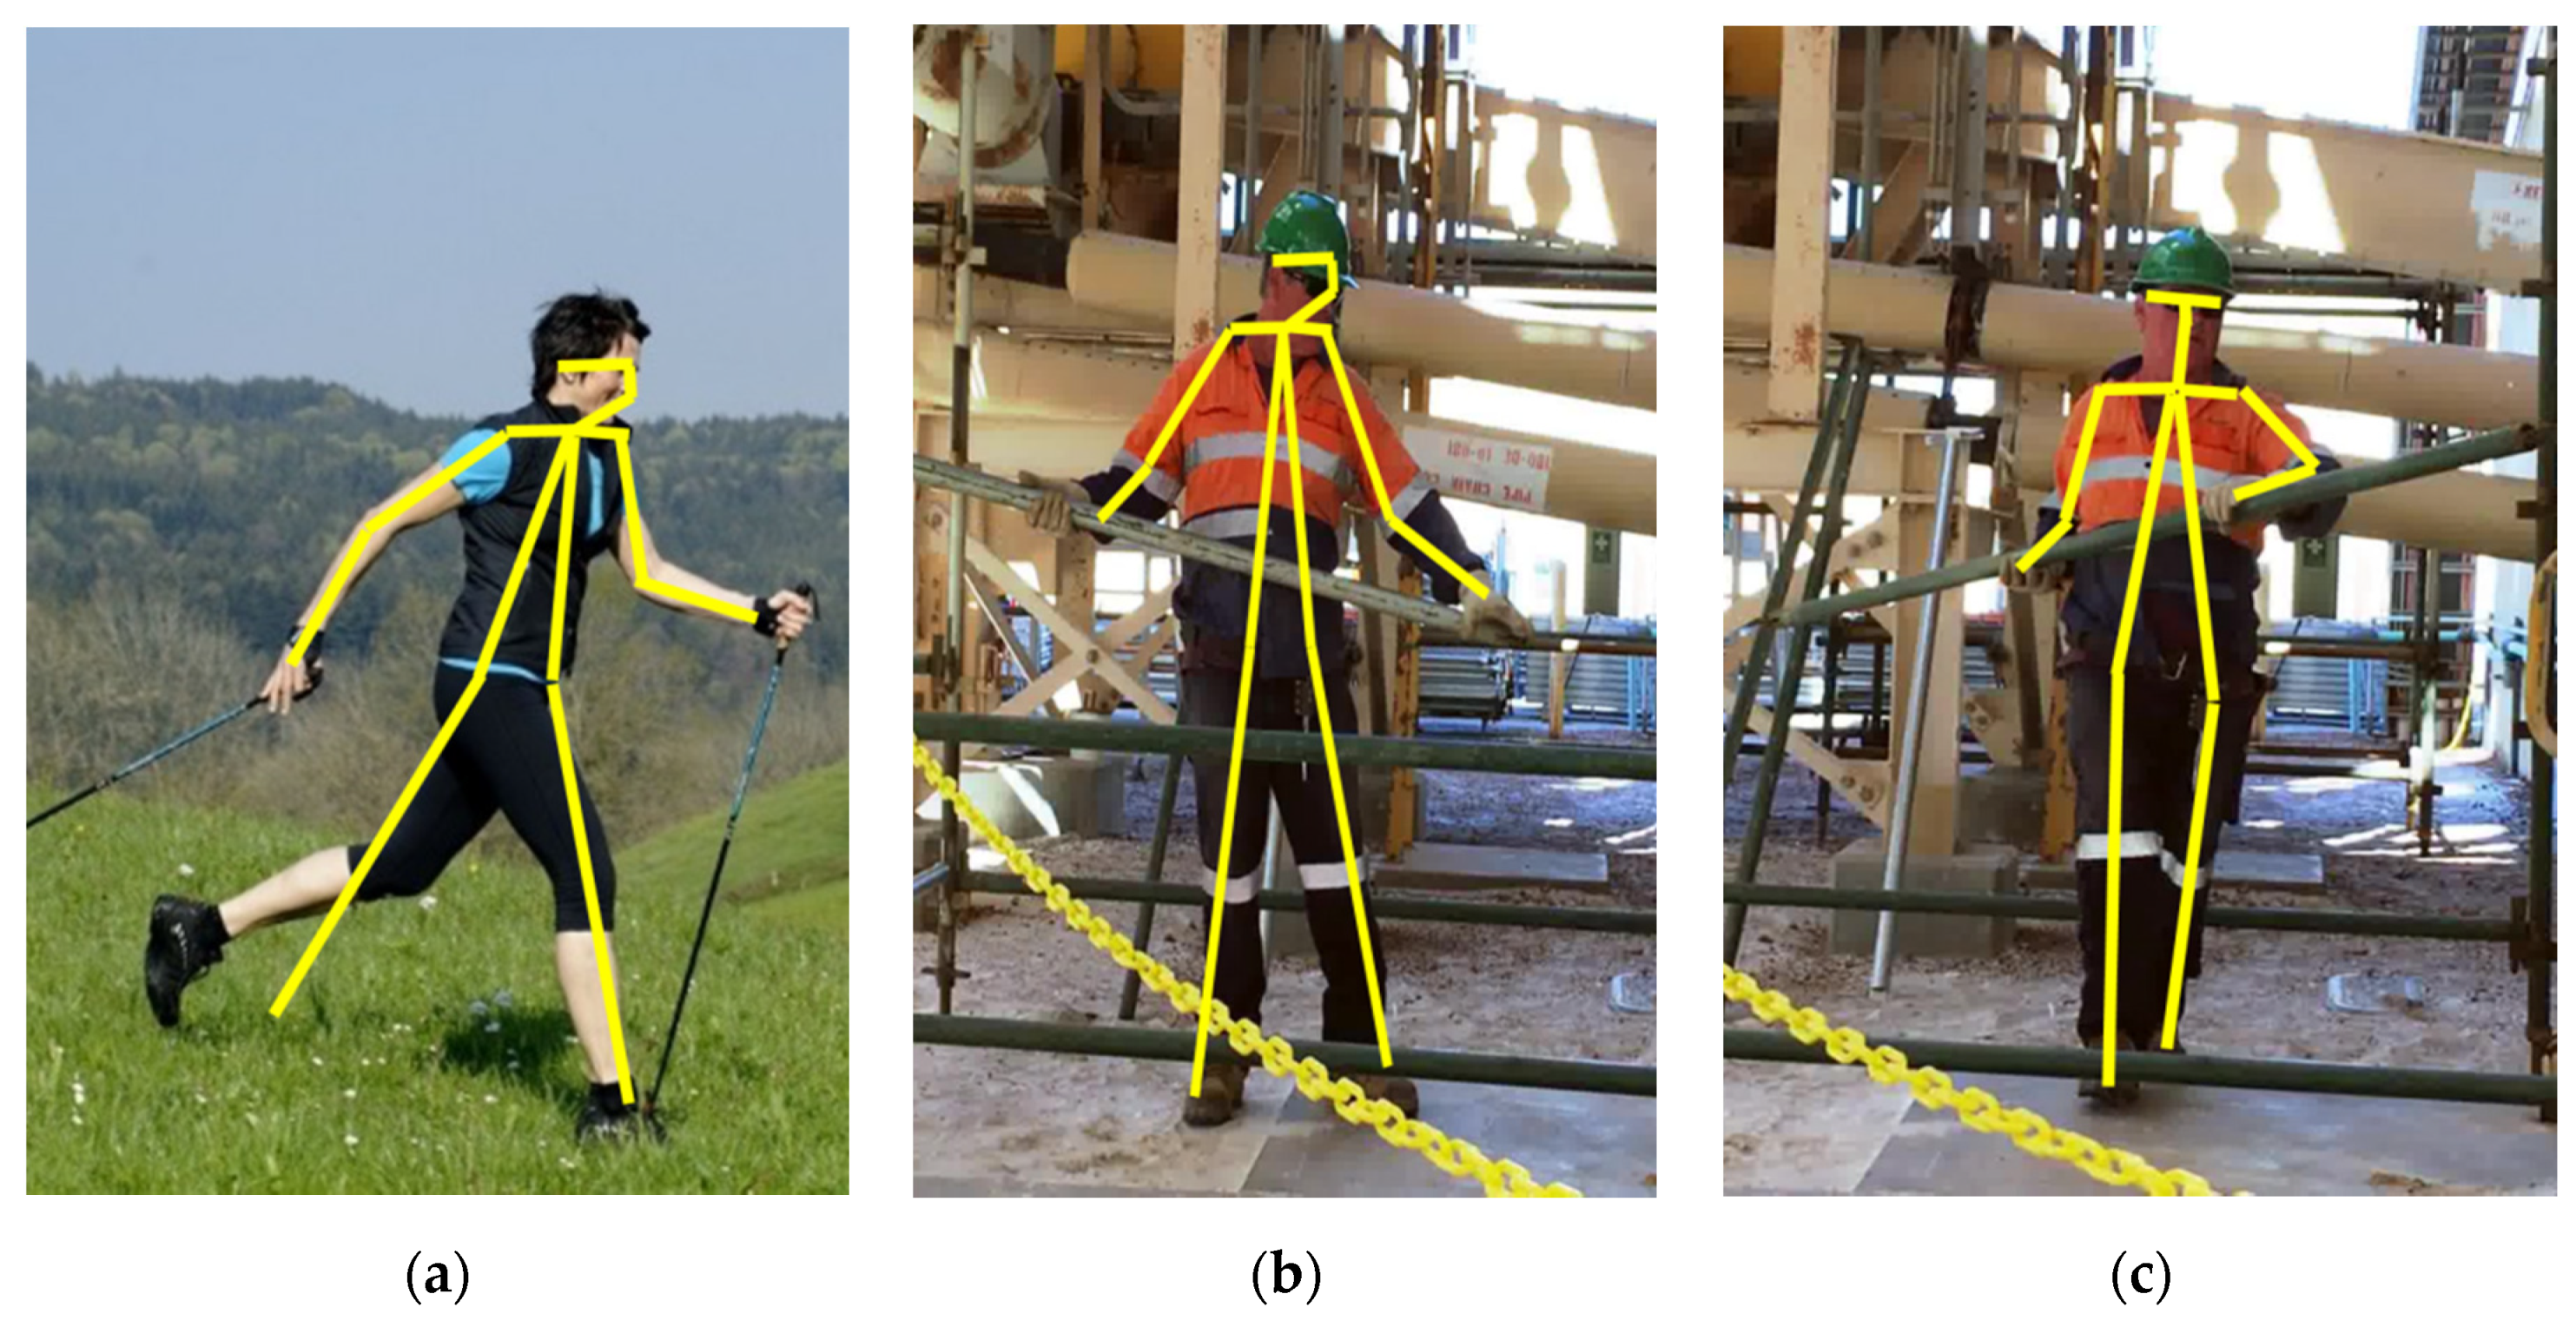
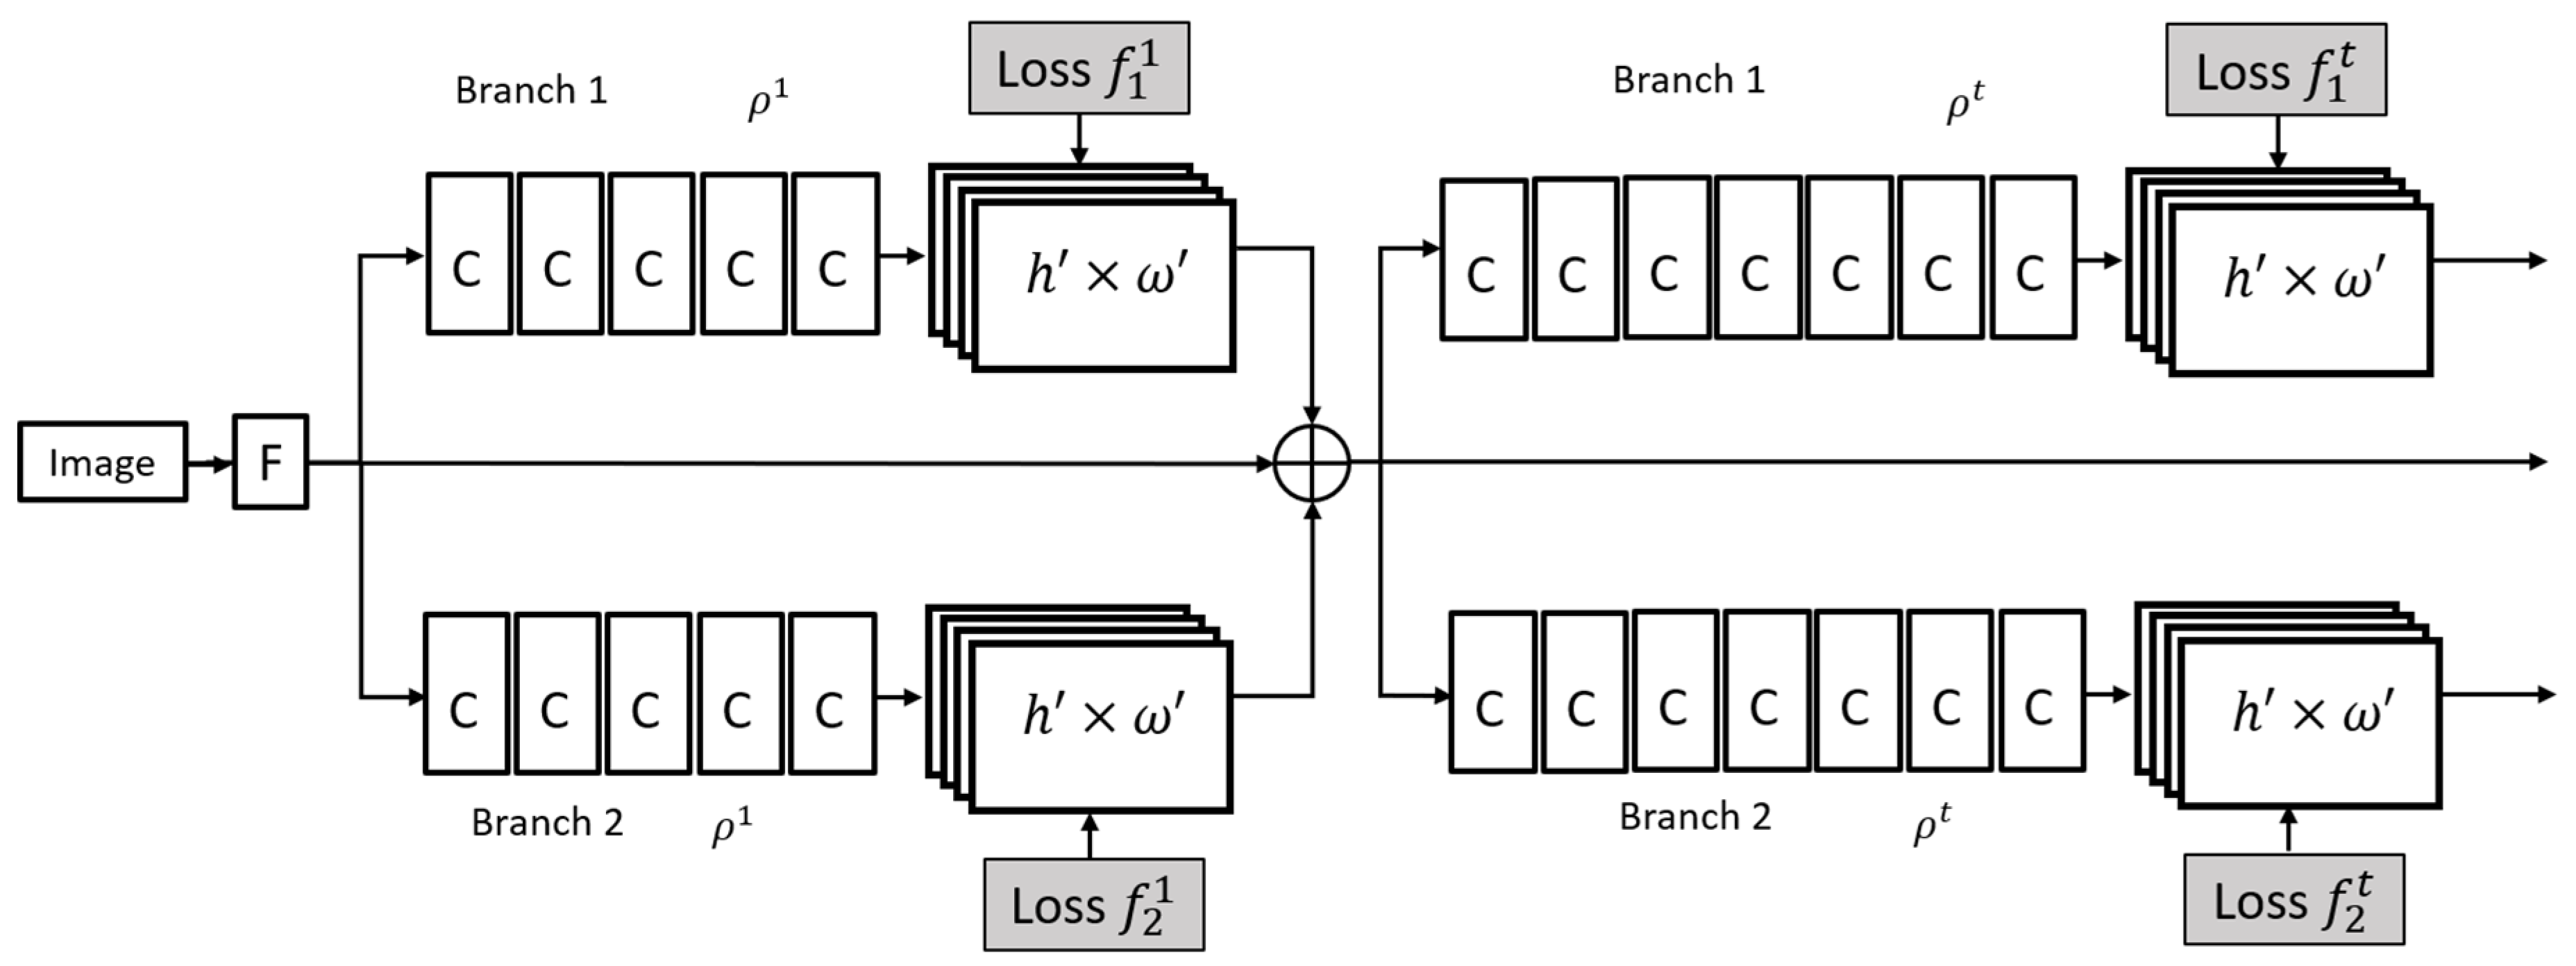
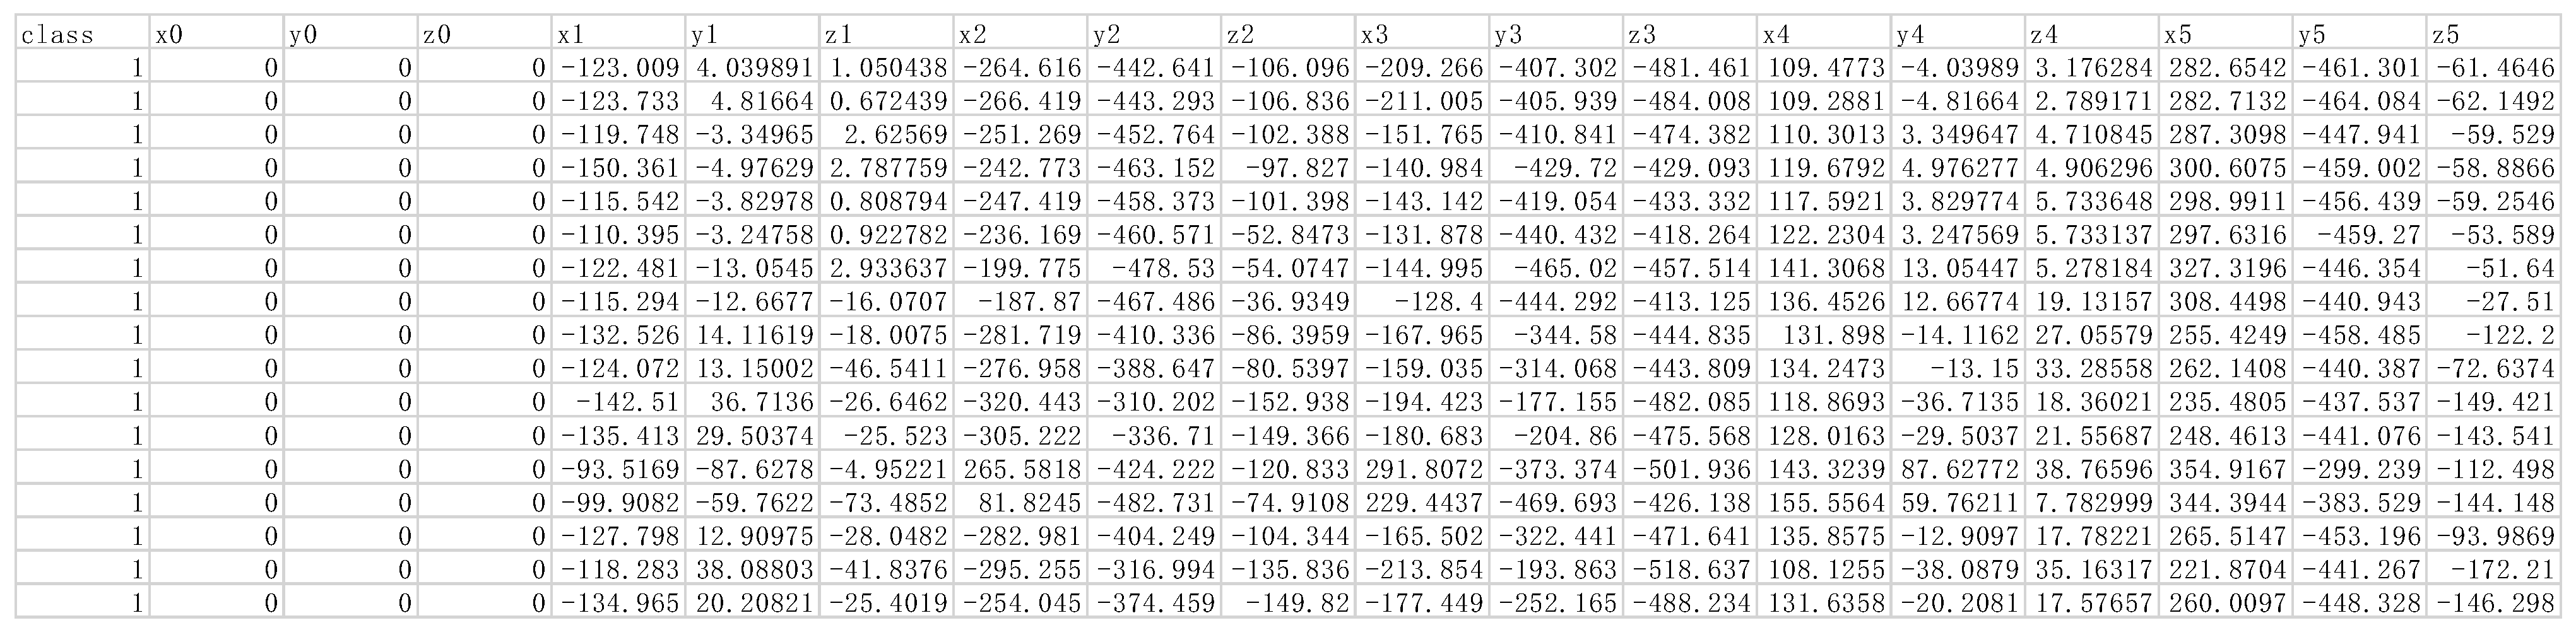
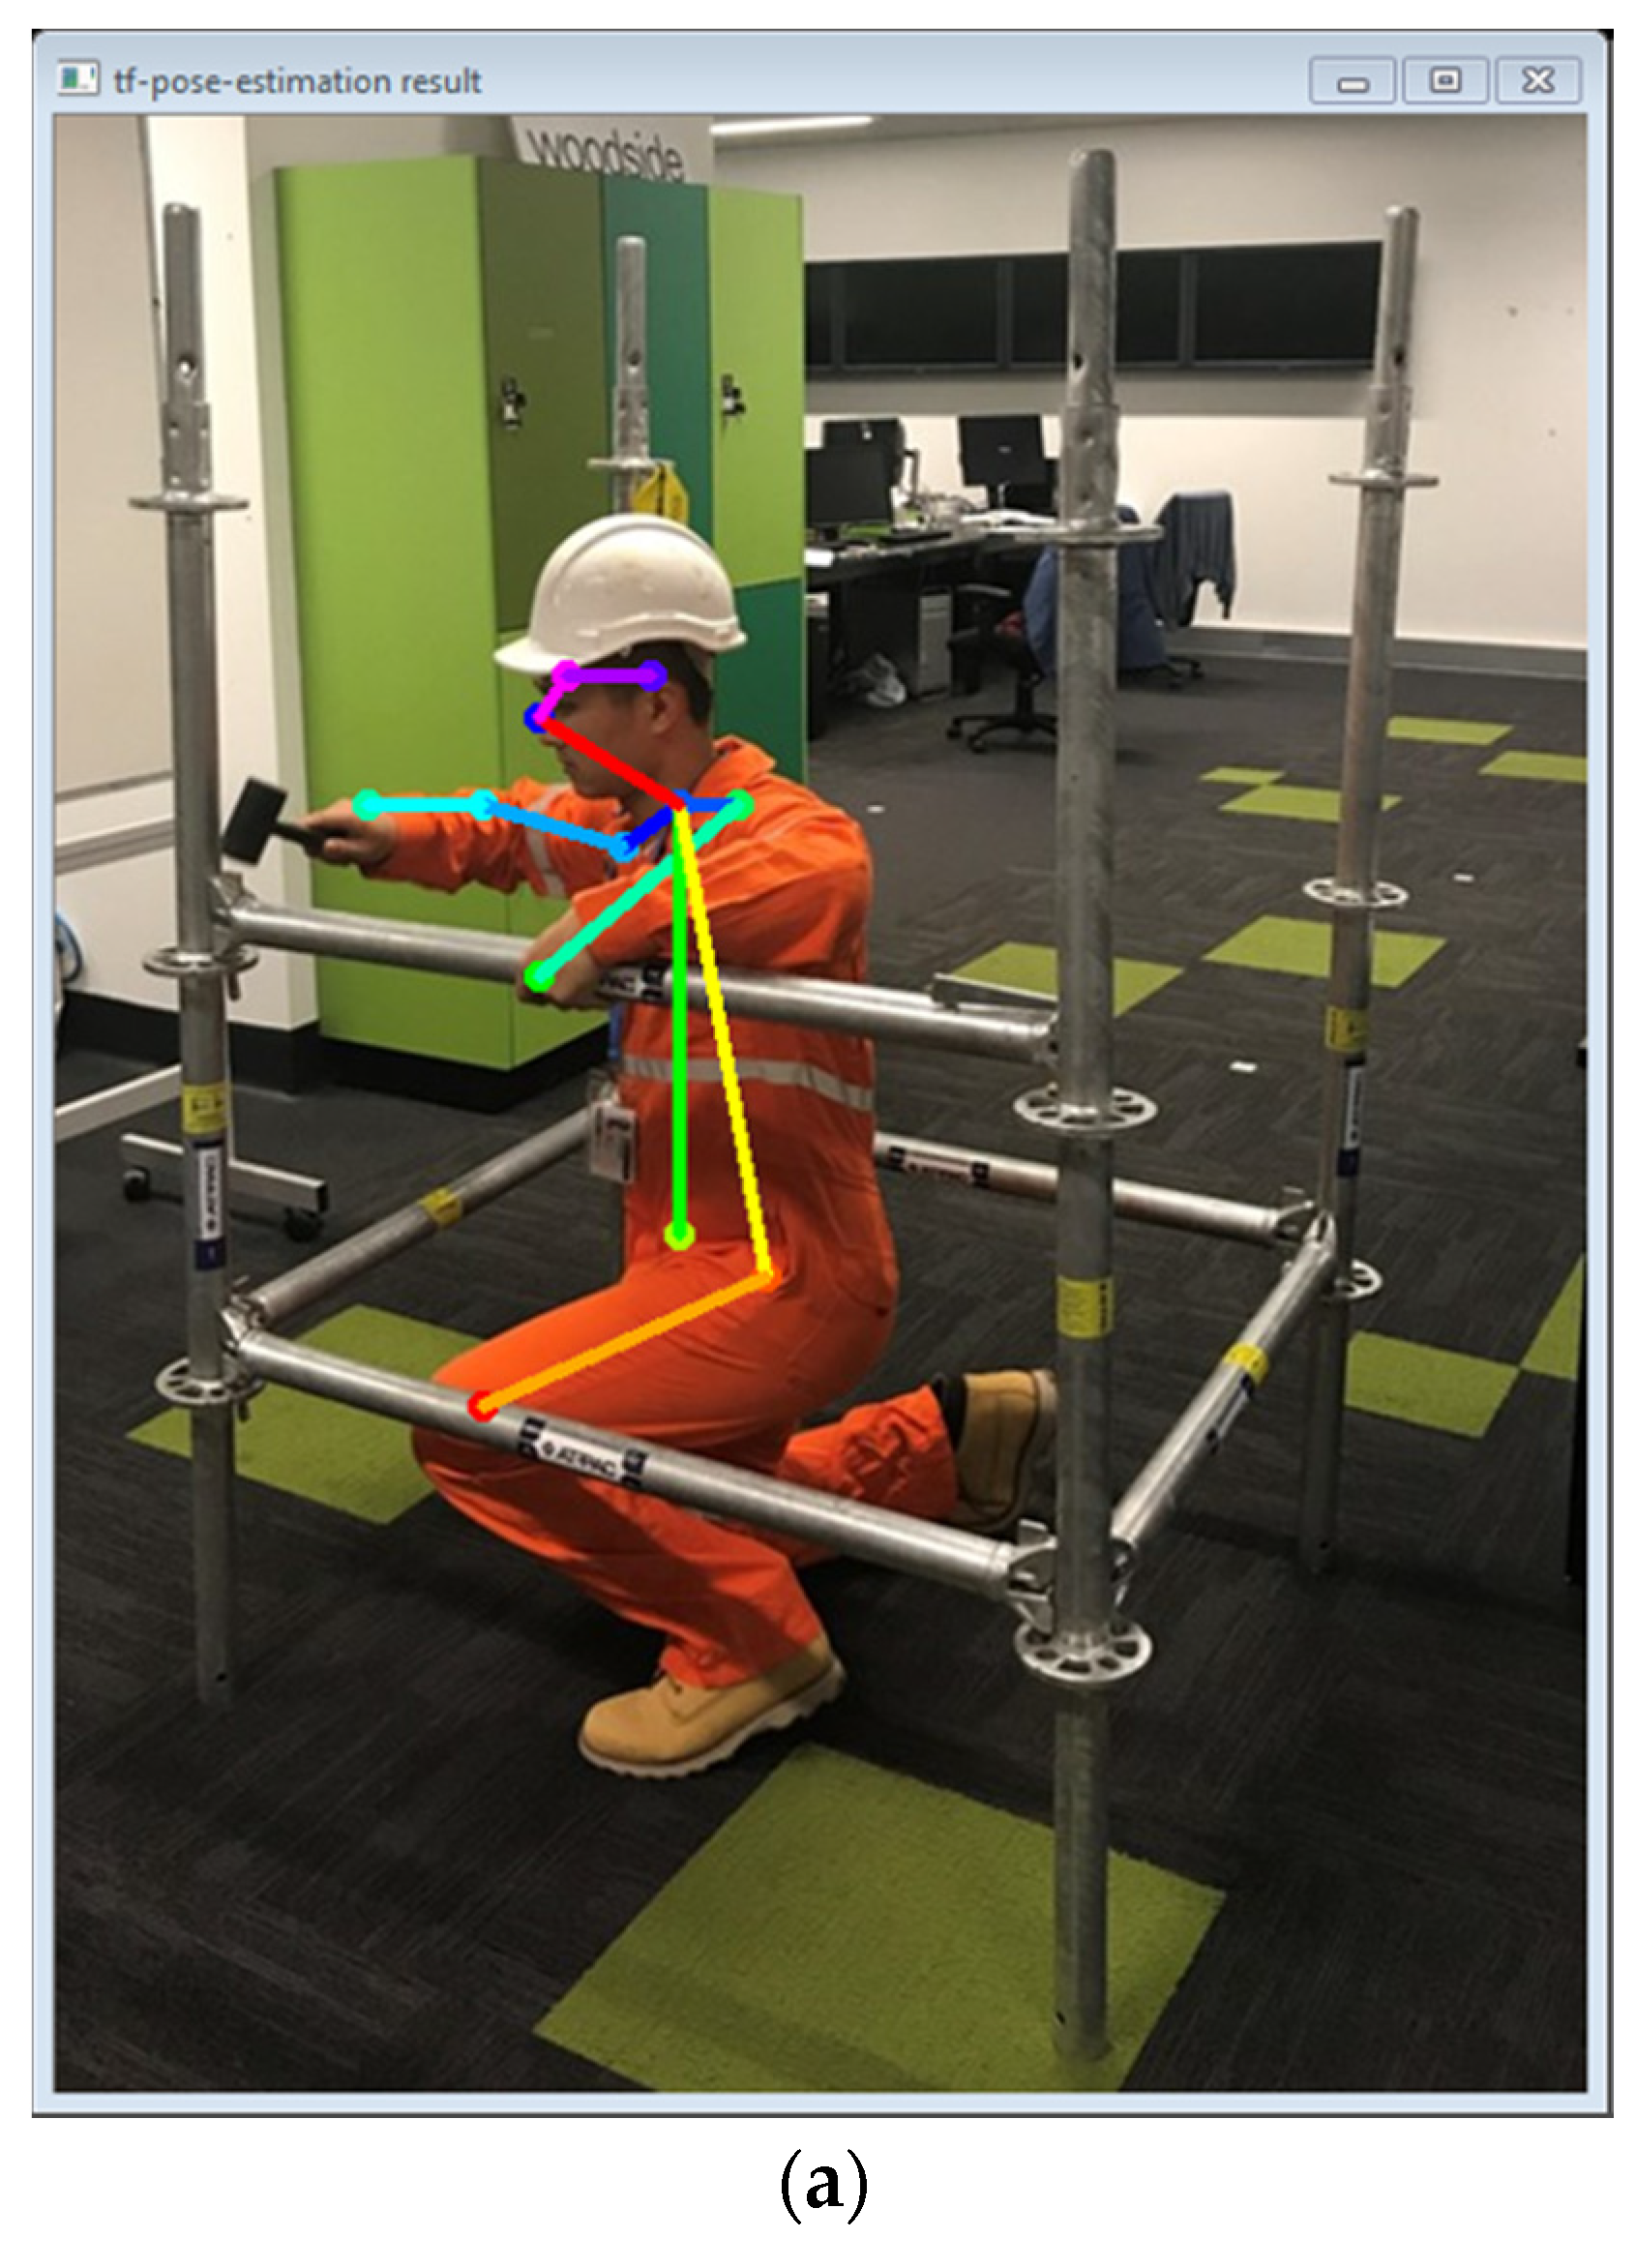
3.3. Key Joints Extraction
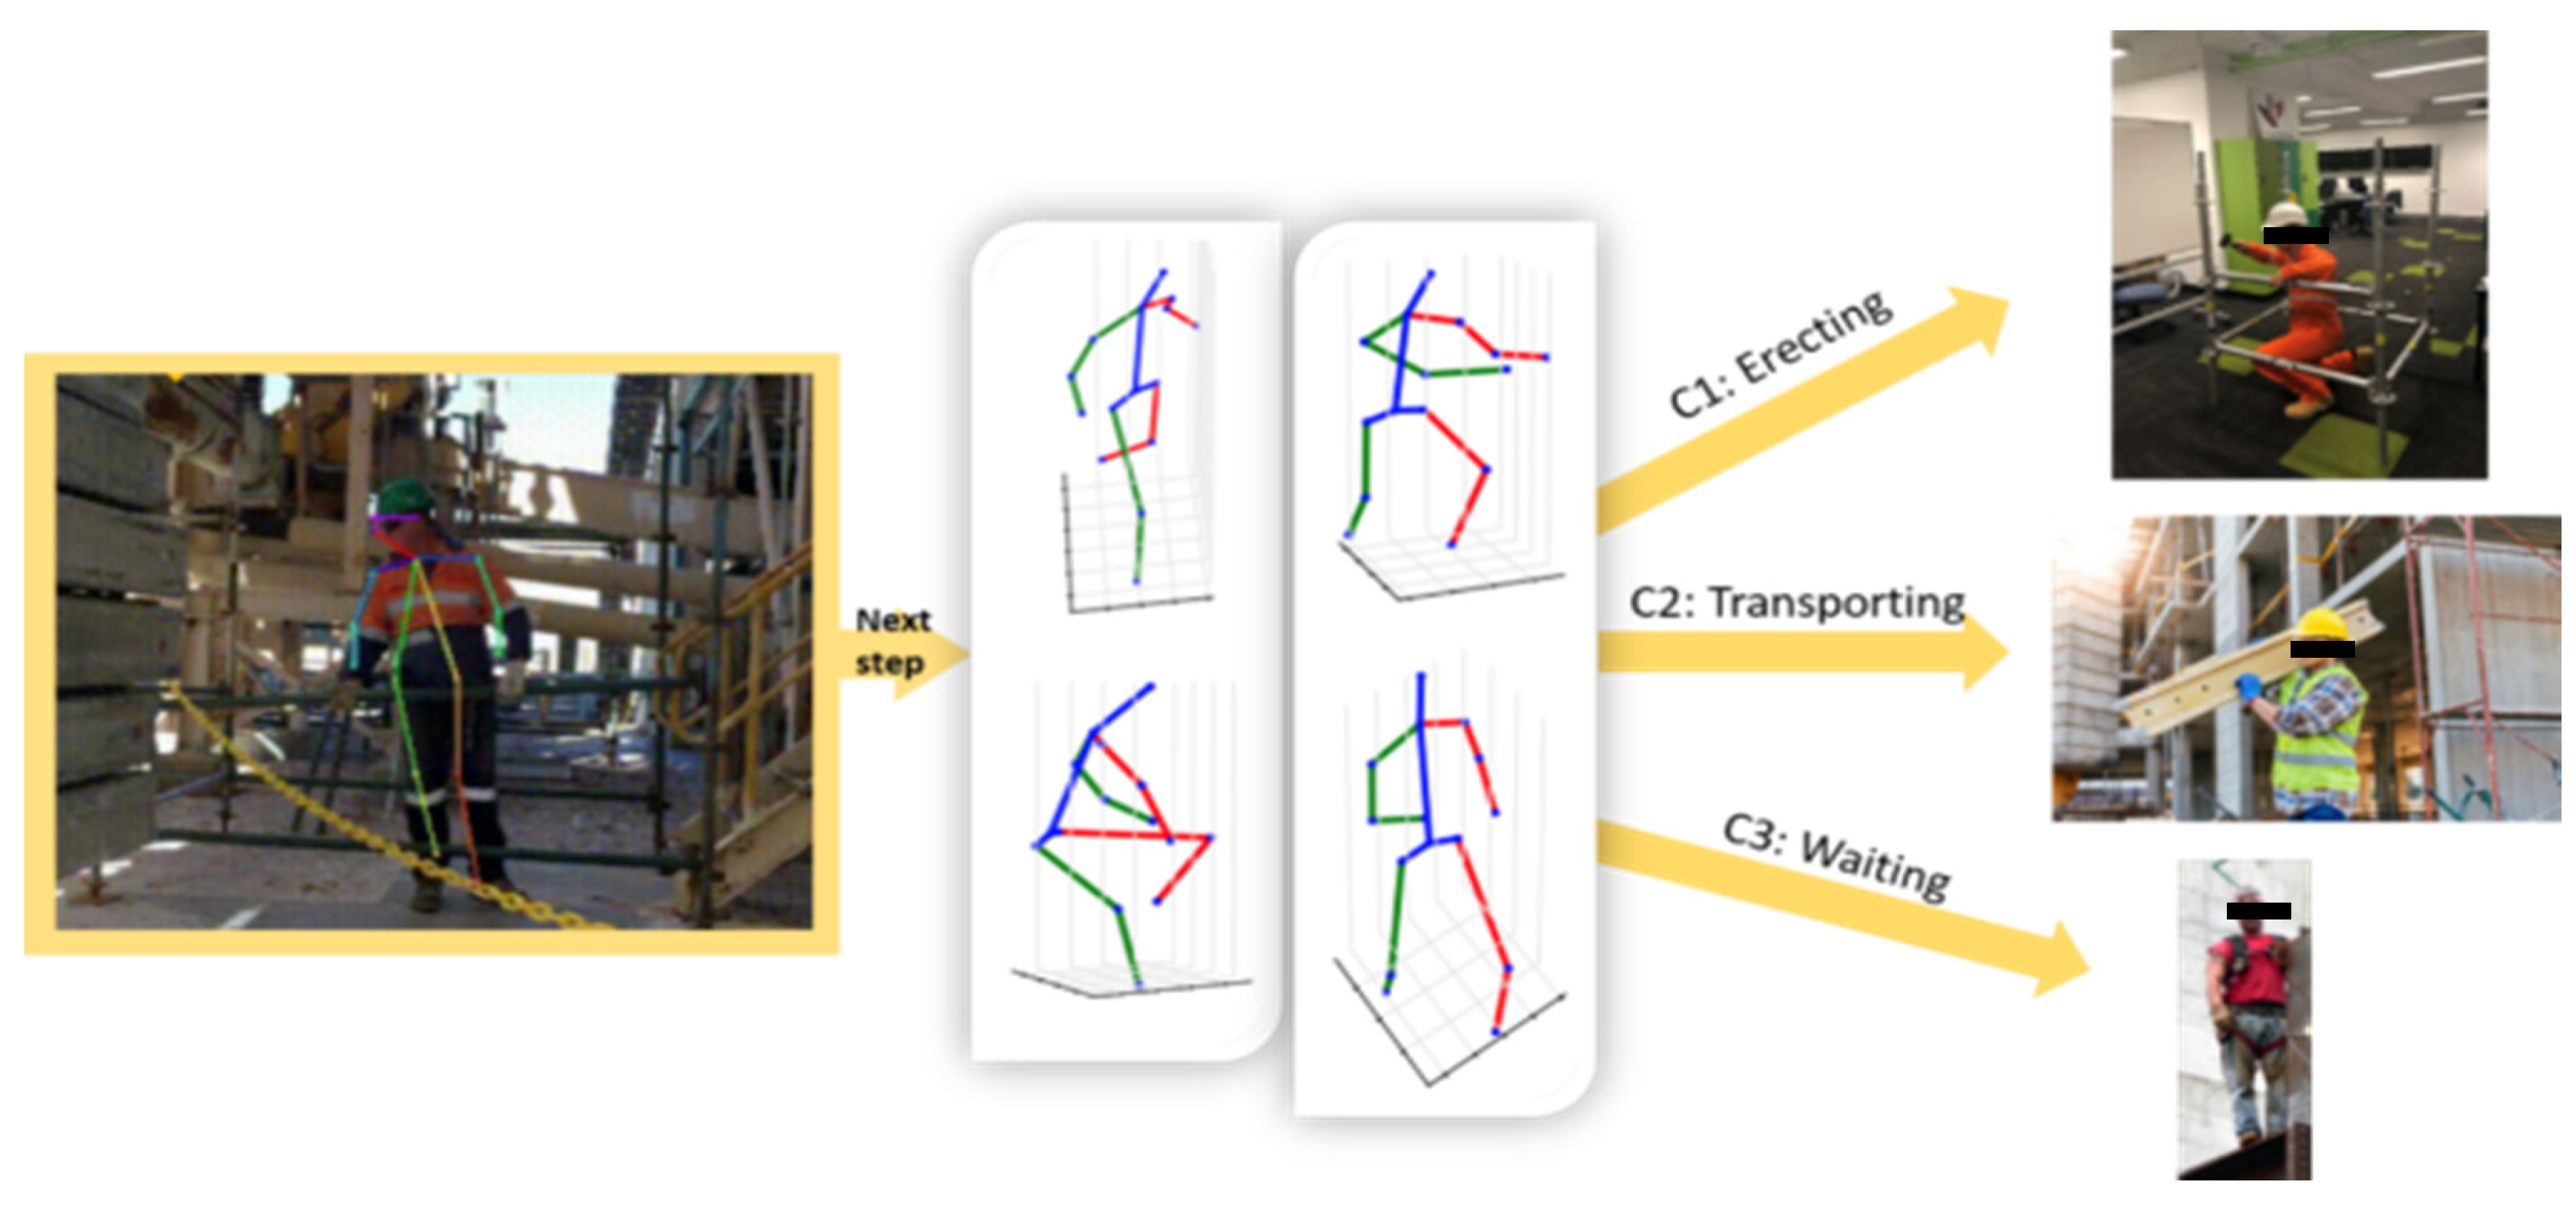
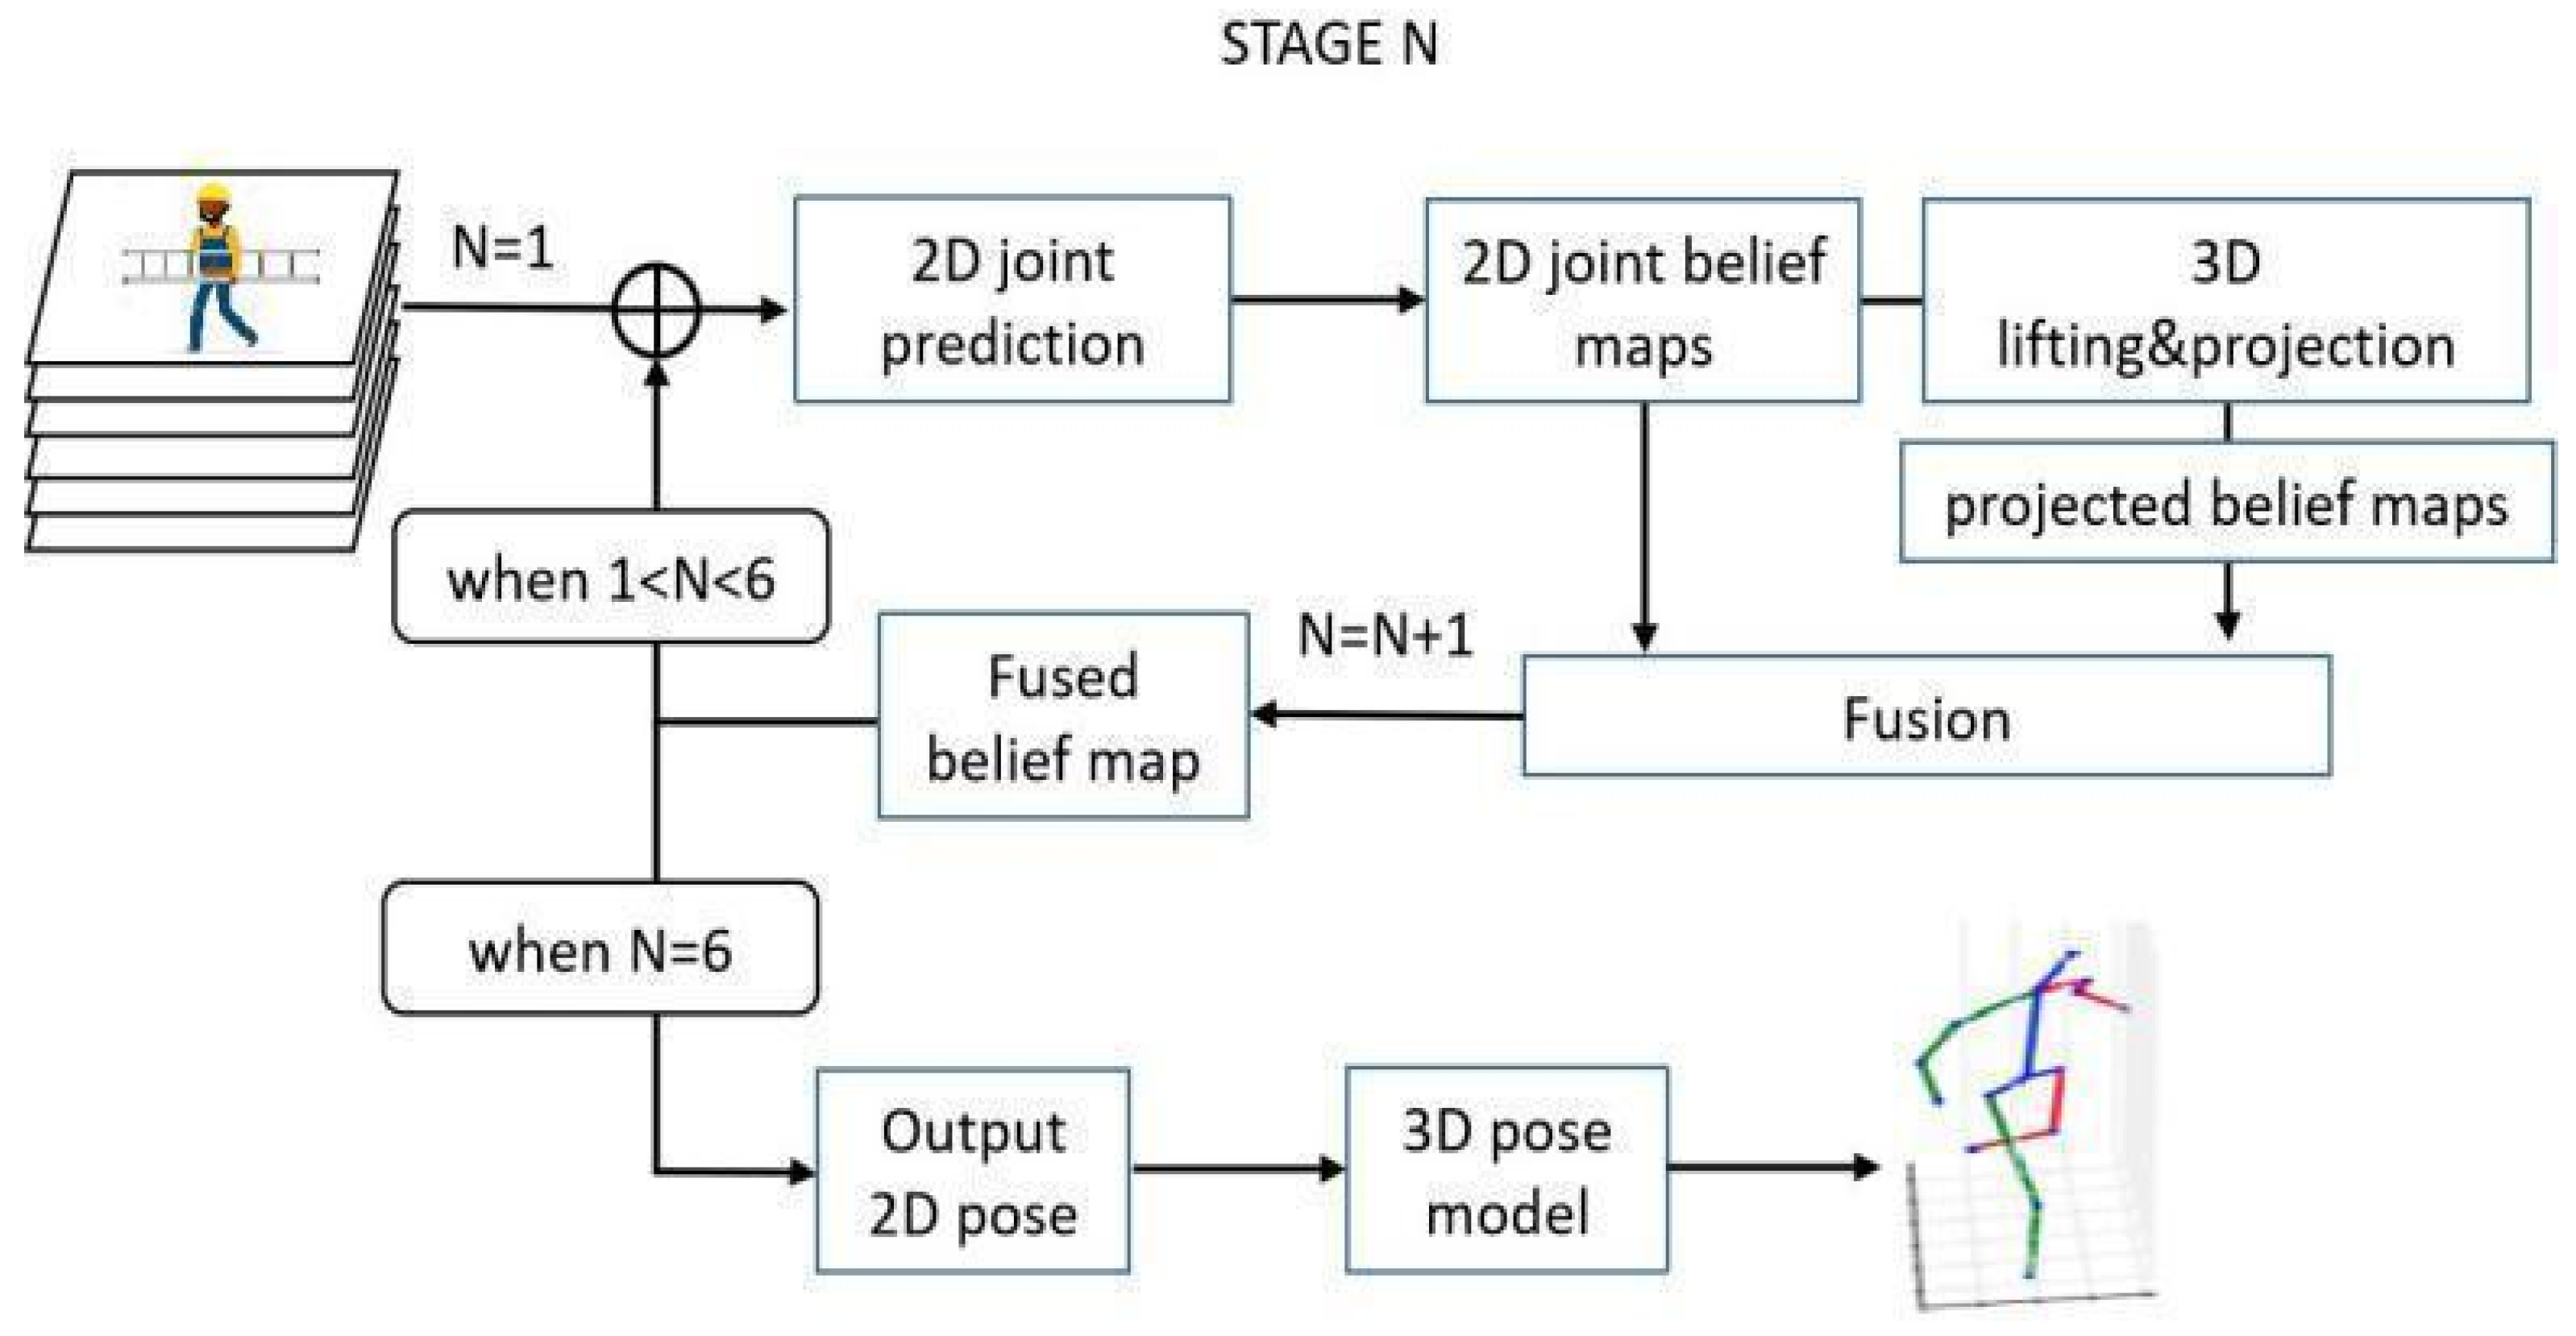
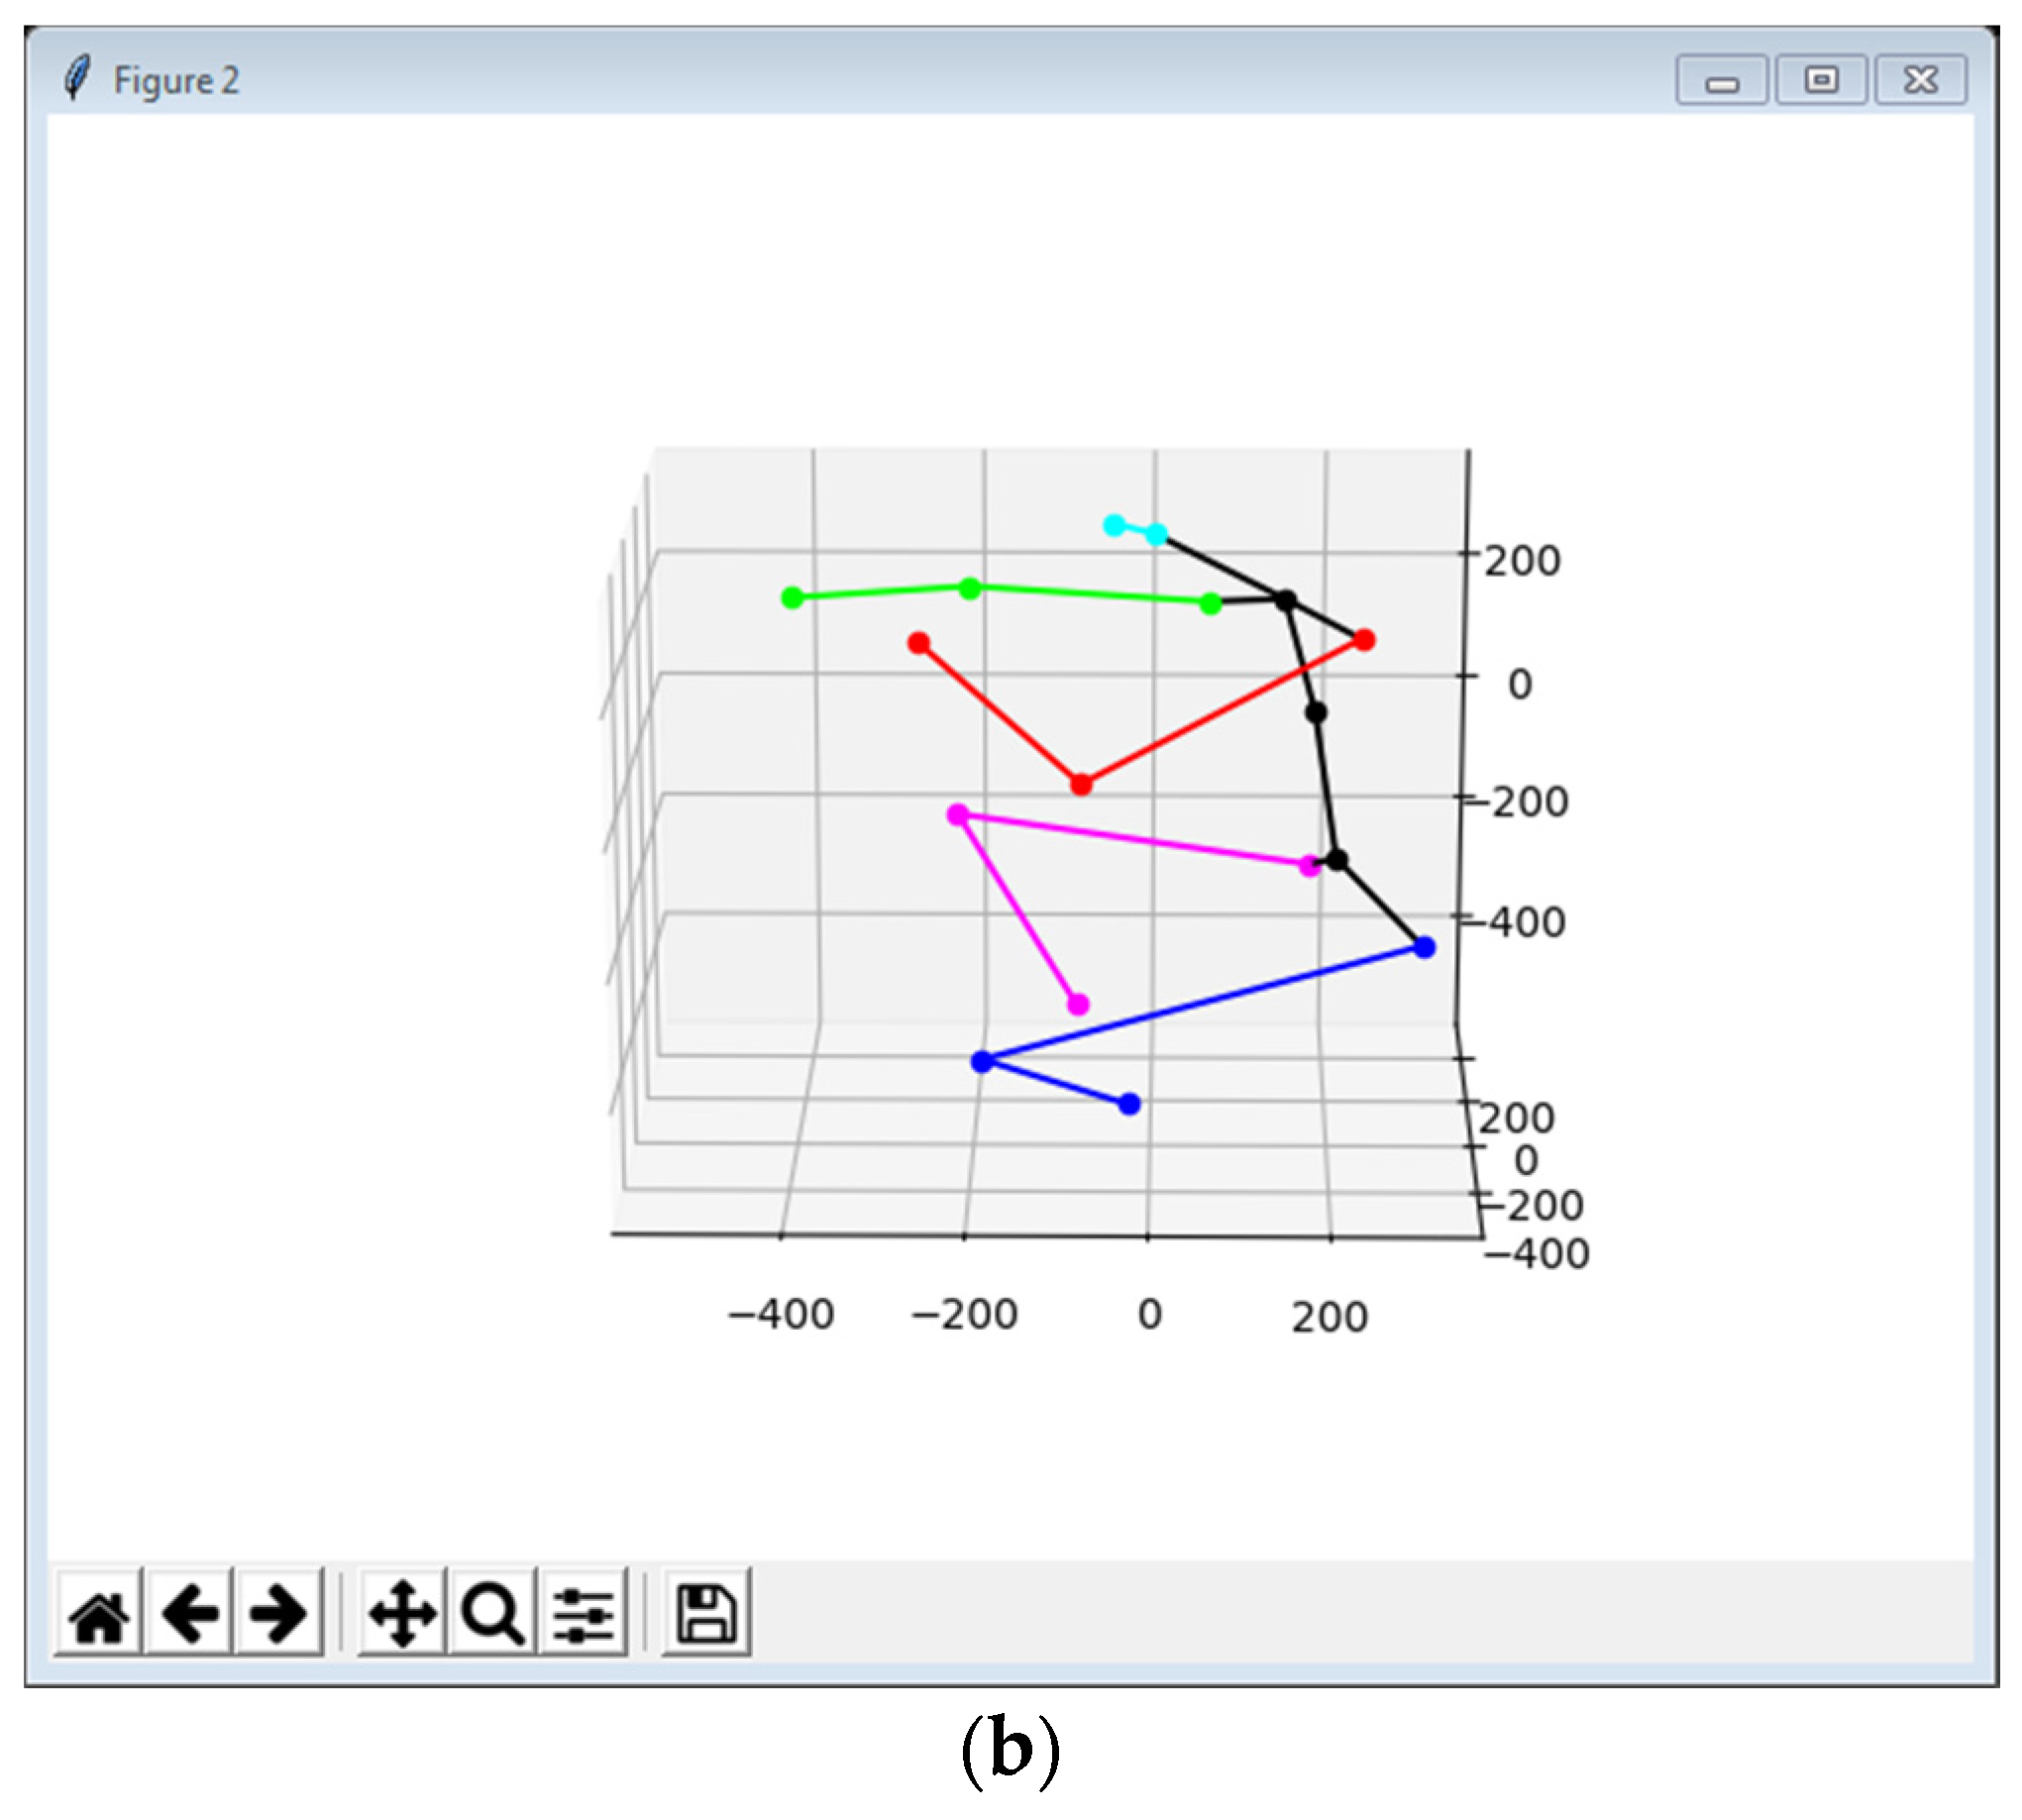
3.4. 3D Pose Estimation
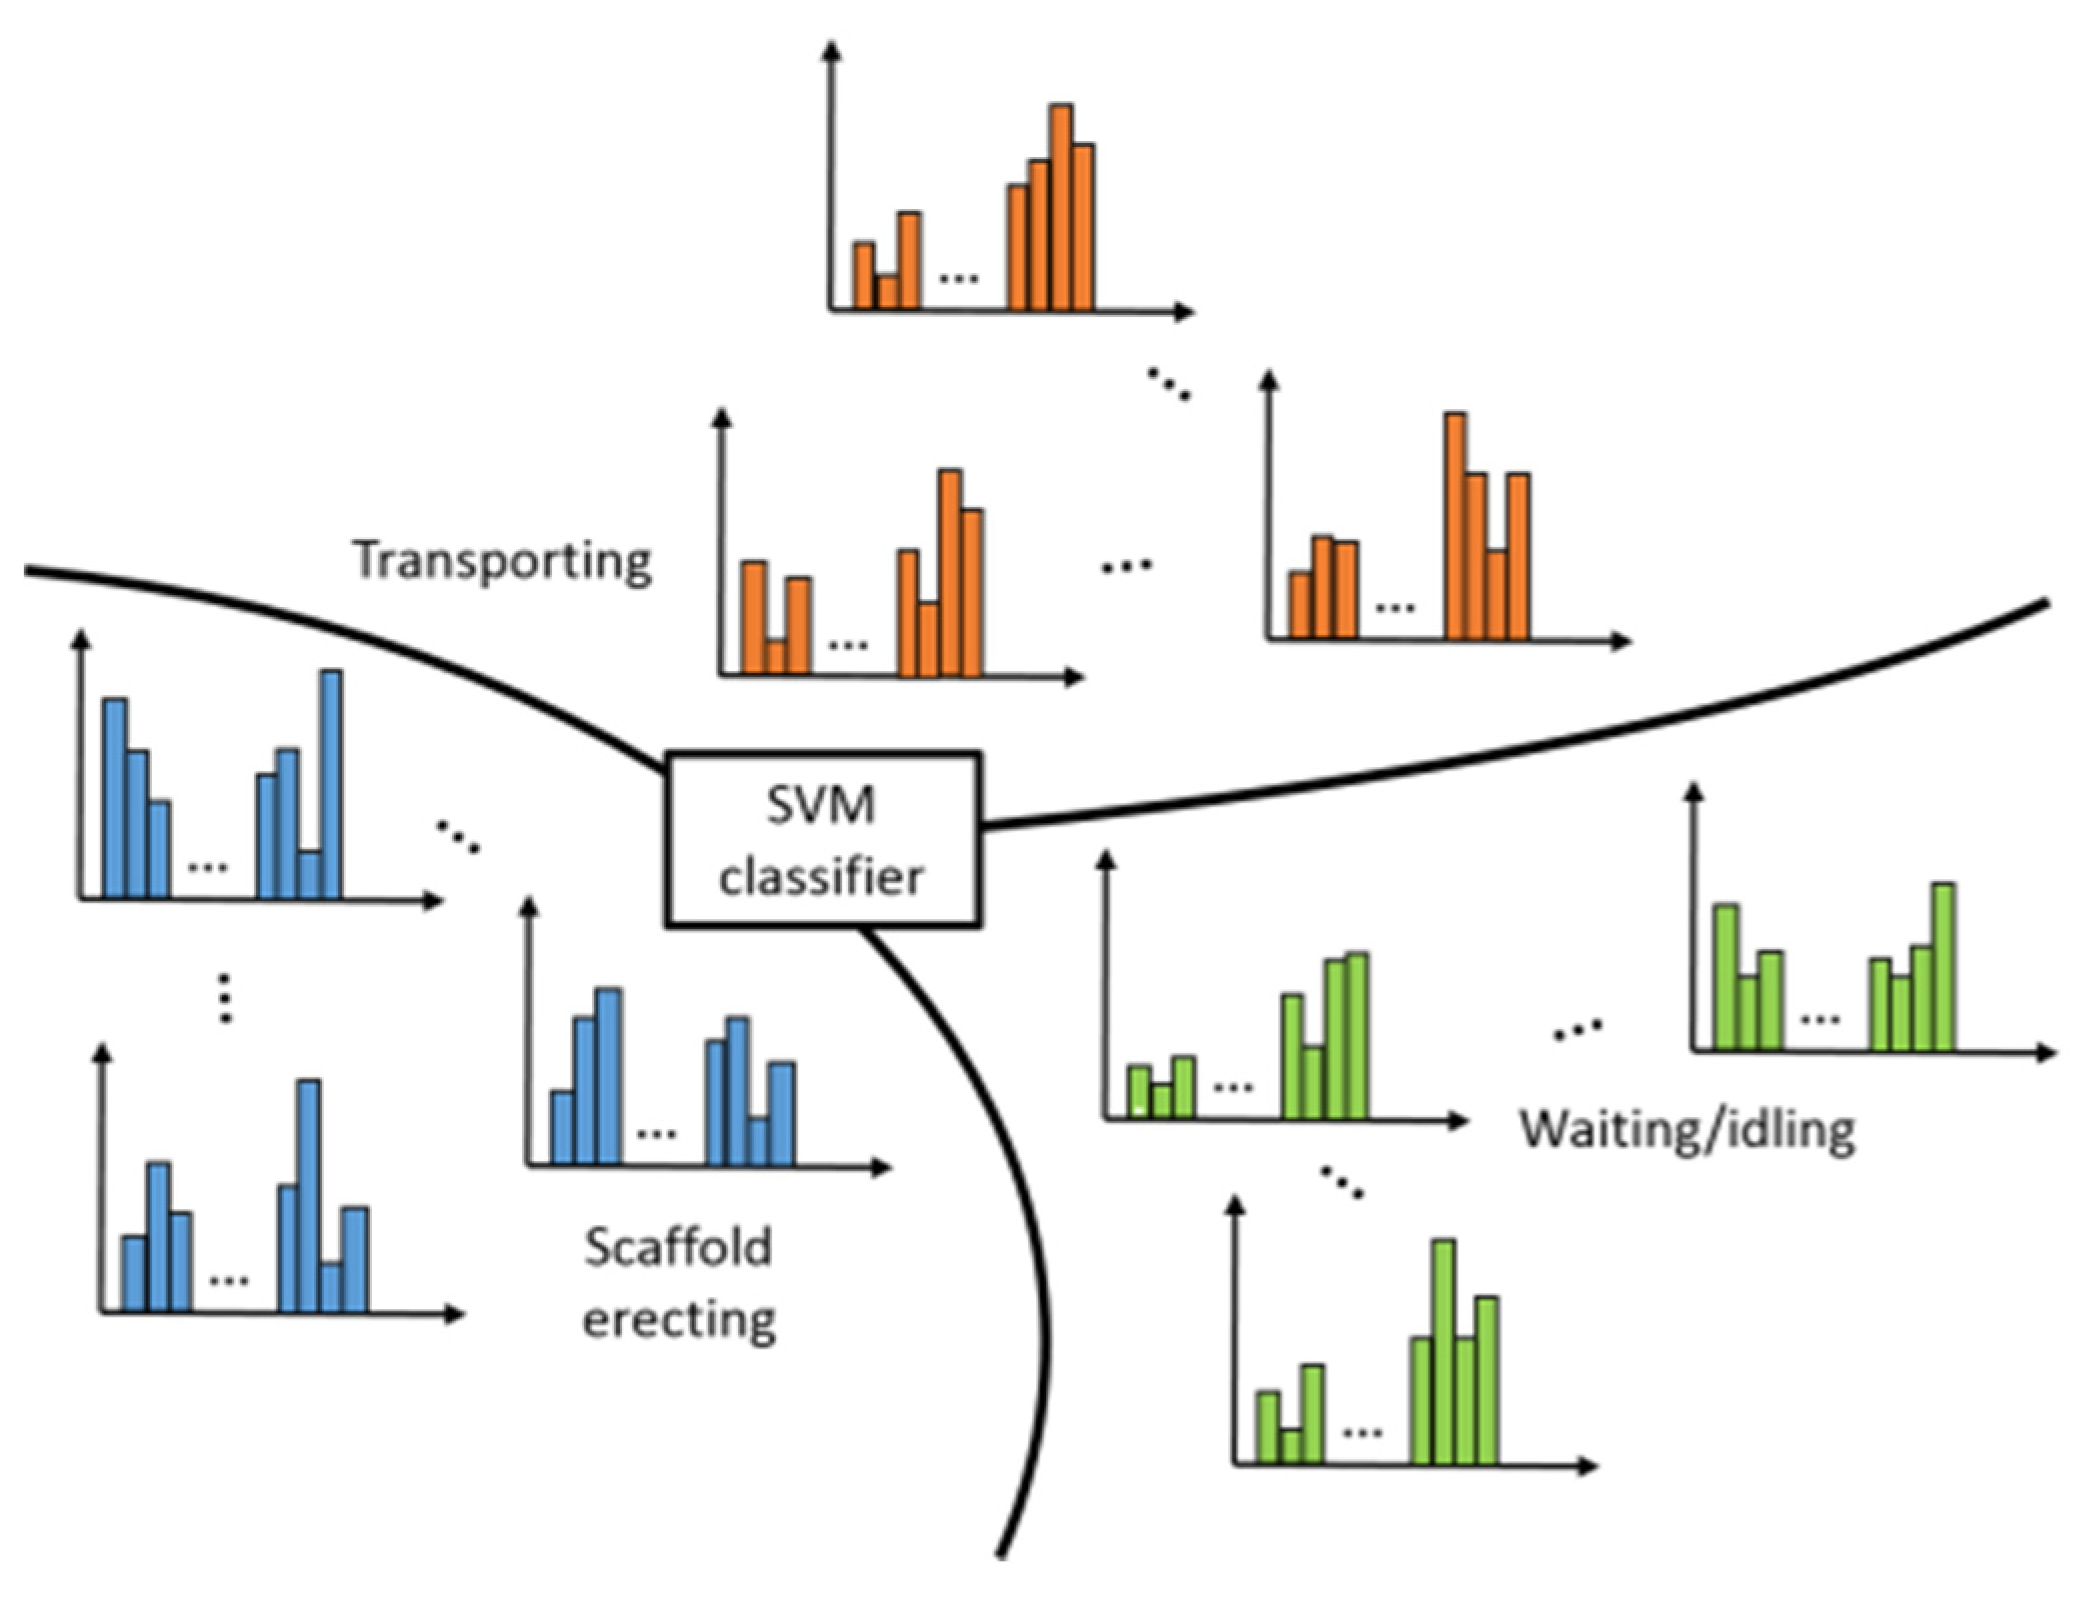
3.5. Classifier Training
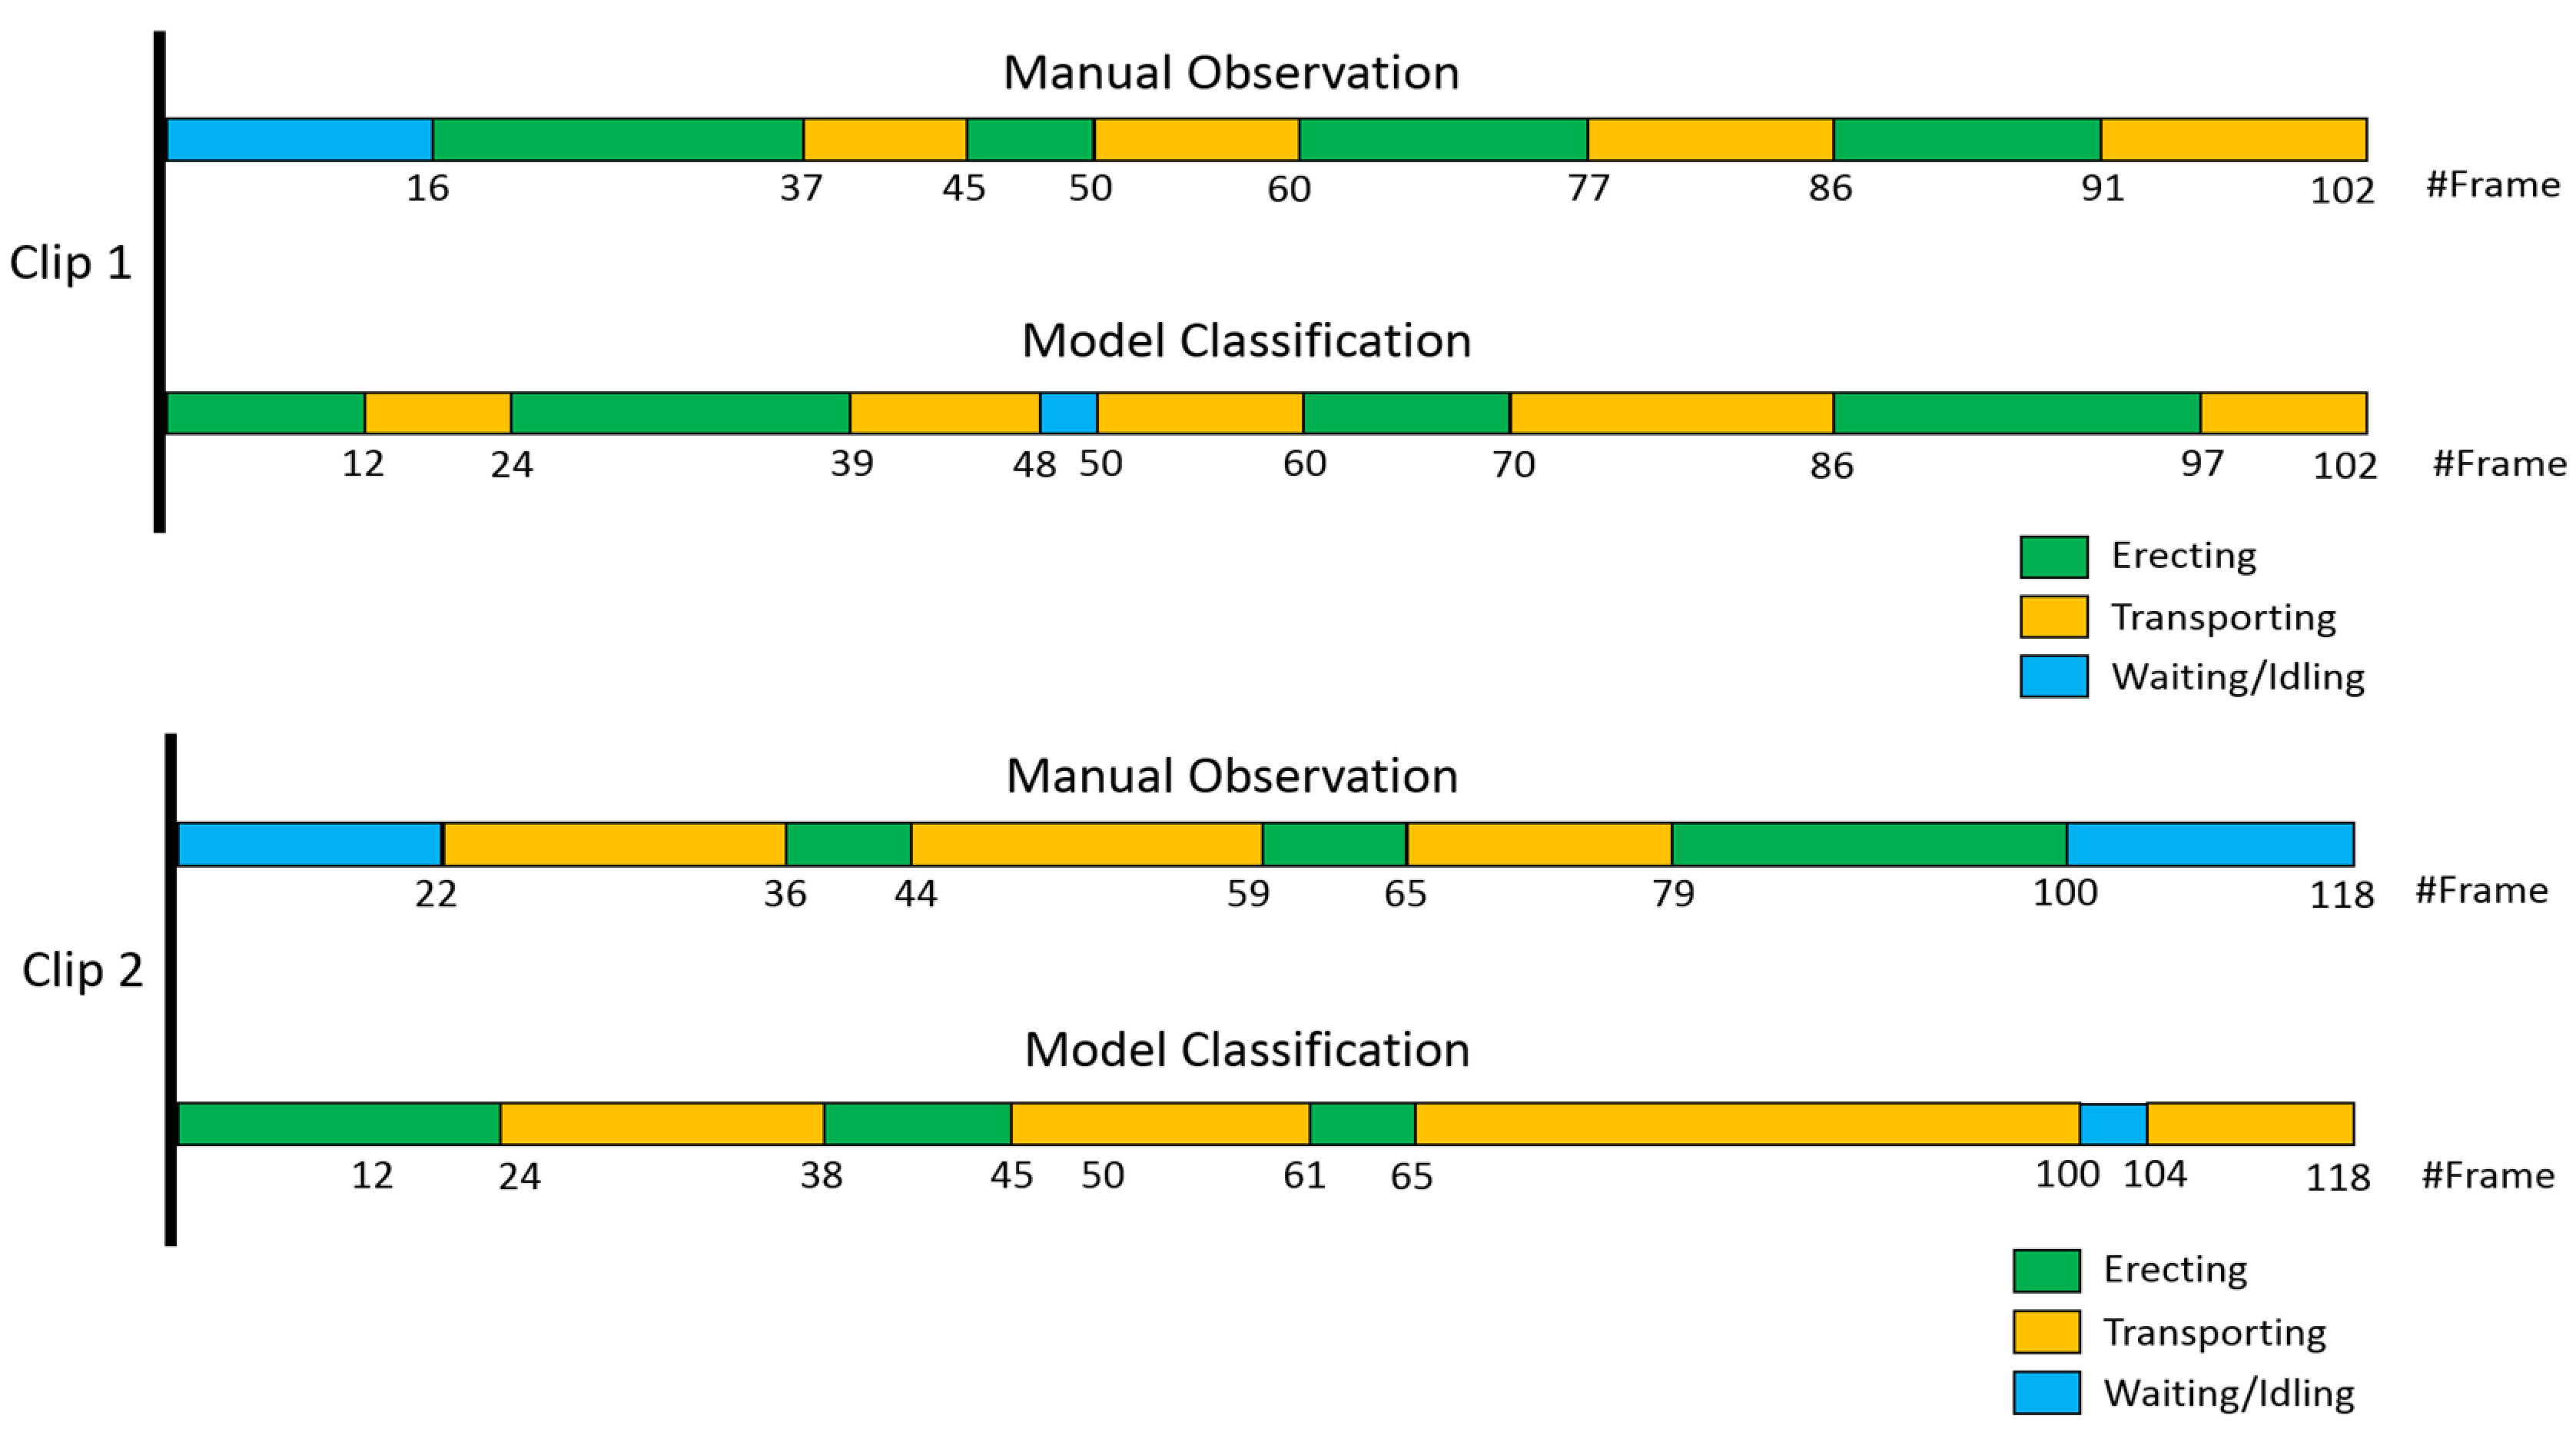
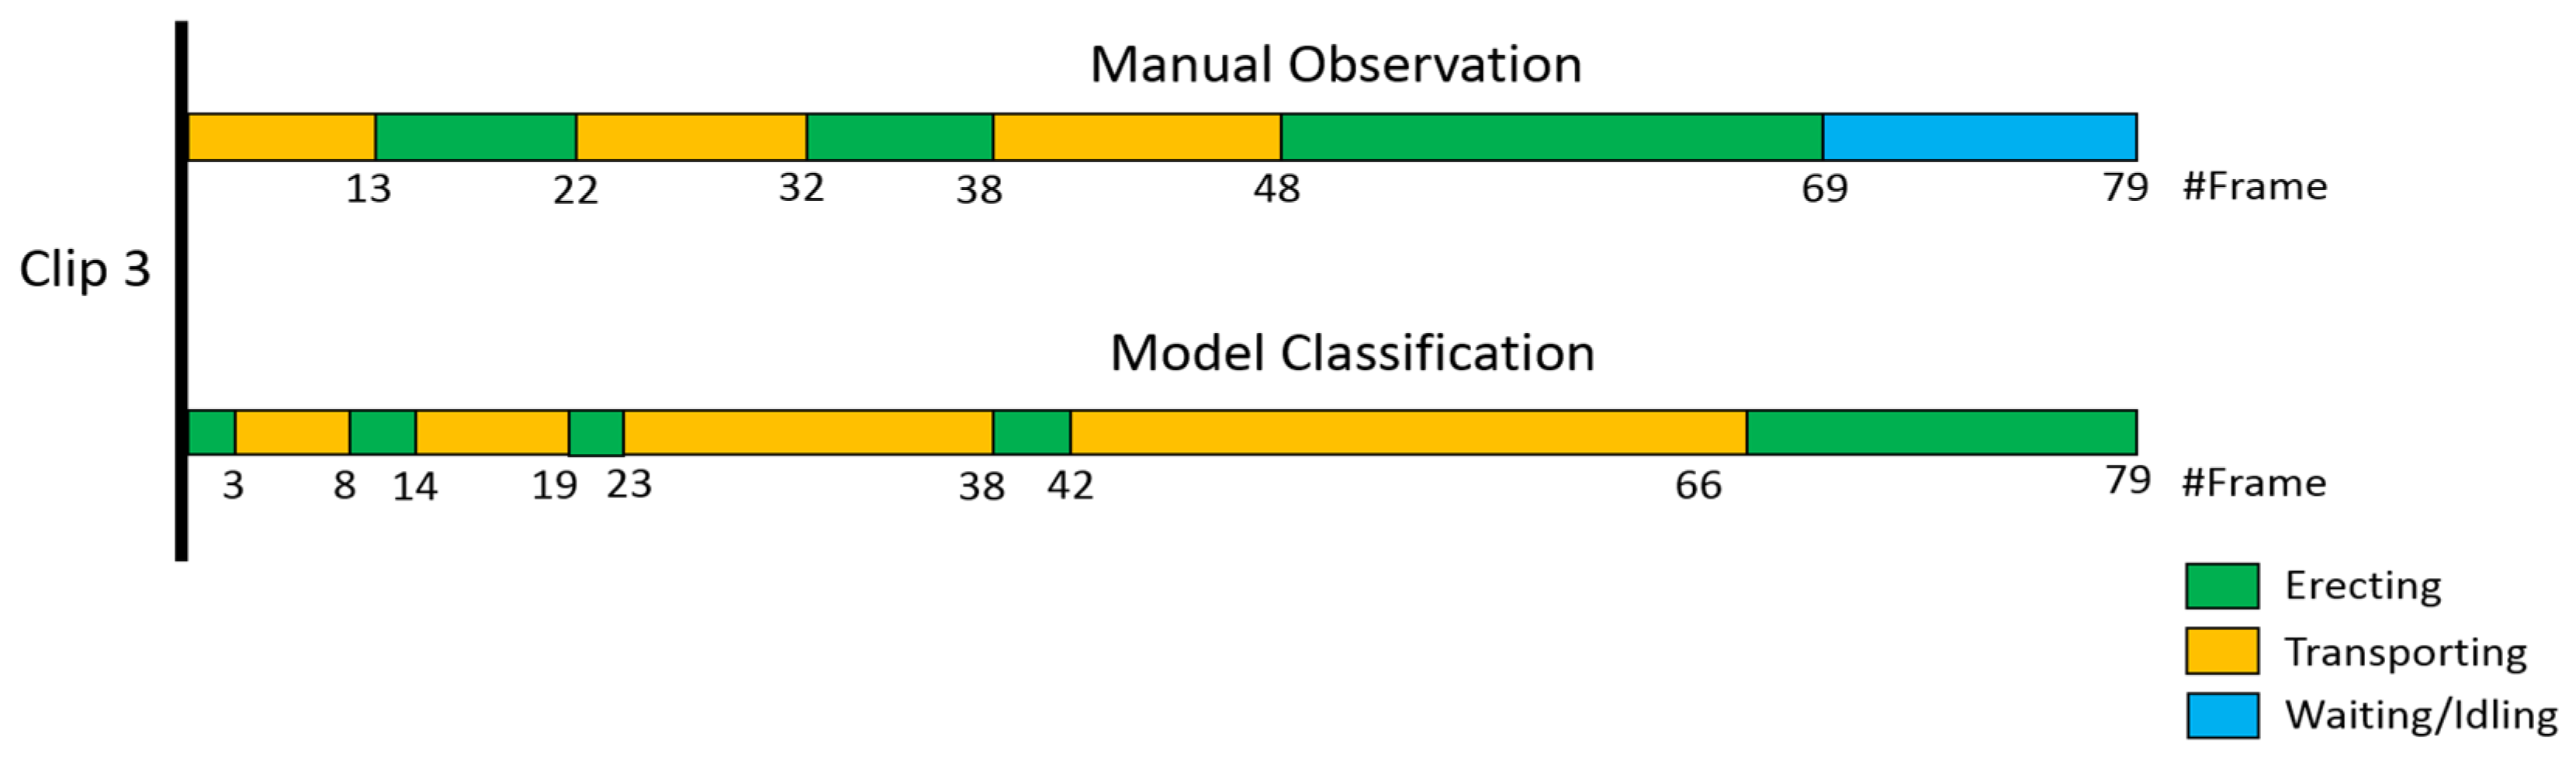
4. Case Study and Results Analysis
5. Discussion and Conclusions
Author Contributions
Funding
Institutional Review Board Statement
Informed Consent Statement
Data Availability Statement
Conflicts of Interest
References
- Hu, X.; Chong, H.-Y.; Wang, X. Sustainability perceptions of off-site manufacturing stakeholders in Australia. J. Clean. Prod. 2019, 227, 346–354. [Google Scholar] [CrossRef]
- Ye, M.; Jiang, J.; Chen, H.; Zhou, H.; Song, D. Seismic behavior of an innovative hybrid beam-column connection for precast concrete structures. Eng. Struct. 2021, 227, 111436. [Google Scholar] [CrossRef]
- Huang, H.; Guo, M.; Zhang, W.; Zeng, J.; Yang, K.; Bai, H. Numerical investigation on the bearing capacity of RC columns strengthened by HPFL-BSP under combined loadings. J. Build. Eng. 2021, 39, 102266. [Google Scholar] [CrossRef]
- Huang, H.; Huang, M.; Zhang, W.; Yang, S. Experimental study of predamaged columns strengthened by HPFL and BSP under combined load cases. Struct. Infrastruct. Eng. 2020, 1–18. [Google Scholar] [CrossRef]
- Moon, S.; Forlani, J.; Wang, X.; Tam, V. Productivity Study of the Scaffolding Operations in Liquefied Natural Gas Plant Construction: Ichthys Project in Darwin, Northern Territory, Australia. J. Prof. Issues Eng. Educ. Pract. 2016, 142, 04016008. [Google Scholar] [CrossRef]
- Chen, Y.; Zheng, W.; Li, W.; Huang, Y. Large group activity security risk assessment and risk early warning based on random forest algorithm. Pattern Recognit. Lett. 2021, 144, 1–5. [Google Scholar] [CrossRef]
- Hou, L.; Zhao, C.; Wu, C.; Moon, S.; Wang, X. Discrete Firefly Algorithm for Scaffolding Construction Scheduling. J. Comput. Civ. Eng. 2017, 31, 04016064. [Google Scholar] [CrossRef] [Green Version]
- Kim, K.; Teizer, J. Automatic design and planning of scaffolding systems using building information modeling. Adv. Eng. Inform. 2014, 28, 66–80. [Google Scholar] [CrossRef]
- Zhu, J.; Wang, X.; Chen, M.; Wu, P.; Kim, M.J. Integration of BIM and GIS: IFC geometry transformation to shapefile using enhanced open-source approach. Autom. Constr. 2019, 106, 102859. [Google Scholar] [CrossRef]
- Singh, V.; Gu, N.; Wang, X. A theoretical framework of a BIM-based multi-disciplinary collaboration platform. Autom. Constr. 2011, 20, 134–144. [Google Scholar] [CrossRef]
- Chong, H.-Y.; Lee, C.-Y.; Wang, X. A mixed review of the adoption of Building Information Modelling (BIM) for sustainability. J. Clean. Prod. 2017, 142, 4114–4126. [Google Scholar] [CrossRef] [Green Version]
- Zhu, J.; Wu, P.; Chen, M.; Kim, M.J.; Wang, X.; Fang, T. Automatically Processing IFC Clipping Representation for BIM and GIS Integration at the Process Level. Appl. Sci. 2020, 10, 2009. [Google Scholar] [CrossRef] [Green Version]
- Omar, H.; Mahdjoubi, L.; Kheder, G. Towards an automated photogrammetry-based approach for monitoring and controlling construction site activities. Comput. Ind. 2018, 98, 172–182. [Google Scholar] [CrossRef]
- Wang, L.; Yuan, J.; Wu, C.; Wang, X. Practical algorithm for stochastic optimal control problem about microbial fermentation in batch culture. Optim. Lett. 2019, 13, 527–541. [Google Scholar] [CrossRef]
- Golparvar-Fard, M.; Bohn, J.; Teizer, J.; Savarese, S.; Peña-Mora, F. Evaluation of image-based modeling and laser scanning accuracy for emerging automated performance monitoring techniques. Autom. Constr. 2011, 20, 1143–1155. [Google Scholar] [CrossRef]
- Bosché, F.; Guillemet, A.; Turkan, Y.; Haas, C.T.; Haas, R. Tracking the Built Status of MEP Works: Assessing the Value of a Scan-vs-BIM System. J. Comput. Civ. Eng. 2014, 28, 05014004. [Google Scholar] [CrossRef] [Green Version]
- Wu, P.; Wang, J.; Wang, X. A critical review of the use of 3-D printing in the construction industry. Autom. Constr. 2016, 68, 21–31. [Google Scholar] [CrossRef] [Green Version]
- Li, X.; Yi, W.; Chi, H.-L.; Wang, X.; Chan, A.P. A critical review of virtual and augmented reality (VR/AR) applications in construction safety. Autom. Constr. 2018, 86, 150–162. [Google Scholar] [CrossRef]
- Niu, Z.; Zhang, B.; Wang, J.; Liu, K.; Chen, Z.; Yang, K.; Zhou, Z.; Fan, Y.; Zhang, Y.; Ji, D.; et al. The research on 220GHz multicarrier high-speed communication system. China Commun. 2020, 17, 131–139. [Google Scholar] [CrossRef]
- Gouett, M.C.; Haas, C.T.; Goodrum, P.M.; Caldas, C.H. Activity Analysis for Direct-Work Rate Improvement in Construction. J. Constr. Eng. Manag. 2011, 137, 1117–1124. [Google Scholar] [CrossRef]
- CII. Guide to Activity Analysis; University of Texas at Austin: Austin, TX, USA, 2010. [Google Scholar]
- Khosrowpour, A.; Niebles, J.C.; Golparvar-Fard, M. Vision-based workface assessment using depth images for activity analysis of interior construction operations. Autom. Constr. 2014, 48, 74–87. [Google Scholar] [CrossRef]
- Ma, X.; Zhang, K.; Zhang, L.; Yao, C.; Yao, J.; Wang, H.; Jian, W.; Yan, Y. Data-Driven Niching Differential Evolution with Adaptive Parameters Control for History Matching and Uncertainty Quantification. SPE J. 2021, 26, 993–1010. [Google Scholar] [CrossRef]
- Shi, J.; Lu, Y.; Zhang, J. Approximation Attacks on Strong PUFs. IEEE Trans. Comput. Des. Integr. Circuits Syst. 2020, 39, 2138–2151. [Google Scholar] [CrossRef]
- Zhang, J.; Shen, C.; Su, H.; Arafin, T.; Qu, G. Voltage Over-scaling-based Lightweight Authentication for IoT Security. IEEE Trans. Comput. 2021, 1. [Google Scholar] [CrossRef]
- Cheng, T.; Teizer, J.; Migliaccio, G.C.; Gatti, U.C. Automated task-level activity analysis through fusion of real time location sensors and worker’s thoracic posture data. Autom. Constr. 2013, 29, 24–39. [Google Scholar] [CrossRef]
- Zhang, B.; Ji, D.; Fang, D.; Liang, S.; Fan, Y.; Chen, X. A Novel 220-GHz GaN Diode On-Chip Tripler with High Driven Power. IEEE Electron Device Lett. 2019, 40, 780–783. [Google Scholar] [CrossRef]
- Liu, Y.; Zhang, B.; Feng, Y.; Lv, X.; Ji, D.; Niu, Z.; Yang, Y.; Zhao, X.; Fan, Y. Development of 340-GHz Transceiver Front End Based on GaAs Monolithic Integration Technology for THz Active Imaging Array. Appl. Sci. 2020, 10, 7924. [Google Scholar] [CrossRef]
- Yang, Y.; Hou, C.; Lang, Y.; Sakamoto, T.; He, Y.; Xiang, W. Omnidirectional Motion Classification with Monostatic Radar System Using Micro-Doppler Signatures. IEEE Trans. Geosci. Remote Sens. 2019, 58, 3574–3587. [Google Scholar] [CrossRef]
- Jiang, Q.; Shao, F.; Gao, W.; Chen, Z.; Jiang, G.; Ho, Y.-S. Unified No-Reference Quality Assessment of Singly and Multiply Distorted Stereoscopic Images. IEEE Trans. Image Process. 2019, 28, 1866–1881. [Google Scholar] [CrossRef] [PubMed]
- Zhang, J.; Chen, Q.; Sun, J.; Tian, L.; Zuo, C. On a universal solution to the transport-of-intensity equation. Opt. Lett. 2020, 45, 3649. [Google Scholar] [CrossRef] [PubMed]
- Zhang, J.; Sun, J.; Chen, Q.; Zuo, C. Resolution Analysis in a Lens-Free On-Chip Digital Holographic Microscope. IEEE Trans. Comput. Imaging 2020, 6, 697–710. [Google Scholar] [CrossRef] [Green Version]
- Assadzadeh, A.; Arashpour, M.; Bab-Hadiashar, A.; Ngo, T.; Li, H. Automatic far-field camera calibration for construction scene analysis. Comput. Civ. Infrastruct. Eng. 2021. [Google Scholar] [CrossRef]
- Jiang, Q.; Shao, F.; Lin, W.; Gu, K.; Jiang, G.; Sun, H. Optimizing Multistage Discriminative Dictionaries for Blind Image Quality Assessment. IEEE Trans. Multimed. 2018, 20, 2035–2048. [Google Scholar] [CrossRef]
- Li, B.; Liang, R.; Zhou, W.; Yin, H.; Gao, H.; Cai, K. LBS Meets Blockchain:an Efficient Method with Security Preserving Trust in SAGIN. IEEE Internet Things J. 2021, 1. [Google Scholar] [CrossRef]
- Sarafianos, N.; Boteanu, B.; Ionescu, B.; Kakadiaris, I.A. 3D Human pose estimation: A review of the literature and analysis of covariates. Comput. Vis. Image Underst. 2016, 152, 1–20. [Google Scholar] [CrossRef]
- Dang, L.M.; Min, K.; Wang, H.; Piran, J.; Lee, C.H.; Moon, H. Sensor-based and vision-based human activity recognition: A comprehensive survey. Pattern Recognit. 2020, 108, 107561. [Google Scholar] [CrossRef]
- Niu, Z.-Q.; Zhang, B.; Li, D.-T.; Ji, D.-F.; Liu, Y.; Feng, Y.-N.; Zhou, T.-C.; Zhang, Y.-H.; Fan, Y. A mechanical reliability study of 3dB waveguide hybrid couplers in the submillimeter and terahertz band. J. Zhejiang Univ. Sci. 1998, 1, 1. [Google Scholar] [CrossRef]
- Ryu, J.; Seo, J.; Jebelli, H.; Lee, S. Automated Action Recognition Using an Accelerometer-Embedded Wristband-Type Activity Tracker. J. Constr. Eng. Manag. 2019, 145, 04018114. [Google Scholar] [CrossRef]
- Bangaru, S.S.; Wang, C.; Aghazadeh, F. Data Quality and Reliability Assessment of Wearable EMG and IMU Sensor for Construction Activity Recognition. Sensors 2020, 20, 5264. [Google Scholar] [CrossRef]
- Bangaru, S.S.; Wang, C.; Busam, S.A.; Aghazadeh, F. ANN-based automated scaffold builder activity recognition through wearable EMG and IMU sensors. Autom. Constr. 2021, 126, 103653. [Google Scholar] [CrossRef]
- Zuo, C.; Chen, Q.; Tian, L.; Waller, L.; Asundi, A. Transport of intensity phase retrieval and computational imaging for partially coherent fields: The phase space perspective. Opt. Lasers Eng. 2015, 71, 20–32. [Google Scholar] [CrossRef]
- Fığlalı, N.; Cihan, A.; Esen, H.; Fığlalı, A.; Çeşmeci, D.; Güllü, M.K.; Yilmaz, M.K.; Yılmaz, M.K. Image processing-aided working posture analysis: I-OWAS. Comput. Ind. Eng. 2015, 85, 384–394. [Google Scholar] [CrossRef]
- Rahman, C. Study and analysis of work postures of workers working in a ceramic industry through rapid upper limb assessment (RULA). Int. J. Eng. 2014, 5, 8269. [Google Scholar]
- Ray, S.J.; Teizer, J. Real-time construction worker posture analysis for ergonomics training. Adv. Eng. Inform. 2012, 26, 439–455. [Google Scholar] [CrossRef]
- Yan, X.; Li, H.; Wang, C.; Seo, J.; Zhang, H.; Wang, H. Development of ergonomic posture recognition technique based on 2D ordinary camera for construction hazard prevention through view-invariant features in 2D skeleton motion. Adv. Eng. Inform. 2017, 34, 152–163. [Google Scholar] [CrossRef]
- Zhang, H.; Yan, X.; Li, H. Ergonomic posture recognition using 3D view-invariant features from single ordinary camera. Autom. Constr. 2018, 94, 1–10. [Google Scholar] [CrossRef]
- Wang, P.; Wu, P.; Wang, X.; Chen, X.; Zhou, T. Developing optimal scaffolding erection through the integration of lean and work posture analysis. Eng. Constr. Arch. Manag. 2020, 27, 2109–2133. [Google Scholar] [CrossRef]
- Yan, X.; Li, H.; Li, A.R.; Zhang, H. Wearable IMU-based real-time motion warning system for construction workers’ musculoskeletal disorders prevention. Autom. Constr. 2017, 74, 2–11. [Google Scholar] [CrossRef]
- Seo, J.; Starbuck, R.; Han, S.; Lee, S.; Armstrong, T.J. Motion Data-Driven Biomechanical Analysis during Construction Tasks on Sites. J. Comput. Civ. Eng. 2015, 29, 4014005. [Google Scholar] [CrossRef]
- Yu, Y.; Guo, H.; Ding, Q.; Li, H.; Skitmore, M. An experimental study of real-time identification of construction workers’ unsafe behaviors. Autom. Constr. 2017, 82, 193–206. [Google Scholar] [CrossRef] [Green Version]
- Zhao, J.; Liu, J.; Jiang, J.; Gao, F. Efficient Deployment with Geometric Analysis for mmWave UAV Communications. IEEE Wirel. Commun. Lett. 2020, 9, 1. [Google Scholar] [CrossRef]
- Alwasel, A.; Sabet, A.; Nahangi, M.; Haas, C.T.; Abdel-Rahman, E. Identifying poses of safe and productive masons using machine learning. Autom. Constr. 2017, 84, 345–355. [Google Scholar] [CrossRef]
- Han, S.; Lee, S.; Peña-Mora, F. Vision-Based Detection of Unsafe Actions of a Construction Worker: Case Study of Ladder Climbing. J. Comput. Civ. Eng. 2013, 27, 635–644. [Google Scholar] [CrossRef]
- Zhang, B.; Niu, Z.; Wang, J.; Ji, D.; Zhou, T.; Liu, Y.; Feng, Y.; Hu, Y.; Zhang, J.; Fan, Y. Four-hundred gigahertz broadband multi-branch waveguide coupler. IET Microw. Antennas Propag. 2020, 14, 1175–1179. [Google Scholar] [CrossRef]
- Luo, H.; Xiong, C.; Fang, W.; Love, P.E.; Zhang, B.; Ouyang, X. Convolutional neural networks: Computer vision-based workforce activity assessment in construction. Autom. Constr. 2018, 94, 282–289. [Google Scholar] [CrossRef]
- Hu, J.; Zhang, H.; Liu, L.; Zhu, X.; Zhao, C.; Pan, Q. Convergent Multiagent Formation Control with Collision Avoidance. IEEE Trans. Robot. 2020, 36, 1805–1818. [Google Scholar] [CrossRef]
- Peddi, A.; Huan, L.; Bai, Y.; Kim, S. Development of Human Pose Analyzing Algorithms for the Determination of Construction Productivity in Real-Time. In Proceedings of the Construction Research Congress, Seattle, WA, USA, 5–7 April 2009. [Google Scholar]
- Calderon, W.T.; Roberts, D.; Golparvar-Fard, M. Synthesizing Pose Sequences from 3D Assets for Vision-Based Activity Analysis. J. Comput. Civ. Eng. 2021, 35, 04020052. [Google Scholar] [CrossRef]
- Guraliuc, A.R.; Barsocchi, P.; Potortì, F.; Nepa, P. Limb Movements Classification Using Wearable Wireless Transceivers. IEEE Trans. Inf. Technol. Biomed. 2011, 15, 474–480. [Google Scholar] [CrossRef] [Green Version]
- Amendola, S.; Bianchi, L.; Marrocco, G. Movement Detection of Human Body Segments: Passive radio-frequency identification and machine-learning technologies. IEEE Antennas Propag. Mag. 2015, 57, 23–37. [Google Scholar] [CrossRef]
- Joshua, L.; Varghese, K. Accelerometer-Based Activity Recognition in Construction. J. Comput. Civ. Eng. 2011, 25, 370–379. [Google Scholar] [CrossRef]
- Aloui, S.; Villien, C.; Lesecq, S. A new approach for motion capture using magnetic field: Models, algorithms and first results. Int. J. Adapt. Control. Signal Process. 2014, 29, 407–426. [Google Scholar] [CrossRef]
- Pradhananga, N.; Teizer, J. Automatic spatio-temporal analysis of construction site equipment operations using GPS data. Autom. Constr. 2013, 29, 107–122. [Google Scholar] [CrossRef]
- Costin, A.; Pradhananga, N.; Teizer, J. Leveraging passive RFID technology for construction resource field mobility and status monitoring in a high-rise renovation project. Autom. Constr. 2012, 24, 1–15. [Google Scholar] [CrossRef]
- Cheng, T.; Venugopal, M.; Teizer, J.; Vela, P.A. Performance evaluation of ultra wideband technology for construction resource location tracking in harsh environments. Autom. Constr. 2011, 20, 1173–1184. [Google Scholar] [CrossRef]
- Hildreth, J.; Vorster, M.; Martinez, J. Reduction of Short-Interval GPS Data for Construction Operations Analysis. J. Constr. Eng. Manag. 2005, 131, 920–927. [Google Scholar] [CrossRef]
- Teizer, J.; Vela, P. Personnel tracking on construction sites using video cameras. Adv. Eng. Inform. 2009, 23, 452–462. [Google Scholar] [CrossRef]
- Azar, E.R.; McCabe, B. Vision-Based Recognition of Dirt Loading Cycles in Construction Sites. In Proceedings of the Construction Research Congress, West Lafayette, IN, USA, 21–23 May 2012; pp. 1042–1051. [Google Scholar] [CrossRef]
- Hu, Y.; Chen, Q.; Feng, S.; Zuo, C. Microscopic fringe projection profilometry: A review. Opt. Lasers Eng. 2020, 135, 106192. [Google Scholar] [CrossRef]
- Wu, C.; Wang, X.; Chen, M.; Kim, M.J. Differential received signal strength based RFID positioning for construction equipment tracking. Adv. Eng. Inform. 2019, 42, 100960. [Google Scholar] [CrossRef]
- Zhou, Y.; Tian, L.; Zhu, C.; Jin, X.; Sun, Y. Video Coding Optimization for Virtual Reality 360-Degree Source. IEEE J. Sel. Top. Signal Process. 2020, 14, 118–129. [Google Scholar] [CrossRef]
- Ali, S.; Shah, M. Human Action Recognition in Videos Using Kinematic Features and Multiple Instance Learning. IEEE Trans. Pattern Anal. Mach. Intell. 2008, 32, 288–303. [Google Scholar] [CrossRef]
- Sheikh, Y.; Sheikh, M.; Shah, M. Exploring the space of a human action. In Proceedings of the Tenth IEEE International Conference on Computer Vision (ICCV’05), Beijing, China, 17–21 October 2005. [Google Scholar]
- Jiang, H.; Drew, M.S.; Li, Z.-N. Successive Convex Matching for Action Detection. In Proceedings of the 2006 IEEE Computer Society Conference on Computer Vision and Pattern Recognition (CVPR’06), New York, NY, USA, 17–22 June 2006. [Google Scholar]
- Liu, J.; Ali, S.; Shah, M. Recognizing human actions using multiple features. In Proceedings of the 2008 IEEE Conference on Computer Vision and Pattern Recognition, Anchorage, AK, USA, 23–28 June 2008; pp. 1–8. [Google Scholar]
- Zuo, C.; Sun, J.; Jialin, Z.; Zhang, J.; Asundi, A.; Chen, Q. High-resolution transport-of-intensity quantitative phase microscopy with annular illumination. Sci. Rep. 2017, 7, 1–22. [Google Scholar] [CrossRef] [PubMed]
- Khosrowpour, A.; Fedorov, I.; Holynski, A.; Niebles, J.C.; Golparvar-Fard, M. Automated Worker Activity Analysis in Indoor Environments for Direct-Work Rate Improvement from Long Sequences of RGB-D Images. In Proceedings of the Construction Research Congress, Atlanta, GA, USA, 19–21 May 2014; pp. 729–738. [Google Scholar] [CrossRef]
- Thomas, H.R.; Daily, J. Crew Performance Measurement Via Activity Sampling. J. Constr. Eng. Manag. 1983, 109, 309–320. [Google Scholar] [CrossRef]
- Shou, W.; Wang, J.; Wu, P.; Wang, X.; Chong, H.-Y. A cross-sector review on the use of value stream mapping. Int. J. Prod. Res. 2017, 55, 3906–3928. [Google Scholar] [CrossRef]
- Cao, Z.; Hidalgo Martinez, G.; Simon, T.; Wei, S.-E.; Sheikh, Y.A. OpenPose: Realtime Multi-Person 2D Pose Estimation using Part Affinity Fields. IEEE Trans. Pattern Anal. Mach. Intell. 2019, 1, 172–186. [Google Scholar] [CrossRef] [PubMed] [Green Version]
- Zhang, J.; Shen, C. Set-Based Obfuscation for Strong PUFs Against Machine Learning Attacks. IEEE Trans. Circuits Syst. I Regul. Pap. 2021, 68, 288–300. [Google Scholar] [CrossRef]
- Simonyan, K.; Zisserman, A. Very deep convolutional networks for large-scale image recognition. arXiv 2014, arXiv:1409.1556. [Google Scholar]
- Yang, S.; Gao, T.; Wang, J.; Deng, B.; Lansdell, B.; Linares-Barranco, B. Efficient Spike-Driven Learning with Dendritic Event-Based Processing. Front. Neurosci. 2021, 15, 97. [Google Scholar] [CrossRef]
- Ionescu, C.; Papava, D.; Olaru, V.; Sminchisescu, C. Human3.6M: Large Scale Datasets and Predictive Methods for 3D Human Sensing in Natural Environments. IEEE Trans. Pattern Anal. Mach. Intell. 2014, 36, 1325–1339. [Google Scholar] [CrossRef]
- Xue, X.; Zhang, K.; Tan, K.C.; Feng, L.; Wang, J.; Chen, G.; Zhao, X.; Zhang, L.; Yao, J. Affine Transformation-Enhanced Multifactorial Optimization for Heterogeneous Problems. IEEE Trans. Cybern. 2020, 1–15. [Google Scholar] [CrossRef]
- Pitelis, N.; Russell, C.; Agapito, L. Learning a manifold as an atlas. In Proceedings of the 26th IEEE Conference on Computer Vision and Pattern Recognition, Portland, OR, USA, 23–28 June 2013; pp. 1325–1339. [Google Scholar]
- Tome, D.; Russell, C.; Agapito, L. Lifting from the Deep: Convolutional 3D Pose Estimation from a Single Image. In Proceedings of the 2017 IEEE Conference on Computer Vision and Pattern Recognition (CVPR), Honolulu, HI, USA, 21–26 July 2017; pp. 5689–5698. [Google Scholar]
- Zhang, J.; Qu, G. Physical Unclonable Function-Based Key Sharing via Machine Learning for IoT Security. IEEE Trans. Ind. Electron. 2019, 67, 7025–7033. [Google Scholar] [CrossRef]
- Zhang, K.; Zhang, J.; Ma, X.; Yao, C.; Zhang, L.; Yang, Y.; Wang, J.; Yao, J.; Zhao, H. History Matching of Naturally Fractured Reservoirs Using a Deep Sparse Autoencoder. SPE J. 2021, 1–21. [Google Scholar] [CrossRef]
- Ding, L.; Huang, L.; Li, S.; Gao, H.; Deng, H.; Li, Y.; Liu, G. Definition and Application of Variable Resistance Coefficient for Wheeled Mobile Robots on Deformable Terrain. IEEE Trans. Robot. 2020, 36, 894–909. [Google Scholar] [CrossRef]
- Shaikhina, T.; Lowe, D.; Daga, S.; Briggs, D.; Higgins, R.; Khovanova, N. Decision tree and random forest models for outcome prediction in antibody incompatible kidney transplantation. Biomed. Signal Process. Control. 2019, 52, 456–462. [Google Scholar] [CrossRef]
- Li, B.-H.; Liu, Y.; Zhang, A.-M.; Wang, W.-H.; Wan, S. A Survey on Blocking Technology of Entity Resolution. J. Comput. Sci. Technol. 2020, 35, 769–793. [Google Scholar] [CrossRef]
- Belgiu, M.; Drăguţ, L. Random forest in remote sensing: A review of applications and future directions. ISPRS J. Photogramm. Remote Sens. 2016, 114, 24–31. [Google Scholar] [CrossRef]
- Li, H.; Chen, D.; Zhang, H.; Wu, C.; Wang, X. Hamiltonian analysis of a hydro-energy generation system in the transient of sudden load increasing. Appl. Energy 2017, 185, 244–253. [Google Scholar] [CrossRef] [Green Version]
- Qu, X.; Yu, Y.; Zhou, M.; Lin, C.-T.; Wang, X. Jointly dampening traffic oscillations and improving energy consumption with electric, connected and automated vehicles: A reinforcement learning based approach. Appl. Energy 2020, 257, 114030. [Google Scholar] [CrossRef]
- Song, Y.; Wang, X.; Wright, G.; Thatcher, D.; Wu, P.; Felix, P. Traffic Volume Prediction with Segment-Based Regression Kriging and its Implementation in Assessing the Impact of Heavy Vehicles. IEEE Trans. Intell. Transp. Syst. 2019, 20, 232–243. [Google Scholar] [CrossRef]
- Hsu, C.-W.; Lin, C.-J. A comparison of methods for multiclass support vector machines. IEEE Trans. Neural Networks 2002, 13, 415–425. [Google Scholar] [CrossRef] [Green Version]


| Activity Category | No. of Samples | Sum |
|---|---|---|
| Class 1: Working | 811 | 1731 |
| Class 2: Transporting | 779 | |
| Class 3: Idling | 141 |
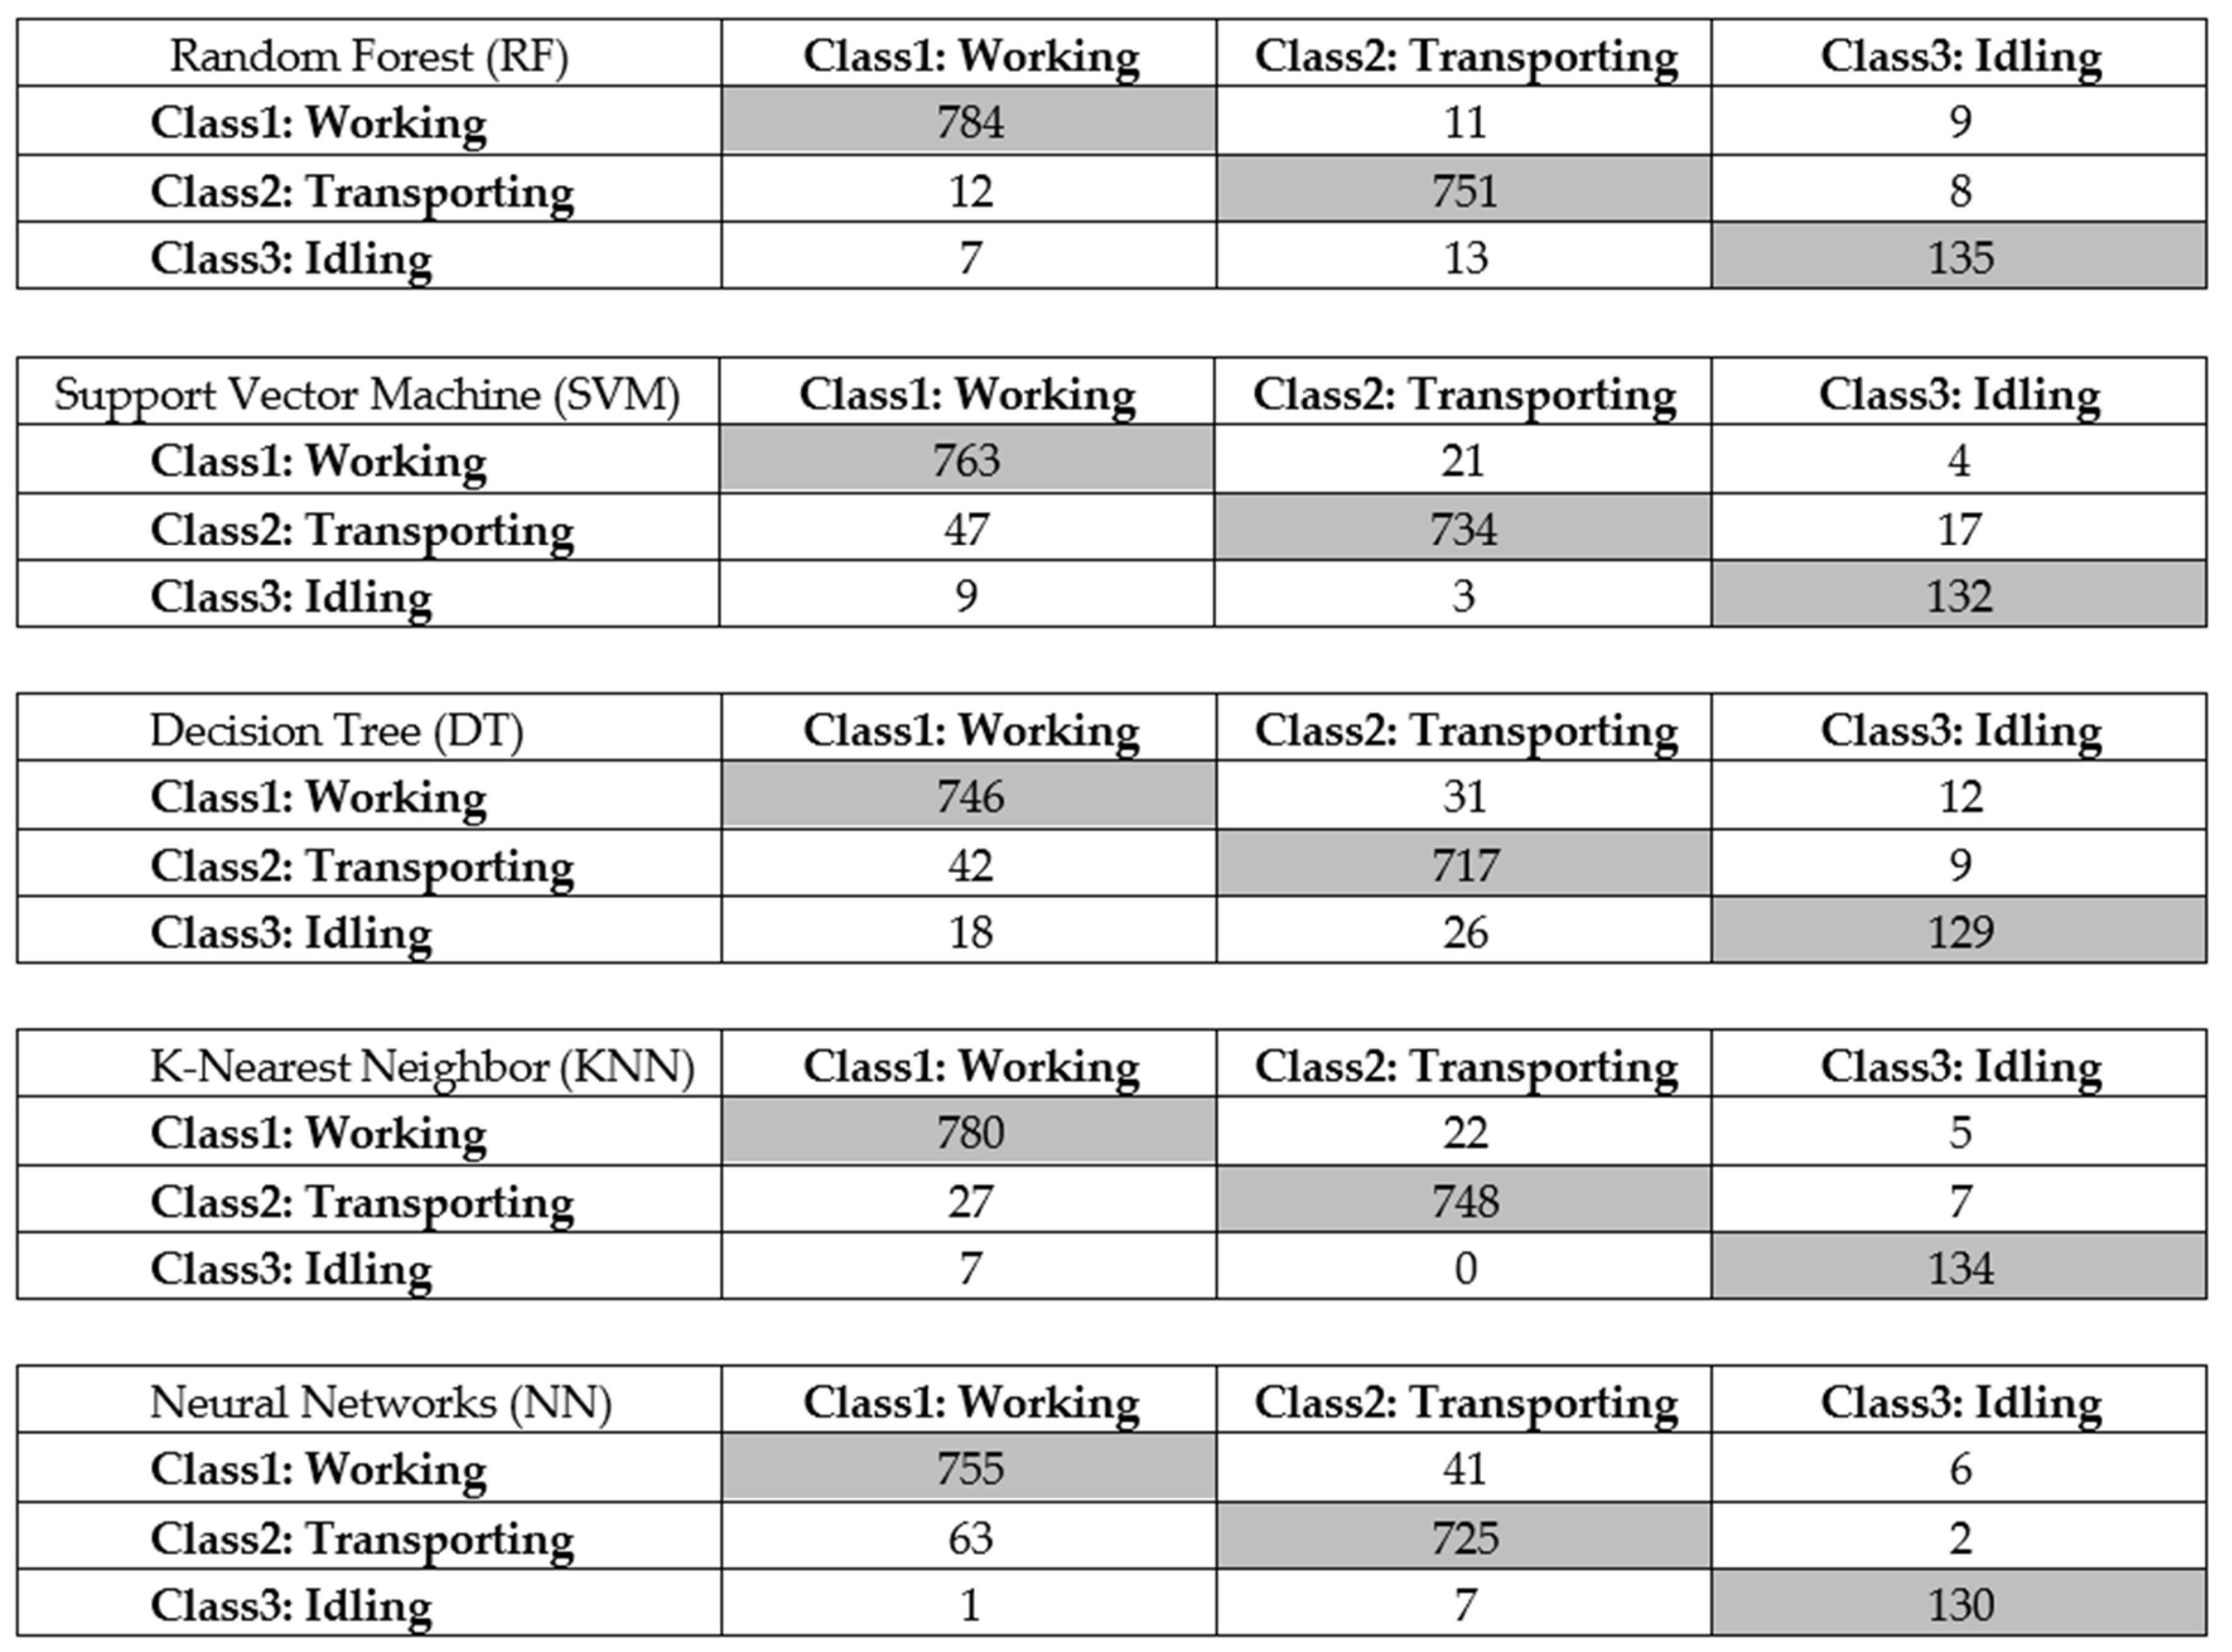
| Classifier | Accuracy | Macroaverage Recall | Macroaverage Precision | Average_F1 Score |
|---|---|---|---|---|
| RF | 96.58% | 0.9445 | 0.9405 | 0.9422 |
| SVM | 94.24% | 0.9209 | 0.9349 | 0.9273 |
| DT | 92.08% | 0.9040 | 0.8749 | 0.8880 |
| KNN | 96.13% | 0.9492 | 0.9578 | 0.9537 |
| NN | 93.12% | 0.9339 | 0.9337 | 0.9337 |
| #Clip | Length (s) | Number of Frames | Frame Interval (s) | Shot Angle |
|---|---|---|---|---|
| 1 | 03:26 | 102 | 2 | Kneel level |
| 2 | 01:56 | 118 | 1 | Chest level |
| 3 | 01:19 | 79 | 1 | Overhead |
Publisher’s Note: MDPI stays neutral with regard to jurisdictional claims in published maps and institutional affiliations. |
© 2021 by the authors. Licensee MDPI, Basel, Switzerland. This article is an open access article distributed under the terms and conditions of the Creative Commons Attribution (CC BY) license (https://creativecommons.org/licenses/by/4.0/).
Share and Cite
Ying, W.; Shou, W.; Wang, J.; Shi, W.; Sun, Y.; Ji, D.; Gai, H.; Wang, X.; Chen, M. Automatic Scaffolding Workface Assessment for Activity Analysis through Machine Learning. Appl. Sci. 2021, 11, 4143. https://0-doi-org.brum.beds.ac.uk/10.3390/app11094143
Ying W, Shou W, Wang J, Shi W, Sun Y, Ji D, Gai H, Wang X, Chen M. Automatic Scaffolding Workface Assessment for Activity Analysis through Machine Learning. Applied Sciences. 2021; 11(9):4143. https://0-doi-org.brum.beds.ac.uk/10.3390/app11094143
Chicago/Turabian StyleYing, Wenzheng, Wenchi Shou, Jun Wang, Weixiang Shi, Yanhui Sun, Dazhi Ji, Haoxuan Gai, Xiangyu Wang, and Mengcheng Chen. 2021. "Automatic Scaffolding Workface Assessment for Activity Analysis through Machine Learning" Applied Sciences 11, no. 9: 4143. https://0-doi-org.brum.beds.ac.uk/10.3390/app11094143