Article

Limitations of Structural Insight into Ultrafast Melting of Solid Materials with X-ray Diffraction Imaging

1
Institute of Nuclear Physics, Polish Academy of Sciences, Radzikowskiego 152, 31-342 Kraków, Poland
2
European XFEL GmbH, Holzkoppel 4, 22869 Schenefeld, Germany
3
Center for Free-Electron Laser Science CFEL, Deutsches Elektronen-Synchrotron DESY, Notkestrasse 85, 22607 Hamburg, Germany
4
The Hamburg Center for Ultrafast Imaging, Luruper Chaussee 149, 22761 Hamburg, Germany
5
Department of Physics, University of Hamburg, Jungiusstrasse 9, 20355 Hamburg, Germany
6
Institute of Physics, Czech Academy of Sciences, Na Slovance 2, 18221 Prague, Czech Republic
7
Institute of Plasma Physics, Czech Academy of Sciences, Za Slovankou 3, 18200 Prague, Czech Republic
*
Authors to whom correspondence should be addressed.
Submission received: 7 April 2021 / Revised: 21 May 2021 / Accepted: 27 May 2021 / Published: 2 June 2021
(This article belongs to the Special Issue Latest Trends in Free Electron Lasers)

Abstract

:
In this work, we analyze the application of X-ray diffraction imaging techniques to follow ultrafast structural transitions in solid materials using the example of an X-ray pump–X-ray probe experiment with a single-crystal silicon performed at a Linac Coherent Light Source. Due to the spatially non-uniform profile of the X-ray beam, the diffractive signal recorded in this experiment included contributions from crystal parts experiencing different fluences from the peak fluence down to zero. With our theoretical model, we could identify specific processes contributing to the silicon melting in those crystal regions, i.e., the non-thermal and thermal melting whose occurrences depended on the locally absorbed X-ray doses. We then constructed the total volume-integrated signal by summing up the coherent signal contributions (amplitudes) from the various crystal regions and found that this significantly differed from the signals obtained for a few selected uniform fluence values, including the peak fluence. This shows that the diffraction imaging signal obtained for a structurally damaged material after an impact of a non-uniform X-ray pump pulse cannot be always interpreted as the material’s response to a pulse of a specific (e.g., peak) fluence as it is sometimes believed. This observation has to be taken into account in planning and interpreting future experiments investigating structural changes in materials with X-ray diffraction imaging.

1. Introduction

Under irradiation with intense femtosecond laser pulses, solids may undergo rapid structural phase transitions. In particular, ultrafast nonthermal melting in semiconductors attracts attention. At a pulse intensity that is sufficiently high, such nonthermal melting induces a loss of atomic periodicity in a semiconductor crystal on a femtosecond timescale without any significant increase in the observed ion temperature [1,2]. Understanding the dependence of the nonthermal melting on light pulse parameters and beam geometry could enable control of this ultrafast process. This would open a prospect for high-precision processing of silicon and other semiconducting materials with wide-ranging scientific and technological applications.
Nonthermal melting occurs after the absorption of a large amount of photons (typically leading to an absorbed dose of ≥1 eV/atom), which triggers a massive excitation of electrons into the conduction band and their subsequent thermalization through collisional processes. As a result, anti-bonding states become populated, and bonding states become depleted. This induces atomic dynamics, which result in a transformation of the material structure. Experimentally, such transitions were first observed for materials irradiated with high-fluence lasers at near-infrared or visible wavelengths [1,3,4,5,6,7,8,9,10]. Currently, free-electron lasers (FELs) [11], emitting photons in the ultraviolet and X-ray range, can also generate pulses intense enough to trigger nonthermal melting in semiconductors after a single shot. Such X-ray-induced transformations have been experimentally observed, e.g., in silicon [12], and in diamond [13].
In parallel to the measurements, a dedicated theory apparatus has been developed to study light-induced nonthermal processes. In the infrared regime, radiation-triggered nonthermal melting of silicon has been studied in detail, e.g., in [2,14,15,16,17]. For studying the response of materials to X-ray irradiation, a dedicated hybrid approach has been developed [18]. The resulting code, XTANT (see next section for details) has been so far successfully applied to model ultrafast X-ray-induced structural transitions in carbon and in silicon materials [18,19,20].
The code applicability is currently restricted to femtosecond timescales, which correspond to the timescales of the pump and probe pulse, and the delays between them. Extension of the code to longer timescales would require the consideration of long-timescale processes, such as, e.g., nucleation and solidification [21,22]. Such computationally expensive extension is not required for the present work, which focuses on X-ray diffraction studies.
Diffraction imaging experiments, performed at various XFEL facilities, exploit the ultrabright, ultrashort X-ray pulses to determine the structure of matter, in particular, of nanoparticles and biomolecules [23,24]. This powerful technique is being improved in its spatial resolution [25,26,27] toward atomic resolution. It can also provide an access to ultrafast dynamics within X-ray-irradiated samples with femtosecond temporal resolution [28], using the X-ray pump–X-ray probe experimental scheme.
In particular, this should enable the study of ultrafast structural transitions in solid materials, triggered by an X-ray pump pulse. However, the results of such experiments have to be interpreted with care [24,28], due to the non-uniformity of the X-ray beam [29]. As the imaged object, e.g., a single crystal, is large in comparison with the beam focal size, the imaging signal includes contributions from the crystal regions illuminated weaker or stronger, depending on their position in respect to the beam focus. The total diffraction signal recorded will then be a superposition of the contributions from the different crystal regions [29] and has to be interpreted and modeled as such.
In what follows, we will demonstrate in detail this limitation of diffractive imaging technique on the example of ultrafast nonthermal melting in Si crystals, which has been recently observed in the experiment performed at the Linac Coherent Light Source (LCLS) facility by Pardini et al. [12]. First, we will obtain theoretical predictions for the evolution of single silicon crystals irradiated with spatially uniform X-ray pulses of various fluences. Second, using the verified experimental pulse parameters, we will construct the total diffraction signal from the spatially non-uniform X-ray pulse, such as the one used in the experiment. We will then compare the signal to the diffraction signals obtained with the spatially uniform X-ray pulses and discuss the outcome. After, we will present our conclusions.

2. Materials and Methods

2.1. Simulations of X-ray-Irradiated Solid Materials with XTANT Code

In order to understand the dynamics of ultrafast melting in detail, we performed respective theoretical simulations, using the irradiation parameters from the above-mentioned pump-probe study [12]. For these simulations, we applied our hybrid code XTANT (X-ray-induced Thermal And Nonthermal Transitions) [18,19,20,30]. The code consists of a few modules dedicated to simulate various processes induced by incoming X-ray FEL radiation:
(a)
The core of the model is the transferable tight binding (TB) Hamiltonian, which treats the electronic band structure and atomic potential energy surface. The latter evolves in time, depending on the positions of atoms in the simulation box. Periodic boundary conditions are applied. Tight-binding parametrization from [31] is used here.
(b)
Atomic positions are propagated in time, using a classical molecular dynamics (MD) scheme. It solves Newton equations for nuclei with the potential energy surface evaluated from the TB module.
(c)
Electron occupation numbers on the transient energy levels are assumed to follow the Fermi–Dirac distribution with a transient temperature and chemical potential evolving in time. The electron temperature changes due to the interaction of band electrons with X-rays and high-energy electrons or due to their nonadiabatic interaction with nuclei (through electron-ion scattering [19]).
(d)
The non-equilibrium part of the electron distribution at high energies and Auger decays of core holes are treated with a classical event-by-event Monte Carlo (MC) simulation. This stochastically models the X-ray-induced photoelectron emission from the K-shell or from the valence band, the Auger decays, and the scattering of high-energy electrons.
(e)
Electron-ion energy exchange is calculated with a nonadiabatic approach [19], in which matrix elements are calculated as an overlap of TB wave-functions plugged into the Boltzmann collision integral. This energy is transferred to atoms by respective velocity scaling at each MD step.
This combined approach allows the treatment of predominant processes within an X-ray FEL-irradiated sample, including the non-equilibrium evolution stage, thermal and nonthermal processes, and phase transitions [32]. In particular, all X-ray-induced processes that excite electrons are taken into account in the model. However, they have different probabilities. For example, in case of hard X-ray-irradiation of Si, the electron excitation from a core level (with the resulting Auger decay) is the most probable one. Please also note that the X-ray-induced electronic excitation ends within ∼ten femtoseconds after the X-ray pulse is over. After this time, only collisional processes and electron-lattice energy exchange contribute to the evolution of electronic distribution.
Ballistic electrons are considered in our model as high energy electrons. In the bulk material, which we simulate here, they propagate within the restriction of periodic boundaries. We checked that the corresponding electron range was below 250 nm (according to our dedicated simulation tool XCascade3D [33]), i.e., much smaller than the laser spot size. Since the actual absorbed energy distribution is typically even narrower than the electron range [34], the fast electron escape should not influence the spatial distribution of the absorbed dose.
XTANT simulates the dynamics using periodic boundary conditions. Our final simulations were preceded by careful convergence studies in respect to the supercell size. They showed that, for this type of simulation (performed within the bulk material under the pulse conditions corresponding to the current experiment), the calculations with a 216-atom-large supercell provided a sufficient accuracy for the results. Therefore, for the current simulations, a supercell containing 216 atoms was used.
In the code, at each time step, there is an intrinsic averaging over 30,000 Monte Carlo realizations of the electron (and core hole) trajectories performed in order to calculate the average electronic distribution, which is then applied at the next time step. All observables shown in the paper were averaged over five different molecular dynamics realizations. We checked through dedicated tests that this was statistically reliable for our system.

2.2. Description of the Experimental Data, Including Beam Characteristics

Below, we recall the details of the experiment presented in [12]. During this measurement, single silicon crystals cut out in the silicon wafer [35], were irradiated with 5.95 keV X-ray photons. Pulse duration was 25 fs FWHM. The pulse was split into a pump and a probe beam, arriving with various delays. The delay between the pump and the probe was in the range between 100 and 400 fs. According to the authors of [12], the focused hard X-ray beam yielded an average absorbed dose of ∼4eV/atom (with a peak dose up to 9 eV/atom) on the material surface.
For the purpose of the actual model calculations, we re-estimated the dose value: (i) approximating the spatial pulse profile as a 2D Gaussian function in the plane perpendicular to the propagation direction of X rays, (ii) assuming a Gaussian temporal pulse profile, and (iii) using the information on the fraction of the pump pulse energy absorbed within an elliptical limiting contour from the wave front propagation simulations presented in [12] (Figure 2 in [12]). The simulations were shown to agree well with the independent beam imprint analysis performed in [12]. Vertical projection of the pulse profile in the simulated intensity plot indicated its non-Gaussian shape.
As our modeling tool can currently use only a 2D Gaussian pulse profile for the volume integration of the scattering amplitude (see section below), we recalculated the dose, approximating the spatial pulse profile as a 2D Gaussian function. From the information in Figure 2 of [12] on the fraction of the pump pulse energy absorbed within an elliptical limiting contour (65%) and the limiting dose at the contour ( 1.5 eV/atom), we estimated the parameters of the 2D Gaussian pulse corresponding to this energy deposition. For that 2D Gaussian pulse, the estimated peak dose on the surface was 4.28 eV/atom.
Note the difference with the peak dose of 9 eV/atom dose for the initial non-Gaussian pulse in [12]. The recalculation of the surface dose into the average absorbed dose, i.e., the absorbed dose within the material layer down to the photon penetration depth (see e.g., [34]) yielded a peak dose of 2.70 eV/atom within the layer. We used this dose as the maximal dose for the simulations in the paper. It is comparable with the doses considered in our previous studies on X-ray-induced structural transitions in Si [36].
Below, we list for clarity all the assumptions applied in our simulations for the beam characteristics and give their justification. These approximations are frequently applied in the interpretation of X-ray pump-X-ray probe experimental results with XFELs (see, e.g., [37,38,39]).
(i)
The “average” 2D Gaussian spatial profile was used. As the signal was integrated over different X-ray shots, obtained with pulses of differing spatial characteristics, the “average” 2D Gaussian spatial profile used for our calculations was a reliable approximation.
(ii)
Gaussian temporal pulse profile was used. The pump-probe experiment was performed at X-ray fluences still within a linear absorption regime (i.e., with the X-ray photoabsorption rate only linearly dependent on the pulse intensity). Therefore, the specific spiky time characteristics of the pulse intensity in each shot did not play much role for the sample evolution (and sample imaging). The respective check was performed in [32]. The final experimental signal did not originate from a single shot but was integrated over signals resulting from many different FEL shots. This justifies the usage of a Gaussian temporal pulse as the “average” case.
(iii)
Assumed uniform illumination of the material in the region above the X-ray penetration depth. The volume averaging of the signal was restricted to the volume averaging in the plane lateral to the X-ray beam, because, as we show in the next subsection, one could neglect with a good accuracy all signal contributions to the volume integration below the X-ray penetration depth, and treat the region in the material above the penetration depth as uniformly illuminated.

2.3. Volume Integration of Diffraction Signal

The structural response of the sample was monitored by the measured strength of the Si (333) Bragg reflection of the probe pulse. It was initially claimed (see [12]) that the peak intensity started to decrease only after 150 ± 40 fs. This delayed onset was originally explained in [12] as due to the time needed to complete secondary electron cascading [33,40] and to achieve electron thermalization. Such thermalization should precede a structural transformation of the irradiated material.
However, as the spatial profile of the pump and probe pulse was non-uniform in this experiment, various regions of the crystal experienced different X-ray fluences during the pump pulse depending on their distance to the beam focus. The amplitude of the diffracted probe pulse summed up coherent contributions from various crystal subunits that were differently affected by the beam. Therefore, the experiment recorded a volume integrated signal (i.e., the absolute square of the amplitude), combining the contributions from crystal regions with various absorbed doses.
For the calculation of the scattered X-ray intensity, we used the code XSINC [29]. This takes into account a spatially non-uniform profile (approximated to be Gaussian) of the X-ray pump and probe pulses. The X-ray probed region in the bulk crystal is divided into smaller crystal subunits. Their size is kept small so that a uniform pulse fluence can be assumed in each subunit. Various subunits experience different X-ray fluences during the pump pulse, depending on their distance to the beam focus.
The pump-pulse-induced atomic dynamics in each subunit are calculated with the code XTANT, which delivers information on the actual atomic positions and electron density at each time step. Five dynamic realizations are calculated for each fluence point. For each crystal subunit, a realization of the XTANT simulated dynamics was chosen randomly. The respective contribution of the subunit to the amplitude of the diffracted probe pulse was then calculated. The amplitude of the diffracted probe pulse was a coherent sum of the contributions from all subunits.
In this way, the volume-integrated diffraction signal (i.e., the absolute square of the amplitude) from the entire X-ray-probed region was calculated. Eleven fluence points, covering the range of 0 to 100% of the maximal fluence with 10% steps, were used for constructing the volume-integrated signal.
Let us emphasize that this volume integration takes into account only the inhomogeneity of the irradiation in the plane ( x , y ) lateral to the X-ray beam, and not in the material depth. However, as the beam intensity is exponentially absorbed in the material, the actual dose of the pump pulse absorbed in the material at ( x , y ) changes with the depth, z in the material. We neglect this inhomogeneity in z, assuming a uniform absorbed dose for the pump pulse equal to the difference between the surface dose at z = 0 and the dose at the material depth corresponding to the X-ray penetration depth. This yields the ( 1 1 / e ) fraction of the surface dose at ( x , y ) . The justification is the following: the cross section for the elastic scattering of X-rays in Si for the photon wavelength of 5.95 keV is only a very small fraction (0.7%) of the total X-ray scattering cross section [41]. This implies that the intensity of the elastically scattered coherent X-rays is only a minor fraction of the incoming X-ray intensity of the probe pulse.
As these incoming X-rays are strongly absorbed in the material, the actual fraction of the Bragg-scattered X-ray signal will be exponentially attenuated with the increasing z. In addition, the coherently scattered signal will also be exponentially attenuated while passing through the crystal toward the detector. Therefore, we can neglect, with good accuracy, all contributions to the volume integrated signal from the regions below the X-ray penetration depth and assume the uniform dose as described above in the region above the penetration depth.
Any secondary electron escape from the beam focus can be with a good accuracy neglected as the maximal electron range following the ∼6 keV photon irradiation is less than 0.3 m in Si, i.e., smaller than the considered focus size (∼a few m [12]).

3. Results

In order to obtain an insight into the ionization dynamics occurring in various parts of the crystal (with respect to the beam focus), below, we show the XTANT predictions for three fluence values, corresponding to 100%, 50%, and 10% of the nominal fluence, which yielded the average absorbed doses of 2.70 , 1.35 , and 0.27 eV/atom, respectively, within the Si layer down to the photon penetration depth (∼30m for 5.95 keV photons).
Our simulations predict that the sample evolution proceeds as a sequence of steps, similarly to the graphitization and amorphization of diamond as described in [30,42]. First, atoms are ionized by energetic X-ray photons. The predominant ionization channel is the excitation of photoelectrons from the K-shells of the Si atoms. The core holes relax predominantly through Auger decay (KLL) on the timescale of 1.5 fs [43], emitting Auger electrons. Figure 1a shows the number of K-shell holes per atom as a function of time. By ∼30 fs after the maximum of the pump pulse all core holes have decayed.
Further, high energy electrons released by X-ray photons and during Auger processes ionize atoms collisionally [33,40]. The fraction of those non-thermalized electrons is shown in Figure 1b. The subsequent electron cascading saturates by ∼100 fs. As a result, valence electrons are excited into the conduction band during and for some time after the pulse. Figure 1c shows that, for 100% of the nominal fluence, the number of thermalized electrons in the conduction band reaches 13% already during the exposure to the pump pulse, exceeding the threshold for nonthermal structural damage in silicon (∼7–10%) [34]. This damage threshold denotes the minimal fraction of excited electrons (calculated with respect to the initial number of valence electrons per atom), which is needed to initiate a nonthermal structural transition in silicon.
For the lower fluence values (50% and 10% of the estimated nominal fluence), the excited electron fraction stayed below 8% and 2%, respectively. In the case of 50% of the nominal fluence (which yields the lower limit of the nonthermal damage threshold), the irradiated crystal subunit will most likely undergo a thermal structural transition where the damage threshold lies for silicon at ∼5–7% [34]. This transition is much slower than the nonthermal melting, typically occurring on a picosecond timescale. For the case of 10% of the nominal fluence, the fraction of thermalized electrons in the conduction band stayed below both the thermal and nonthermal damage thresholds, and, therefore, neither thermal nor nonthermal structural transition are expected.
The energy absorbed during X-ray irradiation is initially transferred only to the electronic system. Thermalized electrons within the valence and the conduction band become quickly heated. This is reflected by the fast increase of the electron temperature (Figure 1c) for thermalized electrons in the valence and conduction bands, which occurs on a timescale of electron excitation. Maximal levels of electron excitation are already reached within 50 fs (for 10% of the nominal fluence) up to 100 fs (for 100% of the nominal fluence) since the maximum of the pump pulse. By that time also all K-shell holes have decayed.
The atomic system then still remains cold, as the 100 fs timescale is too short for advancing a significant energy exchange between the hot electronic system and the lattice. Let us recall that the electron-lattice thermalization typically occurs on a picosecond timescale [18]. A lattice temperature below the melting point clearly indicates that the structural transition observed at the 100% of the nominal pump fluence is predominantly nonthermal.
Figure 2 shows the calculated atomic structure in a Si crystal at 500 fs after the maximum of the pump pulse. As expected, at the highest absorbed dose (corresponding to 100% of the nominal fluence), there is a lattice disorder present in the system. This indicates that silicon amorphization due to nonthermal melting significantly progressed in this time. For the medium dose, only some local atomic disorder can be observed, i.e., the thermal structural transition is still ongoing there. In the case of the lowest dose (10% of the nominal fluence), which lies below any structural damage threshold, the crystal atomic order is fully preserved.
A comparison of the model predictions with the Si(333) Bragg reflection recorded in the experiment by Pardini et al. is shown in Figure 3. First, let us emphasize here that the temporal characteristics of the signal decay strongly depend on the radiation dose absorbed in the crystal. If (as a study case) we used a spatially uniform pump pulse of the 100% nominal fluence, the predicted decrease of the probe signal would start already at ∼50 fs after the maximum of the pump pulse and complete at ∼500 fs, dropping finally below the value of ∼0.1 of the initial signal.
Such a rapid signal decay is completely inconsistent with the experimental data. In contrast, for the lowest fluence value (10%), the signal oscillates; however, its average value remains unchanged at all times. We attribute these oscillations to the displacive excitation of coherent phonons [44]. In the case of ultrafast intense X-ray irradiation such coherent phonon modes can be observed in the excited materials. For the respective theoretical explanation, see, e.g., [45]. Due to the non-uniform irradiation of the crystal by the pump pulse in experiment, a proper volume integration of the scattering amplitude over the probed crystal region is necessary in order to compare the experimental data with theoretical results. In what follows, we will only consider the volume averaging in the plane lateral to the X-ray beam (see the ’Materials and Methods’ section for detailed justification).
We performed volume integration for the theoretically predicted signal, and compared the result to the experimental data from Figure 3 in [12].
These predictions were obtained, using the code XSINC [29] developed to coherently calculate a scattered X-ray signal from samples exhibiting non-uniform dynamics of atoms (see the ’Materials and Methods’ section for more details). Here, it was applied to the snapshots of sample arrangement obtained with the code XTANT. For the current calculations, we used atomic scattering factors for neutral Si atoms, as the average ionization degree per Si atom for all fluences considered was low, reaching maximally 0.56 per atom at the 100% nominal fluence.
This ionization degree led to the decrease of the scattering factor by only 4% for the momentum transfer, q = 0 . The theoretical and experimental results were in good agreement, except for the data point at 150 ± 40 fs, which our volume-integrated predictions did not reproduce. However, after completing our calculations, we became aware of the recently published Erratum [12]. The authors indicated that the first experimental data point recorded at 150 fs was unreliable. Thus, it should be excluded from the comparison.
The very good agreement between our predictions and the experimental data on the total diffractive signal was due to the fact that the experimentally recorded signal indeed included local contributions from differently irradiated regions of the crystal. This implies that the recorded data points cannot be interpreted as resulting from a specific process occurring after the absorption of a single specific radiation dose by Si crystal, as was initially suggested in [12].

4. Discussion and Conclusions

To summarize, we modeled ultrafast melting in a single silicon crystal triggered by an intense hard X-ray pulse under different pulse fluence conditions. We identified the specific mechanisms contributing to the Si melting (including their temporal characteristics) as a function of the pulse fluence under uniform illumination. The reason for the observed strong fluence dependence is that the fluence determines the strength of the initial electronic excitation in the system, necessary to trigger a nonthermal or thermal structural transition. At the conditions of the experiment by Pardini et al. [12], the pulse of 100% nominal fluence (peak absorbed dose ∼2.70 eV/atom) triggered an ultrafast nonthermal transition, whereas the same pulse with a 50% fluence fraction yielded a thermal transition only. At 10% of the nominal fluence, no structural damage occurred in the sample.
We showed that, due to the non-uniform spatial profile of the X-ray beam used in the experiment, the recorded diffractive signal was a volume-integrated signal, i.e., its amplitude is a coherent sum of the contributions from various parts of the crystal, experiencing different local doses. This enabled a correct interpretation of the experimental data with the volume-integrated signal calculated from the simulations. This observation implies that possible effects of volume integration, due to the beam non-uniformity and the relation between the beam size and the imaged object size have to be considered in planning and interpreting future experiments investigating structural changes in solid materials with X-ray diffraction imaging. This should also support the development of techniques for ‘shaping’ the spatial profile of X-ray beams, which could reduce or even eliminate the effect of volume integration.

Author Contributions

Conceptualization, V.T., M.M.A., Z.J. and B.Z.; methodology, all authors; software, V.T., M.M.A., Z.J., N.M. and V.L.; validation, V.T., V.L., M.M. and B.Z.; investigation, all authors; writing, V.T. and B.Z. All authors have read and agreed to the published version of the manuscript.

Funding

This research was partially funded by the Czech Ministry of Education, Youth and Sports, Czech Republic, grant numbers LTT17015, LM2015083 (acknowledged by N.M.). The authors V.T., N.M., V.L. and B.Z. acknowledge the networking support by the COST Action CA17126.

Institutional Review Board Statement

Not applicable.

Informed Consent Statement

Not applicable.

Data Availability Statement

Not applicable.

Acknowledgments

The authors thank A. Aquila, T. Pardini, and S. Toleikis for valuable discussions.

Conflicts of Interest

The authors declare no conflict of interest.

Abbreviations

FELFree Electron Laser
LCLSLinac Coherent Light Source
XTANTX-ray Thermal and Nonthermal Transitions
XSINCX-ray Scattering in Nanocrystals
FWHMFull Width at Half Maximum

References

  1. Rousse, A.; Rischel, C.; Fourmaux, S.; Uschmann, I.; Sebban, S.; Grillon, G.; Balcou, P.; Förster, E.; Geindre, J.P.; Audebert, P.; et al. Non-thermal melting in semiconductors measured at femtosecond resolution. Nature 2001, 410, 65. [Google Scholar] [CrossRef] [PubMed]
  2. Sundaram, S.K.; Mazur, E. Inducing and probing non-thermal transitions in semiconductors using femtosecond laser pulses. Nat. Mat. 2002, 1, 217. [Google Scholar] [CrossRef] [PubMed]
  3. Sokolowski-Tinten, K.; Bialkowski, J.; von der Linde, D. Ultrafast laser-induced order-disorder transitions in semiconductors. Phys. Rev. B 1995, 51, 14186. [Google Scholar] [CrossRef]
  4. Lindenberg, A.M.; Larsson, J.; Sokolowski-Tinten, K.; Gaffney, K.J.; Blome, C.; Synnergren, O.; Sheppard, J.; Caleman, C.; MacPhee, A.G.; Weinstein, D.; et al. Atomic-Scale Visualization of Inertial Dynamics. Science 2005, 308, 392. [Google Scholar] [CrossRef] [Green Version]
  5. Gaffney, K.J.; Lindenberg, A.M.; Larsson, J.; Sokolowski-Tinten, K.; Blome, C.; Synnergren, O.; Sheppard, J.; Caleman, C.; MacPhee, A.G.; Weinstein, D.; et al. Observation of Structural Anisotropy and the Onset of Liquidlike Motion During the Nonthermal Melting of InSb. Phys. Rev. Lett. 2005, 95, 125701. [Google Scholar] [CrossRef]
  6. Hillyard, P.B.; Gaffney, K.J.; Lindenberg, A.M.; Engemann, S.; Akre, R.A.; Arthur, J.; Blome, C.; Bucksbaum, P.H.; Cavalieri, A.L.; Deb, A.; et al. Carrier-Density-Dependent Lattice Stability in InSb. Phys. Rev. Lett. 2007, 98, 125501. [Google Scholar]
  7. Siders, C.W.; Cavalleri, A.; Sokolowski-Tinten, K.; Tóth, C.S.; Guo, T.; Kammler, M.; Horn von Hoegen, M.; Wilson, K.R.; von der Linde, D.; Barty, C.P.J. Detection of Nonthermal Melting by Ultrafast X-ray Diffraction. Science 1999, 286, 1340. [Google Scholar] [CrossRef] [PubMed]
  8. Sciaini, G.; Harb, M.; Kruglik, S.G.; Payer, T.; Hebeisen, C.T.; Meyer zu Heringdorf, F.-J.; Yamaguchi, M.; Horn-von Hoegen, M.; Ernstorfer, R.; Miller, R.J.D. Electronic acceleration of atomic motions and disordering in bismuth. Nature 2009, 458, 56. [Google Scholar] [CrossRef] [PubMed]
  9. Beye, M.; Sorgenfrei, F.; Schlotter, W.F.; Wurth, W.; Föhlisch, A. The liquid-liquid phase transition in silicon revealed by snapshots of valence electrons. Proc. Natl. Acad. Sci. USA 2010, 107, 16772–16776. [Google Scholar] [CrossRef] [Green Version]
  10. Bauerhenne, B.; Lipp, V.P.; Zier, T.; Zijlstra, E.S.; Garcia, M. Self-Learning Method for Construction of Analytical Interatomic Potentials to Describe Laser-Excited Materials. Phys. Rev. Lett. 2020, 124, 085501. [Google Scholar] [CrossRef] [PubMed] [Green Version]
  11. Seddon, E.A.; Clarke, J.A.; Dunning, D.J.; Masciovecchio, C.; Milne, C.J.; Parmigiani, F.; Rugg, D.; Spence, J.C.H.; Thompson, N.R.; Ueda, K.; et al. Short-wavelength free-electron laser sources and science: A review. Rep. Progr. Phys. 2017, 80, 115901. [Google Scholar] [CrossRef] [PubMed]
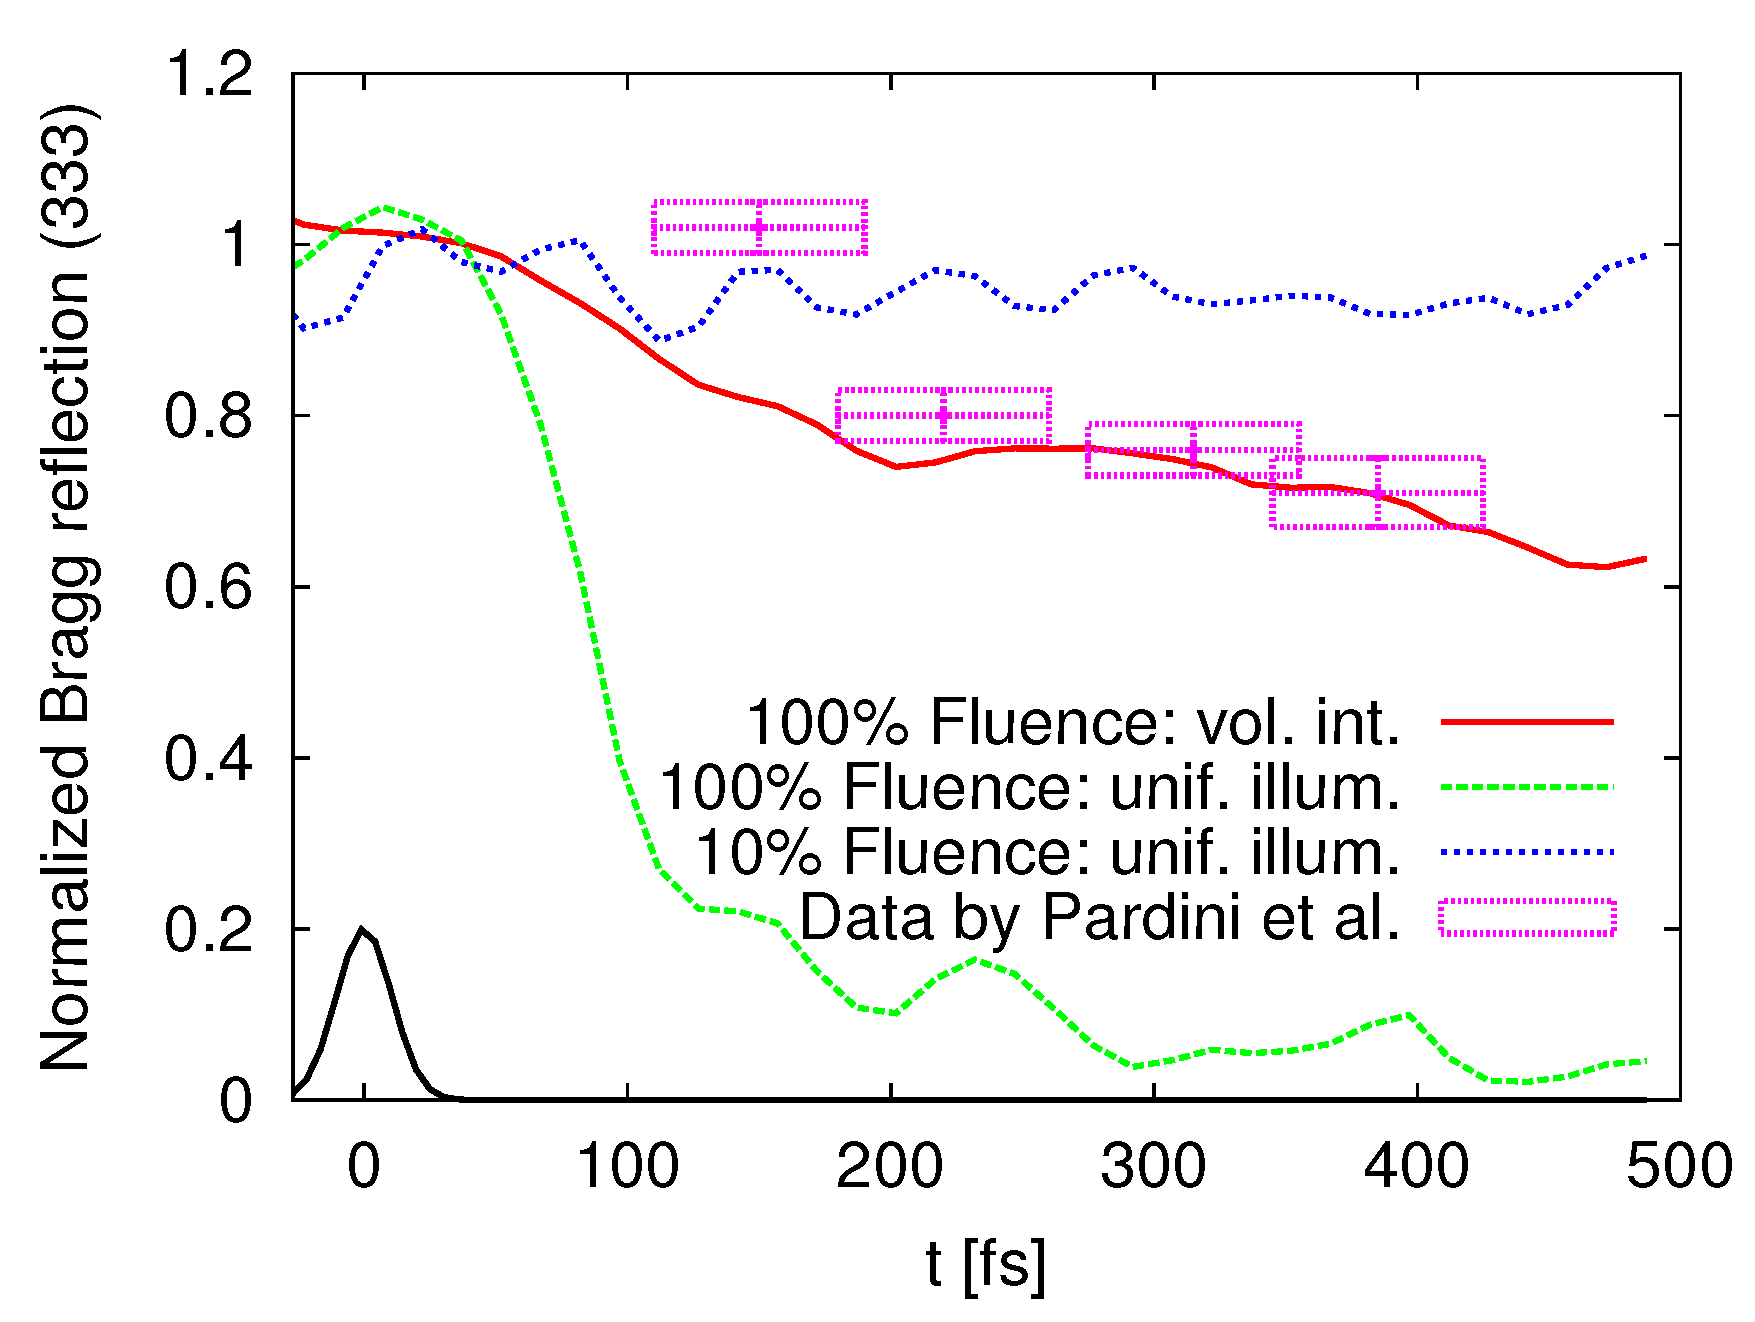
  12. Pardini, T.; Alameda, J.; Aquila, A.; Boutet, S.; Decker, T.; Gleason, A.E.; Guillet, S.; Hamilton, P.; Hayes, M.; Hill, R.; et al. Delayed Onset of Nonthermal Melting in Single-Crystal Silicon Pumped with Hard X rays. Phys. Rev. Lett. 2018, 120, 265701, Erratum in 2020, 124, 129903. [Google Scholar] [CrossRef] [Green Version]
  13. Inoue, I.; Inubushi, Y.; Sato, T.; Tono, K.; Katayama, T.; Kameshima, T.; Ogawa, K.; Togashi, T.; Owada, S.; Amemiya, Y.; et al. Observation of femtosecond X-ray interactions with matter using an X-ray—X-ray pump-probe scheme. Proc. Natl. Acad. Sci. USA 2016, 113, 6. [Google Scholar] [CrossRef] [PubMed] [Green Version]
  14. Zier, T.; Zijlstra, E.S.; Kalitsov, A.; Theodonis, I.; Garcia, M.E. Signatures of nonthermal melting. Str. Dyn. 2015, 2, 054101. [Google Scholar] [CrossRef] [PubMed] [Green Version]
  15. Zier, T.; Zijlstra, E.S.; Garcia, M.E. Quasimomentum-Space Image for Ultrafast Melting of Silicon. Phys. Rev. Lett. 2016, 116, 153901. [Google Scholar] [CrossRef] [PubMed]
  16. Jeschke, H.O.; Garcia, M.E.; Bennemann, K.H. Microscopic analysis of the femtosecond graphitization of diamond. Phys. Rev. B 1999, 60, R3701. [Google Scholar] [CrossRef] [Green Version]
  17. Jeschke, H.; Garcia, M.; Bennemann, K. Theory for the ultrafast ablation of graphite films. Phys. Rev. Lett. 2001, 87, 015003. [Google Scholar] [CrossRef] [Green Version]
  18. Medvedev, N.; Jeschke, H.O.; Ziaja, B. Nonthermal phase transitions in semiconductors induced by a femtosecond extreme ultraviolet laser pulse. New J. Phys. 2013, 15, 015016. [Google Scholar] [CrossRef]
  19. Medvedev, N.; Li, Z.; Tkachenko, V.; Ziaja, B. Electron-ion coupling in semiconductors beyond Fermi’s golden rule. Phys. Rev. B 2017, 95, 014309. [Google Scholar] [CrossRef] [Green Version]
  20. Medvedev, N.; Tkachenko, V.; Lipp, V.; Li, Z.; Ziaja, B. Various damage mechanisms in carbon and silicon materials under femtosecond X-ray irradiation. arXiv 2018, arXiv:1805.07524. [Google Scholar] [CrossRef]
  21. Roy, A.M. Influence of Nanoscale Parameters on Solid-solid Phase Transformation in Octogen Crystal: Multiple Solution and Temperature Effect. JETP Lett. 2021. [Google Scholar] [CrossRef]
  22. Roy, A.M. Barrierless melt nucleation at solid-solid interface in energetic nitramine octahydro-1,3,5,7-tetranitro-1,3,5,7-tetrazocine. Materialia 2021, 15, 101000. [Google Scholar] [CrossRef]
  23. Neutze, R.; Wouts, R.; van der Spoel, D.; Weckert, E.; Hajdu, J. Potential for Biomolecular Imaging with Femtosecond X-Ray Pulses. Nature 2000, 406, 752–757. [Google Scholar] [CrossRef] [PubMed]
  24. Nass, K.; Gorel, A.; Abdullah, M.M.; Martin, A.V.; Kloos, M.; Marinelli, A.; Aquila, A.; Barends, T.R.M.; Decker, F.-J.; Doak, R.B.; et al. Structural Dynamics in Proteins Induced by and Probed with X-Ray Free-Electron Laser Pulses. Nat. Commun. 2020, 11, 1814. [Google Scholar] [CrossRef] [Green Version]
  25. Seibert, M.M.; Ekeberg, T.; Maia, F.R.N.C.; Svenda, M.; Andreasson, J.; Jönsson, O.; Odić, D.; Iwan, B.; Rocker, A.; Westphal, D.; et al. Single Mimivirus Particles Intercepted and Imaged with an X-Ray Laser. Nature 2011, 470, 78–81. [Google Scholar] [CrossRef]
  26. Ekeberg, T.; Svenda, M.; Abergel, C.; Maia, F.R.N.C.; Seltzer, V.; Claverie, J.-M.; Hantke, M.; Jönsson, O.; Nettelblad, C.; van der Schot, G.; et al. Three-Dimensional Reconstruction of the Giant Mimivirus Particle with an x-Ray Free-Electron Laser. Phys. Rev. Lett. 2015, 114, 098102. [Google Scholar] [CrossRef] [Green Version]
  27. Munke, A.; Andreasson, J.; Aquila, A.; Awel, S.; Ayyer, K.; Barty, A.; Bean, R.J.; Berntsen, P.; Bielecki, J.; Boutet, S.; et al. Coherent Diffraction of Single Rice Dwarf Virus Particles Using Hard X-Rays at the Linac Coherent Light Source. Sci. Data 2016, 3, 160064. [Google Scholar] [CrossRef] [Green Version]
  28. Inoue, I.; Deguchi, Y.; Ziaja, B.; Osaka, T.; Abdullah, M.M.; Jurek, Z.; Medvedev, N.; Tkachenko, V.; Inubushi, Y.; Kasai, H.; et al. Atomic-Scale Visualization of Ultrafast Bond Breaking in X-Ray-Excited Diamond. Phys. Rev. Lett. 2021, 126, 117403. [Google Scholar] [CrossRef]
  29. Abdullah, M.M.; Jurek, Z.; Son, S.K.; Santra, R. Calculation of x-ray scattering patterns from nanocrystals at high x-ray intensity. J. Appl. Cryst. 2016, 49, 1048. [Google Scholar] [CrossRef] [Green Version]
  30. Medvedev, N.; Ziaja, B. Multistep transition of diamond to warm dense matter state revealed by femtosecond X-ray diffraction. Sci. Rep. 2018, 8, 5284. [Google Scholar] [CrossRef] [Green Version]
  31. Kwon, I.; Biswas, R.; Wong, C.; Ho, K.; Soukoulis, C. Transferable tight-binding models for silicon. Phys. Rev. B 1994, 49, 7242. [Google Scholar] [CrossRef] [PubMed]
  32. Medvedev, N.; Jeschke, H.; Ziaja, B. Nonthermal graphitization of diamond induced by a femtosecond x-ray laser pulse. Phys. Rev. B 2013, 88, 224304. [Google Scholar] [CrossRef] [Green Version]
  33. Lipp, V.; Medvedev, N.; Ziaja, B. Classical Monte-Carlo simulations of X-ray-induced electron cascades in various materials. Proc. SPIE 2017, 10239, 102360H. [Google Scholar]
  34. Follath, R.; Koyama, K.; Lipp, V.; Medvedev, N.; Tono, K.; Ohashi, H.; Patthey, L.; Yabashi, M.; Ziaja, B. X-ray-induced damage of B4C-coated multilayer materials under various irradiation geometries. Sci. Rep. 2019, 9, 2029. [Google Scholar] [CrossRef]
  35. Pardini, T.; Boutet, S.; Bradley, J.; Döppner, T.; Fletcher, L.B.; Gardner, D.F.; Hill, R.M.; Hunter, M.S.; Krzywinski, J.; Messerschmidt, M.; et al. Silicon Mirrors for High-Intensity X-Ray Pump and Probe Experiments. Phys. Rev. Appl. 2014, 1, 044007. [Google Scholar] [CrossRef]
  36. Medvedev, N.; Li, Z.; Ziaja, B. Thermal and Nonthermal Melting of Silicon under Femtosecond X-Ray Irradiation. Phys. Rev. B 2015, 91, 054113. [Google Scholar] [CrossRef] [Green Version]
  37. Berrah, N.; Sanchez-Gonzalez, A.; Jurek, Z.; Obaid, R.; Xiong, H.; Squibb, R.J.; Osipov, T.; Lutman, A.; Fang, L.; Barillot, T.; et al. Femtosecond-resolved observation of the fragmentation of buckminsterfullerene following x-ray multiphoton ionization. Nat. Phys. 2019, 15, 1279. [Google Scholar] [CrossRef]
  38. Murphy, B.F.; Osipov, T.; Jurek, Z.; Fang, L.; Son, S.-K.; Mucke, M.; Eland, J.H.D.; Zhaunerchyk, V.; Feifel, R.; Avaldi, L.; et al. Femtosecond x-ray-induced explosion of C60 at extreme intensity. Nat. Commun. 2014, 5, 4281. [Google Scholar] [CrossRef] [Green Version]
  39. Kumagai, Y.; Jurek, Z.; Xu, W.; Fukuzawa, H.; Motomura, K.; Iablonskyi, D.; Nagaya, K.; Wada, S.-I.; Mondal, S.; Tachibana, T.; et al. Radiation-induced chemical dynamics in Ar clusters exposed to strong x-ray pulses. Phys. Rev. Lett. 2018, 120, 223201. [Google Scholar] [CrossRef] [PubMed]
  40. Ziaja, B.; London, R.A.; Hajdu, J. Unified model of secondary electron cascades in diamond. J. Appl. Phys. 2005, 97, 064905. [Google Scholar] [CrossRef] [Green Version]
  41. Veigele, W.J. Photon cross sections from 0.1 keV to 1 MeV for elements Z = 1 to Z = 94. At. Data Nucl. Data Tables 1973, 5, 51. [Google Scholar] [CrossRef]
  42. Tavella, F.; Höppner, H.; Tkachenko, V.; Medvedev, N.; Capotondi, F.; Golz, T.; Kai, Y.; Manfredda, M.; Pedersoli, E.; Prandolini, M.J.; et al. Soft X-ray-induced femtosecond solid-to-solid phase transition. High Energy Density Phys. 2017, 24, 22. [Google Scholar] [CrossRef] [Green Version]
  43. Son, S.K.; Young, L.; Santra, R. Impact of hollow-atom formation on coherent x-ray scattering at high intensity. Phys. Rev. A 2011, 83, 033402. [Google Scholar] [CrossRef] [Green Version]
  44. Zeiger, H.J.; Vidal, J.; Cheng, T.K.; Ippen, E.P.; Dresselhaus, G.; Dresselhaus, M.S. Theory for displacive excitation of coherent phonons. Phys. Rev. B 1992, 45, 768. [Google Scholar] [CrossRef] [Green Version]
  45. Medvedev, N.; Kopecky, M.; Chalupsky, J.; Juha, L. Femtosecond X-ray diffraction can discern nonthermal from thermal melting. Phys. Rev. B 2019, 99, 100303. [Google Scholar] [CrossRef]
Figure 1. Theoretical predictions for: (a) Fraction of K-shell holes per atom, (b) fraction of non-thermalized energetic electrons excited per atom, (c) fraction of thermalized electrons in the bottom of the conduction band per atom, and (d) temperatures of thermalized electrons and ions in silicon crystal after irradiation with an X-ray pulse of 5.95 keV photon energy, duration of 25 fs FWHM, at the absorbed doses of 2.70 eV/atom, 1.35 eV/atom, and 0.27 eV/atom. These correspond to 100%, 50%, and 10% of the nominal peak fluence, respectively. The FEL pump pulse temporal shape is schematically represented by a black solid line. Time zero corresponds to the maximum of the pump pulse.
Applsci 11 05157 g001
Figure 2. Calculated single-shot snapshots of atomic arrangements in silicon crystal at 500 fs after its irradiation with an X-ray pulse of 5.95 keV photon energy, duration of 25 fs FWHM, at the average absorbed doses in the material of (a) 2.70 eV/atom, (b) 1.35 eV/atom, and (c) 0.27 eV/atom. These correspond to 100%, 50%, and 10% of the nominal peak fluence, respectively.
Applsci 11 05157 g002
Figure 3. Temporal evolution of the normalized Bragg reflection intensity (333) recorded from Si crystals obtained with our simulations for various fractions of the nominal peak fluence, assuming uniform X-ray illumination: 100% (green curve) and 10% (blue curve), and applying volume integration for the full nominal fluence (red curve). The calculated intensity was normalized using the unperturbed signal value. This was compared to the experimental data from [12]. The FEL pump pulse temporal shape was schematically shown (black solid line). The FEL pulse parameters are as in Figure 1 and Figure 2. Note that the recent analysis performed in [12] excluded the first experimental point at 150 ± 40 fs.
Applsci 11 05157 g003
Publisher’s Note: MDPI stays neutral with regard to jurisdictional claims in published maps and institutional affiliations.

