Article

Research on Contactless Bio-Signal Measurement Technology for Improving Social Awareness of Individuals with Communication Challenges

Korea Electronics Technology Institute, Gwangju 61011, Korea
*
Author to whom correspondence should be addressed.
Submission received: 30 March 2021 / Revised: 30 May 2021 / Accepted: 31 May 2021 / Published: 2 June 2021
(This article belongs to the Special Issue Haptics: Technology and Applications2021)

Abstract

:
Youth and adults with autism spectrum disorder have poor skills such as communication, qualitative interaction, and emotional expression resulting in low social awareness. In this paper, we propose and explore a contactless bio-signal measurement and functional contents for improving social awareness of individuals with communication challenges. We implemented four individual methods for collecting and analyzing the bio data of the individuals without requiring their attention: (1) heart rate, (2) respiration, (3) facial expression, and (4) interaction. The four techniques are all based on image data received and analyzed from a normal web camera. The data were analyzed in a real-time, fully functional algorithm: implementing the algorithm on a mobile device will require future work. However, we have evaluated our method by developing a functional content including the four methods. Based on the analysis of the collected data from the content and qualitative responses from the field, the contactless bio-signal measurement technology combined with friendly designed user interfaces for the individuals with communication challenges could train them to improve their social awareness.

1. Introduction

Recently, the emergence of autism spectrum disorder (ASD) has been increasing, and the prevalence of highly functional autistic children is increasing. High-functioning autism (HFA) usually refers to a child with mild verbal impairment or autism symptoms and a verbal IQ of seventy or higher. They tend to be on the higher side of language development and appear to communicate effectively, but children with HFA show a deficit in their ability to attempt appropriate communicative signals for social purposes. In addition, because they focus on their area of interest and often strictly adhere to the subject, they have difficulty not only in repeating their interests, but also initiating, maintaining, and closing conversation [1,2]. Although expressing emotions is often considered a given ability, many people struggle with them on daily basis. For example, studies have shown that many individuals on the autism spectrum suffer speech impairment [3,4,5]. They may also show atypical facial expressions [5,6]. To make the matters worse, their expressions are more poorly recognized by others, whether autistic or neuro-typical individuals [7].
Management of the autism spectrum focuses on symptom relief and quality of life improvement rather than cure. For example, there are attempts to reduce discord with neighbors or family through counseling, reduce various symptoms with drugs or psychotherapy, and minimize social and occupational problems through behavioral correction. In general, the higher the intelligence, the more effective the treatment and the better the prognosis [8]. However, in the case of autistic children, treatment and education are limited because they cannot properly express their emotional state. In fact, when a child with autism spectrum disorder yells while participating in a treatment program, it is difficult to know whether they are yelling because they are feeling happy or excited.
Trying to understand their emotions using alternative methods such as physiological signal analysis can help manage the autism spectrum. According to James–Lange and Cannon–Bard’s Emotion Theory [9,10], human emotions appear as physiological phenomena such as muscle tension, heart rate, and changes in skin temperature. Facial expression has a communication function and serves as a medium for delivering specific information [11]. Understanding emotions is a key component of social interaction because it allows you to accurately recognize the intentions of others and respond appropriately.
Scientific interest in the use of sensor technology to obtain psychological and emotional states from ASD biometric data has recently increased significantly.
Chung and Yoon [12] presented a framework for autism spectrum disorder treatment system using bio-signal sensing (EEG, ECG) and emotional computing technology. Billeci et al. [13] and Marco et al. [14] used EEG, MEG, and functional Magnetic Resonance Imaging (fMRI) while Wang et al. [15] used HRV and Skin conductance and John et al. [16] focused on works of eye tracking. By using bio-signals in this way, individuals can perceive human emotions with more objective and high reliability. However, in previous studies, collecting biometric data through contact sensors such as ECG, EMG sensors, and wearable devices sense the mental burden and resistance to physical contact of the individuals. This can be a factor that degrades the accuracy of the acquired data and can have a great impact on the status analysis of the subject. One of the major problems with using bio-signals for such applications has been the complexity of measurement device setups and their cost, which can render them impractical outside laboratories [17,18].
Therefore, we would like to propose a non-contact bio-signal collection technology for those with limited communication: high-functioning autistic boys who have difficulty in communication as discussed above. The above method can collect and analyze biometric data by detecting light blood flow (heart rate), respiration, facial expressions, gaze and facial movements, and hand movements with only a webcam-level camera without the need to collect biometric data using multiple contact sensors. It is possible to judge the status of a person with poor communication skills by analyzing the four kinds of status data.
For example, people with weak communication respond to sounds or actions that they do not like, and their changes in heart rate are larger than those who do not suffer from ASD. Breathing can become coarse as your heart rate increases. This can be judged as a state of excitement for those with weak communication. While communicating, most people can determine whether their gaze is focused on the other’s face or whether their gaze is directed to a place other than their face. In addition, if the gaze is focused on the face, it can be determined whether the communication-weak person is communicating smoothly depending on which part of the face is focused. The gazes of those with weak communication clearly show a different gaze pattern from those who do not suffer from ASD [19,20,21].
When communicating, their focus is often on the mouth instead of the eyes [22,23,24,25,26,27].
This is a typical aspect of those with weak communication who have difficulty making eye contact during communication [16].
This paper focuses on technology for collecting and analyzing state data. Mobile and VR contents for social skills training that can contribute to improving the quality of life through the improvement of communication skills of the communication-impaired by incorporating the proposed non-contact state data collection and analysis technology are under research.

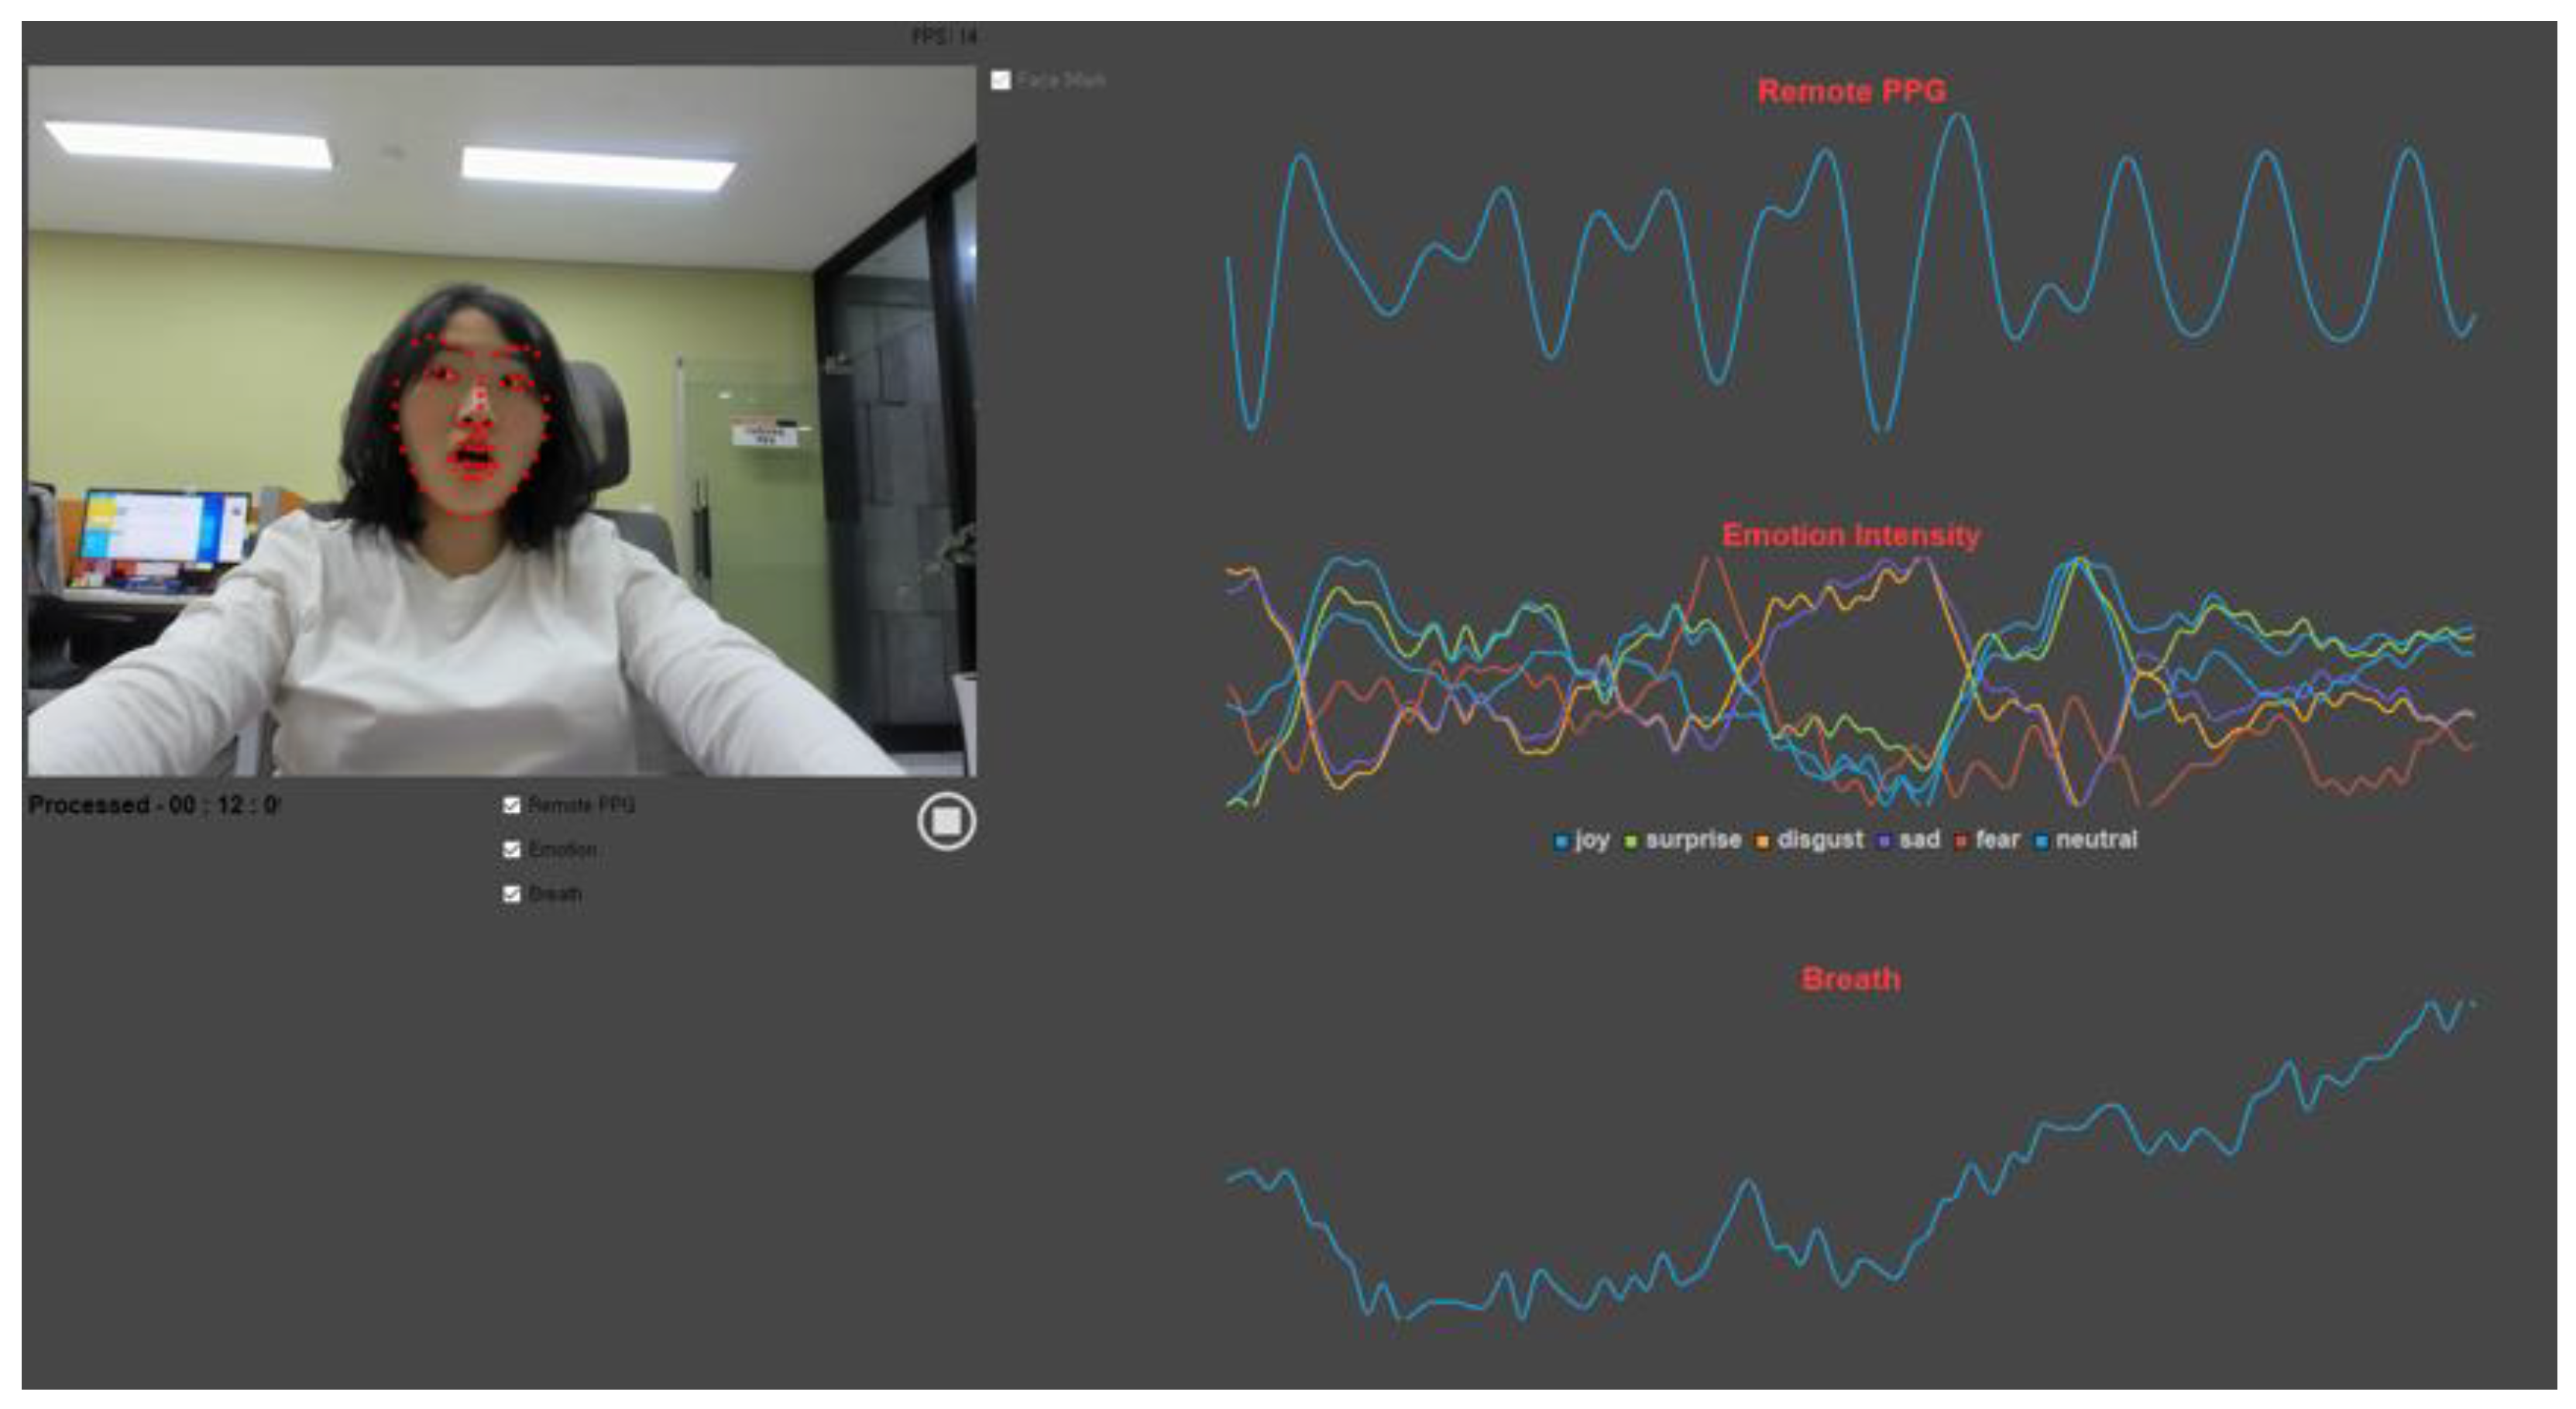
2. Integrated Interface Implementation

Communication weak people sometimes find it difficult to do things outside their area of interest. Therefore, a real-time signal detection integrated interface was defined and implemented by visualizing the status data obtained in a non-contact manner, which does not require the attachment of a special contact sensor, so that the expert managing the communication-weak person can easily recognize and understand the status of the individual. The integrated state data interface enables the extraction of photo blood flow (heart rate), respiration, and facial expression state data from real-time camera images, as well as state data extraction and batch processing for recorded images in Figure 1.
Light blood flow, respiration, and facial expressions have different signal detection methods and data formats, so the integrated structure of the signal detection algorithm is applied equally so that even if a new signal detection algorithm is added, it can be easily linked. The preprocessing process that must be performed to detect the signal is defined in the same way, and the user’s image is acquired in real time so that the preprocessing process for signal detection, such as image conversion and face detection, can be performed.
In addition, the UI was applied to intuitively express the functions of the integrated interface, and each algorithm was threaded and operated to make the most of the performance of the PC running the integrated interface. On the top left, a face image including the upper body received from the camera is displayed, and on the right, real-time status data is displayed as a graph and visualized, and status data and measurement time can be separated and saved in CSV.

3. Measurement of State Data Based on Non-Contact Image Analysis

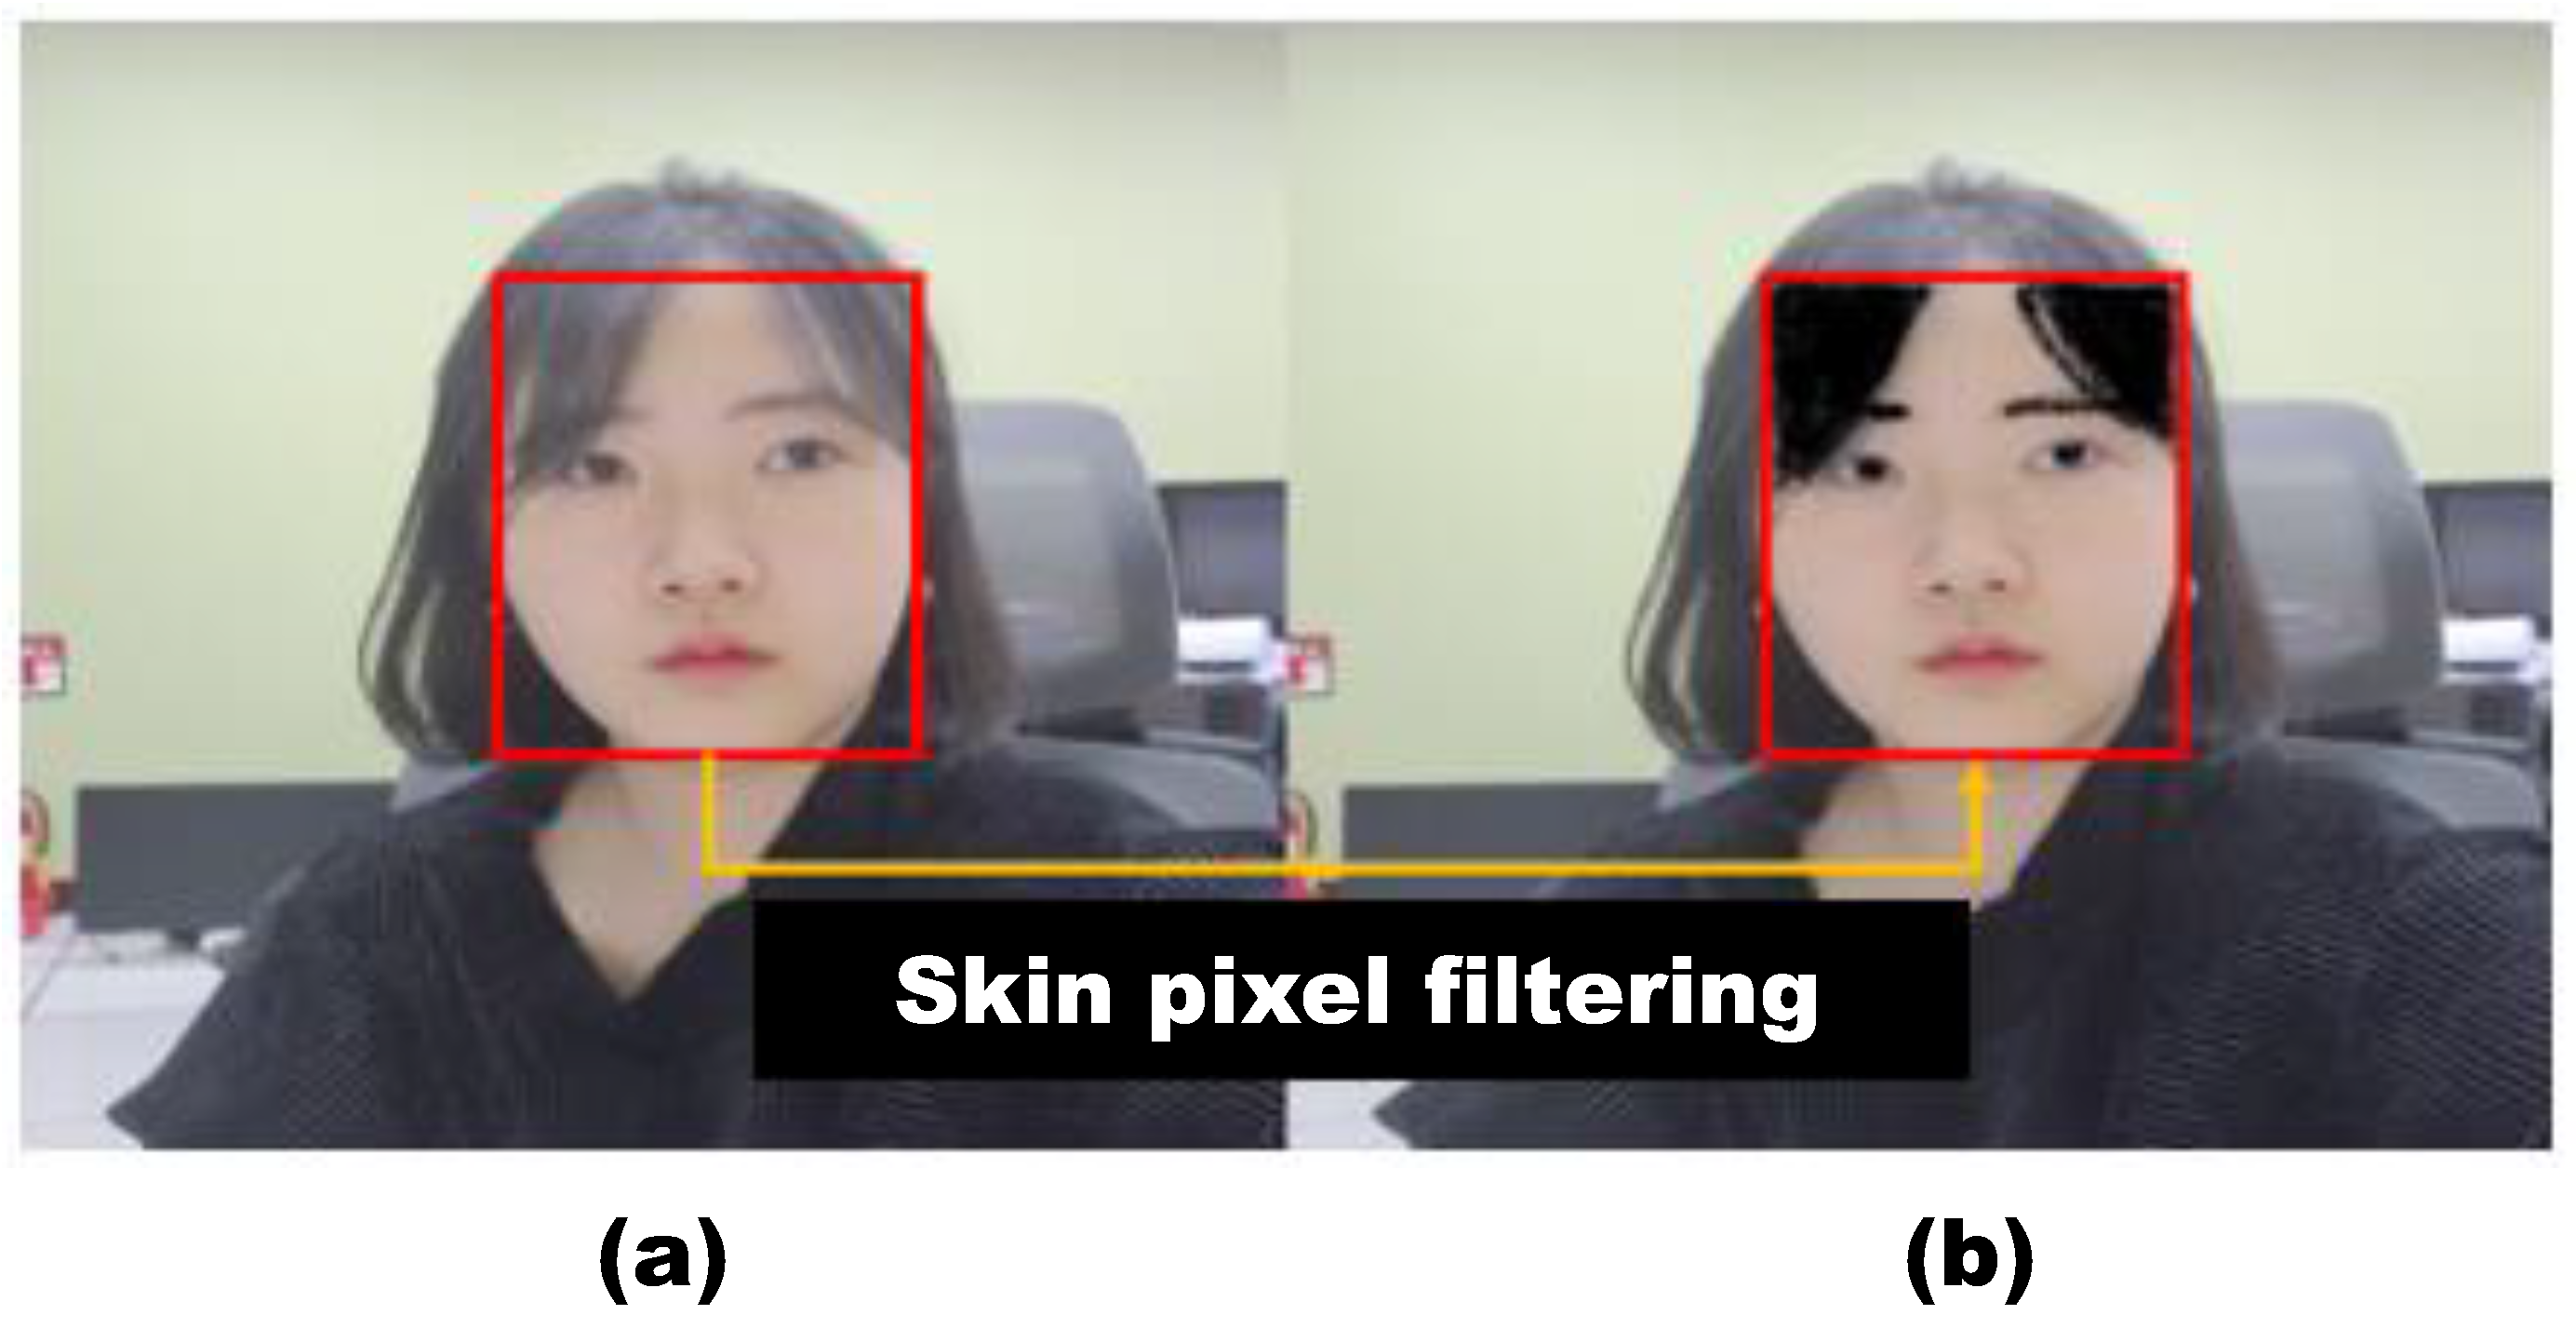
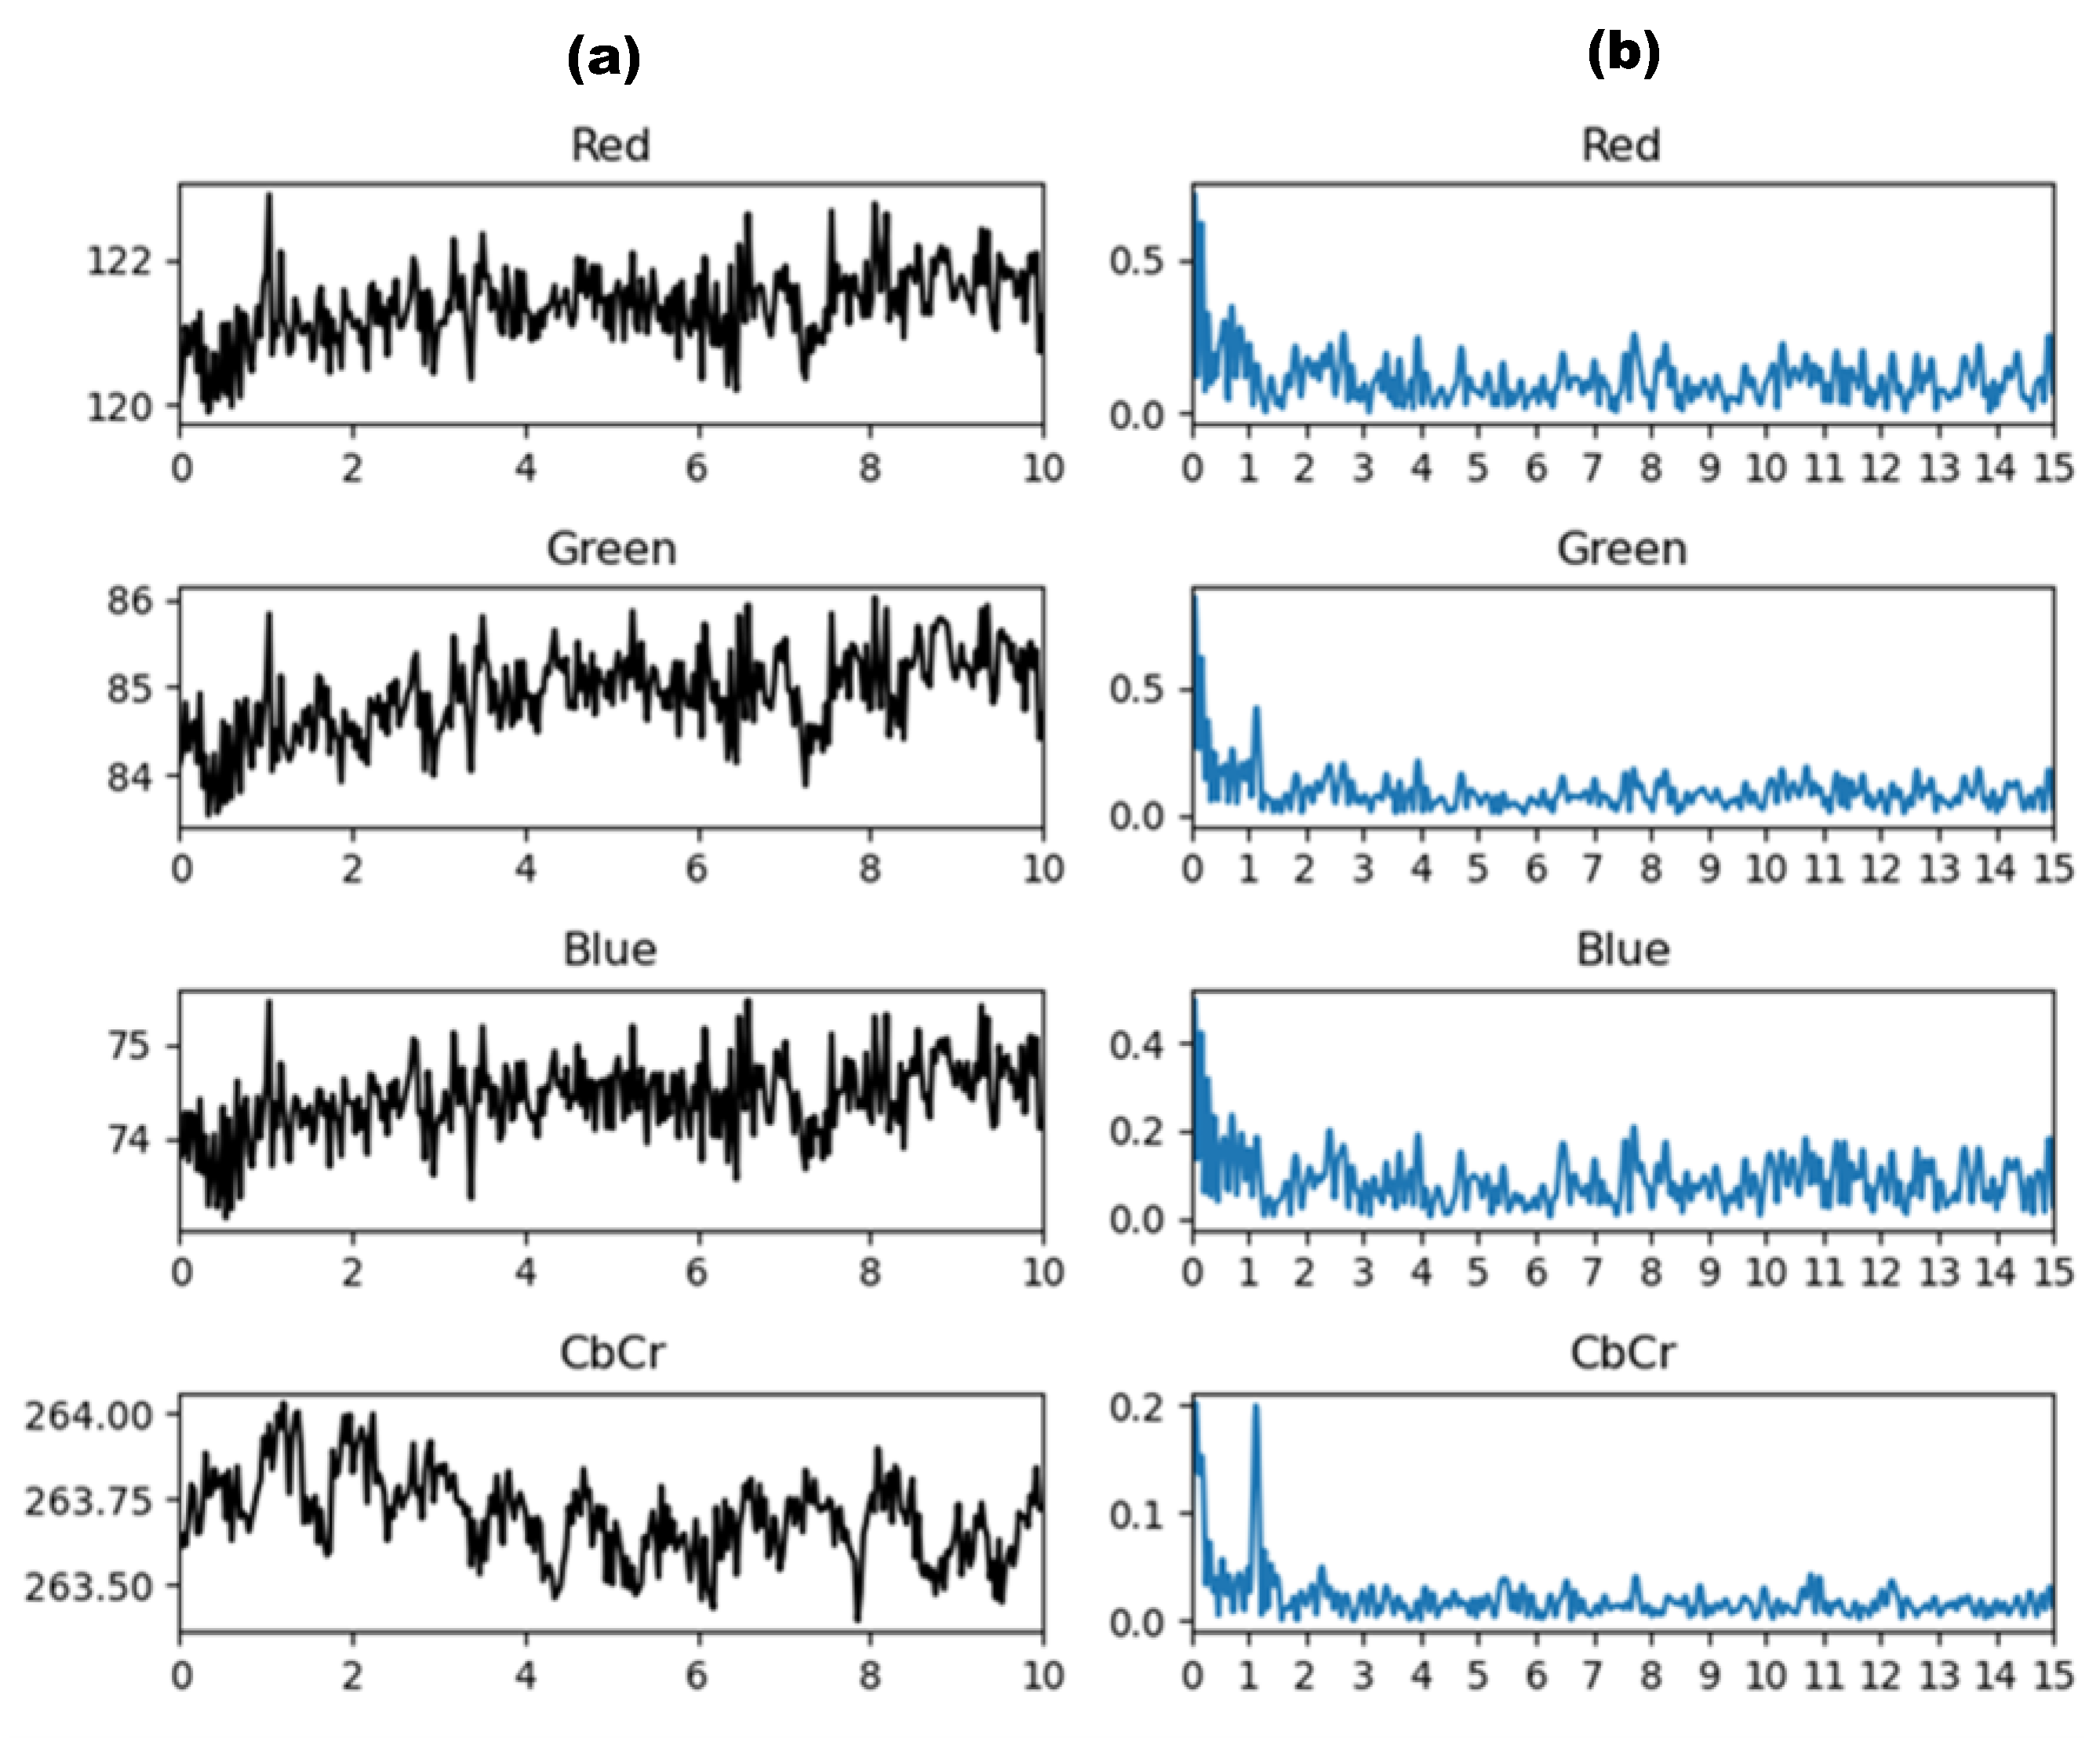
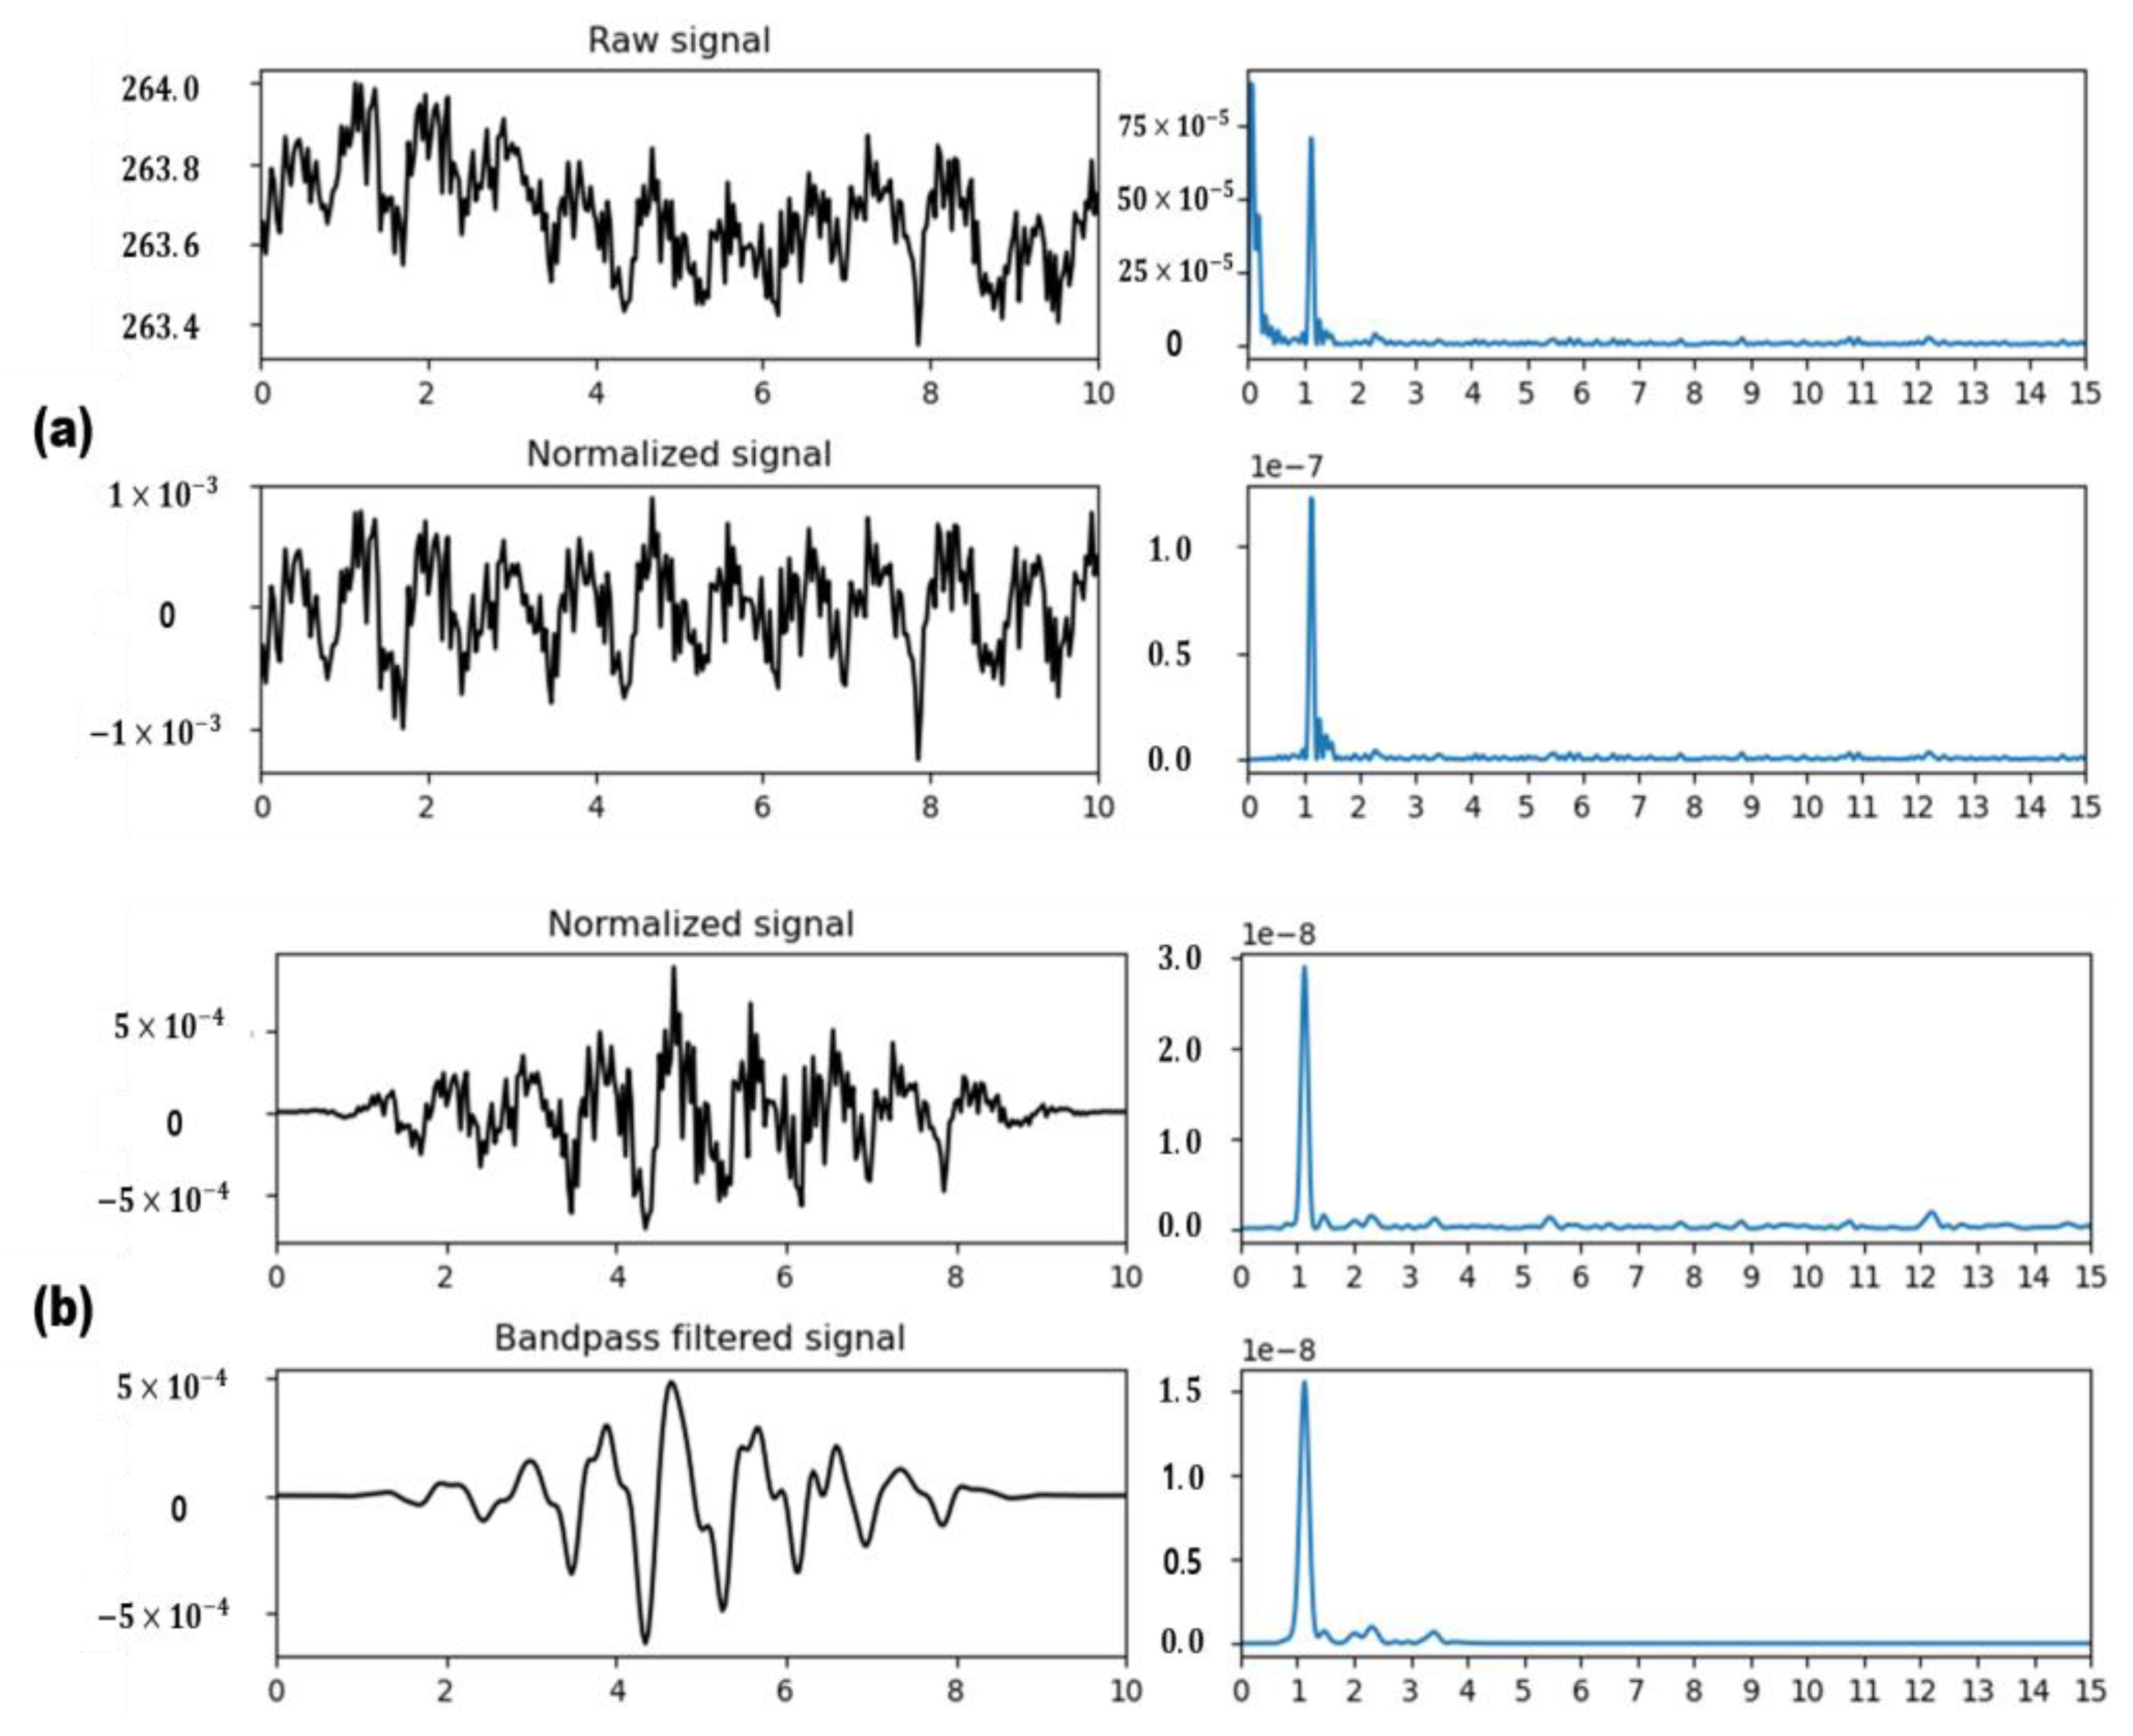
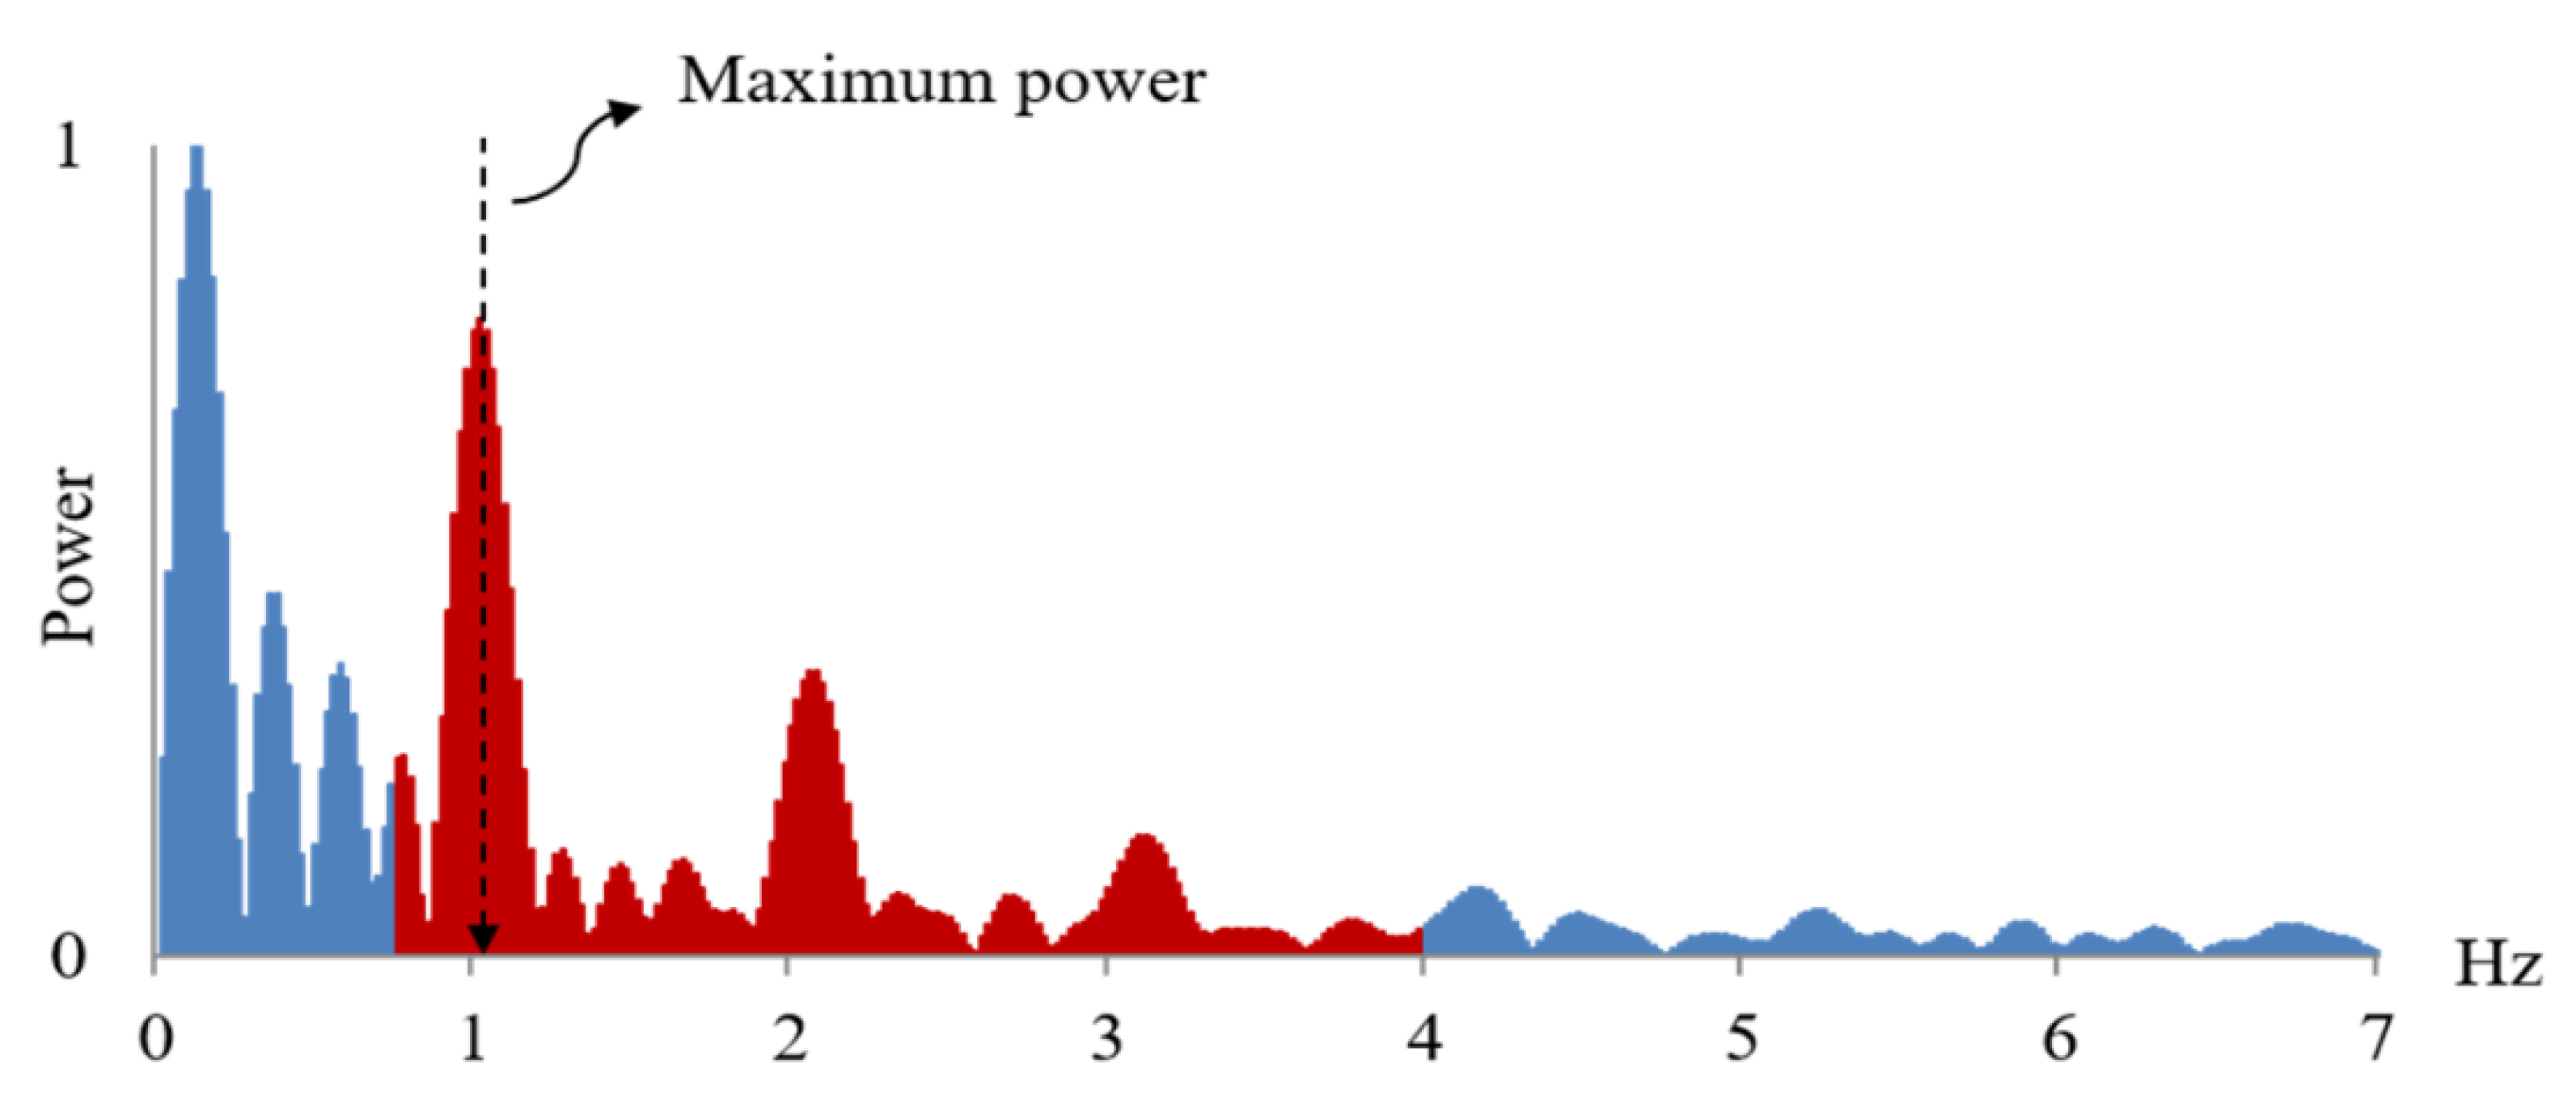
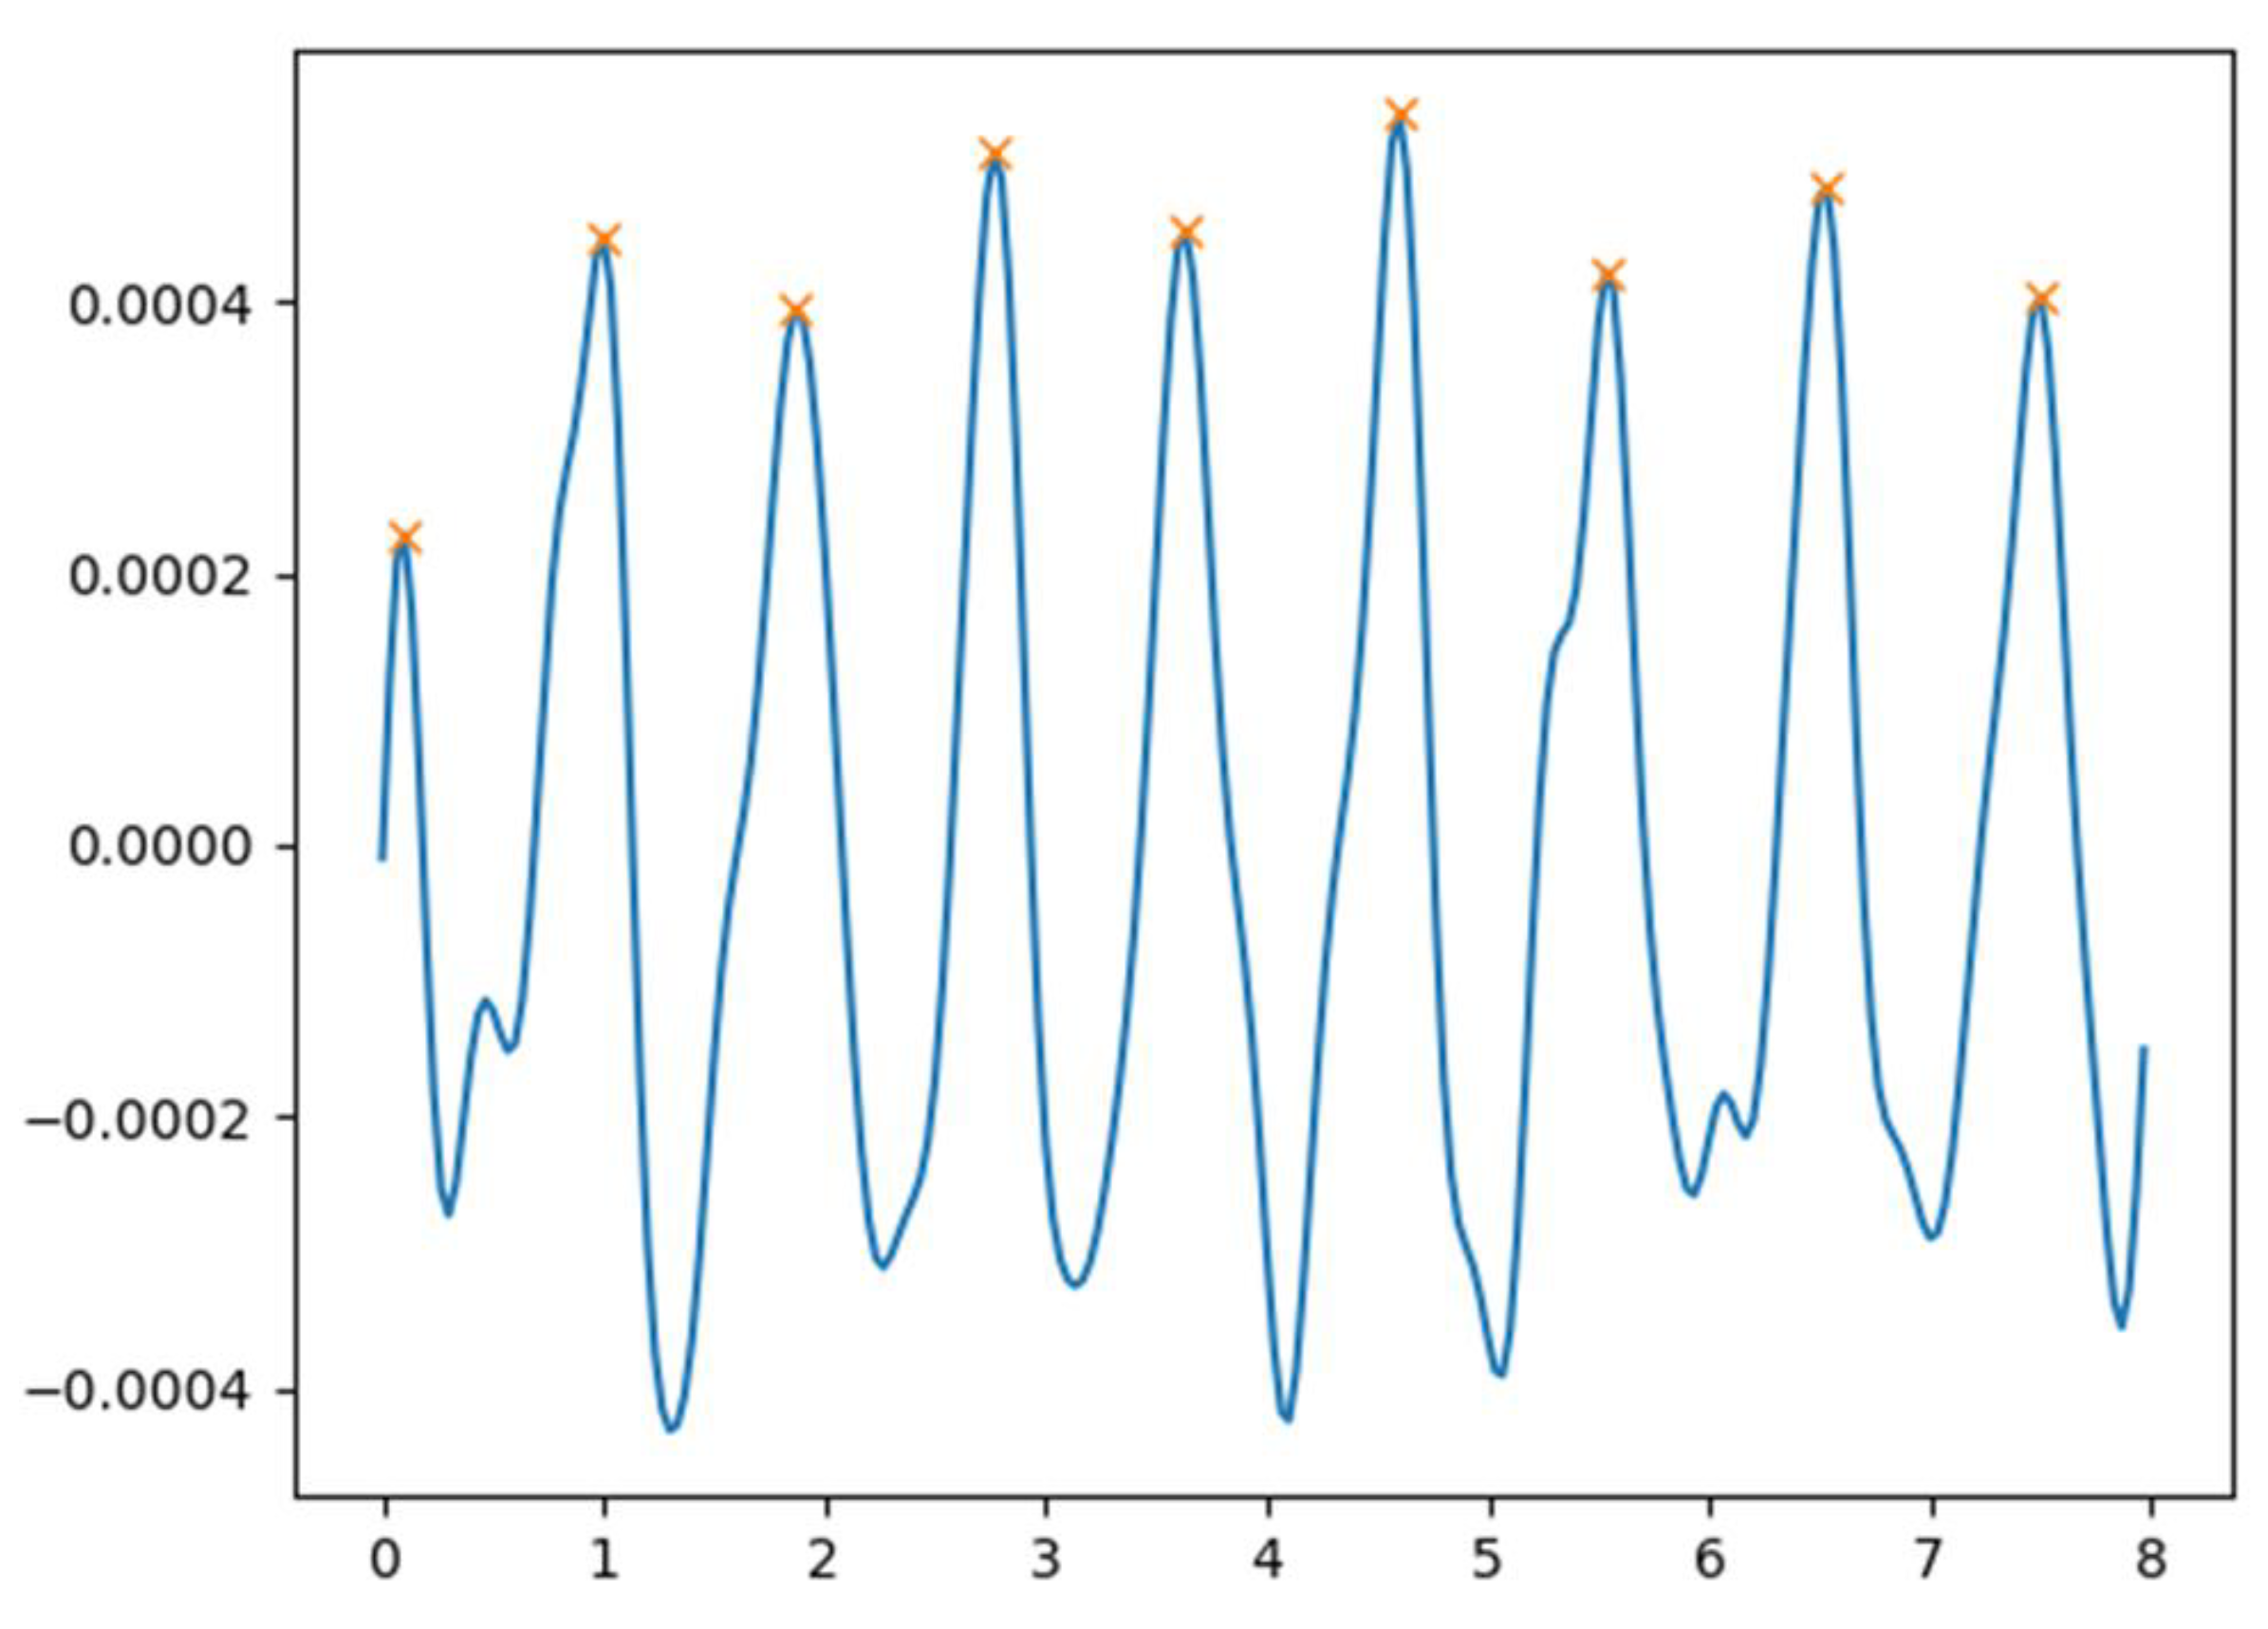
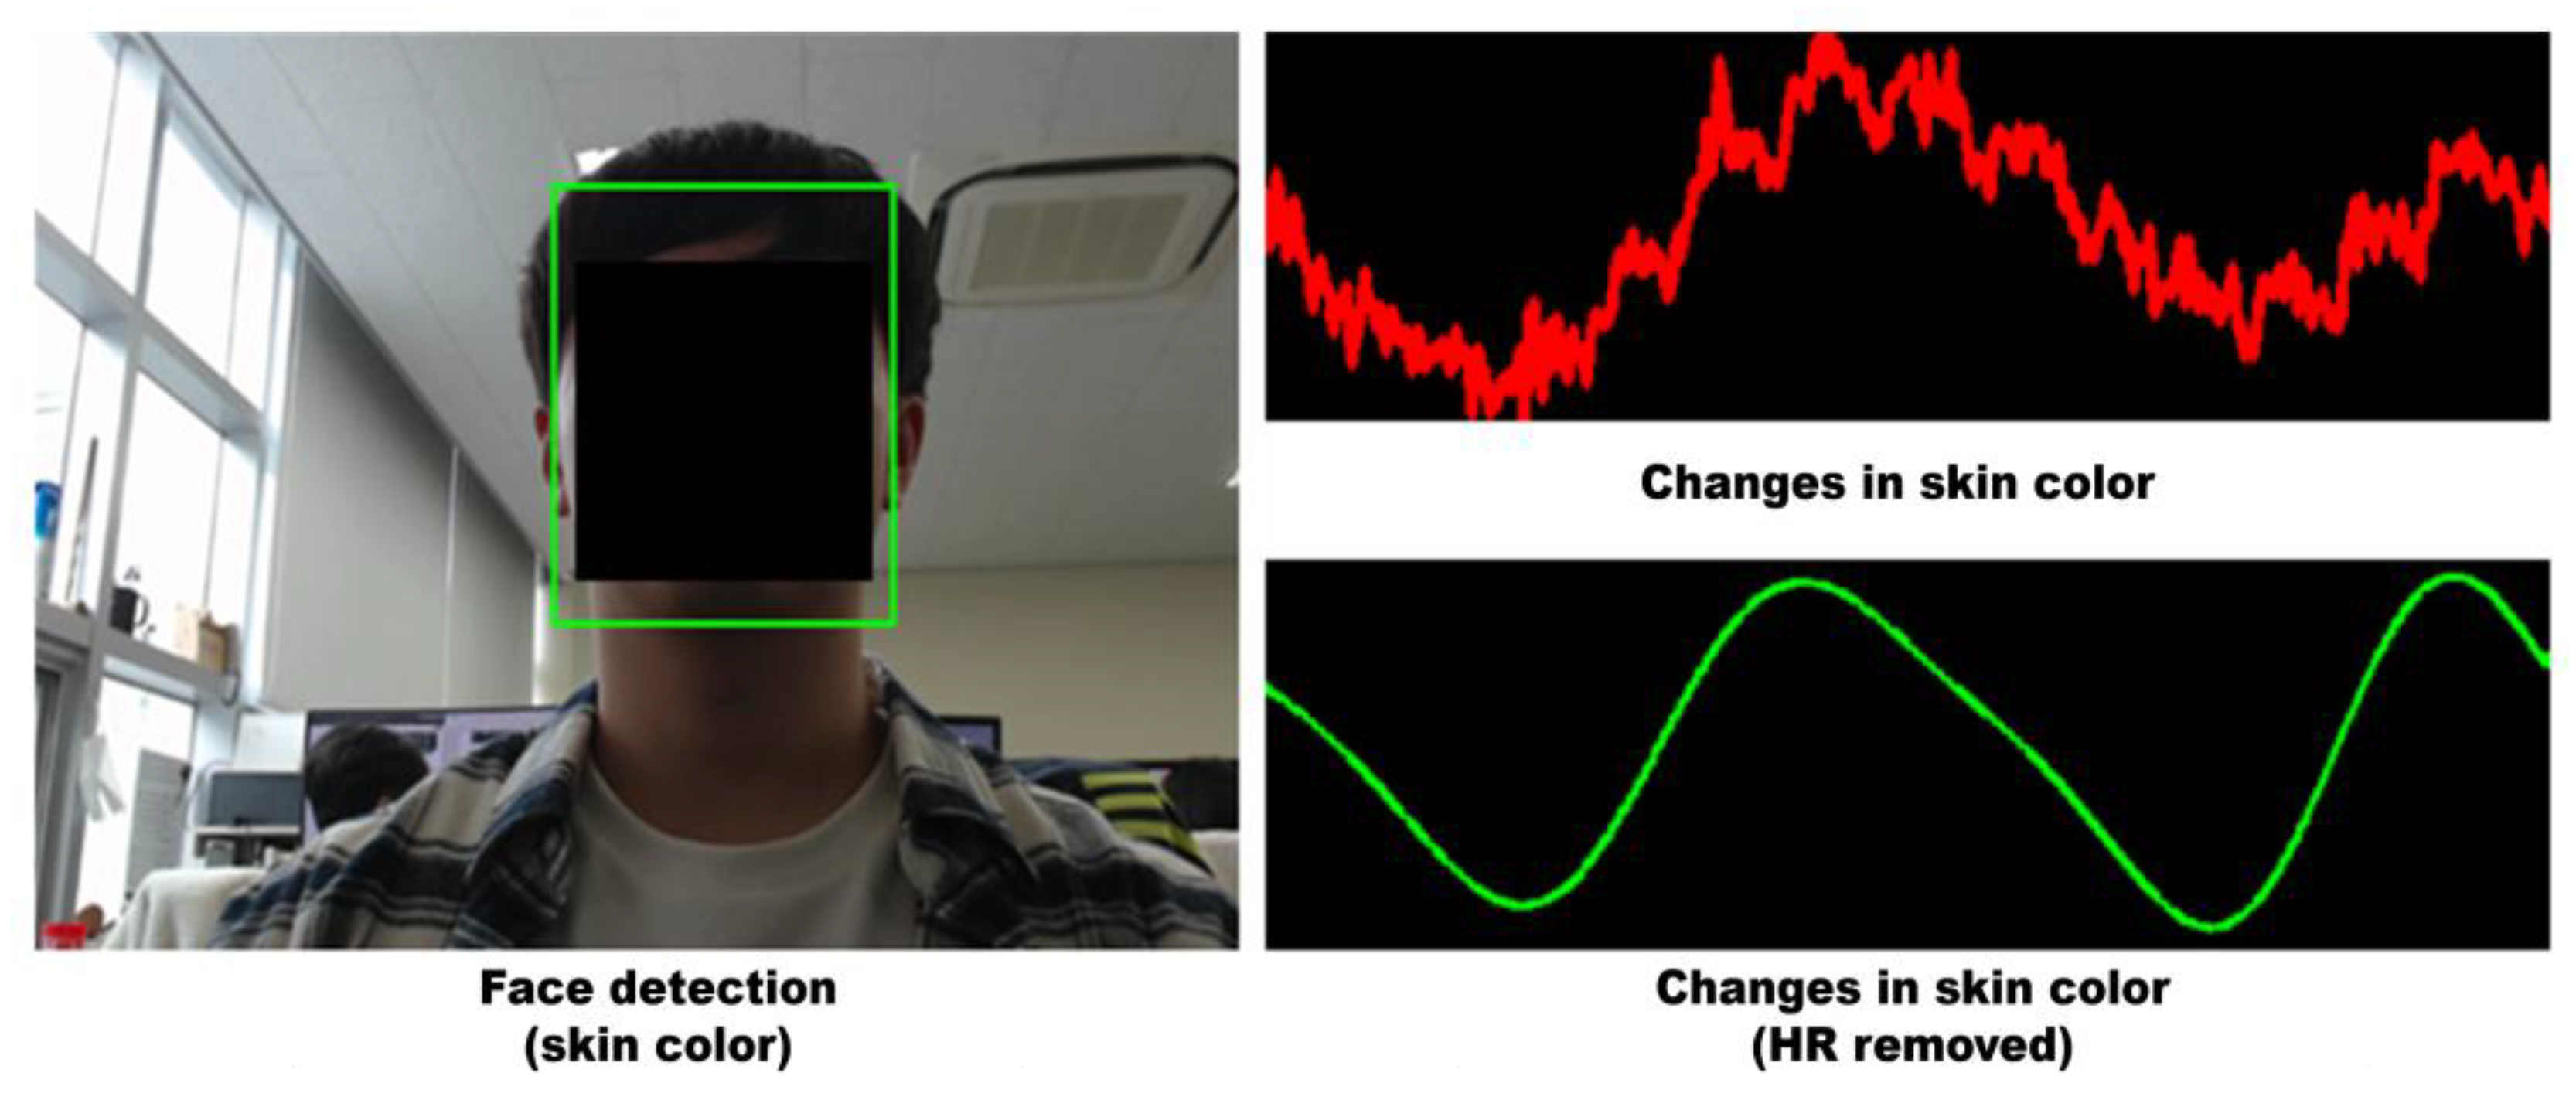
3.1. Optical Blood Flow (Heart Rate) Signal Acquisition

Photo-plethysmography (PPG) is used to measure the blood flow signal by measuring the change in blood flow that occurs according to the heartbeat through the color change of the fingertip or face image. We acquire the optical blood flow signal through the face image, and in order to stably extract the optical blood flow signal, accurate face detection and consistent tracking of the skin area are required. To minimize the background pixels unrelated to the skin during face detection, an SSD [28]-based face detector was used instead of the traditional Vi-ola-Jones detector [29].
As shown in Figure 2a, parts that are not related to pulsating skin such as hair, eyebrows, and background pixels are still included in the face area detected through the SSD. In consideration of real-time characteristics, the background area was removed by modeling the skin color distribution through a statistical method in the YCbCr color space instead of a deep learning-based segmentation algorithm.
In the RGB color space, the red, green, and blue channels have a high correlation, and it is difficult to separate the lighting component and the color component.
In addition, it is very likely that noise is included in the extracted signal due to the fine movement of the body, the three-dimensional structure of the face surface, and the position change with the lighting. The light component was discarded, and the light blood flow signal was extracted by focusing on the change in skin color according to the change in the amount of light blood using the color difference component. Compared to other color signal components, the color-difference signal shows a distinct pulsating waveform, and a component corresponding to the pulse in the frequency spectrum is well revealed. The color difference signal extracted from Figure 2b shows a distinct pulsating waveform compared to other color signal components, and it is shown in Figure 3 that the component corresponding to the pulse rate is well revealed in the frequency spectrum.
In the signal extracted from Figure 3, elements not related to cardiac activity are also included and a process to remove them is necessary. This is the normalization work to remove noise such as facial movement and breathing, which have relatively low frequencies. The signal was normalized using the average according to the time interval, and the window size was set as the sampling rate to include at least one pulse period in the interval. As a result, it was possible to obtain a zero-centered signal from which the DC component was removed during the normalization process. Since there are still noises corresponding to high frequency generated by lighting changes in the signal, camera sensors, etc., band pass filtering was applied to remove them. The passband was set to (0.7, 3.0) corresponding to 42–180 BPM, and a Butterworth filter of order 5 was used.
As a result, as shown in Figure 4, a signal that facilitates heart rate estimation was obtained by removing a significant portion of noise from the contaminated signal through signal normalization and band-pass filtering of the raw signal. In addition, it is possible to extract additional physiological parameters by performing analysis in the frequency domain and time series domain by interpreting the normalized signal as an optical blood flow signal synchronized with the user’s cardiac activity.
Power spectral density detection and analysis as shown in Figure 5 was performed by converting to the frequency domain in order to extract the average pulse rate for the measurement section from the optical blood flow signal. The optical blood flow signal extracted according to the Nyquist sampling theory can be analyzed up to the frequency band corresponding to the maximum ‘1/frame rate’. For instance, 30 fps video analysis up to 15 Hz. Since the normal human pulse rate is between 42–240 beats per minute, the frequency band of interest is set to the 0.7–4.0 Hz band to detect the band with the maximum peak.
In the power spectral density of the detected optical blood flow signal, factors such as respiration and motion noise are included. In the process of setting the frequency band of interest, the estimated pulse rate was within the effective pulse rate range by ignoring periodic components not related to the human pulse. The power spectral density of a physiological signal includes a fundamental frequency corresponding to the pulse rate and a harmonic frequency component that is an integer multiple of the source frequency. Pulse rate can be estimated through source frequency detection.
When the frequency band with the detected maximum power was f m a x , (1) was used to convert it into beats per minute (BPM).
HR = f m a x × 60
For example, when the frequency band having the maximum power in a certain optical blood flow signal is 1.1, the average heart rate can be estimated as 66 bpm.
In order to obtain heart rate variability (HRV) information for further analysis, it is necessary to measure the peak-to-peak interval (PPI) in the signal in the time series domain. In order to obtain heart rate variability (HRV) information for further analysis, it is necessary to measure the peak-to-peak interval (PPI) in the signal in the time series domain. A separate peak detector module was used for peak position detection, and constraints were used to detect peak intervals within the effective pulse rate range. The guaranteed distance between the minimum peaks is determined by ‘fps/maximum pulse rate frequency’, and the maximum pulse rate is a variable that can be adjusted to suit the application scenario. For PPI calculation, position information of the peaks was stored in a separate array, and the timestamp difference value of the two most recent peaks was calculated as the current PPI.
The resolution is determined according to the frame rate, and considering 30 FPS (Frames Per Second), it has a resolution of about 2 BPM in the pulse section at rest and about 8 BPM in the high heart rate section. Considering 60 FPS, it can have a resolution of about 1 BPM in the pulse section at rest and about 4 BPM in the high heart rate section. Recently released general webcams have a performance of about 30 FPS in an uncompressed format with a resolution of 640 × 480 pixels, but detailed analysis of heart rate variability is possible depending on the performance conditions of the camera used.
Heart rate variability refers to a periodic change in heart rate and can be used to estimate stress status and health status through additional analysis. In addition, in the case of healthy people, the heart rate variability is irregular and complex in order to achieve a physiological balance in a short time by responding sensitively to changes, but the reduction in heart rate variability indicates that the dynamic changes and complexity of the heart rate has decreased. It was confirmed that the body’s ability to adapt has decreased as shown in Figure 6.
In order to extract physiological parameters from the signal, a window of a certain size is covered to estimate the parameters for the corresponding signal section. In this case, a sliding window method was used to extract continuous physiological parameters in real time. In order to estimate the heart rate that changes according to the physiological state of the body in real time and to estimate the stable heart rate from the power spectral density, a sliding window is applied at 1 s intervals while using a window of about 4 s. The physiological parameters obtained in this way operate well when the user is not in motion, but stable estimation may be difficult due to noise when facial movement occurs.
This is because, while the face is close to an ellipse, it is detected in a rectangular shape due to the characteristics of the existing face detector, increasing the probability of including background areas other than the face. When the face is rotated, the light reflection from the surface of the face changes, causing unstable detection of areas such as skin color, background, and hair. In order to alleviate the instability caused by noise, pulse rate filtering was performed using the characteristic that the pulse rate continuously beating follows a Gaussian distribution. Outliers were removed by applying Gaussian filtering to the power spectral density for pulse rate estimation by deriving the mean value and standard deviation of recent pulse rate estimates.
The input data can be largely divided into pre-recorded video files and image sequences, or real-time camera input. In the case of pre-recorded video files and image sequences, the input data must be assumed to be a fixed frame rate or include frame-by-frame timestamp information. In the case of real-time camera input, processing time per frame may vary depending on the state of the processor, leading to difficulty to assume a fixed frame rate. Assuming a real-time camera input with a frame rate of 30, it is theoretically possible to read 30 frames per second, but in reality, there may be cases where only one or two frames are missing and only less than 30 frames are read. For example, assuming that a time window having a length of 4 s is used, an error of a physiological parameter estimated later may increase due to the accumulation of such missing frames. To solve this problem, in the case of real-time camera input, the real-time frame rate was calculated by storing the timestamp at the point of processing each frame internally in a separate array. If the signal length corresponding to the time window is k, the real-time frame rate is calculated by (2).
frame   rate = k ×   t a m p s [ k 1 ] ×   t a m p s [ 0 ]
More accurate physiological parameter estimation is possible by calculating the frame rate at the time of calculating the filtering unit and the physiological parameter estimating unit as a value approximating the actual frame rate.

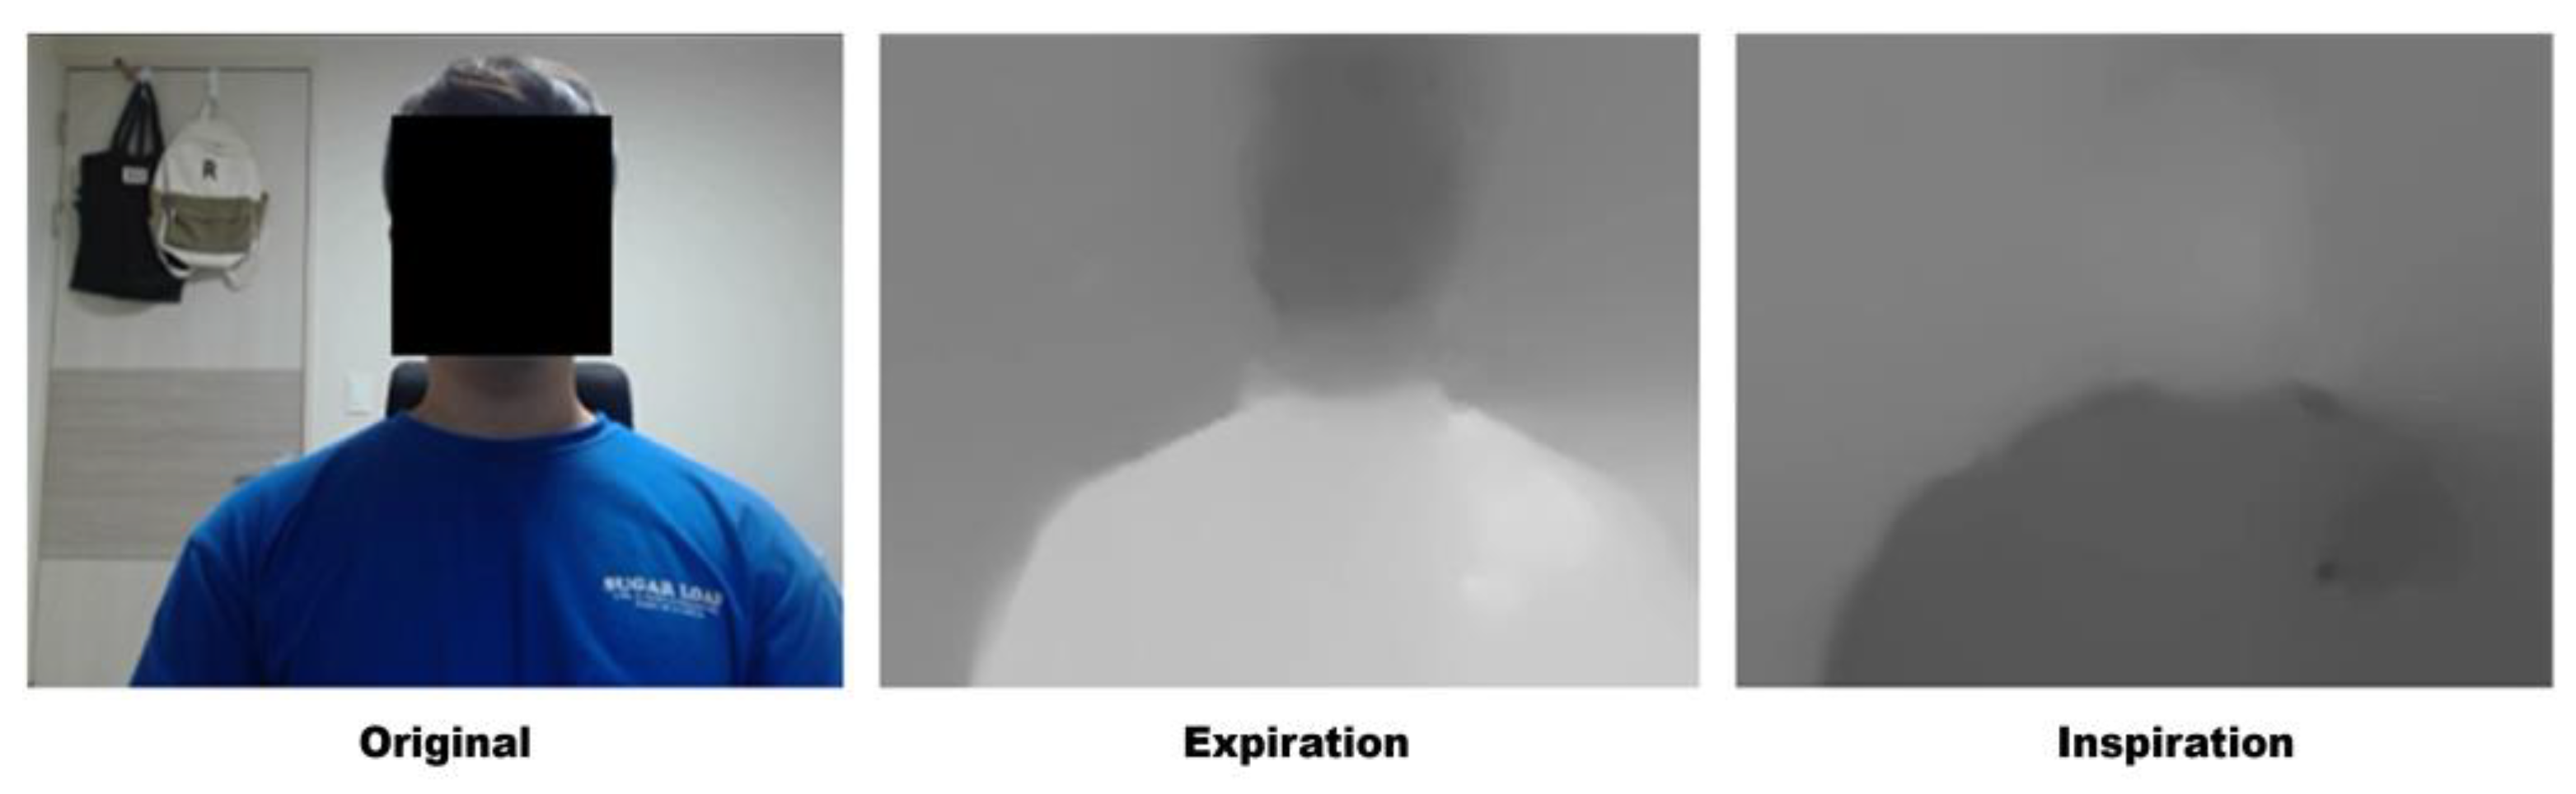
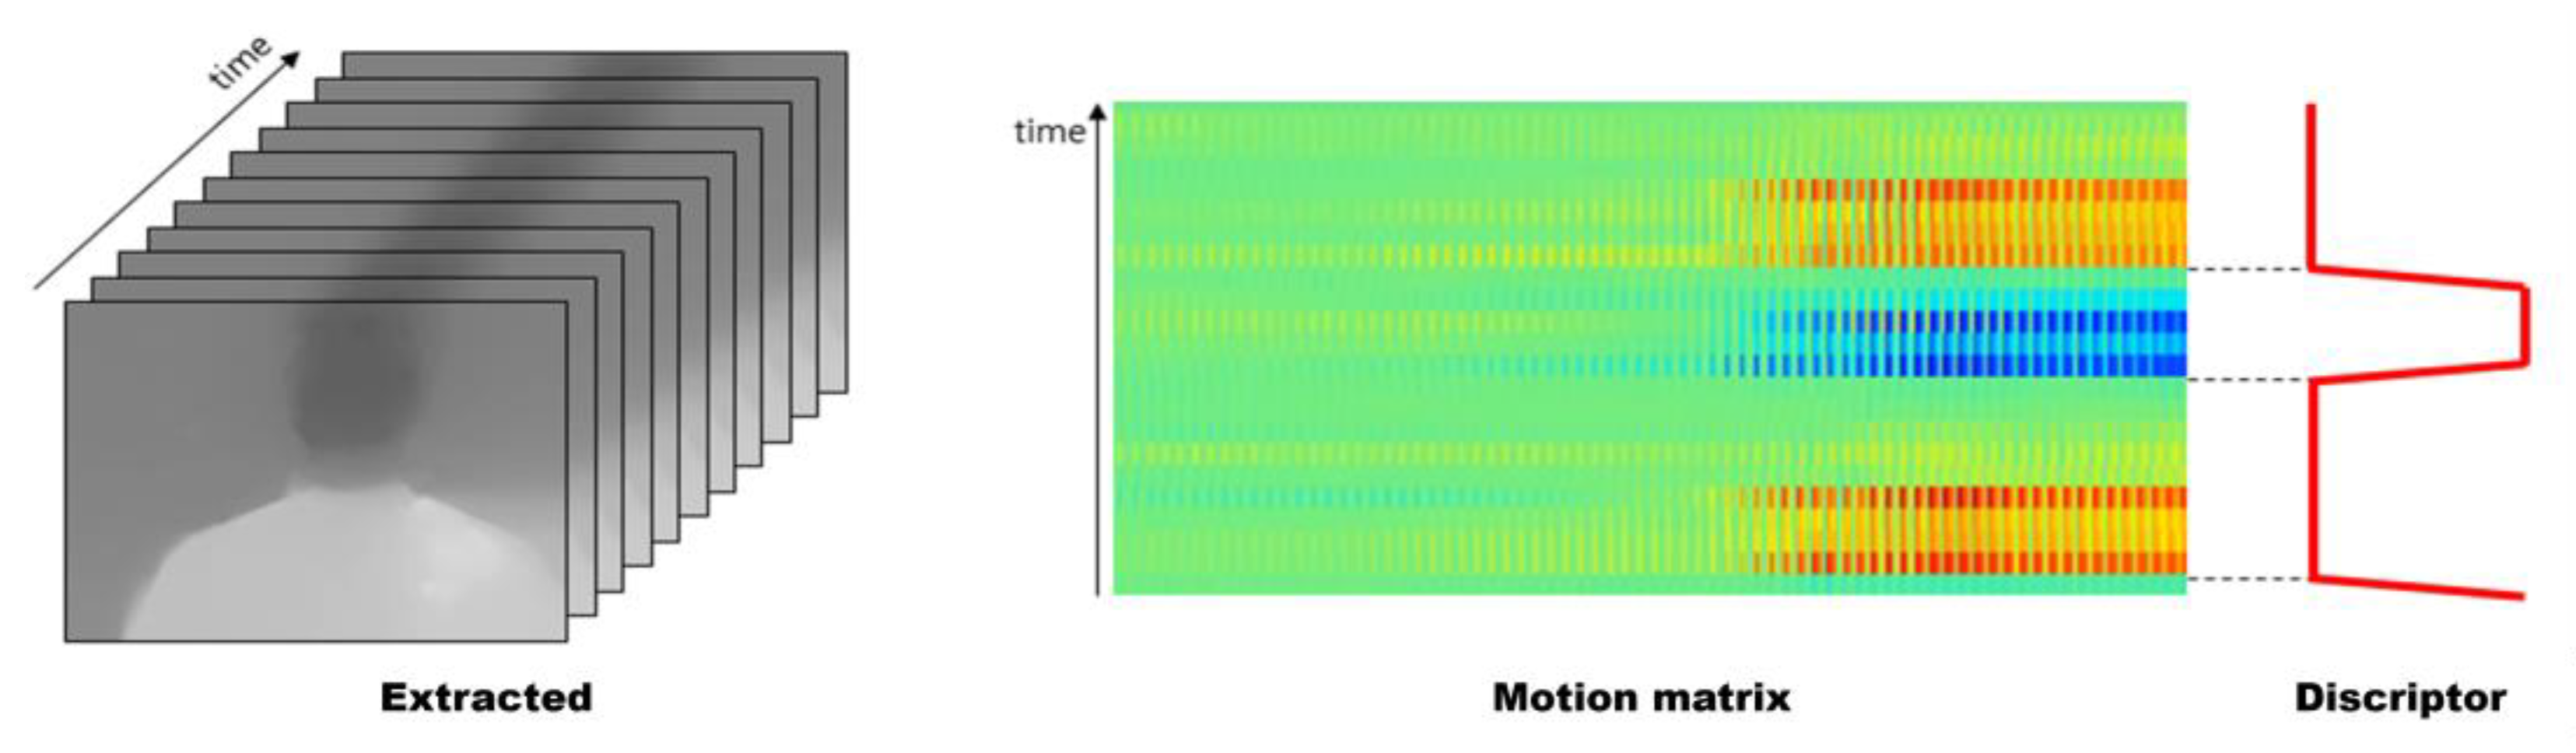
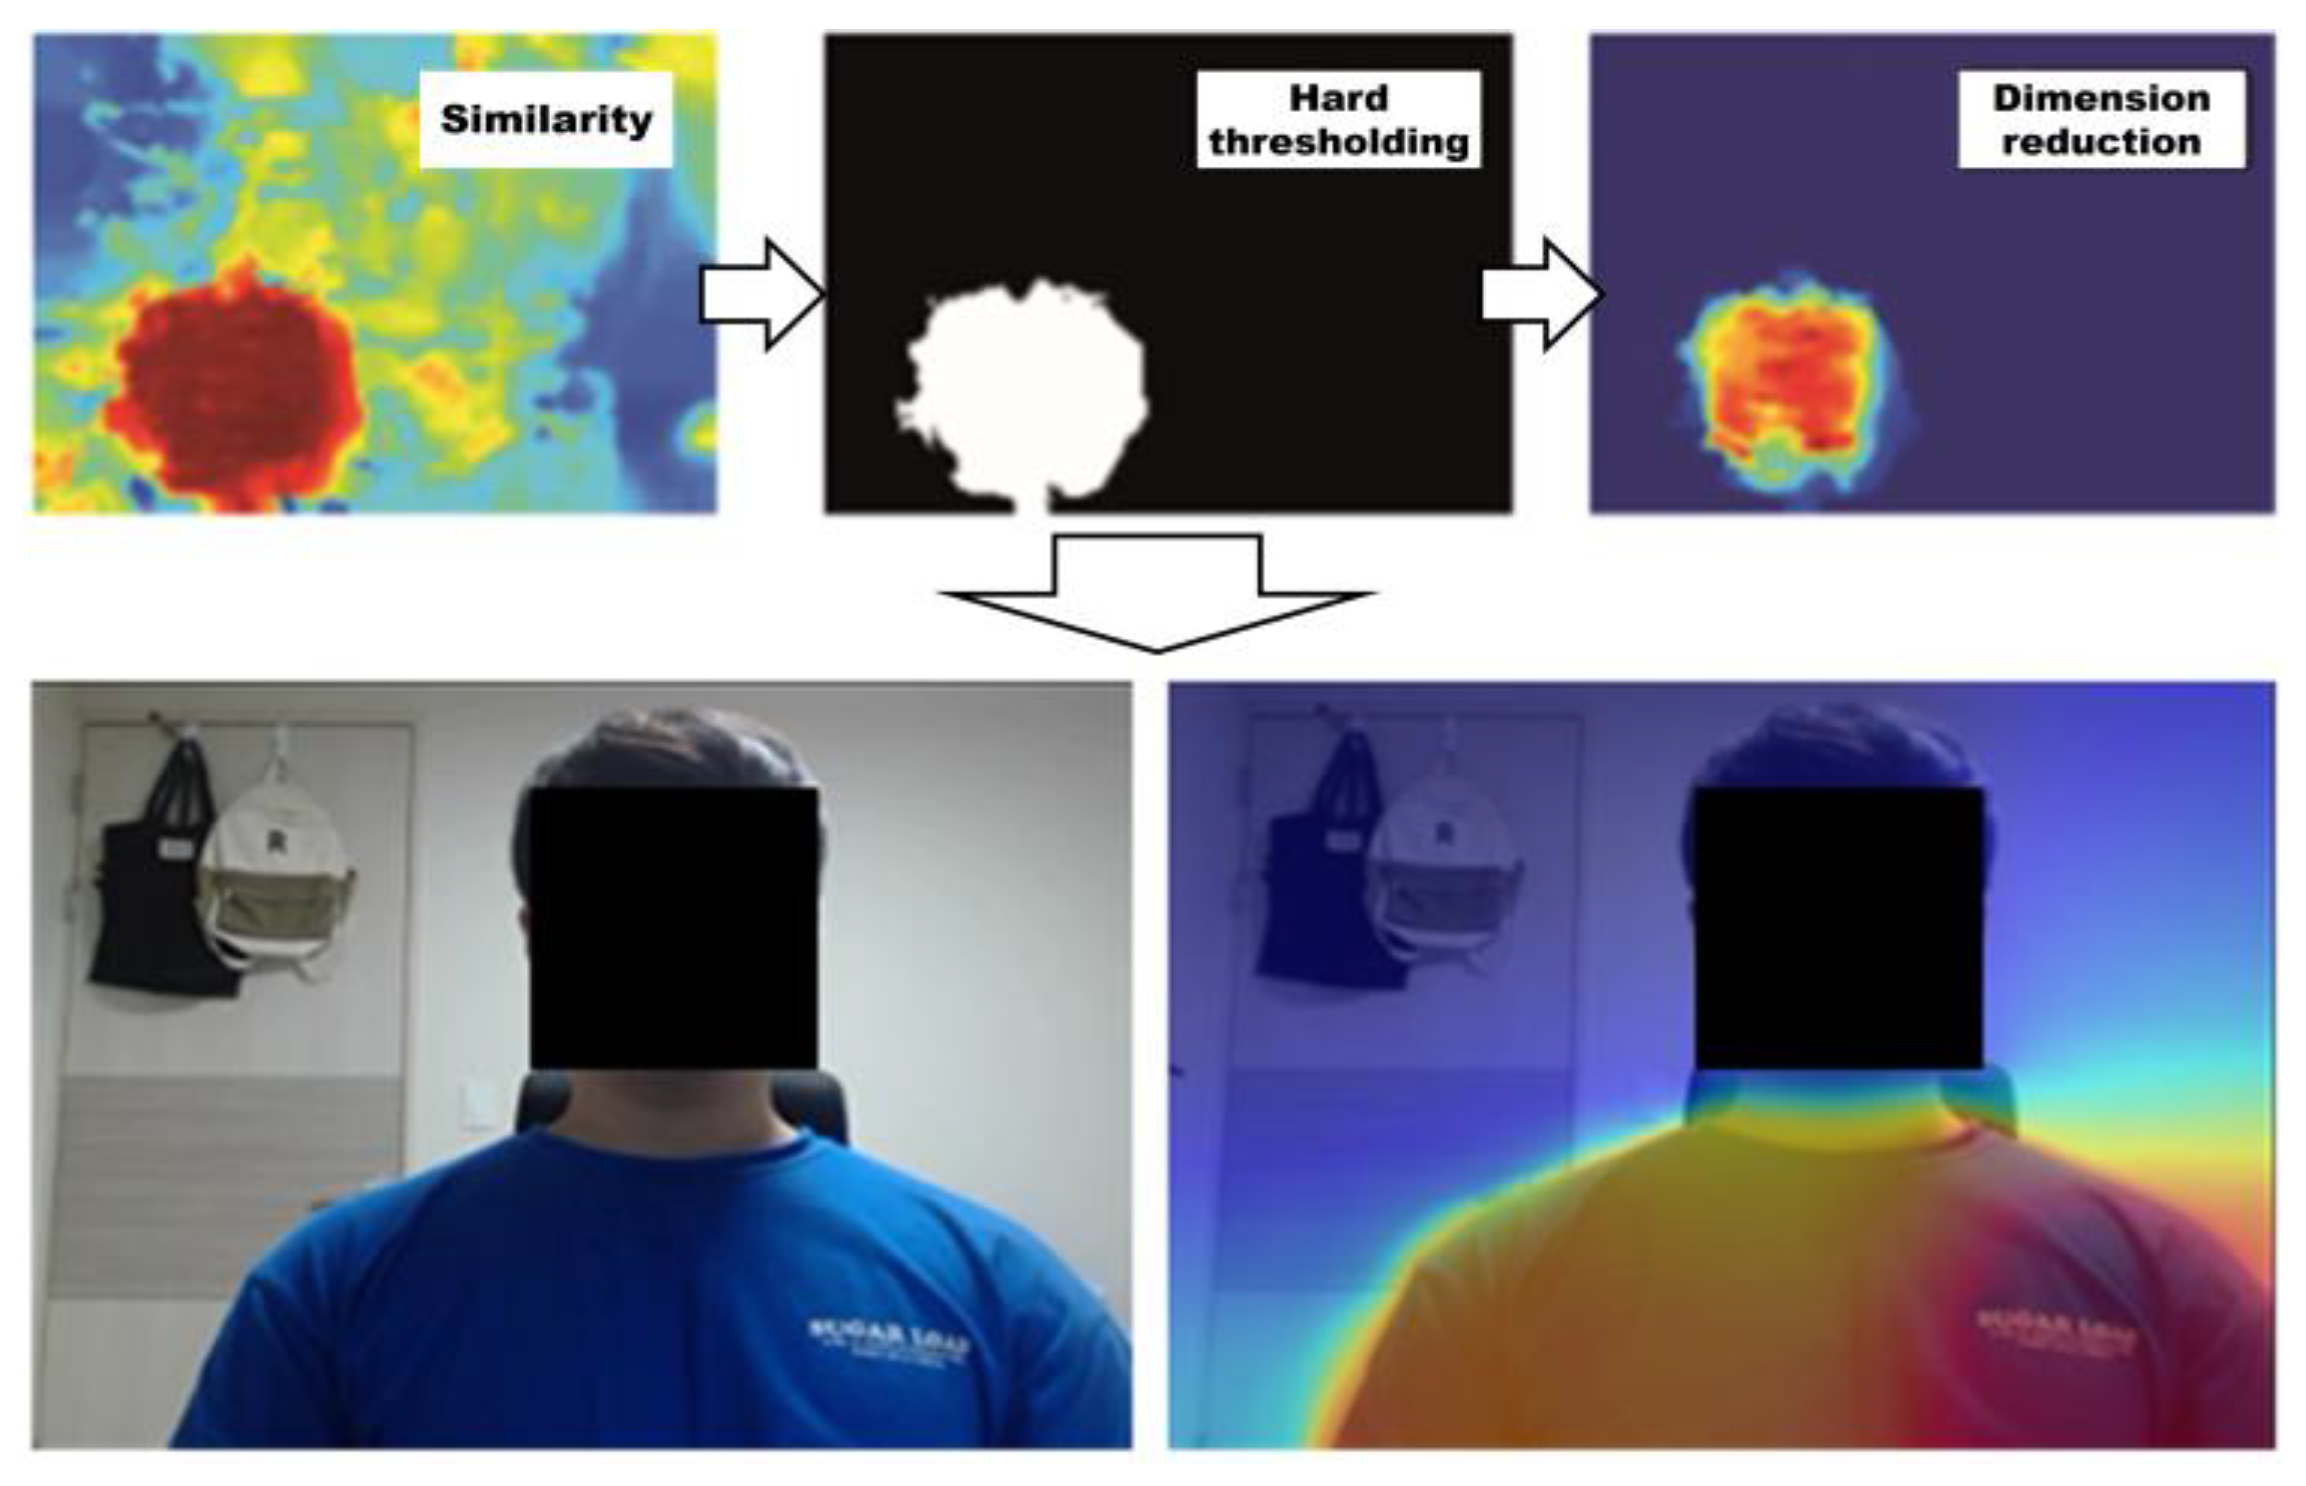
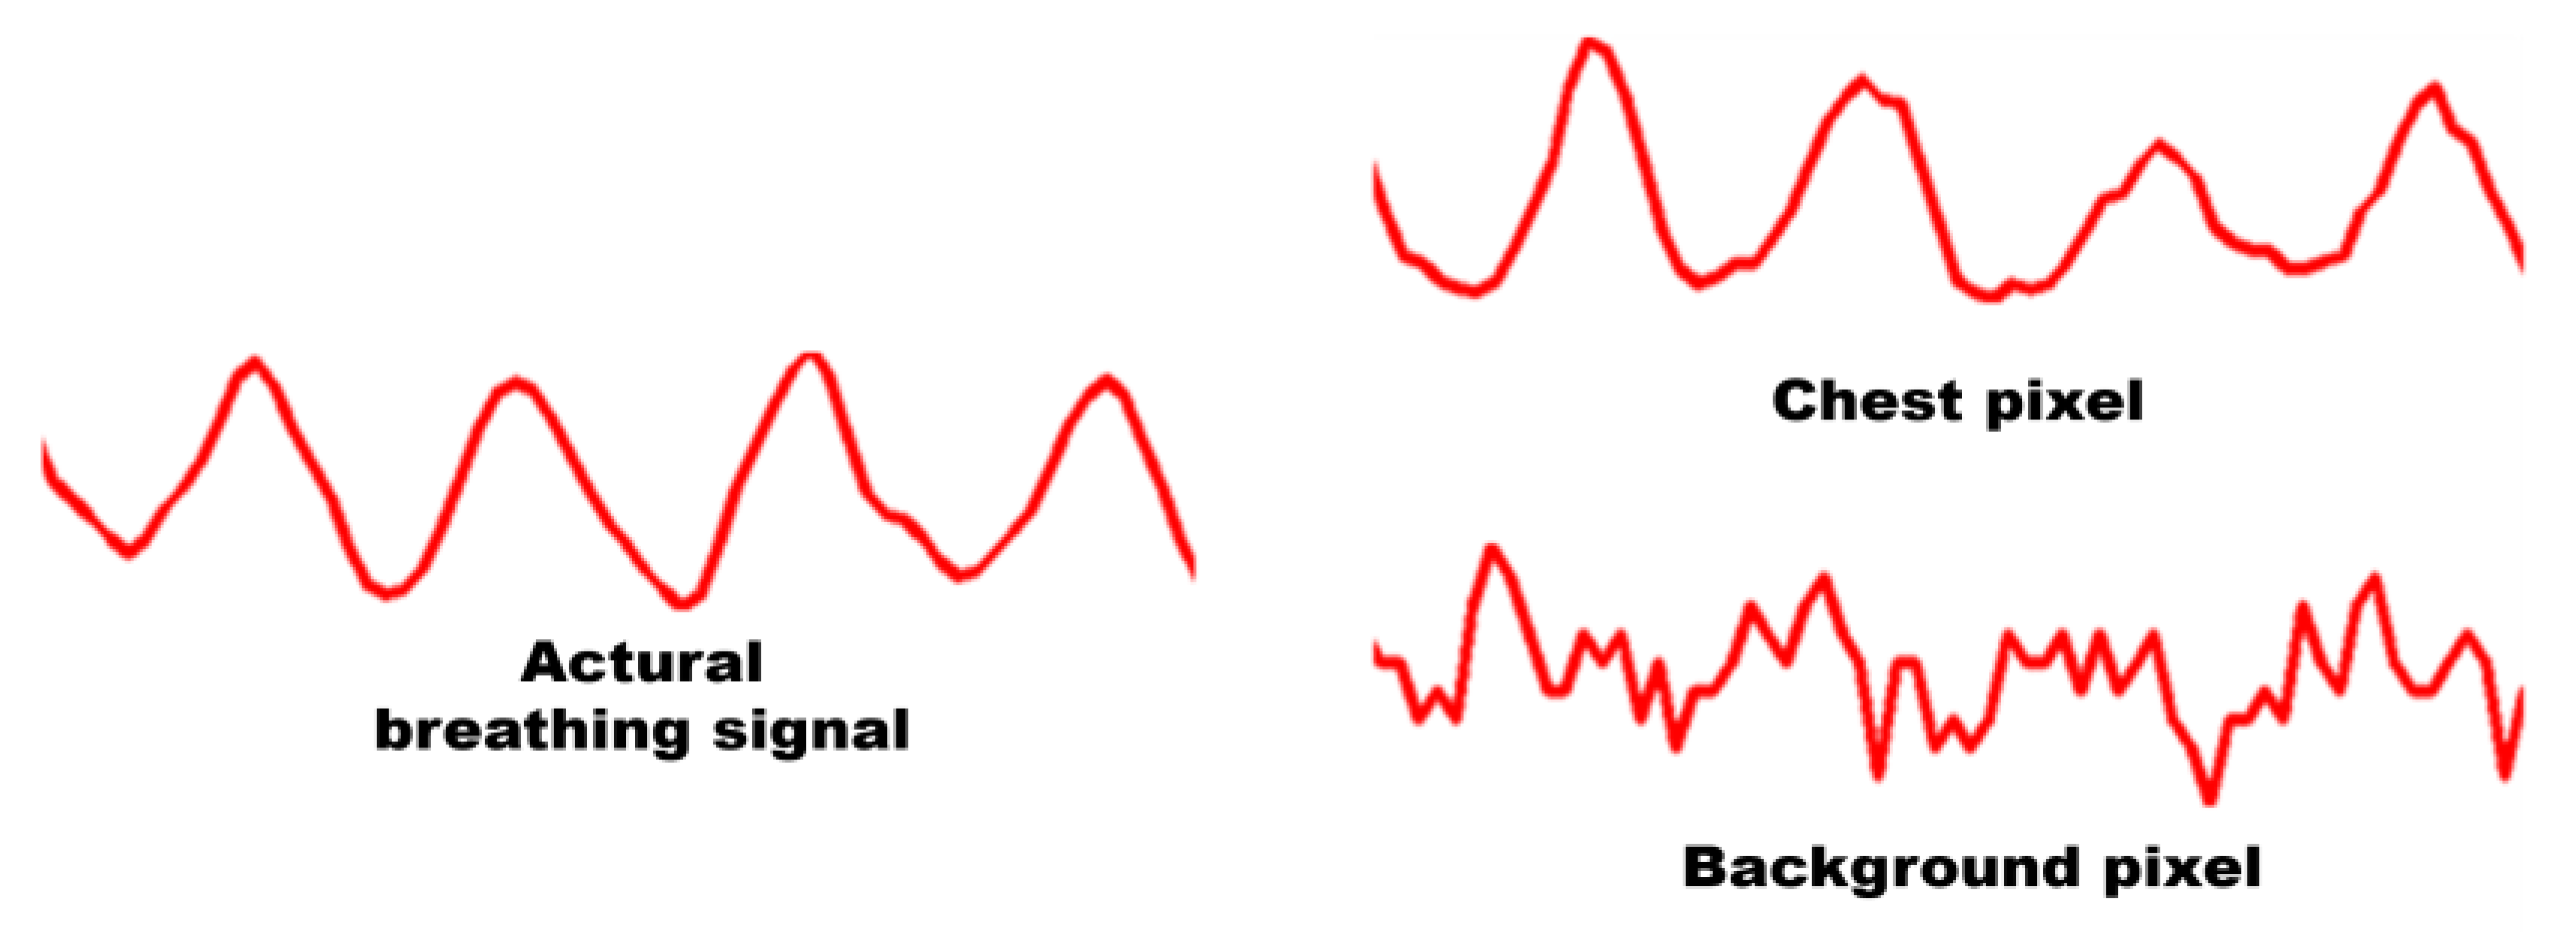
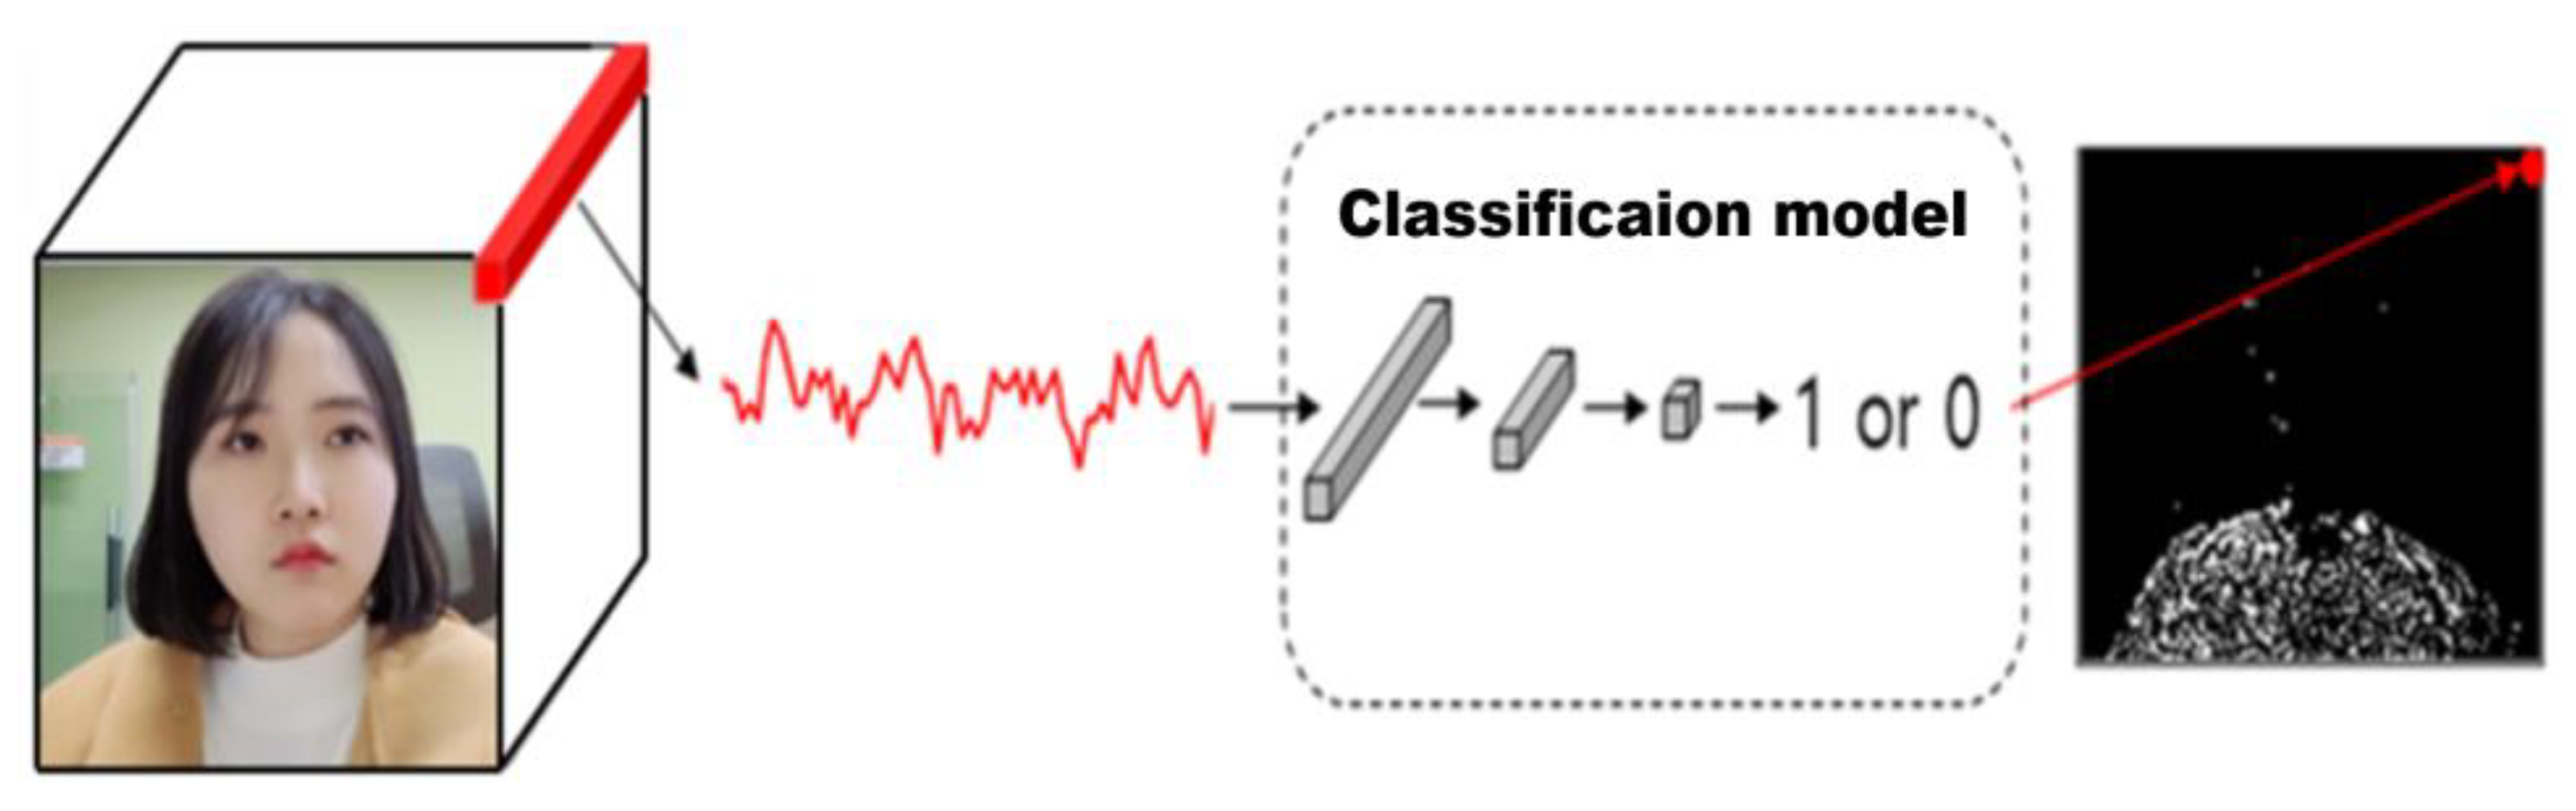
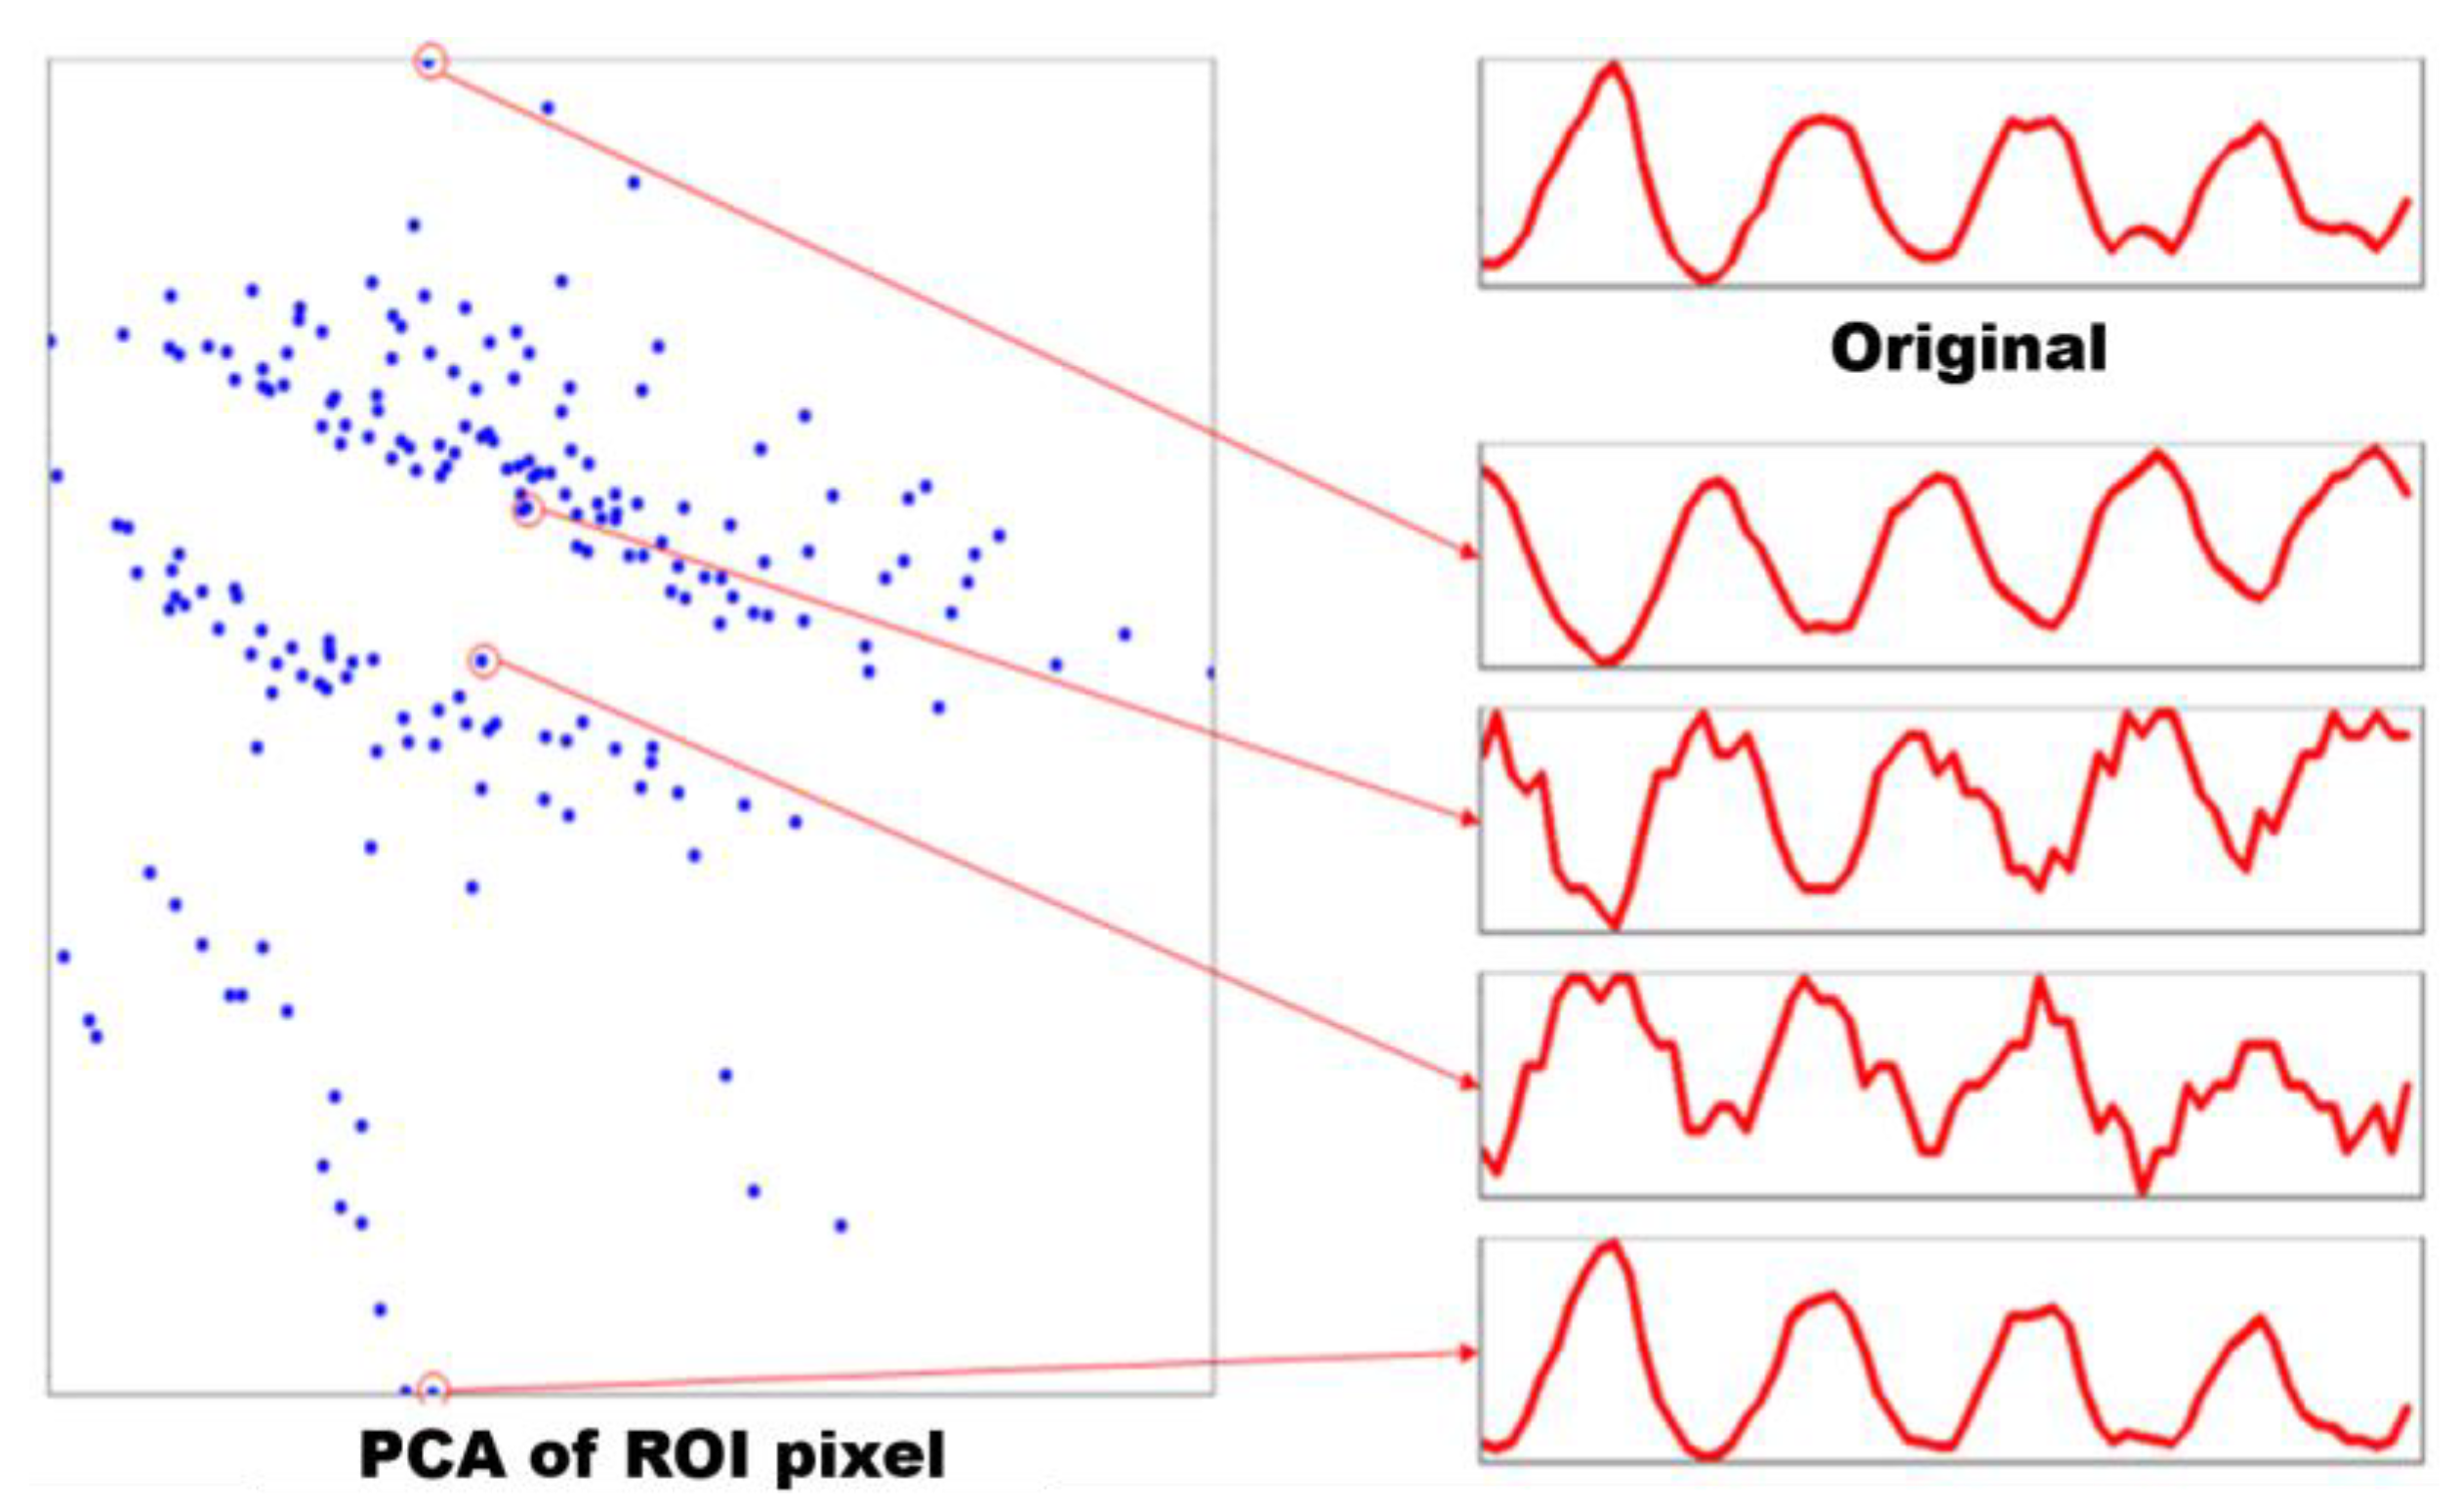
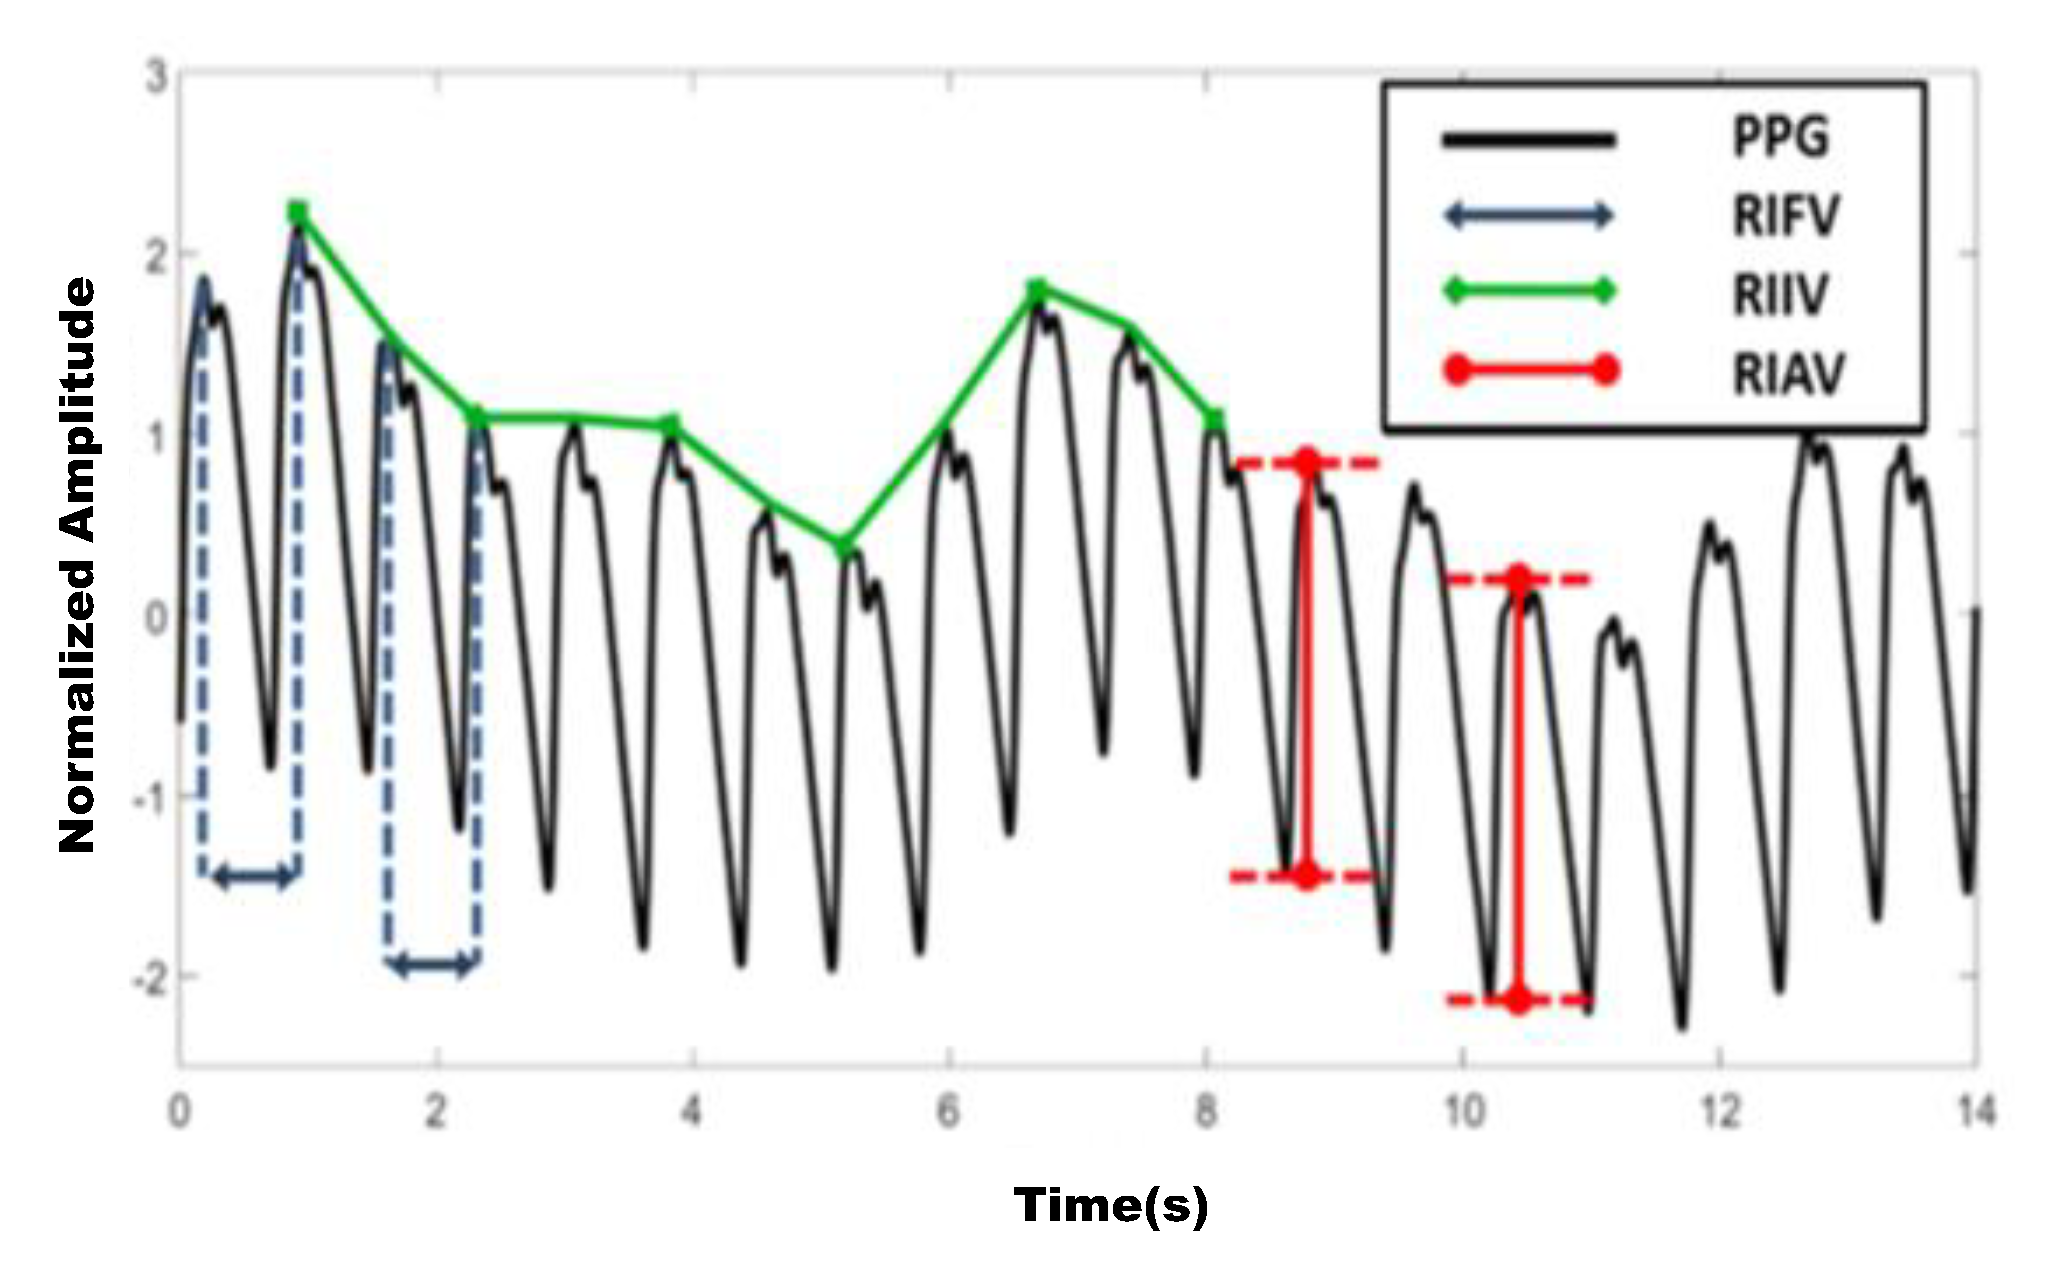
3.2. Respiration Signal Acquisition

Figure 7 shows the user’s motion extracted by applying the optical flow proposed by Brox [30]. Since this optical flow is a dense optical flow that calculates motion information for all pixels, it is possible to extract motion information of the entire image. Since the movement caused by respiration is mainly related to the up/down movement, only the up/down movement information was used among the detected movement information.
In order to extract respiration information using the motion information detected in Figure 7, motion vectors for all pixels within a frame for a certain time window must be obtained. The time window size was used as 23 in the 4 fps environment because the time window should be set to a sufficient size to cover at least one breathing cycle. Motion vectors are compressed into Eigen vectors to obtain a motion matrix. Respiration information was amplified through a chi-square kernel for all motion trajectories in the motion matrix, and noise was removed and refined. It is shown in Figure 8 that the respiration information descriptor present in the image is extracted from the refined result.
Respiration descriptor was used to detect the region containing respiration information in the image as an ROI. The similarity was calculated through the dot product of the respiration descriptor and the motion vector of each pixel: it is shown in Figure 9 that the final respiration ROI is detected by applying pixel similarity dimensionality reduction.
Changes in pixels can be observed in a certain time window, and movements of the chest and head due to breathing also cause these changes in pixels. Since the pixels in which the change is caused by respiration shows a change pattern similar to the actual respiration signal, it is possible to classify the presence or absence of respiration information by analyzing the similarity between the pixel change and the respiration signal.
We have designed a learning model (Figure 11) that analyzes the pattern of changes in pixels obtained in Figure 10 to classify whether changes are caused by respiration or not. Compared to the case where video is input (input data is four-dimensional; time window, image height, image width, image channels), the model has a characteristic that the structural characteristics of the image are not reflected in the classification of the model (the input data is two-dimensional; time window, image channels) can significantly reduce the complexity of training data. In the case of using a video as an input, one video is one data sample, but the designed model contains more than 300,000 data samples in one video, so efficient learning is possible (Figure 11).
Pixels (ROI) including respiration information can be detected using the learned model, and pixels from which noise components are almost removed can be selected and refined using the classification result. In addition, it is possible to obtain breathing information by amplifying the motion of the video in the normal breathing frequency band (0.17~0.7 Hz), and by amplifying the breathing information, a breathing signal that is robust to noise was extracted as shown in Figure 12.
If the average of the ROI signal values is used for signal extraction, the respiration information is canceled by the inverted phase, and the correct respiration signal cannot be estimated, so a method of aligning the phase is needed to improve this problem. For example, assuming that the signal of one pixel is a 64-dimensional vector, it is possible to determine the trend of clustering of pixels having the same phase in the corresponding space, so that the phase of the signal can be classified through a clustering algorithm. Representative clustering algorithms are k-means [31], a distance-based clustering method, and DBSCAN [32], a density-based clustering method. In the distance-based clustering method, the criterion for determining clusters is Euclidean distance, and since each cluster tends to form a prototype, correct performance cannot be guaranteed for clusters that cannot be expressed as a prototype. The density-based clustering method is robust to the shape of the data distribution, but the results are greatly changed by parameters such as epsilon that are determined in advance, and there is a limit to the detection of clusters with different densities. Since a vector whose phase is inverted has a characteristic of opposite directions in a 64-dimensional space, using the cosine distance can obtain a direction similarity independent of the size of the vector. Therefore, as shown in Figure 13 by applying hierarchical clustering based on the cosine distance, it is possible to classify clusters with different vector directions, and through phase alignment, it is possible to extract a refined signal by reducing noise such as cancellation caused by integrating signals with different phases.
The higher the precision of the ROI detector, the higher the quality of the signal contained in the pixel, but it is susceptible to noise, making it difficult to detect ROI even with small movements other than breathing. On the other hand, the higher the recall of the ROI detector, the more robust the ROI can be detected, but the quality of the signal included in the ROI is degraded, and pixels other than the respiration may be included in the ROI. To detect an appropriate ROI that can be used for analysis, precision and reproducibility must also be considered, so some noise may be included in the ROI detection result. When noise pixels are included in the ROI, when clustering is performed in two clusters, noise is included in each cluster, making it difficult to obtain an appropriate respiration signal. Therefore, it is necessary to utilize additional information that can separate the noise from the respiratory information cluster.
The phase of the signal is opposite when the movement caused by the same breath changes from light to dark and from dark to light. This means that the movement induced by breathing has a symmetry with respect to the origin.
Therefore, if one performs clustering by adding the origin-symmetric data to the original data (Figure 14), one can obtain the result shown in Figure 15 by this symmetry. Analyzing the type of data included in the cluster, it is determined that the two clusters have symmetry when the same type of data is included in another cluster. Therefore, noise can be removed by using this symmetric data cluster for respiration signal estimation.
The technology to classify breathing signals by utilizing the symmetry of the signal as a feature shows excellent performance when it is a stable breathing signal, but when noise occurs in the breathing signal itself, the symmetry is broken and the performance is degraded. In particular, when the object is moving, noise, not breathing information, can be easily included in the breathing pixel. In the case of movement, stable breathing information must be maintained for as long as the time window to restore symmetry and to obtain correct breathing information again. Whenever movement occurs, there may be a delay in which correct breathing measurements cannot be made for this reason. It is shown in Figure 16 that unlike the previous method, in which all information of a certain time window was used, it was possible to continuously measure breath without delay by using only the motion of the most recent frame.
Since the parameters of the ROI detection model are adjusted to accommodate some noise in consideration of the reproducibility, respiration pixels can be detected robustly against noise caused by movement, etc. If the detected breathing pixels are tracked by optical flow, it is possible to quantify the movement of the pixels, and among them, the breathing information can be estimated through up-and-down motion information directly related to breathing. Unlike the previous method, in which all information of a certain time window was used, it is possible to continuously measure breath without delay by using only the motion of the most recent frame.
Typical causes of changes in blood flow are heart rate and respiration. As shown in Figure 17, changes in chest pressure caused by breathing can cause changes in blood flow. Since such a change in blood flow causes a minute change in skin color, respiration information obtained through observation of the change in skin color can be used to improve signal quality when a skin area is detected in an image. The respiration measurement method through motion analysis is susceptible to movement other than the movement caused by respiration, whereas the skin color change analysis method enables stable observation of changes through facial area tracking. If motion analysis is difficult due to movement, the method of measuring respiration from changes in skin color can be used as a good alternative.
Changes in blood flow due to heart rate are mainly periodic, and the cycle is shorter than changes due to breathing. Therefore, it is possible to estimate the respiration signal from which the heart rate component has been removed through a high-pass filter that can filter short periodic signals from the blood flow change signal. As shown in Figure 18, it is possible to extract more refined and stable breathing signals by integrating breathing information that can be obtained from skin color changes as well as motion analysis.

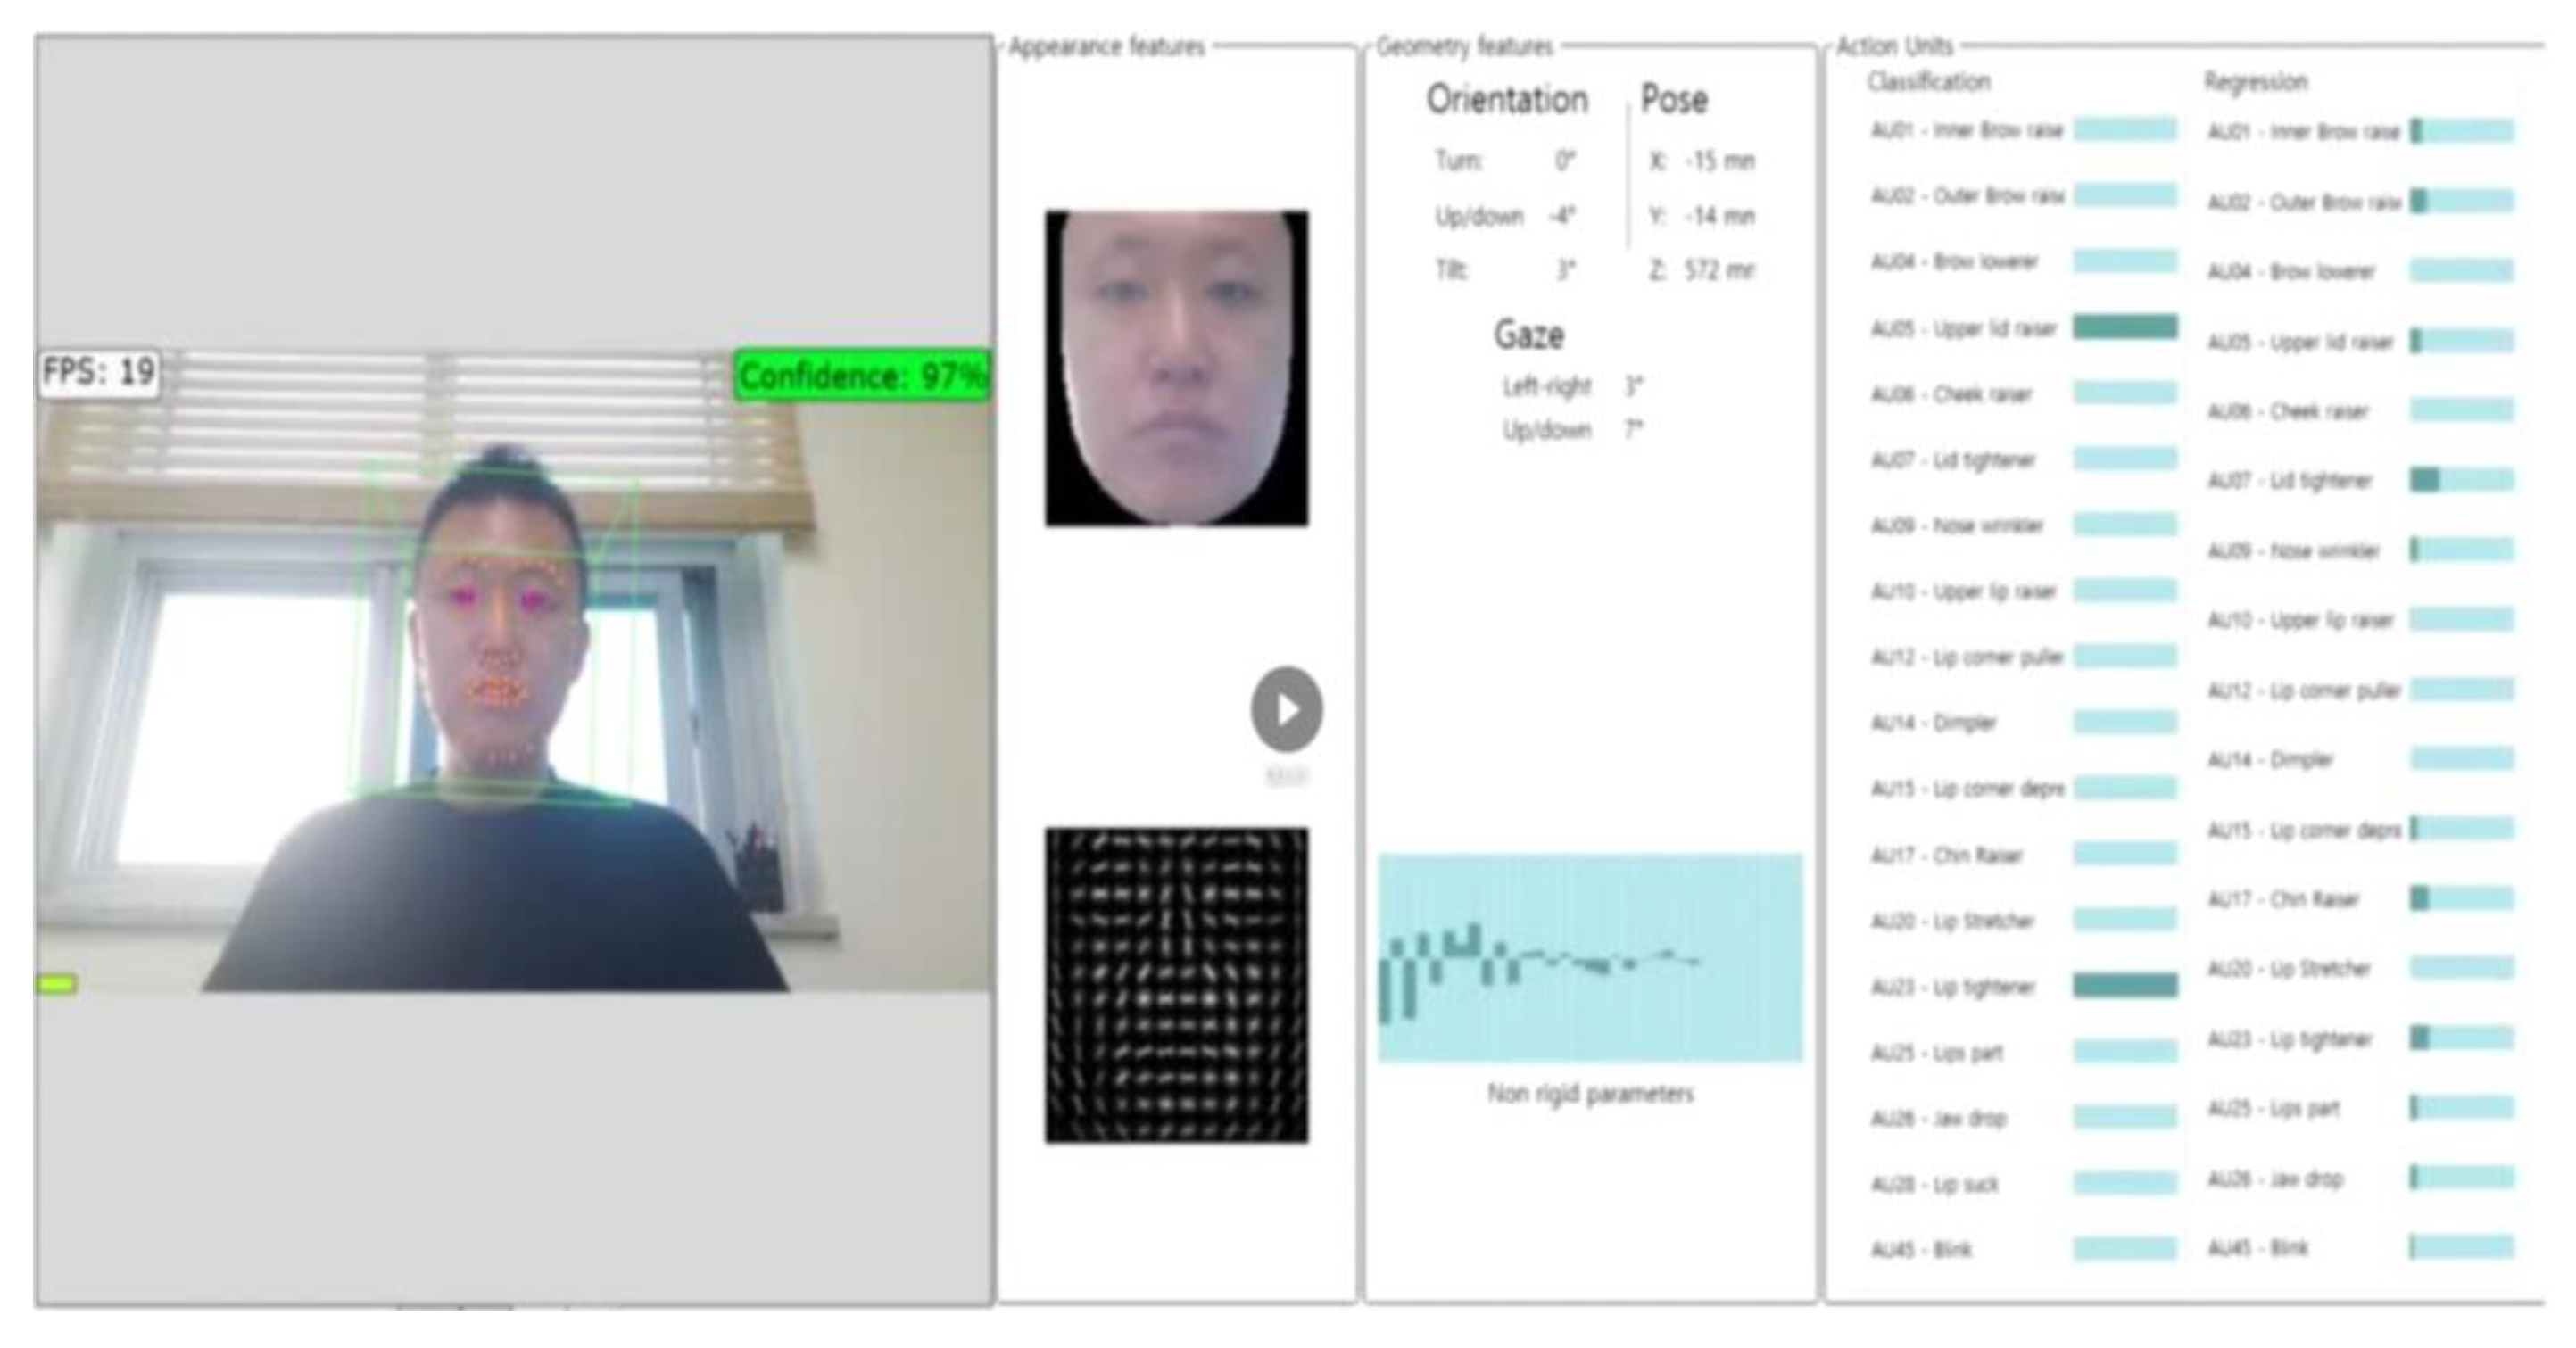
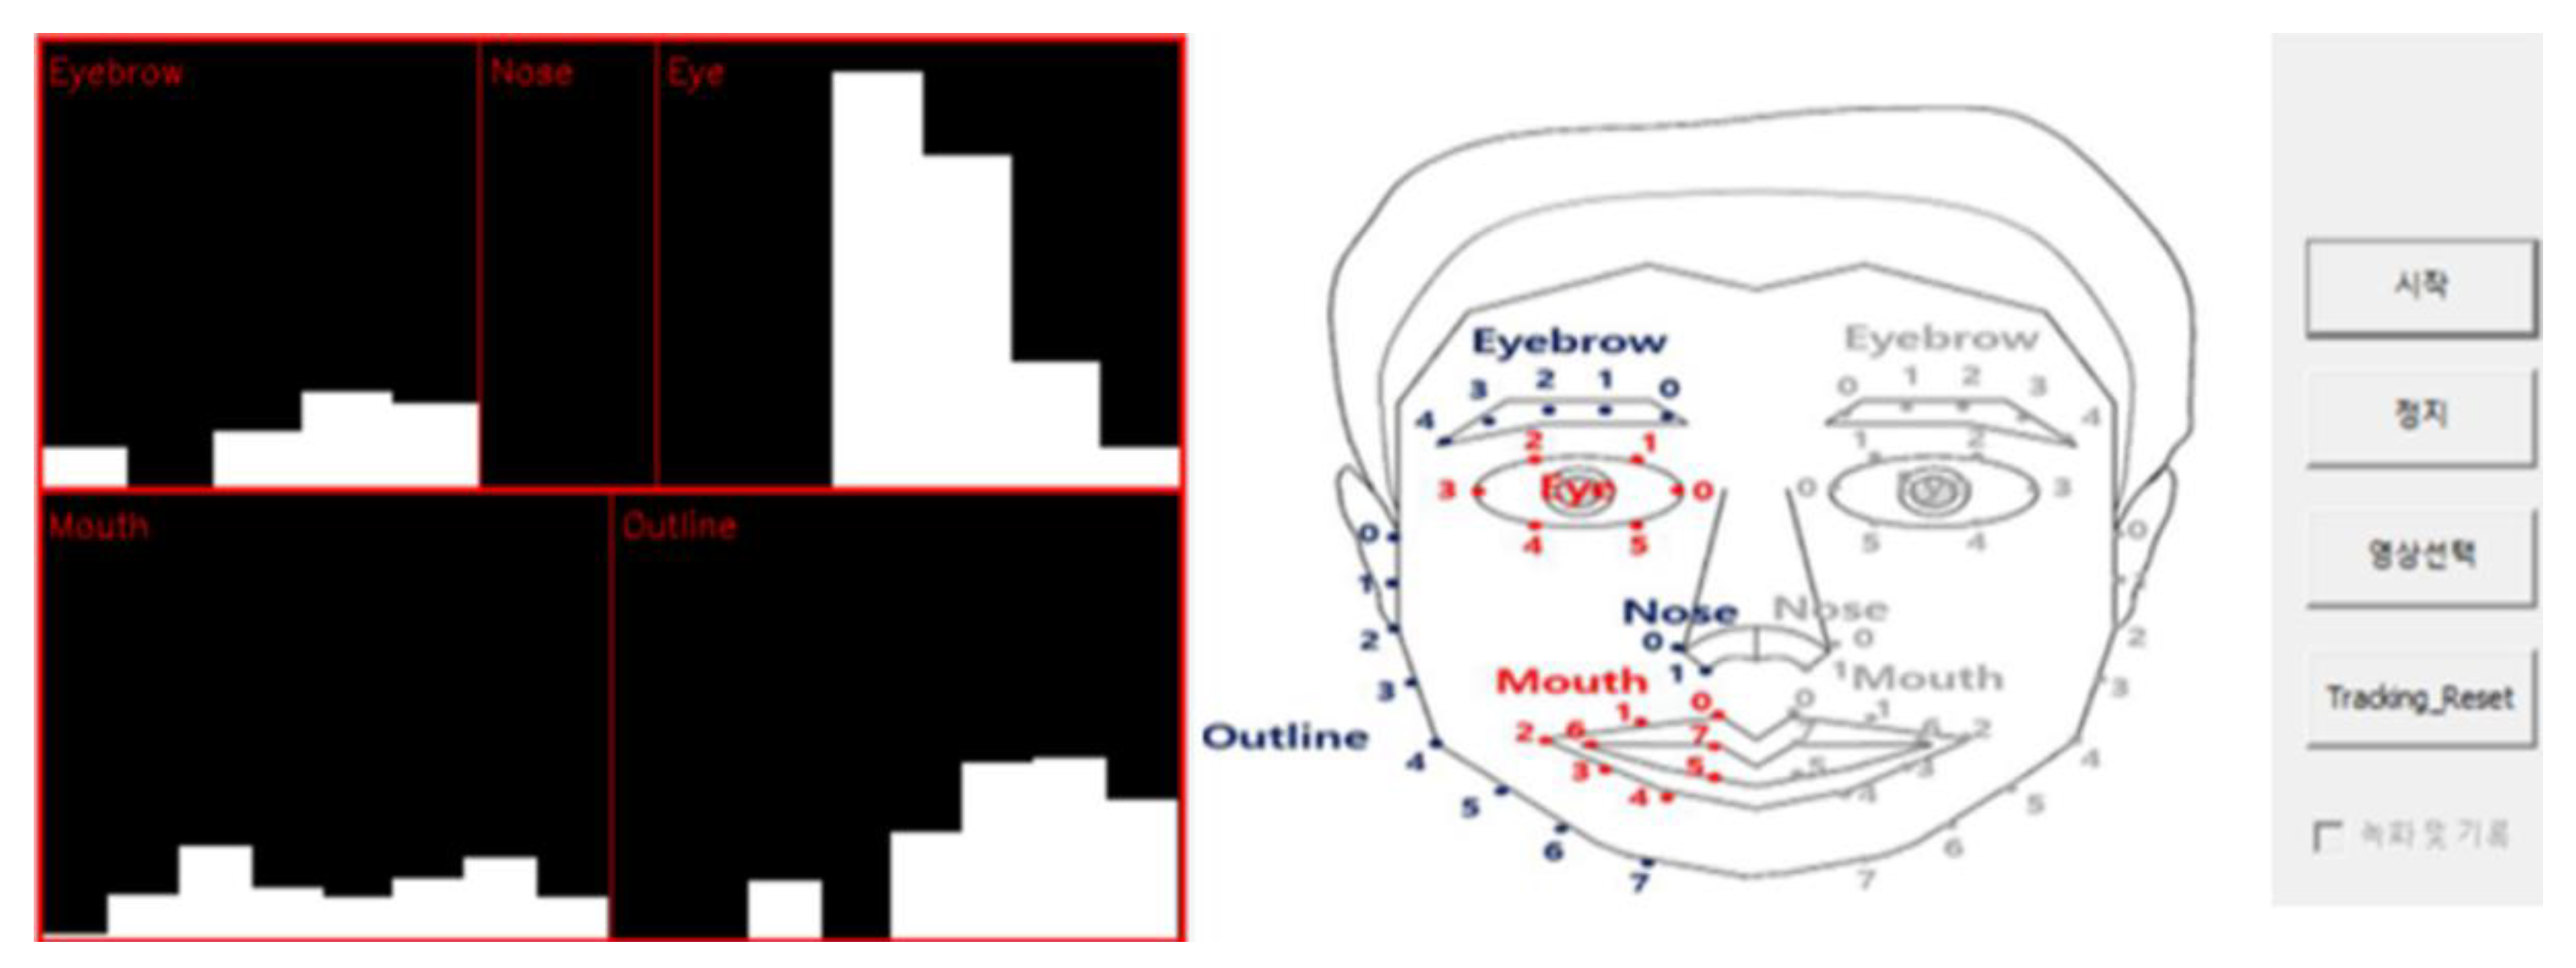
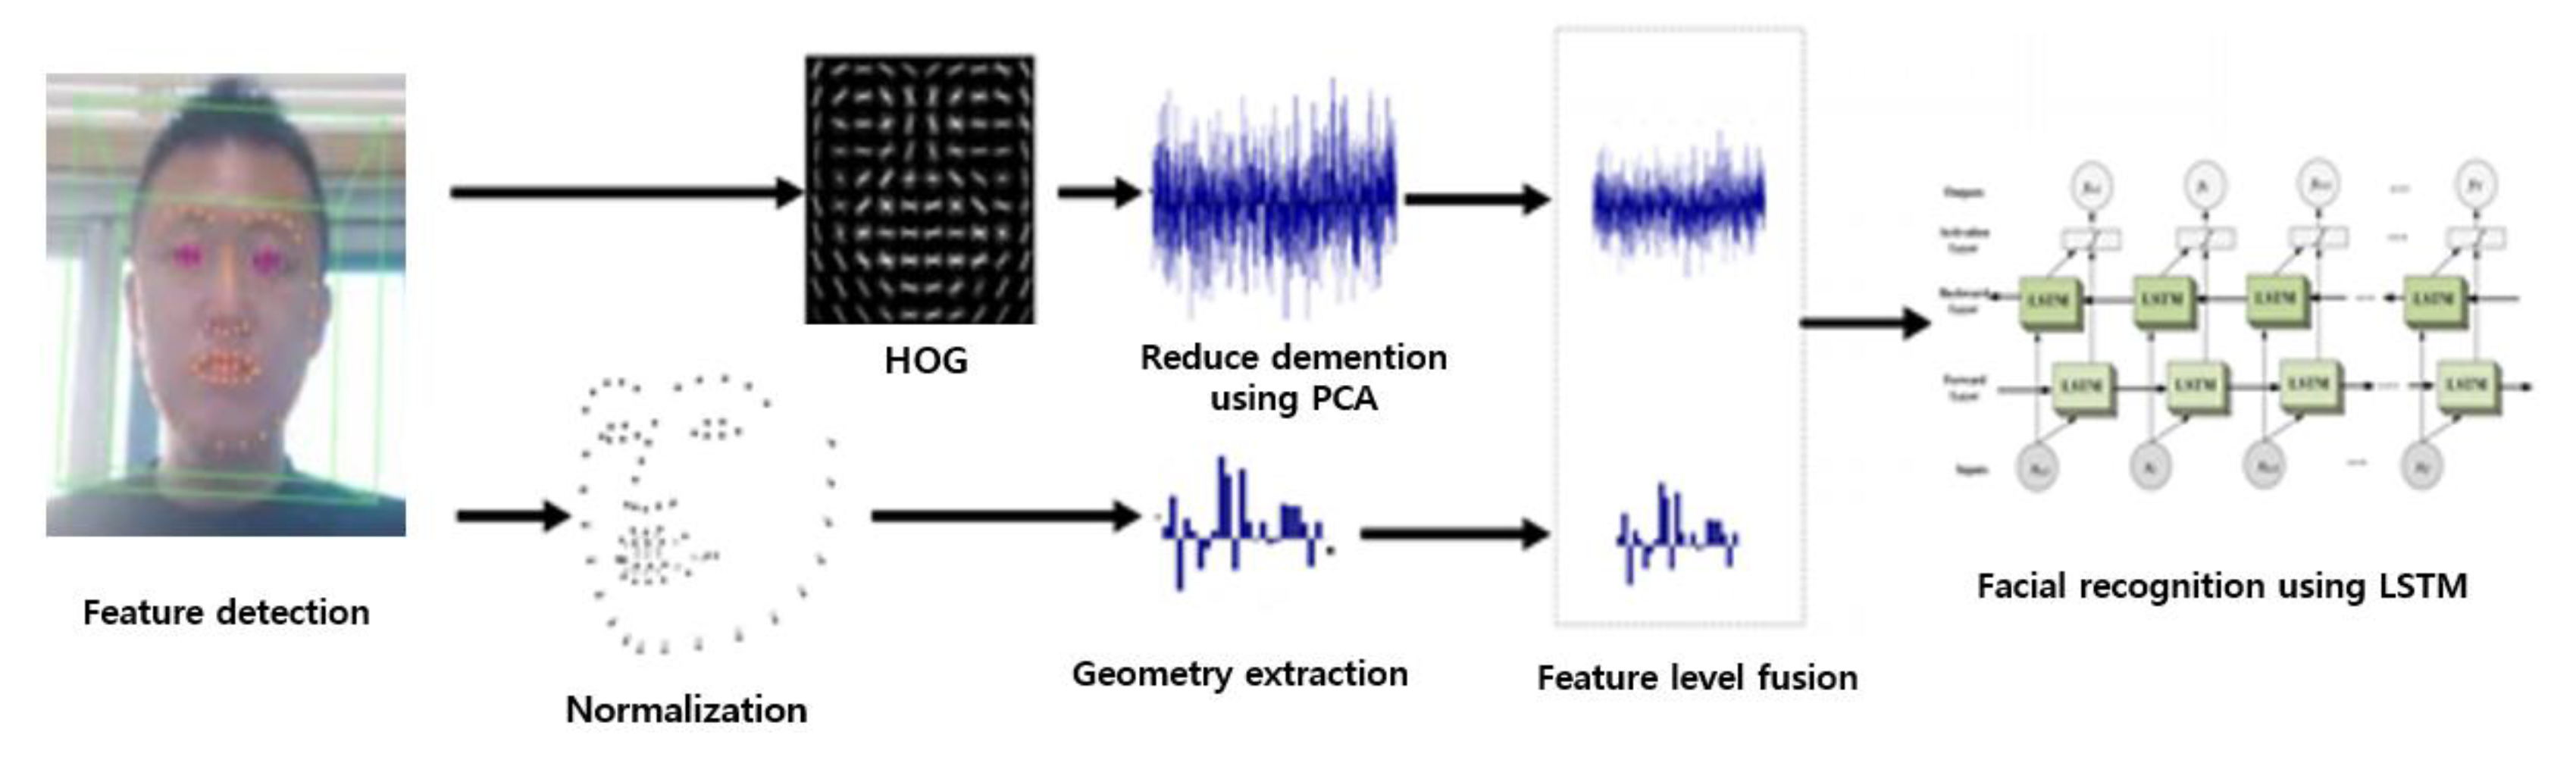
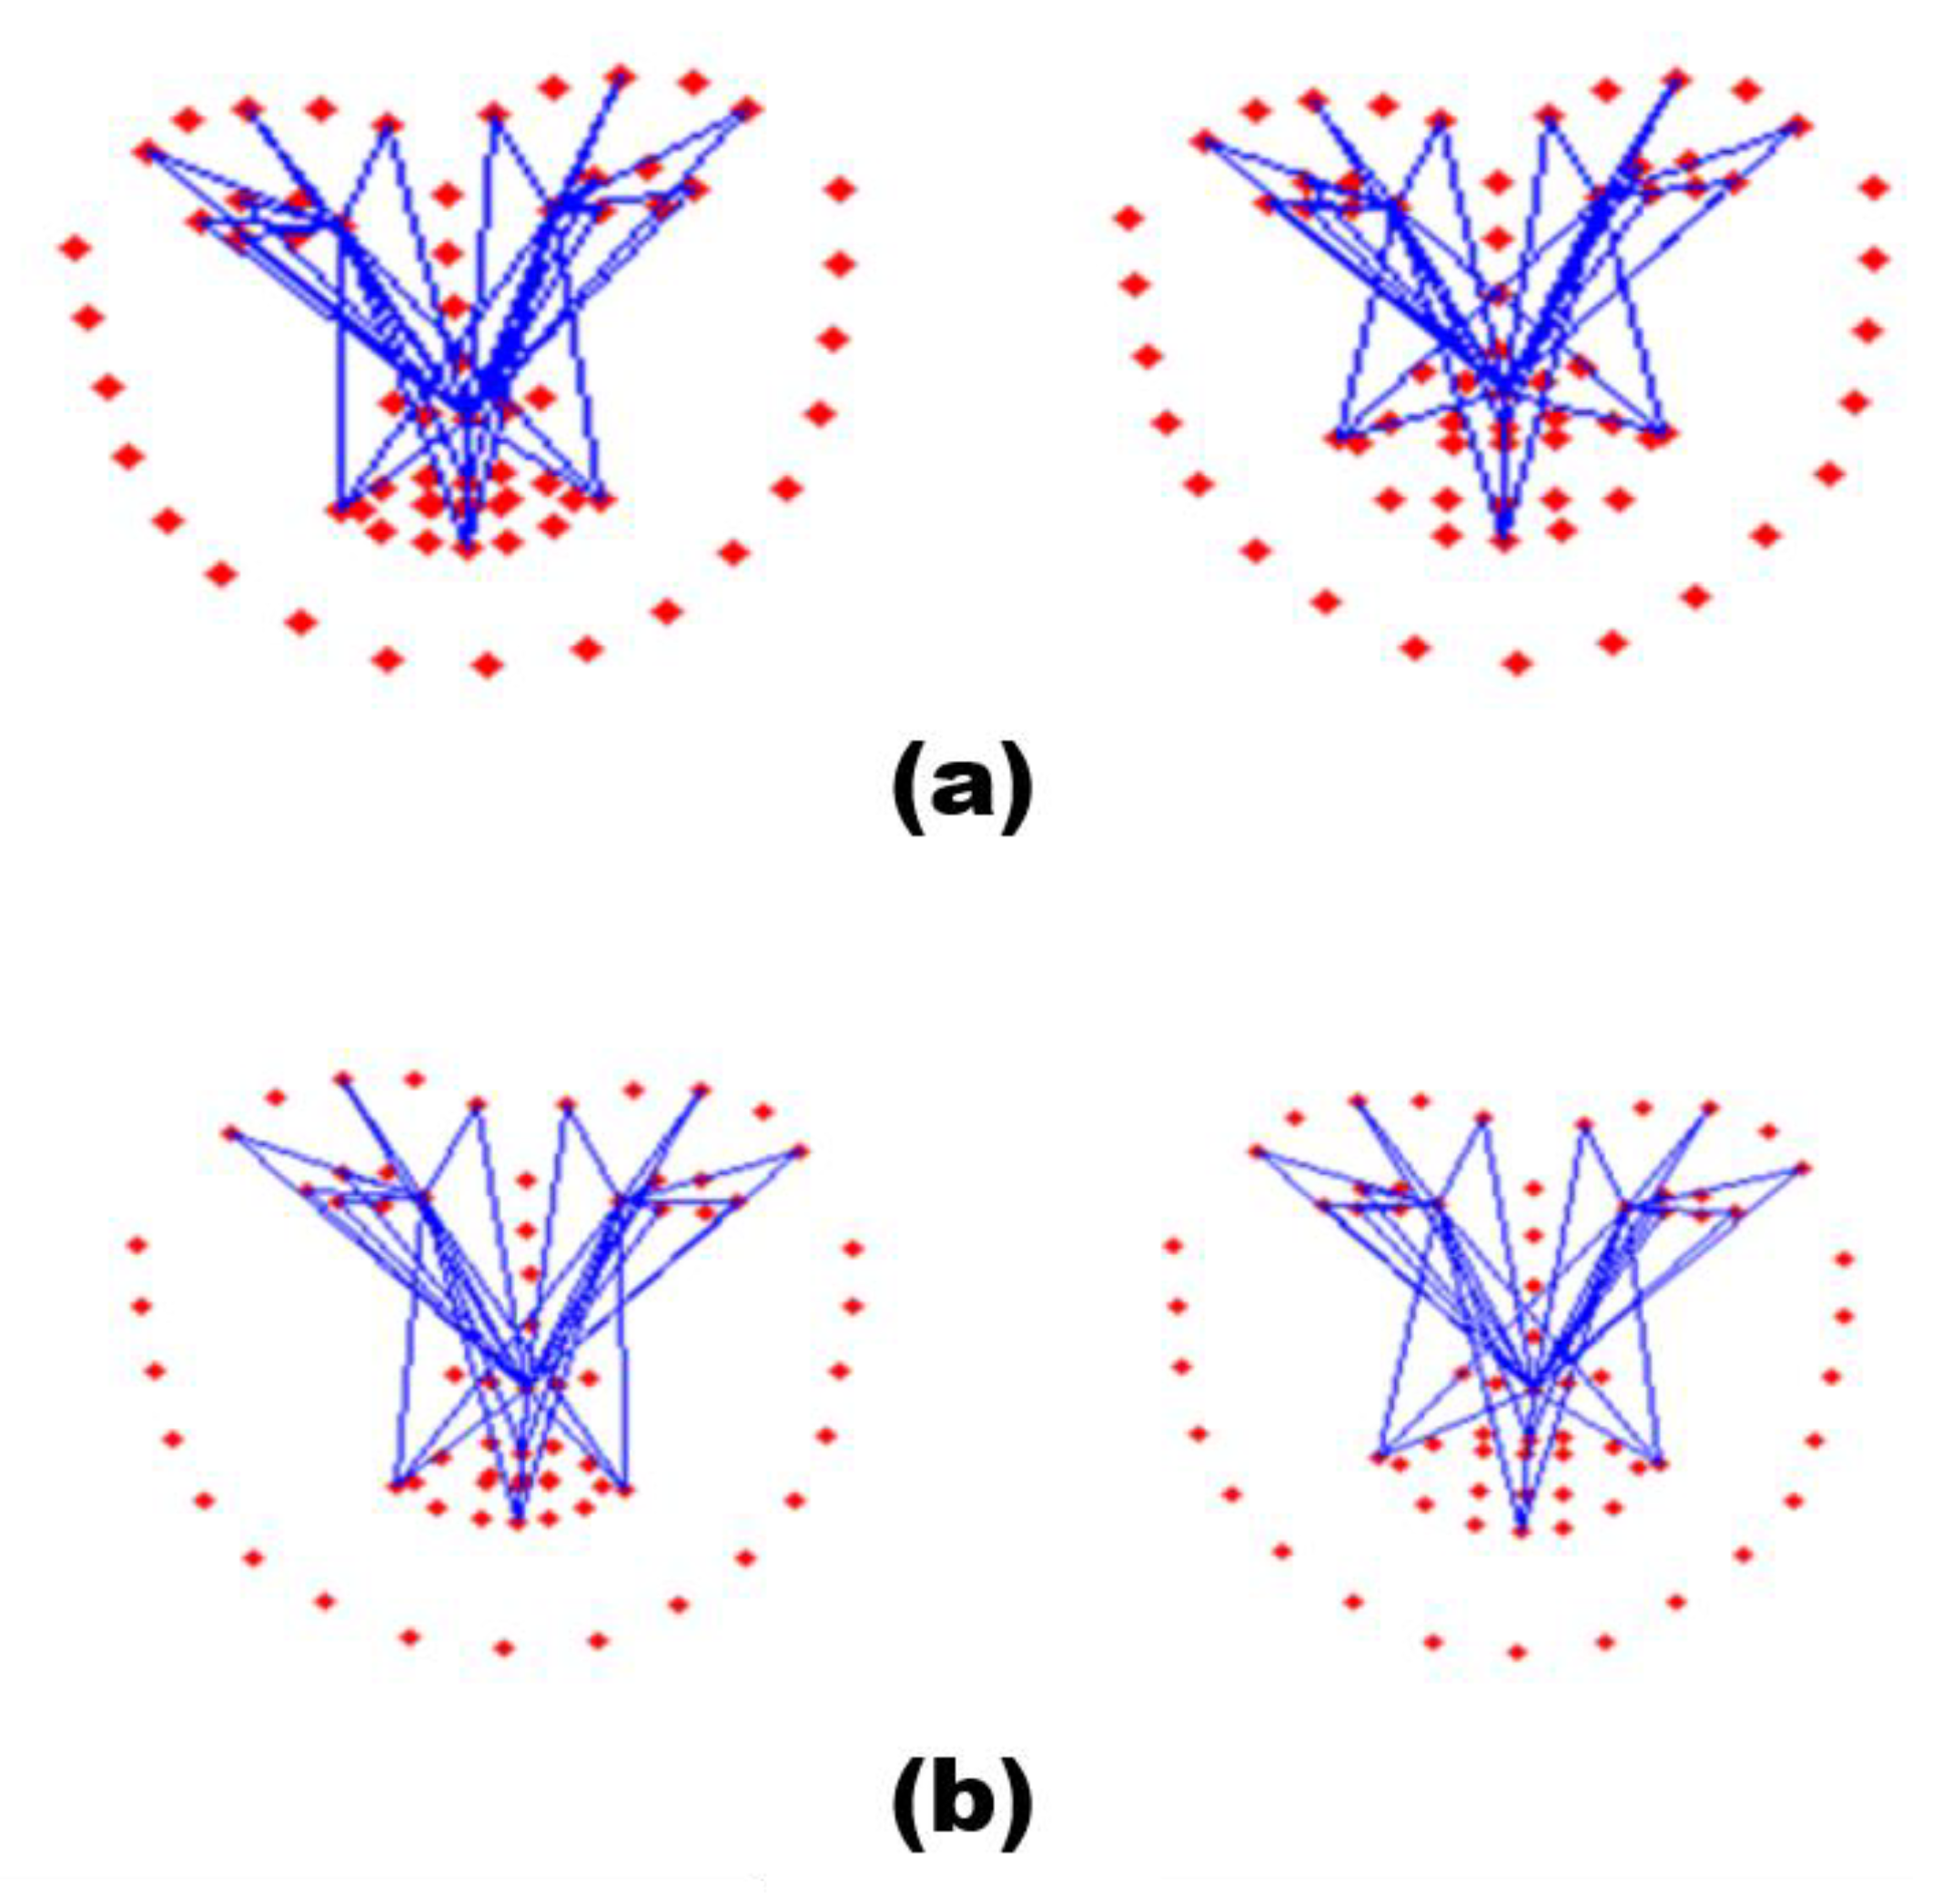
3.3. Face Feature Point Detection and Facial Expression Recognition Implementation

Facial feature points were detected using CE-CLM [33], a deep learning-based algorithm. A total of 68 major facial feature points to be detected were used as facial expression recognition and behavior analysis data. Figure 19 is a facial feature detection and facial expression recognizer using CE-CLM that can detect facial feature points at FHD resolution in real time and analyze facial behavior such as facial pose tracking and gaze tracking based on the detected facial feature points.
Since the location and change of facial feature points have different size and direction distributions for each person due to differences in appearance, a normalization function was implemented that can measure changes in facial feature points based on their neutral expressions in order to normalize individual differences. In Figure 20, facial rotation and movement were corrected and individual differences were normalized by measuring the movement of each facial element after aligning the neutral expression and the expression to be measured using rigid body transformation for the feature points of the joy feature and the neutral feature obtained through Figure 19.
In addition, facial asymmetry has been studied as an index of facial behavior that can grasp the psychological state, and since artificial and spontaneous expressions are expressed in different motor cortex, there is a difference in the degree of facial lateral asymmetry. The asymmetry measurer in Figure 21 measures the degree of asymmetry of a pair of feature points in a lateral symmetry relationship by a geometric operation using the dot product between the face center vector and the feature point vector.
For real-time state data analysis, a facial expression recognition model with a fast and small amount of computation is required, and the input data dimension of the model must be reduced. Accordingly, an expression recognition model based on facial feature points (Figure 22) was designed. In the case of images, data is stored in the form of three dimensions (image height, image width, image channels), which requires a lot of computation when using input data. Dimensional reduction was performed using facial feature points with geometry features according to facial expressions as input data of the facial expression recognition model. The facial feature point data used as input enables facial expression recognition in consideration of the movement and rotation of the face through the facial feature point normalization method described above. In addition, features using HOG [34] (Histogram of Oriented Gradients) are used as input data of the model, and even texture features are used as input data.
For deep learning-based real-time facial feature point extraction using CE-CLM model, parallel processing using GPU is essential, and real-time performance of facial feature point extraction using CE-CLM model cannot be guaranteed in an environment without GPU. Therefore, we implemented a real-time facial feature extraction function suitable for a GPU-free environment using face alignment provided by the dlib library. dlib’s face alignment outputs two-dimensional facial feature points, and enables the extraction of facial feature points with a speed of 40 fps or more with only an operation using only the CPU (i7-6700). However, due to the limitation of 2D facial feature point extraction, there is a problem that the accuracy of feature point extraction decreases when there is a face rotation based on the x-axis and y-axis in the 3D camera coordinate system.
In the CPU calculation-based algorithm, the result of performing size normalization by dividing 21 facial feature points and 38 feature point distance measurements by the distance between the two eyes is shown in Figure 23.
The facial feature points obtained through Figure 23 have not been normalized for differences by feature distance due to the different appearances of each individual.
In the existing person-specific normalization between three-dimensional facial feature points, a rigid body transformation method was used to normalize the measured values, but in a CPU calculation-based algorithm, a normalization method based on the distance measurement value between the feature points as 2D data was used. Figure 24 shows the result of performing person-specific normalization based on facial features during expressionless expression. Through this, it was possible to measure facial movements, which partially solved the problem of reducing the accuracy of feature point extraction in case of facial rotation.

3.4. Contactless Interaction Implementation

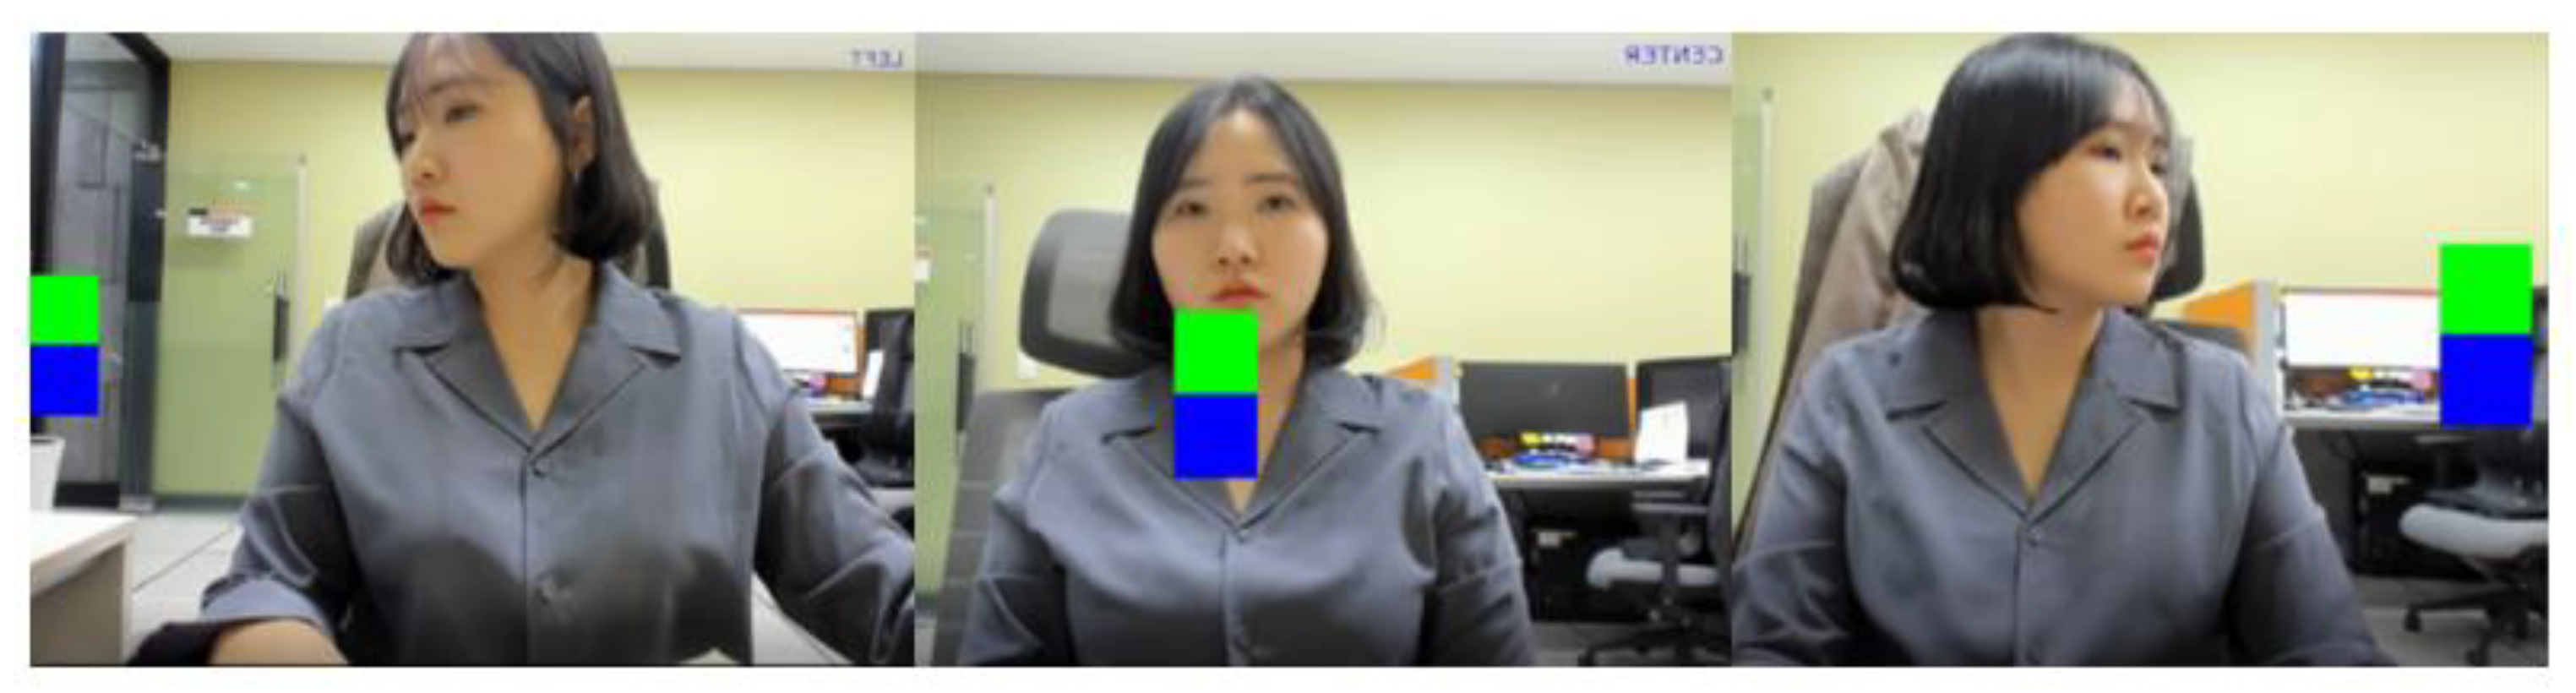
3.4.1. Gaze and Facial Movement Tracking Interaction

In order to recognize and track the user’s gaze, it is important to accurately identify the location of the user’s face and pupil. Among the 20 feature points extracted using WrnchAPI [35], the tip of the nose is used as the root to grasp the movement of the head. Up, down, left, and right movements can be identified, but in order to increase accuracy, only three directions (center, left, and right) can be identified. Eye tracking must perform calibration that defines the camera’s intrinsic parameter, the positional relationship between units, and the eye parameter. Using web camera-based gaze tracking provided by OpenCV, the coordinates of the pupils in the web camera are estimated in real time, the left, center, and right directions are recognized, and movement is estimated in Figure 25.

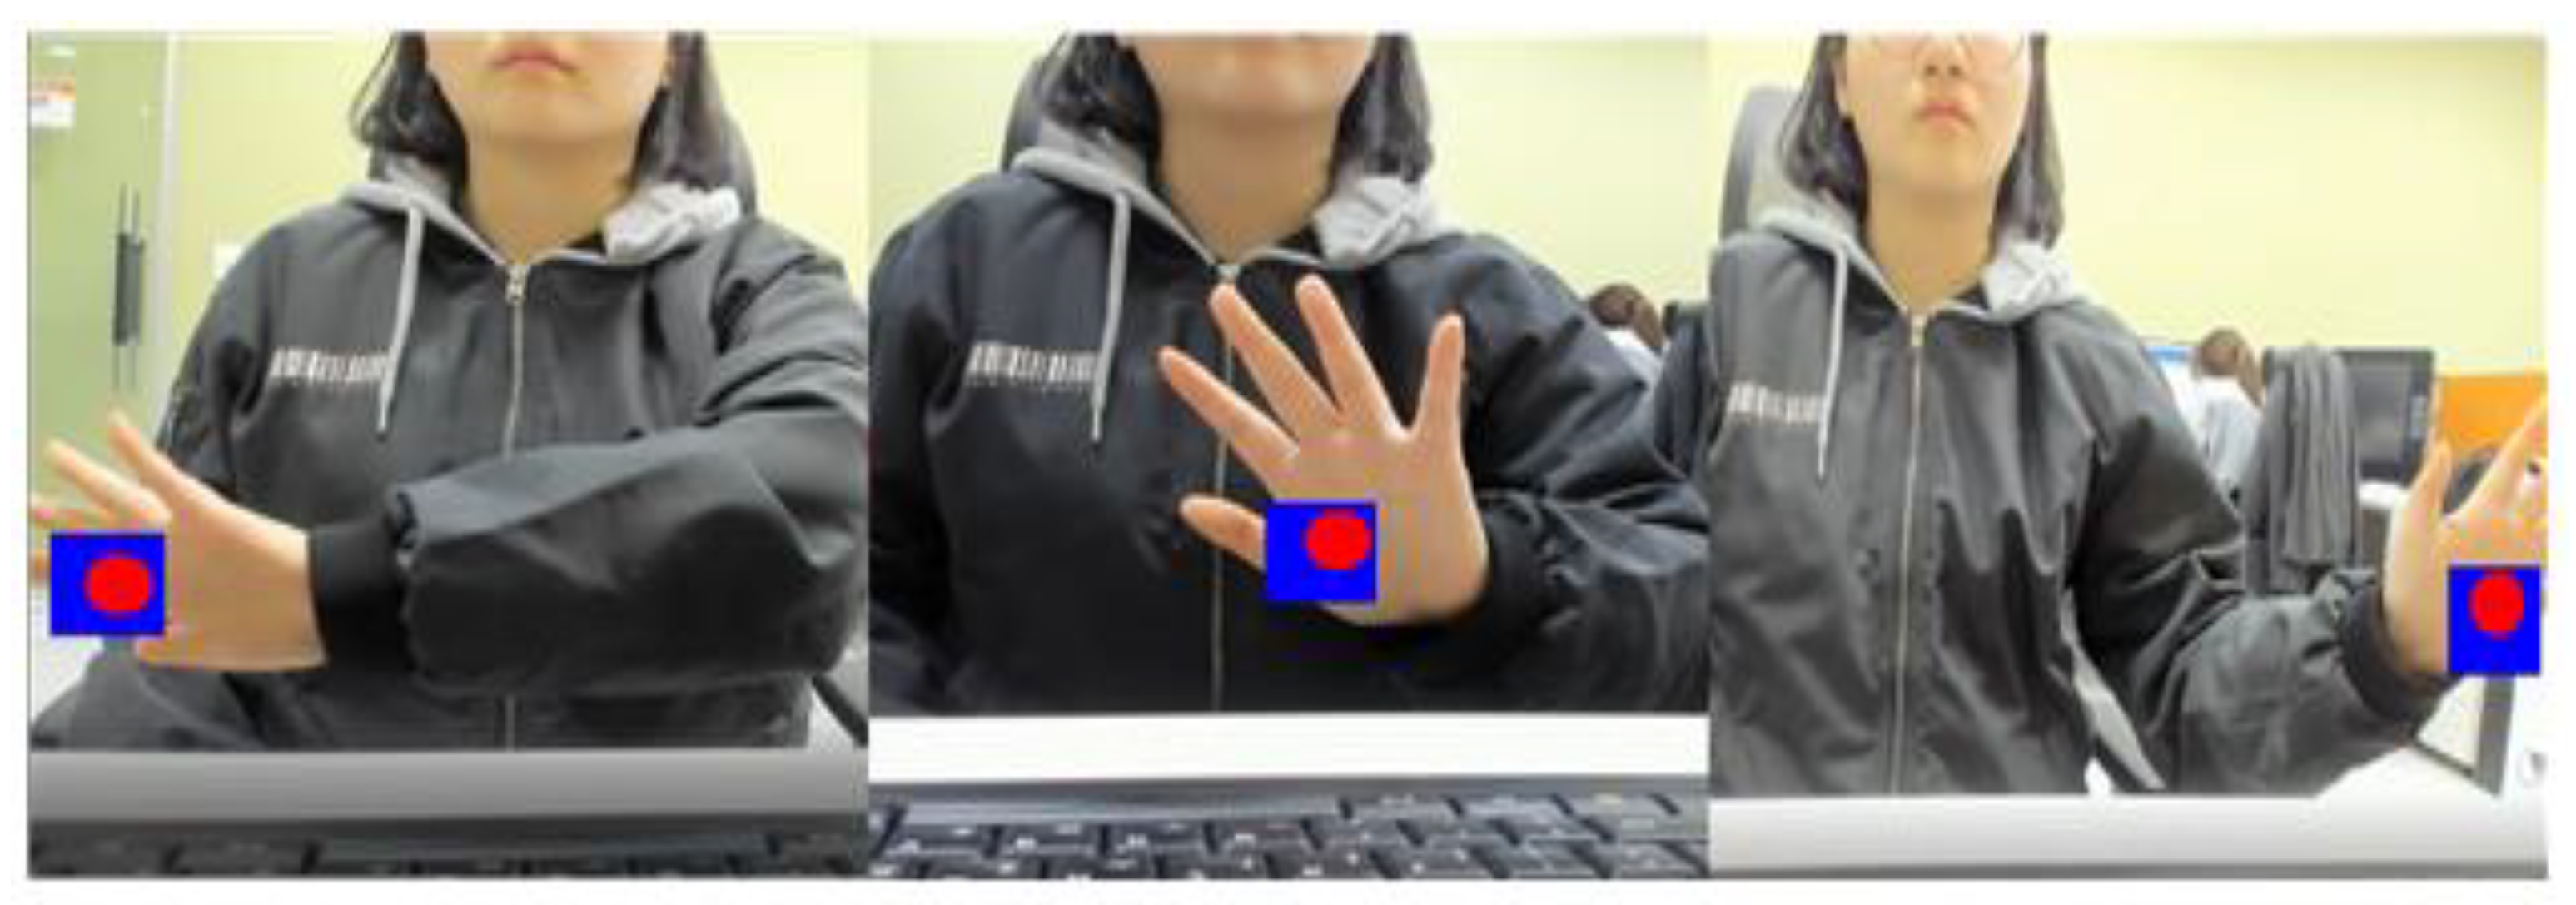
3.4.2. Hand Movement Tracking Interaction

To detect the skin color corresponding to the candidate area of the hand, the image in the RGB color space is converted to the YCrCb color space, and then 128 ≤ Cr ≤ 170, 73 ≤ Cb ≤ 158 excluding the luminance (Y) is used for each channel value. The skin color was detected by comparing the results. Then, the point where the direction of the line changes was designated as a finger candidate by calculating the convexHull for the hand area. However, when all fingers were bent, there was a problem of detecting non-finger parts. To compensate for this, the contour was approximated, and a defect was implemented to detect the finger. Since the location where the finger candidates are found is the place where the two locations meet, it is recognized as a finger only when the angle formed by the left and right edges is less than 90 degrees. Afterwards, based on the previously detected hand region mask, the feature points were extracted by receiving the coordinate values of the feature points in all areas of the finger.
Among the input coordinate values, the feature point corresponding to the center of the hand area was extracted as a red point to recognize the hand motion. As shown in Figure 26 to visualize the hand movement-based interaction, we implemented an event in which a blue square randomly occurs in three directions, left, center, and right. When the red dot stays in the blue square for a certain period of time, the next action is performed.

4. Experiment

The purpose was to secure a selection factor for the state data set for training to improve the communication function of the communication-weak by combining the previously developed technology with the training contents under development, and to verify the validity of the non-contact biometric data collection and analysis technology. The test group is the target of 8 people with weak communication and 14 people in the control group as shown in Table 1. The criterion for selecting a group of people with communication weakness is adolescents and adults aged 13 to 40 years old. The comparative group is a person who voluntarily agreed to participate in the study after reading the study guide and consent to participate in the study for adolescents and adults aged 13 to 40 years old. Contents consist of Music based Attention Test (MAT) and Comprehensive Attention Test (CAT).
Observation items are contact and non-contact optical blood flow signals/respiration signals, facial features, and facial expression recognition.
Status data was collected and analyzed based on the face images of individuals with. ASD through a webcam or front camera in a PC or tablet environment in which the content is driven. The participants of the experiment wore ECG and EMG sensors, and were conducted in an environment of 200 lux or more of illumination.
Table 2 and Table 3 compare ECG and EMG sensor data with heart rate and respiration data acquired through non-contact biosignal measurement technology. With the subject sitting in a chair, the distance between the subject and the camera was about 60 cm, and the heart rate measurement data was acquired from the subject’s face image, and the accuracy was calculated by sampling at 6 s intervals. In simple numerical terms, the difference is 1.27 in heart rate and 0.29 in respiration on average, and the RMSE (Root Mean Square Deviation) is less than 2 in heart rate and less than 1 in breathing. Compared to the conventional contact collection method, it was verified in Table 2 and Table 3 that our non-contact technology shows competitive results.
In Table 4, the expression recognition rate of the subjects was calculated through (3) for 6 types of expressions (joy, surprise, disgust, sadness, fear, neutral) by comparing the DISFA dataset [36] with the subject’s face image.
ACC =   R × 100 , R = T T + F ,   ( 0 R 1 ) , T = Number   of   successful   recognition ,   F = Number   of   failed   recognition
For each of the six expressions, the test was performed 100 times, and the accuracy of 95.7% was verified in the expression recognition rate with 574 times of recognition and 26 times of false recognition.
Table 5 is the determination of the measurement accuracy for the gaze (face direction) and hand interaction. Three interaction areas were selected in consideration of the camera angle of the environment using the tablet and to characterize that precise interactions of the people with ASD. The screen size was based on 640 × 480, and the accuracy was determined for the following three areas. x is the abscissa, y is the ordinate, and the size of the area was determined empirically through sufficient tests.
  • Left area: 10 < x <60, 250 < y < 350
  • Center area: 295 < x < 345, 250 < y < 350
  • Right area: 580 < x < 630, 250 < y < 350
In the case of gaze, the target blue rectangle appears randomly on the screen, and the green rectangle corresponding to the subject’s gaze is placed on the blue rectangle. In the case of hand interaction, the direction of the subject’s palm was marked with a red circle, and the recognition accuracy was calculated through (3) by placing it on a randomly appearing blue square.
In the experiment, it is more advantageous than the contact sensor in that it was possible to collect biometric data without noise and without using a contact sensor that can feel the mental burden of the people with ASD via their heart rate and breathing and a sense of resistance to physical contact. In addition, it was confirmed through Table 2 and Table 3 that similar biometric data measurement values were obtained when compared with the contact sensor. From the image-based facial expression recognition, as shown in Table 4, it has become an index that can grasp the psychological state of people with ASD. In Table 5, the subjects accurately identified their gaze, and it was verified that the hand was accurately recognized and matched to the target even in the hand interaction.

5. Conclusions

In this study, a technology for measuring the state data of people with ASD was proposed through the development of a non-contact image-based bio-signal measurement technology. Data was collected by detecting light blood flow (heart rate), breathing, facial expressions, gaze and facial movements, and hand movements based on a single RGB camera rather than using individual sensors to measure each state data. Conventional contact sensors such as ECG and EMG can feel the mental burden and a sense of resistance to physical contact with people with ASD. In addition, not only can it have a great influence on the state analysis of the communication-weak, but it can also adversely affect the psychological state of the communication-weak.
Based on the collected biometric data, a real-time signal detection integrated interface was defined and implemented by analyzing the condition of the communication-weak person and making it visible so that the expert who manages the person can easily recognize and understand their status. It is predicted that it can be applied to various platforms based on contactless bio-signal measurement technology or integrated interface to develop functional contents that provide opportunities for people with weak communication skills to live their daily lives and meet social needs.
In the future study, applying a face detector for every frame in heart rate measurement is disadvantageous to the overhead and stability of the detection area, so applying a circulated structure-based tracking algorithm based on object tracking technology could improve the learning speed and stability of the face area. In addition, noise generated in a motion situation has a limitation in simply mitigating the change in signal value through a normalization process. Therefore, it is expected that if a method of quantitatively detecting facial motion by applying optical flow and a Kalman filter and mitigating the noise component based on the detected motion amount is applied, it is expected that the change in blood flow volume resilient to motion noise can be estimated.
In respiration, the learning-based ROI detection model is expected to improve the overall respiration signal extraction performance by improving the ROI detection accuracy by applying an additional network structure to optimize the task of the model, such as the advanced shortcut of DenseNet or the bottle-neck layer. In addition, there is a disadvantage in that it is difficult to utilize structural information of an image due to the characteristics of the existing method of using a model that classifies whether a change is caused by respiration by analyzing a pattern of pixel change to detect a respiration signal. To improve this, the use of a 3D-CNN model that considers the structural characteristics of the image is expected to improve the stability of ROI detection.
In facial expression recognition, features subjected to person-specific normalization are used as input data of the facial expression recognition model. In addition, we plan to test the performance of the model and the normalization method using two representative public databases (DISFA, MMI) in the field of facial expression recognition.
In addition, the function of extracting facial feature points based on CPU computation enables real-time state data analysis in an environment without GPU support by using face alignment of the dlib library.
However, it is still vulnerable to face rotation, occlusion, and movement using 2D facial feature points as an inference model. This should be possible to develop a model with improved performance by removing the regression branch operation, which is used only for training during inference calculations, by using a 3DDFA model with a small number of parameters and a fast inference speed as a backbone network.
In the case of the gaze, it will be supplemented to enable more precise measurement of gaze through area segmentation and enhancement of facial feature point extraction functions. In hand interaction, the function will be extended to simple gesture recognition as well as interaction through simple palm tracking.
In the case of the integrated interface, the UI/UX will be supplemented so that the expert who manages the communication-weak person can more easily recognize the status data of the communication-weak person acquired by contactless method.
In addition, we will develop mobile and VR contents that utilize the state data of the communication weak, and recruit more experimental personnel. Future research will prove whether the content to be developed later can contribute to the improvement of quality of life through the improvement of communication skills of people with ASD.

Author Contributions

Conceptualization, S.N., H.S. and Y.K.; methodology, S.N., H.S. and Y.K.; software, S.N., H.S. and Y.K.; validation, S.N., H.S. and Y.K.; formal analysis, S.N., H.S. and Y.K.; investigation, S.N., H.S. and Y.K.; resources, S.N., H.S. and Y.K.; data curation, S.N., H.S. and Y.K.; writing—original draft preparation, S.N., H.S. and Y.K.; writing—review and editing, S.N., H.S. and Y.K.; visualization, S.N., H.S. and Y.K.; supervision, Y.K.; project administration, Y.K.; funding acquisition, Y.K. All authors have read and agreed to the published version of the manuscript.

Funding

This research was funded by Ministry of Culture, Sports and Tourism and Korea Creative Content Agency (Project Number: R2020040186).

Institutional Review Board Statement

The study was conducted according to the guidelines of the Declaration of Helsinki, and approved by the Institutional Review Board of Chungang University, South Korea (1041078-202008-HRBM-235-01).

Informed Consent Statement

Informed consent was obtained from all subjects involved in the study.

Data Availability Statement

Data is contained within the article.

Conflicts of Interest

The authors declare no conflict of interest.

References

  1. Myles, B.S.; Simpson, R.L. Asperger Syndrome: A Guide for Educators and Parents, 2nd ed.; Shoal Creek Blvd: Austin, TX, USA, 2003.
  2. Schopler, E.; Mesibov, G.B. High-Functioning Individuals with Autism; Springer: Boston, MA, USA, 1992. [Google Scholar] [CrossRef]
  3. Diehl, J.J.; Bennetto, L.; Watson, D.; Gunlogson, C.; McDonough, J. Resolving ambiguity: A psycholinguistic approach to understanding prosody processing in high-functioning autism. J. Brain Lang. 2008, 106, 144–152. [Google Scholar] [CrossRef] [Green Version]
  4. Diehl, J.J.; Paul, R. Acoustic differences in the imitation of prosodic patterns in children with autism spectrum disorders. J. Res. Autism Spectr. Disord. 2012, 6, 123–134. [Google Scholar] [CrossRef] [Green Version]
  5. Grossman, R.B.; Edelson, L.R.; Tager-Flusberg, H. Emotional facial and vocal expressions during story retelling by children and adolescents with high-functioning autism. J. Speech Lang. Hear. Res. 2013, 56, 1035–1044. [Google Scholar] [CrossRef] [Green Version]
  6. Stagg, S.D.; Slavny, R.; Hand, C.; Cardoso, A.; Smith, P. Does facial expressivity count? how typically developing children respond initially to children with autism. Autism 2013. [Google Scholar] [CrossRef] [PubMed]
  7. Brewer, R.; Biotti, F.; Catmur, C.; Press, C.; Happ’e, F.; Cook, R.; Bird, G. Can neurotypical individuals read autistic facial expressions? Atypical production of emotional facial expressions in autism spectrum disorders. Autism Res. 2016, 9, 262–271. [Google Scholar] [CrossRef] [Green Version]
  8. Eldevik, S.; Hastings, R.P.; Hughes, J.C.; Jahr, E.; Eikeseth, S.; Cross, S. Meta-analysis of Early Intensive Behavioral Intervention for children with autism. J. Clin. Child Adolesc. Psychol. 2009, 38, 439–450. [Google Scholar] [CrossRef] [PubMed]
  9. Lange, C.G.; James, W. A Series of Reprints and Translations. The Emotions; Williams & Wilkins Co.: Philadelphia, PA, USA, 1922; Volume 1. [Google Scholar] [CrossRef]
  10. Cannon, W.B. The James-Lange Theory of Emotions: A Critical Examination and an Alternative Theory. Am. J. Psychol. 1927, 39, 106. [Google Scholar] [CrossRef]
  11. Blair, R.J.R.; Coles, M. Expression recognition and behavioral problems in early adolescence. Cogn. Dev. 2000, 15, 421–434. [Google Scholar] [CrossRef]
  12. Chung, S.Y.; Yoon, H.J. A Framework for Treatment of Autism Using Affective Computing. In Proceedings of the 18th Medicine Meets Virtual Reality (MMVR), Newport Beach, CA, USA, 8–12 February 2011. [Google Scholar]
  13. Billeci, L.; Sicca, F.; Maharatna, K.; Apicella, F.; Narzisi, A.; Campatelli, G.; Calderoni, S.; Pioggia, G.; Muratori, F. On the Application of Quantitative EEG for Characterizing Autistic Brain: A Systematic Review. Front. Hum. Neurosci. 2013, 7, 442. [Google Scholar] [CrossRef] [Green Version]
  14. Marco, E.J.; Hinkley, L.B.N.; Hill, S.S.; Nagarajan, S.S.; Hinkley, L.B.N. Sensory processing in autism: A review of neurophysiologic findings. Pediatr. Res. 2011, 69, R48–R54. [Google Scholar] [CrossRef] [PubMed]
  15. Wang, Y.; Hensley, M.K.; Tasman, A.; Sears, L.; Casanova, M.F.; Sokhadze, E.M. Heart Rate Variability and Skin Conductance During Repetitive TMS Course in Children with Autism. Psychophysiol. Biofeedback 2016, 41, 47–60. [Google Scholar] [CrossRef]
  16. Cabibihan, J.-J.; Javed, H.; Aldosari, M.; Frazier, T.; Elbashir, H. Sensing Technologies for Autism Spectrum Disorder Screening and Intervention. Sensors 2016, 17, 46. [Google Scholar] [CrossRef] [Green Version]
  17. Jang, E.-H.; Park, B.-J.; Park, M.-S.; Kim, S.-H.; Sohn, J.-H. Analysis of physiological signals for recognition of boredom, pain, and surprise emotions. J. Physiol. Anthropol. 2015, 34, 25. [Google Scholar] [CrossRef] [Green Version]
  18. Yu, S.-N.; Chen, S.-F. Emotion state identification based on heart rate variability and genetic algorithm. In Proceedings of the 37th Annual International Conference of the IEEE Engineering in Medicine and Biology Society (EMBC), Milano, Italy, 25–29 August 2015; pp. 538–541. [Google Scholar]
  19. Nakano, T.; Tanaka, K.; Endo, Y.; Yamane, Y.; Yamamoto, T.; Nakano, Y.; Ohta, H.; Kato, N.; Kitazawa, S. Atypical gaze patterns in children and adults with autism spectrum disorders dissociated from developmental changes in gaze behaviour. Proc. Biol. Sci. R. Soc. B Biol. Sci. 2010, 277, 2935–2943. [Google Scholar] [CrossRef] [PubMed] [Green Version]
  20. Bird, G.; Catmur, C.; Silani, G.; Frith, C.; Frith, U. Attention does not modulate neural responses to social stimuli in autism spectrum disorders. Neuroimage 2006, 31, 1614–1624. [Google Scholar] [CrossRef] [PubMed]
  21. Luo, Y.; Cheong, L.F.; Cabibihan, J.J. Modeling the Temporality of Saliency. In Computer Vision—Proceedings of the ACCV 2014: 12th Asian Conference on Computer Vision, Singapore, 1–5 November 2014; Cremers, D., Reid, I., Saito, H., Yang, M.H., Eds.; Revised Selected Papers, Part III; Springer International Publishing: Cham, Switzerland, 2015; pp. 205–220. [Google Scholar]
  22. Boraston, Z.; Blakemore, S.J. The application of eye-tracking technology in the study of autism. J. Physiol. 2007, 581, 893–898. [Google Scholar] [CrossRef] [PubMed]
  23. Jolliffe, T.; Baron-Cohen, S. A test of central coherence theory: Can adults with high-functioning autism or Asperger syndrome integrate objects in context? Vis. Cogn. 2001, 8, 67–101. [Google Scholar] [CrossRef]
  24. Pelphrey, K.A.; Sasson, N.J.; Reznick, J.S.; Paul, G.; Goldman, B.D.; Piven, J. Visual scanning of faces in autism. J. Autism Dev. Disord. 2002, 32, 249–261. [Google Scholar] [CrossRef]
  25. Klin, A.; Jones, W.; Schultz, R.; Volkmar, F.; Cohen, D. Defining and quantifying the social phenotype in autism. Am. J. Psychiatry 2002, 159, 895–908. [Google Scholar] [CrossRef]
  26. Joseph, R.M.; Tanaka, J. Holistic and part-based face recognition in children with autism. J. Child Psychol. Psychiatry 2003, 44, 529–542. [Google Scholar] [CrossRef]
  27. Spezio, M.L.; Adolphs, R.; Hurley, R.S.E.; Piven, J. Abnormal use of facial information in high-functioning autism. J. Autism Dev. Disord. 2007, 37, 929–939. [Google Scholar] [CrossRef] [PubMed]
  28. Liu, W.; Anguelov, D.; Erhan, D.; Szegedy, C.; Reed, S.; Fu, C.-Y.; Berg, A.C. SSD: Single Shot MultiBox Detector. In European Conference on Computer Vision, Proceedings of the ECCV 2016, Amsterdam, The Netherlands, 11–14 October 2016; Springer: Berlin/Heidelberg, Germany, 2016; pp. 21–37. [Google Scholar] [CrossRef] [Green Version]
  29. Viola, P.; Jones, M. Rapid object detection using a boosted cascade of simple features. In Proceedings of the 2001 IEEE Computer Society Conference on Computer Vision and Pattern Recognition (CVPR 2001), Kauai, HI, USA, 8–14 December 2001. [Google Scholar] [CrossRef]
  30. Brox, T.; Bruhn, A.; Papenberg, N.; Weickert, J. High Accuracy Optical Flow Estimation Based on a Theory for Warping. In European Conference on Computer Vision, Proceedings of the ECCV 2004, Prague, Czech Republic, 11–14 May 2004; Springer: Berlin/Heidelberg, Germany, 2004; pp. 25–36. [Google Scholar] [CrossRef]
  31. Hartigan, J.A.; Wong, M.A. Algorithm AS 136: A K-Means Clustering Algorithm. Appl. Stat. 1979, 28, 100. [Google Scholar] [CrossRef]
  32. Ester, M.; Kriegel, H.-P.; Sander, J.; Xu, X. A Density-Based Algorithm for Discovering Clusters in Large Spatial Databases with Noise. In Proceedings of the 2nd International Conference on Knowledge Discovery and Data Mining, Portland, OR, USA, 2–4 August 1996; Simoudis, E., Han, J., Fayyad, U.M., Eds.; AAAI Press: Palo Alto, CA, USA, 1996; pp. 226–231, ISBN 1-57735-004-9. [Google Scholar]
  33. Zadeh, A.; Baltrusaitis, T.; Morency, L.-P. Convolutional Experts Constrained Local Model for Facial Landmark Detection. In Proceedings of the 2017 IEEE Conference on Computer Vision and Pattern Recognition Workshops (CVPRW), Honolulu, HI, USA, 22–29 October 2017; pp. 2051–2059. [Google Scholar] [CrossRef] [Green Version]
  34. Dalal, N.; Triggs, B. Histograms of oriented gradients for human detection. In Proceedings of the IEEE Conference on Computer Vision and Pattern Recognition, San Diego, CA, USA, 20–25 June 2005; pp. 886–893. [Google Scholar] [CrossRef] [Green Version]
  35. Wrnch. What is Human-Centric Computer Vision? Available online: https://wrnch.ai/technology/ (accessed on 4 April 2021).
  36. Mavadati, S.M.; Mahoor, M.H.; Bartlett, K.; Trinh, P.; Cohn, J.F. DISFA: A Spontaneous Facial Action Intensity Database. IEEE Trans. Affect. Comput. 2013, 4, 151–160. [Google Scholar] [CrossRef]
Figure 1. State data integration interface.
Applsci 11 05169 g001
Figure 2. Skin pixel filtering applied to the face area detected through SSD. (a) Before filtering, (b) After filtering.
Applsci 11 05169 g002
Figure 3. Comparison of (a) time series and (b) frequency spectrum for each channel of the skin pixel filtering applied face area.
Applsci 11 05169 g003
Figure 4. Removing low-frequency noise in the signal through signal normalization (a), removing high-frequency noise in the signal through bandpass filtering (b).
Applsci 11 05169 g004
Figure 5. Band detection and analysis with maximum peak for calculating average pulse rate.
Applsci 11 05169 g005
Figure 6. Peak detection results in the time series domain for PPI calculation.
Applsci 11 05169 g006
Figure 7. Motion information detected using optical flow.
Applsci 11 05169 g007
Figure 8. The extracted motion, the calculated motion matrix, and the breathing descriptor of the image calculated from the motion matrix.
Applsci 11 05169 g008
Figure 9. ROI detection, purification process and actual detection results.
Applsci 11 05169 g009
Figure 10. Comparison of actual measured respiratory signal and chest and background pixel changes.
Applsci 11 05169 g010
Figure 11. Learning-based ROI detection flow and detected ROI.
Applsci 11 05169 g011
Figure 12. ROI extracted through learning-based ROI detection model (Figure 11) and signal types for each area.
Applsci 11 05169 g012
Figure 13. Respiration vector visualization using clustering algorithm (Hierarchical clustering shows the best in extracting refined respiration signals by reducing destructive noise).
Applsci 11 05169 g013
Figure 14. Clustering of breathing pixel and noise data and the data contained in each cluster.
Applsci 11 05169 g014
Figure 15. Clustering of respiratory pixel and noise data with origin symmetric data and data contained in each cluster.
Applsci 11 05169 g015
Figure 16. Optical flow tracking result for pixels detected by ROI.
Applsci 11 05169 g016
Figure 17. Changes in blood flow due to respiration observed in PPG (Photoplethysmogram).
Applsci 11 05169 g017
Figure 18. The result of removing the skin color change and heart rate component measured from the actual skin of the face.
Applsci 11 05169 g018
Figure 19. Facial feature point detection and facial expression recognizer.
Applsci 11 05169 g019
Figure 20. Changes in the position of facial feature points by movement (a), before rigid body transformation (b), after rigid body transformation (c).
Applsci 11 05169 g020
Figure 21. Face side asymmetry meter using facial feature points.
Applsci 11 05169 g021
Figure 22. Facial feature recognition model based on facial feature points.
Applsci 11 05169 g022
Figure 23. Extraction of feature points from neutral expressions (left) and smiley expressions (right) and results of size normalization, Participant 1 (a), Participant 2 (b).
Applsci 11 05169 g023
Figure 24. A graph of characteristic values of smiley expressions before (a) and after (b) person specific-normalization for Participant 1 (left) and Participant 2 (right).
Applsci 11 05169 g024
Figure 25. Implementing gaze and face motion tracking interaction.
Applsci 11 05169 g025
Figure 26. Implementing hand movement tracking interaction.
Applsci 11 05169 g026
Table 1. Basic information of research participants.
ClassificationCategoryComparative GroupControl GroupTotal
GenderMale3811
Female11 11
Age12~15123
16~19549
20~24617
25~29213
EducationJunior Highschool224
Attending Highschool426
Graduated Highschool123
Attending University527
Graduated University2 2
DisabilityASD 22
ID 66
ASD: Autism spectrum disorder, ID: Intellectual disability.
Table 2. Non-contact heart rate measurement data compared to contact (unit: bpm).
Num1234567891011121314151617181920Mean ErrRMSE
1contact9081798177818285919079738278888380787576 1.673
ours8881788080828085909081737880878281787774
err201131201020421110221.3
2contact7877887882868586878883858885958982808483 1.774
ours7777867681878586858980858685908984788383
err100211002130205022101.15
3contact8382867088818183828785868286858485897885 1.244
ours8481847187818282838684858385858686897782
err112110111111110210131.05
4contact8487868689868679847779997880827982788680 2.626
ours8487868787868474847682907781807883778678
err000120250139112111021.6
5contact8488798790859386868084818682868786918788 1.466
ours8486788687859085848182828583858685908687
err021130312121111111111.25
mean1.271.756
Table 3. Non-contact breathing measurement data compared to contact type (unit: number of breaths).
Num1234567891011121314151617181920Mean ErrRMSE
1contact1919201818171516161516161715152121171617 0.591
ours1920201819171616161516171715152221161618
err010010100001000101010.35
2contact1415111411141312131522212215151413121415 0.447
ours1415111411141312131521222115151413121414
err000000000011100000010.2
3contact1315141315131411151414141423262320202018 0.387
ours1415141315131411151414141423272320202118
err100000000000001000100.15
4contact1714171613151313131116141414121513131616 1.140
ours1719171613151313131116141415121513131616
err050000000000001000000.3
5contact1515141514132520191815141413131313181313 1.396
ours1515141614132520191814141413121313121313
err000100000010001006000.45
mean0.290.792
Table 4. Non-contact image-based facial expression recognition (unit: %).
StatusGround-TruthNumber of TrialsTFRatio
1joy Applsci 11 05169 i001100 ea95595
2surprise Applsci 11 05169 i0021000100
3disgust Applsci 11 05169 i00398298
4sadness Applsci 11 05169 i00497397
5fear Applsci 11 05169 i005891189
6neutral Applsci 11 05169 i00695595
mean95.7
Table 5. Determination of recognition accuracy for gaze and hand interaction (unit: %).
MethodGround-TruthNumber of TrialsTFRatio
1gaze Applsci 11 05169 i007100 ea1000100
2hand Applsci 11 05169 i0081000100
mean100
Publisher’s Note: MDPI stays neutral with regard to jurisdictional claims in published maps and institutional affiliations.

