
Case Study of Power Plants in the Slovak Republic and Construction of Microgrid and Smart Grid


Department of Electric Power Engineering, Faculty of Electrical Engineering and Informatics, Technical University of Košice, Mäsiarska 74, 04001 Košice, Slovakia
*
Author to whom correspondence should be addressed.
Appl. Sci. 2021, 11(11), 5252; https://0-doi-org.brum.beds.ac.uk/10.3390/app11115252
Submission received: 17 May 2021
/
Revised: 1 June 2021
/
Accepted: 3 June 2021
/
Published: 5 June 2021
(This article belongs to the Special Issue Renewable Energy Sources for Smart Grids)
Abstract
:To reduce emissions worldwide, decarbonization has also affected for power engineering and its conventional methods of power generation, distribution, and transmission. This fact affects not only the production of power and supply itself, but also other parts related to it, namely systems for the protection of electricity generation facilities and the location of faults in distribution networks and transmission systems. Is this new technology of renewable energy sources (RES) mastered enough to be able to replace traditional methods of energy generation reliably and safely? If we can answer the previous question, we could proceed to the next phase of putting these technologies into practice, considering the actual state of distribution networks and transmission systems. The aim of the article will be to evaluate the current state of systems and production sources of electricity in the Slovak Republic and to provide a better insight and suggestions for rebuilding current networks on a smart grid. The proposals will also include models of some RES in the Matlab/Simulink software.
1. Introduction
The construction or conversion of the current system into a smart grid will require a lot of effort for successful application, which will lead to uninterrupted power supply for all consumers, reduced transmission and distribution loss high penetration of renewable energy sources, cyber secured electrical network, large-scale power storage, creation of new opportunities for the electricity market, and active involvement of costumers in the management process [1].
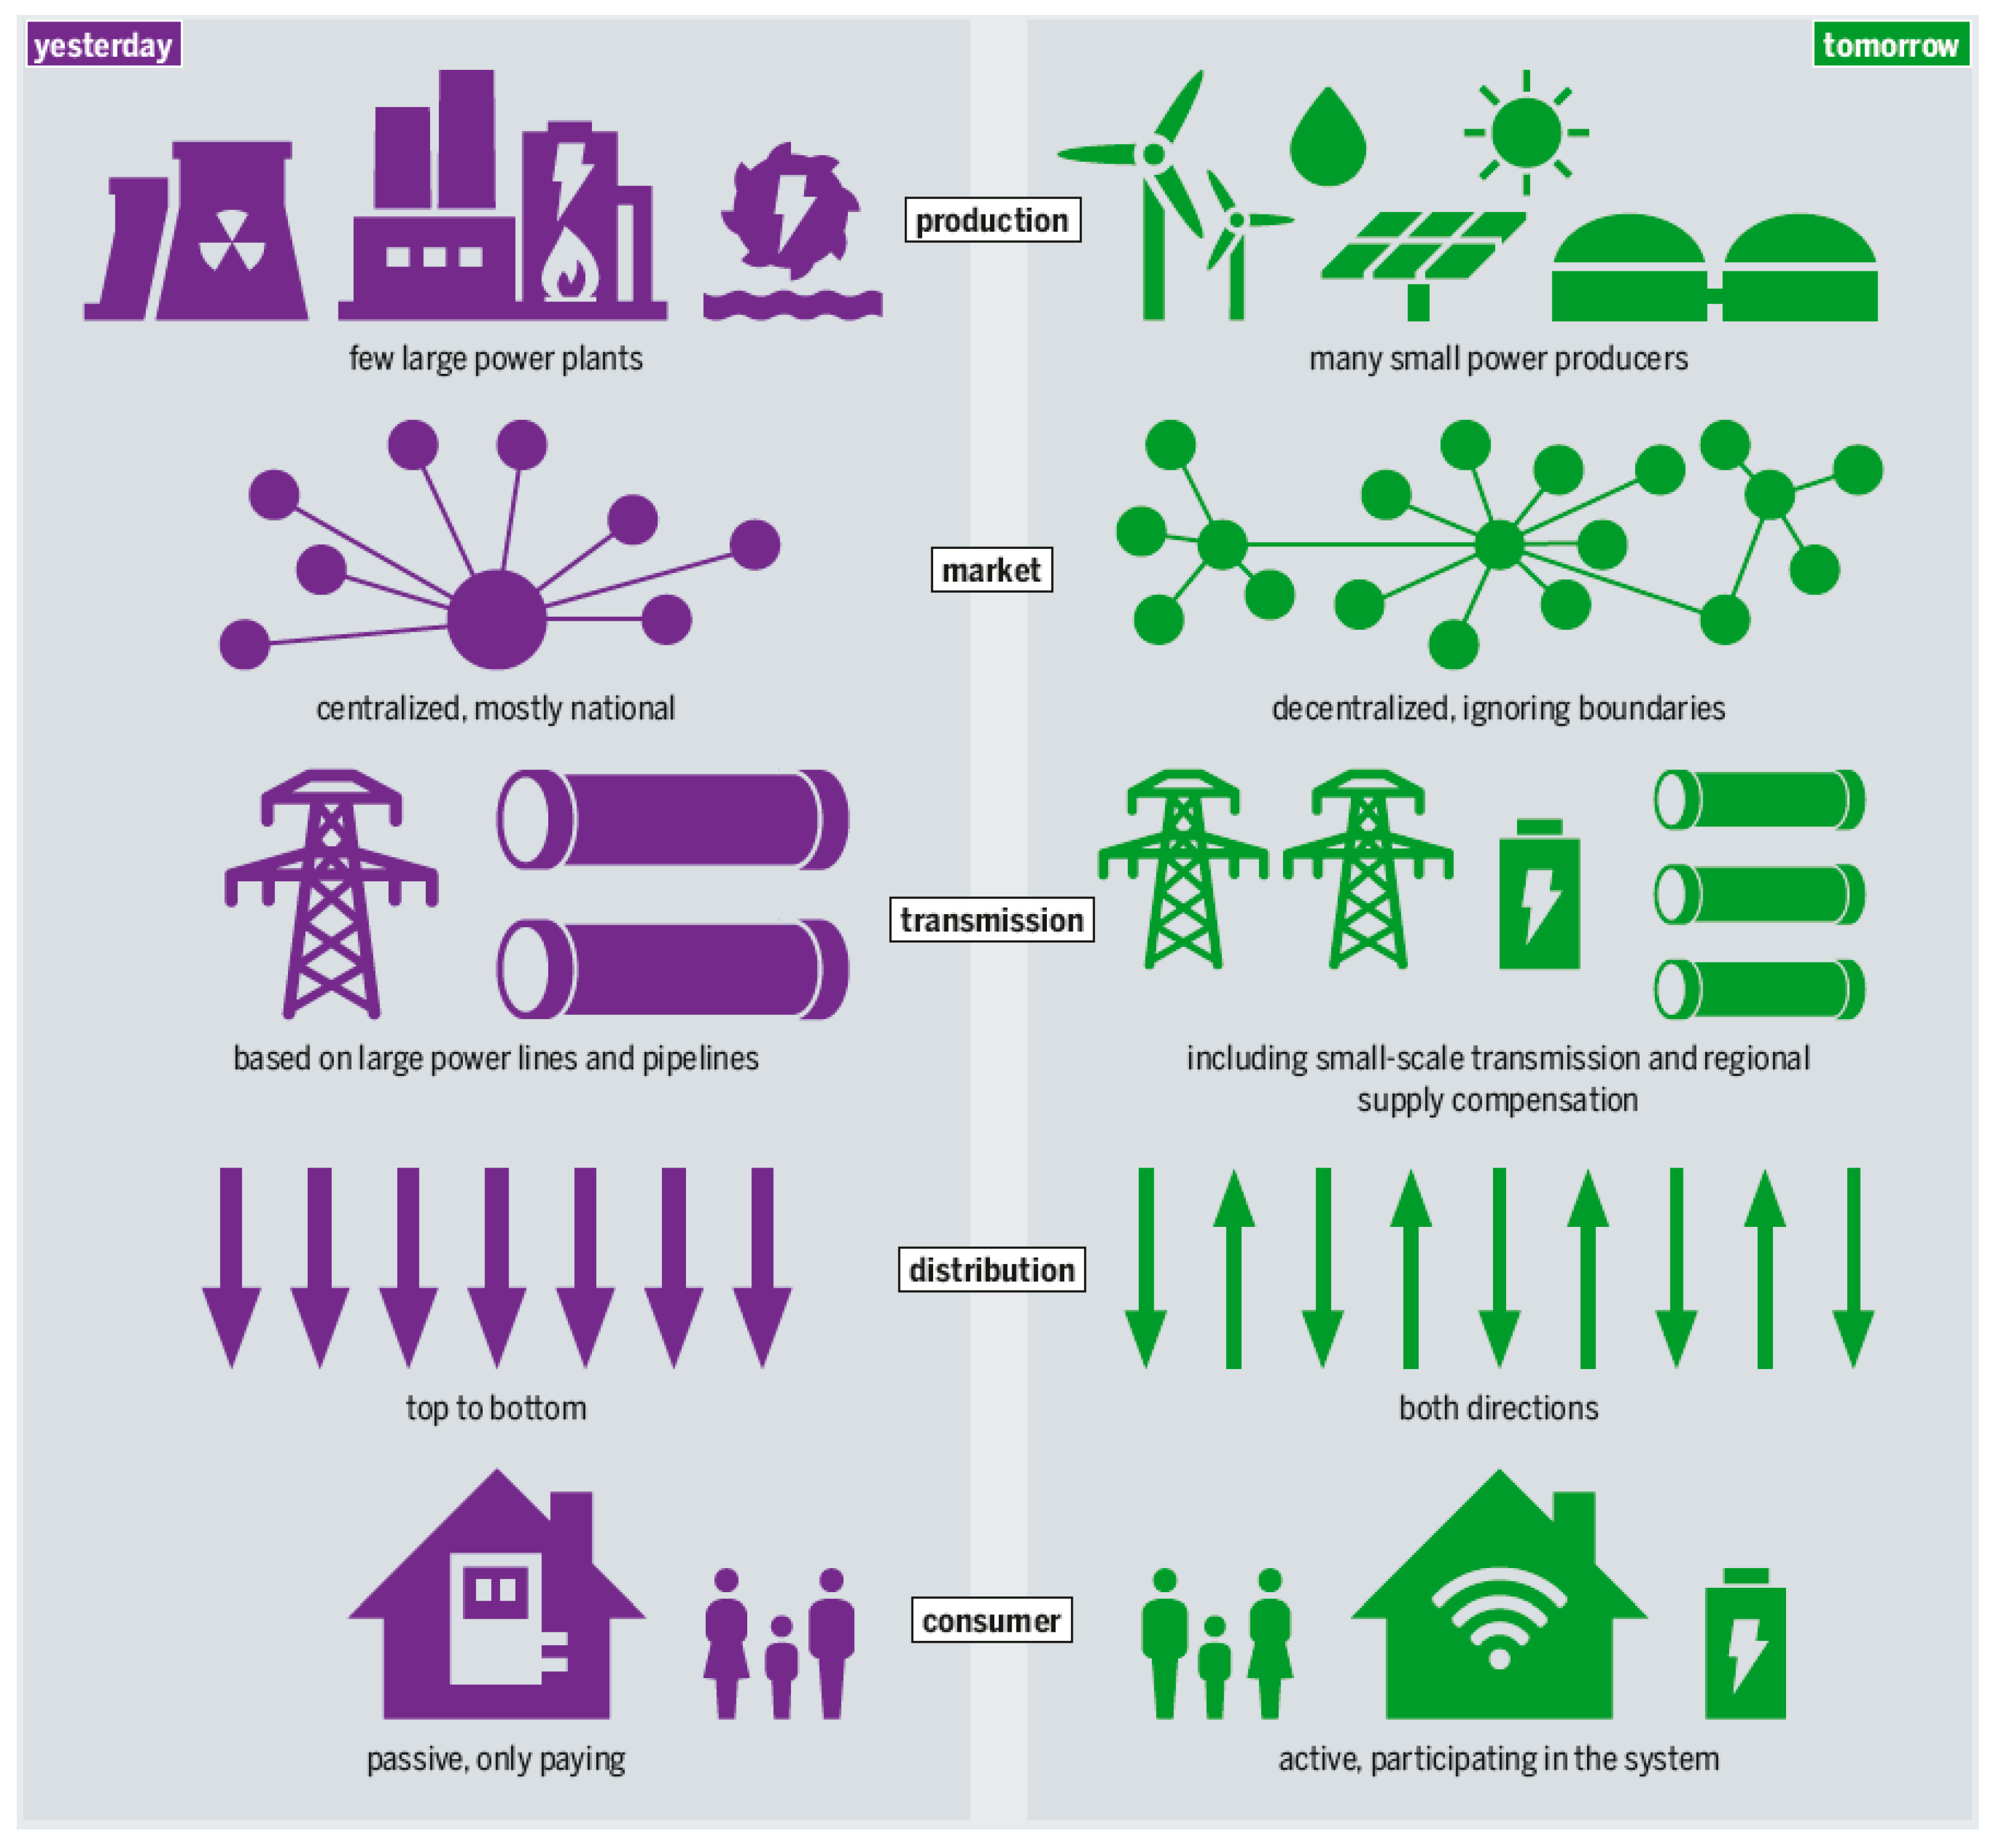
Figure 1 shows a comparison of the current system with the smart grid. The difference in producing is the transition from large power plants to many small power plants, which changes centralized production to decentralize, which is a significant modification smart grid system. Another significant difference is distribution, where the transmission structure is lightened, and a distribution network with compensation is used. While the direction of energy flow has a major impact on these facts. In the current system, we use only one direction, from production to consumption, but in smart grid, this fact changes into a two-way flow of energy, with the consumers themselves also participating in the production [2].
These are the main advantages and goals of a smart grid and for such a network to work, it is first necessary to master a similar management on a smaller scale in a microgrid. The first step towards getting closer to the smart grid is that the issue of the microgrid must first be mastered.
When designing the smart grid, we must choose the appropriate size of local microgrids structures and not forget to select the right energy mix of sources that will power these regional systems and therefore ensure a continuous supply of electricity due to the possibility of switching to island mode [3,4].
Literature Overview
The issue of microgrid systems is addressed worldwide, in which several publications have been published so far. The design of the economic system for the microgrid was realized in the Yanbu area in Saudi Arabia, where they considered using photovoltaic stations (PV), battery energy storage systems, wind farm, diesel generators, and biomass systems [6]. They have a different approach to this issue in South Korea, where they have applied a microgrid model to a photovoltaic system using energy stored in a pumped hydropower plant [7]. The state of Rio de Janeiro in Brazil considered the appropriate choice of sources to supplement renewable energy sources for the high dependence of fossil fuel power plants, therefore these studies were conducted to evaluate the complementarity of renewable energy sources for hydropower plants, photovoltaic stations, and wind farms [8]. From another perspective, the specific mix of energy sources and their environmental impacts and carbon dioxide (CO2) production should also be considered, this issue has been evaluated in Malaysia for the small share of RES and provides a comparison with neighboring countries [9]. In Italy, a study has been carried out in the alpine region to compare combined heat and power (CHP) systems with renewable such as photovoltaic station and run-of-the-river (RoR) hydropower. The use of this combined source system will ensure the same energy satisfaction as in thinking only with only twice the number of RES they do not consider CHP [10]. For the Portuguese power energy system, a study has been carried out on the optimal combination of renewable energy production, specifically for photovoltaic stations, hydropower plants and wind farms based on temporal and spatial diversity. The study shows that to limit the reserve power, it is appropriate to consider the total power of photovoltaic stations and wind farms, which their sum will be lower than the installed capacity of hydropower plants [11]. The issue of the mix of energy sources, mainly affects fewer developing countries than Bangladesh, where so far, they mainly use gas and oil as energy sources, which does not contribute to reducing carbon dioxide. It is for this reason that it is necessary to solve the problem of microgrid systems and introduce the ready-made solution directly to less developing countries [12]. Compared to other countries, the issue of the energy network in Sudan is considerably complicated by the size and location of the communities. For this reason, it uses small island networks, where they use solar and wind energy with energy storage using compressed air, which, due to their geographical location, are ideally renewable energy sources [13].
When compiling the energy mix of resources, it is necessary to consider several factors, the main role being played by the daily load diagram and the selection of energy sources in terms of CO2 minimization, risk minimization, or levelized cost of energy [14].
The issue of microgrid system analyzes various possibilities of electricity storage, for example, using compressed air energy storage (CAES) and power-to-gas (P2G). The advantage of this system is the possibility of storing any excess energy [15]. The issue of renewable energy sources and their dynamic changes depending on the weather is important to solve, which also results in new or modified control methods that improve the use of energy stored in the battery or another storage system [16].
2. Current Situation in Slovakia
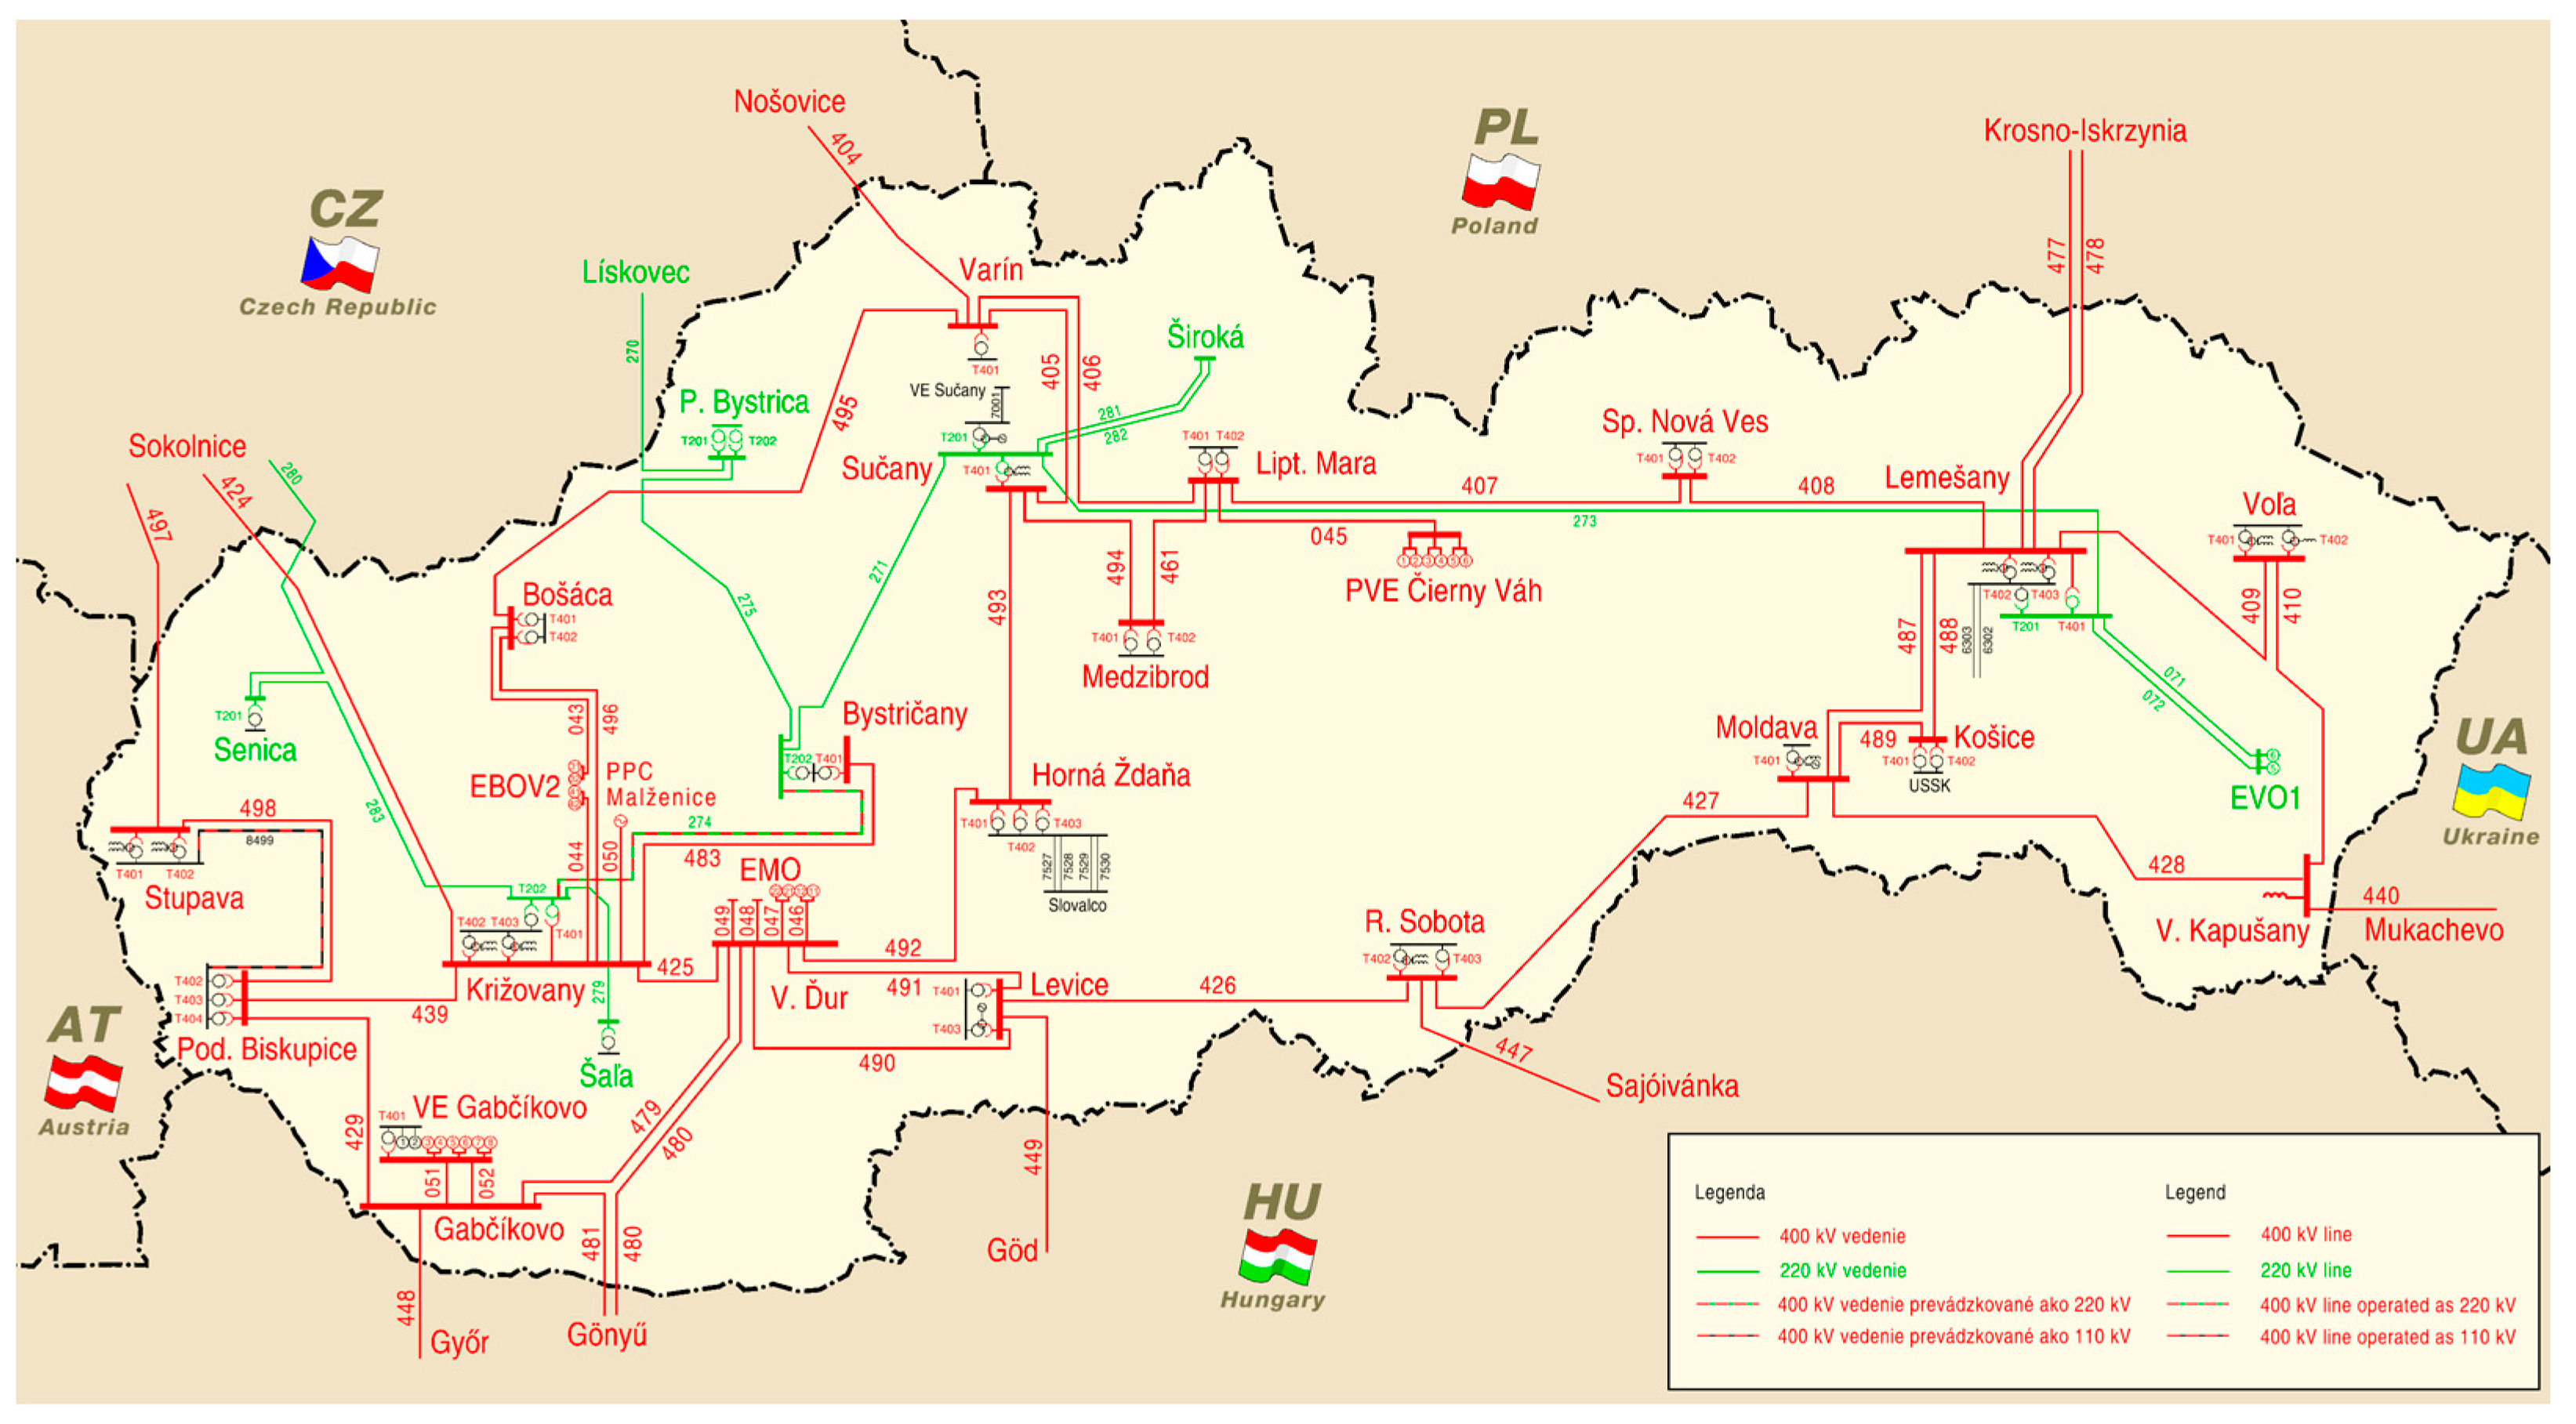
The Slovak Republic has one transmission system, which is managed by the Slovak Electricity Transmission System, a.s. (SEPS). SEPS manages all transmission lines with a total length of 3008 km and a total transformation power of 11,730 MVA [17]. As shown in Figure 2 current grid map.
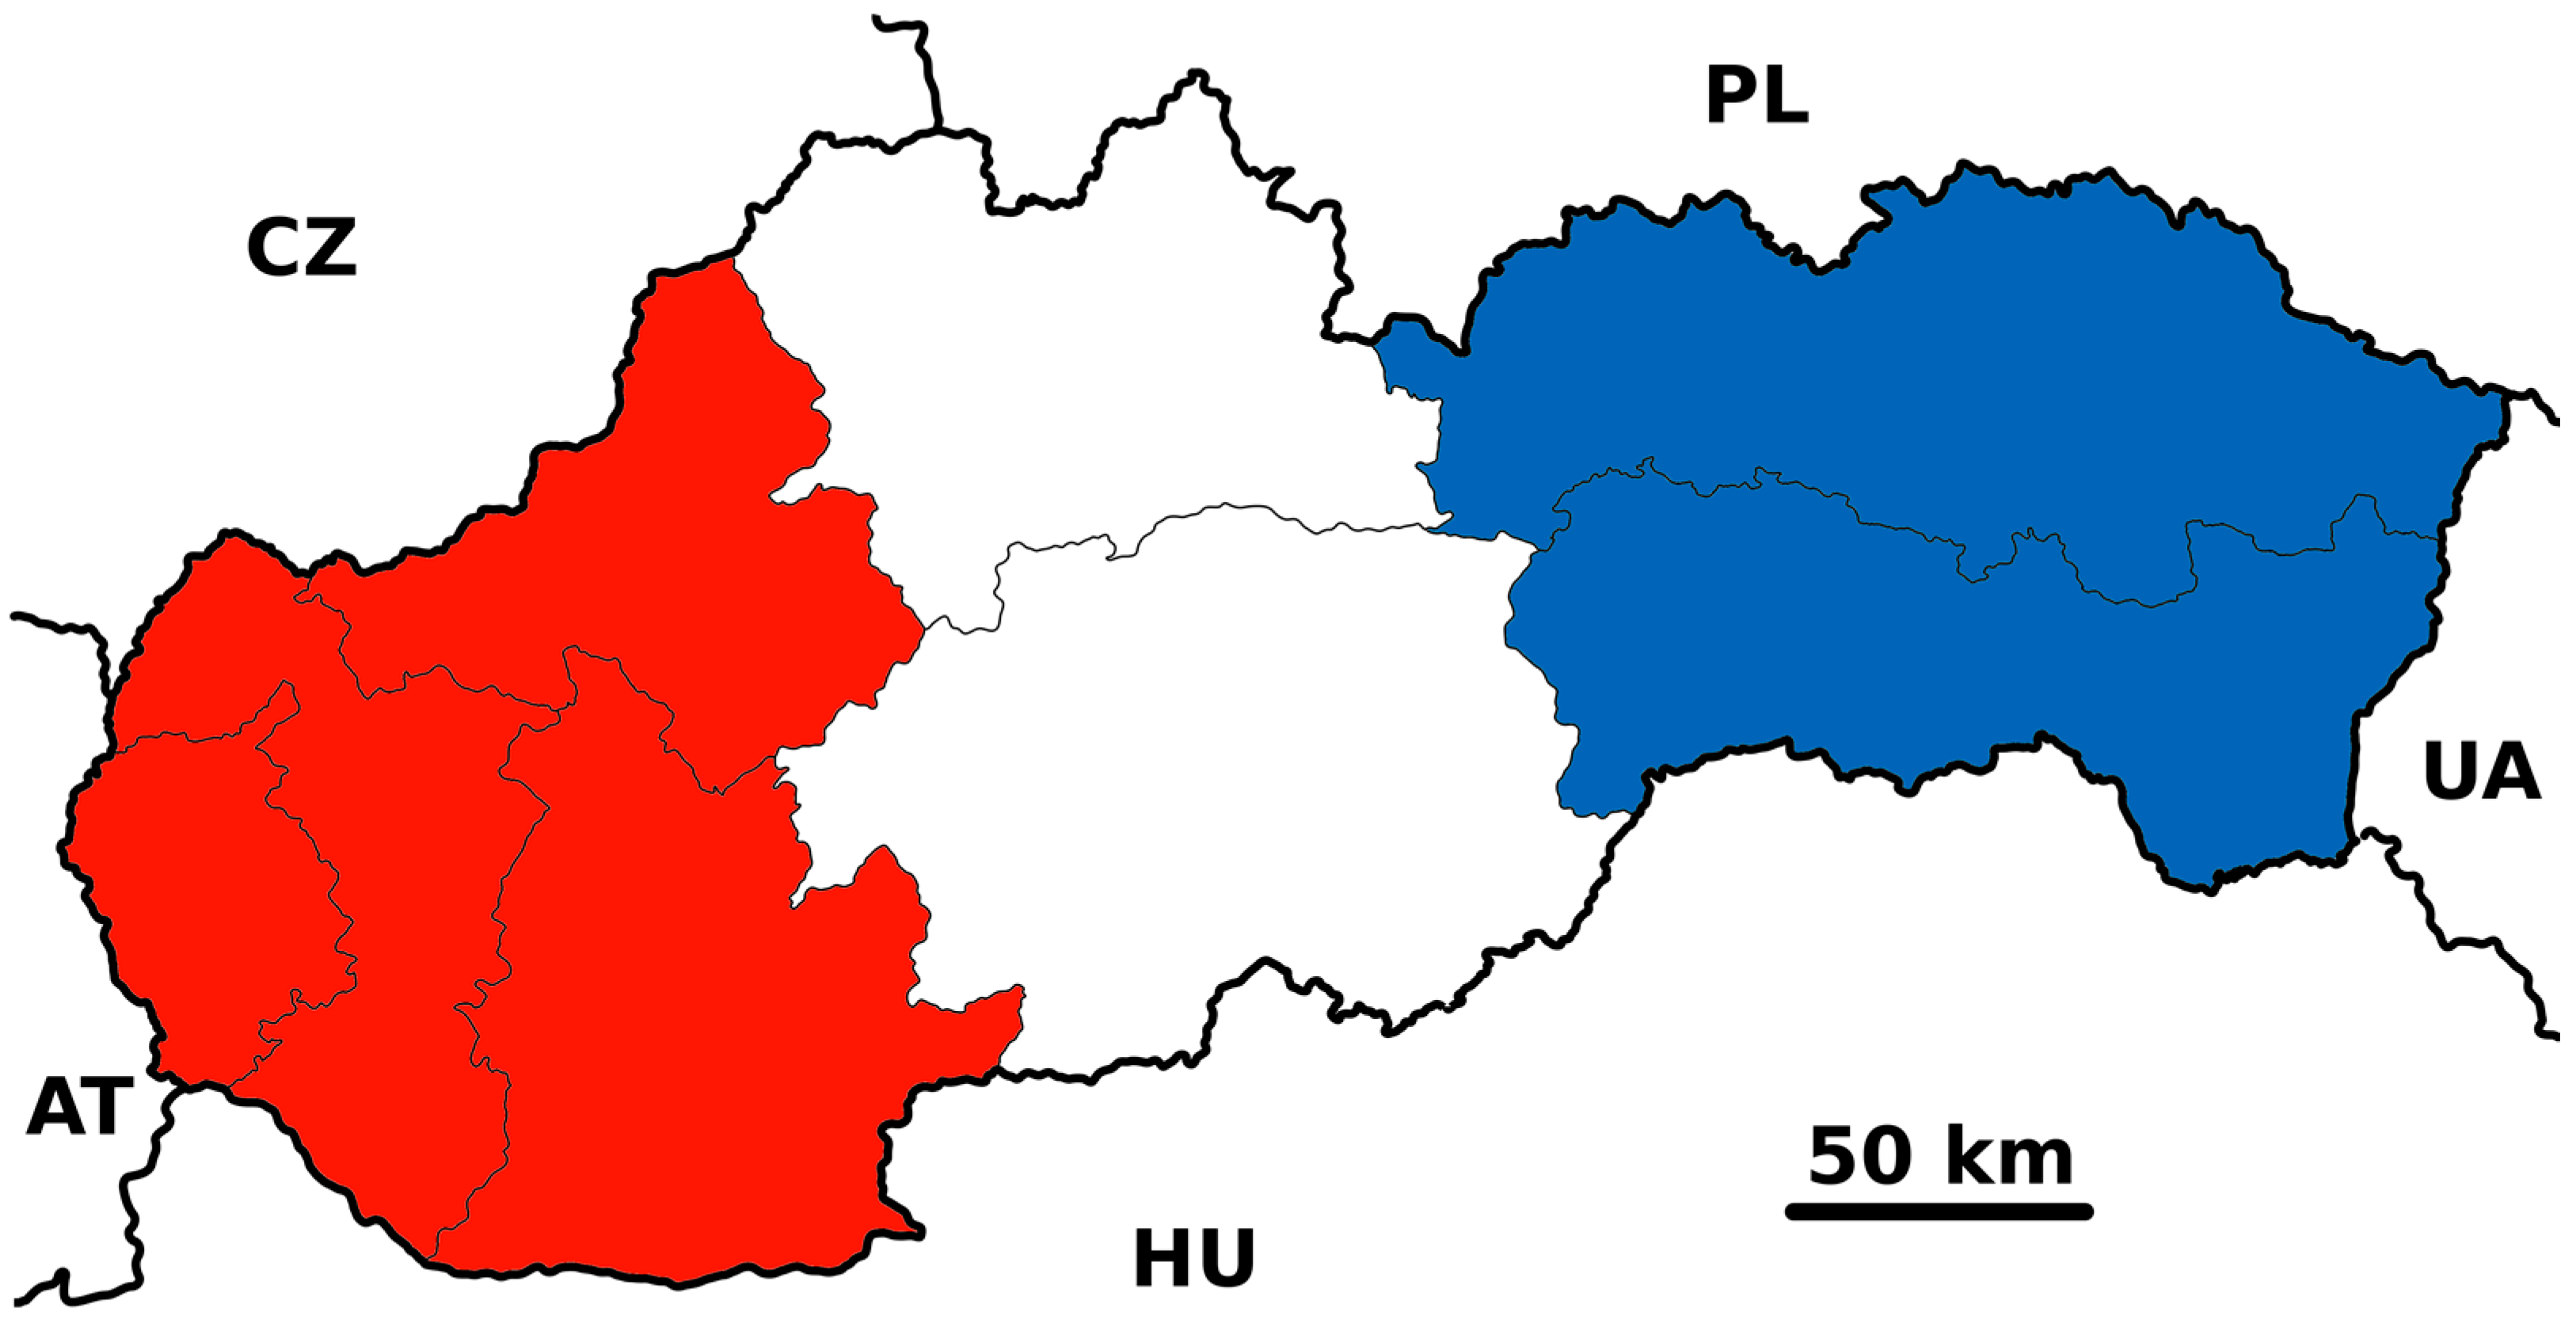
Furthermore, the Slovak Republic was divided into three distribution companies, namely West Slovak Distribution, a.s. (ZSD), Middle Slovak Distribution, a.s. (SSD), and East Slovak Distribution, a.s. (VSD). As shown in Figure 3.
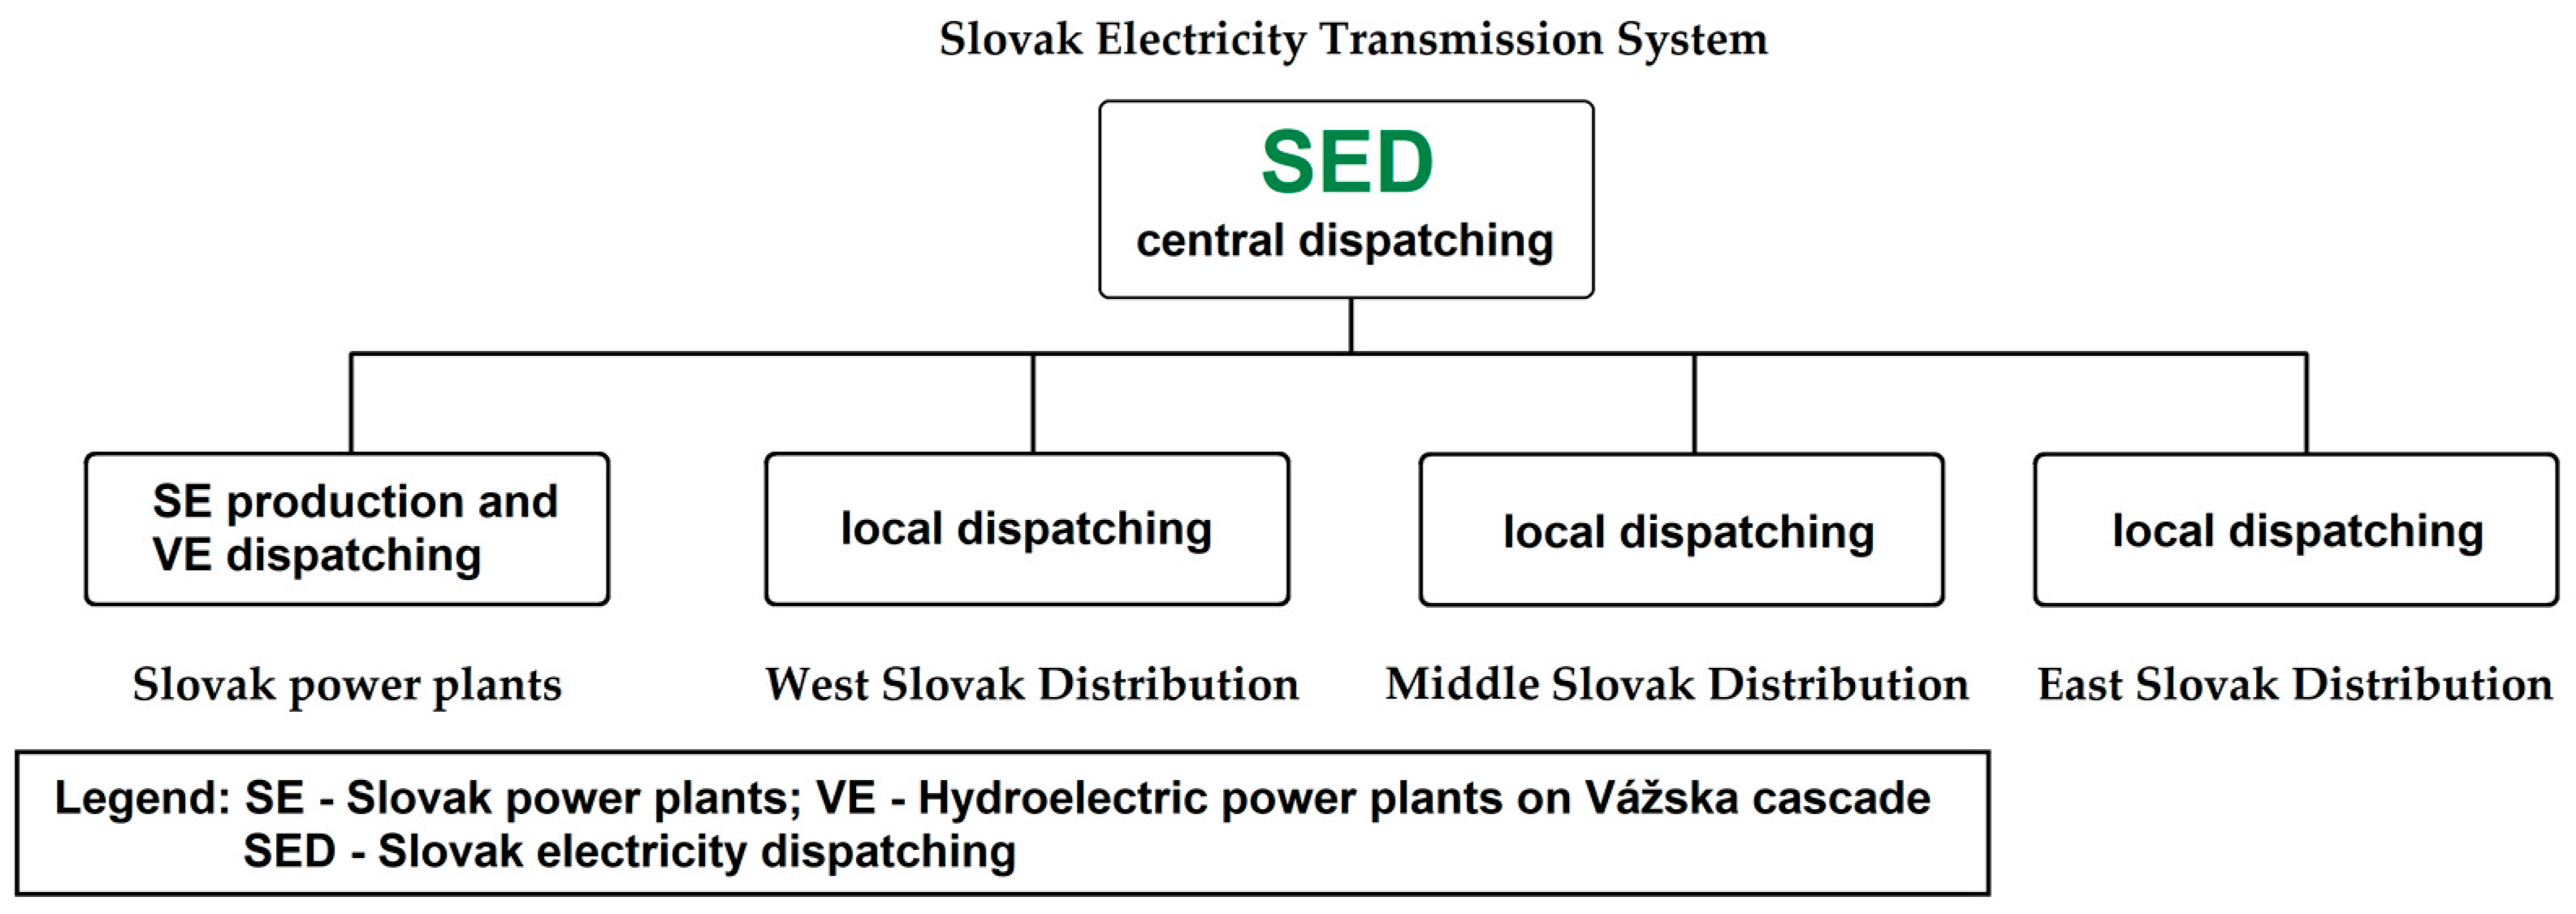
The organization of power supply management in Slovakia was divided according to Figure 4. The transmission and distribution of power at the voltage level of 400 kV and 220 kV are controlled by SEPS at the central dispatching Slovak electricity dispatching (SED). The majority production of electricity is managed by Slovak power plants through dispatching stations in individual power plants, and the management of all hydroelectric power plants in the Vážska cascade is managed by a separate dispatching center. The supply of electricity to households and businesses is provided by local dispatch centers as ZSD, SSD, and VSD according to the point of consumption, as shown in Figure 3. These dispatching manage voltage level of 110 kV, 22 kV, and 0.4 kV. During the transition to the intelligent network, it will be necessary to redistribute the management of Slovak power and hydropower plants between the SED and the local dispatching stations ZSD, SSD and VSD.
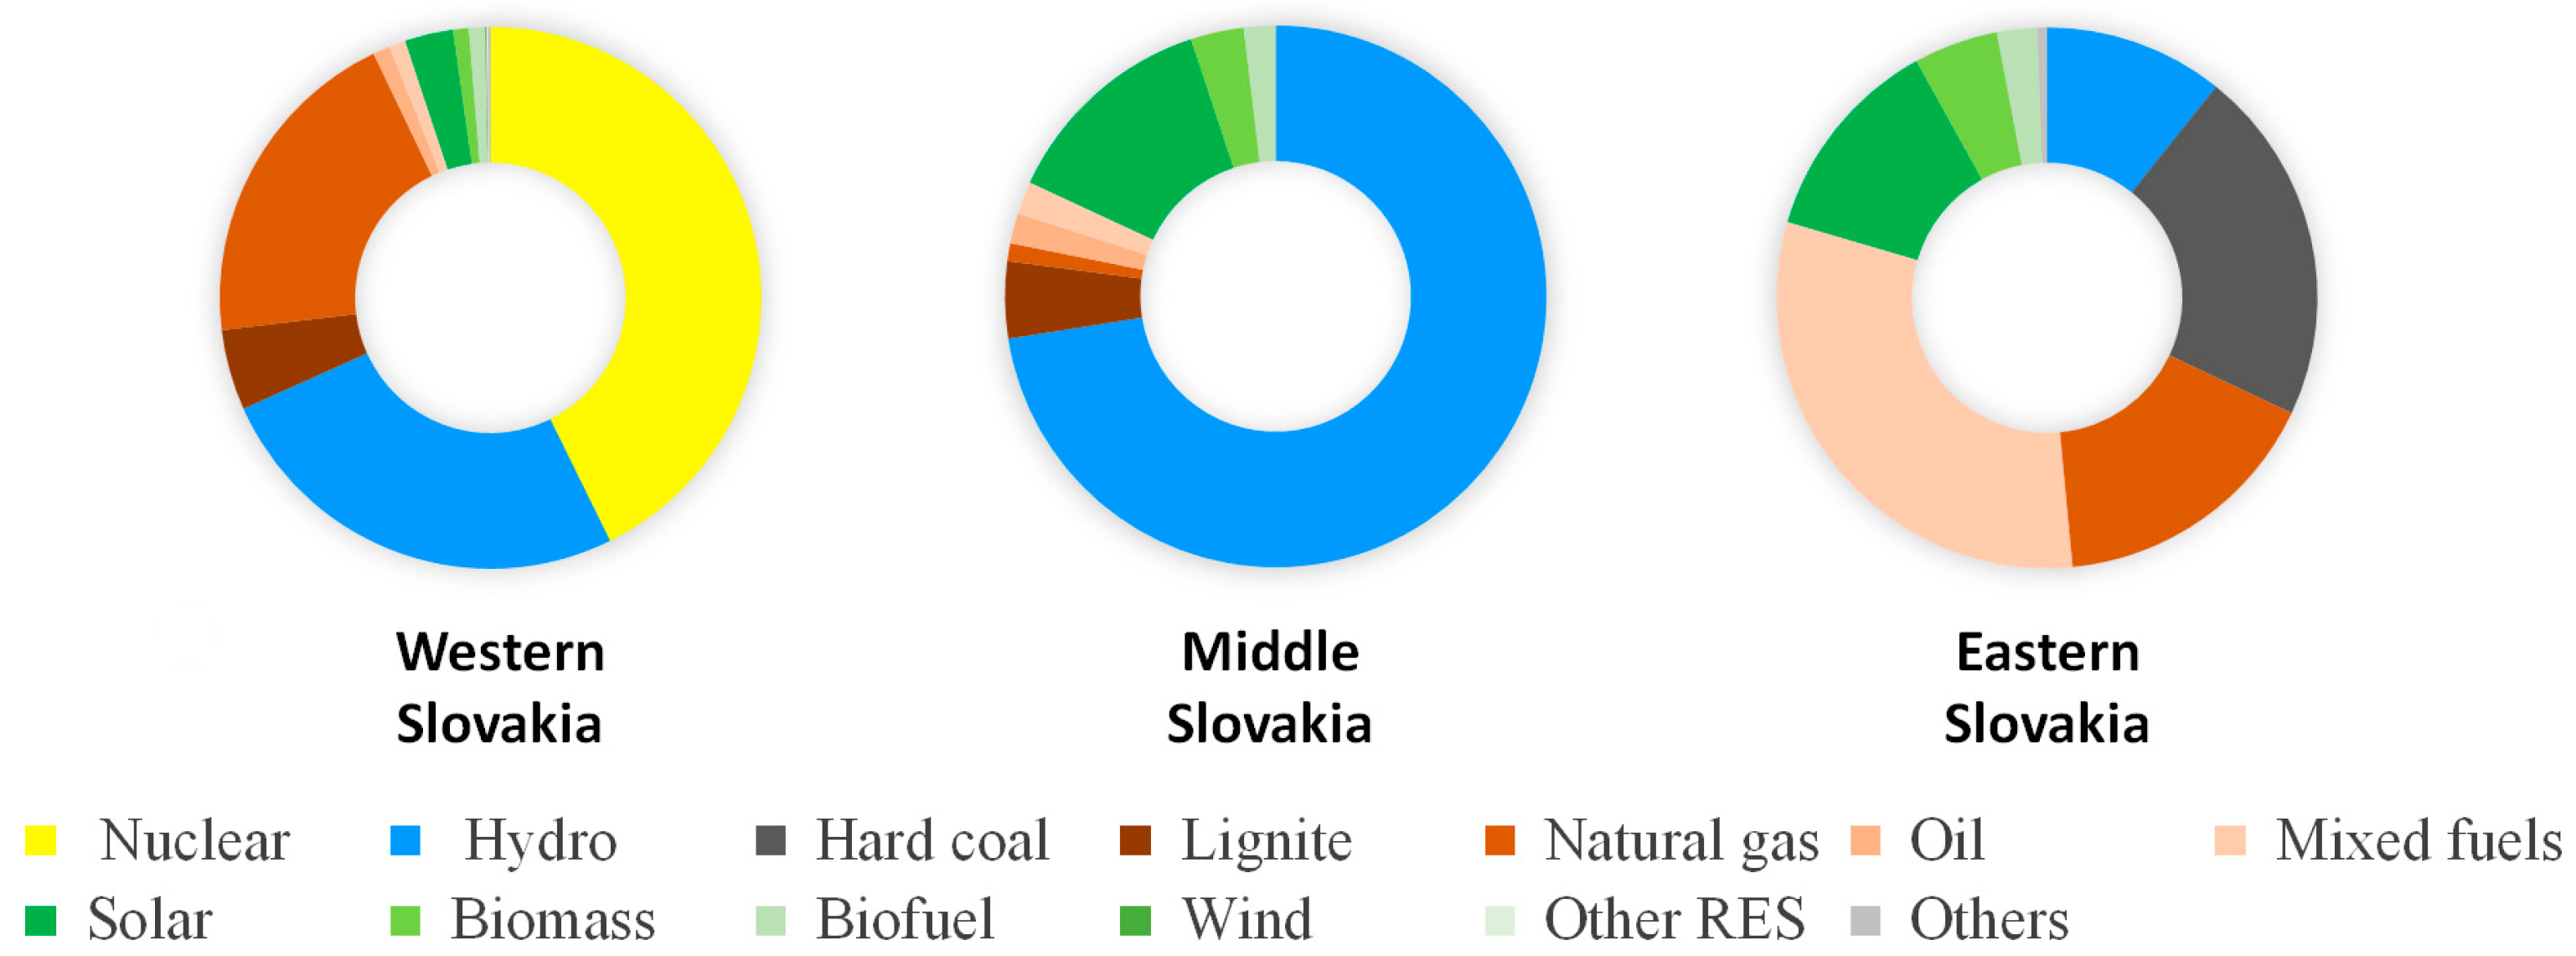
Slovak power plants operate 31 hydro, 2 nuclear, 2 thermal, and 2 solar power plants with a total capacity of 4112 MW [19]. The total installed capacity of the Slovak power plant in 2019 is 7716 MW. The full electricity consumption for the Slovak Republic in 2019 was 30,309 GWh [17]. When we examined more detailed information about the location of power plants, we found the following divisions of power plants in Slovakia, which is shown in Table 1 and Figure 5.
3. Microgrid
Research shows microgrid systems will be a key part of building smart grids, and this major part also provides solutions for powering remote communities and industrial facilities and military bases that are usually connected to the grid so that they can disconnect and operate independently.
Microgrid working system:
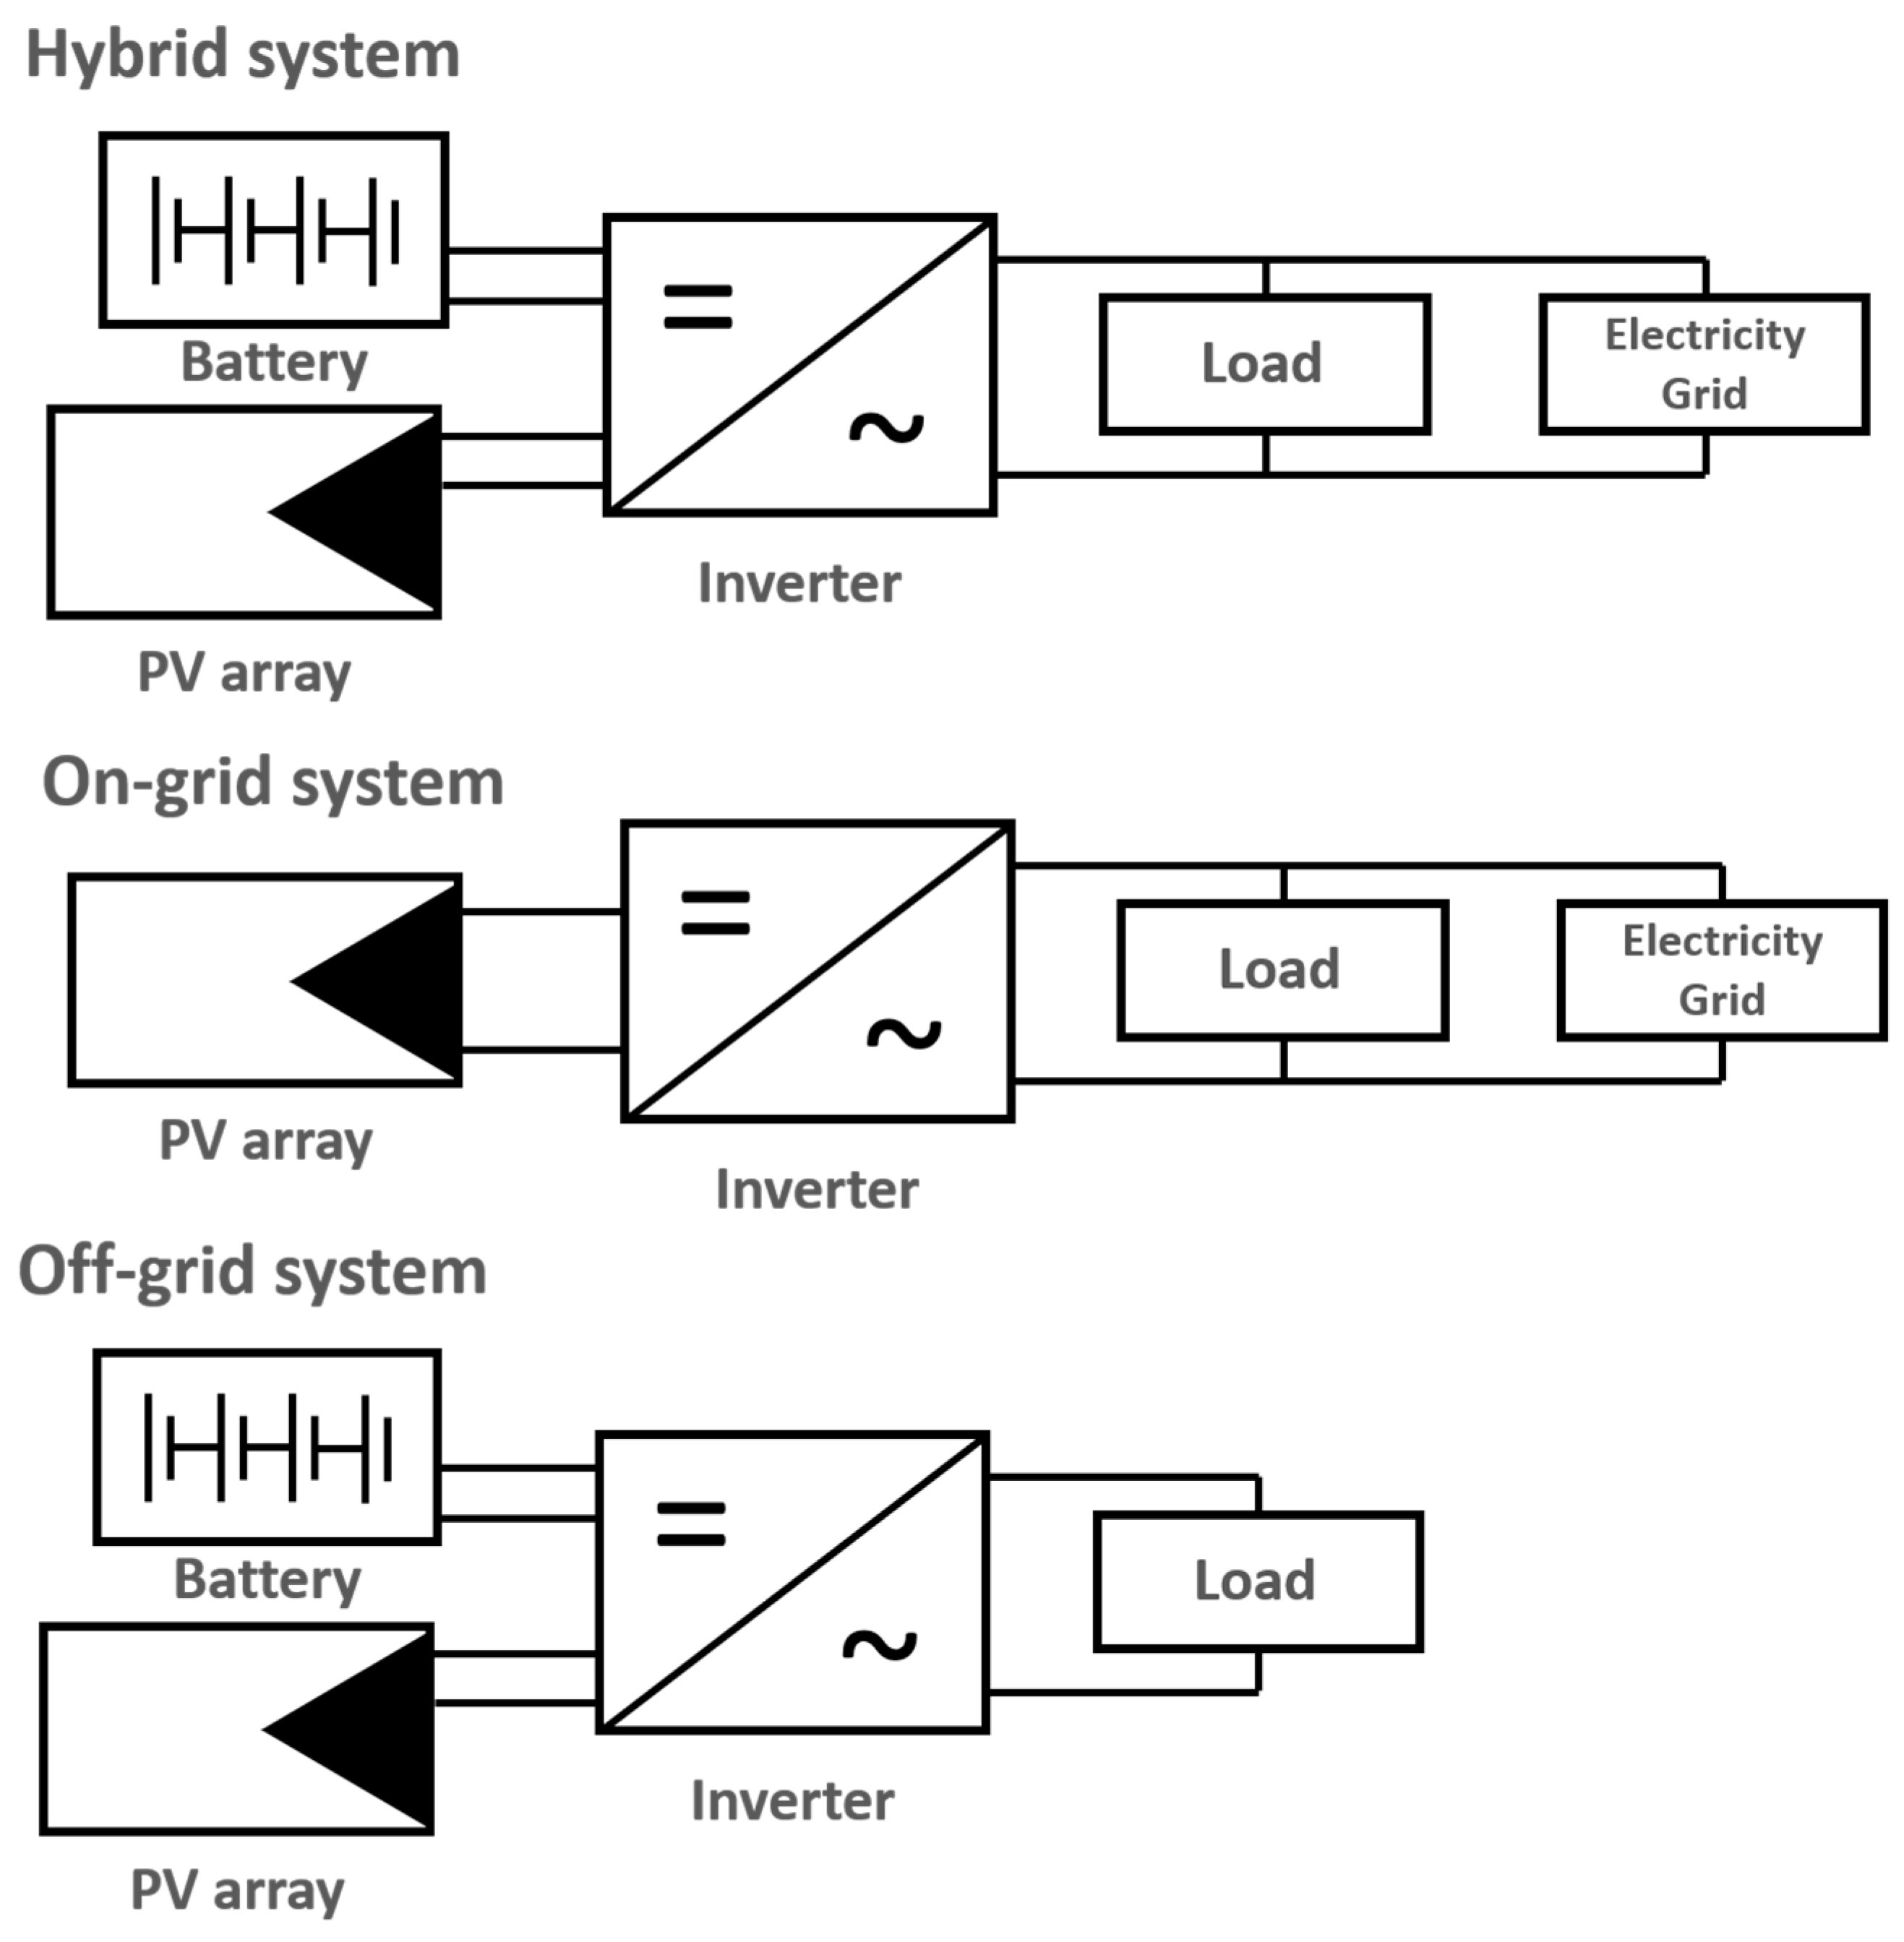
- On-grid microgrid obtains a battery-free system that is connected to the public power grid. Any excess solar energy they produce is provided in the power grid. The primary disadvantage of this structure is that they fail to operate during a blackout [26].
- Off-grid microgrids typically provide power for remote villages, industrial operations, and military bases. These usually have a very high cost of generation as they are totally dependent on diesel fuel and may face logistical challenges in fuel delivery. We can also use photovoltaic panels with battery systems, but in this case, we have certain performance limitations [26].
- Hybrid microgrids can be disconnected from the grid to operate autonomously, ensuring continuity of power supply in the case of an outage. This approach is common in locations where the grid can be unreliable, such as storm-prone or mountainous areas. As shown in Figure 6 system takes advantage of both previous systems.
The most promising for the future is a hybrid system, which, as shown in Figure 6, uses the advantages of both the On-grid and the Off-grid systems. However, there are also problems with this system in the form of a protection system and locating faults. The main problem with the microgrid system is the way of managing individual resources so that they work as efficiently as viable and with the least possible losses. Solving these problems in microgrid systems will simplify management, increase the efficiency of electricity generation, and reduce transmission losses in the smart grid.
For these microgrid systems, it will therefore be essential to select, according to the area of application, the appropriate energy sources so that the supply of electricity is guaranteed under any weather conditions. The problem with applying these structures in practice is several, but the essential problems are with a suitable mix of energy sources for such systems and the transmission infrastructure itself, which is undesigned for such changes. The key will be to determine the size of the area that such a microgrid system will control.
Examples of Application of Microgrid Systems
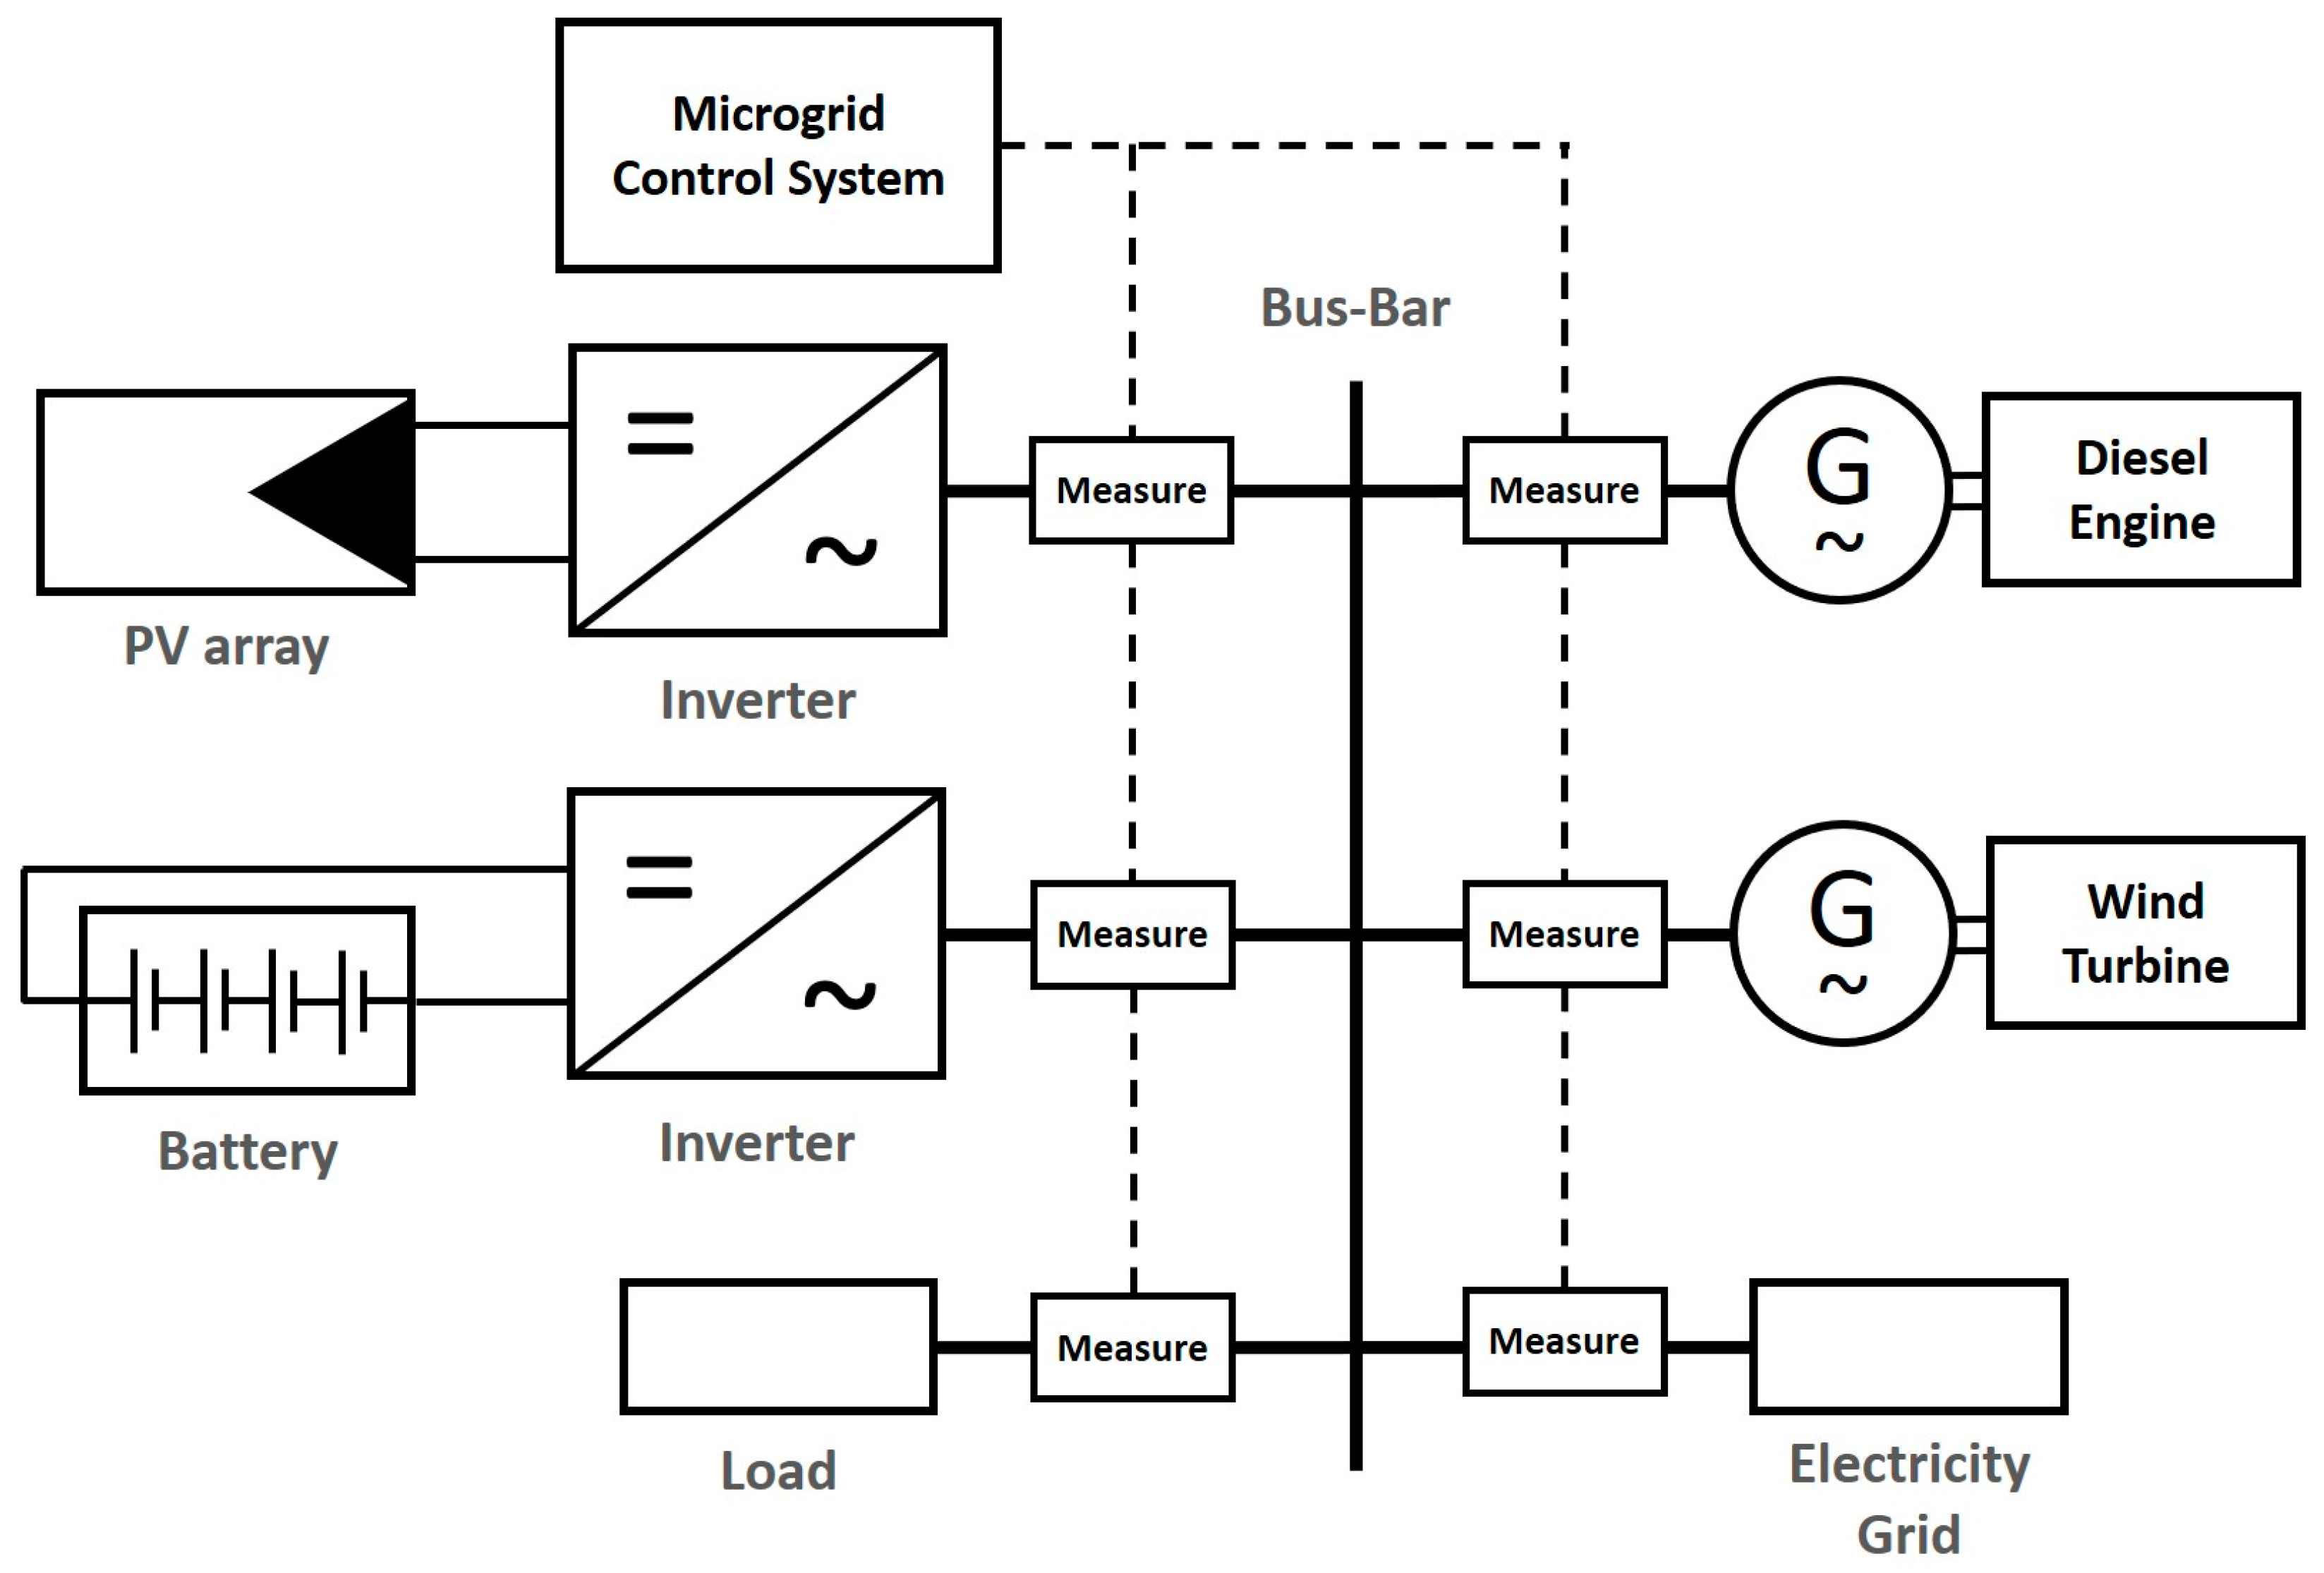
The schematic of the microgrid system shown in Figure 6 has already been practically tested on island operation and is currently working in a few places. One such system supplies electricity to the remote north of the Arctic, with approximately 160 members of Lake Colville located 50 km beyond the Arctic Circle in Northern Canada. The peak load is 150 kW and the basic load is 30 kW, 136 kW solar panels were installed locally, generating approximately 112 MWh per year—representing about half of the community’s total annual consumption, together with a 2 × 100 kW and 1 × 150 kW diesel generators complemented by a battery energy storage system (BESS) Intensium® Max 20M Medium Power (IM 20M) (Saft, Jacksonville, USA), which provides 232 kWh of energy in combination with a 200 kW Power Conditioning System from ABB (ABB, Napier, New Zealand) [26,27].
At the other extreme, microgrid is also supporting a remote community in Bolivia’s Amazonian rainforest, near the border of Brazil and Peru. The remote community is not grid connected and depended on 16 MW diesel generators and 5 MW solar PV, together with a BESS comprising two Saft IM 20M Medium Power containers (Saft, Jacksonville, USA), each with 580 kWh storages and 1.1 MW peak power output to meet total 8 MW load. BESS allows the penetration of renewables to be optimized while ensuring operational excellence in terms of reliability and stability [26]. Figure 7 shown used microgrid.
Experience has shown that research into renewable energy sources and increasing the efficiency of already used electricity sources is still needed. The combination of BESS and solar PV has proved its worth in practice, and it is necessary to address the issue for the design of the energy mix of sources and not only use fossil energy sources. In such a case, if we consider in the future with the use of battery systems, it is necessary to deal with their recycling, increasing their lifespan and technical parameters.
4. Modeling RES in MATLAB/Simulink
In this chapter we will deal with RES models and evaluation of their properties during ordinary operation and through simulated fault conditions. For further research and development, it is necessary to utilize quality models that will match the facts for their applications in microgrid and smart grid systems.
The following models use the Simscape Power System library (v7.5, MathWork, CA, USA) in the Simulink (v9.10.0.1649659, MathWork, CA, USA). For the following models, we will consider with photovoltaic stations, diesel generators, battery systems, and thermal power plants and hydropower plants, which would be most suitable use for Slovakia.
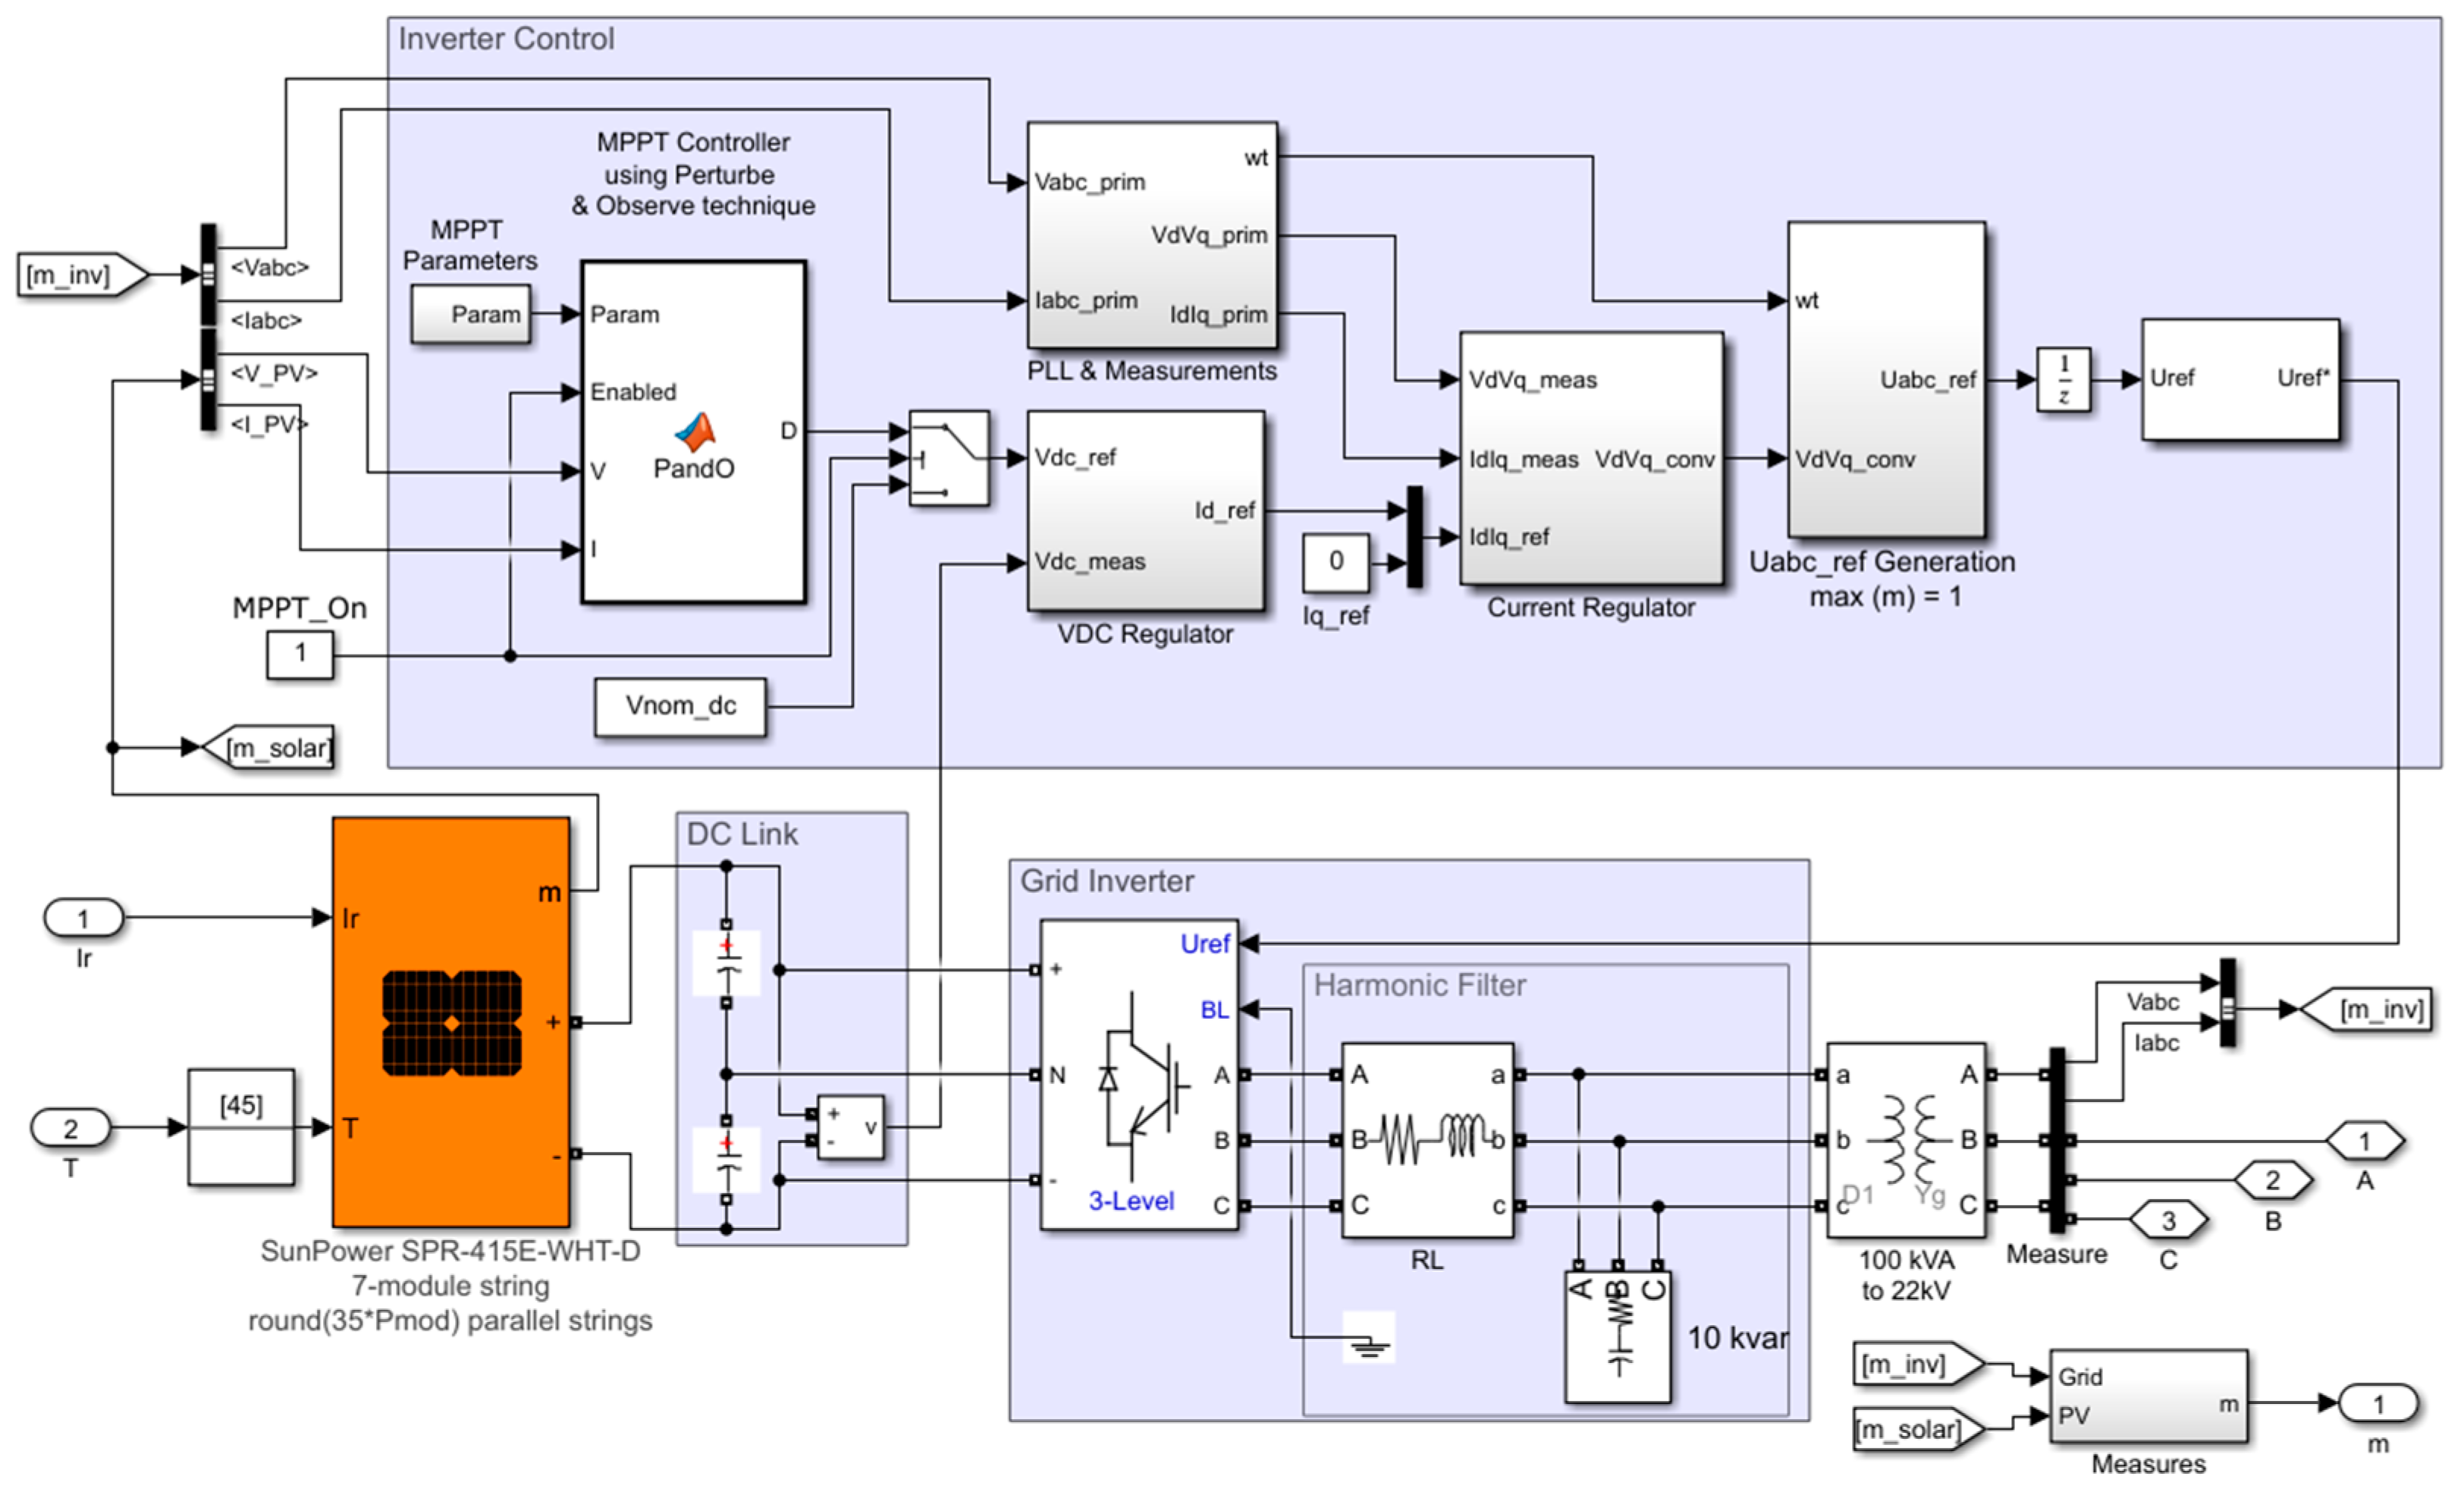
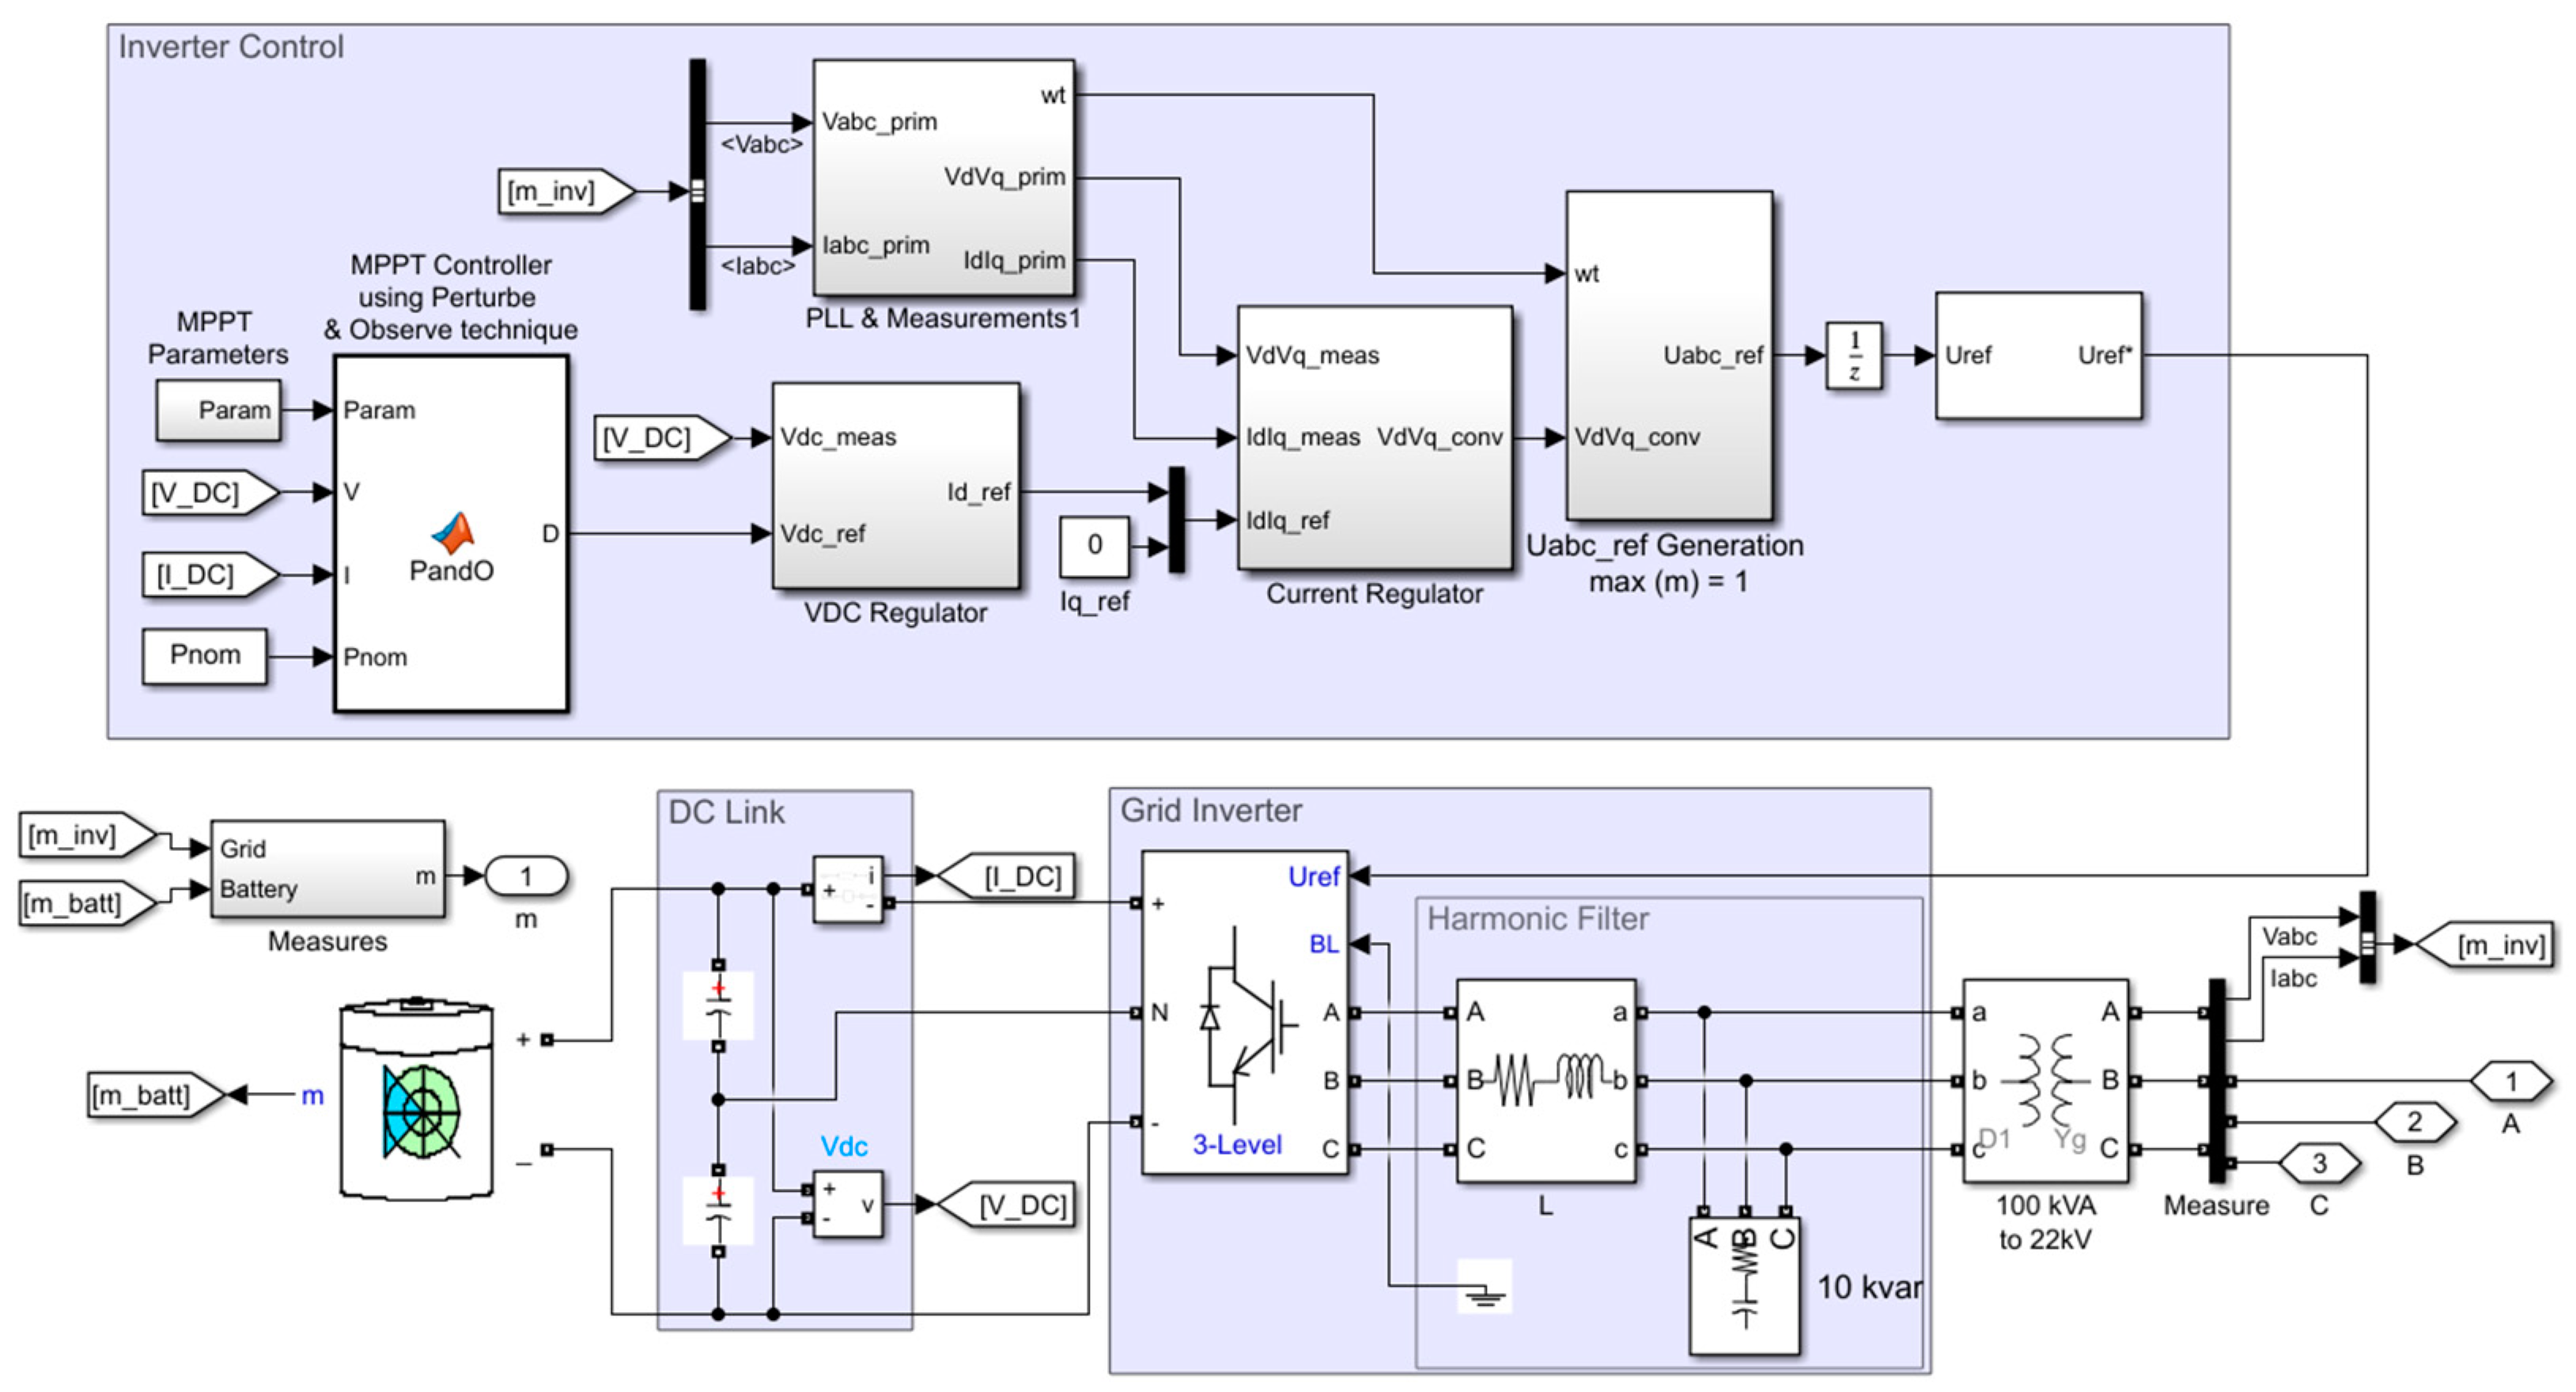
4.1. Model of Photovoltaic Station
This model of photovoltaic station was designed for an output of 100 kW. The PV array has seven modules per string connected in series, which are connected in thirty-five strings in parallel. Wherein the DC link electric potential is 480 V and the output phase–phase alternating voltage from the inverter is 250 V, which is in the end increased to a 22 kV by means of a step-up transformer. Figure 8 shown schematic model of PV station.
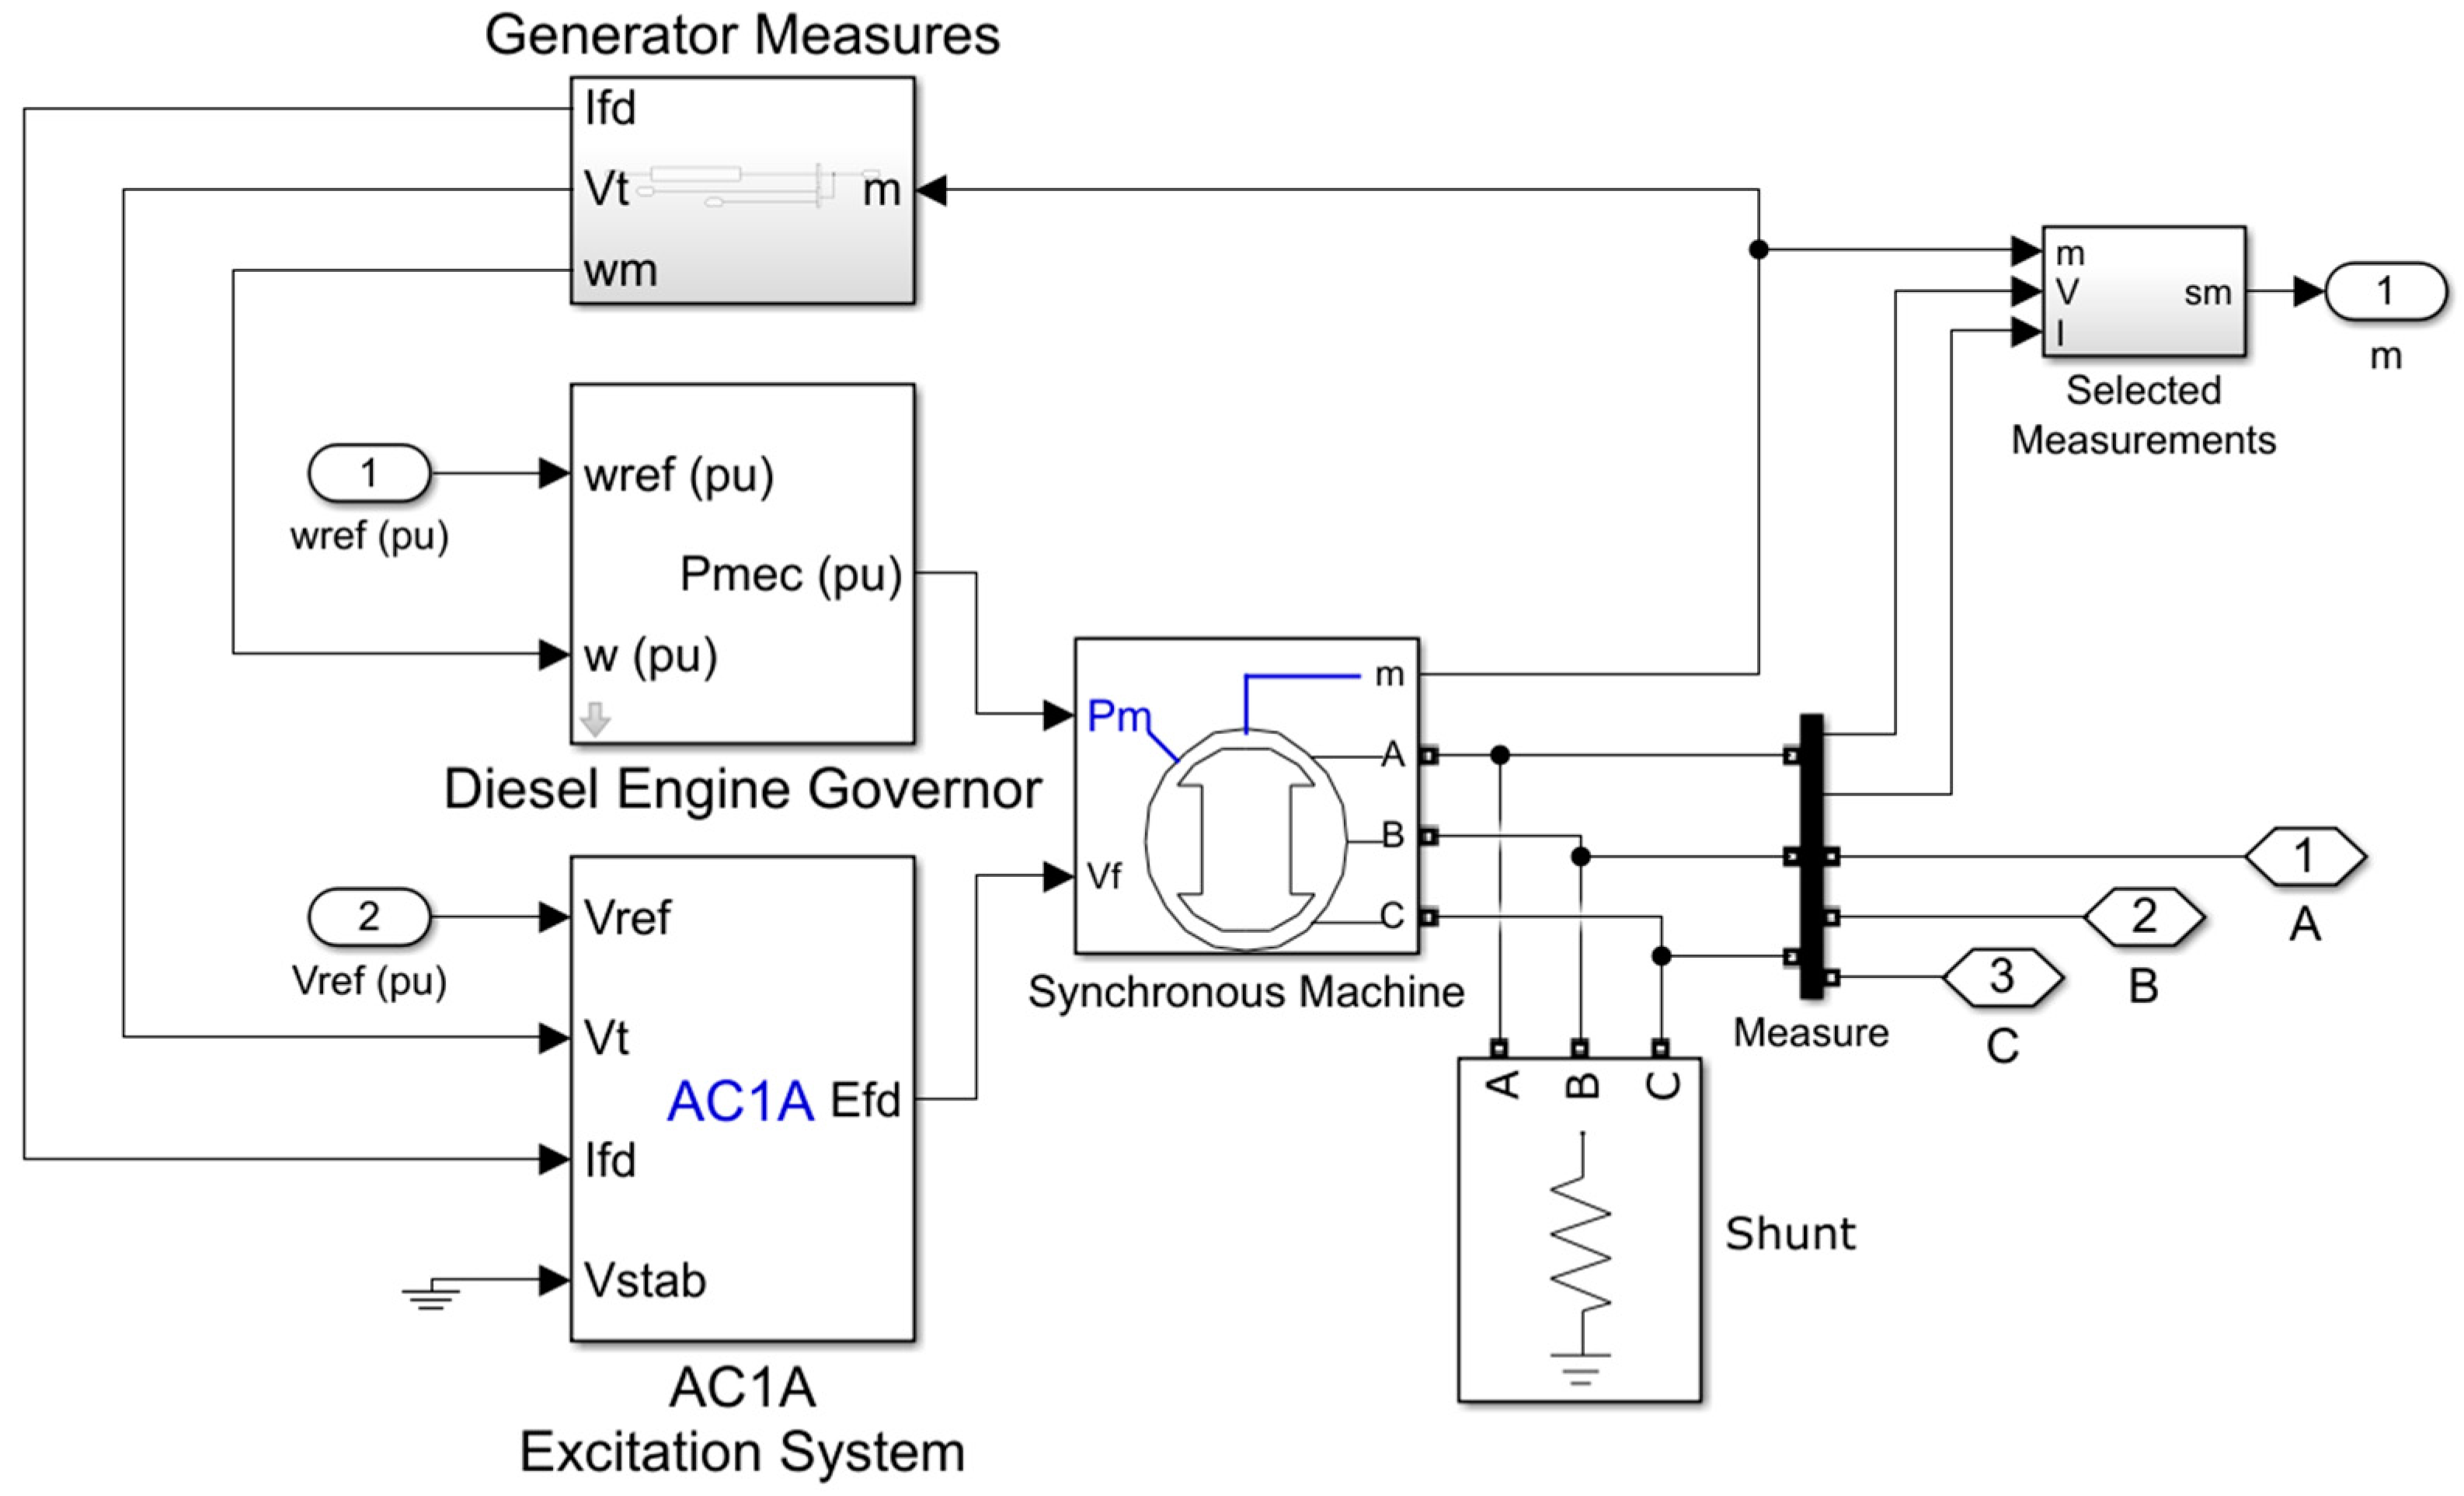
4.2. Model of Diesel Generator
This model of the diesel generator was designed for direct connection to the network for a phase–phase voltage of 22 kV for this reason. It is not necessary to use a step-up transformer. A synchronous machine was used in this model to generate electricity. Figure 9 shown schematic model of diesel generator.
4.3. Model of Battery Energy Storage System
This model of battery energy storage system was based on the same design as the replica of the photovoltaic station. This model also uses a step-up transformer to output power to the grid. The battery module can also be added in a PV station. Figure 10 shown schematic model of BESS.
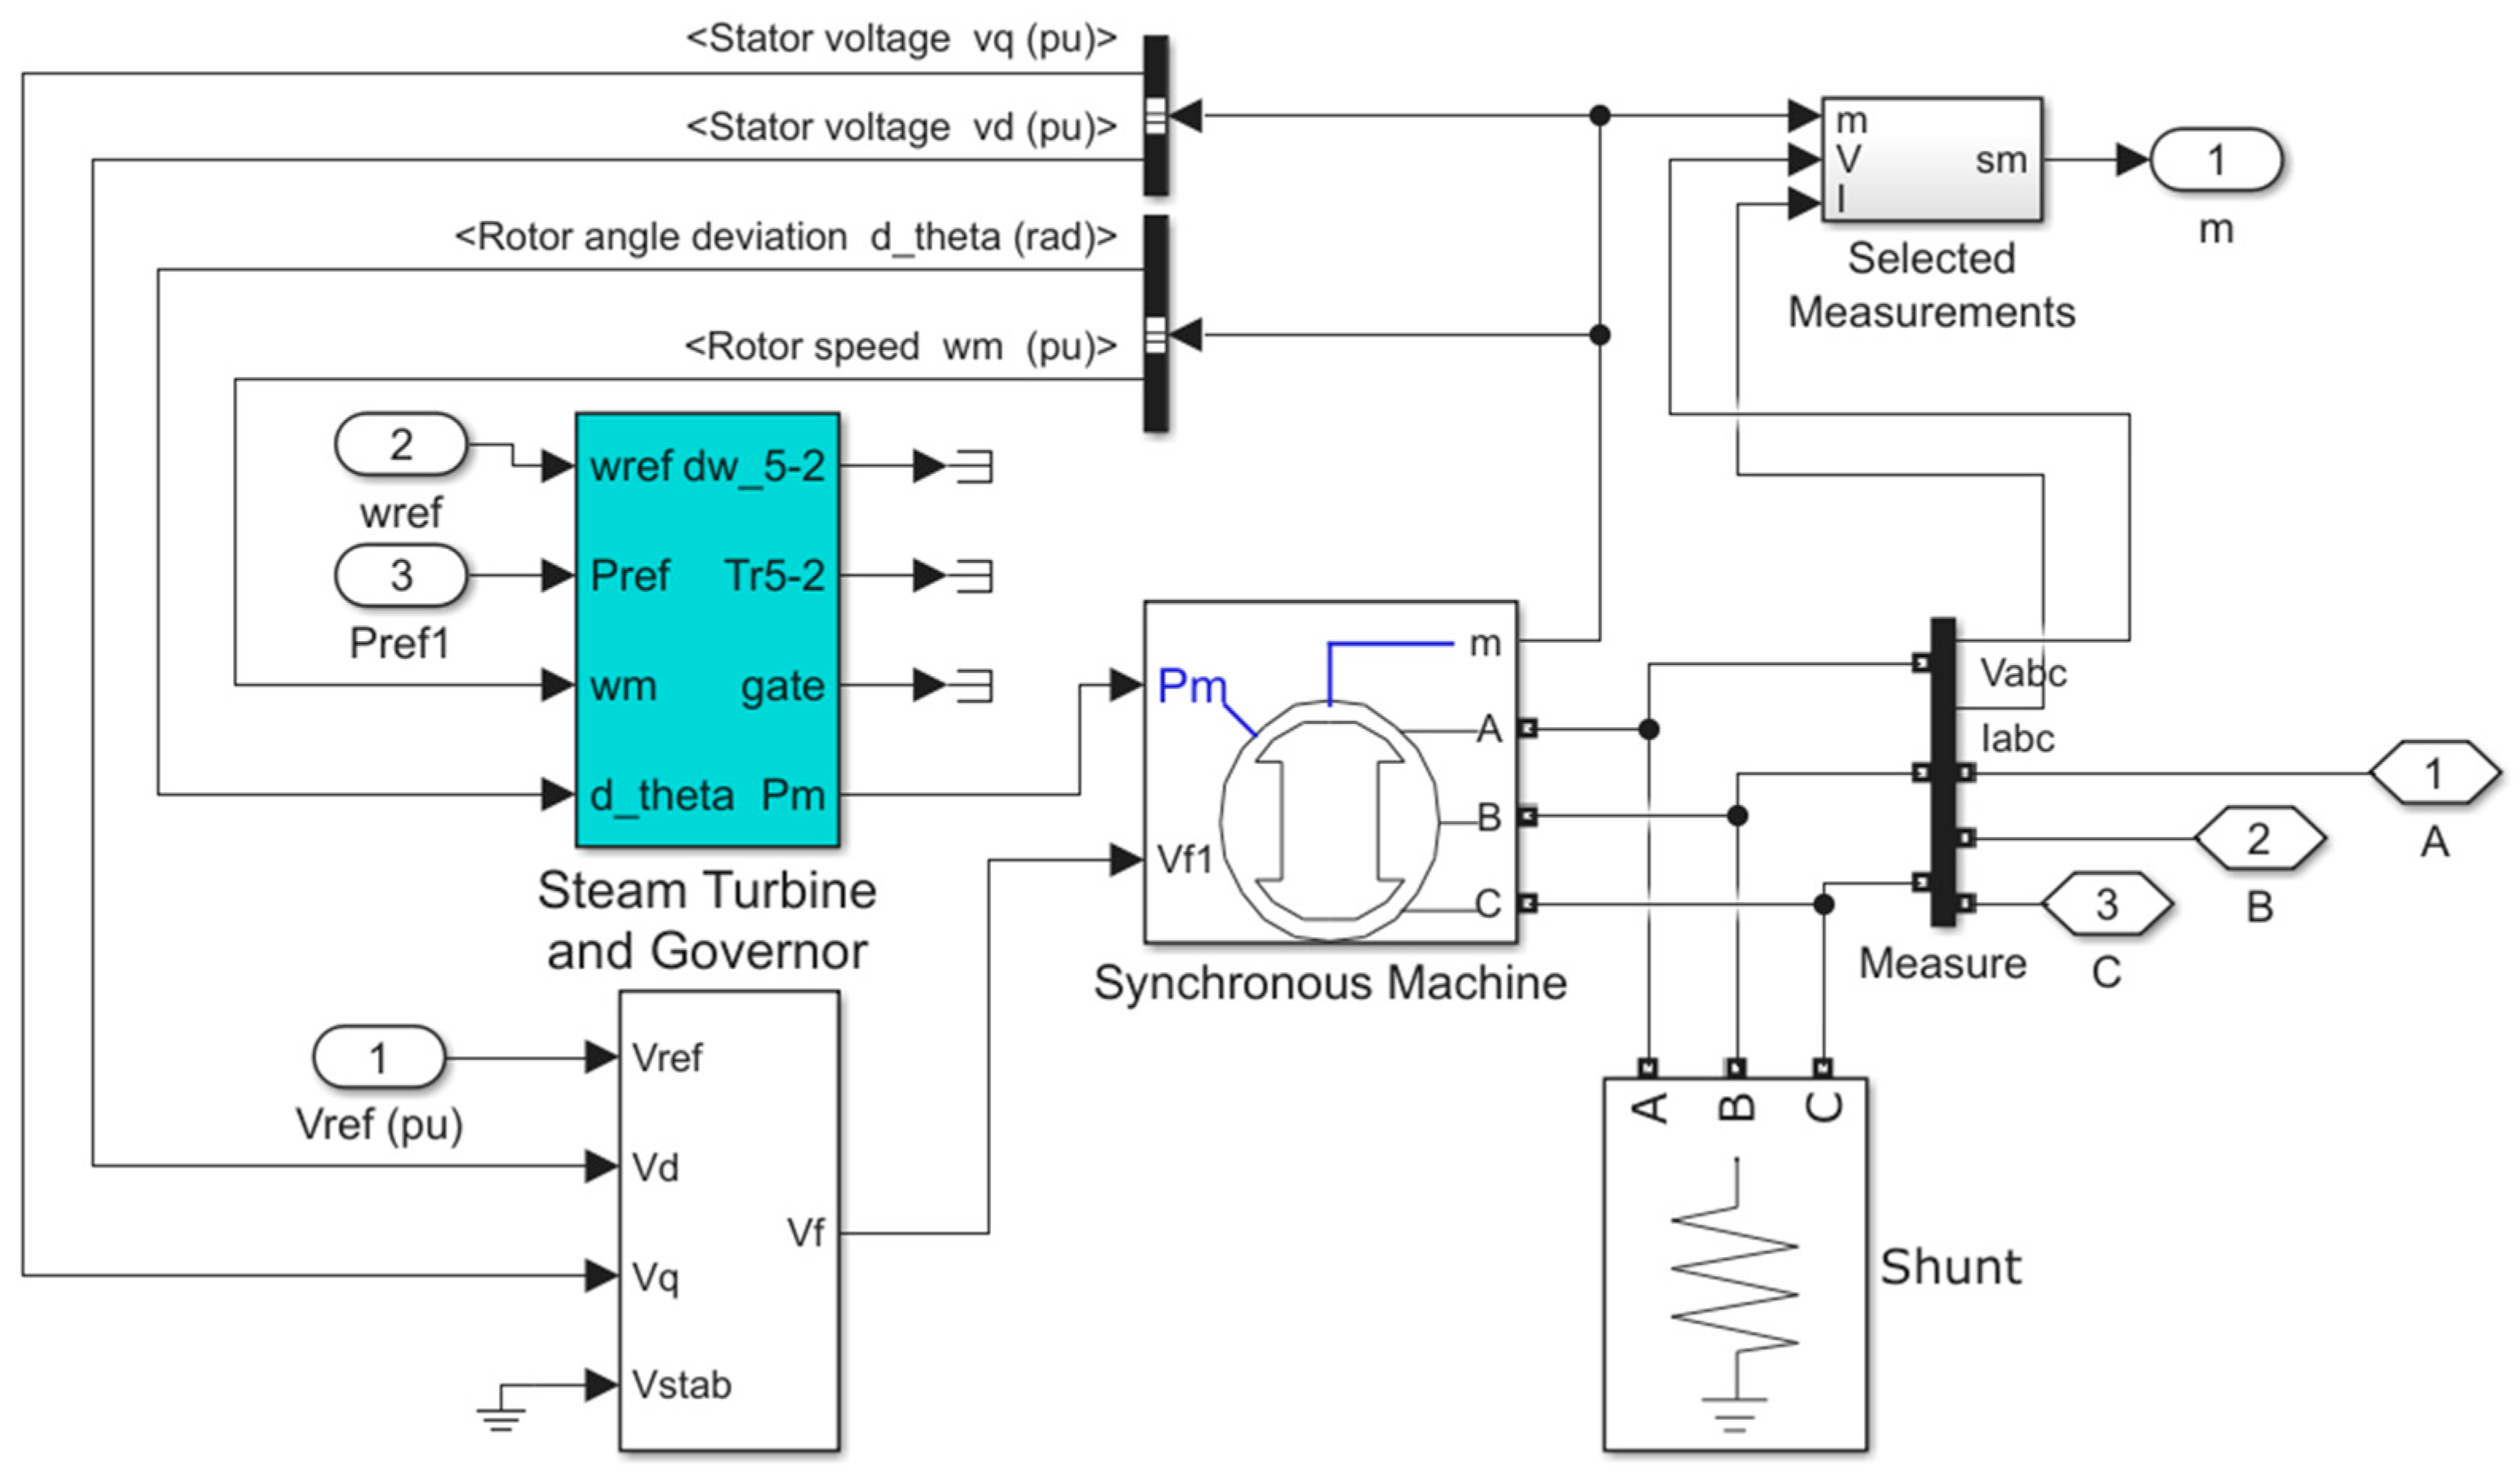
4.4. Model of Thermal Power Plant
This model of the thermal power plant was based on the same design as the replica of the diesel generator and is also created for direct connection to the grid for a phase–phase voltage of 22 kV, therefore it is not necessary to use a step-up transformer. A synchronous machine was used in this model to generate electricity. Figure 11 shown schematic model of thermal power plant.
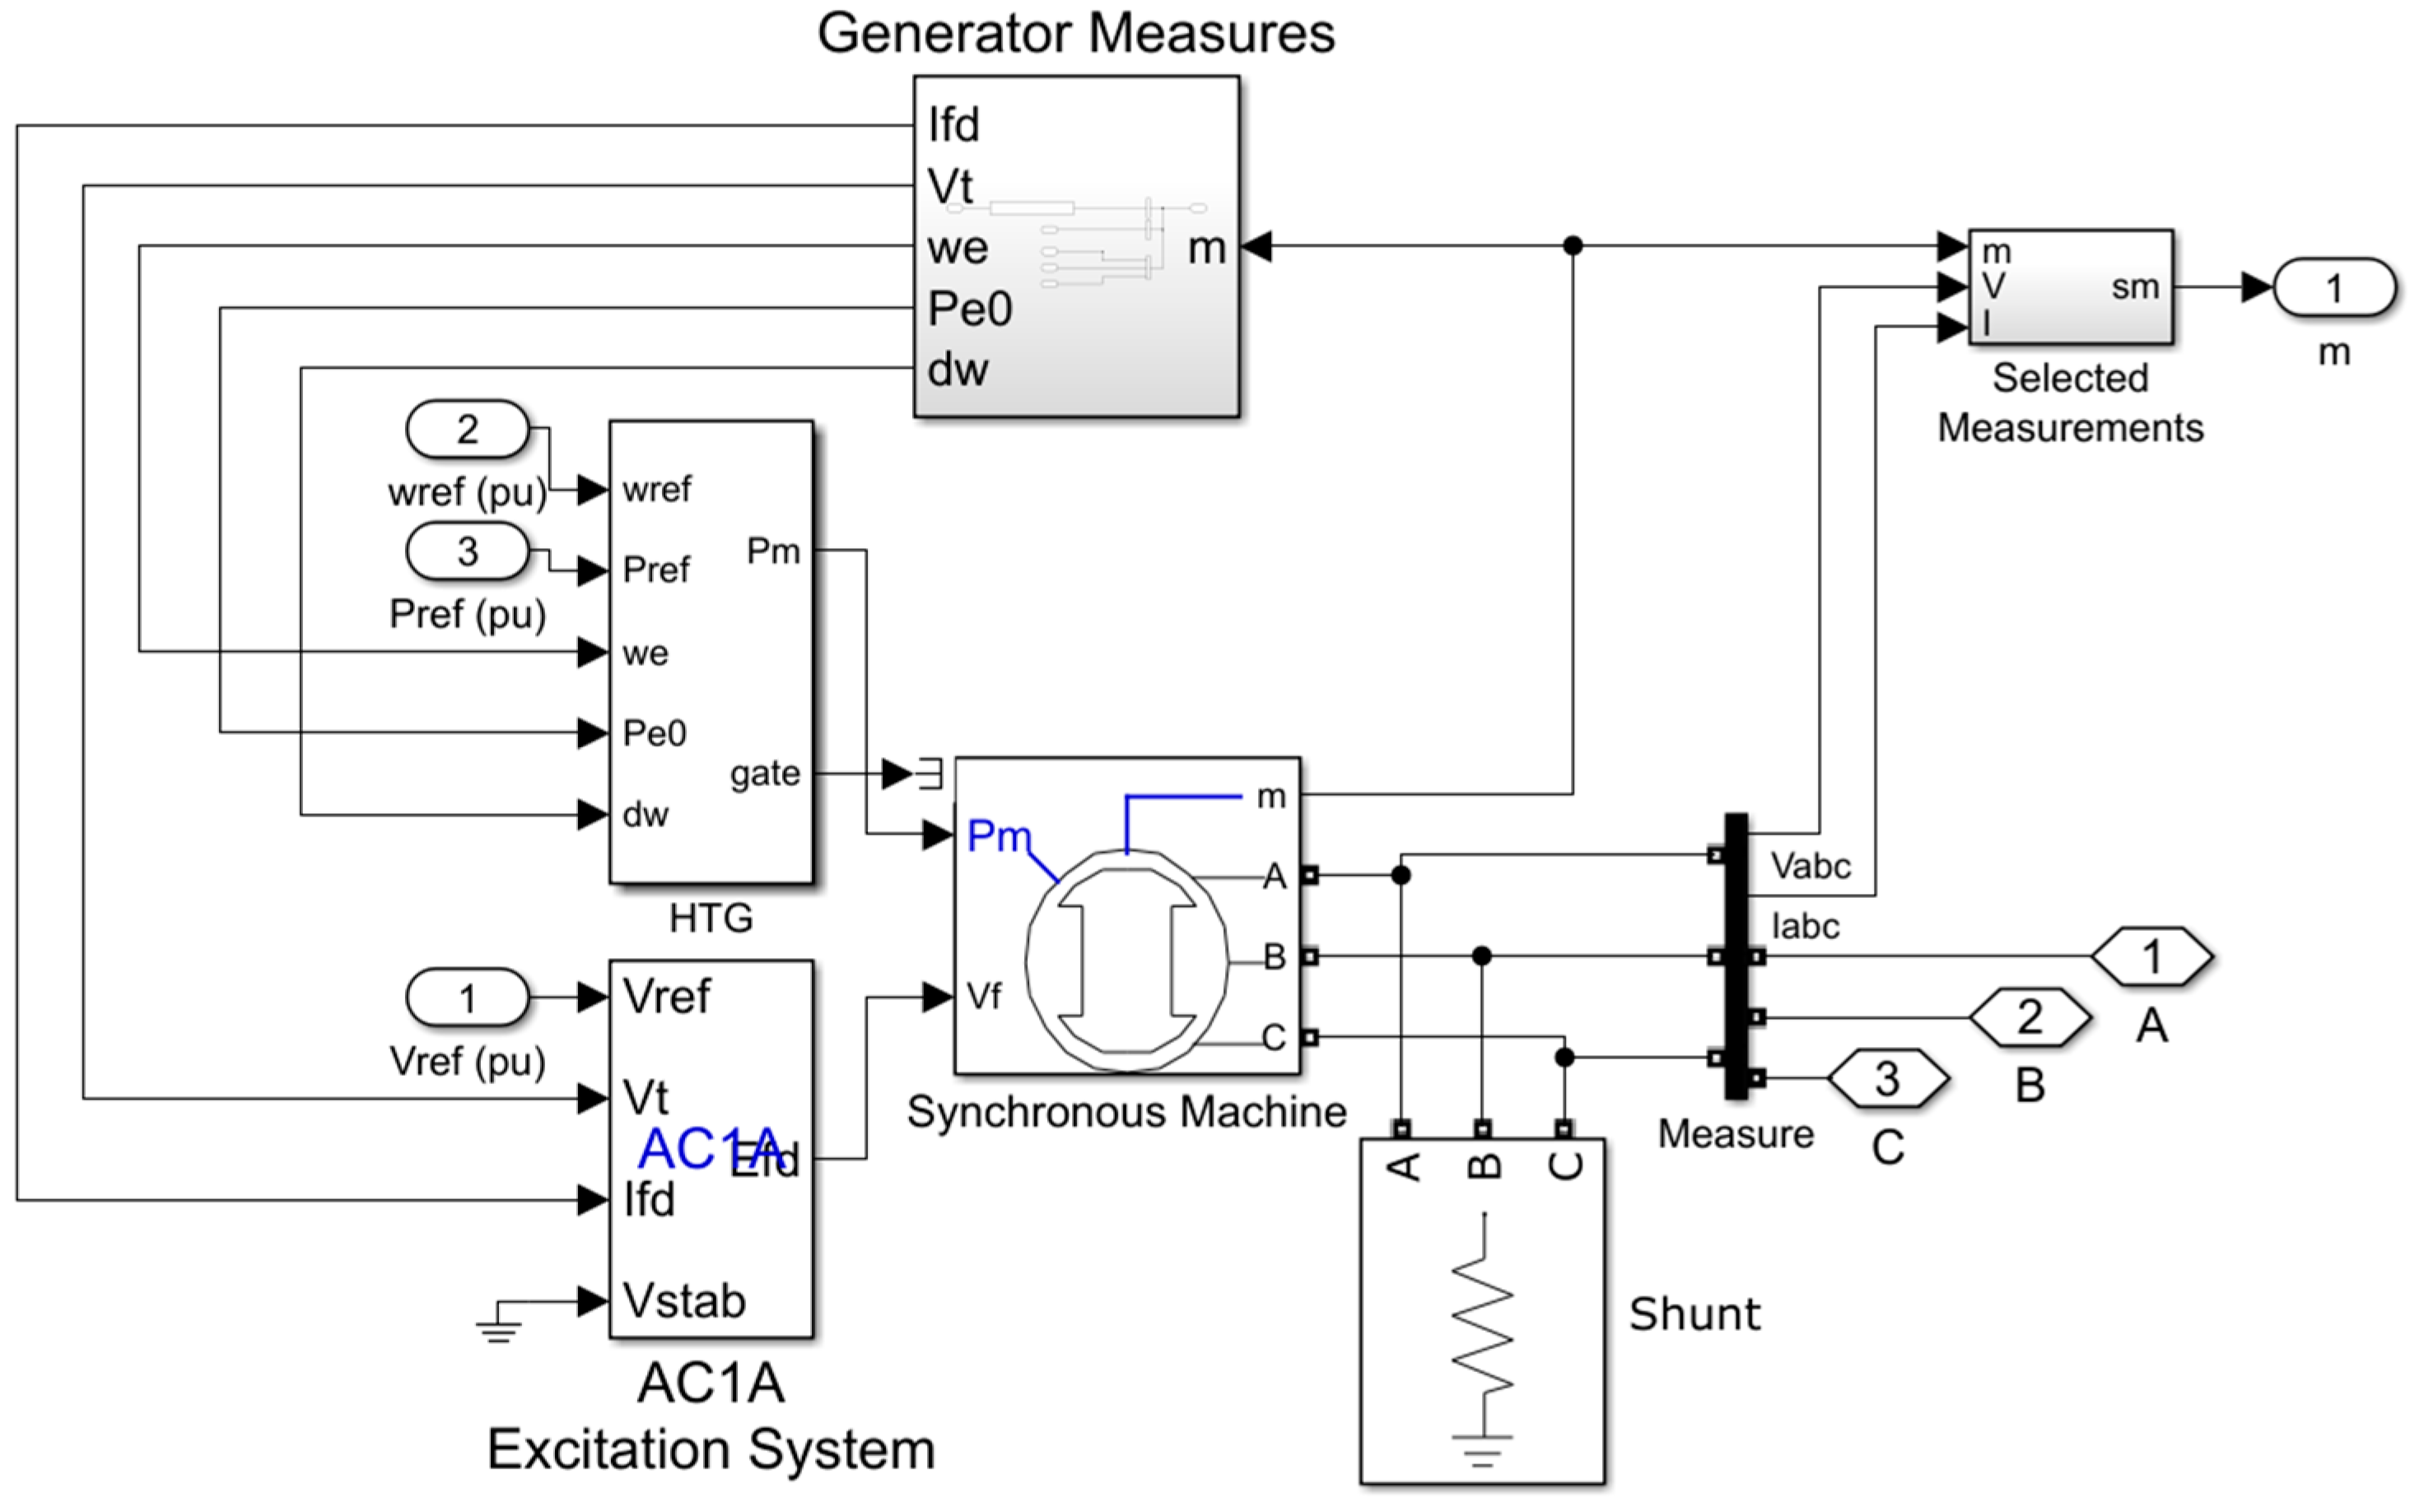
4.5. Model of Hydropower Plant
This replica of a hydropower plant was based on the same design as the model of a diesel generator and a thermal power plant. Like the previous models, it is designed for direct connection to the mains for a phase–phase voltage of 22 kV, therefore it is not necessary to use a step-up transformer. A synchronous machine was used in this model to generate electricity. Figure 12 shown schematic model of hydropower plant.
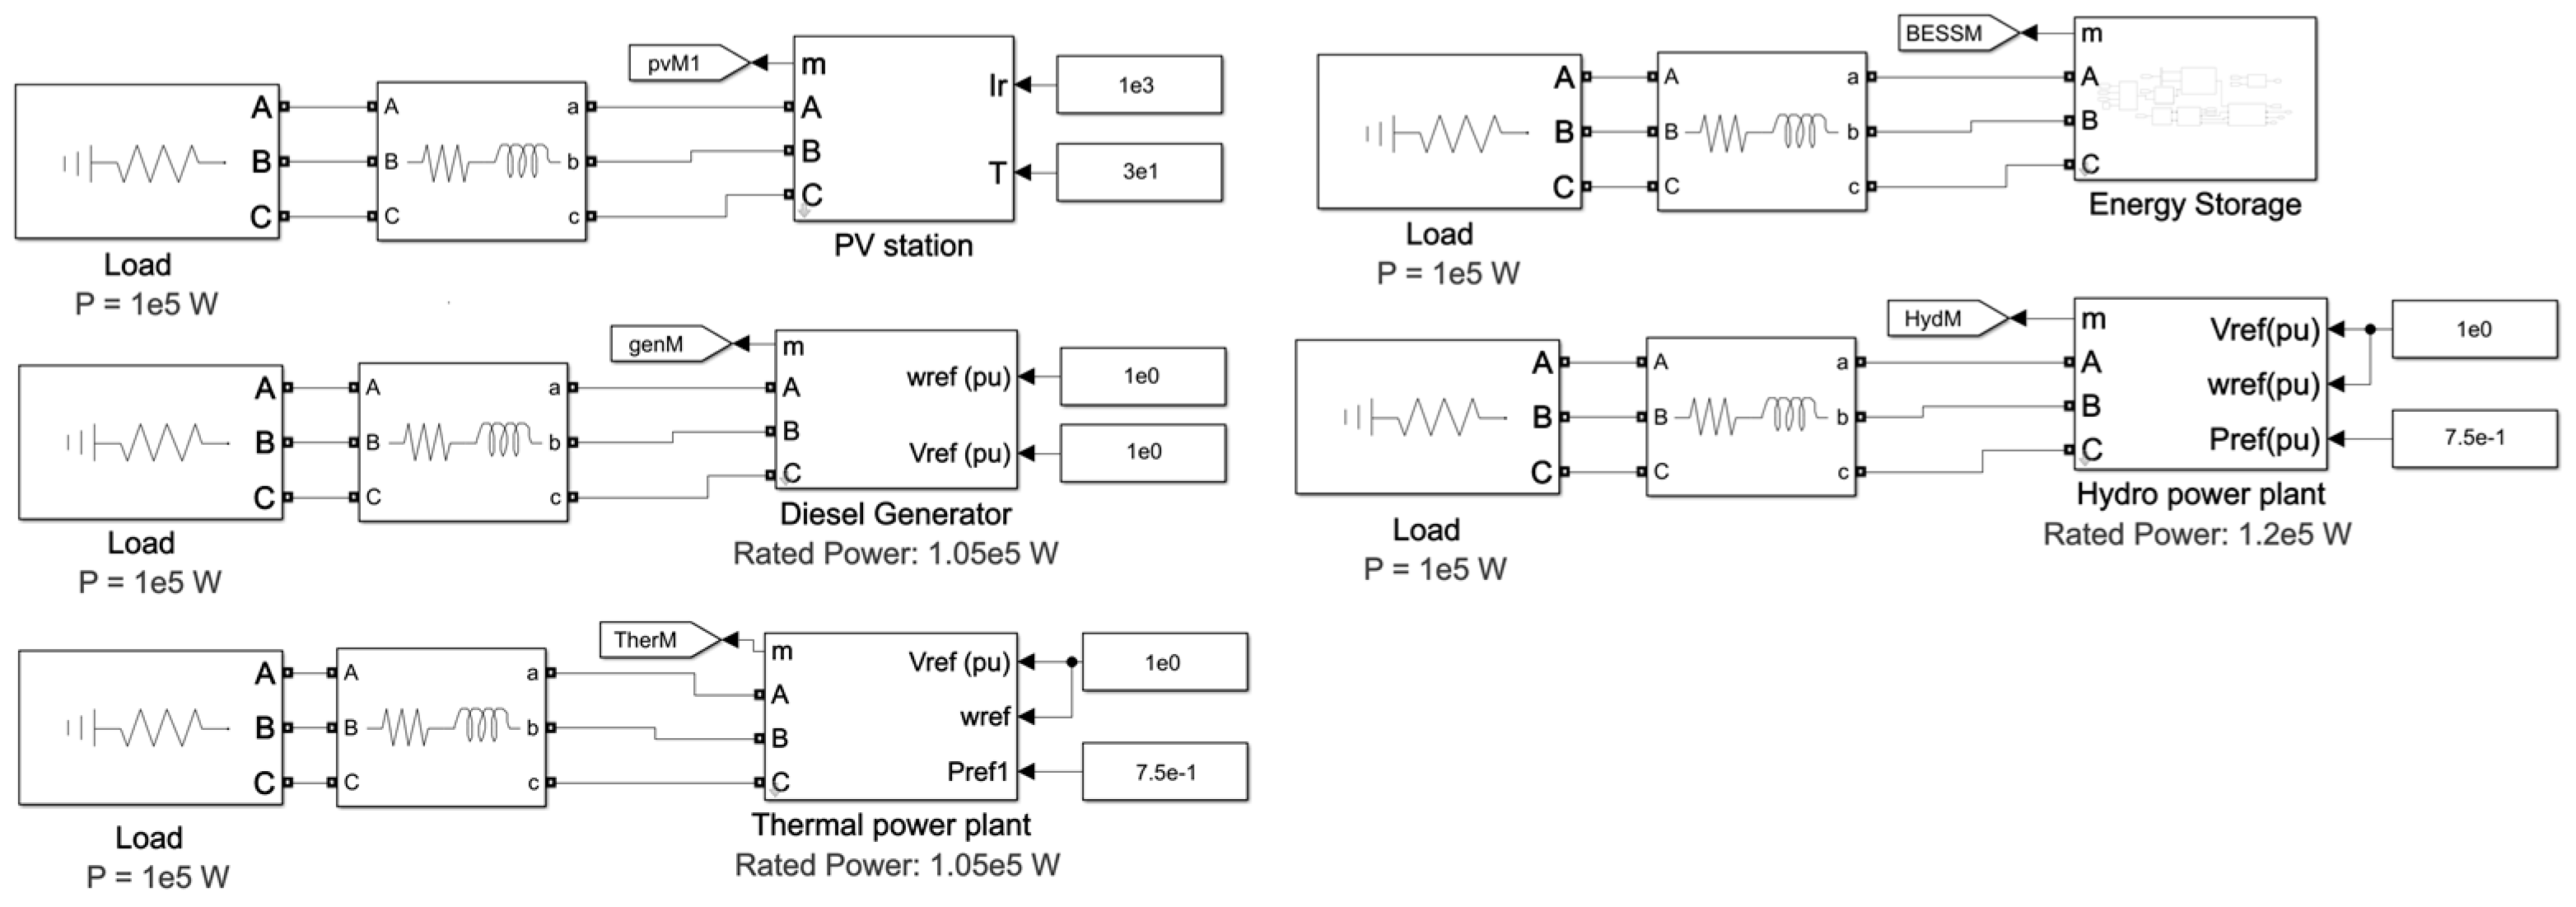
4.6. Modeled Scheme of Simulink
In the MATLAB/Simulink system, we constructed a scheme according to Figure 13, where we considered a load of 100 kW for individual RES. For the fault condition, we consider the location of the fault of the output terminals of the RES models with a voltage level of 22 kV and in the vicinity of the load, which is 5 km away from the source by a line. The line parameters are as follows resistance 0.156 Ω/km and inductance 1.3 mH/km.
The simulation was performed on five models described in Section 3 and the simulated scheme is shown in Figure 13. For each model of the power plant, we considered two fault locations, close to the power plant and close to the source. The next chapter analyzes the simulation results for individual power plant models and for each the considered short-circuit locations.
5. Simulation Results
5.1. Model of Photovoltaic Station
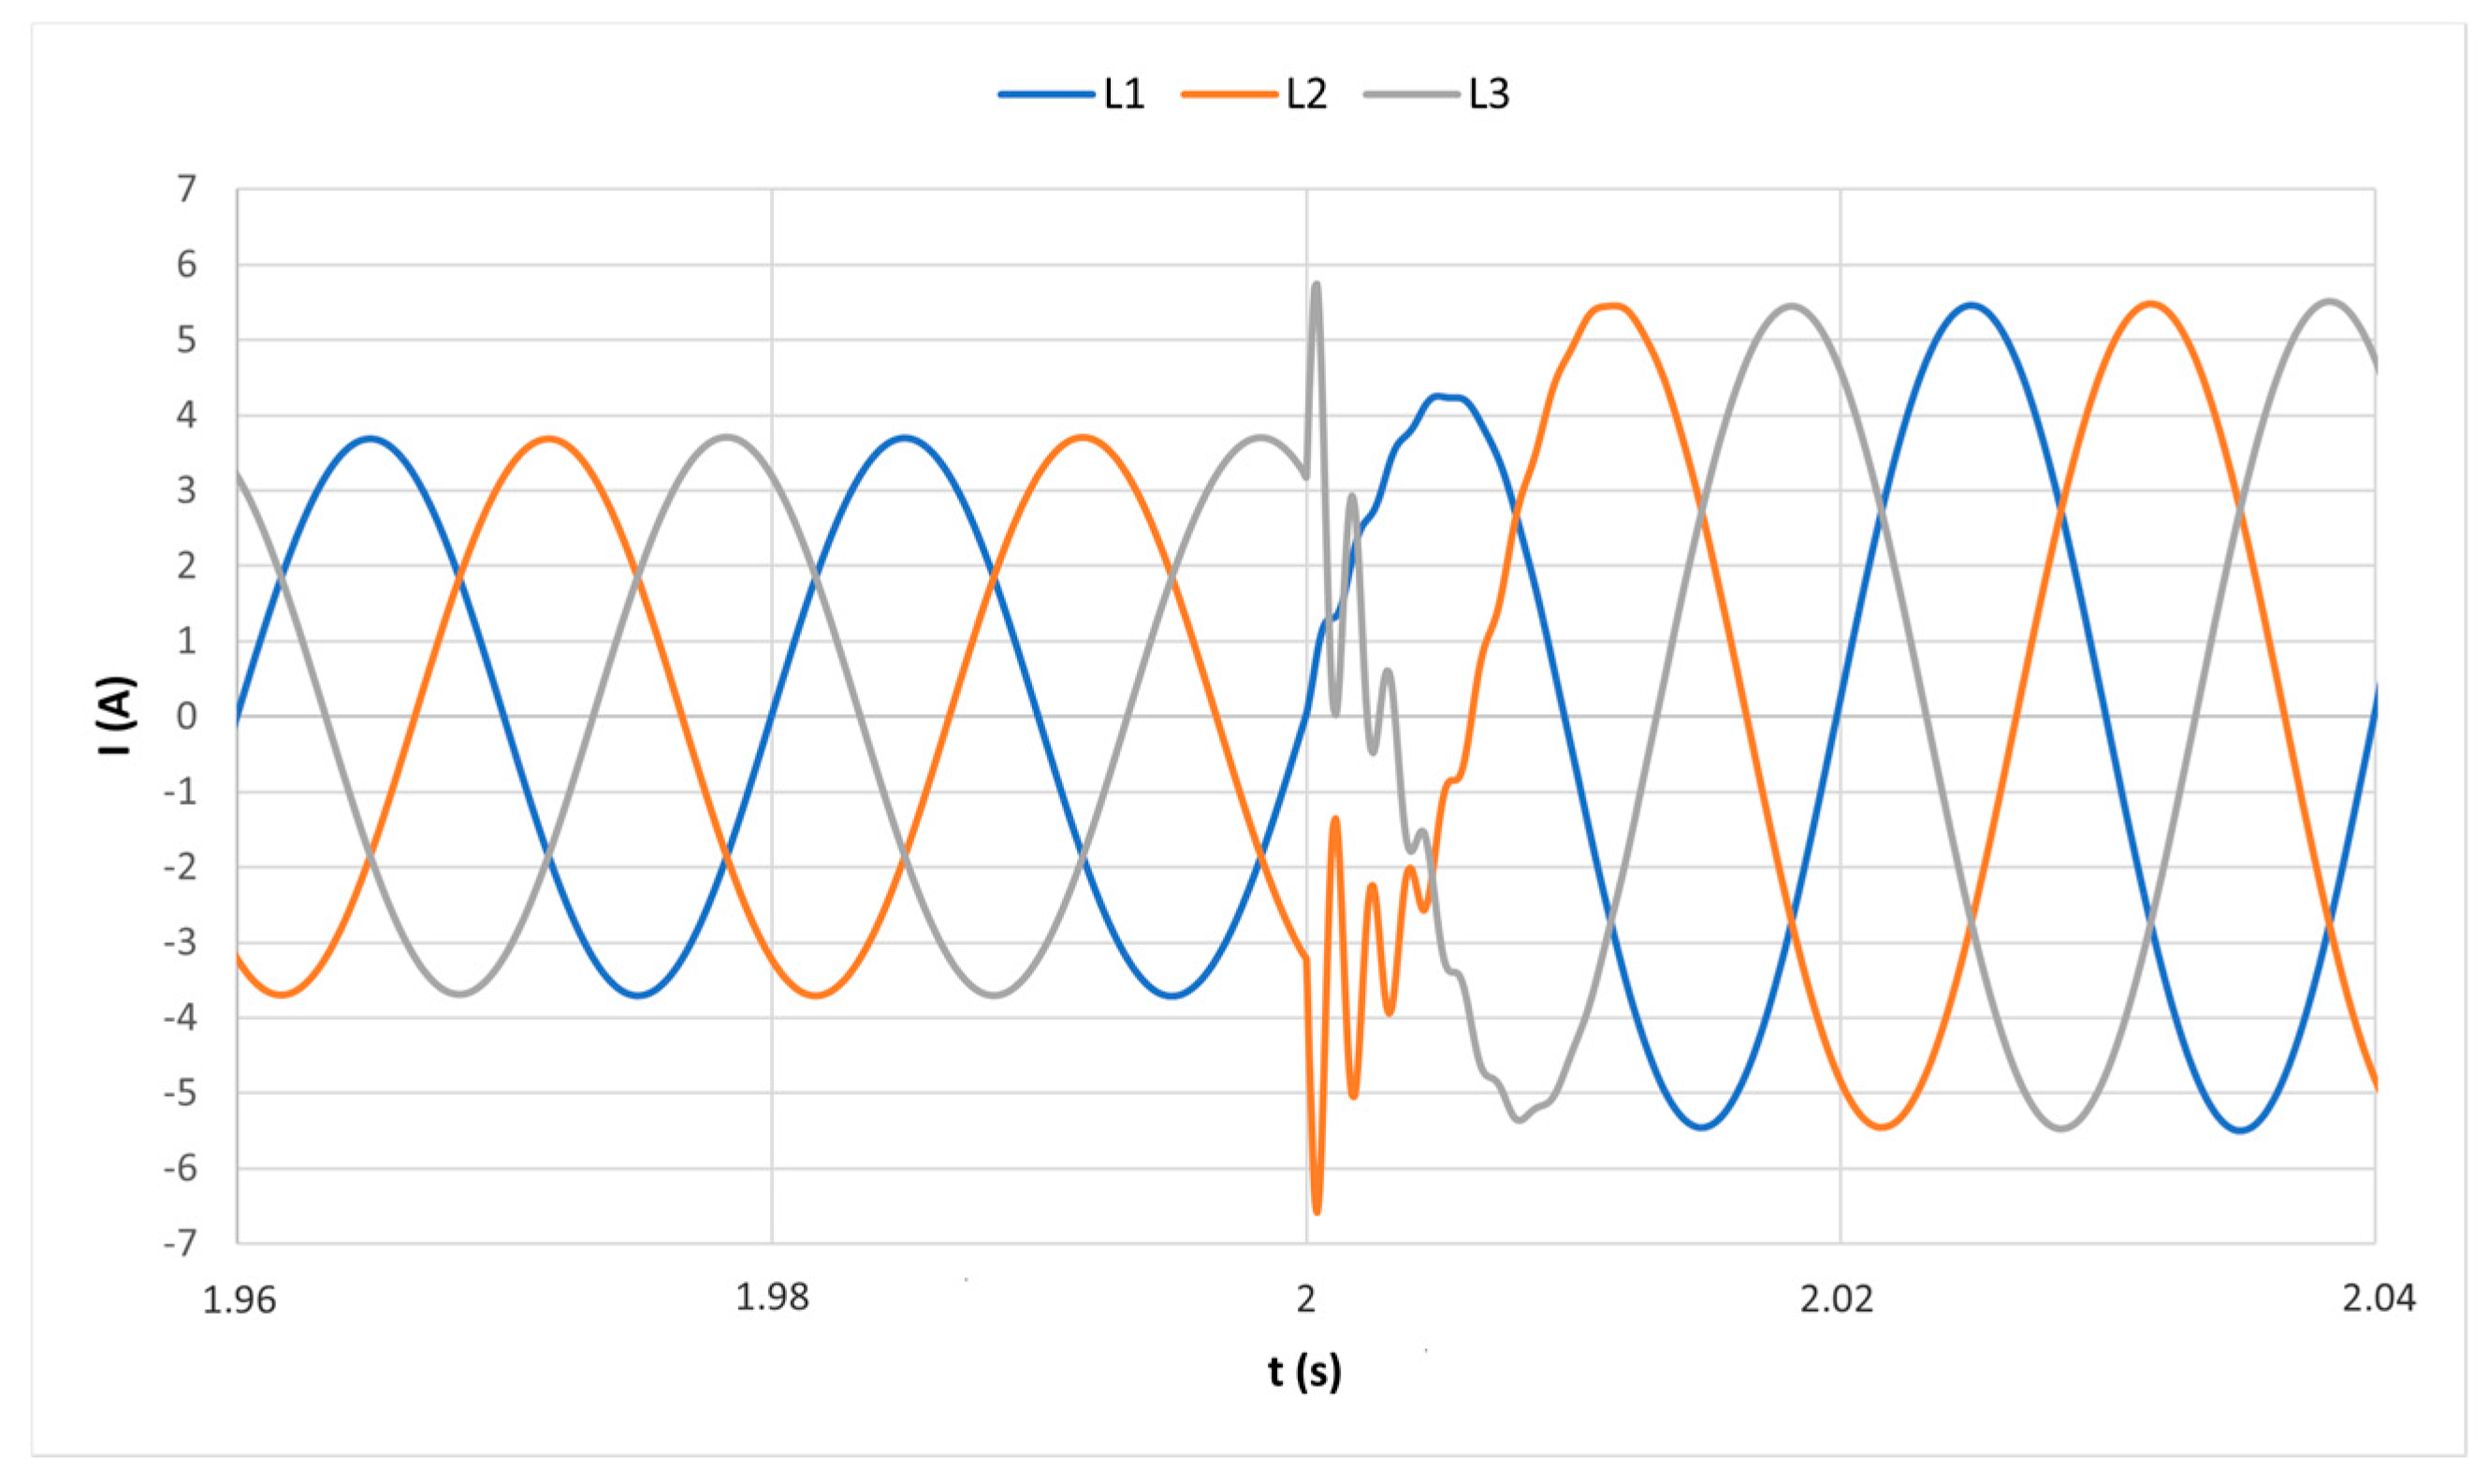
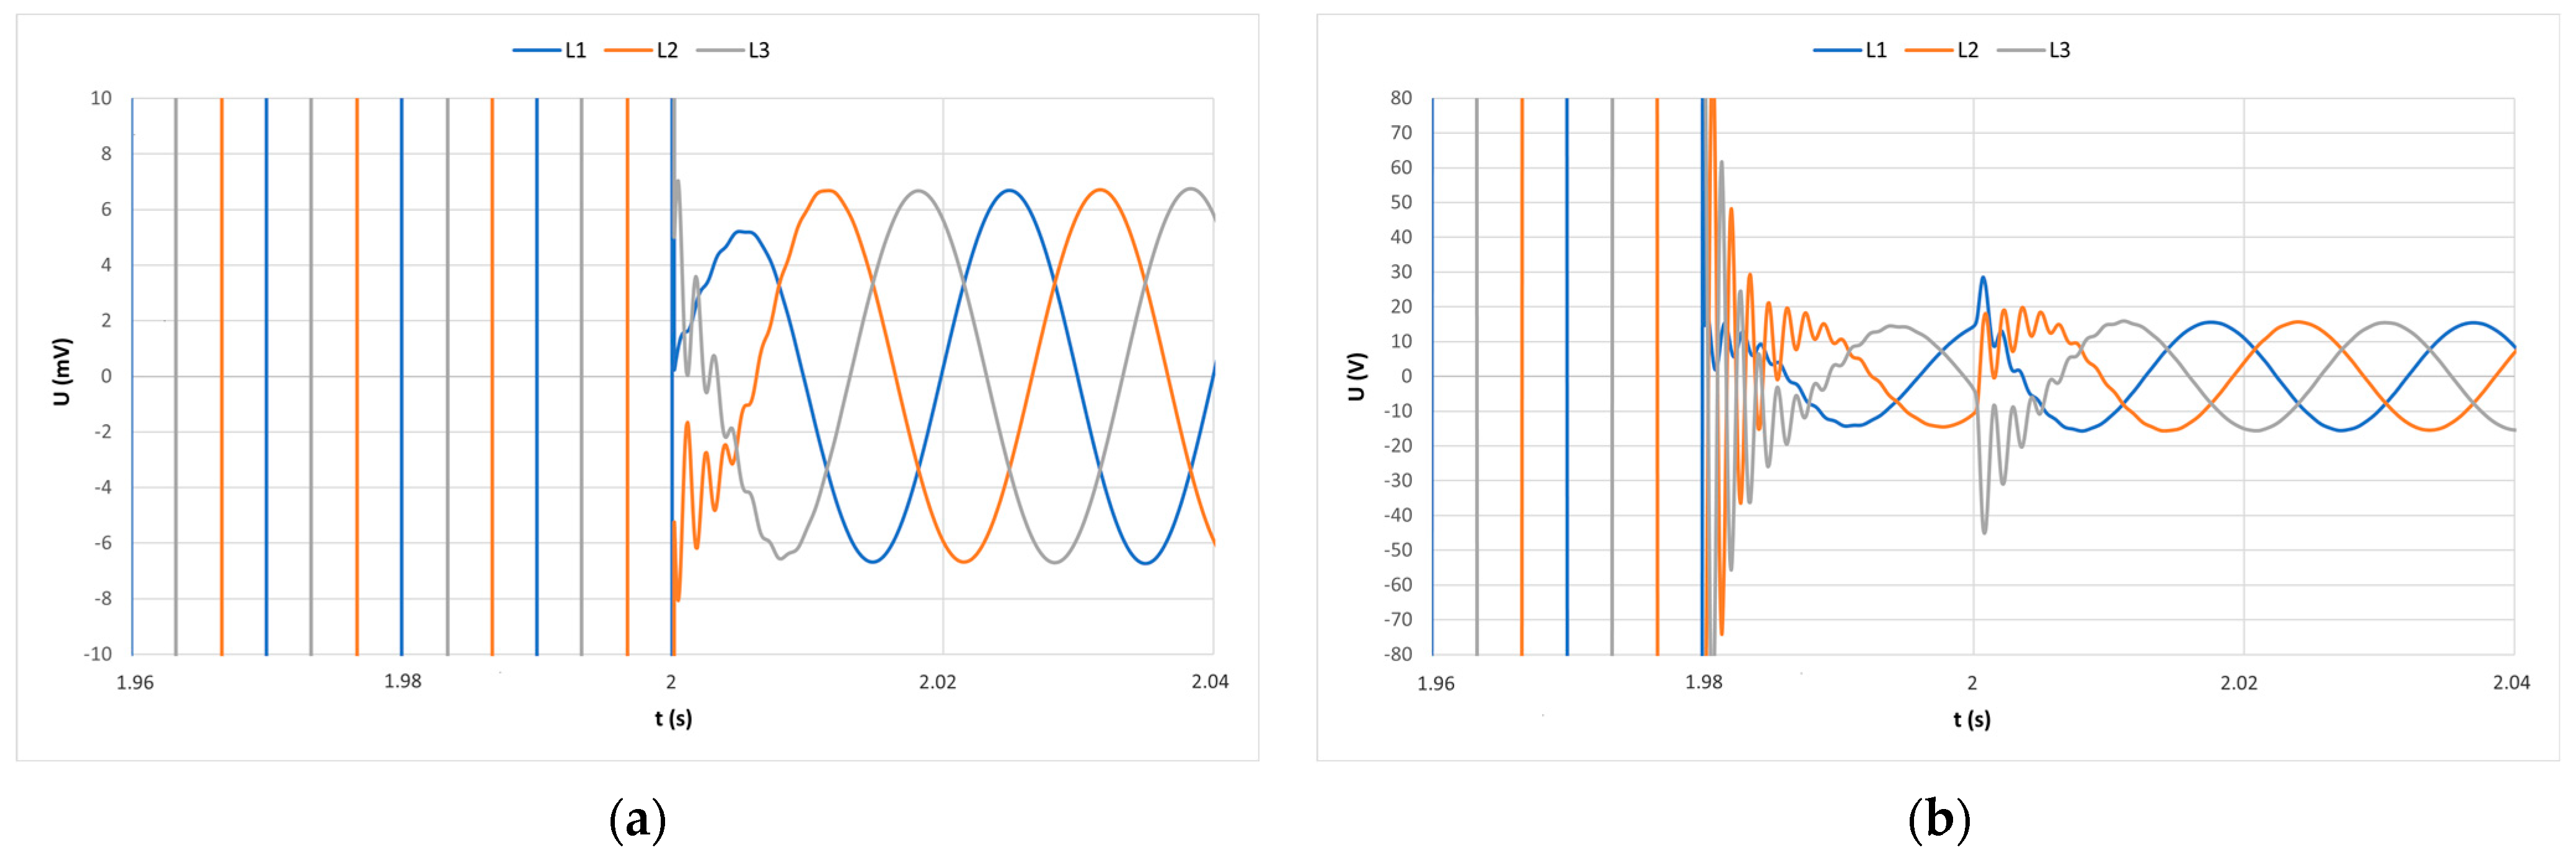
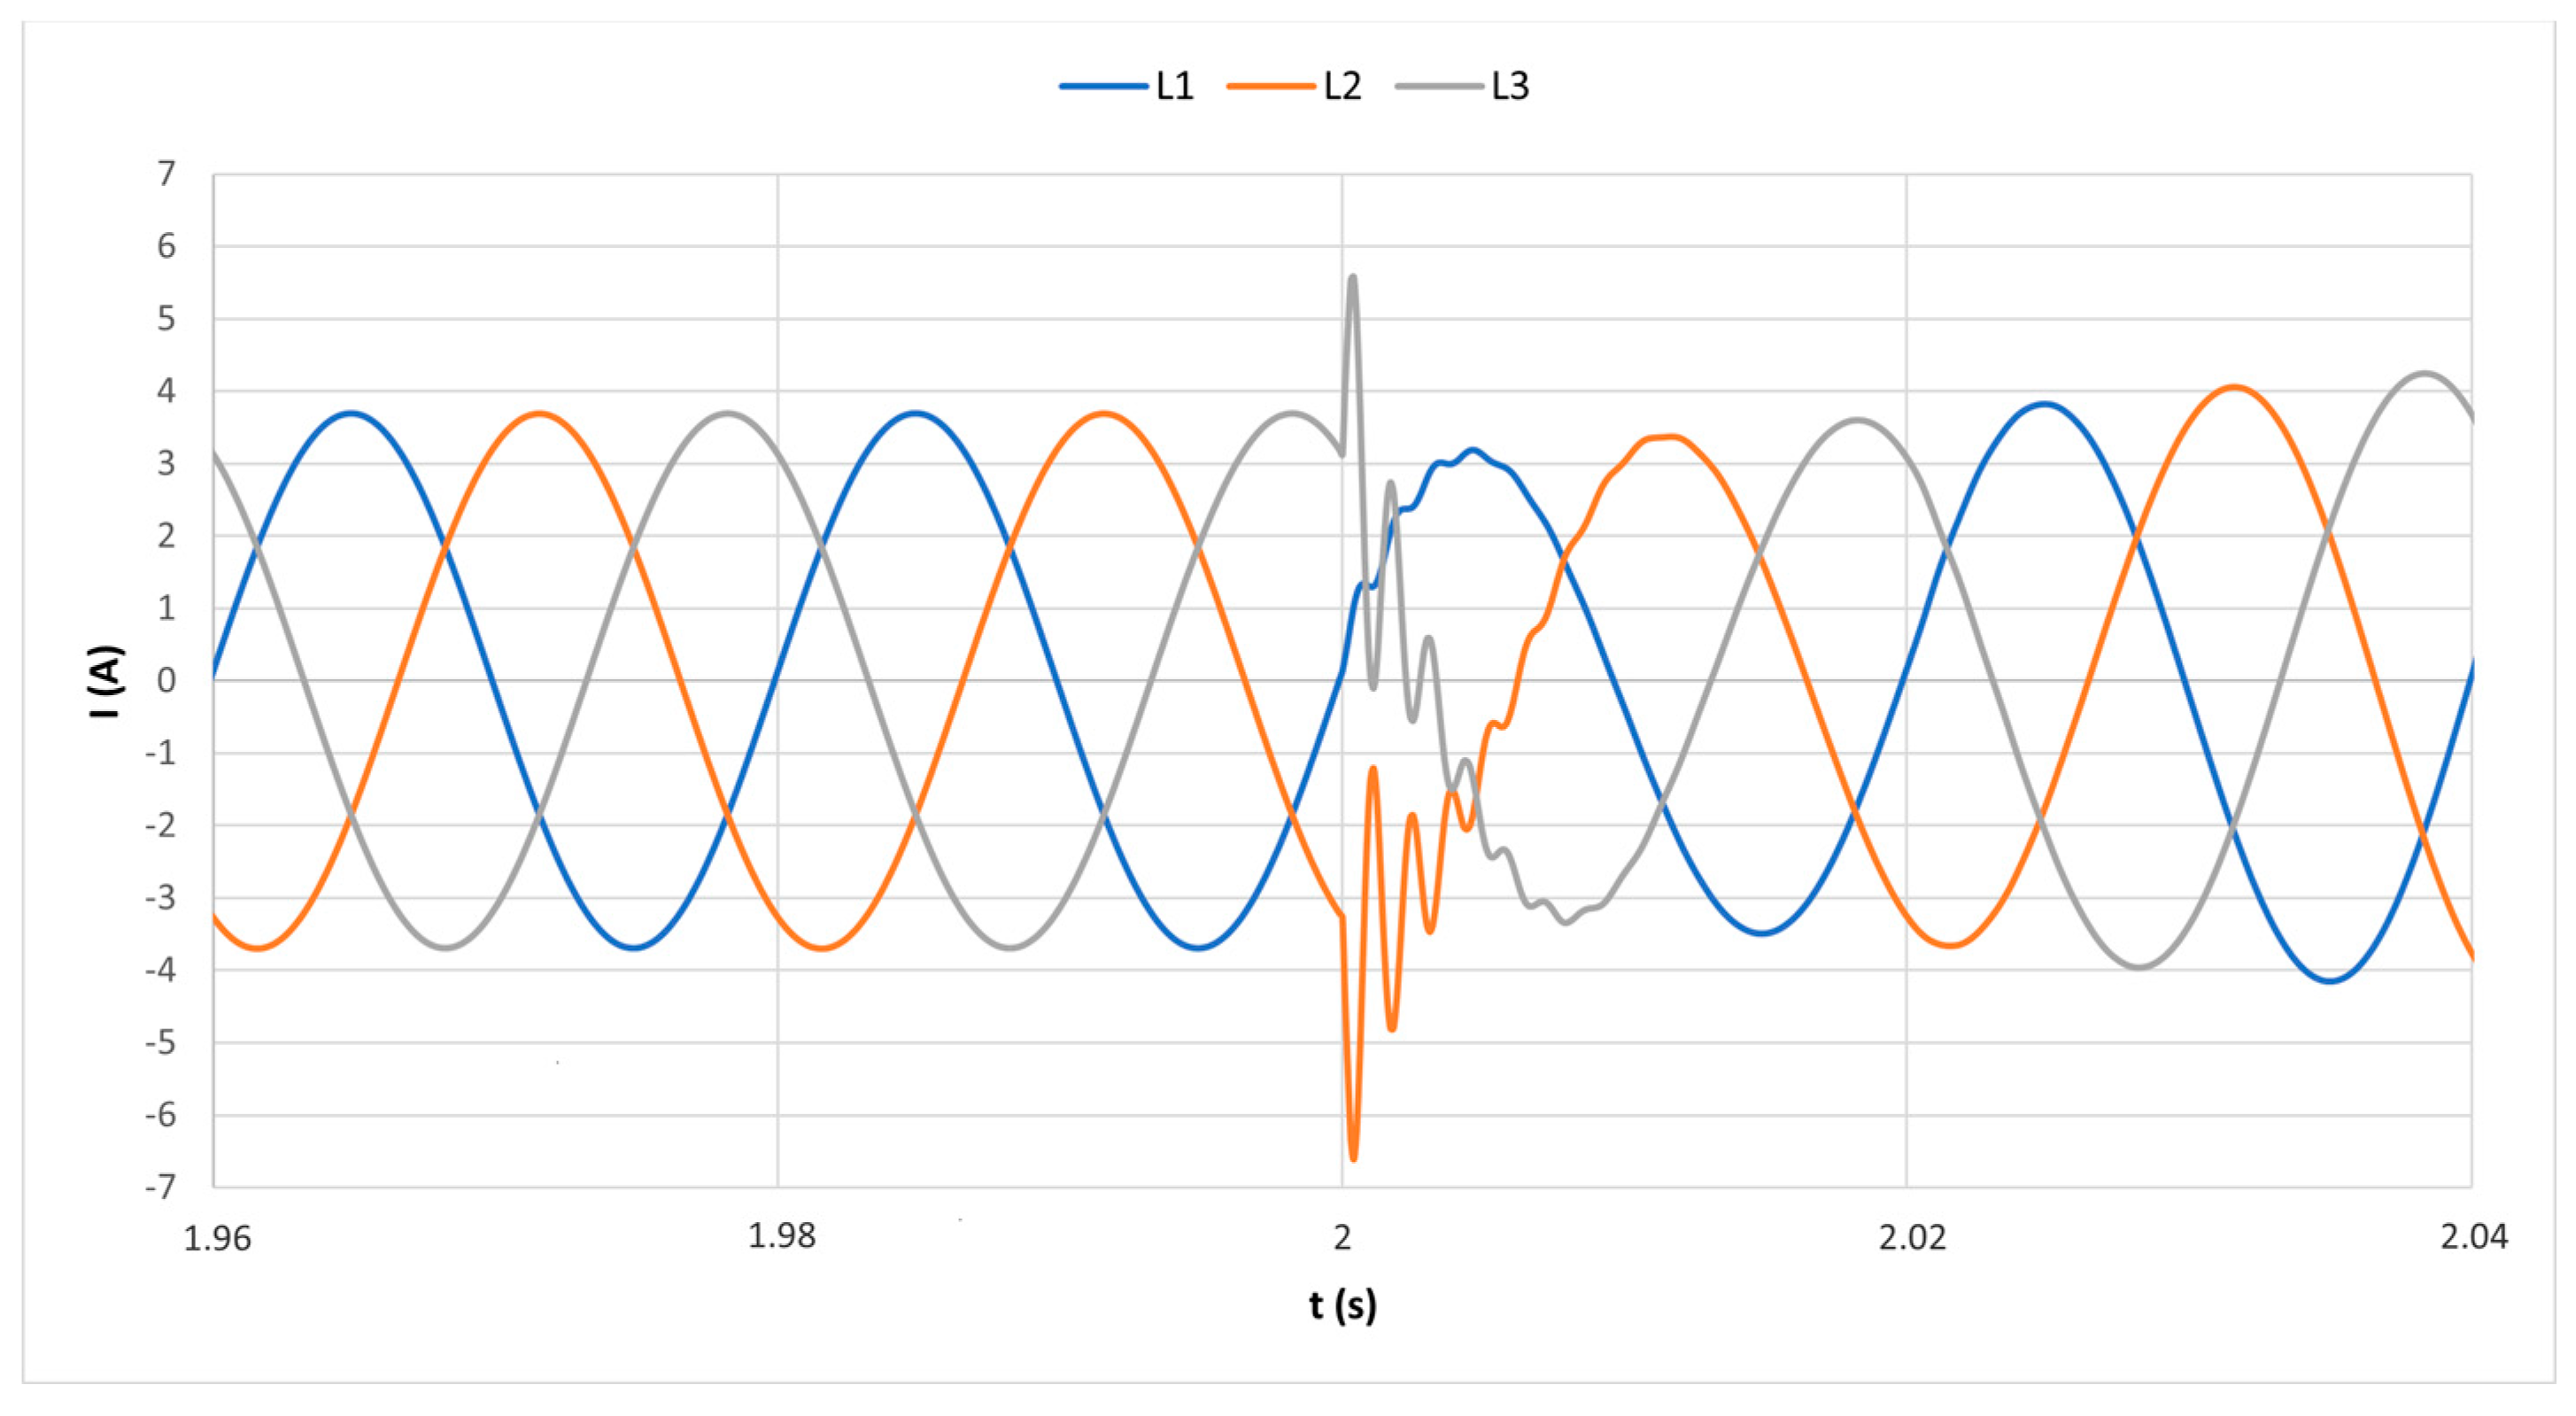
Figure 14 and Figure 15 show a comparison of the operating parameters of the ordinary condition with the fault state. The value of the simulated nominal current was less than 3.75 A and the phase–phase voltage was 21.82 kV. The simulated fault current value stabilized near the source at 5.62 A and the phase–phase voltage decreased to 6.885 mV, but on the load side simulated the fault current value was nearly the same as a fault condition on the source and the phase–phase voltage decreased to 15.8 V. The highest impulse simulated value of the fault current near the source was 6.606 A and on the other side was 6.598 A. The measuring point as also was shown in the individual models in Section 4.1 was located near the output of the power source.
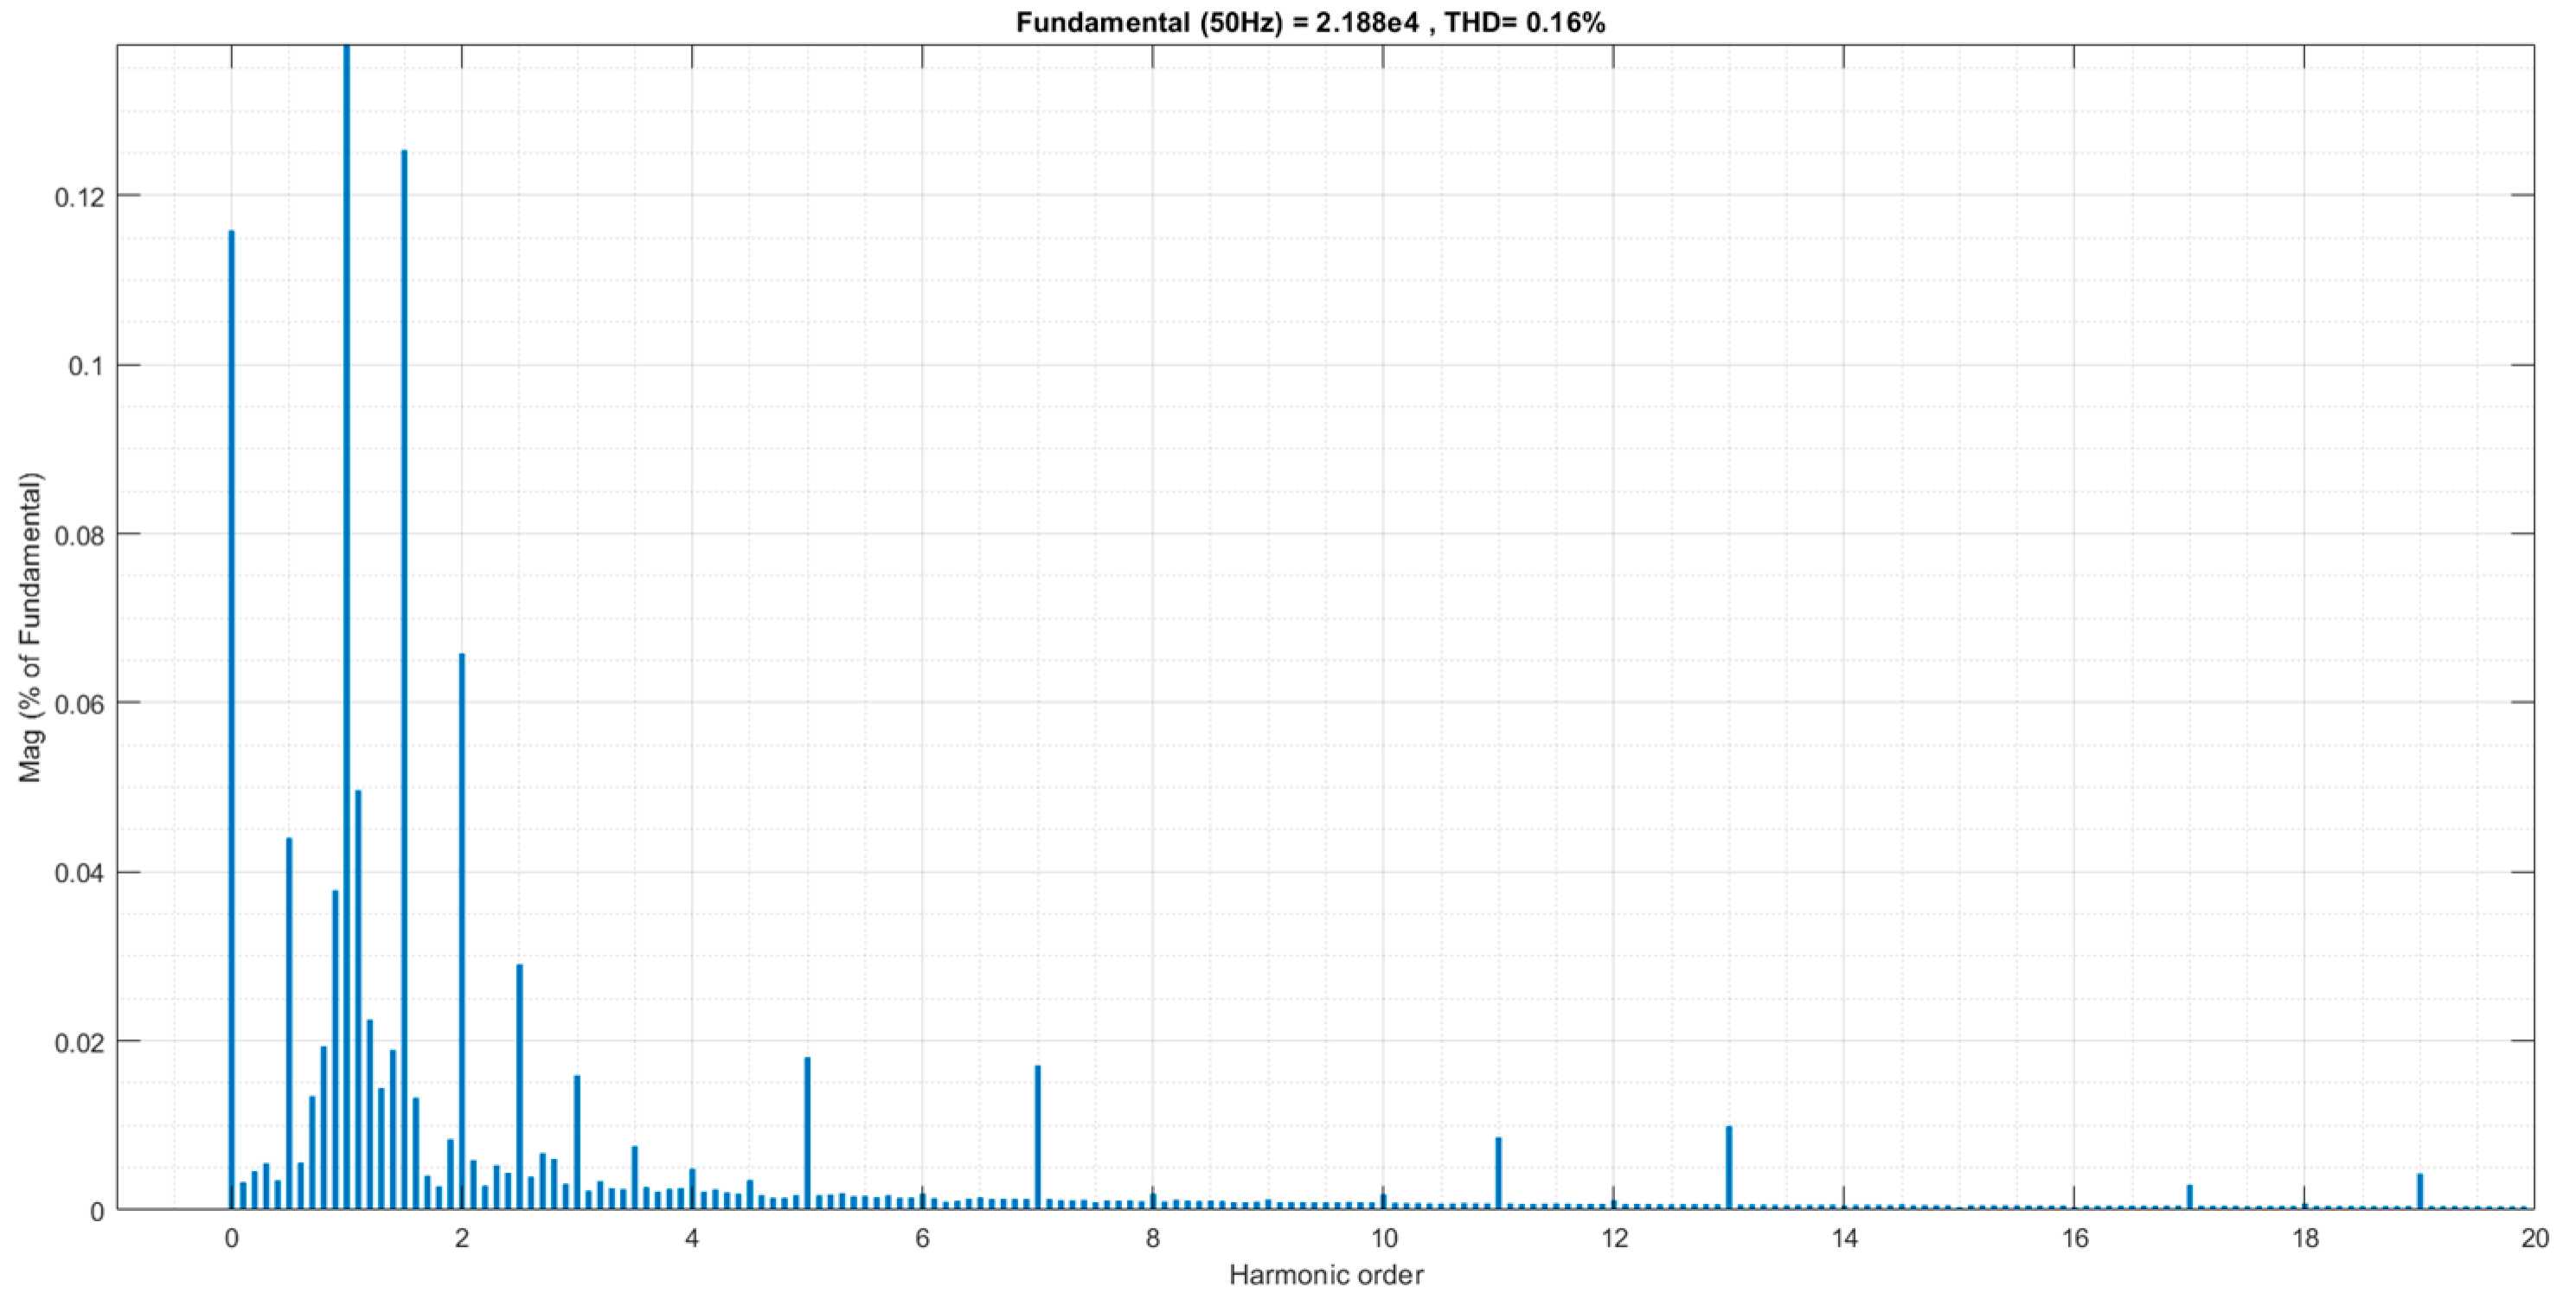
Figure 16 shows the fast Fourier transform (FFT) analysis of the ordinary voltage condition. The generated voltage of this model had a total harmonic distortion (THD) value of 0.16%. As shown in the Figure 16, it is possible to see the typical higher harmonics caused by the inverter and the interharmonic and unidirectional component, the individual values of these interfering elements not exceeding a value of 0.13%.
5.2. Model of Diesel Generator
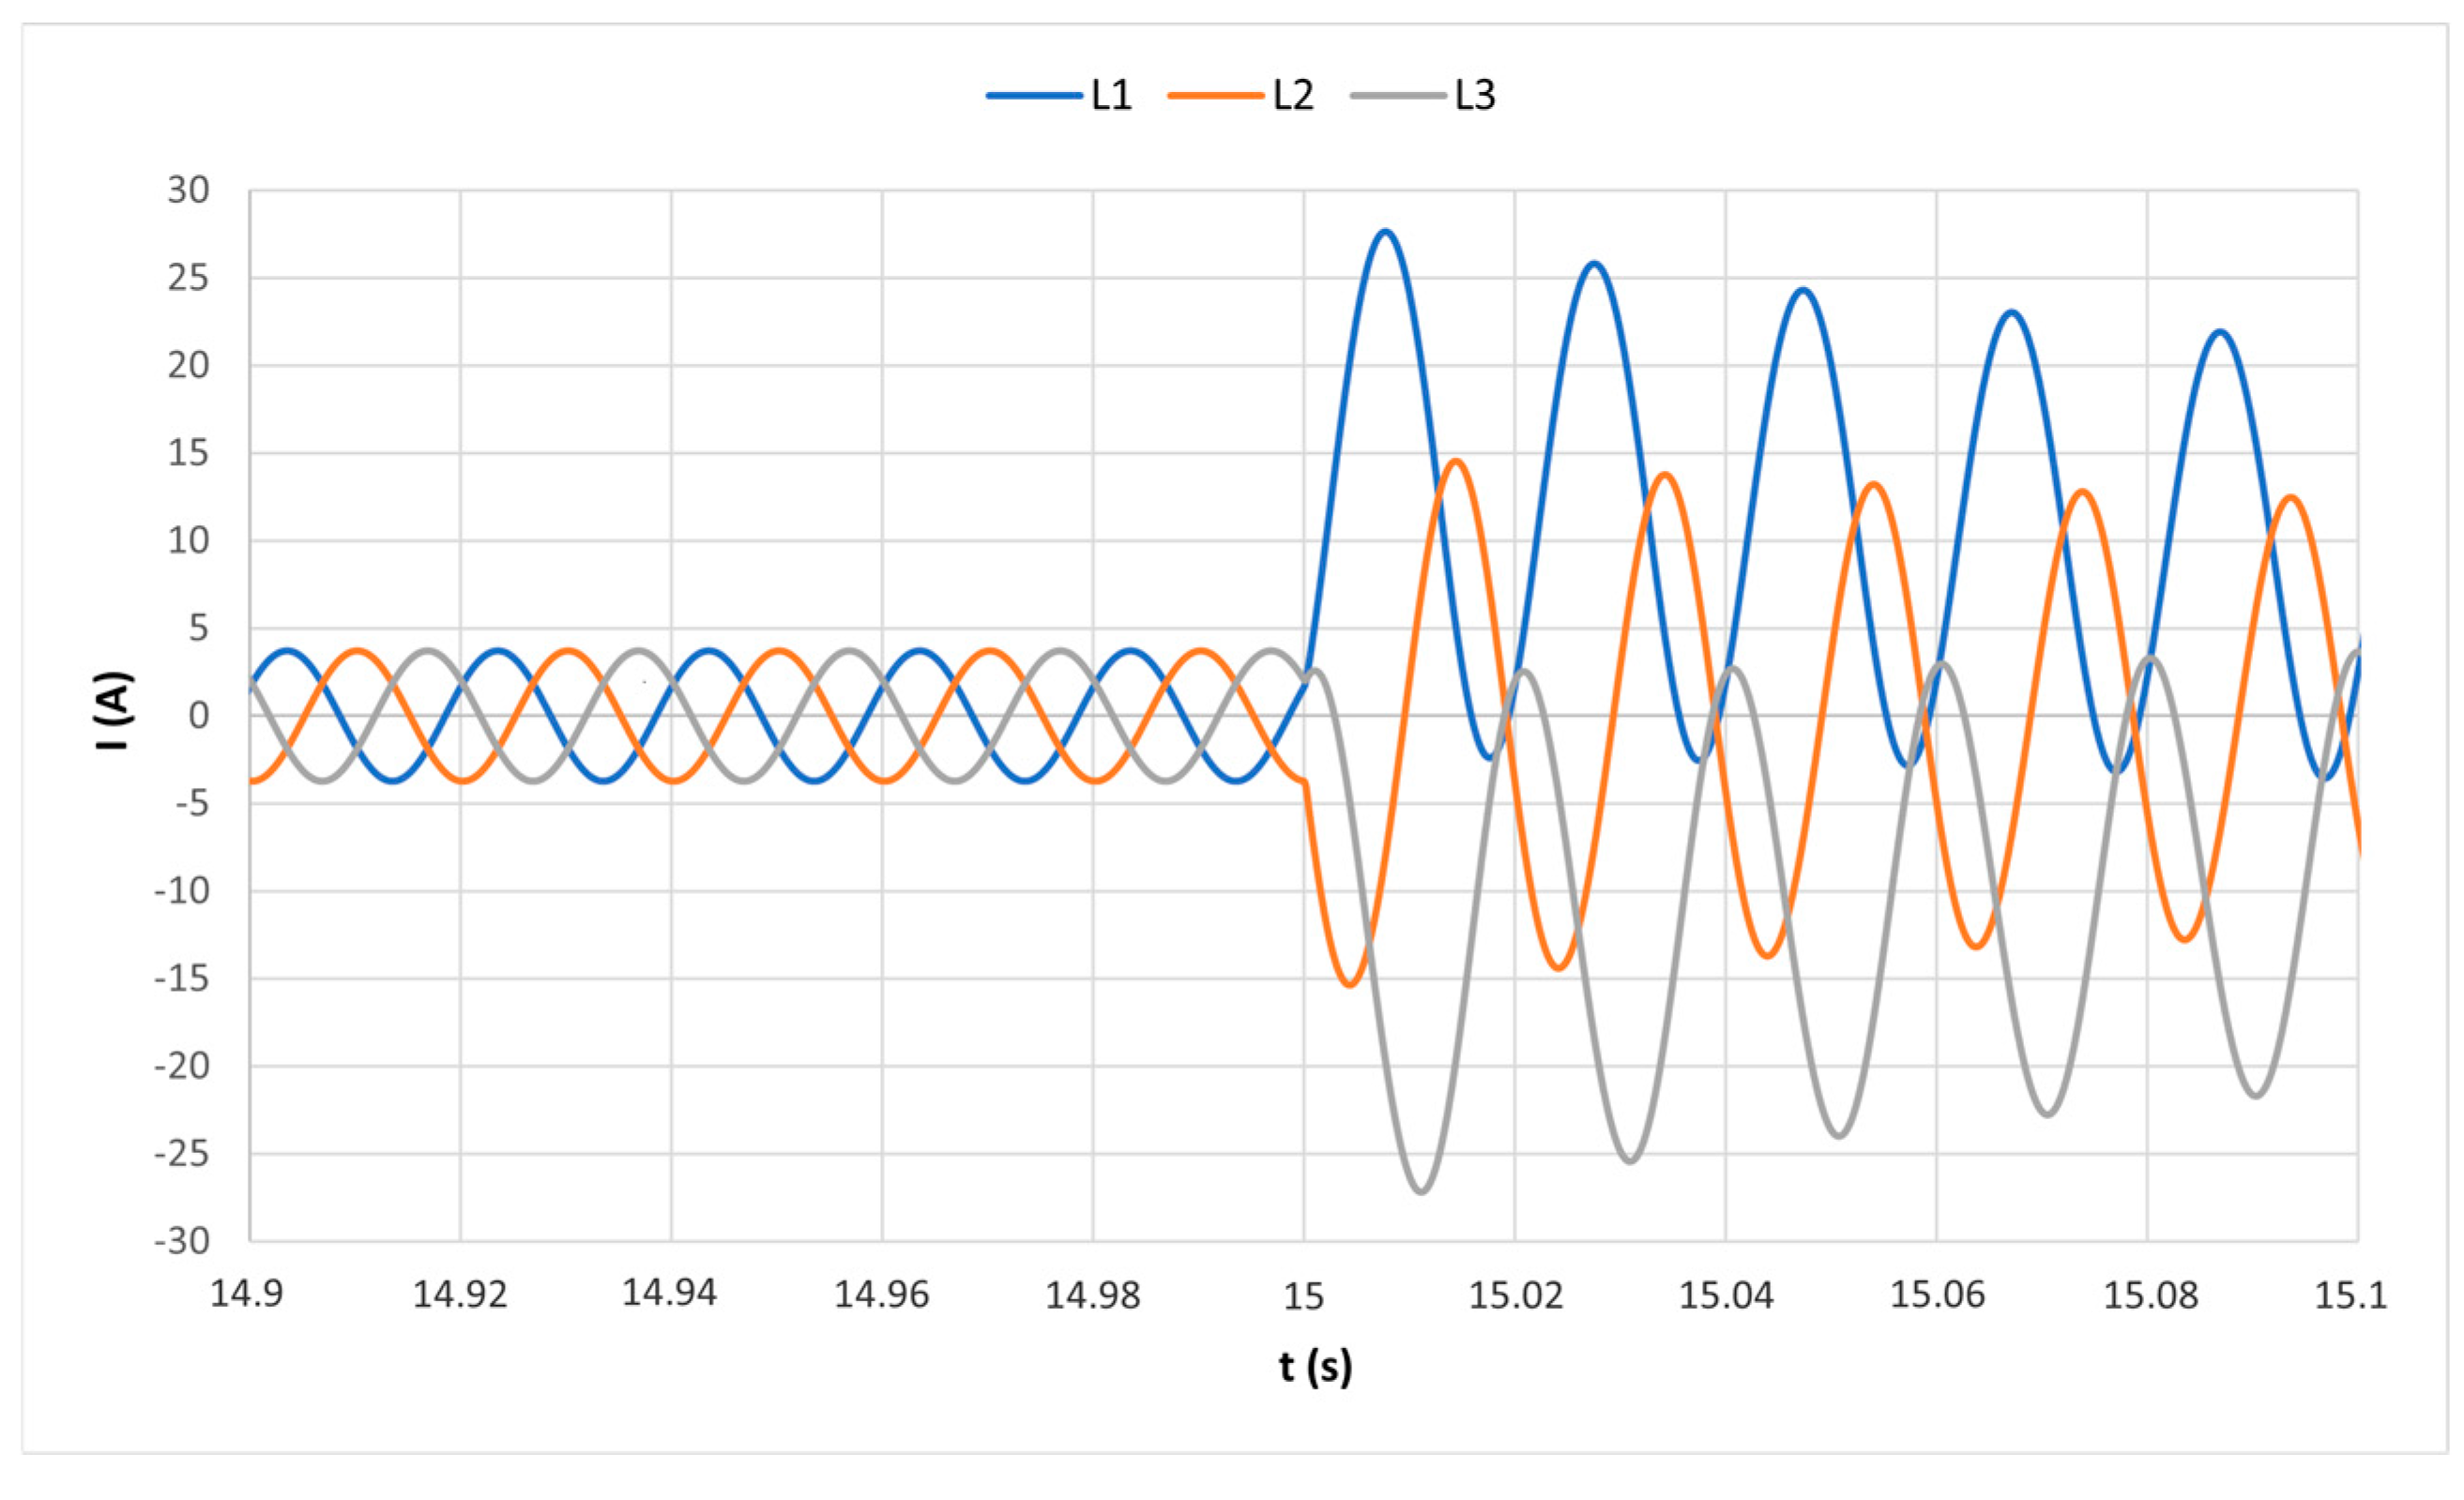
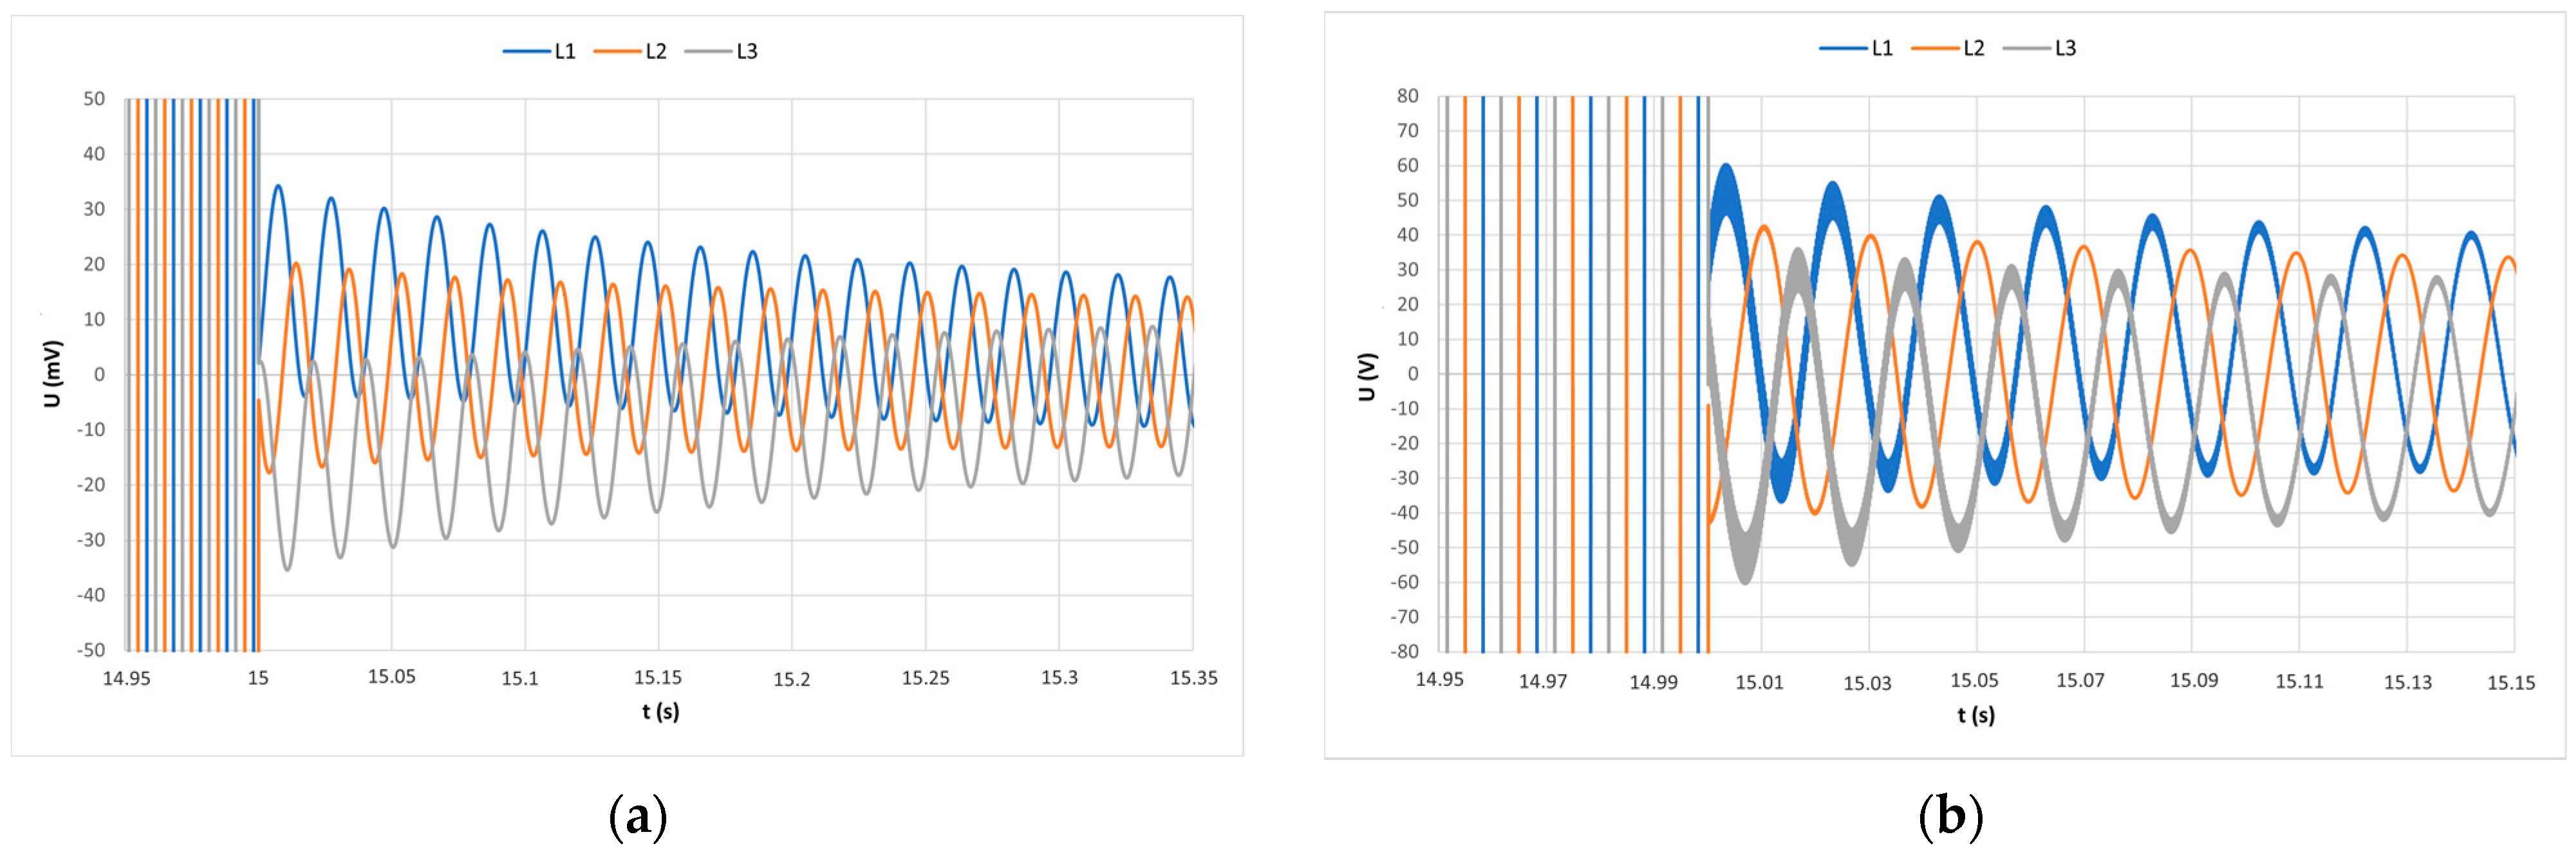
Figure 17 and Figure 18 show a comparison of the operating parameters of the ordinary condition with the fault state. The value of the simulated nominal current was less than 3.73 A and the phase–phase voltage was 21.96 kV. The simulated the fault current value stabilized near the source at 10.2 A and the phase–phase voltage decreased to 12.5 mV, but on the load side simulated fault current value was nearly the same as a fault condition on the source and the phase–phase voltage decreased to 27.5 V. The highest impulse simulated value of the fault current near the source was 28.89 A and on the other side was 28.8 A. The measuring point also was shown in the individual models in Section 4.2 and was located near the output of the power source.
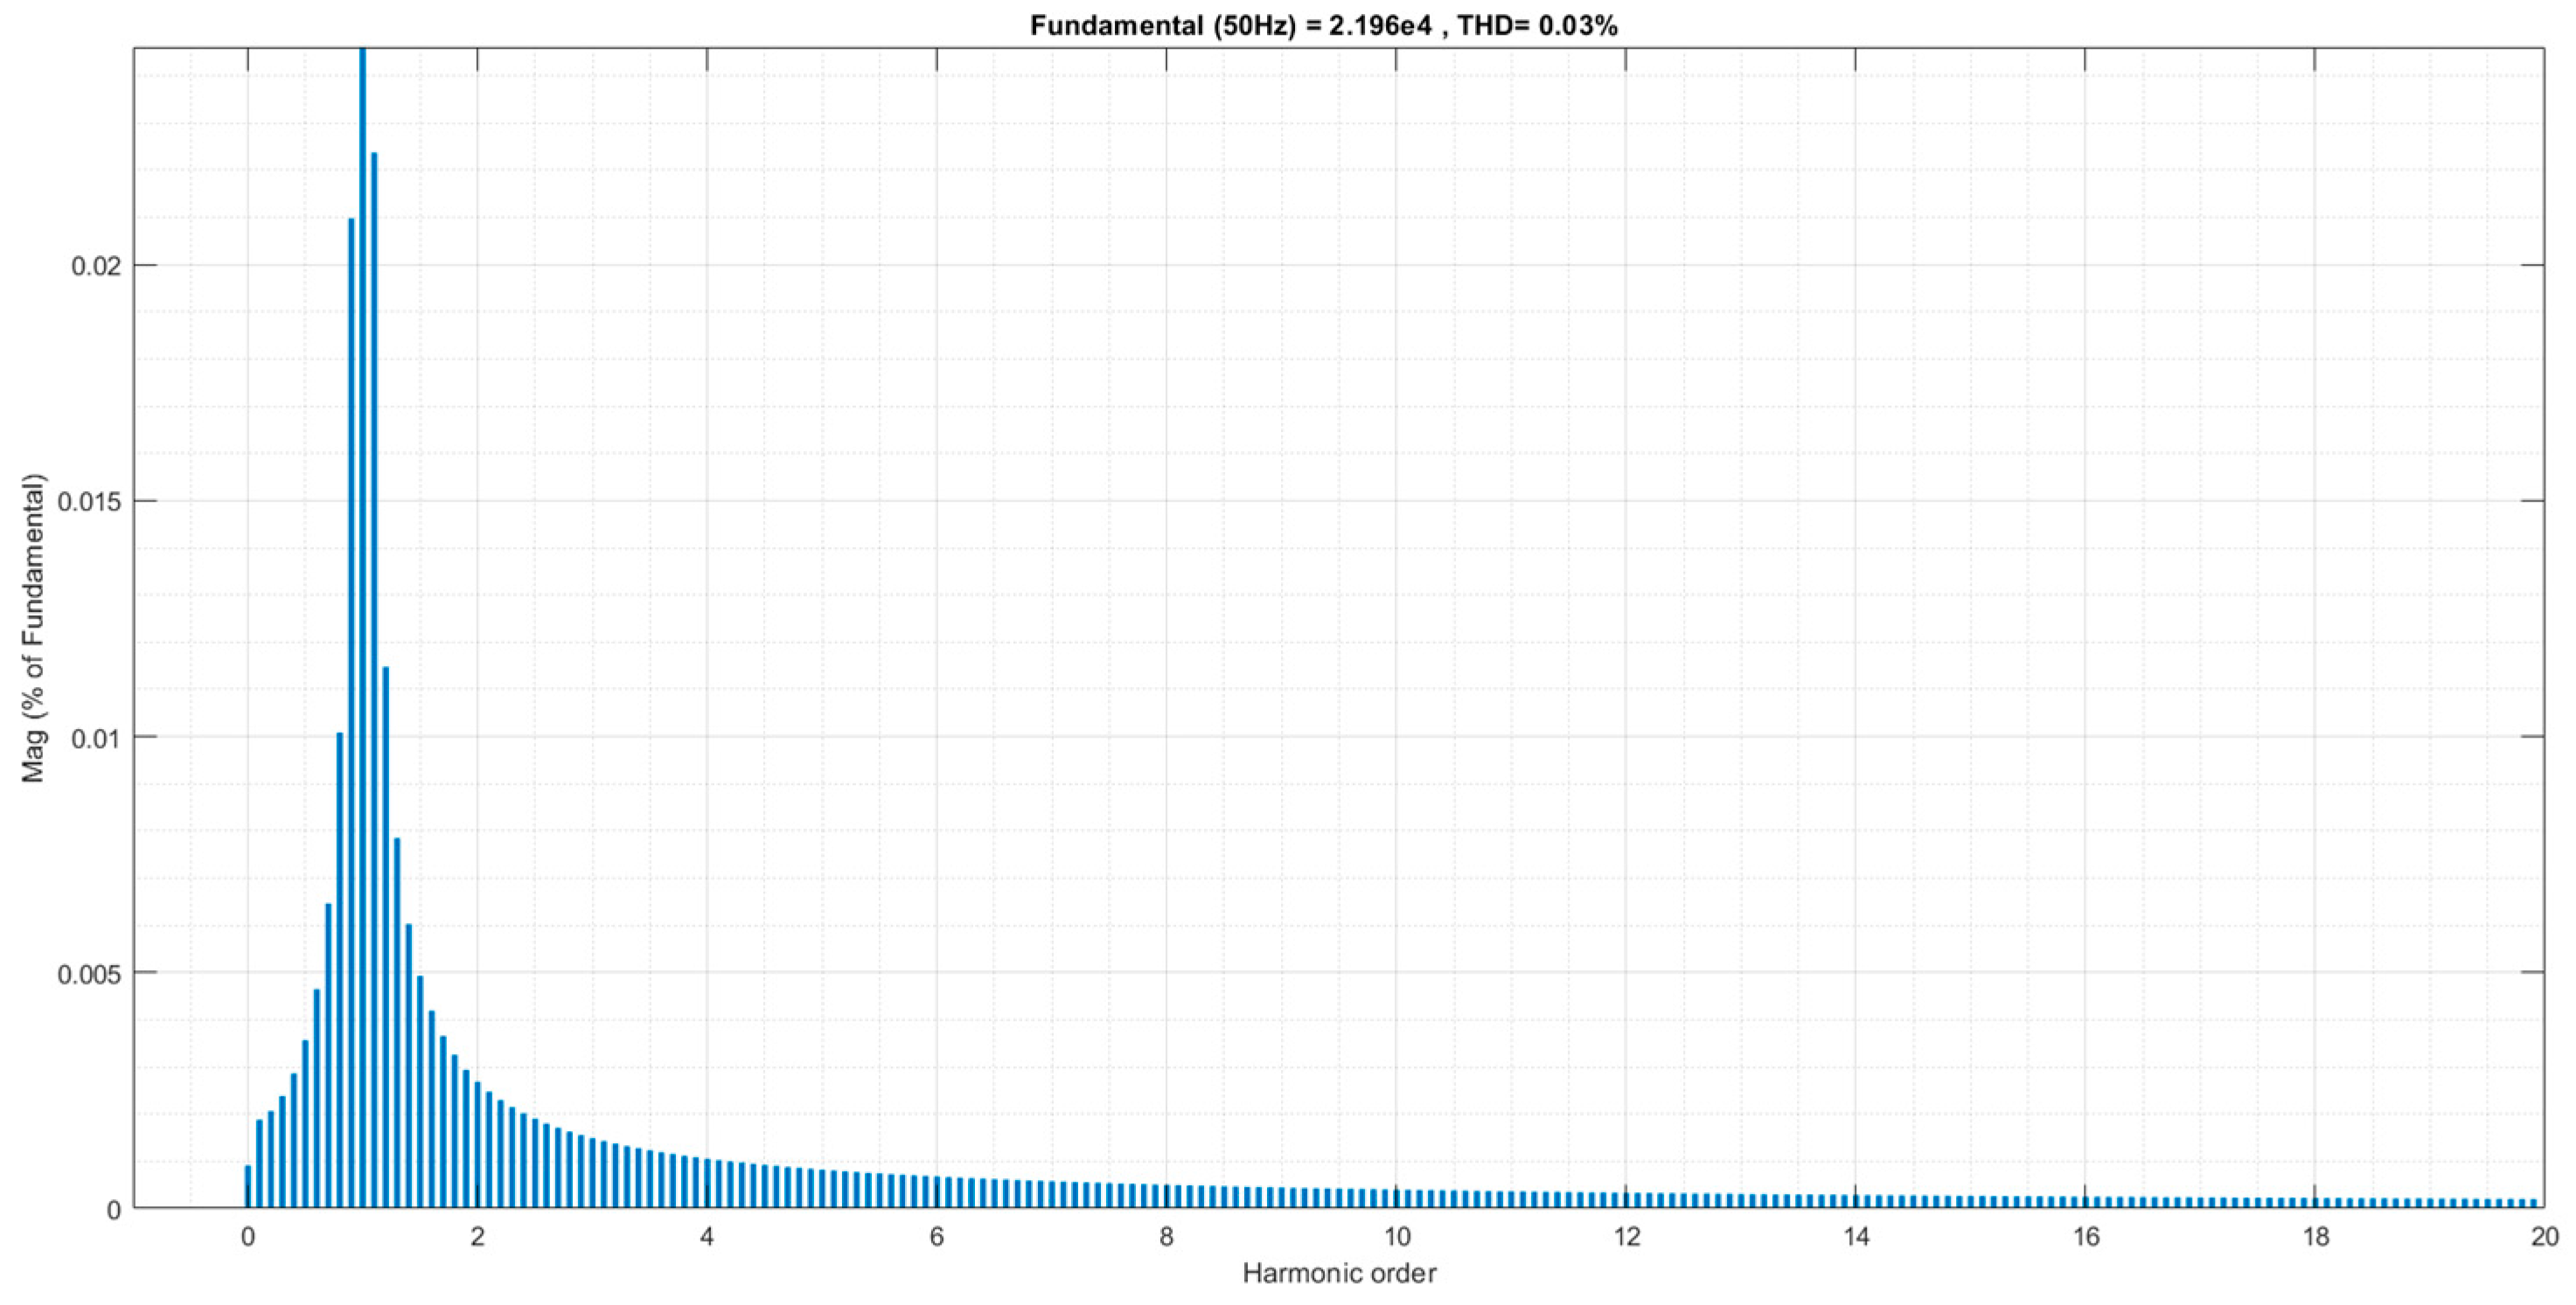
Figure 19 shows FFT analysis of the ordinary voltage condition. The generated voltage of this model had a THD value of 0.03%. As shown in the Figure 19, it is possible to see some harmonic near the base frequency value of 50 Hz, the individual values of these interfering elements not exceeding a value of 0.022%.
5.3. Model of Battery Energy Storage System
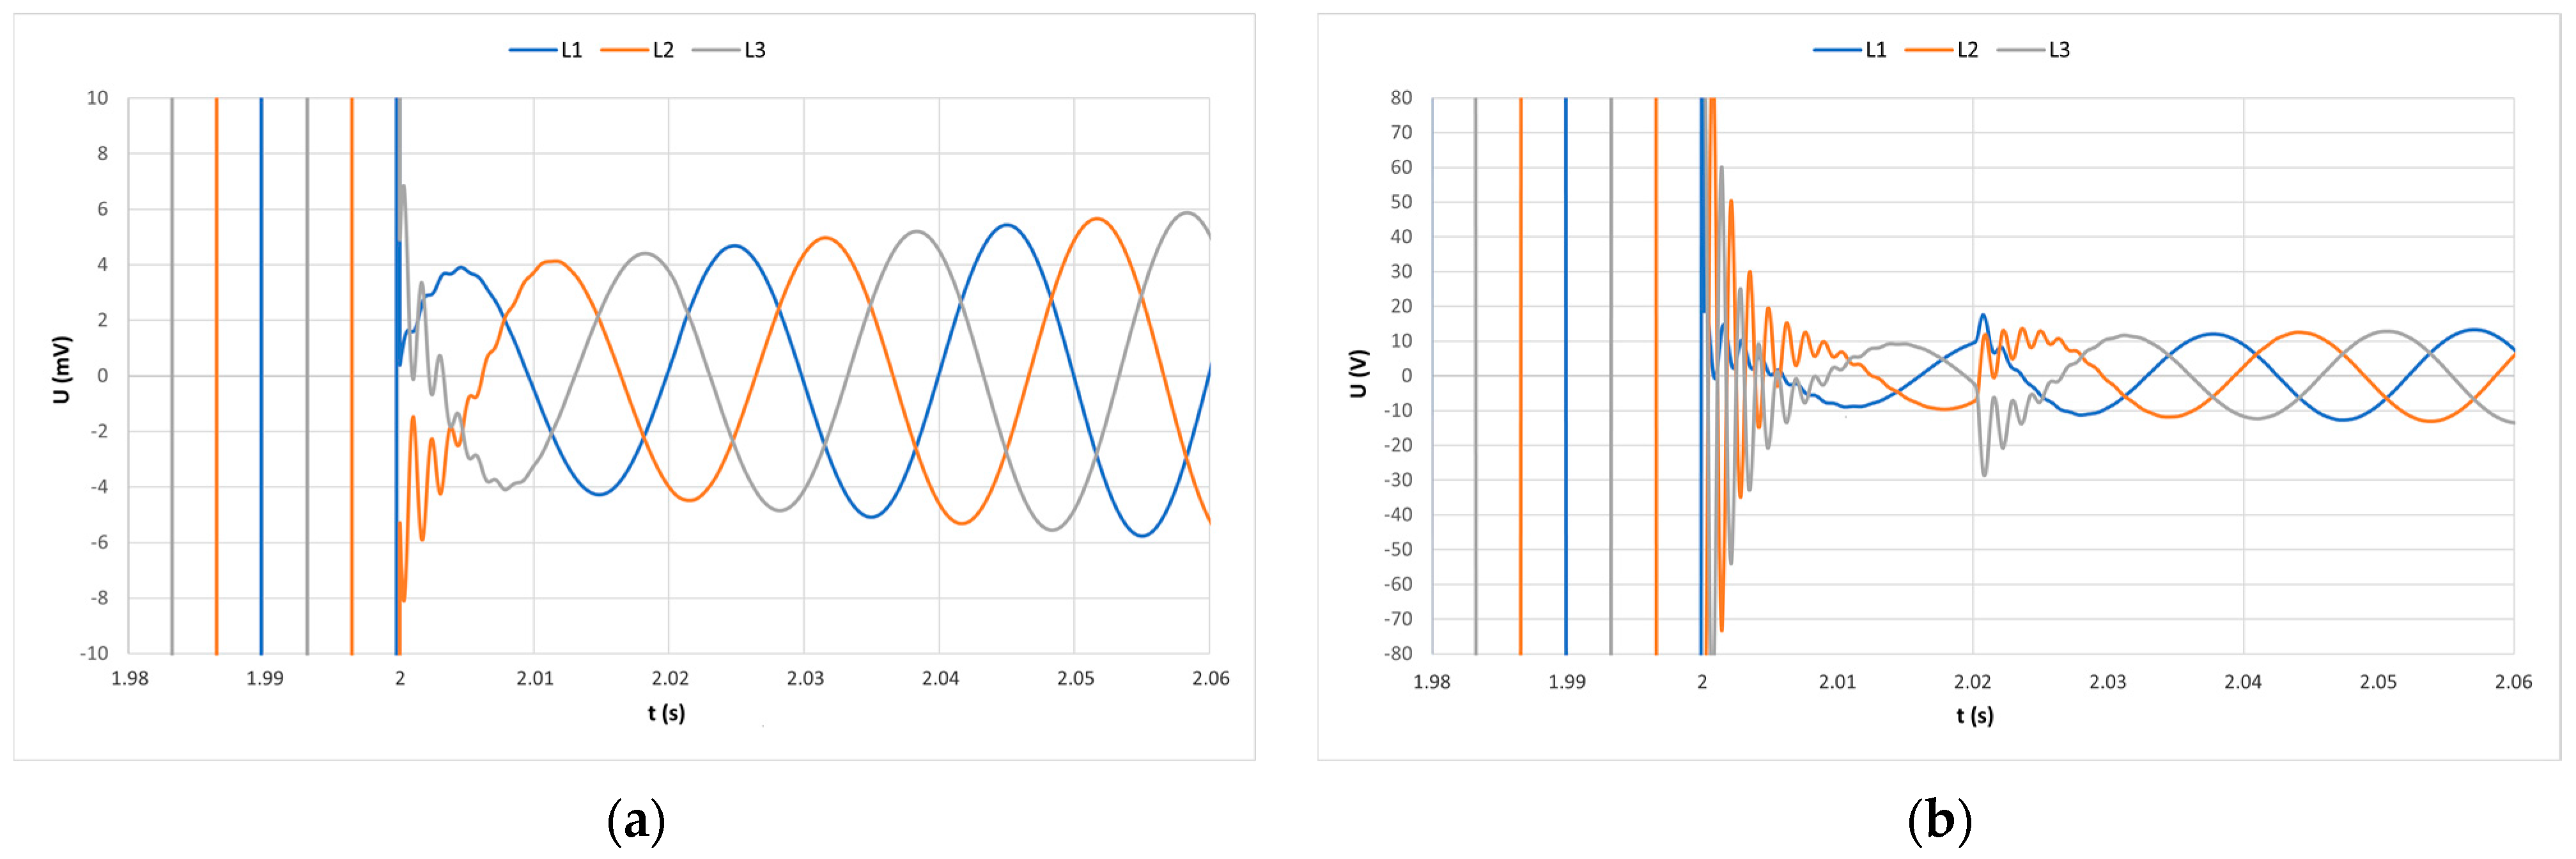
Figure 20 and Figure 21 show a comparison of the operating parameters of the ordinary condition with the fault state. The value of the simulated nominal current was less than 3.7 A and the phase–phase voltage was 21.847 kV. The simulated fault current value stabilized near the source at 5.567 A and the phase–phase voltage decreased to 6.82 mV, but on the load side simulated the fault current value was nearly same as a fault condition on the source and the phase–phase voltage decreased to 15.67 V. The highest impulse simulated value of the fault current near the source was 6.621 A and on the other side was 6.613 A. The measuring point also was shown in the individual models in Section 4.3 and was located near the output of the power source.
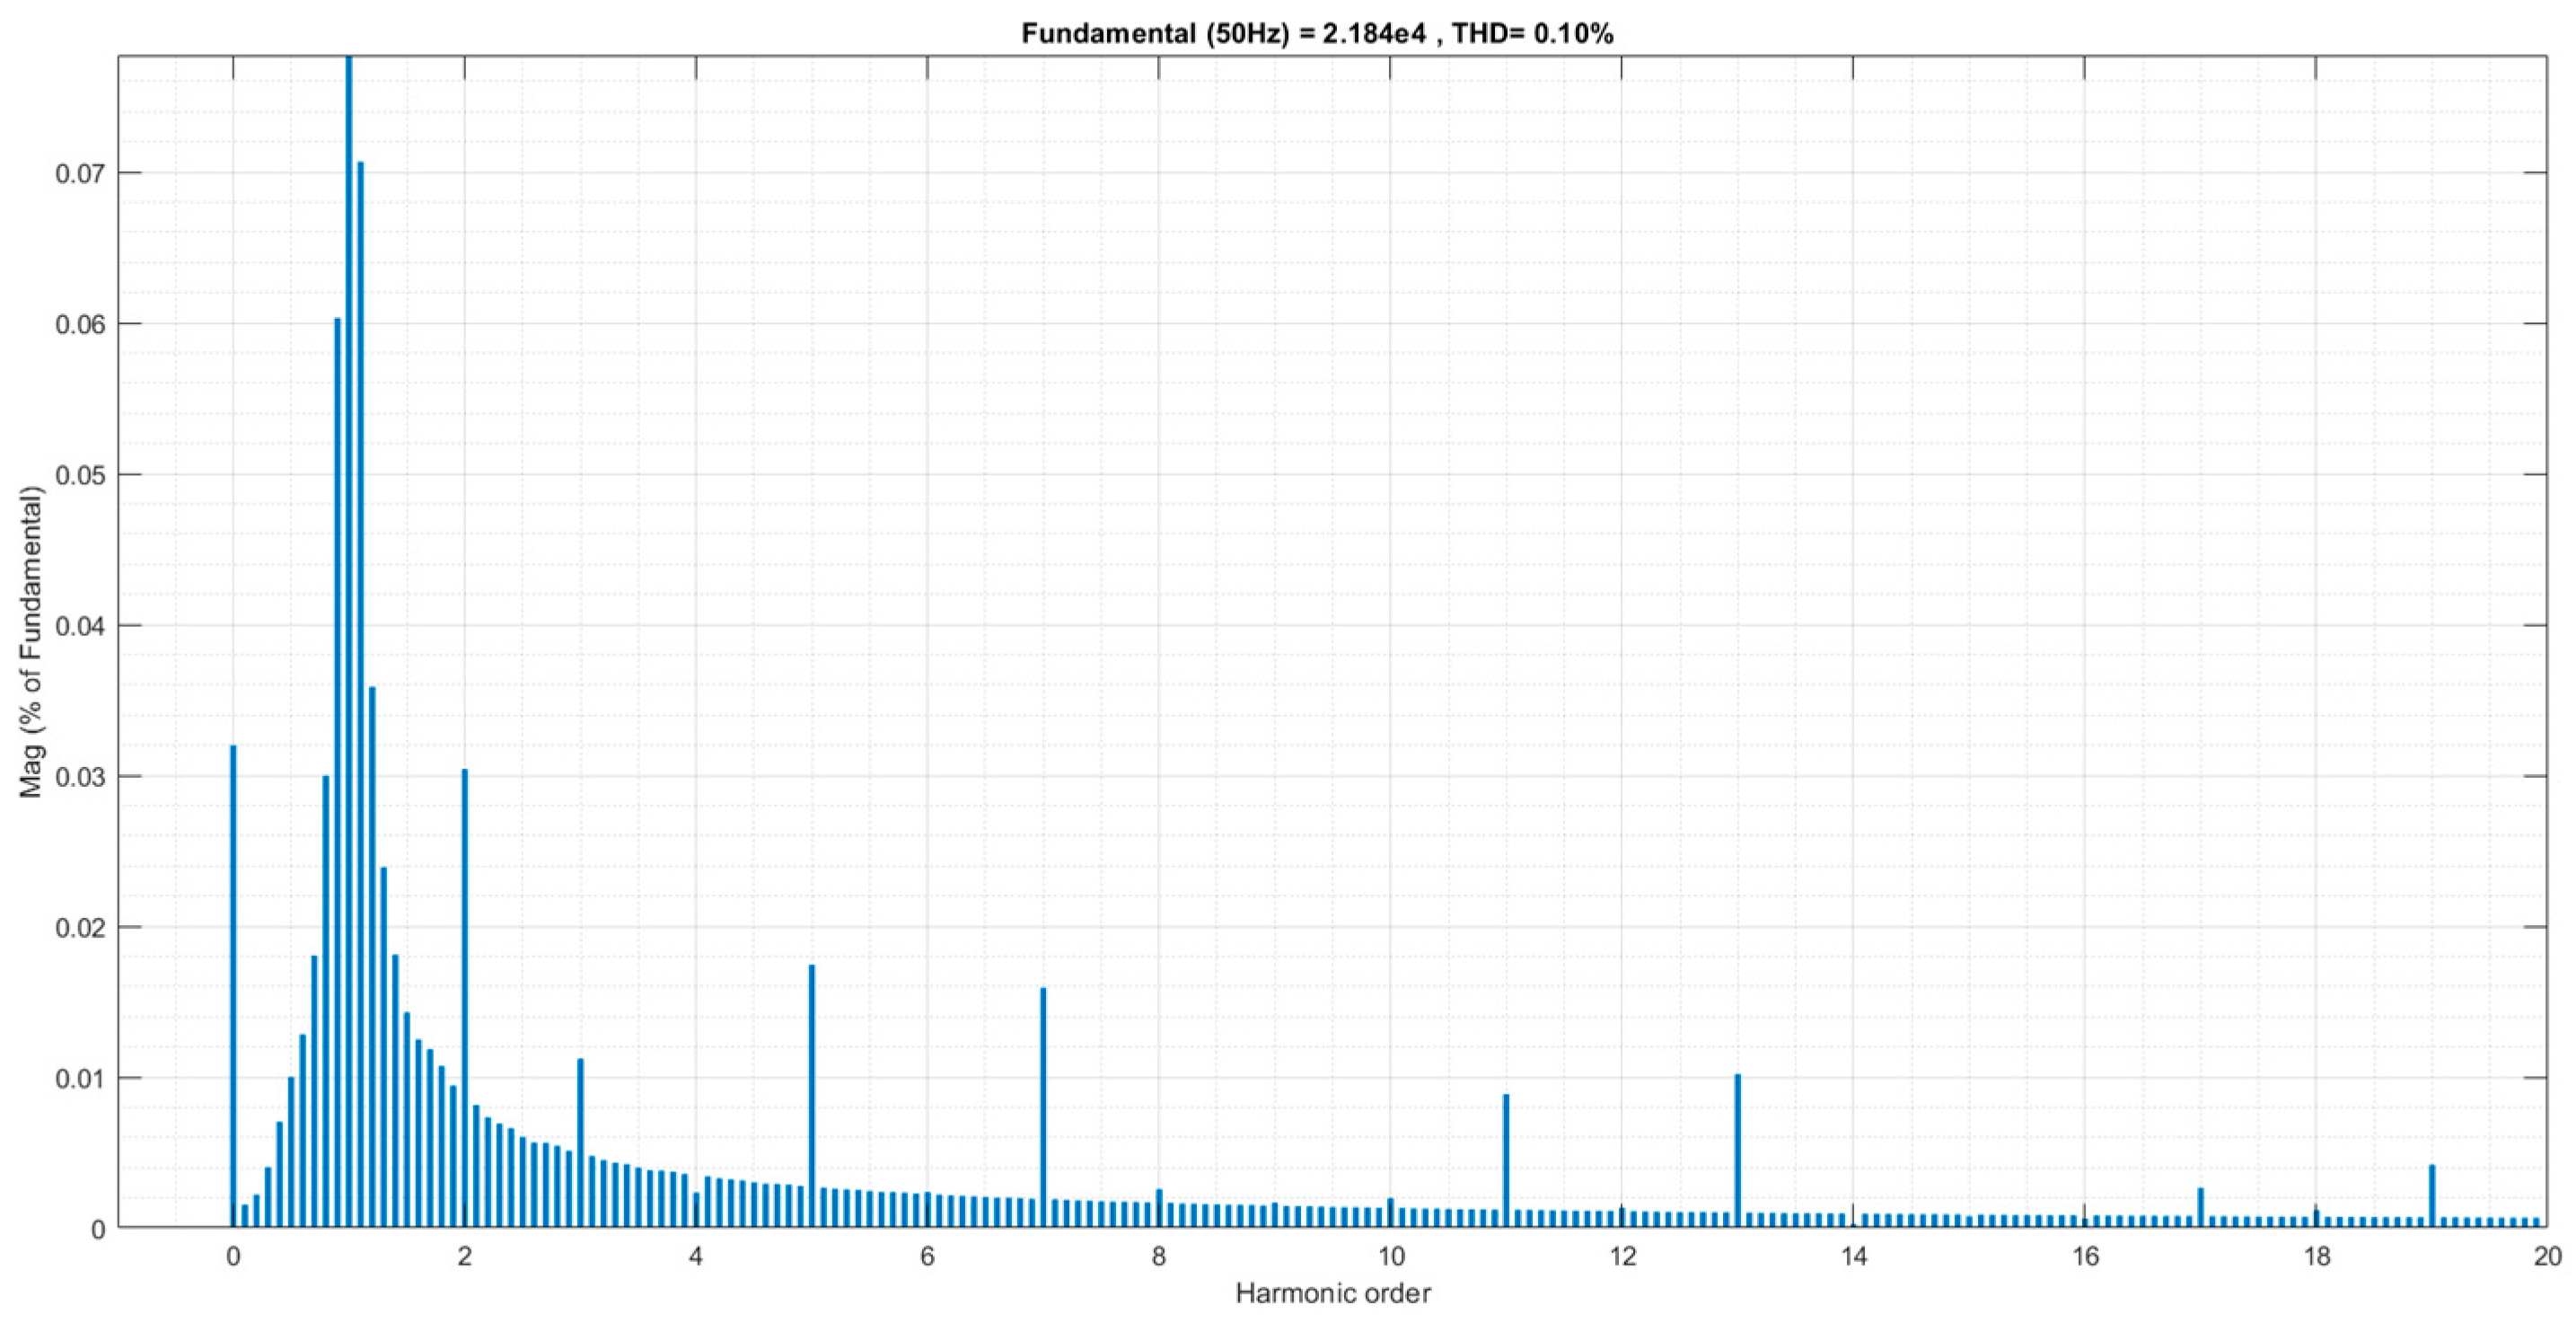
Figure 22 show FFT analysis of the ordinary voltage condition. The generated voltage of this model has a THD value of 0.10%. As shown in Figure 22, it is possible to see same harmonics as on the model of PV station, because it uses the inverter. The individual values of these interfering elements not exceeding a value of 0.071%.
5.4. Model of Thermal Power Plant
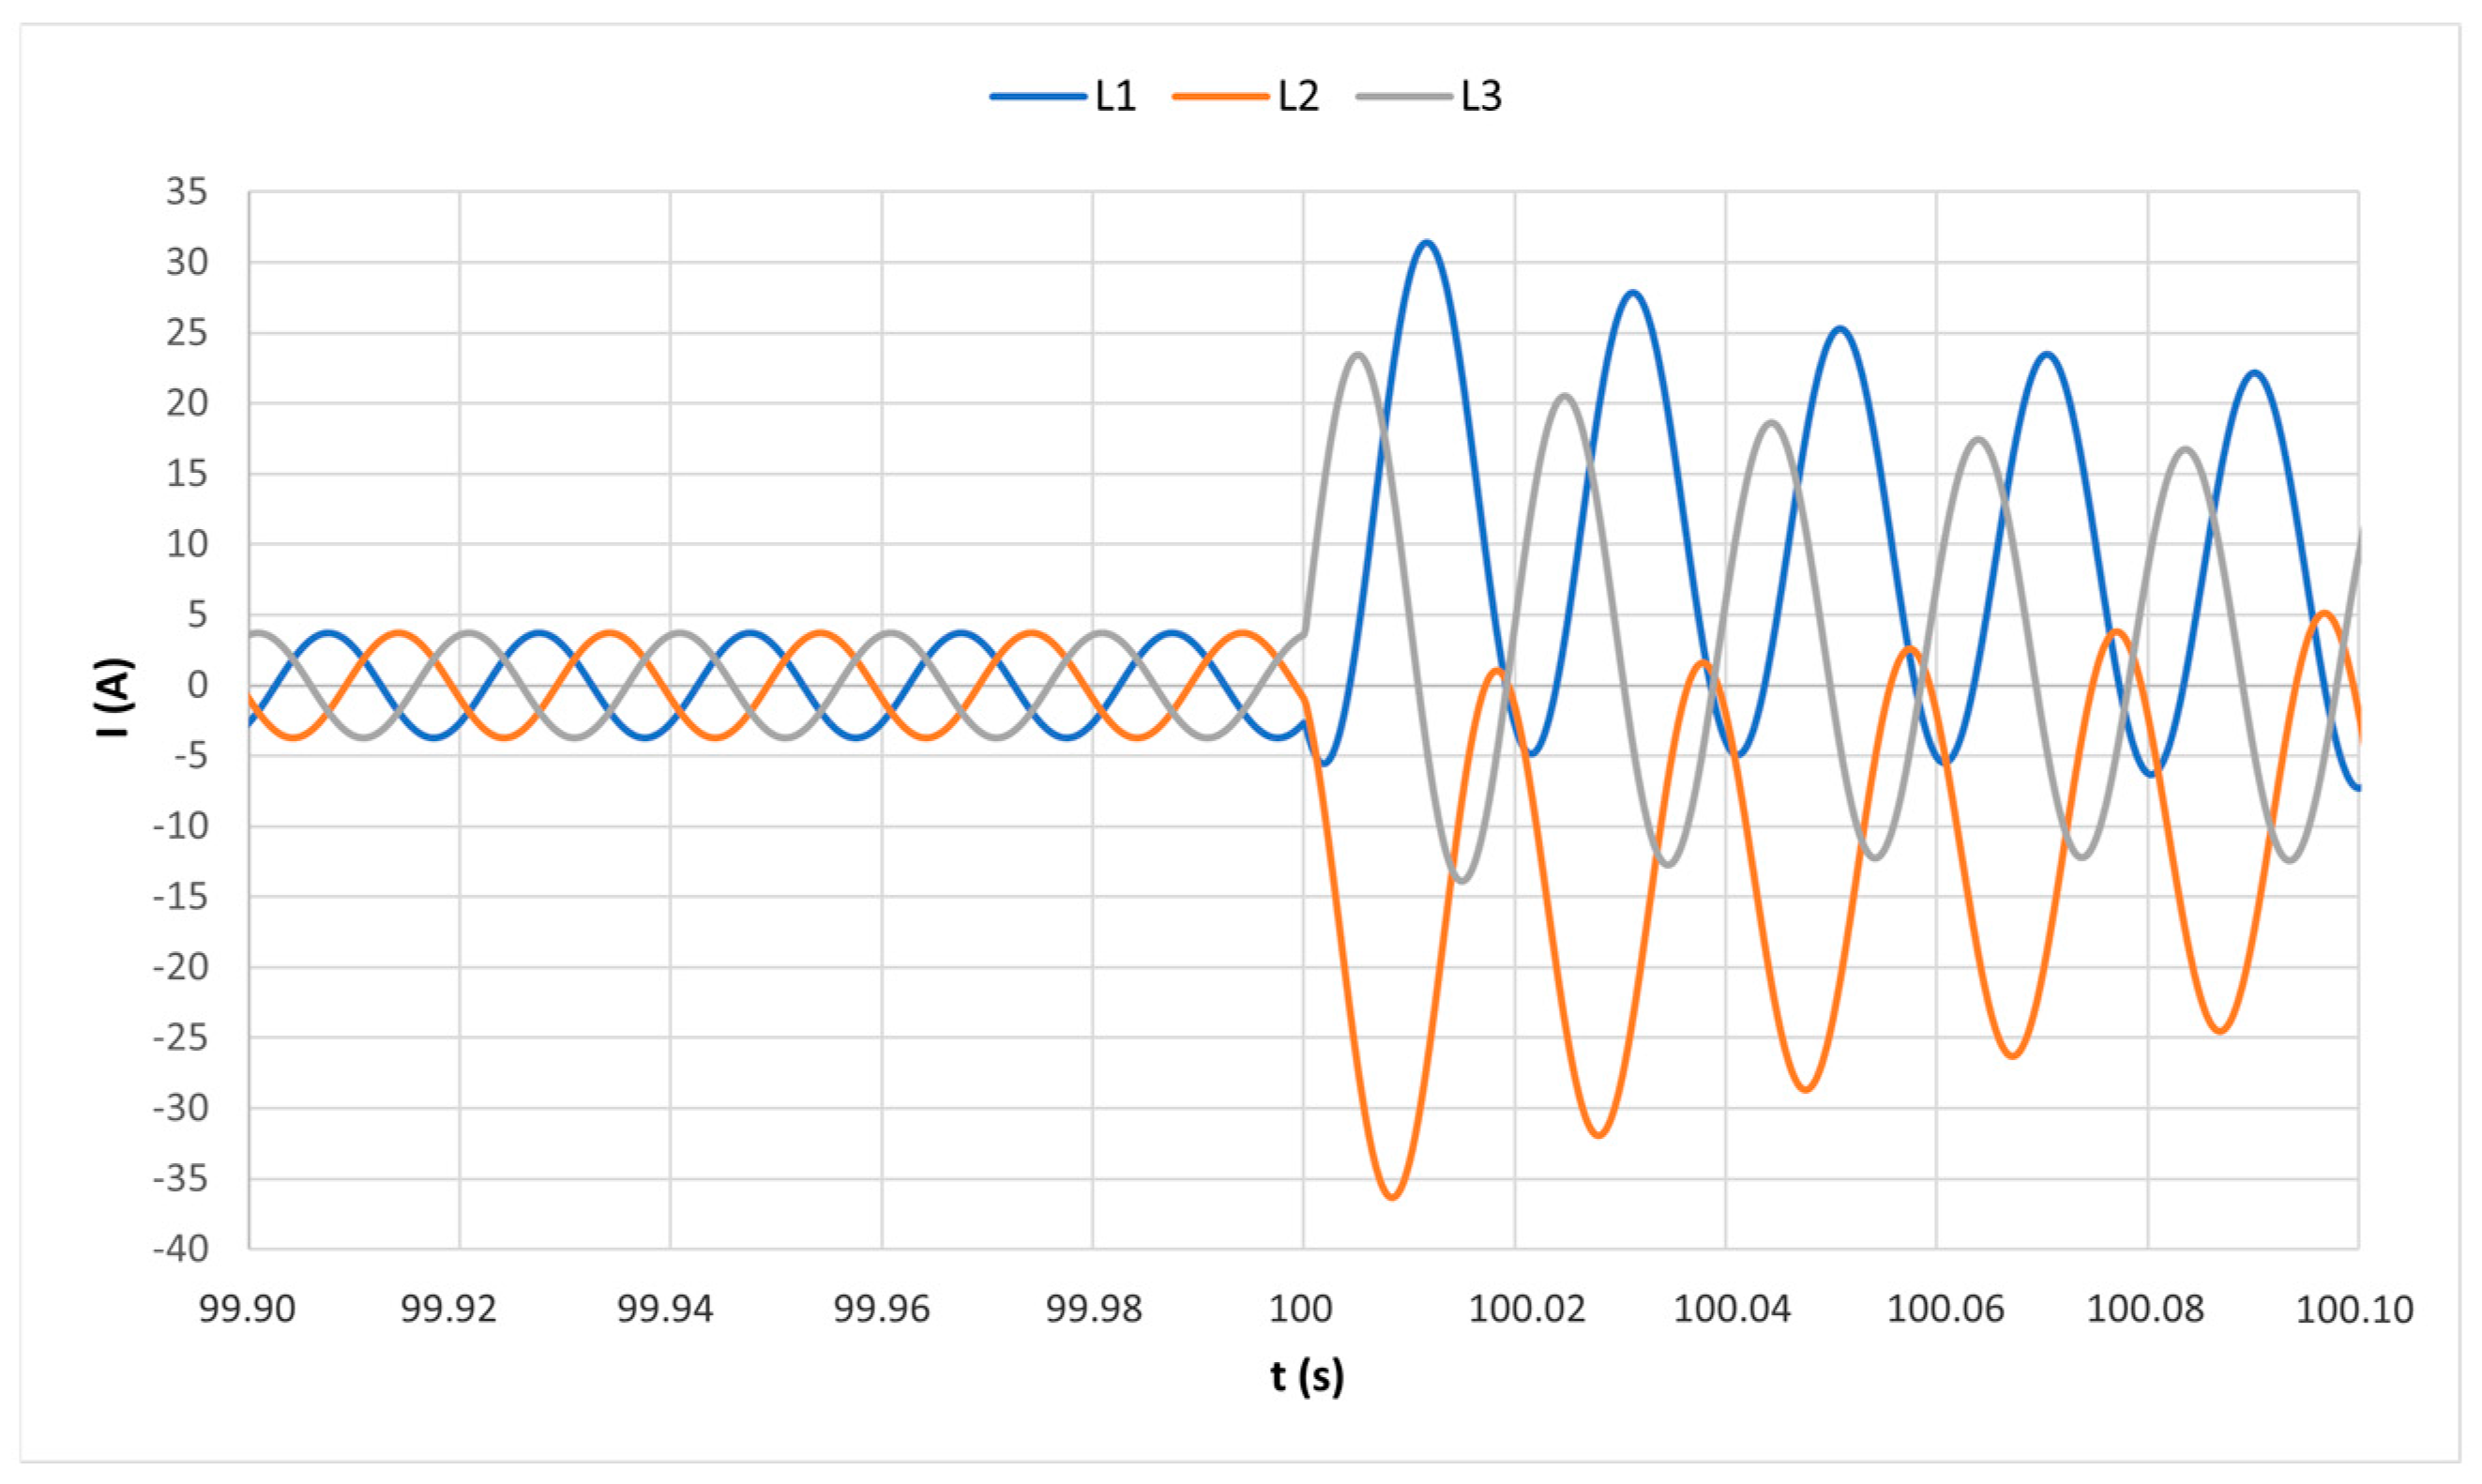
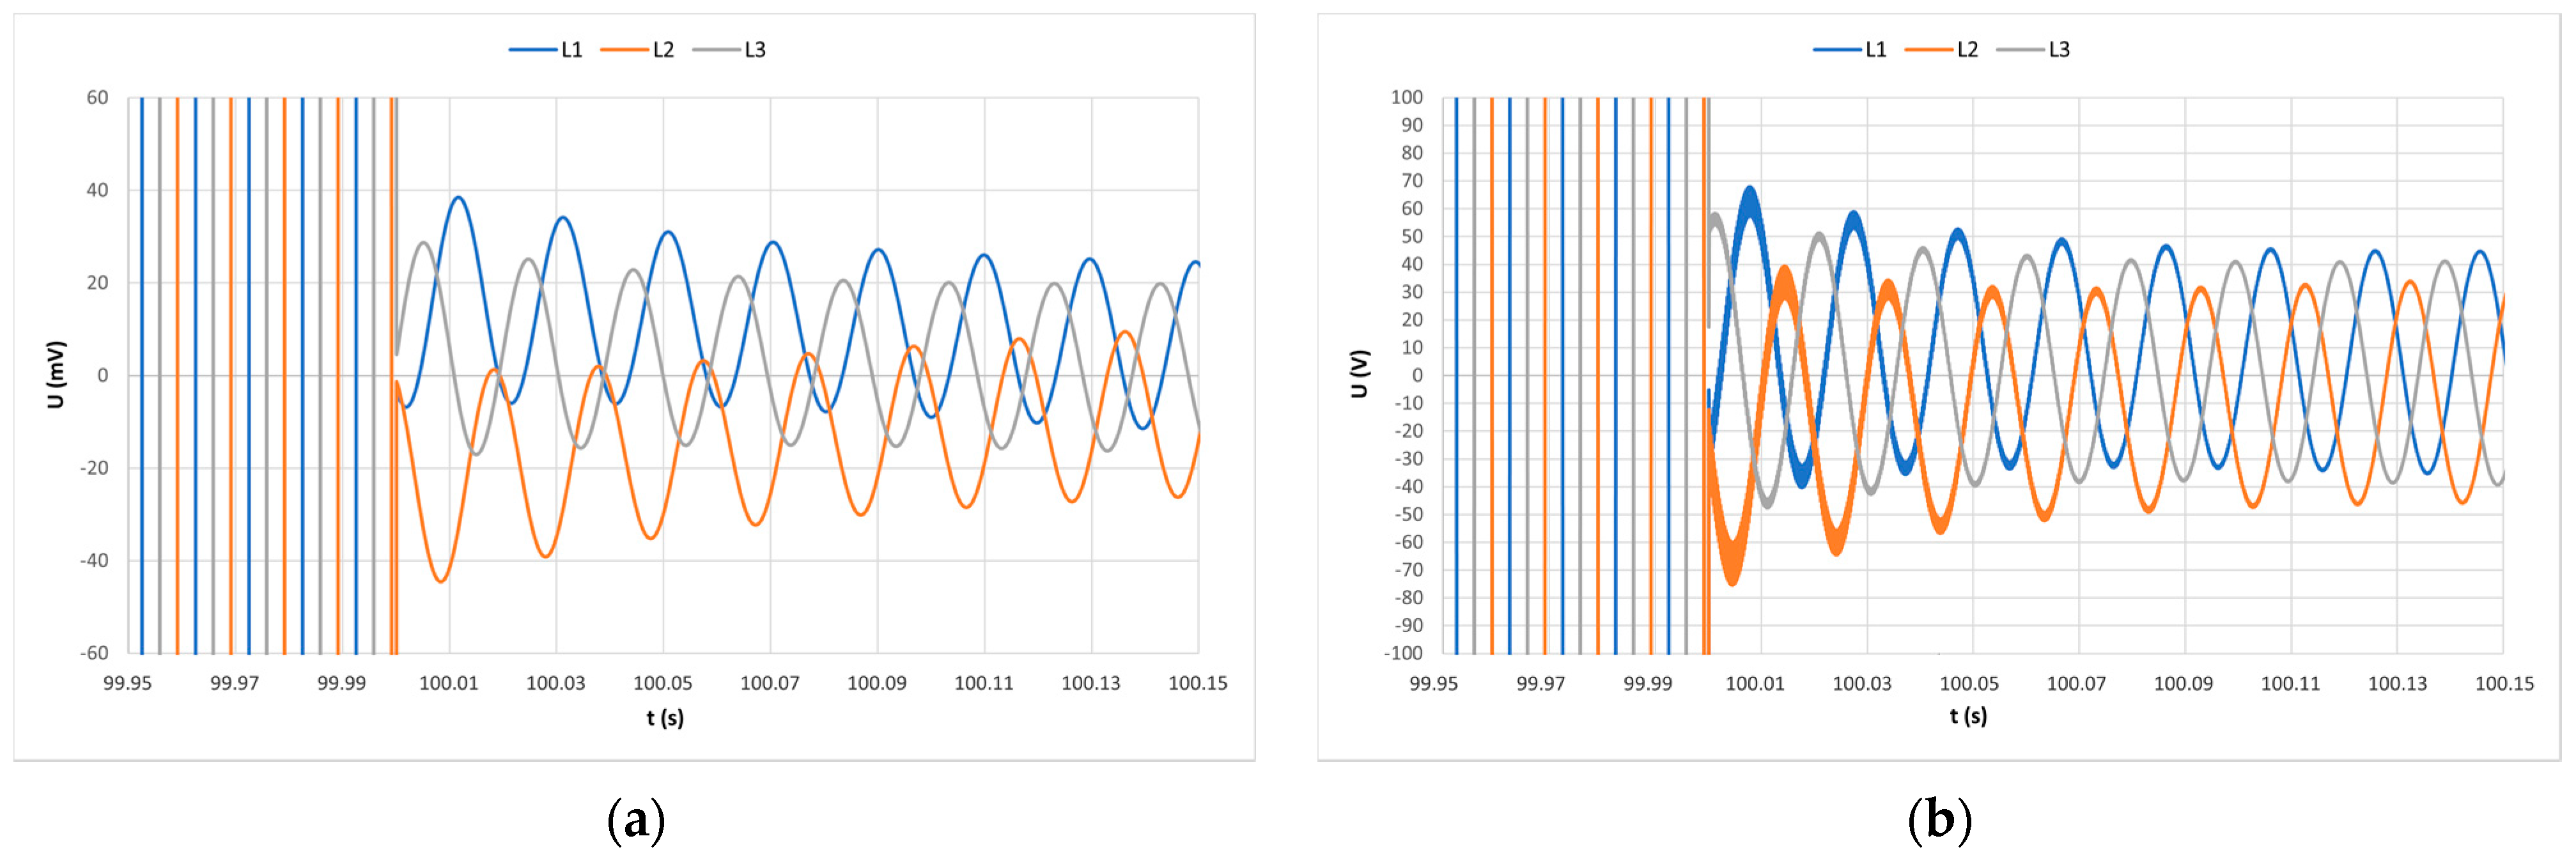
Figure 23 and Figure 24 show a comparison of the operating parameters of the ordinary condition with the fault state. The value of the simulated nominal current was less than 3.72 A and the phase–phase voltage was 21.951 kV. The simulated fault current value stabilized near the source at 27.15 A and the phase–phase voltage decreased to 33 mV, but on the load side simulated the fault current value was nearly same as a fault condition on the source and the phase–phase voltage decreased to 72.7 V. The highest impulse simulated value of the fault current near the source was 36.329 A and on the other side was 36.21 A. The measuring point as also was shown in the individual models in Section 4.4, was located near the output of the power source.
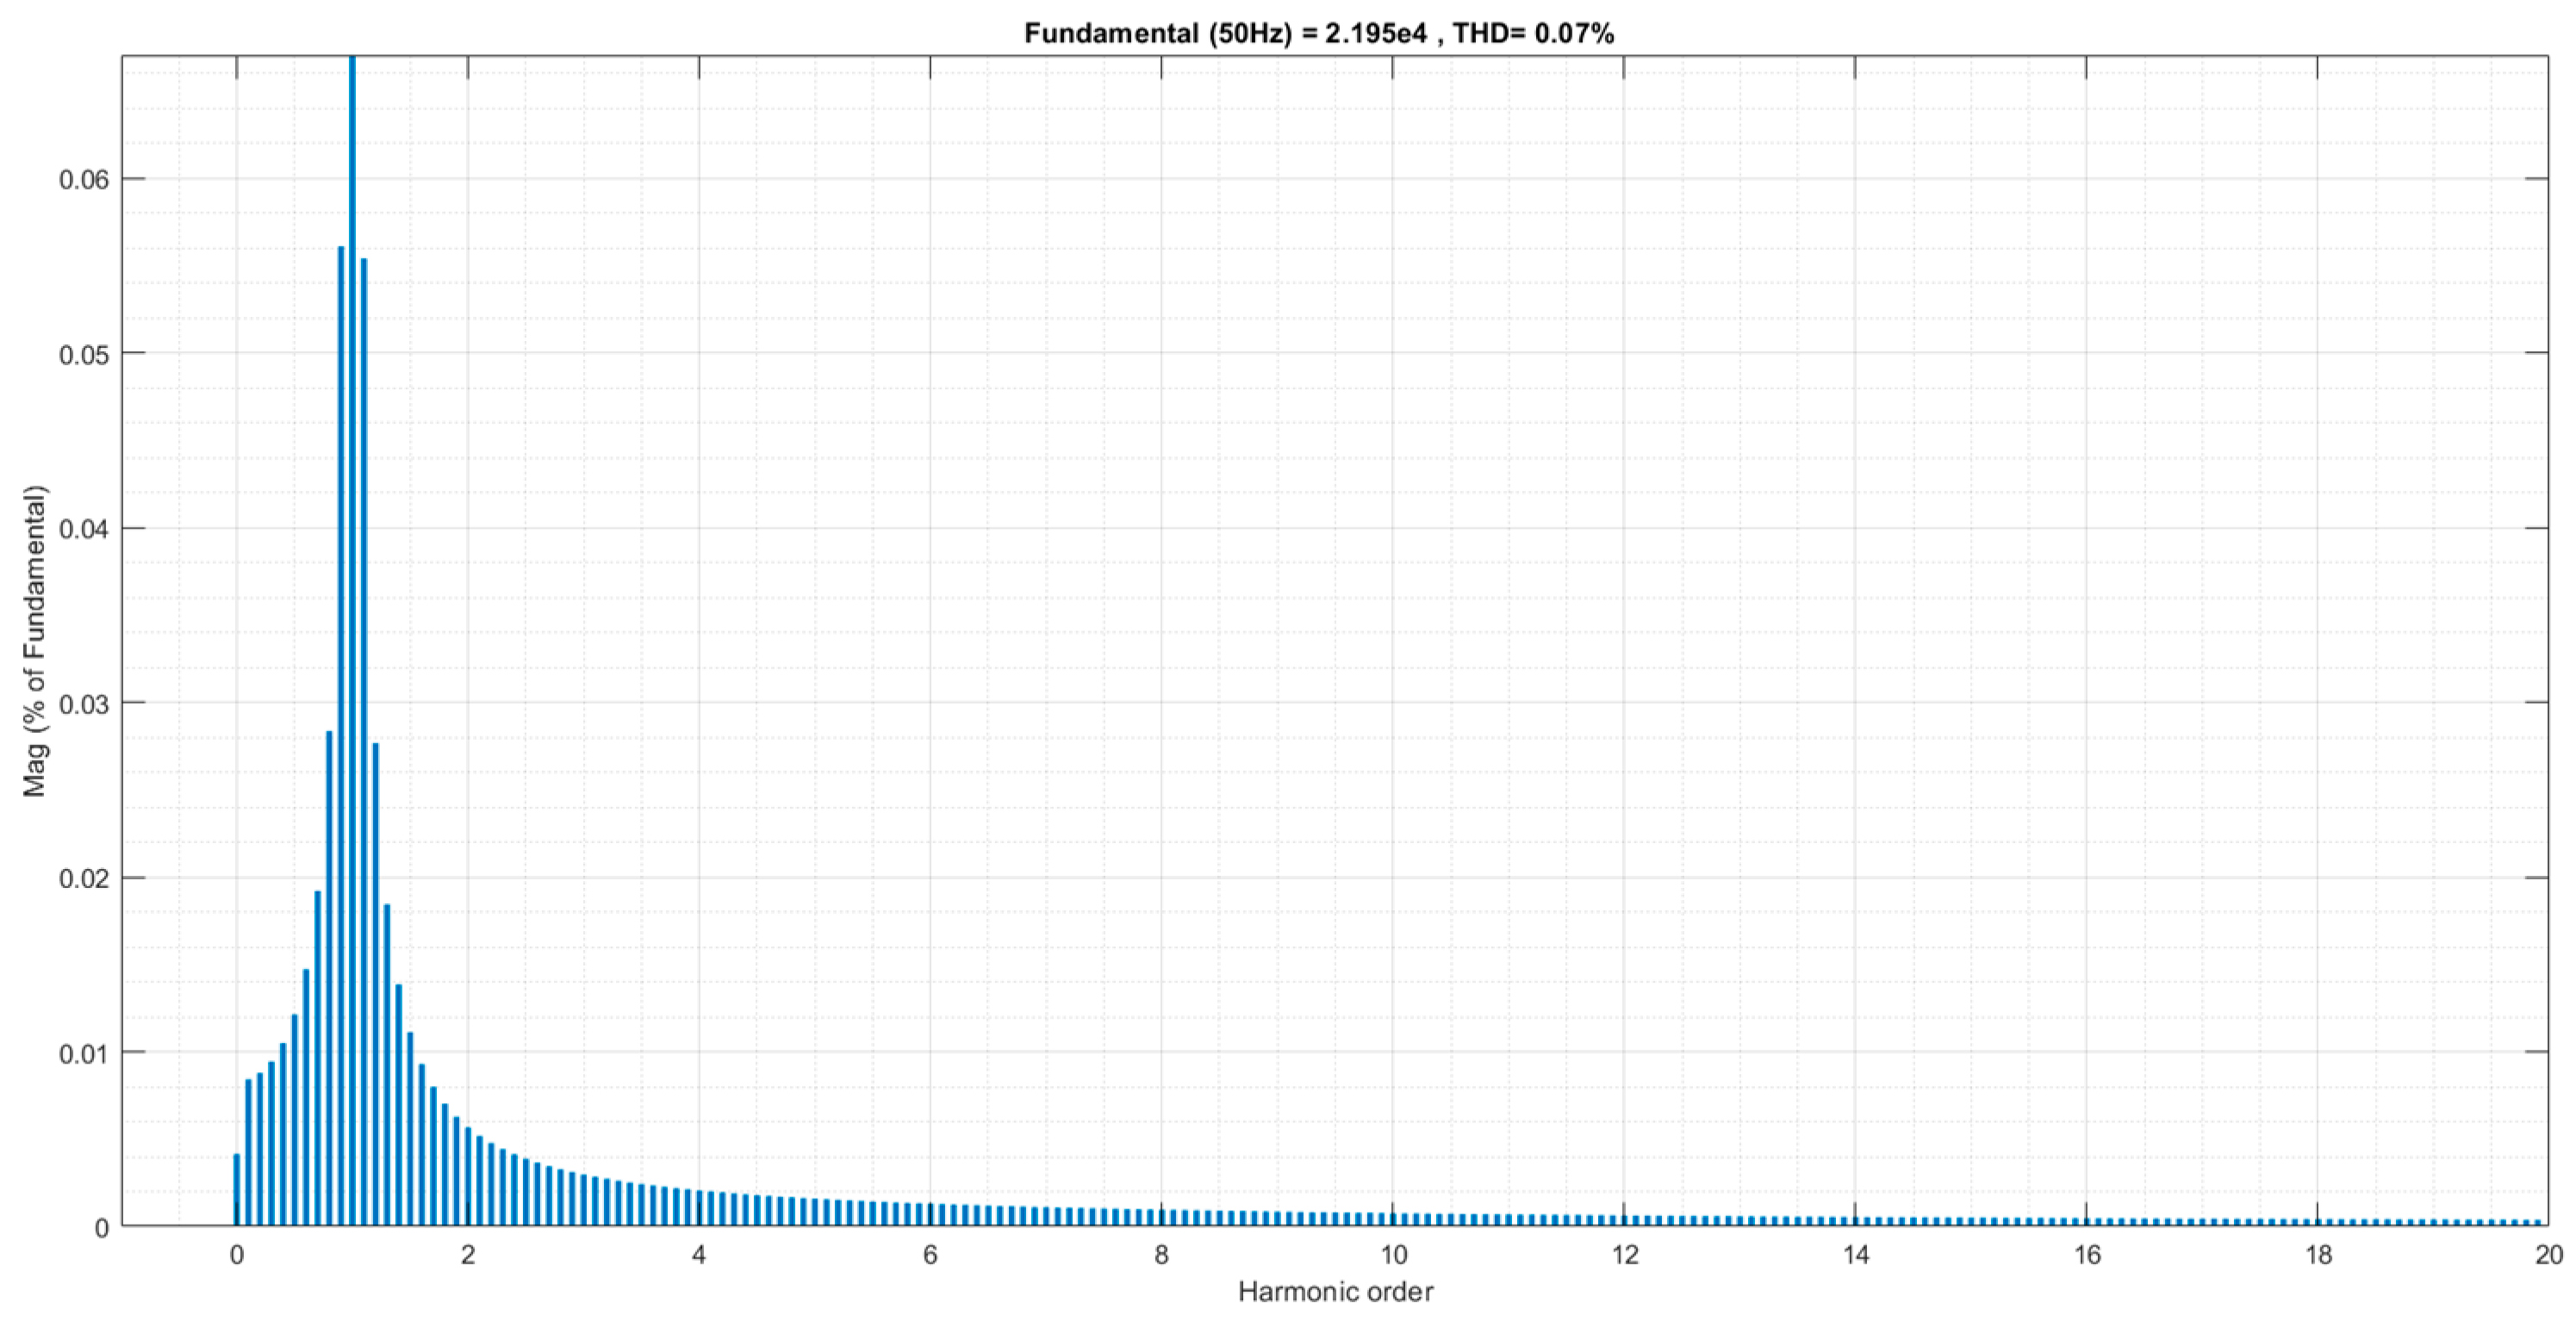
Figure 25 shows FFT analysis of the ordinary voltage condition. The generated voltage of this model had a THD value of 0.07%. As shown in the Figure 25, it is possible to see some harmonic near the base frequency value of 50 Hz, the individual values of these interfering elements not exceeding a value of 0.057%.
5.5. Model of Hydropower Plant
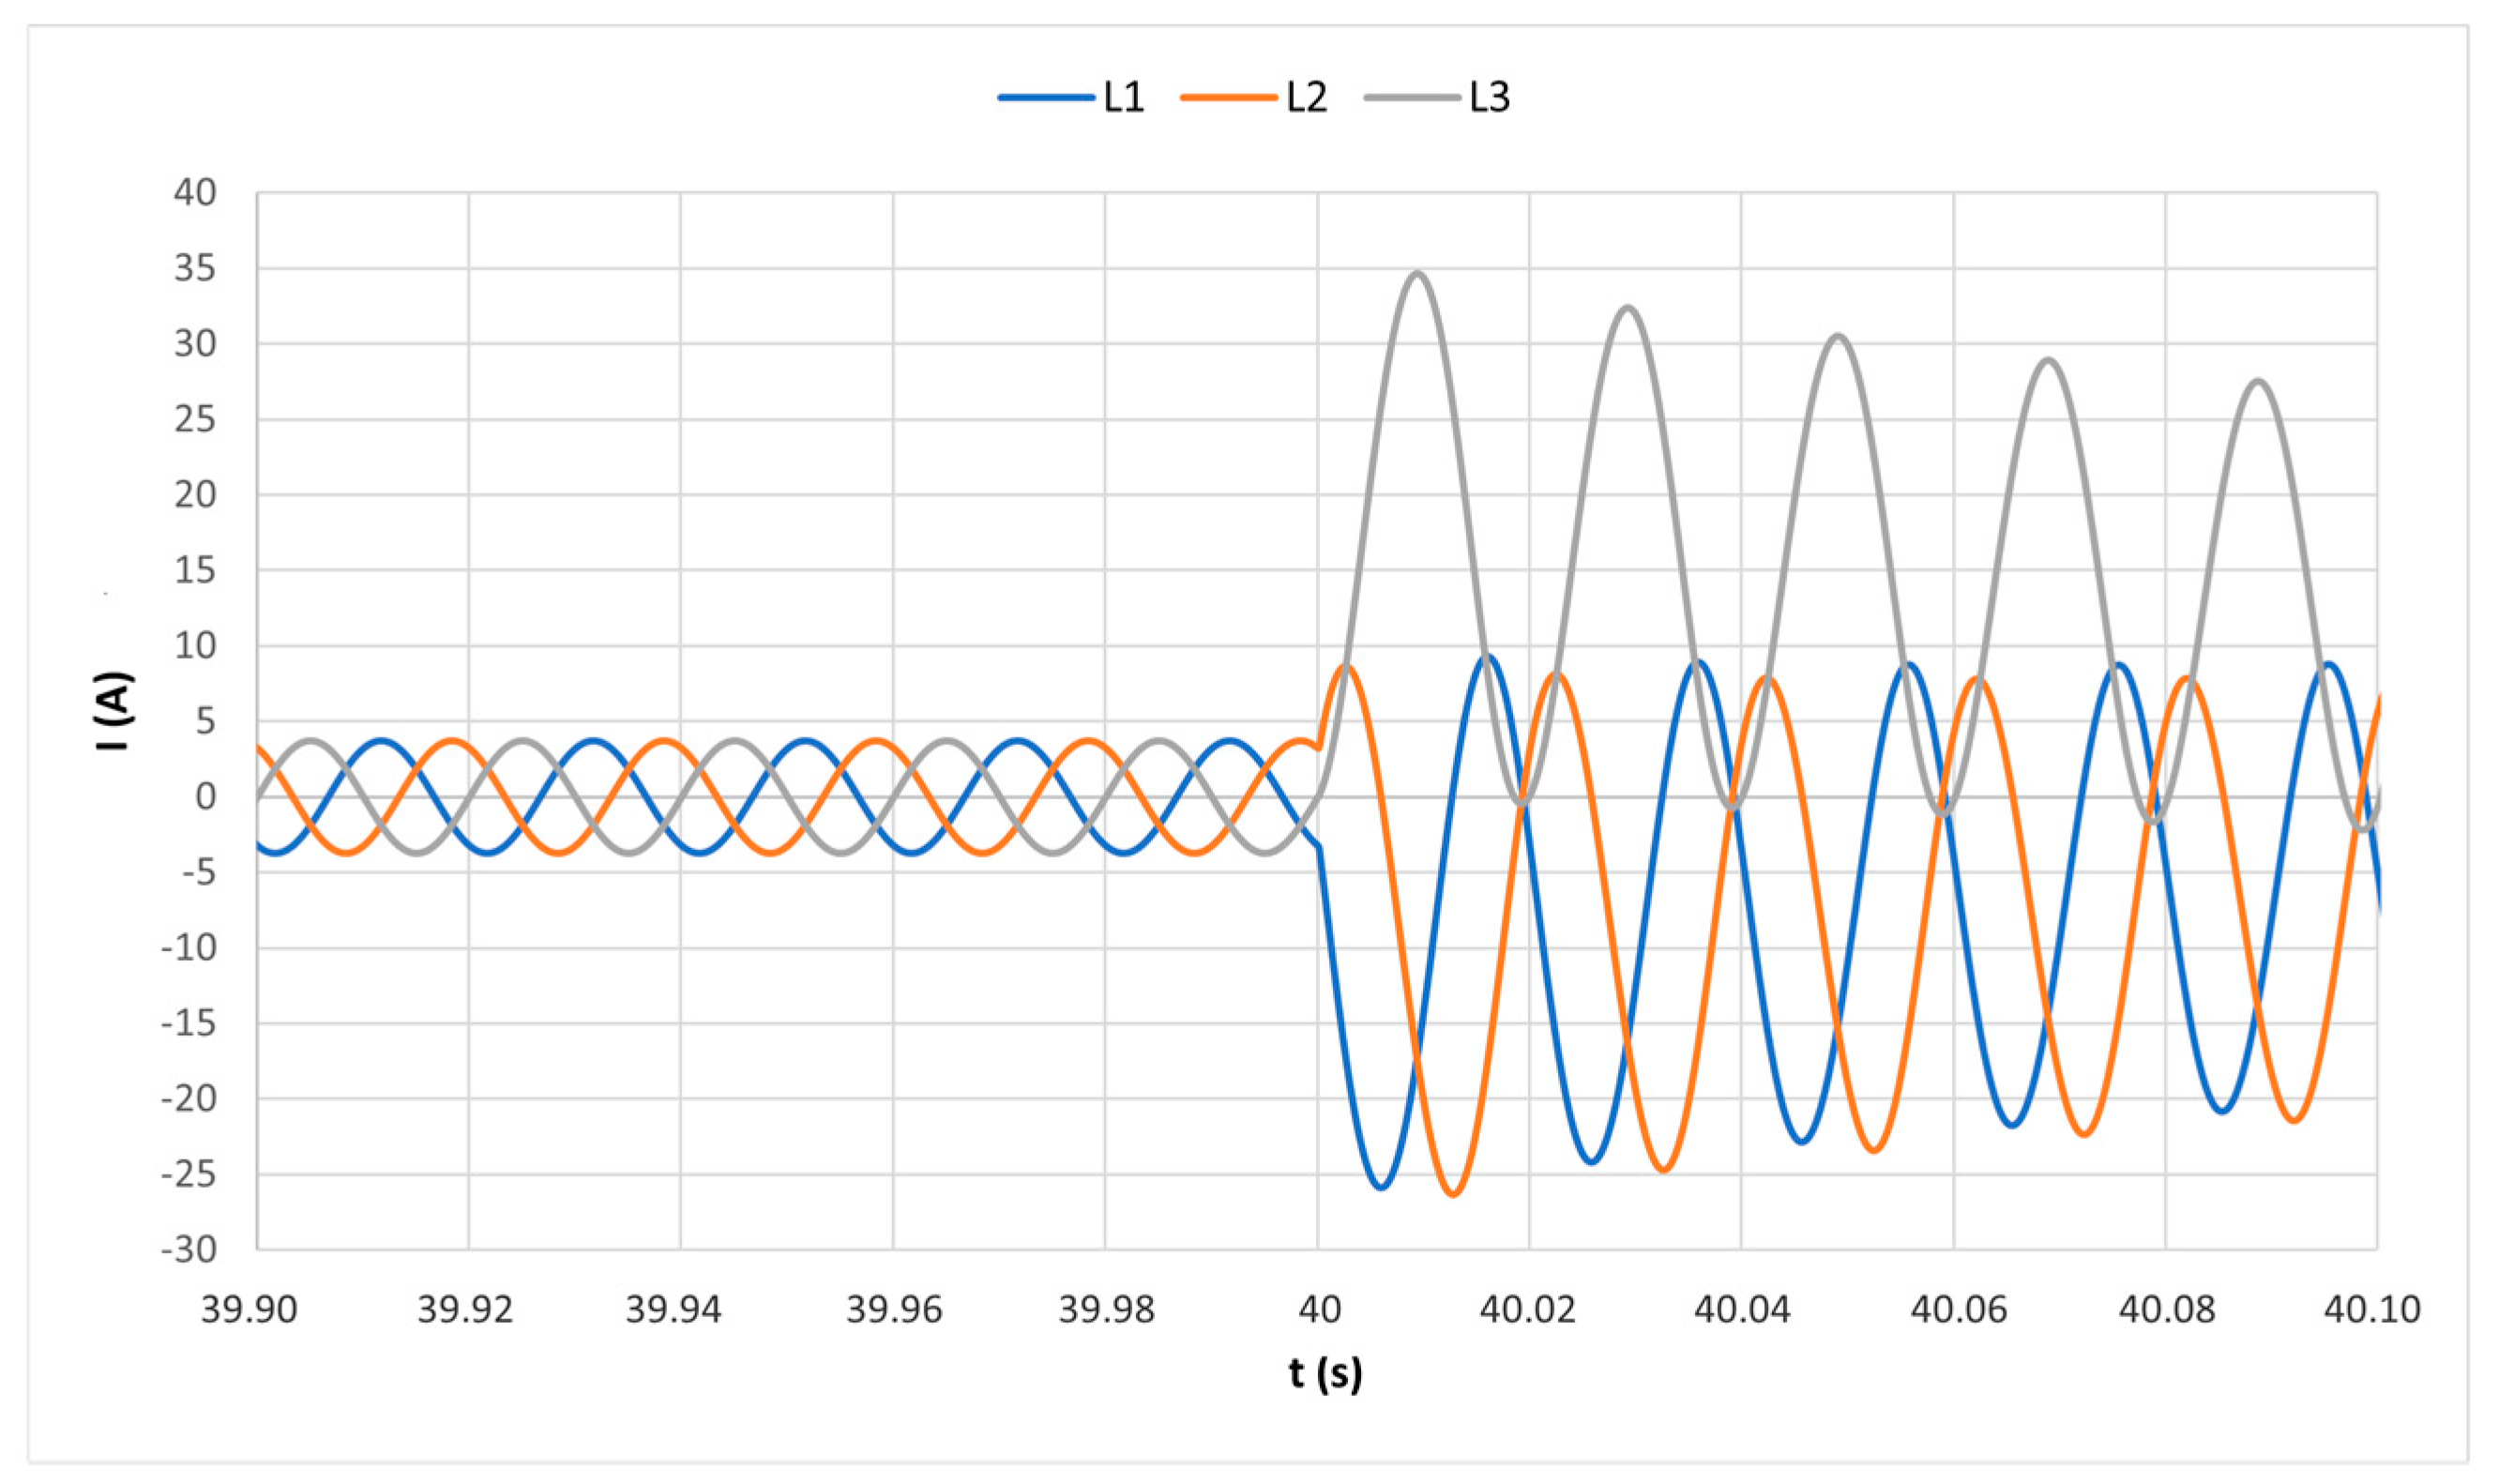
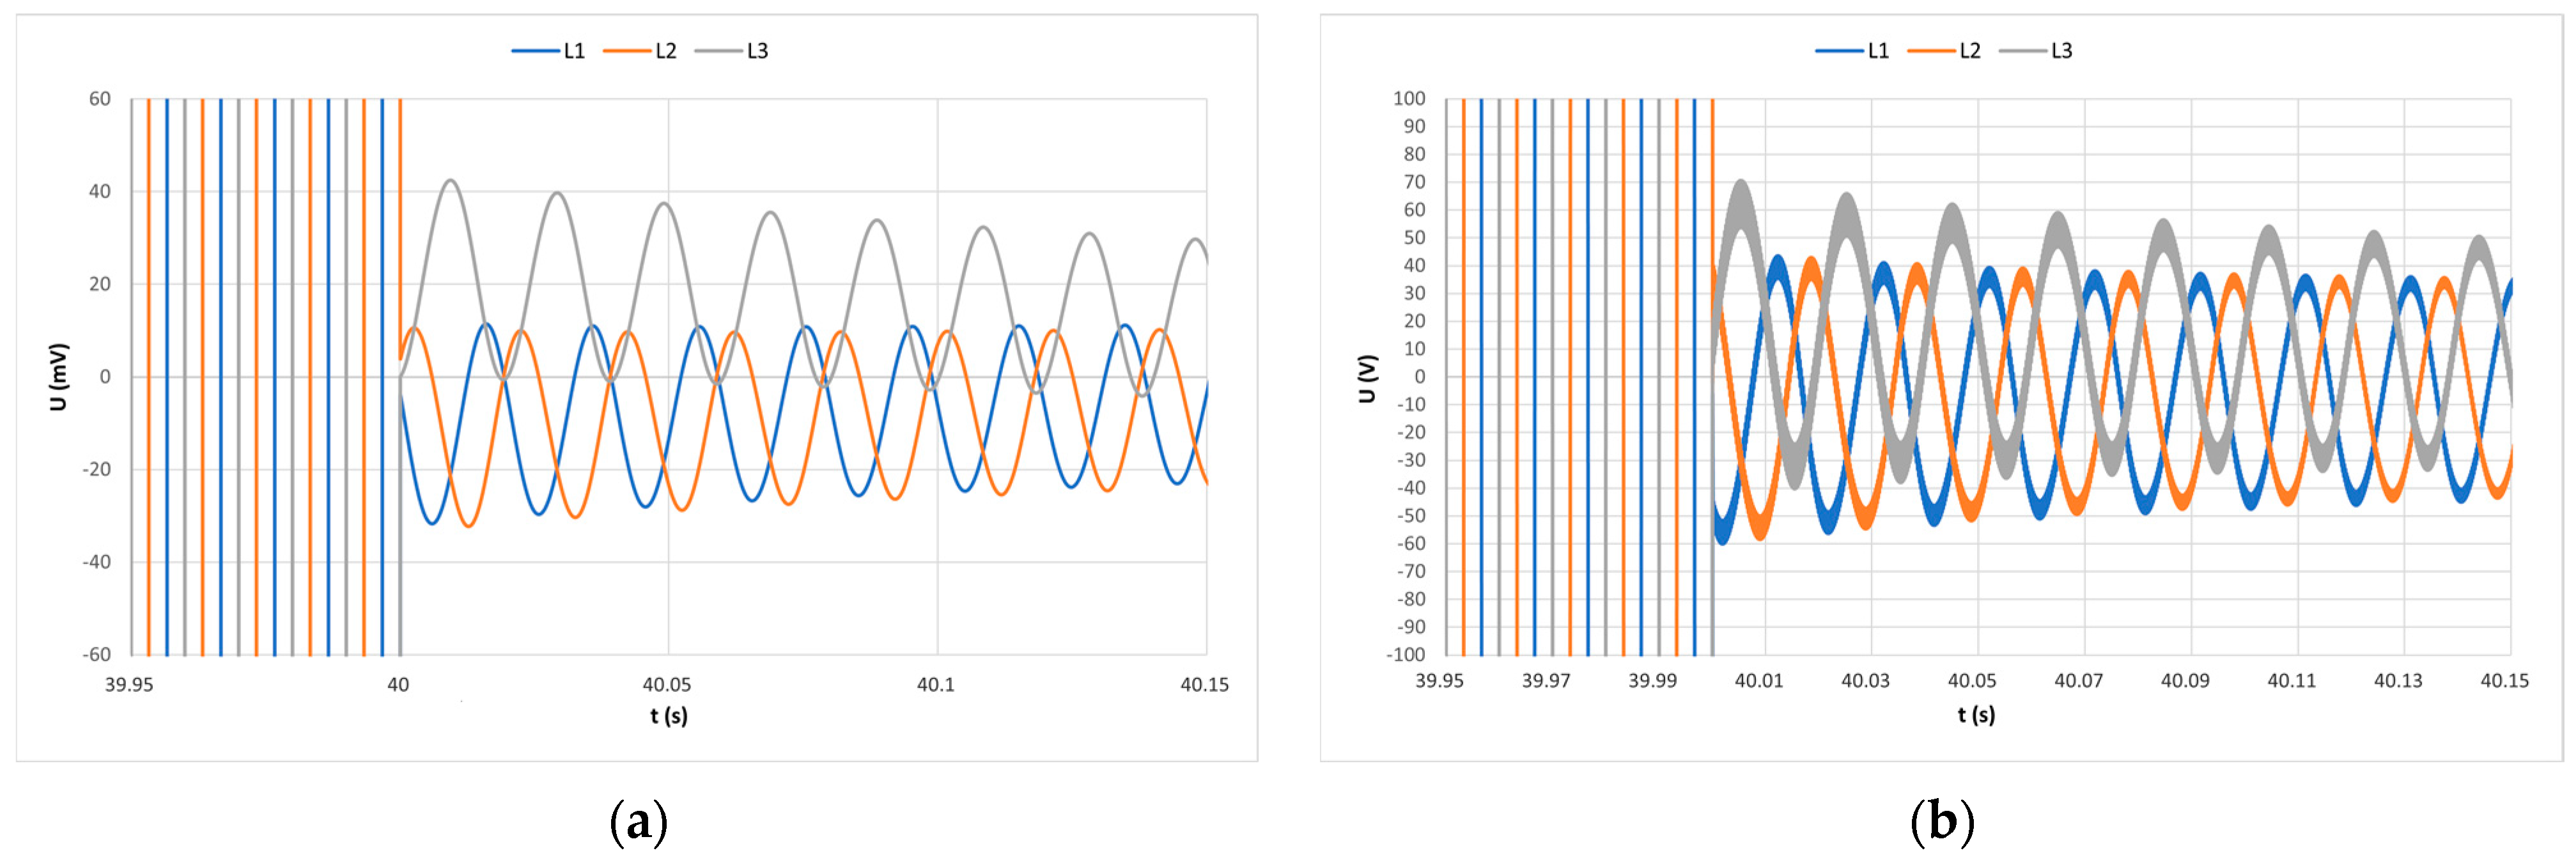
Figure 26 and Figure 27 show a comparison of the operating parameters of the ordinary condition with the fault state. The value of the simulated nominal current was less than 3.723 A and the phase–phase voltage was 21.971 kV. The simulated fault current value stabilized near the source at 12.8 A and the phase–phase voltage decreased to 15.6 mV, but on the load side simulated the fault current value was nearly same as a fault condition on the source and the phase–phase voltage decreased to 42.6 V. The highest impulse simulated value of the fault current near the source was 34.65 A and on the other side was 34.54 A. The measuring point also was shown in the individual models in Section 4.5 and was located near the output of the power source.
Figure 28 shows FFT analysis of the ordinary voltage condition. The generated voltage of this model had a THD value of 0.02%. As shown in the Figure 28, it is possible to see some harmonic near the base frequency value of 50 Hz, the individual values of these interfering elements not exceeding a value of 0.022%.
6. Analysis of Results and Design of a Protected System
6.1. Analysis of Results of Testing Models
As the results show the use of inverters significantly reduced the amount of short-circuit current supplied by the source to the grid, resulting in an impact on protection systems. This is only a part of the problem, as shown in Figure 14 and Figure 20, the occurrence of faults for the inverters caused an immediate limitation of the current and a significant deformation of the sinusoidal course. Compared to hydro and thermal power plants, this is not a problem and the short-circuit current supplied by these sources is several times higher than the nominal current. As shown in Figure 15, Figure 18, Figure 21, Figure 24 and Figure 27, the large voltage drop was caused by a near short circuit, and the hardness of the sources can be clearly seen from the simulated values.
According to the simulated data, we can evaluate the impact of models of the power system, while using many photovoltaic stations or battery systems, there are problems with maintaining the system and there is a risk of the blackout due to a significant drop in voltage and decreasing short-circuit current. When using thermal power plants and hydropower plants supplemented by diesel generators, we had a stable electricity system. For this reason, it is necessary to determine the appropriate mix of energy sources.
Microgrid Model
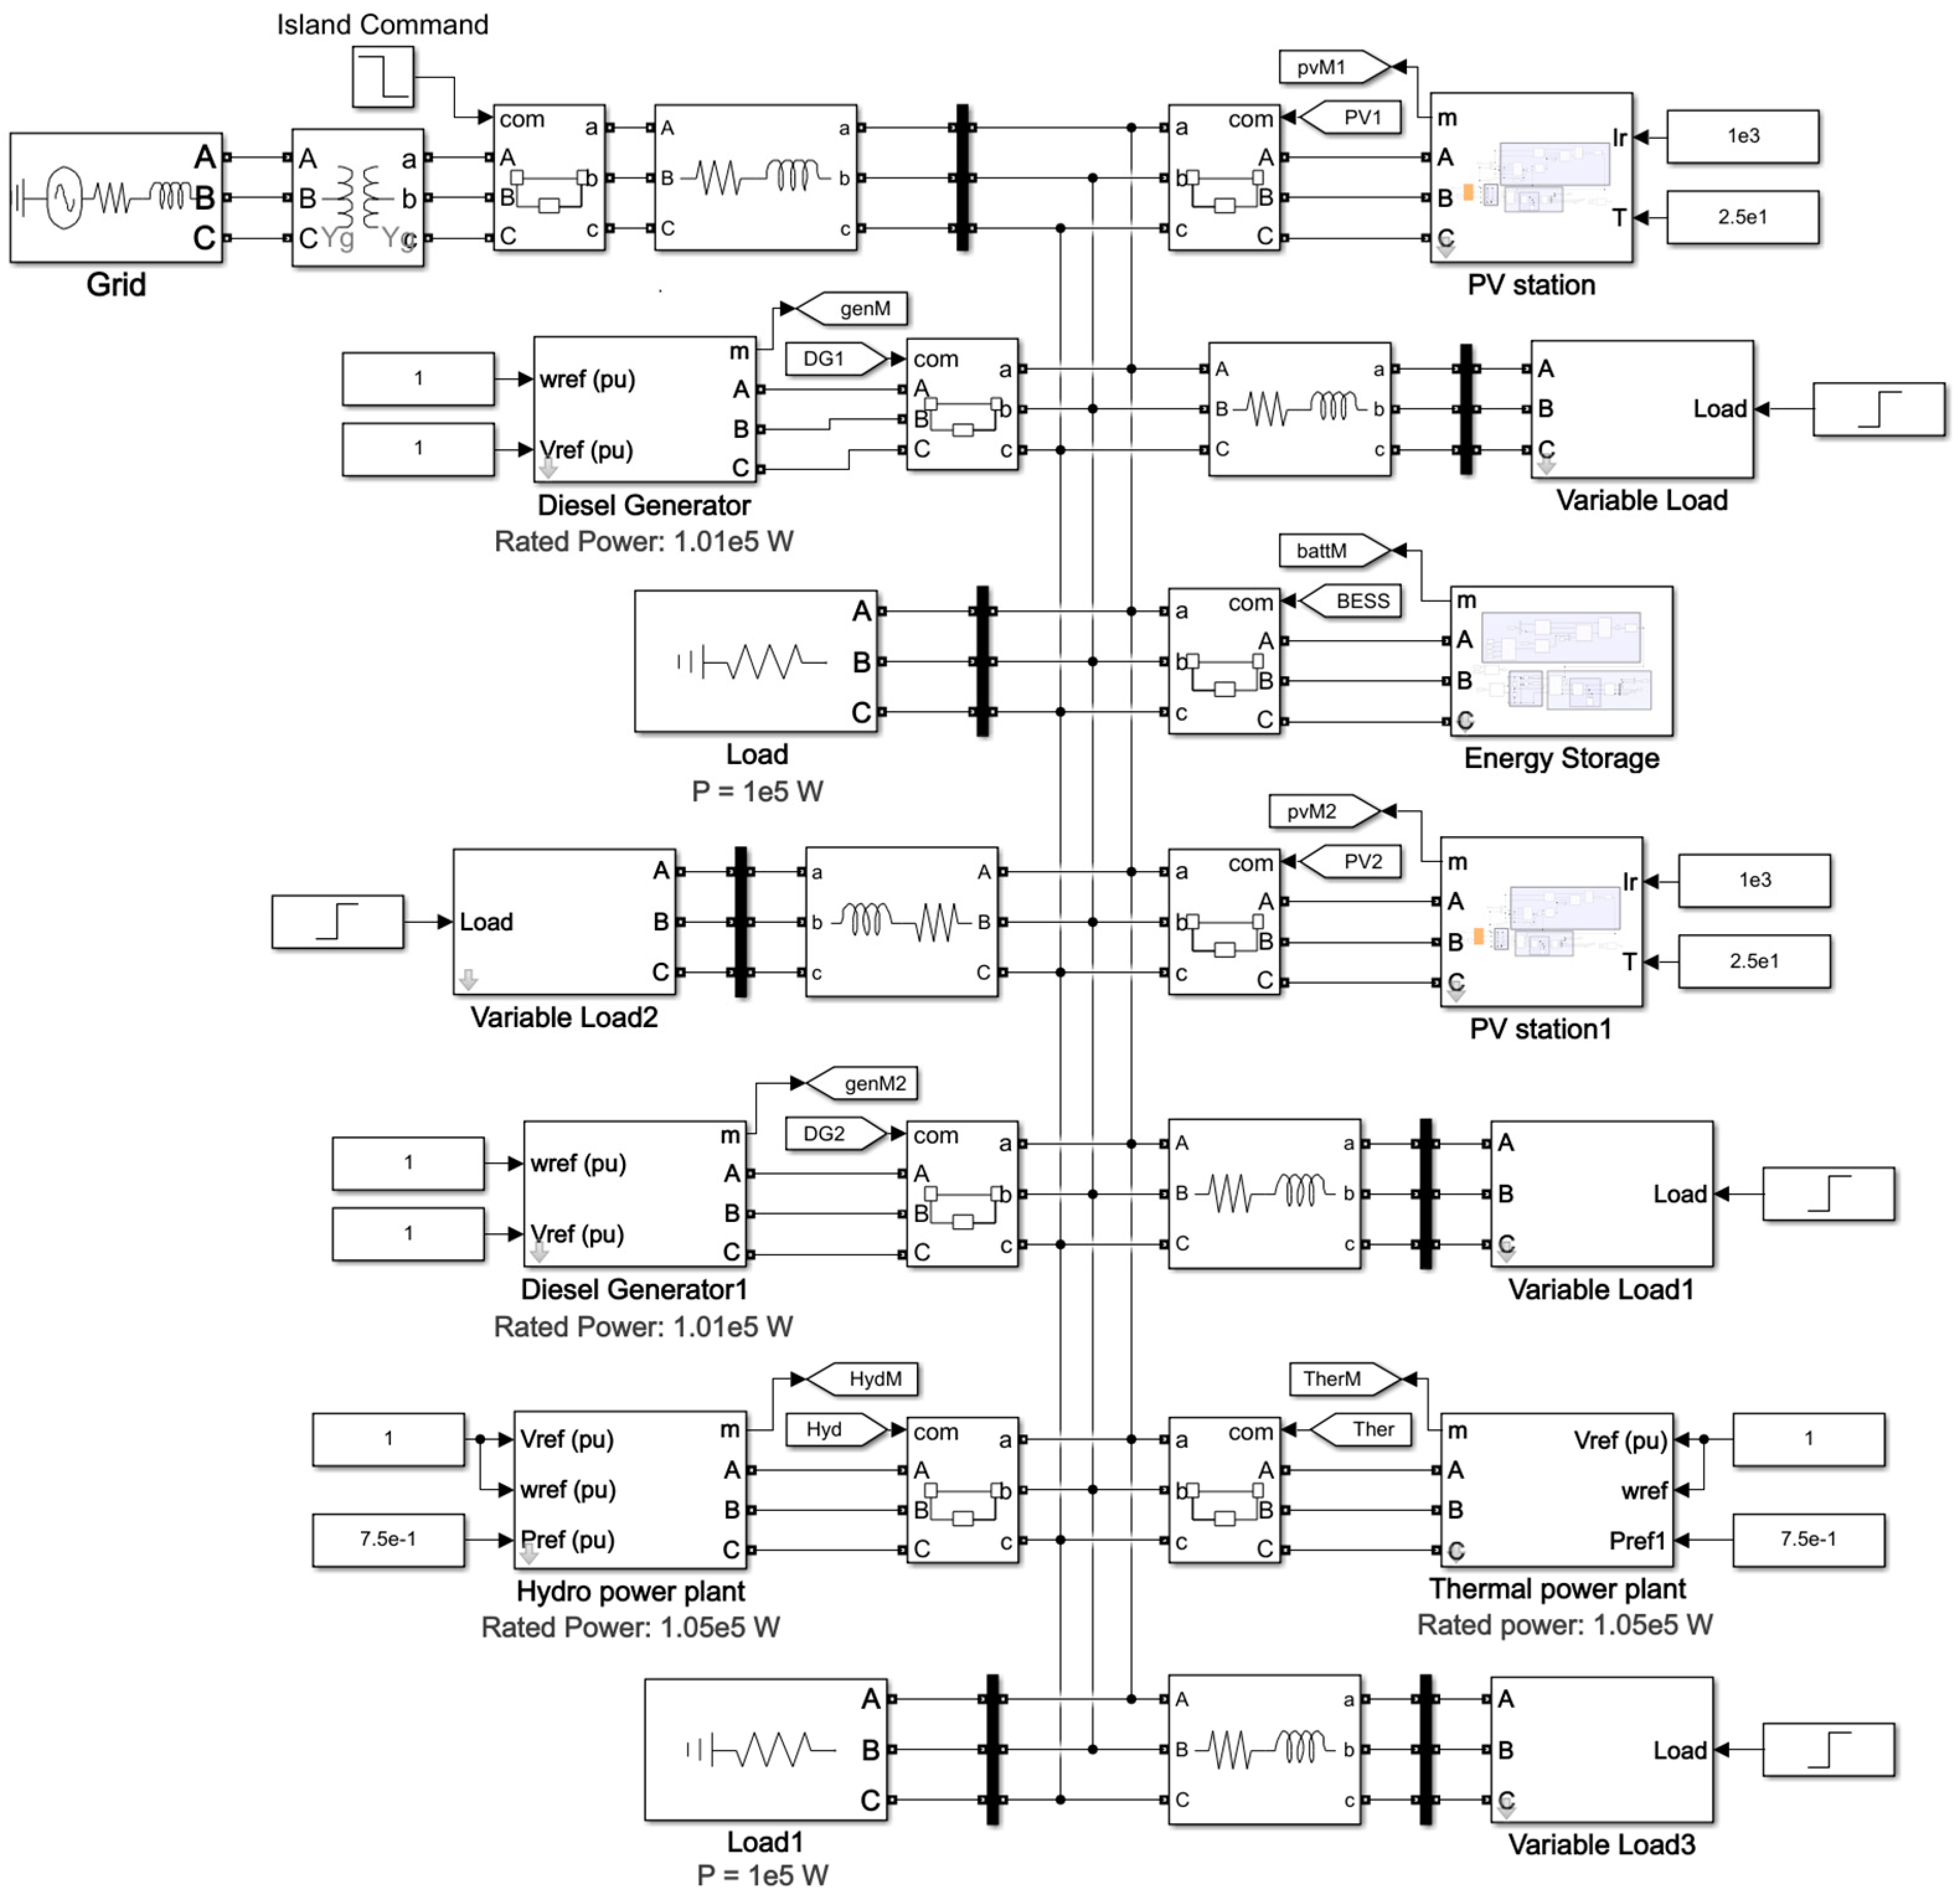
The use of the models of individual renewable sources mentioned in this article can be used to create a model microgrid, where further research will be carried out for fault localization and parameterization of protections, where we will already consider a dynamic load. Figure 29 shown example for microgrid model with RES.
6.2. Design of a Protection System
Conventional protection systems can be used for thermal and hydropower plants together with diesel generators, but for photovoltaic station and battery systems is needed for the development of a new protection system due to their shortcomings for the microgrid systems described in Section 5.1. The current connection conditions and the photovoltaic stations protection system did not provide sufficient protection for the electricity system and in some cases may react incorrectly. Another of the main problems with photovoltaic systems and battery systems was simulated, where the current measuring devices measure the sinusoidal course or the evaluated data according to this course did not correspond to the actual values in the grid. Therefore, there is a need to develop measurement and data processing systems that reliably locate the fault location and disconnect it. Differential protections, impedance protections, and directional overcurrent protections with mutual communication have the most suitable perspective for independent protection of individual sources.
7. Discussion
In the future, it will be necessary to adjust the protection system for renewable energy source, while the protection system will be managed centrally for the local microgrid, to speed up the process of locating the fault and fault elimination. The protection system depends on the operating conditions and the type of resources used for this reason, it is necessary to consider this system as a whole and not separate. The size of the microgrid system will be decisive in this issue, and for Slovakia we could consider the size of the microgrid system according to the current regions or larger parts with the binding of several microgrid systems cooperating with each other. The mix of energy sources of microgrid power supplies must comply with the year-round load diagram and for individual days, as the size of consumption varies from month to month and from the weather the system sources must be flexible enough.
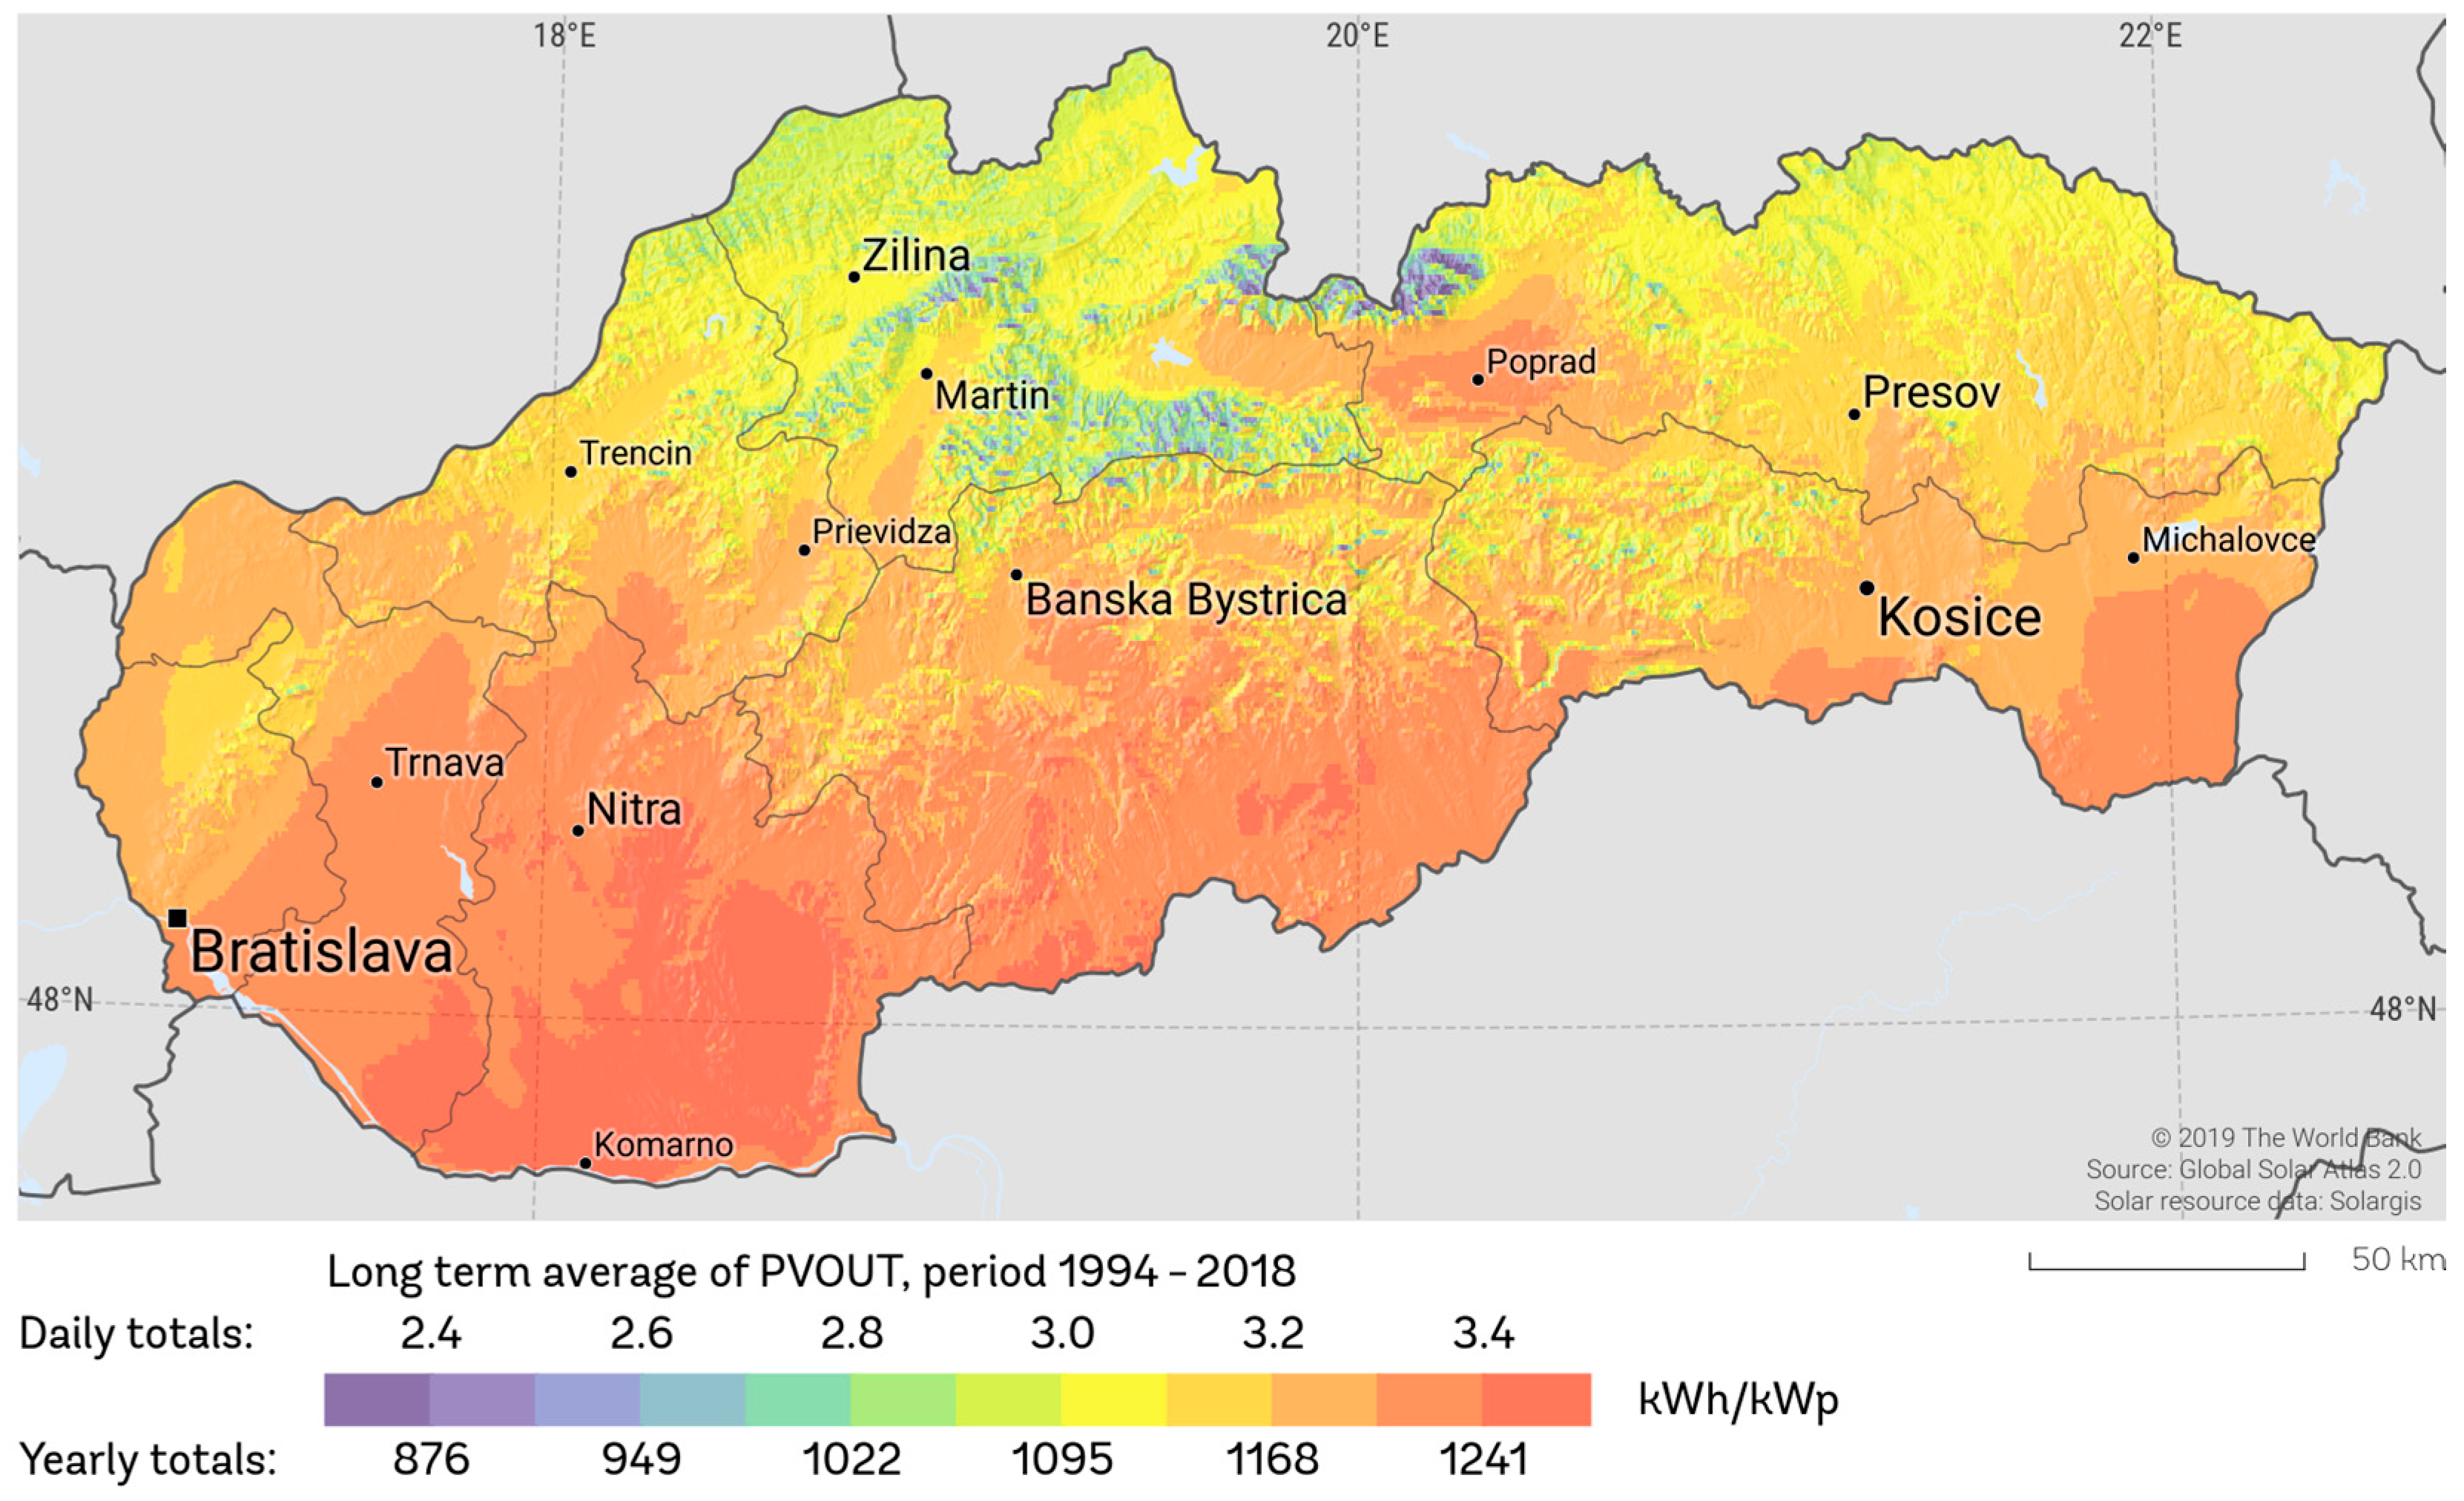
Figure 30 shows perspective places on the territory of the Slovak Republic for the location of photovoltaic stations, where the greatest perspective is in the southern part of Slovakia, while we can get the most electricity from photovoltaic stations in the vicinity of Komarno and Nitra.
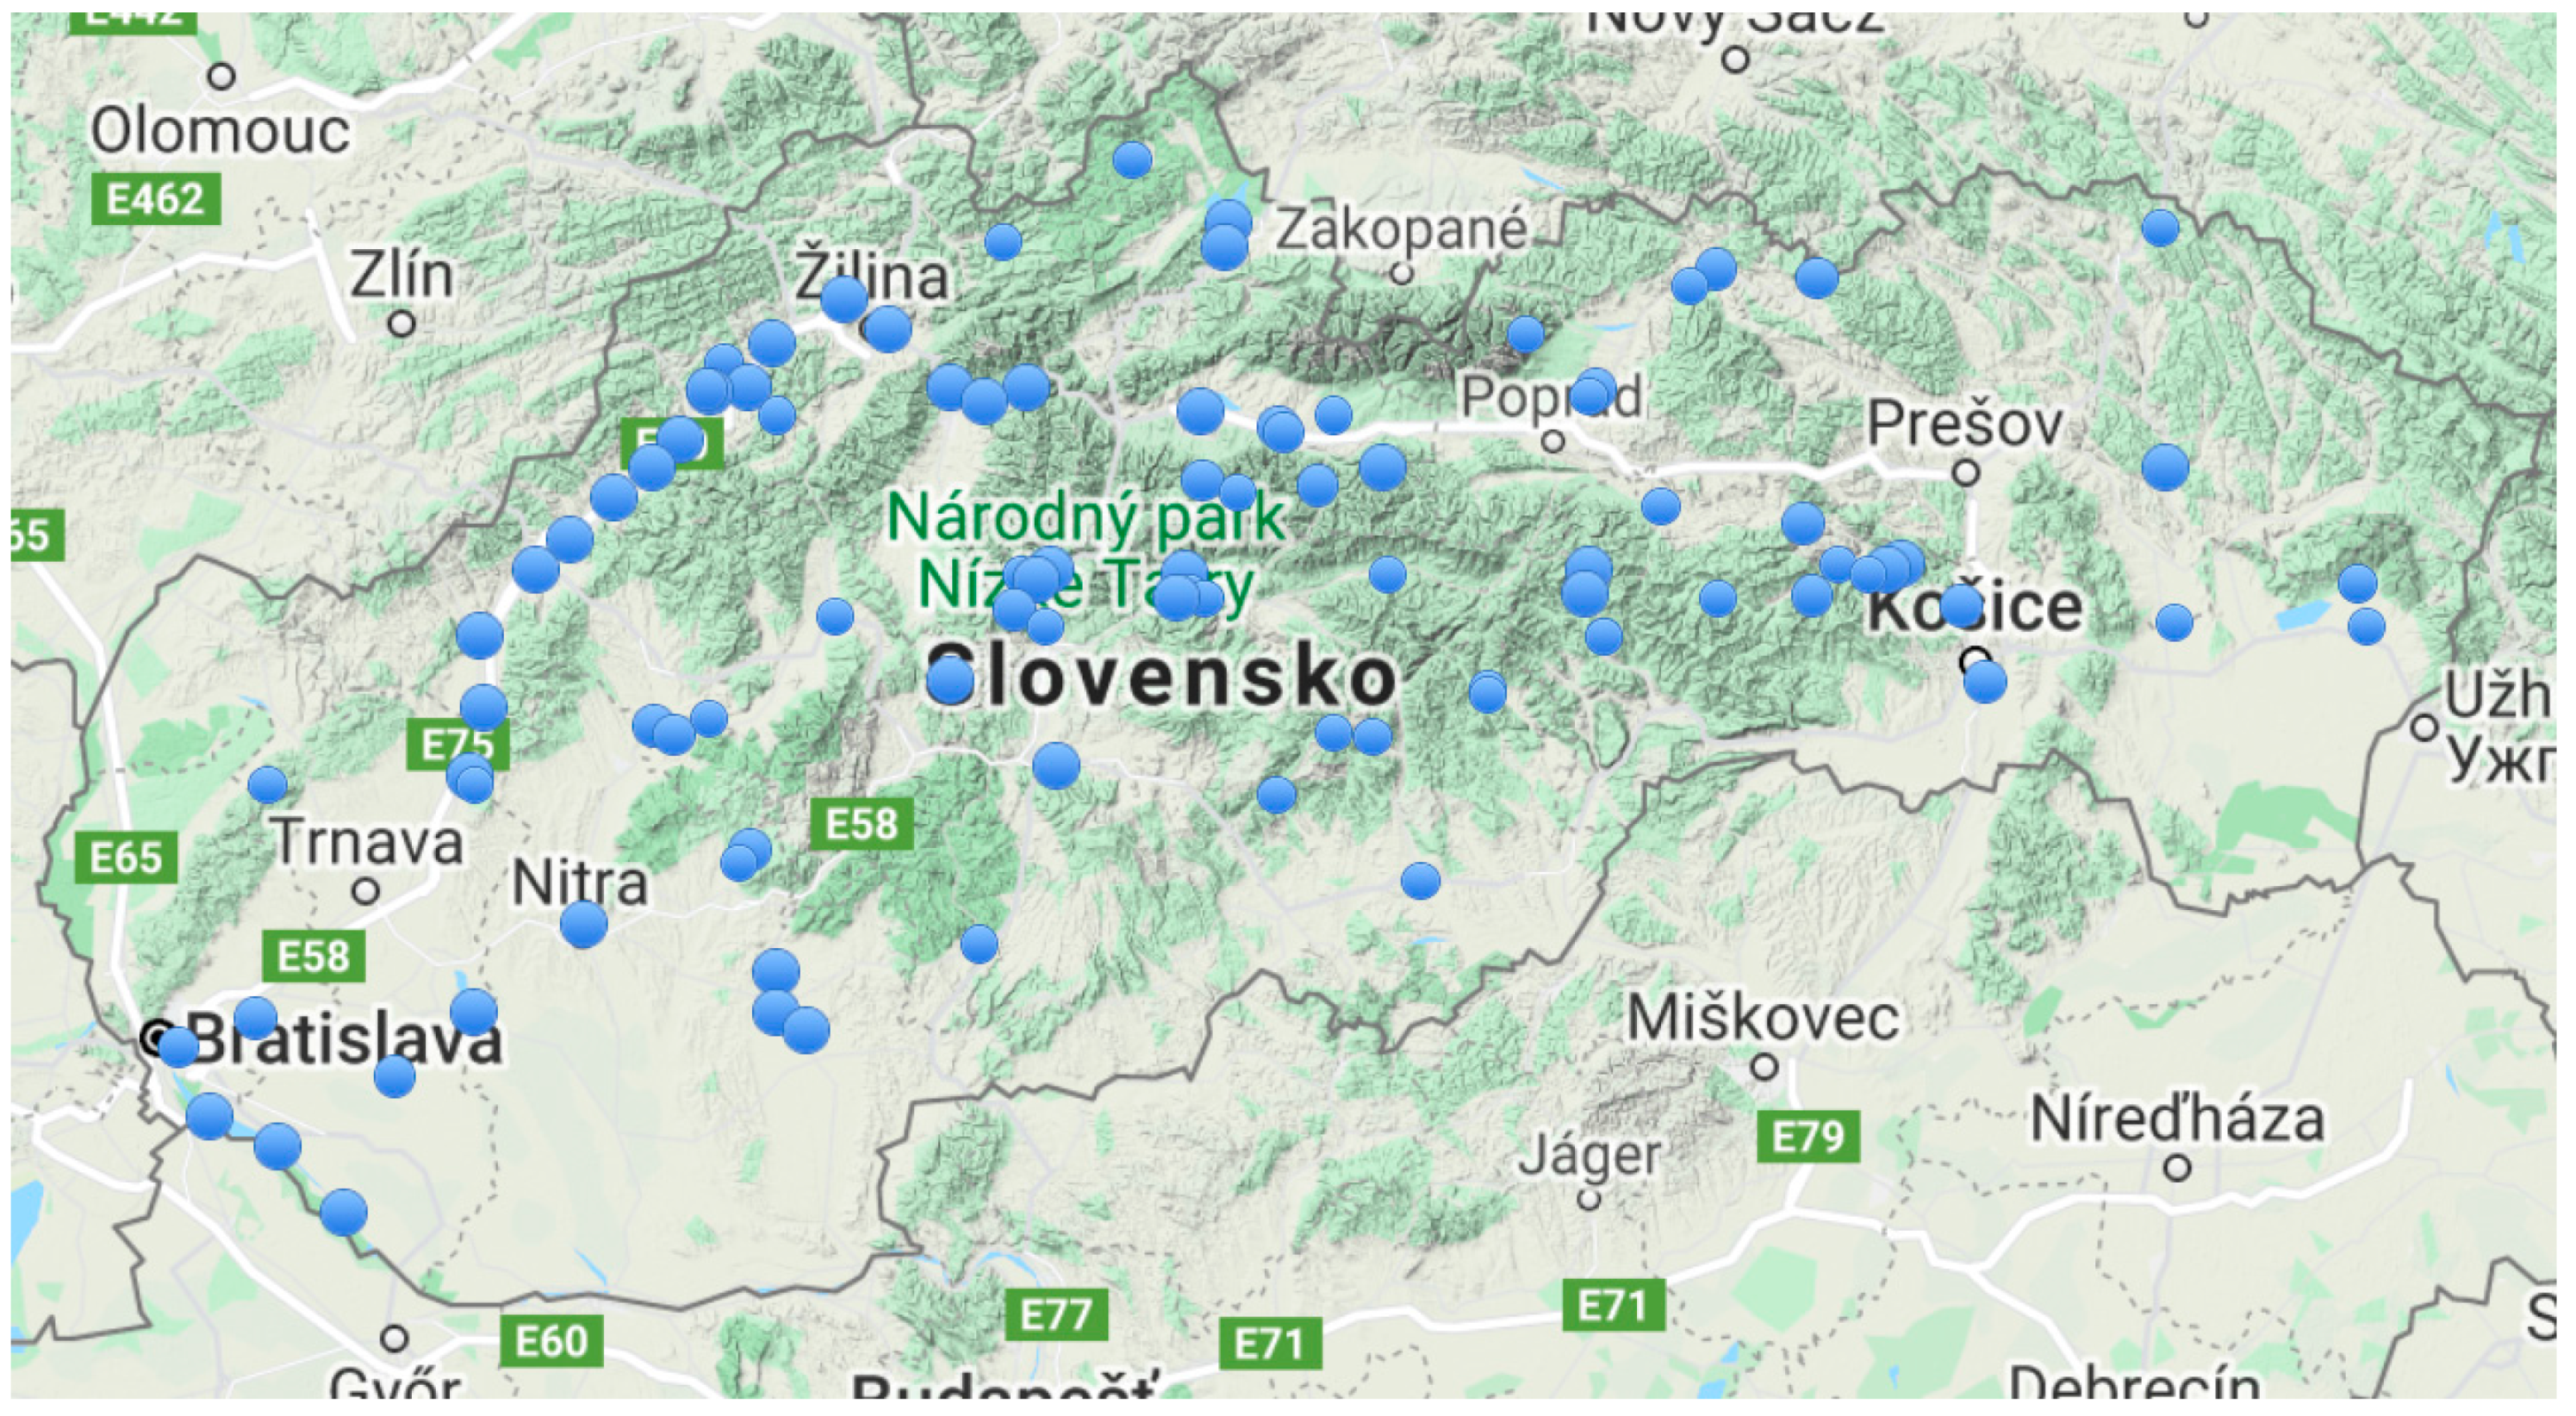
Figure 31 shows actual hydropower plants places on the territory of the Slovak Republic, where the most power plants are placed on the Váh River. The hydropower plants in Slovakia are currently around 108. The largest hydroelectric power plants in Slovakia are Gabčíkovo on the Dunaj River and Pumped-storage hydropower plants the Čierny Váh and the Liptovská Mara.
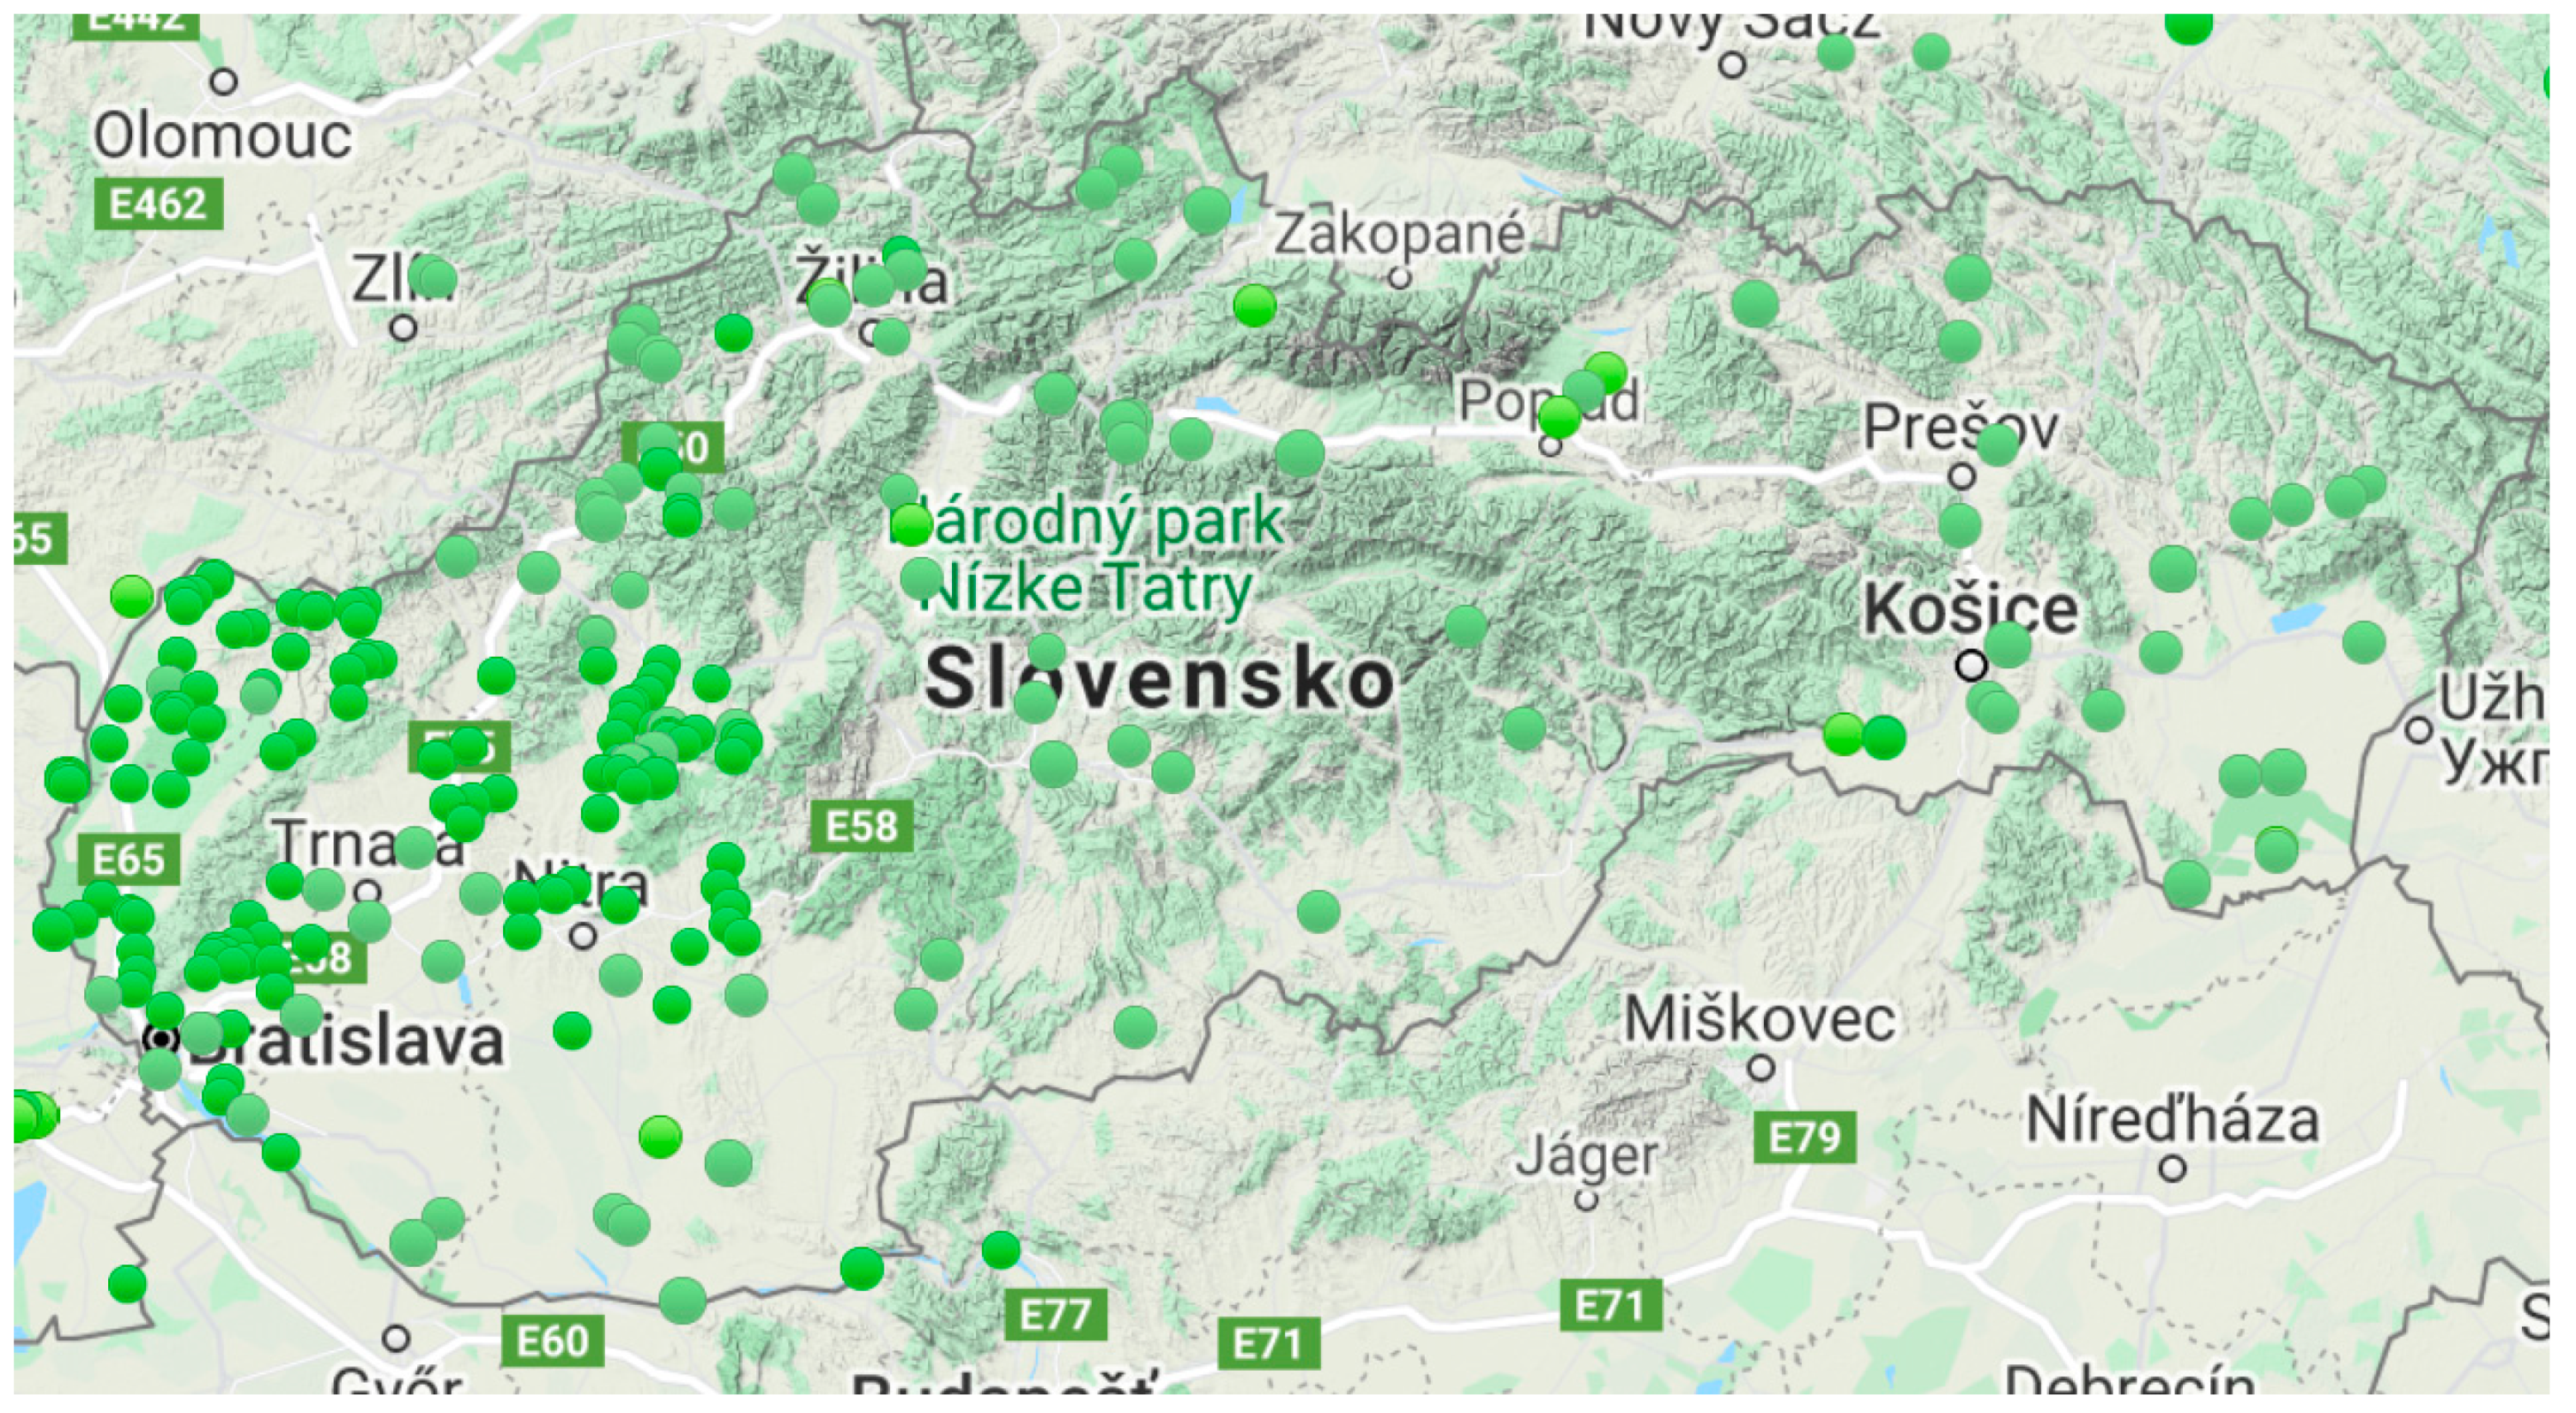
Figure 32 shows actual biogas and biomass power plants places on the territory of the Slovak Republic. The biogas power plants of Slovakia are currently around 90. The biomass power plants of Slovakia are currently around 167.
For this reason, it is appropriate to place battery systems or other power sources in the northern parts of Slovakia. The balanced distribution of power plants as shown in Table 1 is not ideal due to the uneven distribution of power plants in Slovakia, because the western part of Slovakia has several times higher capacity of installed power plants than the eastern part.
8. Conclusions
In the introduction, the current situation of the location of power plants in the Slovak Republic was evaluated, where most of the installed capacity is in Western Slovakia. For this reason, Slovakia is not yet ready to create microgrids. Alternatively, the possibility of trial designs opens only in Western Slovakia as a microgrid model example.
The aim of the publication was to highlight the need for a suitable energy mix of resources and to ensure it in all areas. Determining the appropriate mix of resources, we can proceed to the next step, to determine the size of the territory that will be controlled by the microgrid system. As soon as we successfully apply these steps in practice, we can approach the solution of the problem of the protection system and localization of faults, while the problem of measuring and evaluating the simulated data must be solved.
The article provides design options for the RES model, where the next step will be to design a system using these models as a sample microgrid with the proposed protection system. Perspective control tool in the future to control and monitor microgrid and the smart grid is the wide area management system and control.
Author Contributions
Conceptualization, R.Š., Z.Č. and M.K.; software, R.Š.; data curation, R.Š. Z.Č., and M.K..; formal analysis, R.Š. Z.Č.; funding acquisition, Z.Č. and M.K.; investigation, R.Š. Z.Č.; methodology, R.Š. Z.Č.; project administration, M.K.; resources, M.K.; validation, Z.Č.; visualization, R.Š.; supervision, M.K.; writing—original draft, R.Š. Z.Č.. All authors have read and agreed to the published version of the manuscript.
Funding
This research was funded by the Slovak Research and Development Agency APVV-19-0576 and the Ministry of Education, Science, Research and Sport of the Slovak Republic and the Slovak Academy of Sciences VEGA 1/0757/21.
Institutional Review Board Statement
Not applicable.
Informed Consent Statement
Not applicable.
Data Availability Statement
Not applicable.
Conflicts of Interest
The authors declare no conflict of interest.
References
- Ng, C.H.; Logenthiran, T.; Woo, W.L. Intelligent distributed smart grid network—Reconfiguration. In Proceedings of the 2015 IEEE Innovative Smart Grid Technologies-Asia (ISGT ASIA), Bangkok, Thailand, 3–6 November 2015; pp. 1–6. [Google Scholar] [CrossRef]
- Štefko, R. Protection System for Microgrid and Smart Grid Systems; SCYR: Košice, Slovakia, 2021; pp. 23–26. ISBN 978-80-553-3904-7. [Google Scholar]
- Jin, X.; Zhang, Y.; Wang, X. Strategy and coordinated development of strong and smart grid. In IEEE PES Innovative Smart Grid Technologies; Institute of Electrical and Electronics Engineers (IEEE): Tianjin, China, 2012; pp. 1–4. [Google Scholar]
- Che, L.; Khodayar, M.E.; Shahidehpour, M. Adaptive Protection System for Microgrids: Protection practices of a functional microgrid system. IEEE Electrif. Mag. 2014, 2, 66–80. [Google Scholar] [CrossRef]
- Aryblia, R.M.; Bertram, A.; Bolle, A.; Corovessi, F.; Dembski, D.; Fouquet, P.; Giňová, K.; Księżopolski, N.; Mantzaris, J.; Ondřich, J.; et al. Facts and Figures about Renewables in Europe. In Energy Atlas; Heinrich Böll Foundation, Berlin, Germany, Friends of the Earth Europe, Brussels, Belgium, European Renewable Energies Federation, Brussels, BelgiumGreen European Foundation, Luxembour, 2018. Available online: https://gef.eu/wp-content/uploads/2018/04/energyatlas2018_facts-and-figures-renewables-europe.pdf (accessed on 3 April 2021).
- Kharrich, M.; Kamel, S.; Alghamdi, A.; Eid, A.; Mosaad, M.; Akherraz, M.; Abdel-Akher, M. Optimal Design of an Isolated Hybrid Microgrid for Enhanced Deployment of Renewable Energy Sources in Saudi Arabia. Sustainability 2021, 13, 4708. [Google Scholar] [CrossRef]
- Choi, Y.-J.; Oh, B.-C.; Acquah, M.; Kim, D.-M.; Kim, S.-Y. Optimal Operation of a Hybrid Power System as an Island Microgrid in South-Korea. Sustainability 2021, 13, 5022. [Google Scholar] [CrossRef]
- Rosa, C.D.O.C.S.; Costa, K.A.; Christo, E.D.S.; Bertahone, P.B. Complementarity of Hydro, Photovoltaic, and Wind Power in Rio de Janeiro State. Sustainability 2017, 9, 1130. [Google Scholar] [CrossRef] [Green Version]
- Latif, S.A.; Chiong, M.; Rajoo, S.; Takada, A.; Chun, Y.-Y.; Tahara, K.; Ikegami, Y. The Trend and Status of Energy Resources and Greenhouse Gas Emissions in the Malaysia Power Generation Mix. Energies 2021, 14, 2200. [Google Scholar] [CrossRef]
- Puspitarini, H.D.; François, B.; Baratieri, M.; Brown, C.; Zaramella, M.; Borga, M. Complementarity between Combined Heat and Power Systems, Solar PV and Hydropower at a District Level: Sensitivity to Climate Characteristics along an Alpine Transect. Energies 2020, 13, 4156. [Google Scholar] [CrossRef]
- Pereira, J.; Ferreira, R.A.; Sousa, J.A.M.; Lagarto, J.; Martins, A.; Martins, A. Optimizing the renewable generation mix in the Portuguese power system based on temporal and spatial diversity. In Proceedings of the 11th International Conference on the European Energy Market (EEM14), Krakow, Poland, 28–30 May 2014; pp. 1–5. [Google Scholar]
- Nath, A.; Barua, S.; Mohammad, N. Electric Power Generation-Mix for Bangladesh and Its Future. In Proceedings of the 2019 International Conference on Electrical, Computer and Communication Engineering (ECCE), Cox’sBazar, Bangladesh, 7–9 February 2019; pp. 1–4. [Google Scholar]
- Ahmed, A.; Jiang, T. Operation Management of Power Grid System with Renewable Energy Sources and Energy Storage System Integrations. In Proceedings of the 2018 2nd IEEE Conference on Energy Internet and Energy System Integration (EI2), Beijing, China, 20–22 October 2018; pp. 1–6. [Google Scholar]
- Kadar, P. Power mix optimization on risk base. In Proceedings of the 2015 18th International Conference on Intelligent System Application to Power Systems (ISAP), Porto, Portugal, 11–16 September 2015; pp. 1–5. [Google Scholar]
- Hamedi, K.; Sadeghi, S.; Esfandi, S.; Azimian, M.; Golmohamadi, H. Eco-Emission Analysis of Multi-Carrier Microgrid Integrated with Compressed Air and Power-to-Gas Energy Storage Technologies. Sustainability 2021, 13, 4681. [Google Scholar] [CrossRef]
- Muriithi, G.; Chowdhury, S. Optimal Energy Management of a Grid-Tied Solar PV-Battery Microgrid: A Reinforcement Learning Approach. Energies 2021, 14, 2700. [Google Scholar] [CrossRef]
- Slovak Electricity Transmission System. “Ročenka SED 2019”, in SEPSAS. 2019. Available online: https://www.sepsas.sk/media/4171/rocenka-sed-2019-1.pdf (accessed on 3 March 2021).
- Slovak Electricity Transmission System. “Grid Maps”, in SEPSAS. Available online: https://www.sepsas.sk/en_SchemaSiete.asp?kod=107 (accessed on 3 March 2021).
- Slovak Power Plants. “Typy Elektrární”, in SEAS. Available online: https://www.seas.sk/typy-elektrarni (accessed on 3 May 2021).
- Slovak Power Plants. “Cenové Rozhodnutia ÚRSO”, in SEAS. Available online: https://www.seas.sk/cenove-rozhodnutia-urso (accessed on 3 March 2021).
- Redaction. “Vodné Elektrárne v SR”, in Energie-Portal. 2016. Available online: https://www.energie-portal.sk/Dokument/vodne-elektrarne-v-sr-100207.aspx (accessed on 3 March 2021).
- Redaction. “Bioplynové Stanice v SR”, in Energie-Portal. 2014. Available online: https://www.energie-portal.sk/Dokument/bioplynove-stanice-v-sr-100191.aspx (accessed on 3 March 2021).
- Redaction. “Fotovoltické Elektrárne v SR”, in Energie-Portal. 2014. Available online: https://www.energie-portal.sk/Dokument/fotovolticke-elektrarne-v-sr-100461.aspx (accessed on 3 March 2021).
- Slovak Renewable Energy Agency, “Obnoviteľné Zdroje Energie”. Available online: http://skrea.sk/obnovitelne-zdroje-energie/ (accessed on 3 March 2021).
- “Estrategie”, in Umweltbundesamt. 2013. Available online: https://www.umweltbundesamt.at/fileadmin/site/themen/energie/kernenergie/verfahren/slowakei/sk_estrategie2013/priloha15.pdf (accessed on 3 March 2021).
- McDowall, J. “Taking Microgrids to the Next Level with Li-ion Energy Storage”, in Altenergymag.2018. Available online: https://www.altenergymag.com/article/2018/03/taking-microgrids-to-the-next-level-with-li-ion-energy-storage/28049 (accessed on 3 March 2021).
- Pasqua, C. “Saft Enables Microgrid to Harness the Midnight Sun for Arctic Circle community”, in Saft, France. Article-Number: No 21959-1216-2. 2016. Available online: https://www.saftbatteries.com/case-studies/saft-enables-microgrid-harness-midnight-sun-arctic-circle-community-0 (accessed on 3 March 2021).
- The World Bank. “Global Solar Atlas 2.0”, Solar Resource Data: Solargis. 2019. Available online: https://solargis.com/maps-and-gis-data/download/slovakia (accessed on 4 March 2021).
Figure 1.
Comparison of the current power network with the smart grid [5].
Figure 1.
Comparison of the current power network with the smart grid [5].

Figure 2.
Grid map of the power system of The Slovak Republic for the state of 2021 [18].
Figure 2.
Grid map of the power system of The Slovak Republic for the state of 2021 [18].

Figure 3.
Division of the Slovak Republic according to electricity distributors.

Figure 4.
Scheme of distribution of energy system management.


Figure 6.
Microgrid working system.

Figure 7.
Schematic of the microgrid system.

Figure 8.
Schematic model of the photovoltaic station.

Figure 9.
Schematic model of diesel generator.

Figure 10.
Schematic model of battery energy storage system.

Figure 11.
Schematic model of the thermal power plant.

Figure 12.
Schematic model of hydropower plant.

Figure 13.
Modeled scheme of Simulink.

Figure 14.
Simulated values of PV station model currents during a 3-Ph ground fault condition at the source.
Figure 14.
Simulated values of PV station model currents during a 3-Ph ground fault condition at the source.

Figure 15.
Simulated values of PV station model voltages during a 3-Ph ground fault condition at: (a) the source; (b) the end of transmission line.
Figure 15.
Simulated values of PV station model voltages during a 3-Ph ground fault condition at: (a) the source; (b) the end of transmission line.

Figure 16.
FFT analysis of output voltage of the PV station model.

Figure 17.
Simulated values of diesel generator model currents during a 3-Ph ground fault condition at the source.
Figure 17.
Simulated values of diesel generator model currents during a 3-Ph ground fault condition at the source.

Figure 18.
Simulated values of diesel generator model voltages during a 3-Ph ground fault condition at: (a) the source; (b) the end of transmission line.
Figure 18.
Simulated values of diesel generator model voltages during a 3-Ph ground fault condition at: (a) the source; (b) the end of transmission line.

Figure 19.
FFT analysis of output power of diesel generator model.

Figure 20.
Simulated values of battery energy storage system model currents during a 3-Ph ground fault condition at the source.
Figure 20.
Simulated values of battery energy storage system model currents during a 3-Ph ground fault condition at the source.

Figure 21.
Simulated values of battery energy storage system model voltages during a 3-Ph ground fault condition at: (a) the source; (b) the end of transmission line.
Figure 21.
Simulated values of battery energy storage system model voltages during a 3-Ph ground fault condition at: (a) the source; (b) the end of transmission line.

Figure 22.
FFT analysis of output power of the battery energy storage system model.

Figure 23.
Simulated values of thermal power plant model currents during a 3-Ph ground fault condition at the source.
Figure 23.
Simulated values of thermal power plant model currents during a 3-Ph ground fault condition at the source.

Figure 24.
Simulated values of thermal power plant model voltages during a 3-Ph ground fault condition at: (a) the source; (b) the end of transmission line.
Figure 24.
Simulated values of thermal power plant model voltages during a 3-Ph ground fault condition at: (a) the source; (b) the end of transmission line.

Figure 25.
FFT analysis of output power of thermal power plant model.

Figure 26.
Simulated values of hydropower plant model currents during a 3-Ph ground fault condition at the source.
Figure 26.
Simulated values of hydropower plant model currents during a 3-Ph ground fault condition at the source.

Figure 27.
Simulated values of hydropower plant model voltages during a 3-Ph ground fault condition at: (a) the source; (b) the end of transmission line.
Figure 27.
Simulated values of hydropower plant model voltages during a 3-Ph ground fault condition at: (a) the source; (b) the end of transmission line.

Figure 28.
FFT analysis of output power of hydropower plant model.

Figure 29.
Microgrid model with renewable energy sources.

Figure 30.
Photovoltaic power potential of Slovak Republic [28].
Figure 30.
Photovoltaic power potential of Slovak Republic [28].

Figure 31.
Location of hydropower plants of Slovak Republic [24].
Figure 31.
Location of hydropower plants of Slovak Republic [24].

Figure 32.
Location of biogas and biomass power plants of Slovak Republic [24].
Figure 32.
Location of biogas and biomass power plants of Slovak Republic [24].


| Energy Source | Western Slovakia | Middle Slovakia | Eastern Slovakia |
|---|---|---|---|
| Nuclear | 1950 MW | 0 MW | 0 MW |
| Hydro | 1166.2 MW | 1289.98 MW | 111.19 MW |
| Hard coal | 0 MW | 0 MW | 220 MW |
| Lignite | 220 MW | 81.77 MW | 0 MW |
| Natural gas | 903.3 MW | 18.9 MW | 170.5 MW |
| Oil | 45.9 MW | 32 MW | 0.72 MW |
| Mix fuels | 46 MW | 35 MW | 320.5 MW |
| Solar | 130.39 MW | 231.32 MW | 128.54 MW |
| Biomass | 43.67 MW | 56.78 MW | 52.39 MW |
| Biofuel | 44.41 MW | 33.65 MW | 24.82 MW |
| Wind | 3.14 MW | 0 MW | 0 MW |
| Other RES | 4.66 MW | 0 MW | 0 MW |
| Other | 6.3 MW | 0 MW | 6 MW |
| Total | 4563.46 MW | 1779.39 MW | 1034.66 MW |
Publisher’s Note: MDPI stays neutral with regard to jurisdictional claims in published maps and institutional affiliations. |
© 2021 by the authors. Licensee MDPI, Basel, Switzerland. This article is an open access article distributed under the terms and conditions of the Creative Commons Attribution (CC BY) license (https://creativecommons.org/licenses/by/4.0/).
Share and Cite
MDPI and ACS Style
Štefko, R.; Čonka, Z.; Kolcun, M. Case Study of Power Plants in the Slovak Republic and Construction of Microgrid and Smart Grid. Appl. Sci. 2021, 11, 5252. https://0-doi-org.brum.beds.ac.uk/10.3390/app11115252
AMA Style
Štefko R, Čonka Z, Kolcun M. Case Study of Power Plants in the Slovak Republic and Construction of Microgrid and Smart Grid. Applied Sciences. 2021; 11(11):5252. https://0-doi-org.brum.beds.ac.uk/10.3390/app11115252
Chicago/Turabian StyleŠtefko, Róbert, Zsolt Čonka, and Michal Kolcun. 2021. "Case Study of Power Plants in the Slovak Republic and Construction of Microgrid and Smart Grid" Applied Sciences 11, no. 11: 5252. https://0-doi-org.brum.beds.ac.uk/10.3390/app11115252
Note that from the first issue of 2016, this journal uses article numbers instead of page numbers. See further details here.