
Modeling of Ductile Fracture for SS275 Structural Steel Sheets


1
University Core Research Center for Disaster-Free and Safe Ocean City Construction, Dong-A University, Busan 49315, Korea
2
Department of Architectural Engineering, Dong-A University, Busan 49315, Korea
*
Author to whom correspondence should be addressed.
Appl. Sci. 2021, 11(12), 5392; https://0-doi-org.brum.beds.ac.uk/10.3390/app11125392
Submission received: 6 May 2021
/
Revised: 7 June 2021
/
Accepted: 7 June 2021
/
Published: 10 June 2021
(This article belongs to the Special Issue Advances on Structural Engineering, Volume II)
Abstract
:A series of earthquake events give impetus to research on the ductile fracture behavior of steel materials. In the last decades, many fracture models have been developed and utilized in the mechanical or aerospace engineering. Nevertheless, very little application to structural members used in the construction industry has been made due to the lack of a suitable model for the fracture behavior of constructional steel. This paper presents the experimental and finite element (FE) technique to predict ductile fracture in mild carbon structural steel (SS275) sheets, which has been widely used in building structures. The post-necking true stress–strain responses were successfully estimated using the weighted-average method. The Bao and Wierzbicki (BW) model, which requires only two model parameters, was selected for the identification of fracture locus. Each model parameter was calibrated from uniaxial tension and in-plane shear specimens with the aid of digital image correlation (DIC) and finite element analysis. Fracture simulation was then performed and validated based on the experimental results of the specimens under combined tension and shear stress state.
1. Introduction
Ductile fracture accompanied by a remarkable amount of plastic deformation has been observed in a large number of steel structural components in buildings damaged by the Northridge (1994) [1] and Kobe (1995) [2] earthquakes. Fracture has been mainly described through the comparison of the strength obtained in the material testing against empirical stress capacities in civil engineering [3,4,5]. However, occurrences of such events have motivated researchers to study the ductile fracture mechanism, which had been of interest among the community of mechanical, aerospace, and nuclear engineers.
The micromechanics-based fracture models involving the changes in micro-void of steel material during the fracture process (nucleation, growth, and coalescence) can be classified into two main categories: the coupled model that considers the internal damage evolution and accumulation, and the uncoupled model that considers only the effect of the fracture threshold (equivalent stress, strain, etc.) on critical fracture. The coupled model proposed by Gurson (1977) [6] has been widely used in structural engineering for the assessment of structural integrity. This model was further modified by many independent researchers to replicate the physical mechanism of ductile fracture under various stress states. Another type of coupled model is the continuum damage mechanics (CDM) model, which originated from the macroscopic damage variable proposed by Kachanov (1958) [7]. The main drawback of these coupled models is that a considerable number of parameters need to be identified. A good example is the modified Gurson model [8] that has nine parameters, which increases computational cost and thereby limits the industrial application.
In contrast, the uncoupled models have fewer model parameters and have been found in recent studies to provide comparable accuracy in predicting the ductile fracture behavior in comparison to the coupled models. In this sense, the model could be appropriate for application in civil engineering that requires large-scale structural simulation.
The most representative of the uncoupled model is the Rice and Tracey (1969) model [9], which has been coded into the commercial finite element analysis (FEA) software ABAQUS [10], known as “Ductile Damage”. The model is dependent on the stress triaxiality, , which is defined as the ratio of hydrostatic pressure to von Mises equivalent stress. It is assumed that the ductility decreases exponentially with the increase in stress triaxiality. This model implicitly indicates that the fracture strain in pure shear is higher than in uniaxial tension. In contrast to such belief, recent experimental reports [11] showed that the reverse is true in some cases. Therefore, stress triaxiality-dependent models may not be applicable in low or negative triaxiality domains where the shear fracture dominates. To overcome this issue, the lode angle parameter related to the normalized third deviatoric stress invariant has been incorporated into the recent fracture model [12,13,14]. The fracture locus is constructed in the 3D-space of equivalent fracture strain, stress triaxiality, and lode angle parameter.
The objective of the present paper was to investigate the ductile fracture response of mild structural steel and to present the finite element method to simulate ductile fracture in structural components. Three types of specimens taken from structural steel SS275 plate were tested, in which ductile fracture was initiated under different stress states. The entire fracture responses of these specimens were simulated using the ABAQUS software [10]. The uncoupled fracture model proposed by Bao and Wierzbicki (BW) [11] was selected to define the onset of fracture initiation. The detailed calibration methodology of the fracture parameters is presented with the results of digital image correlation (DIC) analysis and finite element (FE) analysis.
2. Experimental Investigation
2.1. Test Specimen Configurations
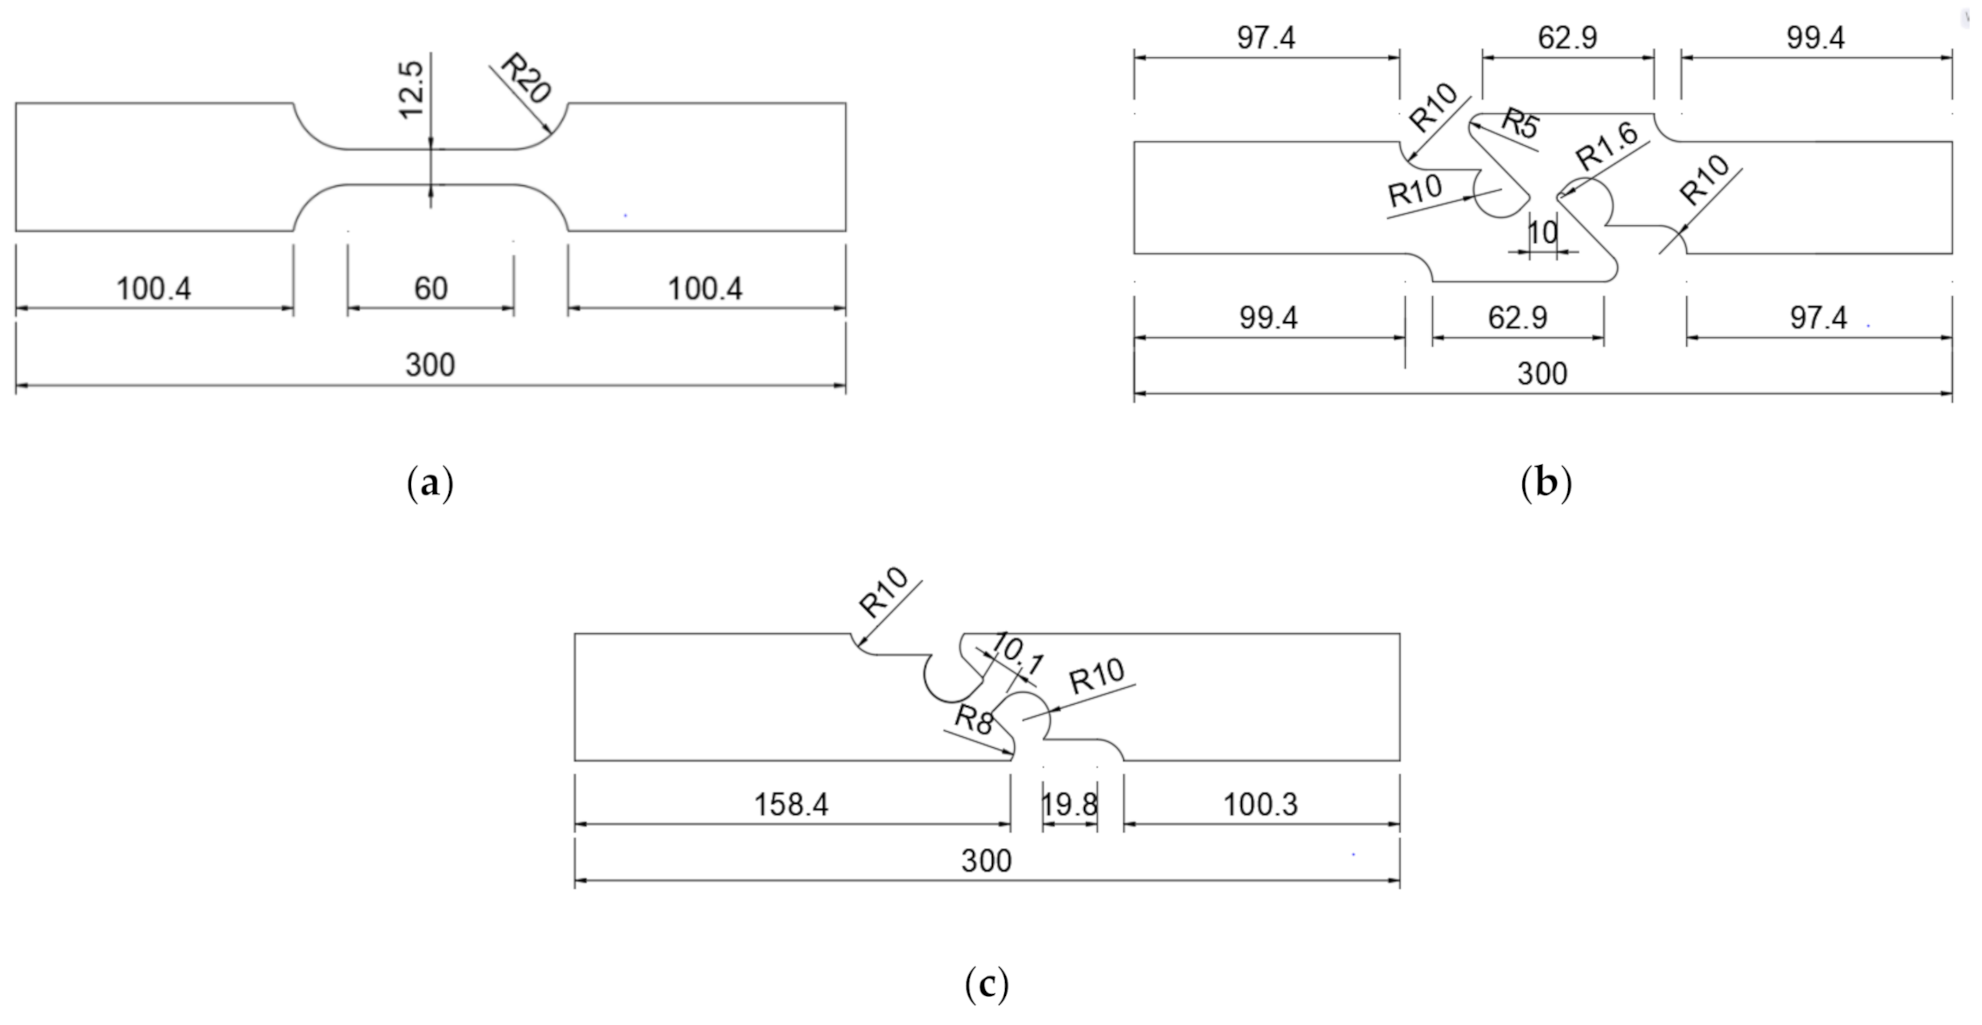
The material used in the present paper was an SS275 structural steel sheet of 8-mm thickness, manufactured and supplied by POSCO of Korea. Three different types of specimens were cut by using water jet along the rolling direction of the steel sheet to minimize material degradation induced by heat from machining. The test specimens were designed in such a way as to undergo different stress states during failure for investigating the fracture behavior of the structural steel. The nominal geometries are illustrated in Figure 1, consisting of uniaxial tension coupon specimen, in-plane shear specimen, and tension and in-plane shear specimen. Three replicate tests for each configuration were performed, thus giving a total of 9 tests.
2.2. Test Set-Up
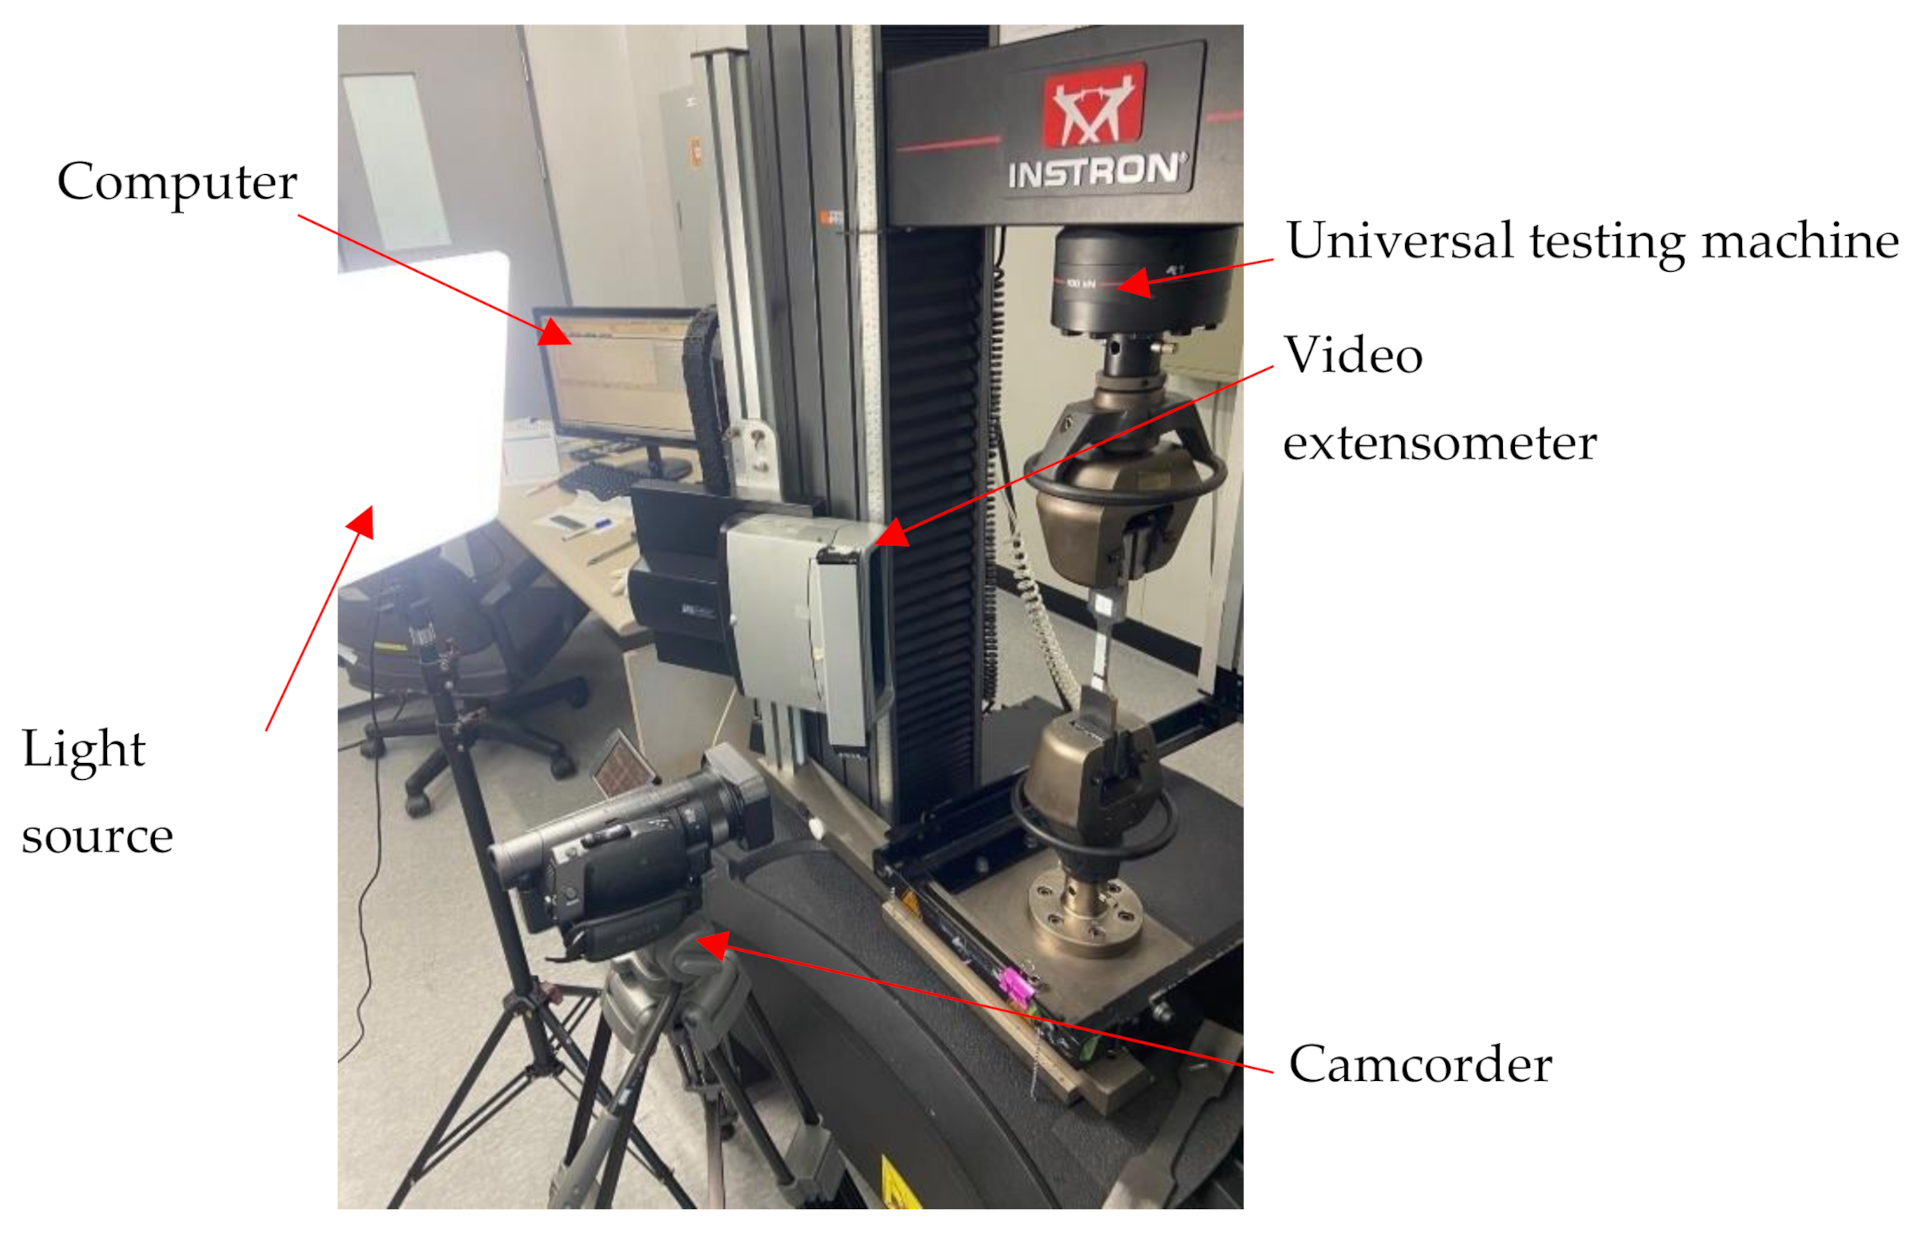
Figure 2 shows a typical test arrangement for fracture investigation. All specimens were tested at room temperature on an Instron 5982 testing machine with a maximum load capacity of 100 kN. The crosshead displacement rate was 1.5 mm/min, which corresponds to an average strain rate of approximately in the elastic region. This strain rate satisfies the requirement of the ASTM E8/E8M standard [15] for quasi-static loading condition, which is defined as and . The longitudinal deformation was measured by means of a video extensometer. The initial gauge length of 50 mm was set for the uniaxial tension coupon testing, while the gauge length of 70 mm was set for the in-plane shear and tension and shear specimen testing.
In the present work, two-dimensional Digital Image Correlation (2D-DIC) is used for local strain measurement that cannot be obtained from extensometer reading. The matt black and white aerosols were used for a high contrast speckle pattern, which is found to have a significant effect on the accuracy of the DIC measurements. Prior to performing each test, the view of the camera was adjusted carefully to be horizontally aligned with the surface of the specimen. A LED light unit was used to provide homogeneous light intensity on the specimen surface. A series of images were captured at the rate of five frames per second using a SONY FDR-AX700 camcorder, which provides FHD (1920 x 1080 pixels) video recording. After setting the region of interest (ROI), the images were post-processed with the commercial software GOM correlate [16] for 2D displacement and strain fields.
2.3. Test Results
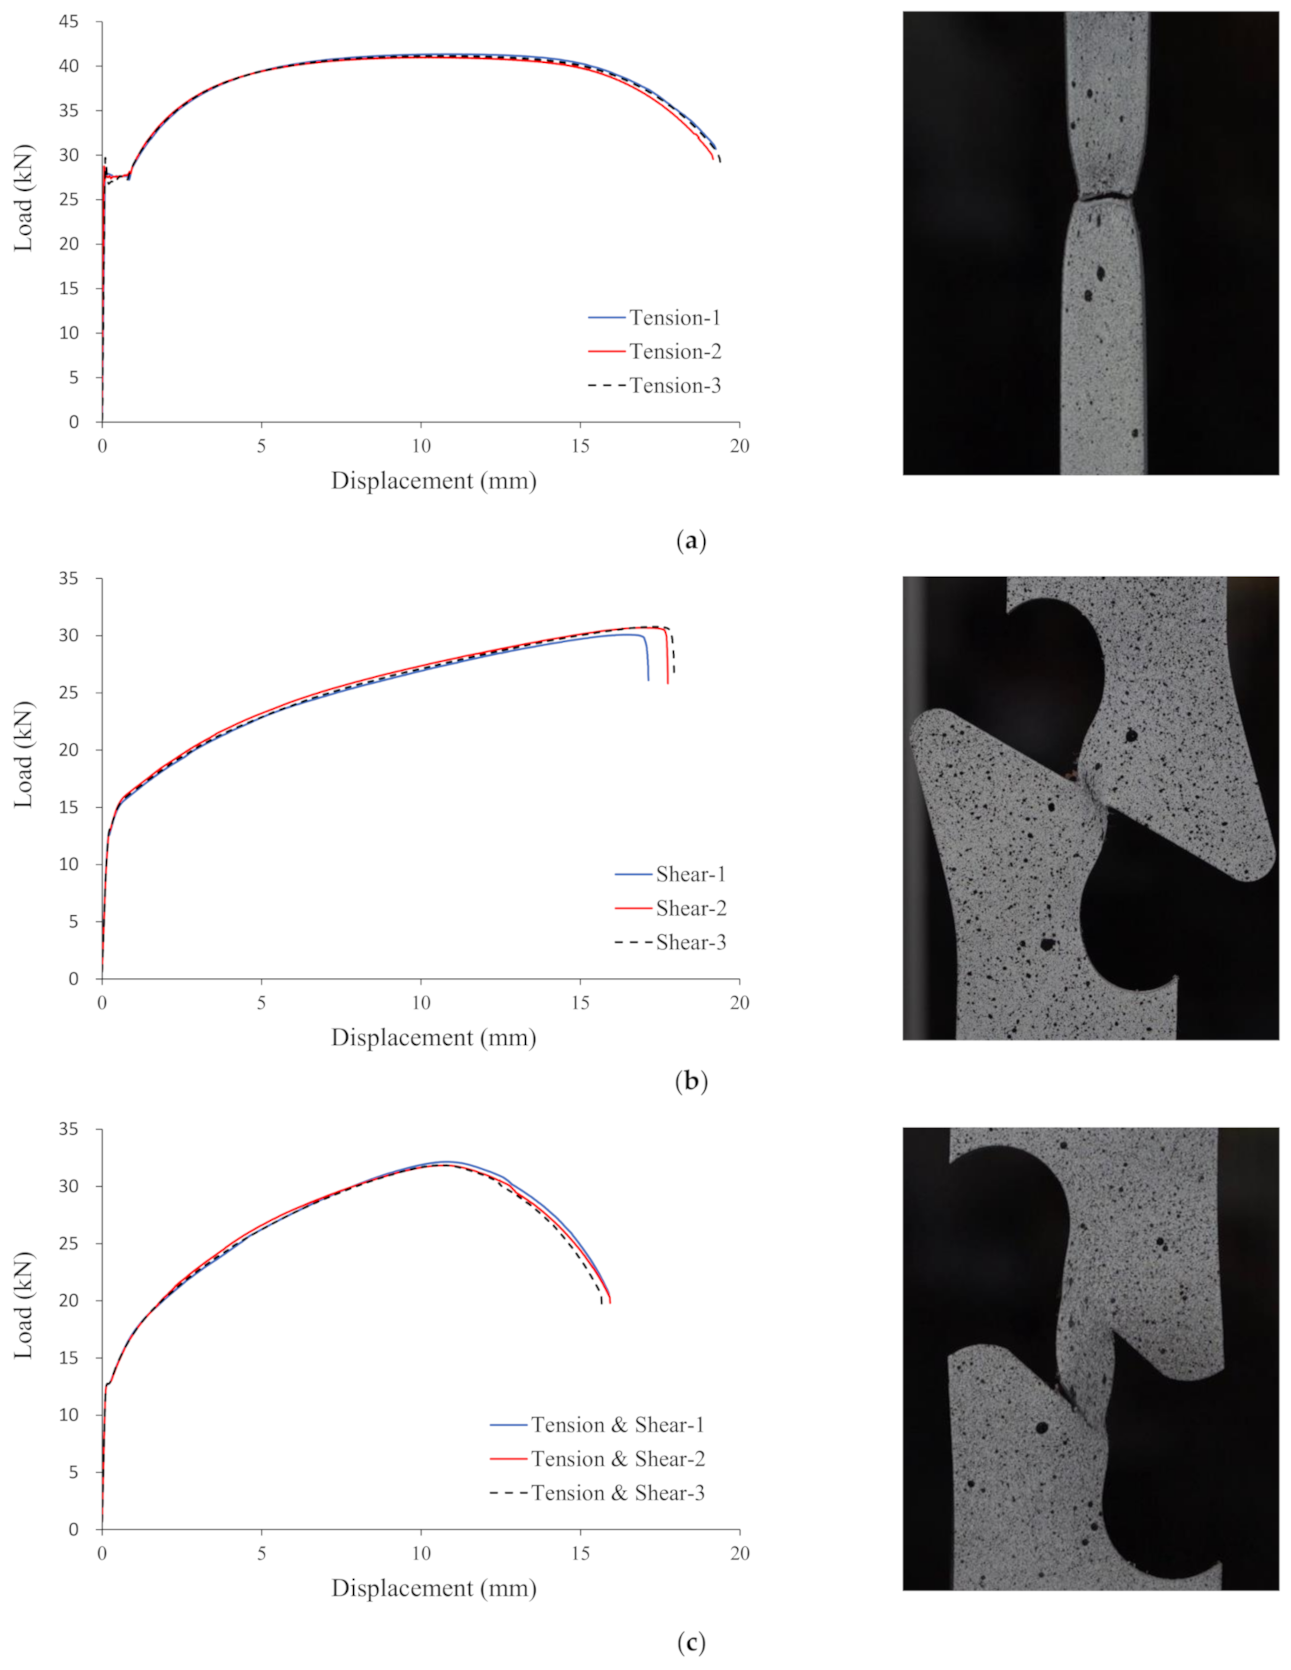
The steel material used in the present work was SS275 structural steel in Korean Industrial Standard (KS) [17] (corresponds to ASTM A36). The measured material properties from tension coupon tests are shown in Table 1, which lists the measured thickness t, elastic modulus E, yield stress Fy, tensile strength Fu, and elongation at fracture εf. Load–displacement curves obtained from the tests are plotted in Figure 3. Note that the fracture displacement is defined as the point where a precipitous drop in the load capacity to zero is identified. For the uniaxial tension coupon specimen, the ultimate strength was reached with in-plane (diffuse) necking when the strain is about 21%. The final tensile fracture occurred at approximately 25% drop of the peak load with apparent localized necking as shown in Figure 3a. Comparing to tension coupon specimens, the fracture of in-plane shear specimens propagates more quickly after the ultimate strength (the ultimate strength point is close to the final fracture point).
3. Finite Element (FE) Investigation
3.1. Description of FE Modeling
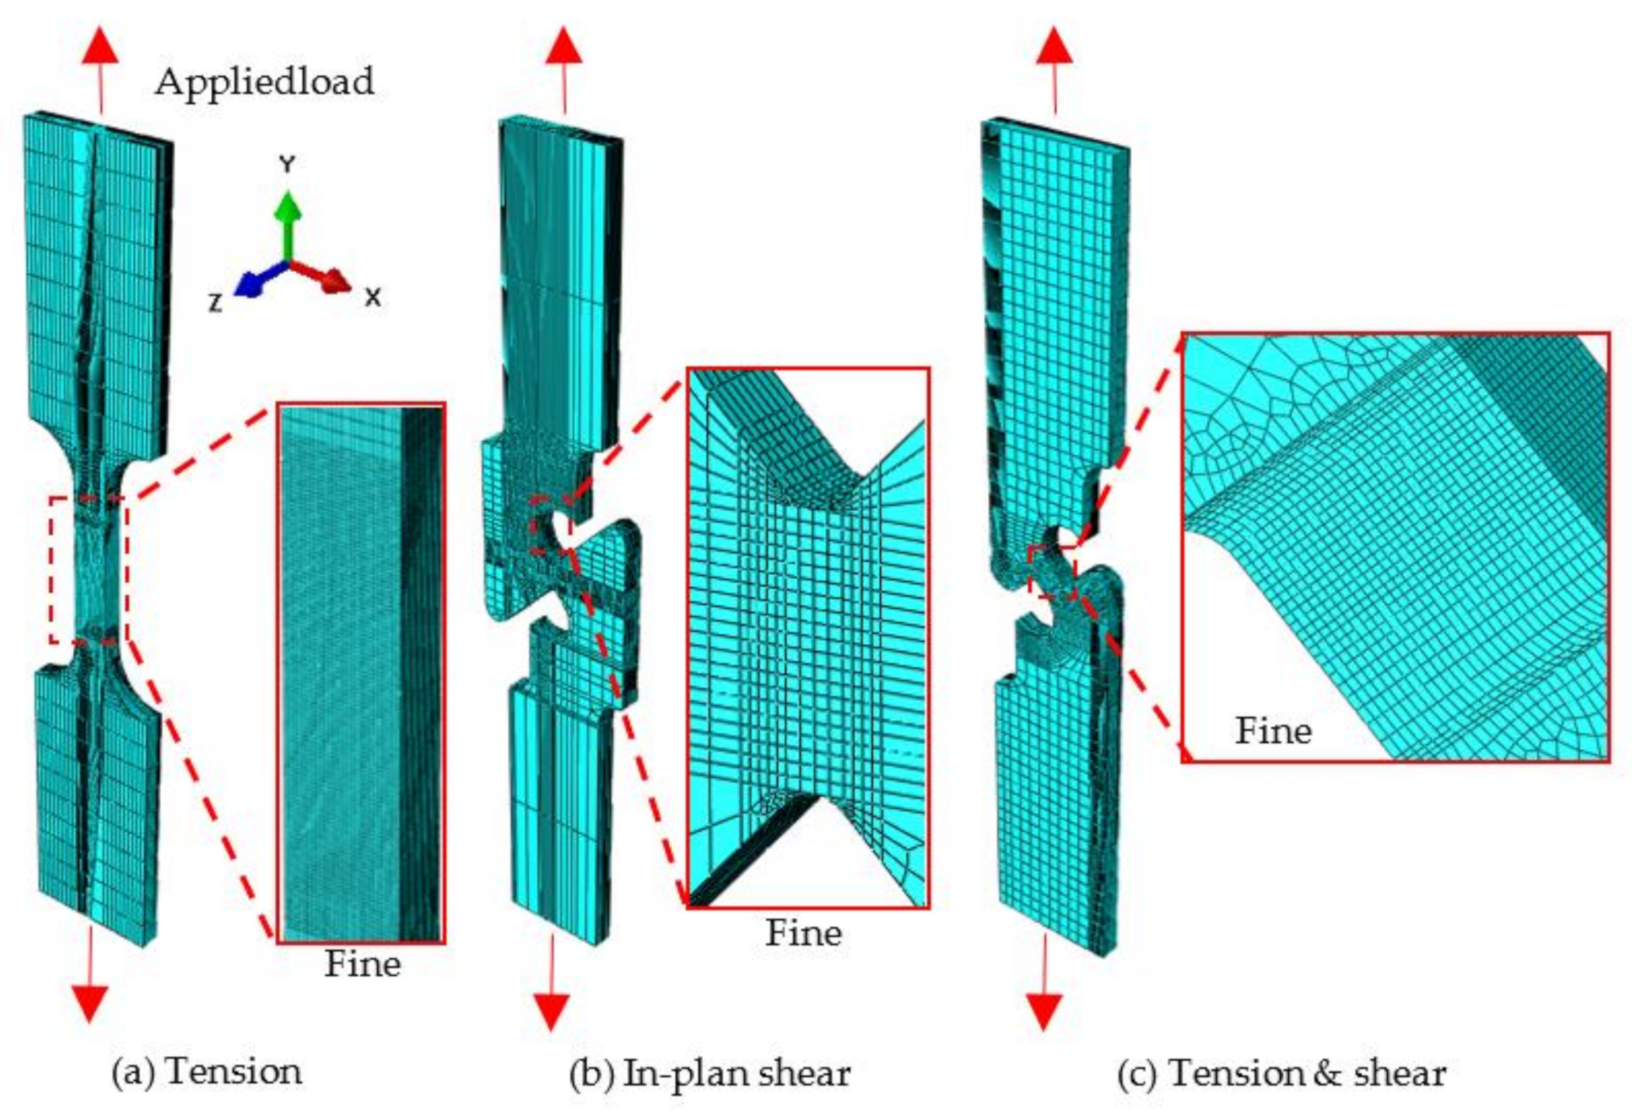
Finite element analysis for the present experimental tests was carried out with ABAQUS/Standard [10]. Due to the success of the simulations reported in the previous studies [18], the hexahedral reduced integration solid element C3D8R, available in the ABAQUS element library, was used to mesh all specimens. The finer mesh was generated in the region where fracture would initiate and propagate. Elastic modulus of 212 GPa and a Poisson’s ratio of 0.3 were assumed, and loading was simulated by imposing displacement on the end of the specimens, as shown in Figure 4. The clamped area identical to that of the test specimen was set as a rigid body to prevent lateral deformation. The plasticity of the steel material was described by using the von Mises yield criterion with isotropic hardening. Hardening properties were based on true stress–strain curves obtained from the tested tension coupons.
3.2. Identification of the True Stress–Strain Curves
A successful fracture simulation requires reliable input data on true stress–strain curves up to the plastic deformation limit (the point just before fracture). Prior to necking, the true stress–strain curve of the specimen can be easily calculated by:
where is the true stress, is the true strain, is the engineering stress, and is the engineering strain.
Equations (1) and (2) are based on the assumption that the specimen volume remains constant in a uniaxial stress state until the onset of necking, where the peak load is applied. However, the calculation results of such equations are no longer valid after the occurrence of necking as the steel material experiences the plastic instability. The post-necking material behavior could not be captured through extensometer or 2D-DIC measurements due to the variation in the cross-sectional area [19,20]. Alternatively, empirical equations have been used in the literature. Bridgman (1952) [21] proposed an empirical method to find the stress and strain values in the neck of a round specimen, but not applicable to sheet type specimen due to the complicated variation of the neck. Instead, the weighted-average method proposed by Ling (1996) [22] has been used for the sheet-type specimen. The method assumes the empirical low and upper bounds for the post-necking material behavior. However, the lower bound was found to overestimate the post-necking true stress for some steel materials. For this reason, the present study, therefore, used the modified weighted-average method by Song (2020) [23], which shows good accuracy in estimating the full true stress–strain curves of stainless-steel bolts.
The post-necking material behavior can be expressed as the weighted-average of upper and lower bounds as follows:
where and are the true stress and strain at necking, and is the weighted-average constant. Song proposed the following equation for determining the value of which is strongly dependent on the post-necking true strain:
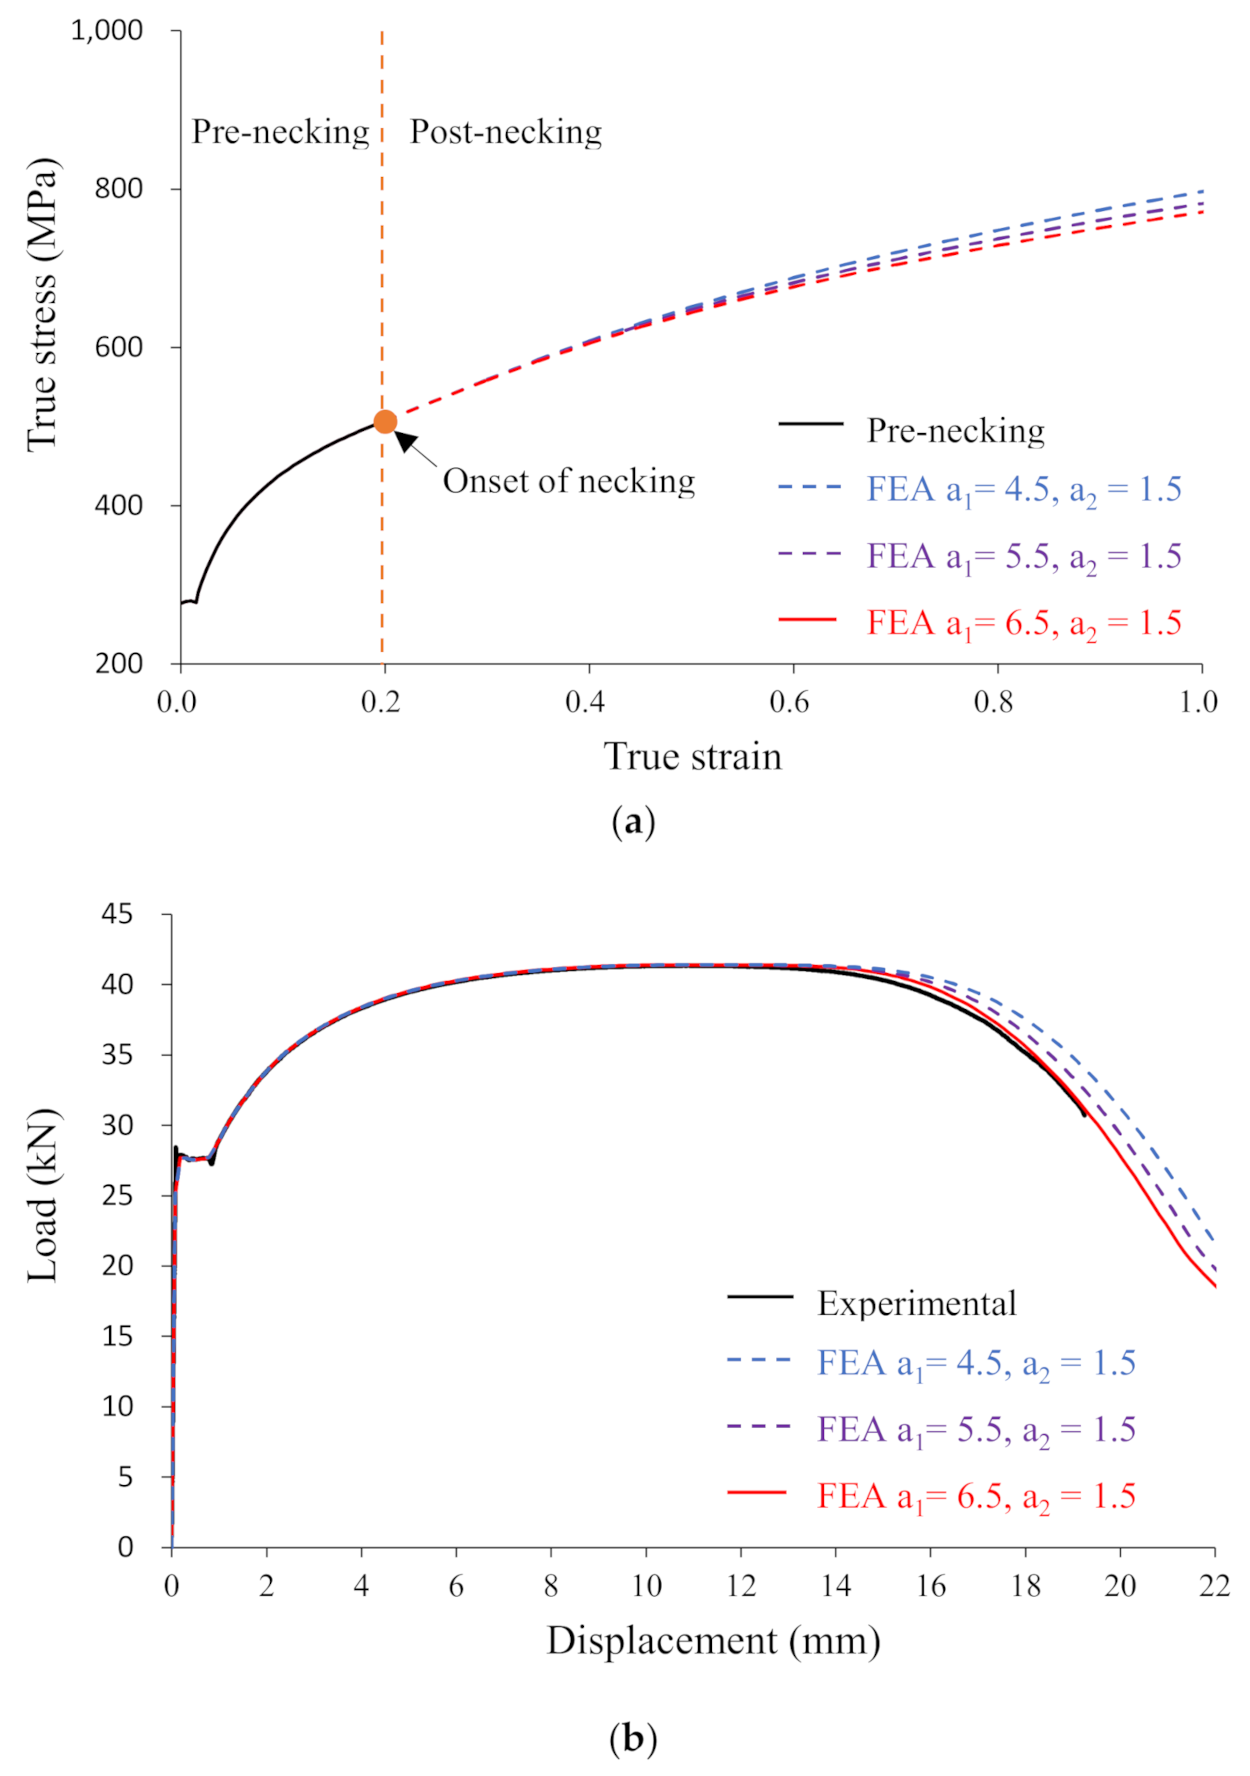
The optimal values of two parameters, and , were determined in the same manner as conducted by Song (2020) [23]. For the SS275 structural steel used in the present paper, and were optimized through an iterative process. The results of finite element analysis were fitted to test results until the replicated response was consistent with the measured one, as shown in Figure 5.
3.3. Fracture Criterion
As explained in the preceding section, two types of ductile fracture criteria exist: coupled fracture criteria and uncoupled fracture criteria. The coupled ductile fracture criteria would provide more realistic material softening than the uncoupled one as the physical mechanism including void nucleation is considered. However, considering the difficulties in calibrating a large number of model parameters, it has not been favorable for industrial application.
One of the uncoupled fracture models, the Bao–Wierzbick (BW) model [11] was, therefore, adopted for simulating fracture in the present paper. Such a model gives the strain at the onset of fracture as a function of the stress triaxiality , and requires two parameters to be calibrated from experimental tests involving tension and shear fracture. It is noteworthy that the Lode angle parameter is known to play a significant role in ductile fracture, especially at low stress triaxialities, but this parameter was neglected here for the purpose of simplification. Indeed, the calibration of the Lode angle parameter is very difficult and costly as it needs a large number of specimens generally involving in combined tension and shear fractures.
The BW model can be expressed mathematically as follows:
where and are the strains at fracture initiation in pure shear () and uniaxial tension (), respectively.
The model indicates that shear fracture dominates for negative stress triaxialities, but fracture does not take place for stress triaxialities less than −1/3. On the other hand, ductile fracture by void growth dominates for stress triaxialities higher than 1/3. For stress triaxialities between two regions, fracture occurs as a combination of shear and ductile fracture.
3.4. Calibration of Fracture Parameters
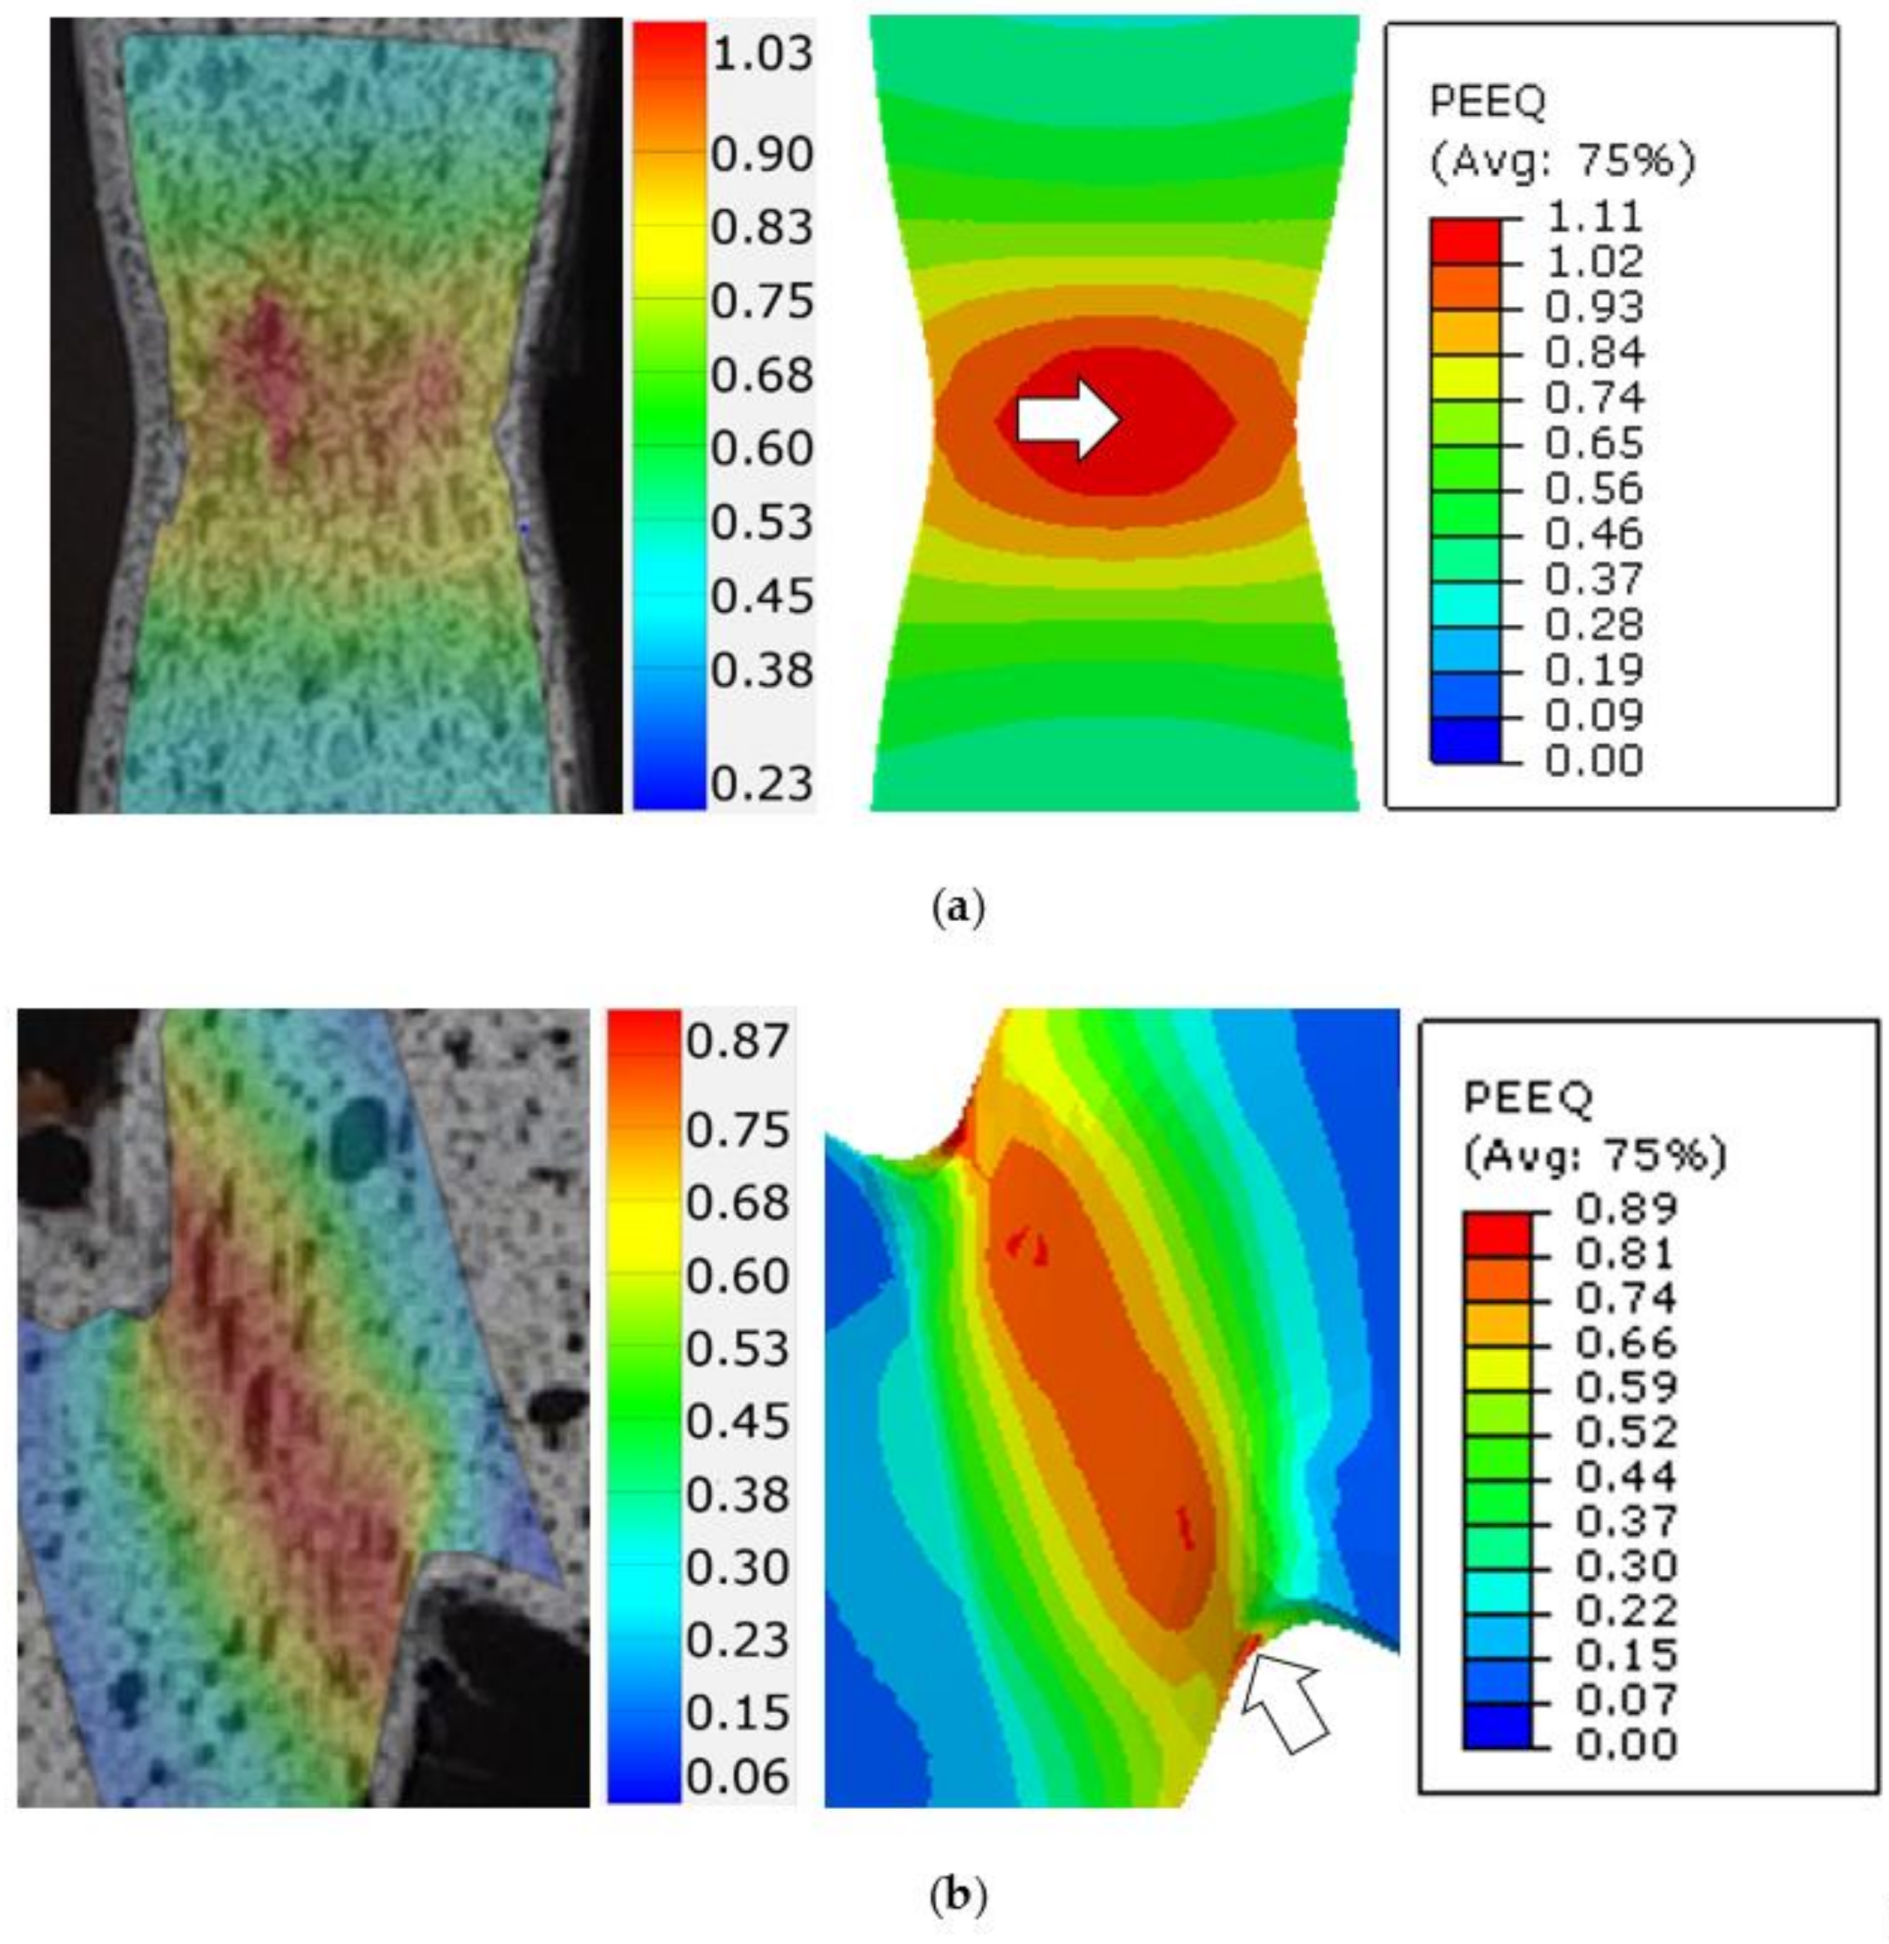
To determine the fracture locus of structural steel SS275, the equivalent plastic strain and stress triaxiality at the onset of fracture were measured by using a hybrid experimental finite element method, which was found to give a good approximation of such fracture parameters in the literature [14,24]. The finite element model, which incorporates the plastic material model shown in Figure 5, was verified against DIC analysis results concerning the distribution of the equivalent plastic strain, as shown in Figure 6, for tension and in-plane shear specimens. It is noted that the strain at the fracture displacement could not be calculated successfully through DIC analysis due to the large deformation, which leads to the loss of local speckle pattern. For this reason, the comparison in the strain distribution was made near the fracture displacement. It can be seen from Figure 6 that the strain distribution of DIC analysis for tension specimen is rather unsymmetric. This is attributed to the misalignment of the specimen. However, the FE models were able to replicate the plastic deformation of the tested specimens with reasonable accuracy.
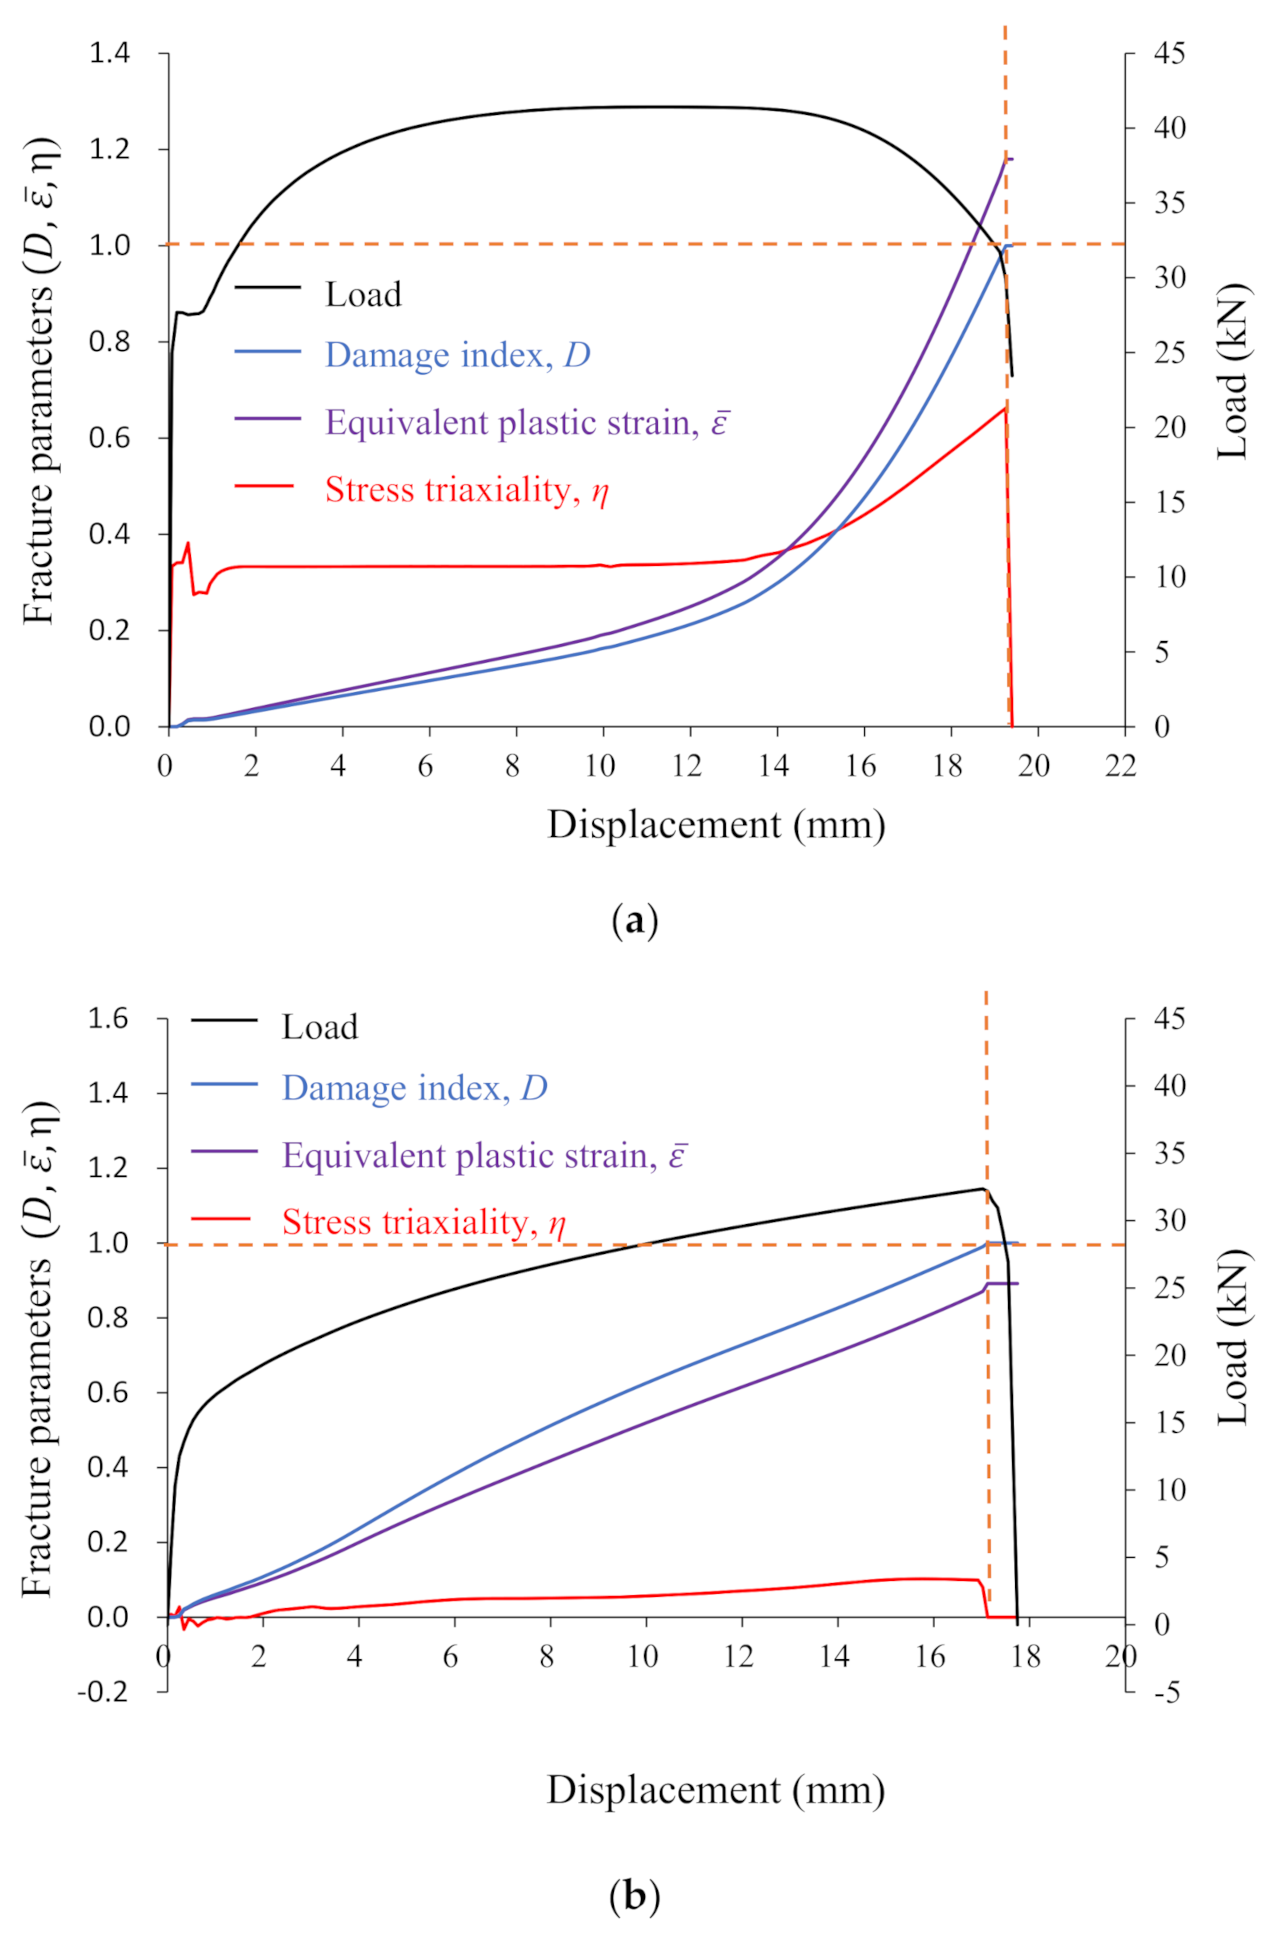
The existing studies [23,25,26] showed that ductile fracture in tension coupon generally initiates at the center of the necking region, while the fracture for in-plane shear specimen occurs at the edge. Thus, elements at the corresponding locations were selected for calibrating the fracture parameters, as marked in Figure 6. To illustrate the relationships between fracture parameters, the corresponding parameter paths of the critical element over the loading history are presented in Figure 7. It shows that the tension specimens exhibited larger variation in stress triaxiality than the shear specimen. This can be explained by the fact that the tension specimen experienced large plastic deformation from the ultimate strength point to the completed fracture point, in contrast to the shear specimen in which the fracture occurred just after the ultimate strength point. In the present study, the average value of stress triaxiality, given by Equation (6) was used to account for such characteristic.
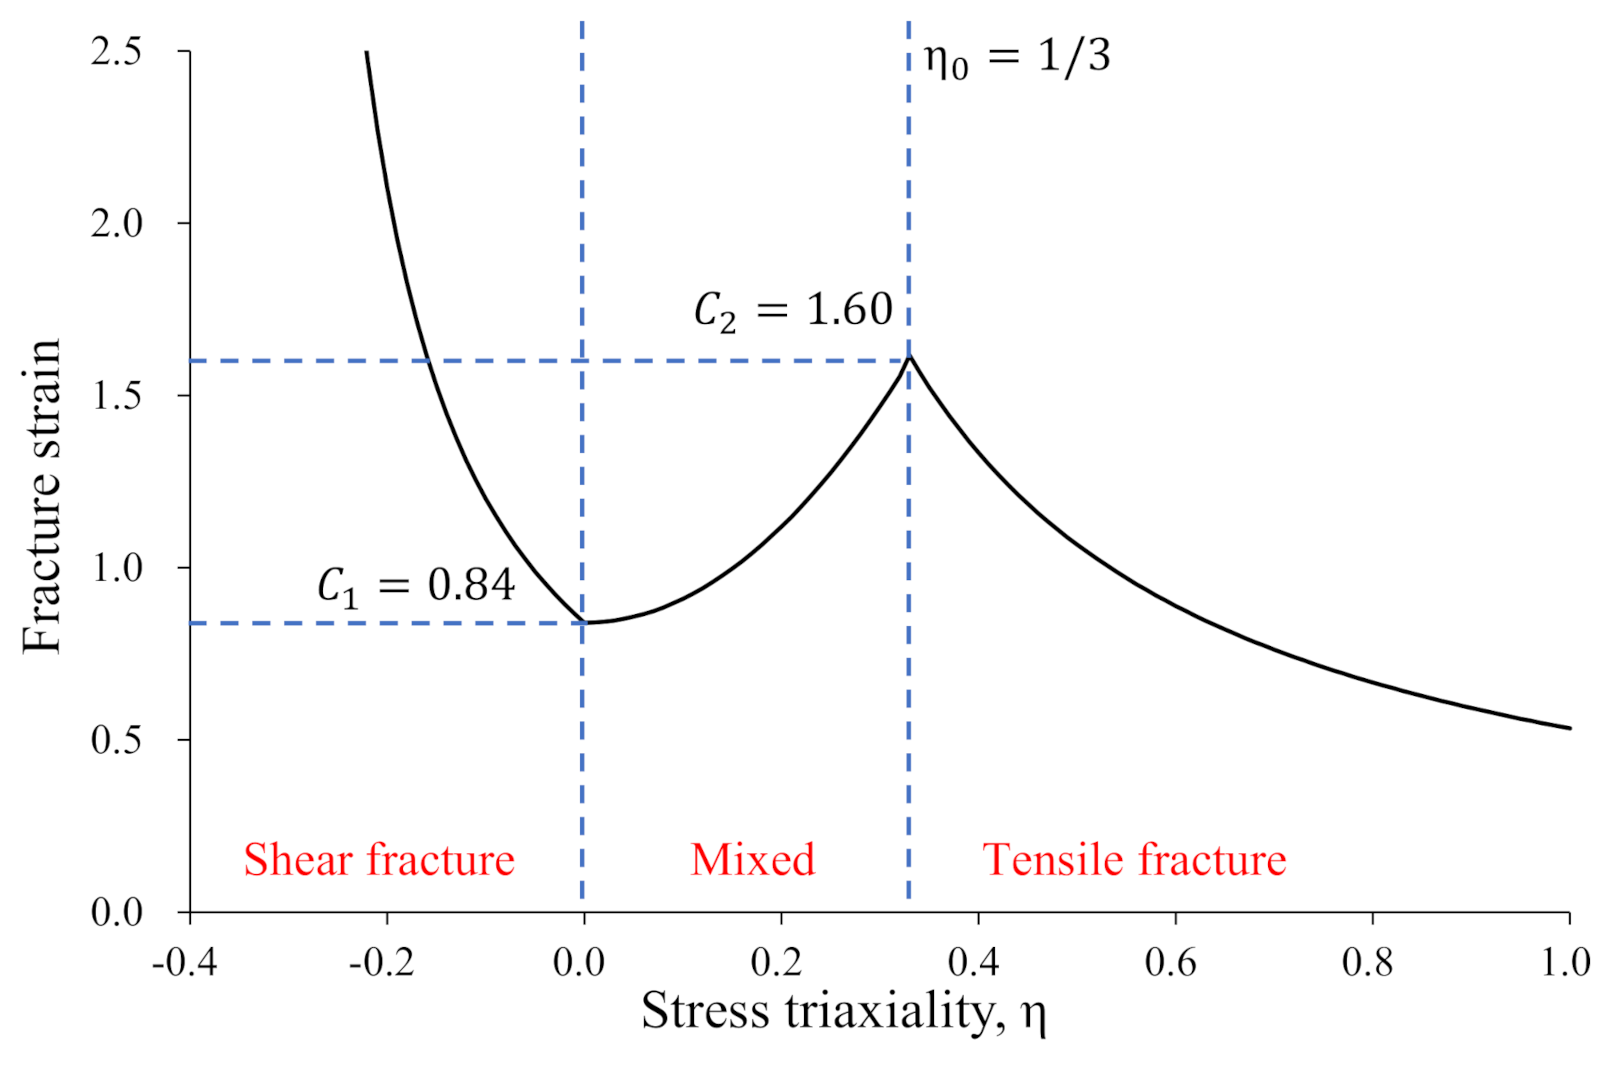
Table 2 lists the calibrated fracture parameters used in determining the material parameters and in Equation (5). Through the optimization procedure with the aid of FE analysis, it was found that of 0.84 and of 1.60 were appropriate in predicting the fracture initiation of both tension and in-plane shear specimens composed of SS275 structural steel. Figure 8 shows the constructed fracture locus with these fracture parameters. For a nonlinear strain path, the fracture initiation criterion can be expressed as the integral form as below:
where is the accumulated damage index, and is the fracture strain given by Equation (5). When this index is equal to unity, the fracture will occur. In the present study, the Damage evolution law for use in ABAQUS material model was set with the equivalent plastic displacement at failure to be 0.01. In this way, the FE models can simulate a sudden loss in the load capacity when the damage index reaches a critical value.
3.5. Mesh Sensitivity Analysis
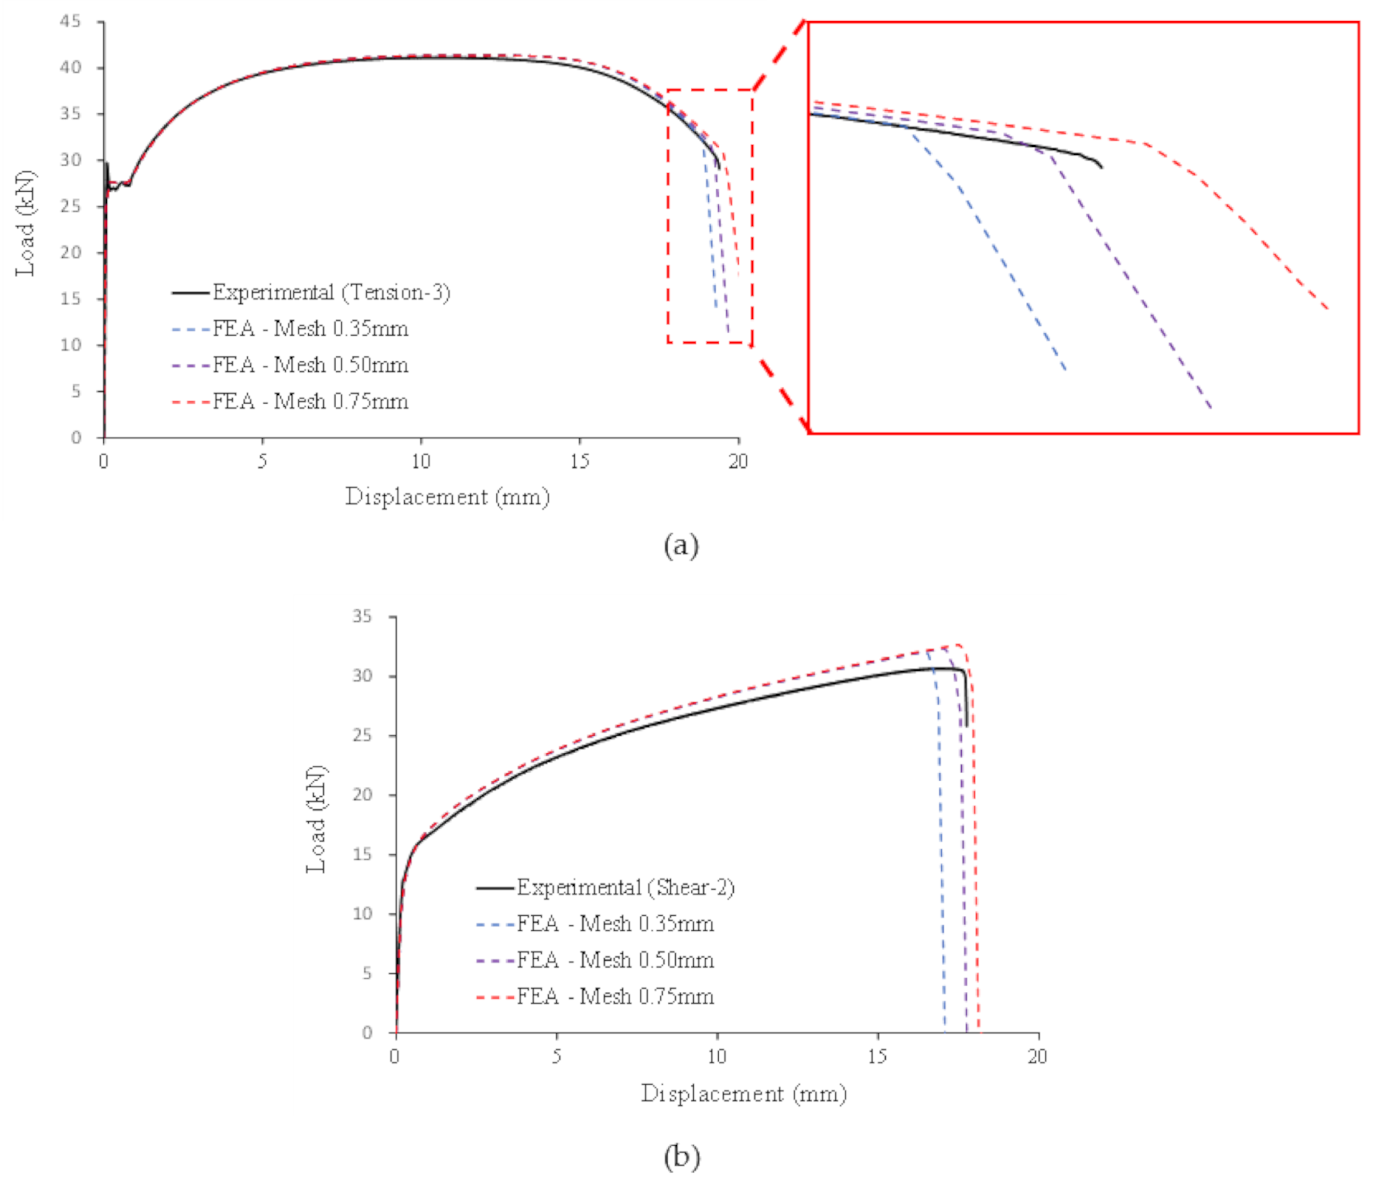
It is well known that FE analysis involving fracture behavior is strongly dependent on the mesh size due to the strain localization during the material softening. The mesh sensitivity analysis is carried out with three mesh sizes of 0.35 mm, 0.50 mm, and 0.75 mm in a region where fracture would initiate and propagate. Figure 9 shows the load–displacement curves obtained from FE analysis with different mesh sizes. It was found that there is a noticeable effect of mesh size on the fracture response. The 0.35-mm fine mesh exhibited a sudden drop of load capacity at smaller fracture displacement than the comparable one of the 0.75-mm coarse mesh. In this sense, the smaller size of the mesh is associated with the fracture initiation at an earlier stage. In any case, the 0.50-mm medium mesh, which shows a good agreement with the experimental load–displacement curve, was selected for further fracture simulations. The use of this element size can be justified from the outcome of Yan et al.’s study [27] indicating that the mesh size of 0.5 mm could not affect the accuracy of fracture simulation.
3.6. Fracture Simulations
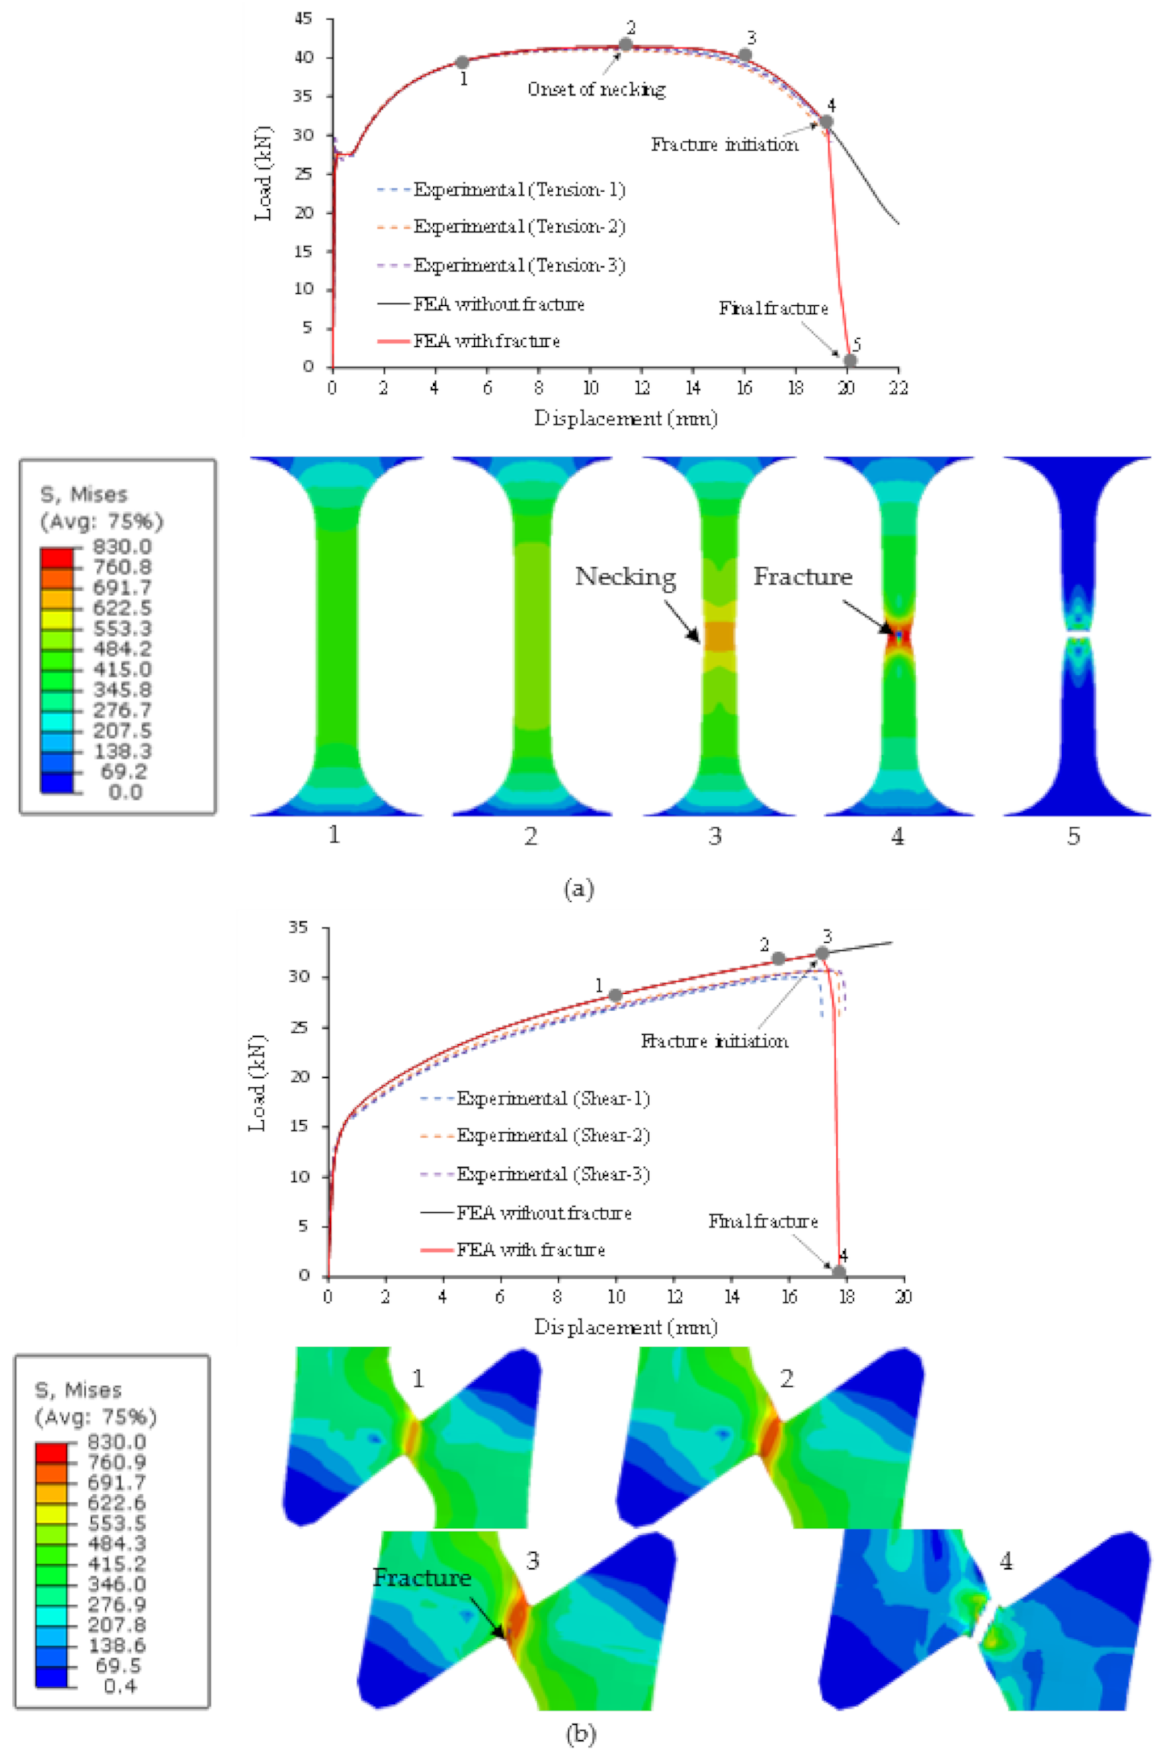
The ductile fracture model by Bao–Wierzbicki [11] in conjunction with the true stress–strain response identified in Section 3.2 was applied to simulate fracture in three types of specimens, in which tension and in-plane shear specimens were used for calibration of the fracture locus shown in Figure 8. Figure 10 compares the FE load–displacement curves of tension and in-plane shear specimens against those obtained from experimental tests. It shows that the FE models were able to replicate the experimental responses of the tension coupons with a reasonable level of accuracy, while it overestimates the load capacity of in-plane shear specimens.
One reason for this inaccuracy is the use of the von Mises yield criterion, which was derived from uniaxial tension tests. As the Lode angle effect is not considered in the plasticity model of SS275 structural steel, the inaccurate yielding function was adopted for the pure shear specimens. The similar finding can be found in the results of the high strength (Q690) pure shear specimens tested by Wang et al. [28], in which the von Mises yield criterion overestimates the load capacity by up to 25%. Another possible reason is the characteristic of the uncoupled damage model, which neglects the material softening by accumulated damage.
The results of fracture simulation are consistent with the experimental results in Figure 3a,b for the tension and in-plane shear specimens, respectively. It was found that the fracture started at the center of the tension specimen, while it initiated at the edge of shear specimen. The fracture model was also validated against the test results of the tension and shear specimens that have not been used for defining fracture criterion.
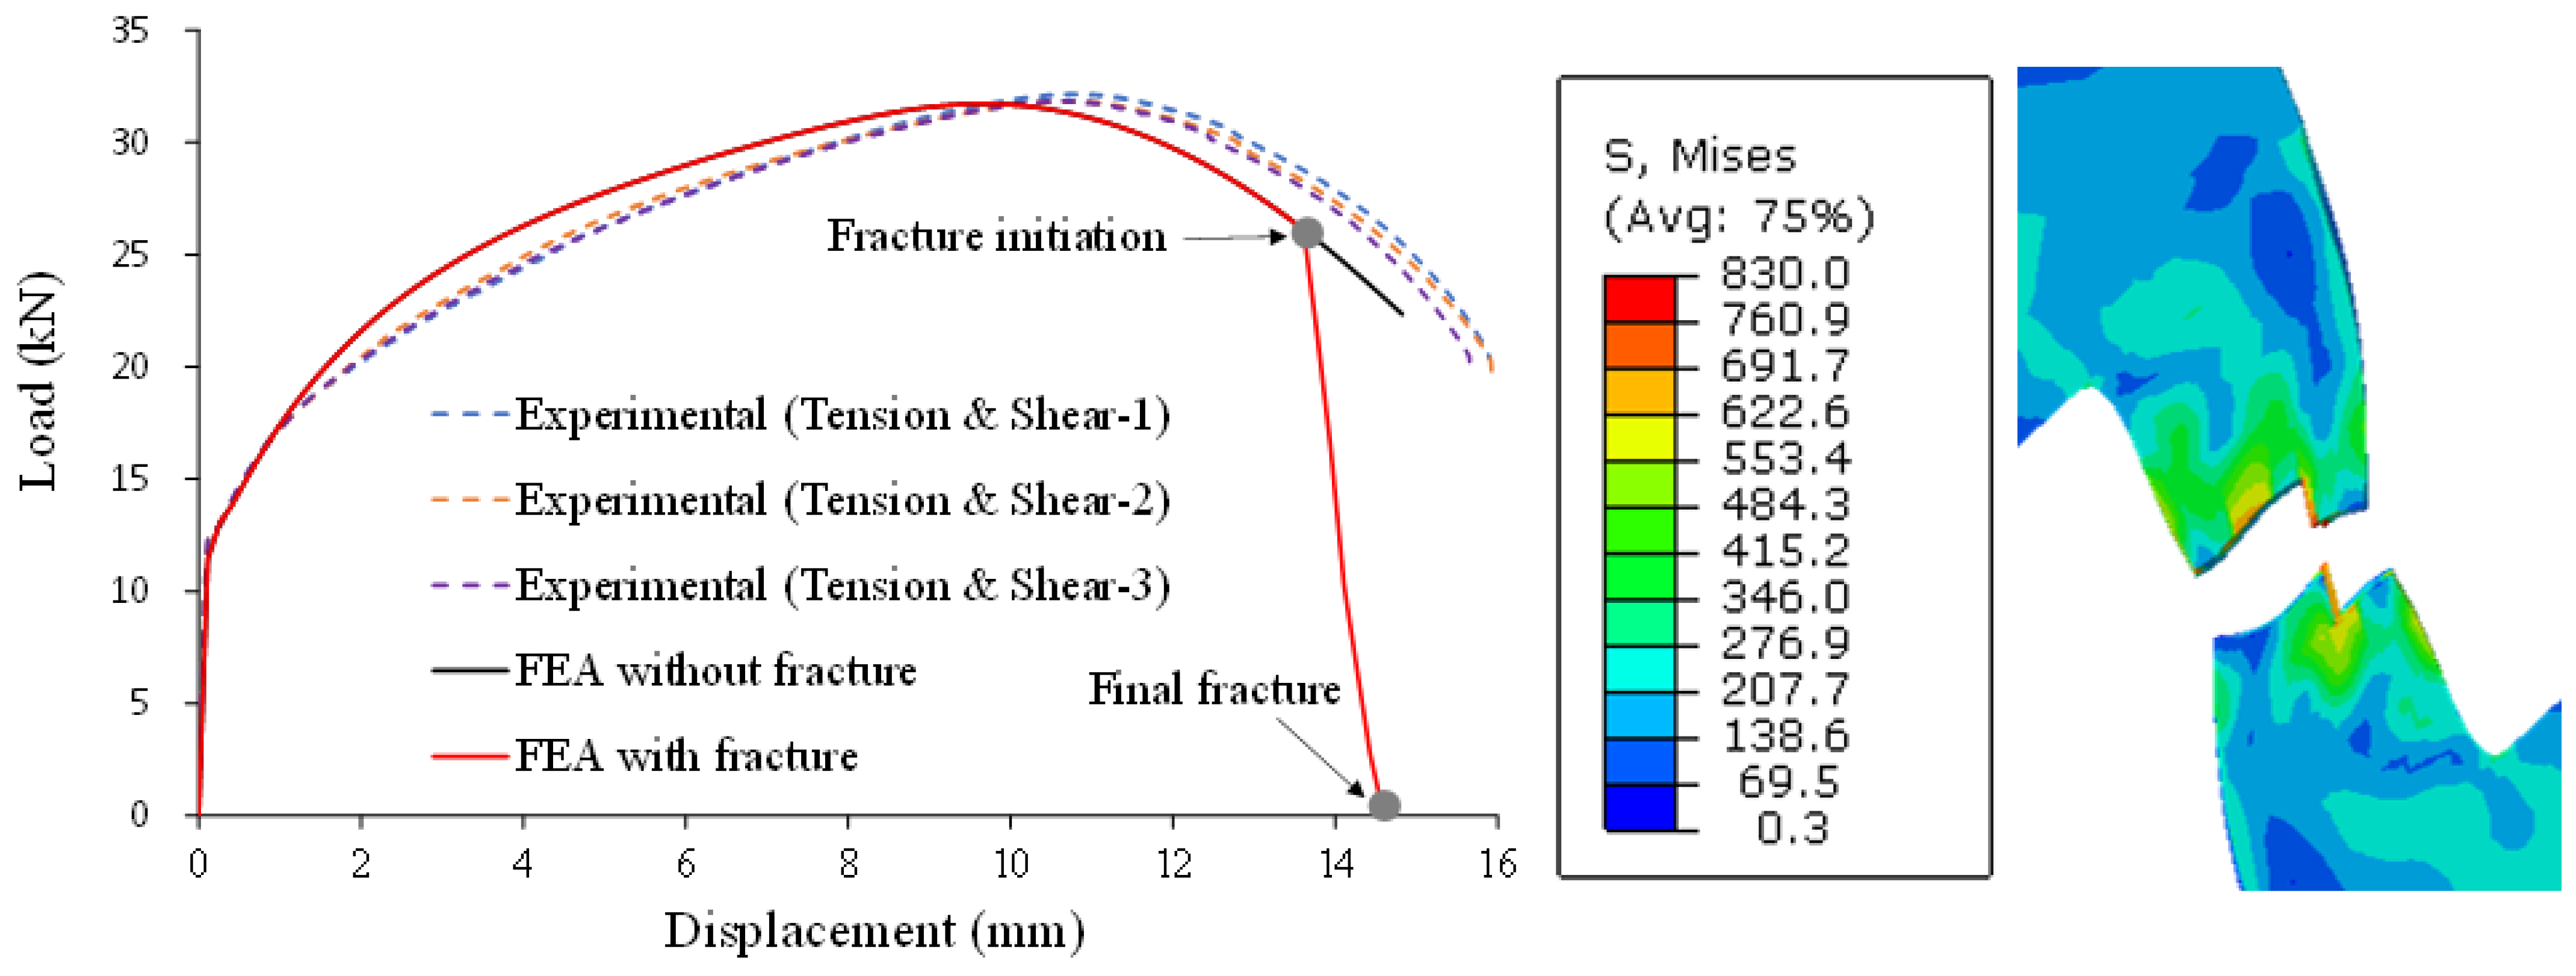
It can be seen from Figure 11 that the FE model underestimates the fracture displacement of the tension and shear specimens. This is mainly due to the off-axis loading induced by misalignment. Although pin-loading is generally recommended for ensuring axis loading, the fixed-end boundary condition was applied to the testing with the limitation of experimental design. This resulted in the fracture that started at an earlier stage and developed at the center of specimen, in contrast to the experimental response shown in Figure 3c. The conservative prediction could be also explained by the use of a simplified fracture model based on only two model parameters. The inaccuracy of the BW model in predicting ductility of steel material subjected to combined tension and shear loading has been pointed out by Song [23]. Better accuracy could be achieved when introducing more mode parameters to account for Lode angle dependence. Nevertheless, this simplified model may be still favorable to engineers, due to its ease of implementing fracture simulation. In fact, the model has provided sufficient accuracy for fatigue life prediction [29,30].
4. Summary and Conclusions
The paper has presented a methodology to predict the onset of ductile fracture in SS275 structural steel sheets. An experimental program consisting of three material tests subjected to various stress states was conducted. It shows the occurrence of fracture at the center of the tension specimen, but for shear specimen, fracture occurs at the edge. The true stress–strain response after the necking was estimated using the weighted-average method with and . It gives a good prediction for the plastic behavior of the tension specimens including the material softening region.
The uncoupled model, the Bao–Wierzbicki model, which is a function of fracture plastic strain to stress triaxiality, was adopted for fracture simulation in the present study. The data of the tension and shear specimens were utilized to determine two parameters in the model. The fracture plastic strains of these specimens were measured by means of an experimental-finite element method and validated against the obtained results from the digital image correlation (DIC) analysis. The Bao–Wierzbicki model with and , which were optimized through a trial-and-error procedure, can give an appropriate prediction for ductile fracture in the specimens under the tension and shear loadings. However, the fracture model shows a slightly inaccurate prediction for the combined loading (tension and shear) due to the error of test set-up and oversimplified assumption. The accuracy may be enhanced if the Lode angle dependency is considered. Nevertheless, the author believed that the proposed fracture model may be more preferred in the industry, as it only requires tensile and shear testing results. Further research is needed to determine the optimal balance of accuracy and simplicity.
Author Contributions
Conceptualization, Y.C. and C.L.; methodology, Y.C. and C.L.; software, Y.C. and D.-K.K.; validation, C.L.; formal analysis, Y.C. and C.L.; investigation Y.C. and C.L.; resources, J.-J.Y. and D.-K.K.; data curation, D.-K.K. and J.-J.Y.; writing—original draft preparation, Y.C. and C.L.; writing—review and editing, J.-J.Y. and D.-K.K.; visualization, Y.C.; supervision, D.-K.K.; project administration, J.-J.Y.; funding acquisition, J.-J.Y. All authors have read and agreed to the published version of the manuscript.
Funding
This research was supported by the Basic Science Research Program through the National Research Foundation (NRF) of Korea funded by the Ministry of Education (2016R1A6A1A03012812).
Institutional Review Board Statement
Not applicable.
Informed Consent Statement
Not applicable.
Data Availability Statement
Data is contained within the article.
Conflicts of Interest
The authors declare no conflict of interest.
References
- Mahin, S.A. Lessons from damage to steel buildings during the Northridge earthquake. Eng. Struct. 1998, 20, 261–270. [Google Scholar] [CrossRef]
- Kuwamura, H. Fracture of steel during an earthquake—State-of-art in Japan. Eng. Struct. 1998, 20, 310–322. [Google Scholar] [CrossRef]
- Cho, Y.H.; Kim, T.S. Estimation of ultimate strength in single shear bolted connections with aluminum alloys (6061-T6). Thin-Walled Struct. 2016, 101, 43–57. [Google Scholar] [CrossRef]
- Wang, F.; Young, B.; Gardner, L. Compressive behaviour and design CFDST cross-sections with stainless steel outer tubes. J. Construct. Steel Res. 2020, 170, 105942. [Google Scholar] [CrossRef]
- Lee, H.C.; Hwang, B.K.; Kim, T.S. Ultimate strength of austenitic stainless fillet-welded connections with weld metal fracture. Thin Walled Struct. 2017, 116, 145–153. [Google Scholar] [CrossRef]
- Gurson, A.L. Continuum theory of ductile rupture by void nucleation and growth: Part I—Yield criteria and flow and flow rules for porous ductile media. J. Eng. Mater. Technol. 1977, 99, 2–15. [Google Scholar] [CrossRef]
- Kachanov, L.M. Time of the rupture process under creep conditions. Izv. Akad. Nauk. SSSR Otd. Tekhnicheskich Nauk. 1958, 8, 26–31. (In Russian) [Google Scholar]
- Tvergaard, V. Influence of voids on shear band instabilities under plane strain conditions. Int. J. Fract. 1981, 17, 389–407. [Google Scholar] [CrossRef]
- Rice, J.R.; Tracey, D.M. On the ductile enlargement of voids in triaxial stress fields. J. Mech. Phys. Solids. 1969, 17, 201–217. [Google Scholar] [CrossRef] [Green Version]
- ABAQUS. ABAQUS Analysis User’s Manual; Dassault Systems: Johnston, RI, USA, 2018. [Google Scholar]
- Bao, Y.B.; Wierzbicki, T. On fracture locus in the equivalent strain and stress triaxiality space. Int. J. Mech. Sci. 2004, 46, 81–89. [Google Scholar] [CrossRef]
- Bai, Y.L.; Wierzbicki, T. A new model of metal plasticity and fracture with pressure and lode dependence. Int. J. Plasticity. 2008, 24, 1071–1096. [Google Scholar] [CrossRef]
- Xue, L. Damage accumulation and fracture initiation in uncracked ductile solids subject to triaxial loading. Int. J. Solids. Struct. 2007, 44, 5163–5181. [Google Scholar] [CrossRef] [Green Version]
- Huh, H.; Lou, Y. Prediction of ductile fracture for advanced high strength steel with a new criterion: Experiments and simulation. J. Mater. Process. Technol. 2013, 213, 1284–1302. [Google Scholar] [CrossRef]
- ASTM. Standard Test Methods for Tension Testing of Metallic Materials; ASTM E8-16; ASTM International: West Conshohocken, PA, USA, 2016. [Google Scholar]
- GOM. GOM Testing Technical Documentation Since V8 SR1: Basics of Digital Image Correlation and Strain Calculation; GOM: Braunchweig, Germany, 2016. [Google Scholar]
- Korean Standards Association. Rolled Steels for General Structure; KS D 3503; Korean Standards Association: Seoul, Korea, 2018. (In Korean) [Google Scholar]
- Song, Q.Y.; Heidarpour, A.; Zhao, X.L.; Han, L.H. Experimental and numerical investigation of ductile fracture of carbon steel structural components. J. Construct. Steel Res. 2018, 145, 425–437. [Google Scholar] [CrossRef]
- Beese, M.A.; Mohr, D. Anisotropic plasticity model coupled with Lode angle dependent strain-induced transformation kinetics law. J. Mech. Phys. Solids. 2012, 60, 1922–1940. [Google Scholar] [CrossRef]
- Wei, L.; Qin, F.; Cui, K. Prediction the stainless steel sheet fracture with mesh size effect for shell elements. Int. J. Solids. Struct. 2021, 210–211, 35–48. [Google Scholar] [CrossRef]
- Bridgman, P.W. Studies in Large Plastic Flow and Fracture; McGraw-Hill: New York, NY, USA, 1952. [Google Scholar]
- Ling, Y. Uniaxial true stress-strain after necking. AMP J. Technol. 1996, 5, 37–48. [Google Scholar]
- Song, Y.; Wang, J.; Uy, B.; Li, D. Experimental behaviour and fracture prediction of austenitic stainless steel bolts under combined tension and shear. J. Construct. Steel Res. 2020, 166, 105916. [Google Scholar] [CrossRef]
- Dunand, M.; Mohr, D. Hybrid experimental-numerical analysis of basic ductile fracture experiments for sheet metals. Int. J. Solids Struct. 2010, 47, 1130–1143. [Google Scholar] [CrossRef]
- Yang, F.; Veljkovic, M. Damage model calibration for S275 and S690 steels. CE Pap. 2019, 3, 262–2671. [Google Scholar] [CrossRef] [Green Version]
- Gruben, G.; Fagerholt, E.; Hopperstad, O.S.; Borvik, T. Fracture characteristics of a cold-rolled dual-phase steel. Int. J. Mech. Solids. 2011, 30, 204–218. [Google Scholar] [CrossRef]
- Yan, S.; Zhao, A.; Wu, A. Ductile fracture simulation of constructional steels based on yield-to-fracture stress-strain relationship and micromechanism-based fracture criterion. J. Struct. Eng. 2018, 144, 04018004. [Google Scholar] [CrossRef]
- Wang, Y.Z.; Li, G.Q.; Wang, Y.B.; Lyu, Y.F.; Li, H. Ductile fracture of high strength steel under multi-axial loading. Eng. Struct. 2020, 210, 110401. [Google Scholar] [CrossRef]
- Hai, L.T.; Wang, Y.B.; Li, G.Q.; Sun, F.F.; Wang, Y.Z. Numerical investigation on cyclic behavior of Q690 high strength steel beam-columns. J. Construct. Steel Res. 2020, 167, 105814. [Google Scholar] [CrossRef]
- Zeng, L.; Zhang, W.; Li, H. Low-cycle fatigue life prediction of I-shaped steel brace components and brace frames. Thin Walled Struct. 2021, 163, 107711. [Google Scholar] [CrossRef]
Figure 1.
Configuration of the test specimens (dimensions in mm): (a) Uniaxial tension specimen; (b) In-plane shear specimen; (c) Tension and shear specimen.
Figure 1.
Configuration of the test specimens (dimensions in mm): (a) Uniaxial tension specimen; (b) In-plane shear specimen; (c) Tension and shear specimen.

Figure 2.
Testing set-up for fracture investigation.

Figure 3.
Experimental load–displacement curves and fracture modes: (a) Uniaxial tension specimen; (b) In-plane shear specimen; (c) Tension and shear specimen.
Figure 3.
Experimental load–displacement curves and fracture modes: (a) Uniaxial tension specimen; (b) In-plane shear specimen; (c) Tension and shear specimen.

Figure 4.
FE models: (a) Uniaxial tension specimen; (b) In-plane shear specimen; (c) Tension and shear specimen.
Figure 4.
FE models: (a) Uniaxial tension specimen; (b) In-plane shear specimen; (c) Tension and shear specimen.

Figure 5.
(a) True stress–strain curves; (b) Calibration outcomes of Specimen Tension-1.

Figure 6.
Strain contours obtained from DIC calculation and FE analysis: (a) Uniaxial tension specimen; (b) In-plane shear specimen.
Figure 6.
Strain contours obtained from DIC calculation and FE analysis: (a) Uniaxial tension specimen; (b) In-plane shear specimen.

Figure 7.
Relationships between fracture parameters: (a) Uniaxial tension specimen; (b) In-plane shear specimen.
Figure 7.
Relationships between fracture parameters: (a) Uniaxial tension specimen; (b) In-plane shear specimen.

Figure 8.
Locus of the calibrated fracture initiation.

Figure 9.
Results of mesh sensitivity analysis: (a) Specimen Tension-3; (b) Specimen Shear-2.

Figure 10.
Results of fracture simulation: (a) Uniaxial tension specimen; (b) In-plane shear specimen.
Figure 10.
Results of fracture simulation: (a) Uniaxial tension specimen; (b) In-plane shear specimen.

Figure 11.
Results of fracture simulation on tension and shear specimens.


Table 1.
Material properties of SS275 steel from tension coupon specimens.
| Specimen | Measured Thickness (t, mm) | Elastic Modulus (E, GPa) | Yield Stress | Tensile Strength | Elongation at Fracture (%) | |
|---|---|---|---|---|---|---|
| Tension-1 | 7.82 | 214.7 | 276.2 | 414.4 | 1.50 | 38.7 |
| Tension-2 | 7.83 | 214.8 | 271.5 | 410.4 | 1.51 | 40.8 |
| Tension-3 | 7.85 | 206.6 | 271.8 | 410.6 | 1.51 | 39.6 |
| Average | 7.83 | 212.0 | 273.2 | 411.8 | 1.51 | 39.7 |
| Standard deviation (%) | 0.16% | 1.81% | 0.79% | 0.45% | 0.34% | 2.17% |
Table 2.
Calibrated fracture parameters.
| Specimen | Fracture Strain | Averaged Stress Triaxiality |
|---|---|---|
| Tension | 1.1739 | 0.4588 |
| Shear | 0.8709 | 0.0532 |
Publisher’s Note: MDPI stays neutral with regard to jurisdictional claims in published maps and institutional affiliations. |
© 2021 by the authors. Licensee MDPI, Basel, Switzerland. This article is an open access article distributed under the terms and conditions of the Creative Commons Attribution (CC BY) license (https://creativecommons.org/licenses/by/4.0/).
Share and Cite
MDPI and ACS Style
Cho, Y.; Lee, C.; Yee, J.-J.; Kim, D.-K. Modeling of Ductile Fracture for SS275 Structural Steel Sheets. Appl. Sci. 2021, 11, 5392. https://0-doi-org.brum.beds.ac.uk/10.3390/app11125392
AMA Style
Cho Y, Lee C, Yee J-J, Kim D-K. Modeling of Ductile Fracture for SS275 Structural Steel Sheets. Applied Sciences. 2021; 11(12):5392. https://0-doi-org.brum.beds.ac.uk/10.3390/app11125392
Chicago/Turabian StyleCho, Yonghyun, Changkye Lee, Jurng-Jae Yee, and Dong-Keon Kim. 2021. "Modeling of Ductile Fracture for SS275 Structural Steel Sheets" Applied Sciences 11, no. 12: 5392. https://0-doi-org.brum.beds.ac.uk/10.3390/app11125392
Note that from the first issue of 2016, this journal uses article numbers instead of page numbers. See further details here.