Article

Experimental Thermodynamic Investigation on the Refrigerant Charge in a Transcritical CO2 Electric Bus Air Conditioning System

1
School of Energy and Power Engineering, Xi’an Jiaotong University, 28 Xianning West Road, Xi’an 710049, China
2
Department of Mechanical Engineering, Technical University of Denmark (DTU), Nils Koppels Allé, Building 403, 2800 Kgs. Lyngby, Denmark
*
Authors to whom correspondence should be addressed.
Submission received: 10 May 2021 / Revised: 10 June 2021 / Accepted: 14 June 2021 / Published: 17 June 2021

Abstract

:
Due to its considerable impact on climate, bus air conditioning systems are being pushed to take a new and sustainable path. Electric buses relying on transcritical CO2 air conditioning units are perceived to be eco-friendly and future-proof solutions to achieving such a target. However, in order to have highly efficient air conditioning systems, the CO2 charge needs to be optimized. In this paper the energy and exergy-based analyses were performed to investigate the effect of normalized refrigerant charge on the system performance by using a test rig of a transcritical CO2 air conditioning unit for an 8 m electric bus. Results showed that the normalized refrigerant charge range of 0.248~0.336 was recommended in order to ensure the maximum coefficient of performance (COP). In addition, in sufficient charge conditions, the optimal COP, cooling capacity and exergy efficiency were 1.716, 18.97 kW and 29.79%, respectively, under the standard refrigeration condition of 35 °C/27 °C. As the ambient temperature rose from 35 °C to 40 °C, the COP, cooling capacity and exergy efficiency decreased by 16.03%, 10.90% and 12.22%, respectively. Furthermore, the exergy efficiency was found not to be sensitive to slightly insufficient charge, whereas overcharge was observed to be even beneficial to exergy efficiency under the condition of ensuring the maximum COP. In addition, insufficient refrigerant charging seriously affected the irreversible losses in the indoor and outdoor heat exchangers, whereas slight overcharge had little effect on the component exergy efficiency. Finally, the need to improve the CO2 compressor efficiency to enhance the system performance was revealed.

1. Introduction

Electricity as an energy vector for vehicle propulsion promotes the use of renewable and carbon-free energy sources in addition to favoring energy supply security as well as lowering air pollution. Therefore, the uptake of electric vehicles [1], including buses [2], is increasing considerably worldwide. On the one hand, at present, hydrofluorocarbons (HFCs) are the most widely used refrigerants for bus air conditioning systems, especially R407C and R410A [3], which have a high value of global warming potential (GWP). On the other hand, the wide adoption of the Kigali Amendment will result in HFC cut by around 85% before 2050 on a global basis, leading low-to-zero GWP refrigerants to take center stage in transport sector. CO2 is a widely used natural working fluid (R744) with negligible GWP, zero ozone depletion potential (ODP), low cost and excellent thermo-physical properties in addition to being non-flammable and non-toxic [4]. In addition, transcritical CO2 systems have considerable advantages in heating performance, especially at low-temperature heating conditions, which can solve the problem of large power consumption of electric vehicles in winter [5,6,7,8]. Therefore, transcritical CO2 systems have great potential to become future-proof solutions for electric vehicle air conditioning units.
There are many factors that affect the coefficient of performance (COP) of the transcritical CO2 systems [9,10,11], refrigerant charge being one of the most crucial ones [12]. Compared with the traditional vapor compression systems using HFCs, the performance of transcritical CO2 systems is more sensitive to the refrigerant charge [13]. Baek et al. [14] experimentally investigated the cooling performance of a CO2 heat pump unit by varying the refrigerant charge amount, electronic expansion valve (EEV) opening degree, compressor frequency and outdoor fan speed at various outdoor temperatures. The results showed that the optimum normalized charge is 0.712 to achieve the maximum COP at the standard cooling condition (outdoor temperature of 35 °C, indoor temperature of 27 °C) with the compressor frequency of 45 Hz and a superheating degree of 5 K. The performance of a transcritical system was experimentally evaluated under different refrigerant charge amounts by Aprea et al. [15]. The influence of the refrigerant charge on COP, cooling capacity, compression ratio and suction line superheat was analyzed in detail and the maximum COP was assessed at the optimal refrigerant charge of 7.5 kg. Hazarika et al. [12] presented a steady-state simulation model developed for a transcritical CO2 air conditioning system. The authors found that the variation in COP is marginal for a charge variation of ±18% from the optimum value.
However, to the best of the authors’ knowledge, there is only limited research on refrigerant charge of CO2 mobile air conditioning (MAC) systems. In addition, most of the research focuses on the systems of passenger cars. Liu et al. [16] found that undercharged CO2 systems lead to a fast decrease of the cooling capacity and COP, whereas overcharged CO2 systems cause an abrupt increase of the compressor power input. Wang et al. [17] experimentally investigated the charge characteristics and refrigerant migration behavior of an electric transcritical CO2 MAC unit. The authors observed that a plateau region involving the optimal system performance occurred for a refrigerant charge between 1100 g and 1600 g at 35 °C, for which COP and cooling capacity achieved their optimal performance of 1.87 and 3.5 kW, respectively. An experimental study on the normalized refrigerant charge (NRC) of the MAC system was carried out by Yin et al. [18] who found that the optimal NRC range for a transcritical CO2 air conditioning system was between 0.111 and 0.321. Dong et al. [19] experimentally compared the COPs and cooling/heating capabilities of MAC systems using R134a and CO2 as work fluid. The optimal CO2 charge amount was determined to be 600~650 g and the COP can reach 1.36 and 2.16 at 40 °C (cooling mode) and −20 °C (heating mode), respectively. Different from the above studies, Song et al. [20,21] experimentally investigated the cooling and heating performance of a transcritical CO2 MAC system for an electric bus. The results showed an optimal COP of 2.88 and a cooling capacity of 31.4 kW at 9 kg charge amount in cooling mode (outdoor temperature of 35 °C and indoor temperature of 19.5 °C) as well as an optimal COP of 1.78 and a heating capacity of 15.3 kW at 8.8 kg in heating mode (outdoor temperature of −20 °C and indoor temperature of 20 °C). From the literature above it can be concluded that there is little research on transcritical CO2 air conditioning systems for electric buses. In order to fill this research gap, a test rig of an electric bus air conditioning system was built and employed for evaluating the influence of the refrigerant charge on the performance of the air conditioning unit based on the energy and exergy analyses.

2. Materials and Methods

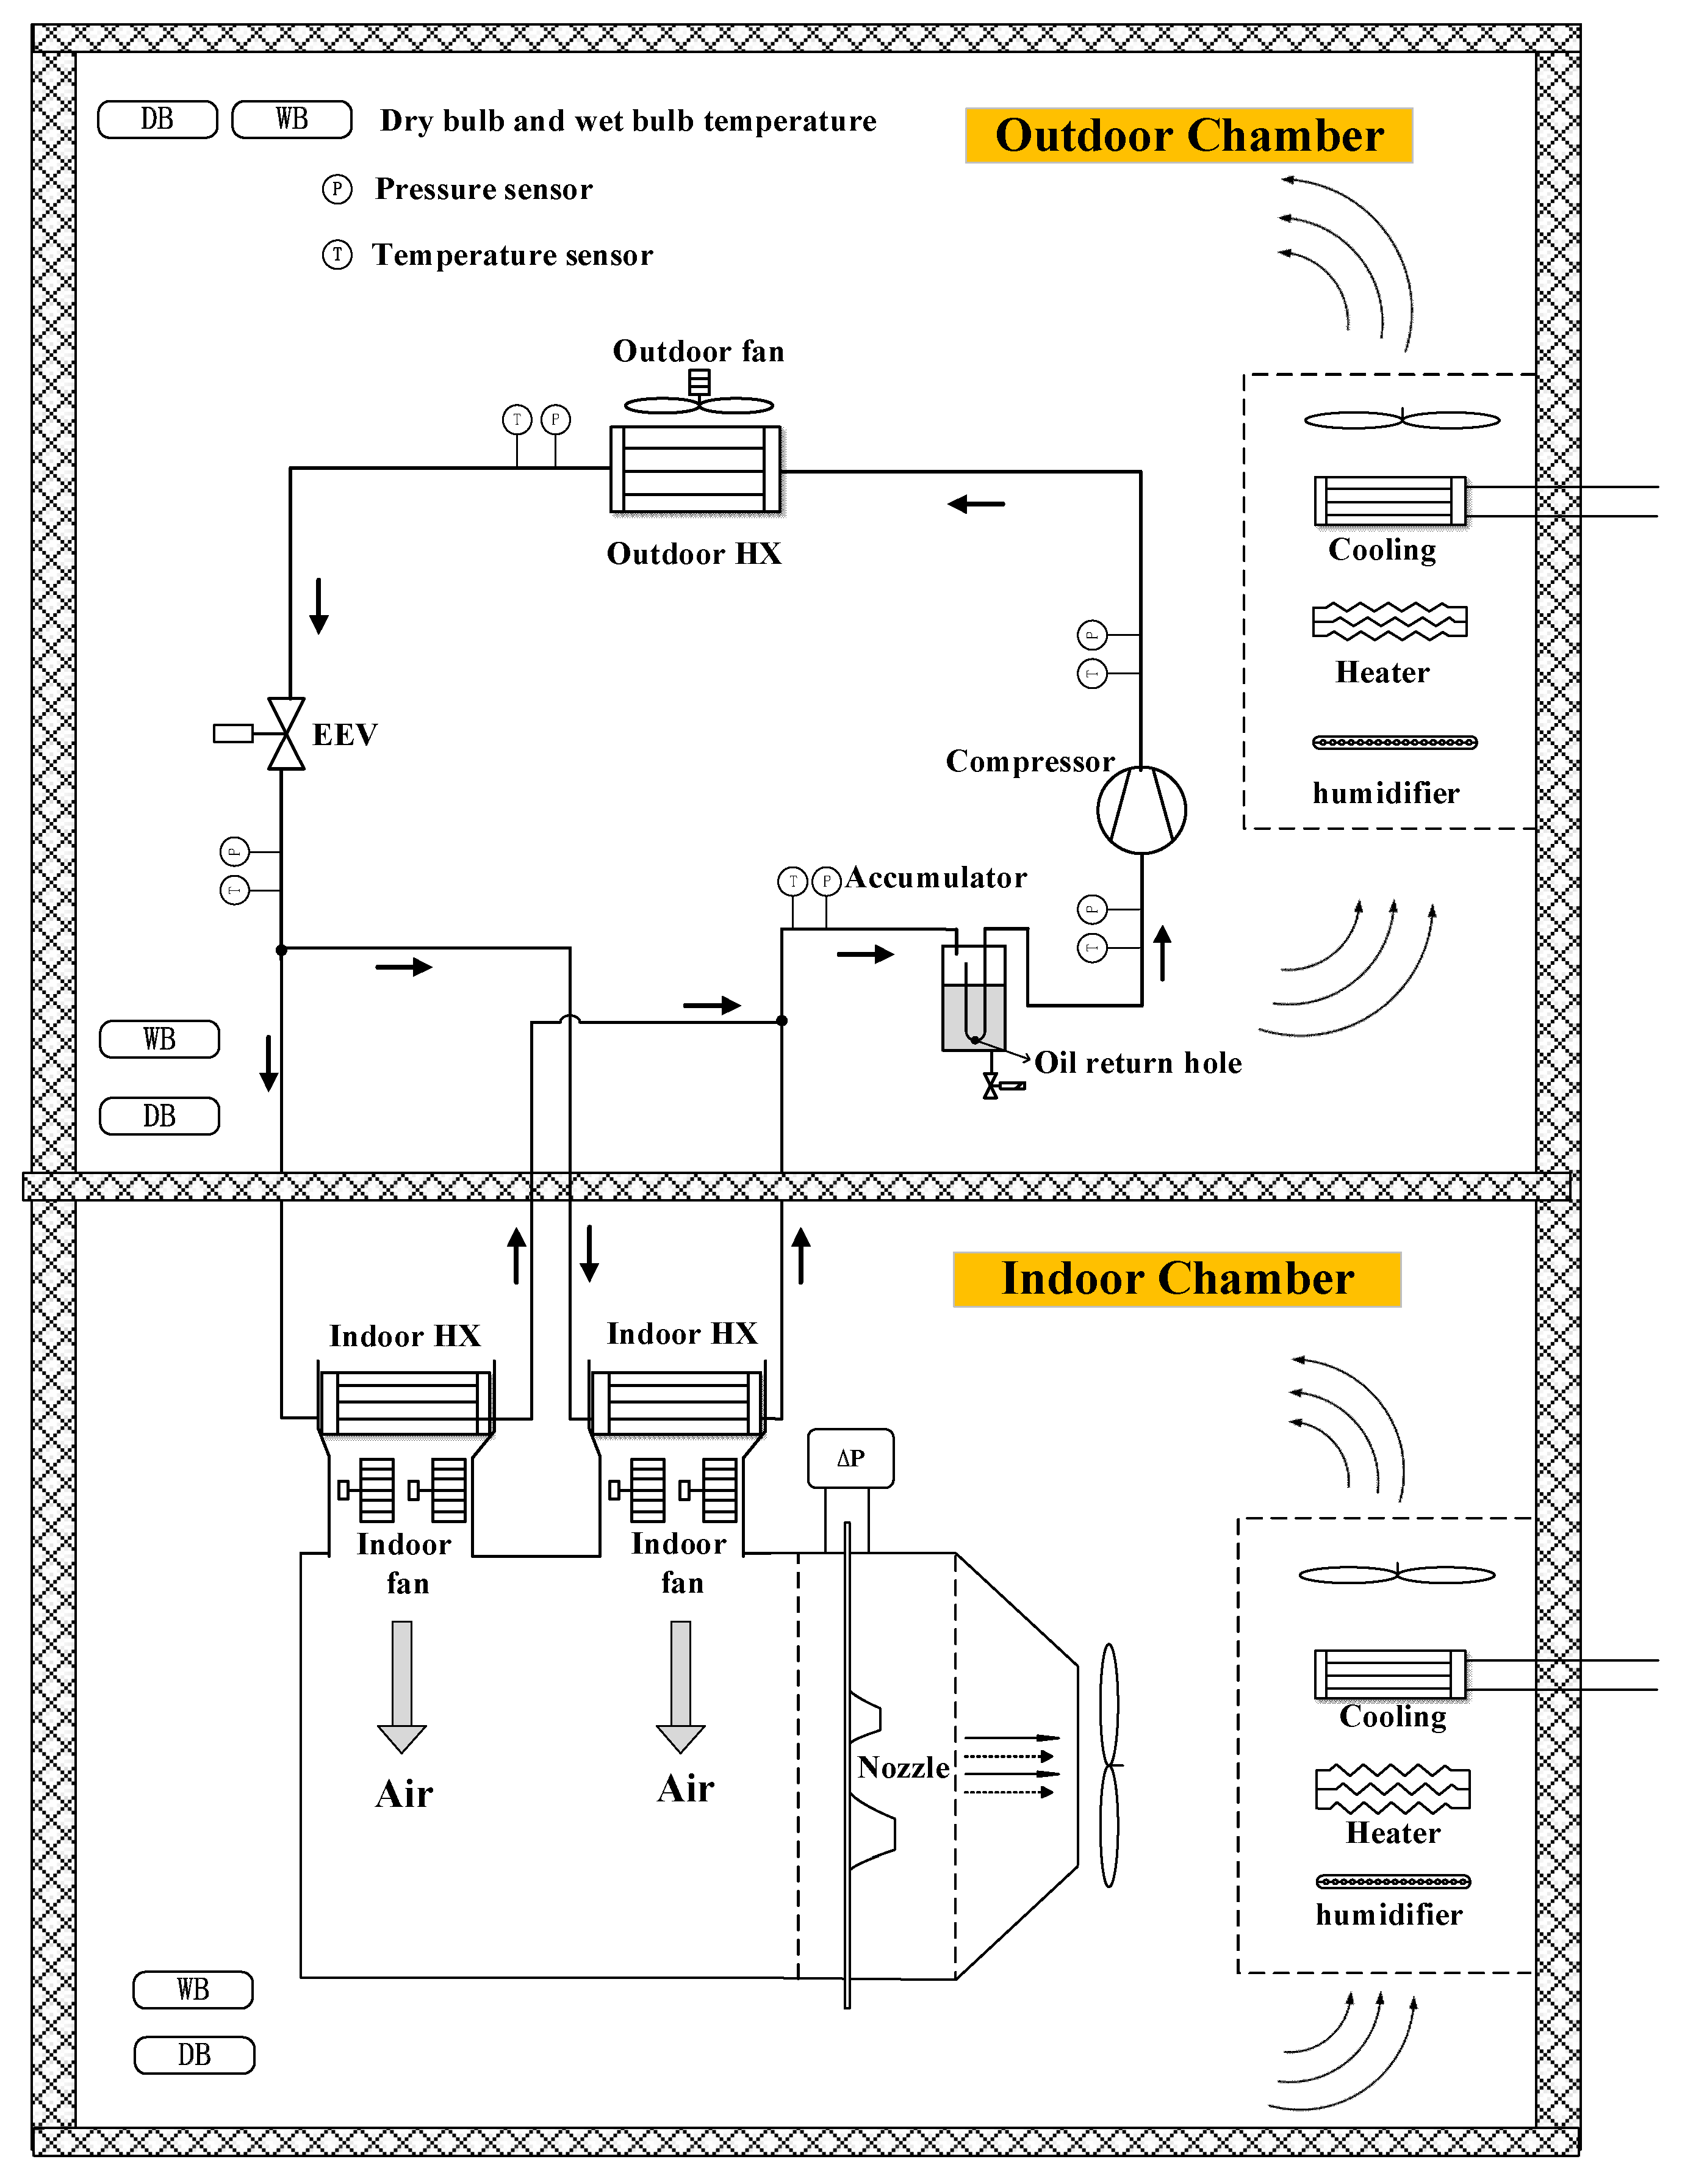
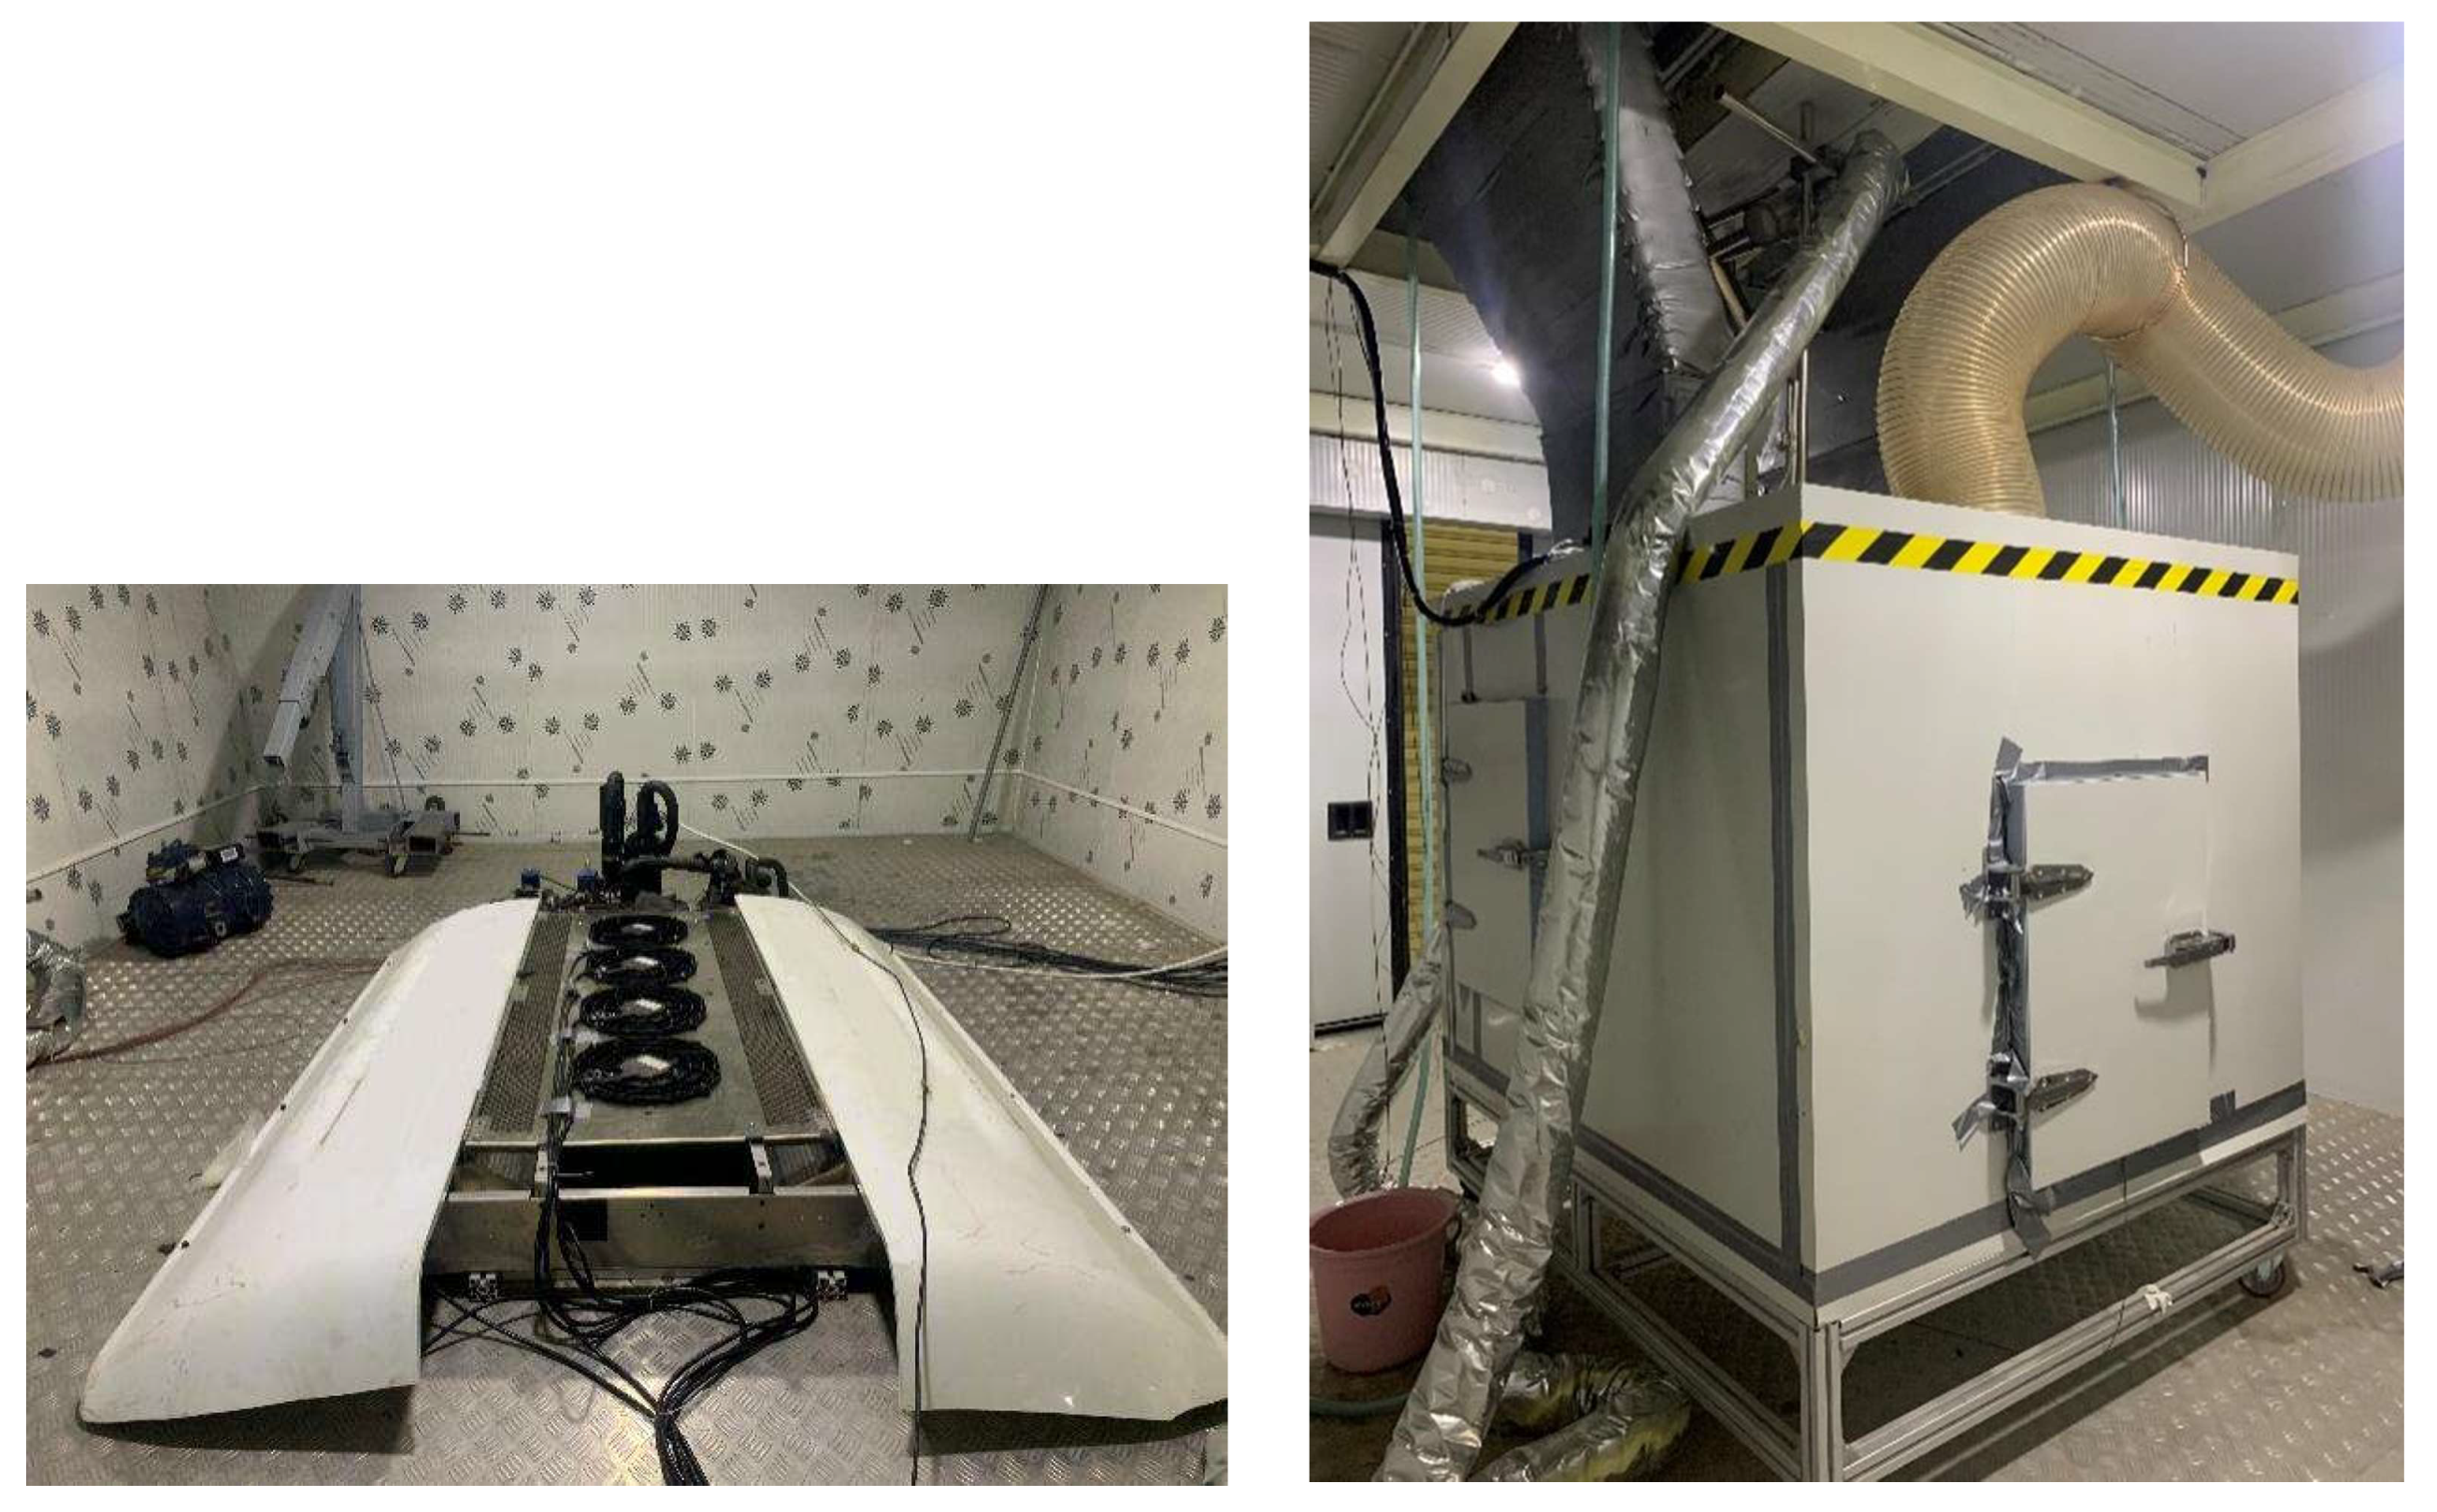
2.1. Experimental Setup Description

The schematic of the employed test rig, i.e., a transcritical CO2 air conditioning system for an 8 m electric bus, is shown in Figure 1. It consists of an electrical compressor, two indoor heat exchangers (HXs), an outdoor HX, an EEV and an accumulator. The compressor used in the test rig is a rotary type with double cylinders and whose displacement is 5.4 m3⋅h−1 at 3600 RPM. In addition, its speed can vary from 1800 RPM to 5400 RPM. The high pressure and the compressor discharge temperature could not be above 12 MPa and 120 °C, respectively, due to safety reasons. The indoor HXs and the outdoor HX are fin tube heat exchangers. Four axial flow fans were installed on the outdoor HX, while two centrifugal fans were mounted on each indoor HX. The 4.8 L accumulator is located upstream of the compressor suction pipe to protect the compressor and enhance the system adaptability under different working conditions. A Saginomiya JKV-24D EEV was used in the system, and it was driven by a stepper motor, whose operating range is 0–480 step. The specifications of each component are listed in Table 1.

2.2. Test Procedures

To investigate the impacts of refrigerant charge on system performance in the transcritical CO2 refrigeration system for electric buses, a series of steady-state tests were conducted under different refrigerant charges, different EEV opening degrees and different ambient temperatures. The experiments were carried out in the upper and lower separated enthalpy difference chamber, both of which can independently control the environment temperature and humidity. The photos of the test rig in both parts of the enthalpy difference chamber are shown in Figure 2. The outdoor ambient temperatures were set to 35 °C, 38 °C and 40 °C in the experiments, while the indoor dry/wet bulb temperatures were set to 27 °C/19.5 °C. Furthermore, the air flow rates of the indoor and outdoor fans were kept constant at 3100 m3·h−1 and 8800 m3·h−1, respectively. The discharge pressure and temperature of the compressor were controlled to not exceed the aforementioned safety limits, while the compressor speed was set to 3600 RPM in the whole experimental campaign. In addition, the opening of the EEV is reduced by 30 steps per second in the beginning and 10 steps when the system is close to the optimal state. The optimal values of each parameter were obtained in the experiment.
Furthermore, Beak et al. [14] proposed the concept of a normalized refrigerant charge (NRC) to eliminate the effect of the system volume. The actual charge in the various unit scales can be normalized as indicated in Equation (1). The NRC varies from 0 to 1.
NRC = M a c t u a l M v a p o r M l i q u i d M v a p o r
in which Mactual is the actual refrigerant charge (kg) while Mvapor and Mliquid are the corresponding refrigerant charges (kg) at saturation conditions. The values of Mvapor and Mliquid can be obtained by multiplying the system internal volume with the refrigerant densities at the saturation conditions evaluated at the ambient temperature of 25 °C. Table 2 shows the normalized charge value.

2.3. Data Processing

2.3.1. Energy Analysis

The cooling capacity of the CO2 transcritical system for the electric bus was evaluated from the air side given in Equation (2) as follows:
Q ˙ c o o l i n g = V ˙ a ρ a ( h a , i n h a , o u t ) 3600
in which V ˙ a is the volume flow rate of the air (m3·h−1), ρ a is the density of the air (kg·m−3), ha,in and ha,out are the enthalpy of the air at the inlet and outlet of the electric bus cabin (kJ·kg−1), respectively; and 3600 represents the conversion of hours to seconds.
The enthalpies of the air ha,in and ha,out were evaluated as a function of the measured dry-bulb temperature and wet-bulb temperature as follows:
h a = f ( T a , d r y b u l b , T a , w e t b u l b )
The COP was calculated by Equation (4), in which the W ˙ t o t refers to the power input of compressor and fans as follows:
COP = Q ˙ c o o l i n g W ˙ t o t
Since there is no internal heat exchanger in the system, the CO2 fluid suctioned by the compressor could be in the vapor-liquid state when the charge amount is large. At this time, the enthalpy of the CO2 at inlet of the compressor is calculated by Equation (5):
h c o m , s u c = h e , i n + COP h c o m , o u t 1 + COP
in which h c o m , s u c and h c o m , o u t are the enthalpy of the CO2 at inlet and outlet of the compressor, respectively, and h e , i n is the enthalpy of the CO2 at inlet of the evaporator.

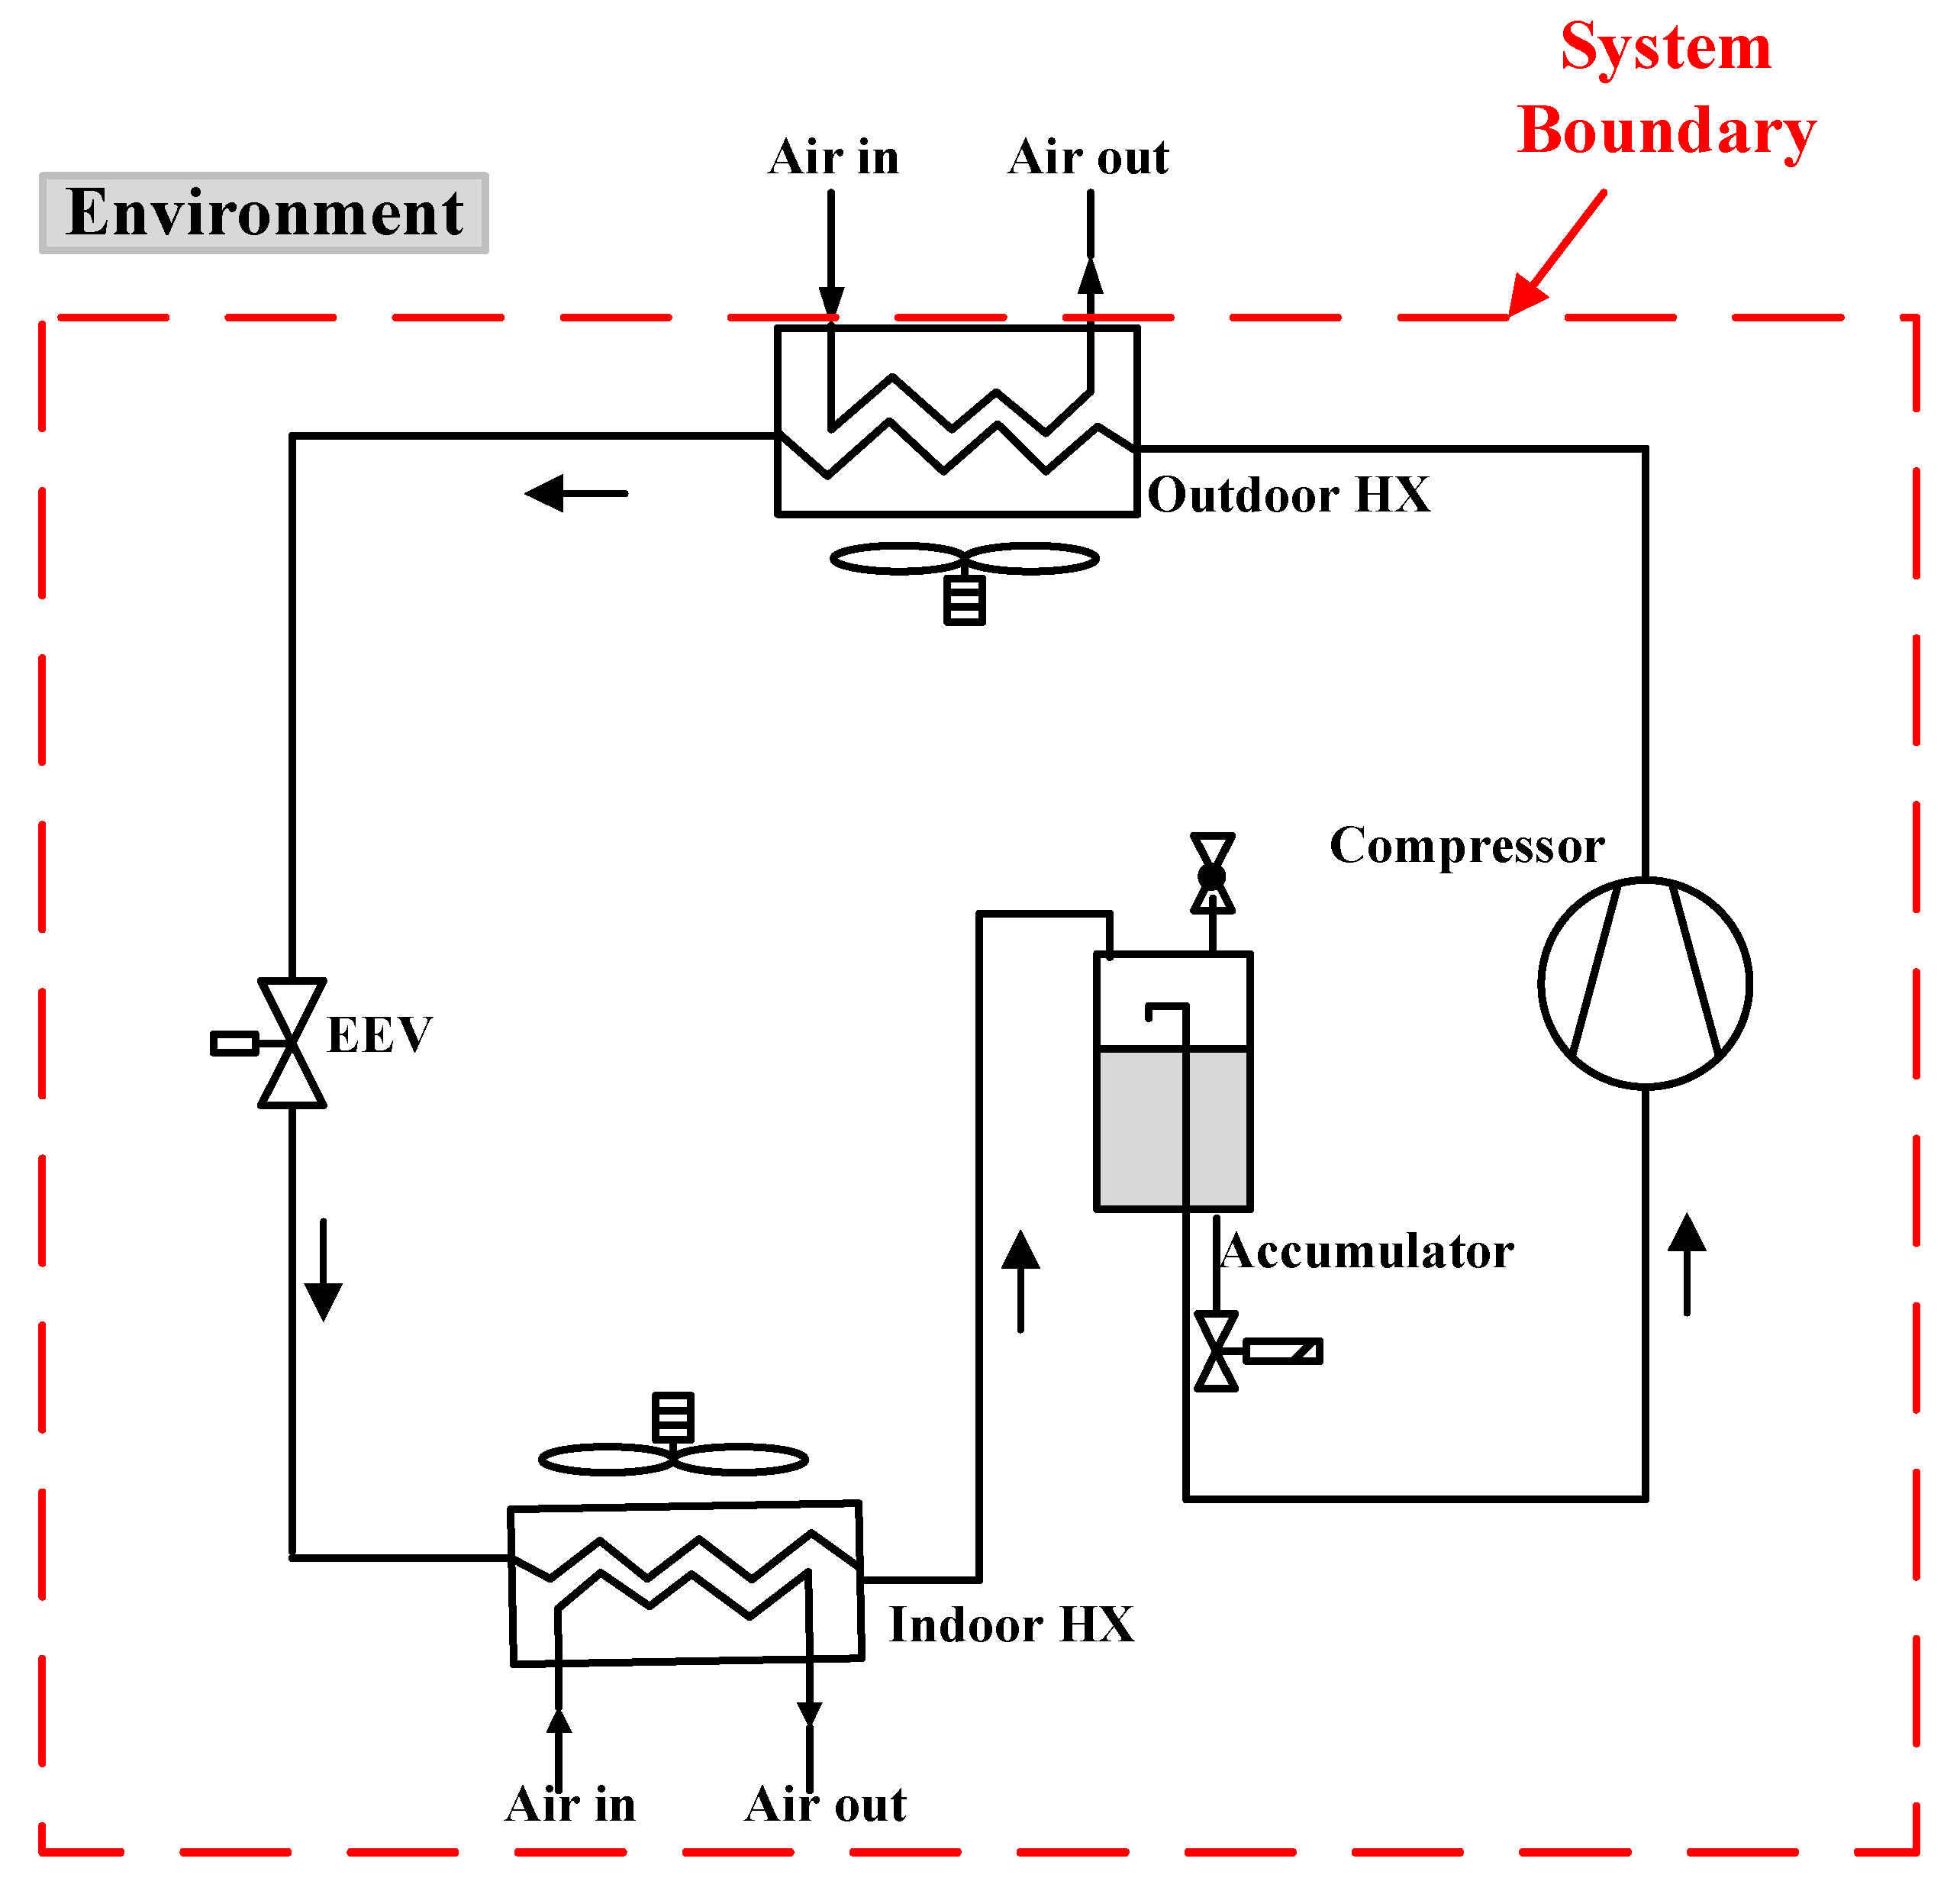
2.3.2. Exergy Analysis

The exergy of a system is the maximum valuable work possible during a process, bringing the system into equilibrium with a heat reservoir. The system boundary, as shown in the Figure 3 was used in the calculation of exergy efficiency. In conformity with the work by Gullo et al. [22,23], the conventional exergy analysis was performed by applying Equation (6) to each component of the investigated system. Equation (6) represents the exergy rate balance within the selected control volume (i.e., the selected component) at steady state conditions, allowing for the assessment of the source of its thermodynamic inefficiencies by calculating its exergy destruction rate ( E ˙ D ). Equation (6) is presented as follows:
j ( 1 T 0 T j ) · Q ˙ j W ˙ + i n m ˙ i n · e i n o u t m ˙ o u t · e o u t E ˙ D = 0
in which the term ( 1 T 0 / T j ) · Q ˙ j indicates the exergy transfer rate related to heat transfer at the rate Q ˙ j occurring at the location on the boundary characterized by a temperature Tj, while the term W ˙ accounts for power. The specific exergy of the selected component was calculated as follows:
e = h h 0 T 0 ( s s 0 )
in which h0 (kJ·kg−1) and s0 (kJ·(kg−1·K−1)) are the enthalpy and entropy of working medium calculated at the dead state, i.e., T0 = 308.15 K, 311.15 K and 313.15 K (ambient temperature of system operation) and p0 = 0.1013 MPa. It is important to highlight that the kinetic, chemical and potential exergy variations are negligible for all vapor compression systems.
The specific exergy of air can be calculated by Equation (8) [24] as follows:
e a = ( c P , a + ω a c P , v ) ( T a T 0 ) T 0 [ ( c P , a + ω a c P , v ) l n ( T a T 0 ) ( R a + ω a R v ) l n ( P a P 0 ) ] + T 0 [ ( R a + ω a R v ) l n ( 1 + 1.6078 ω 0 1 + 1.6078 ω a ) + 1.6078 ω a R a l n ( ω a P ω 0 ) ]
for which ωa is the absolute humidity of air (kgwater/kgdry air); R a and R v are the air and vapor constant (kJ·(kg−1·K−1); and c P , a and c P , v are the specific heat of air and vapor at constant pressure (kJ·(kg−1·°C−1).
The total product exergy rate of the investigated air conditioning unit ( E ˙ P ) was:
E ˙ P , t o t = W ˙ t o t E ˙ D , t o t E ˙ l o s s , t o t
in which the exergy loss rate E ˙ l o s s , t o t (kW) refers to the exergy rate of the air flowing through the gas cooler. In this paper, E ˙ l o s s , t o t was neglected.
The exergy efficiency (η) of the transcritical CO2 cycle was calculated as
η = 1 E ˙ D , t o t W ˙ t o t

2.4. Uncertainty Analysis

The detailed information of the measuring instruments is listed in Table 3.
The uncertainty propagation analysis was performed by using the Kline and McClintock method [25], expressed in the following equation:
ω R = [ ( R x 1 ω 1 ) 2 + ( R x 2 ω 2 ) 2 + + ( R x n ω n ) 2 ] 1 / 2
where ωR is the resulting uncertainty, ω1, ω2, …, ωn are the uncertainties of the independent variables x1, x2, …, xn. According to this method, the maximum uncertainties of Q ˙ c o o l i n g , COP and η were estimated to be ±6.51%, ±6.68% and ±5.84%, respectively. The thermo-physical properties of CO2 and air were derived from NIST REFPROP [26] during the data reduction process.

3. Results and Discussion

3.1. Energy Analysis

Figure 4 presents the variation of the COPopt, cooling capacity ( Q ˙ c o o l i n g ), optimal discharge pressure (Pdis,opt), outlet pressure of the evaporator (Pe,out) and the optimal EEV opening degree (ODopt) with respect to NRC. The values of ODopt as a function of NRC were kept the same at all the selected ambient temperatures, since they were not affected by the latter considerably. The states of sufficient charge showed in Figure 4 (i.e., NRC values between 0.248 and 0.336) refer to the operating conditions at which the COP values are maximized. On the other hand, the excessive and insufficient states in Figure 4 indicate the operating conditions above and below those involving COPmax values, respectively. The ODopt reached the minimum value of 0.479 at sufficient charge states, and at the same time, the optimal discharge pressures were 10.9 MPa, 11.5 MPa and 11.63 MPa at 35 °C, 38 °C and 40 °C, respectively. The highest values of COPopt and Q ˙ c o o l i n g were about 1.716 and 18.97 kW at 35 °C, 1.543 and 17.69 kW at 38 °C and 1.441 and 16.90 kW at 40 °C. As the ambient temperature rose from 35 °C to 40 °C, the COP and cooling capacity of the system decreased by 16.03% and 10.90%, respectively. For low values of NRC, the system performance was found to be very poor. As the NRC was 0.204, the COP and Q ˙ c o o l i n g decreased by 1.39% and 4.06% at 35 °C, by 3.56% and 5.94% at 38 °C and by 7.04% and 9.44% at 40 °C compared to corresponding cases involving NRC values between 0.248 and 0.336, respectively. As the NRC was 0.380, the COP and Q ˙ c o o l i n g decreased by 2.59% and 3.22% at 35 °C, by 1.25% and 0.50% at 38 °C and by 2.91% and 1.51% at 40 °C compared to the corresponding cases involving NRC values between 0.248 and 0.336. It could be concluded that the effect of insufficient charge on cooling capacity is more penalizing than that of a slight overcharge.
Figure 5a shows the variation of COP and Q ˙ c o o l i n g with discharge pressure when the NRC is 0.137 (insufficient charge condition), 0.248 (sufficient charge condition) and 0.381 (excessive charge condition) at 35 °C. It was found that as Pdis reached the optimal value, both COP and Q ˙ c o o l i n g reached the maximum values. Furthermore, when the discharge pressure was higher than Pdis,opt, both COP and Q ˙ c o o l i n g decreased significantly in the insufficient charge condition, whereas they declined more slightly in the sufficient charge condition. However, in the excessive charge condition, as the COP started decreasing slightly, Q ˙ c o o l i n g was still increasing significantly. These phenomena were caused by the migration characteristics of the refrigerant. Figure 5b depicts the P-h diagrams of the investigated system at the aforementioned three conditions at different EEV opening degrees. As the value of OD decreased from 1 to 0.417, Pdis increased slightly (from 9.25 MPa to 9.78 MPa) and Psuc reduced from 4.58 MPa to 3.63 MPa under the insufficient charge condition. The variation of Psuc was more marked than Pdis with the rise in OD, leading to a significant increase in the superheating degree of the system and thus to a sharp reduction of the CO2 mass flow rate. Although the enthalpy difference in indoor HXs increased, the cooling capacity was found to reduce. With the rise in refrigerant charge, the amount of refrigerant in the indoor HXs and outdoor HX increased. Additionally, the Psuc decreased slightly and the Pdis increased with the reduction in OD. Under the sufficient charge condition, Pdis increased from 10.04 MPa to 11.17 MPa and the Psuc reduced from 5.02 MPa to 4.53 MPa as the value of OD decreased from 1 to 0.417. In addition, as OD was lower than the optimal value, the refrigerant drawn by the compressor was superheated vapor and its superheating degree increased with decrease in EEV opening degree, resulting in a slight reduction in cooling capacity. Under the excessive charge condition, Pdis sharply increased from 10.16 MPa to 11.81 MPa and the refrigerant drawn by the compressor was in the condition of a vapor–liquid mixture. Thus, the increase of enthalpy difference in the evaporators rather than the decrease of flow rate was the main factor affecting the system cooling capacity, causing an increase in cooling capacity. Therefore, it could be concluded that from the insufficient charge condition to the sufficient charge condition, the refrigerant mainly migrated to the three heat exchangers, whereas in the excessive charge condition the accumulation of refrigerant in the gas cooler was more marked than that in the evaporators.

3.2. Exergy Analysis

Figure 6 indicates that the exergy efficiency (η) corresponding to the optimal COP increased with rise in NRC. In addition, at sufficient charge conditions, η was equal to 29.79%, 28.32% and 26.15% at 35 °C, 38 °C and 40 °C, respectively. As the ambient temperature rose from 35 °C to 40 °C, η decreased by 12.22%. It is worth noting that although the system was undercharged (i.e., NRC between 0.100 and 0.248), the exergy efficiency almost remained the same. In contrast, the value went up sharply in excessive charge conditions. However, although the compressor power input was small as the NRC was 0.10, the power input of the indoor/outdoor fans was relatively high, which led to the reduction of η. Furthermore, in the excessive charge condition, the total product exergy rate and compressor power consumption increased with the rapid rise of the CO2 mass flow rate. Therefore, the exergy efficiency increased, since the fan power input accounted for a small proportion of the total power input. It could be concluded that the value of the η was not sensitive to slight insufficient charge, whereas overcharging the system resulted in even greater exergy efficiency under the condition of ensuring the maximum COP.
Figure 7 shows the effect of the discharge pressure (Pdis) on the exergy efficiency (η), the total product exergy rate ( E ˙ P , t o t ), the total power input ( W ˙ t o t ) and the total exergy destruction rate ( E ˙ D , t o t ) at 35 °C. It can be seen from Figure 7a that the value of η first increased and then decreased with rise in Pdis under different charging conditions. Total power input went up almost linearly with the increase in Pdis, whereas the growth rate of E ˙ D , t o t continues to rise (shown in Figure 7b), resulting in a peak value of η. However, the Pdis corresponding to the maximum η of each charging condition was smaller than that of the maximum COP. The maximum value of η increased first and then decreased with the NRC increase and achieved the maximum value of 30.74% in the sufficient charging condition. In addition, similar to cooling capacity, the total product exergy rate ( E ˙ P , t o t ) first increased and then decreased with the rise in Pdis in the insufficient and sufficient charge conditions, whereas no peak value in the excessive charge condition was observed.
Figure 7b shows that E ˙ D , t o t increased significantly in insufficient charge conditions and it rose even more sharply as Pdis was greater than 10.9 MPa (Pdis,opt) in sufficient charge conditions. The main reason is that the temperature difference between air and refrigerant in the evaporator increased due to the low evaporator pressure. Furthermore, the refrigerant drawn by the compressor was at the state of superheated vapor under these conditions, causing an increase of Tdis and thus higher exergy destruction within the gas cooler.
The variation of exergy destruction percentages of the compressor, gas cooler, EEV and evaporator with NRC corresponding to the optimal COP at ambient temperature of 35 °C is shown in Figure 8. It was found that the exergy destruction percentage of the compressor varies more significantly, increasing from 24.69% to 44.27% as NRC increase from 0.100 to 0.373. This is related to the slight increase of the compressor isentropic efficiency. On the contrary, the exergy destruction percentage of the evaporator decreased from 19.78% to 7.97% mainly due to the rise of the evaporation pressure and the reduction of the heat transfer temperature difference between air and refrigerant. In the gas cooler the exergy destruction decreased gradually due to the reduction of the compressor discharge temperature. Furthermore, the CO2 entropy difference between the inlet and outlet of the EEV decreased gradually with rise in NRC, thus the exergy destruction percentage also showed a slight downward trend. The exergy destruction percentage of the gas cooler and EEV corresponded to 22.06~27.08% and 24.13~29.63%, respectively. It could be concluded that insufficient refrigerant charging in the investigated air conditioner unit seriously affected the thermodynamic performance of the indoor and outdoor HXs, whereas slight overcharge was found to have little effect on the thermodynamic performance of each component. Finally, the obtained results suggested the need to improve the efficiency of the CO2 compressor.

4. Conclusions

In this paper, the performance of a transcritical CO2 air conditioning system for an electric bus has been investigated from an energy and exergy point of view. The effects of the normalized refrigerant charge, ambient temperature and EEV opening degree on the cycle performance have been analyzed in detail. The crucial conclusions are summarized below:
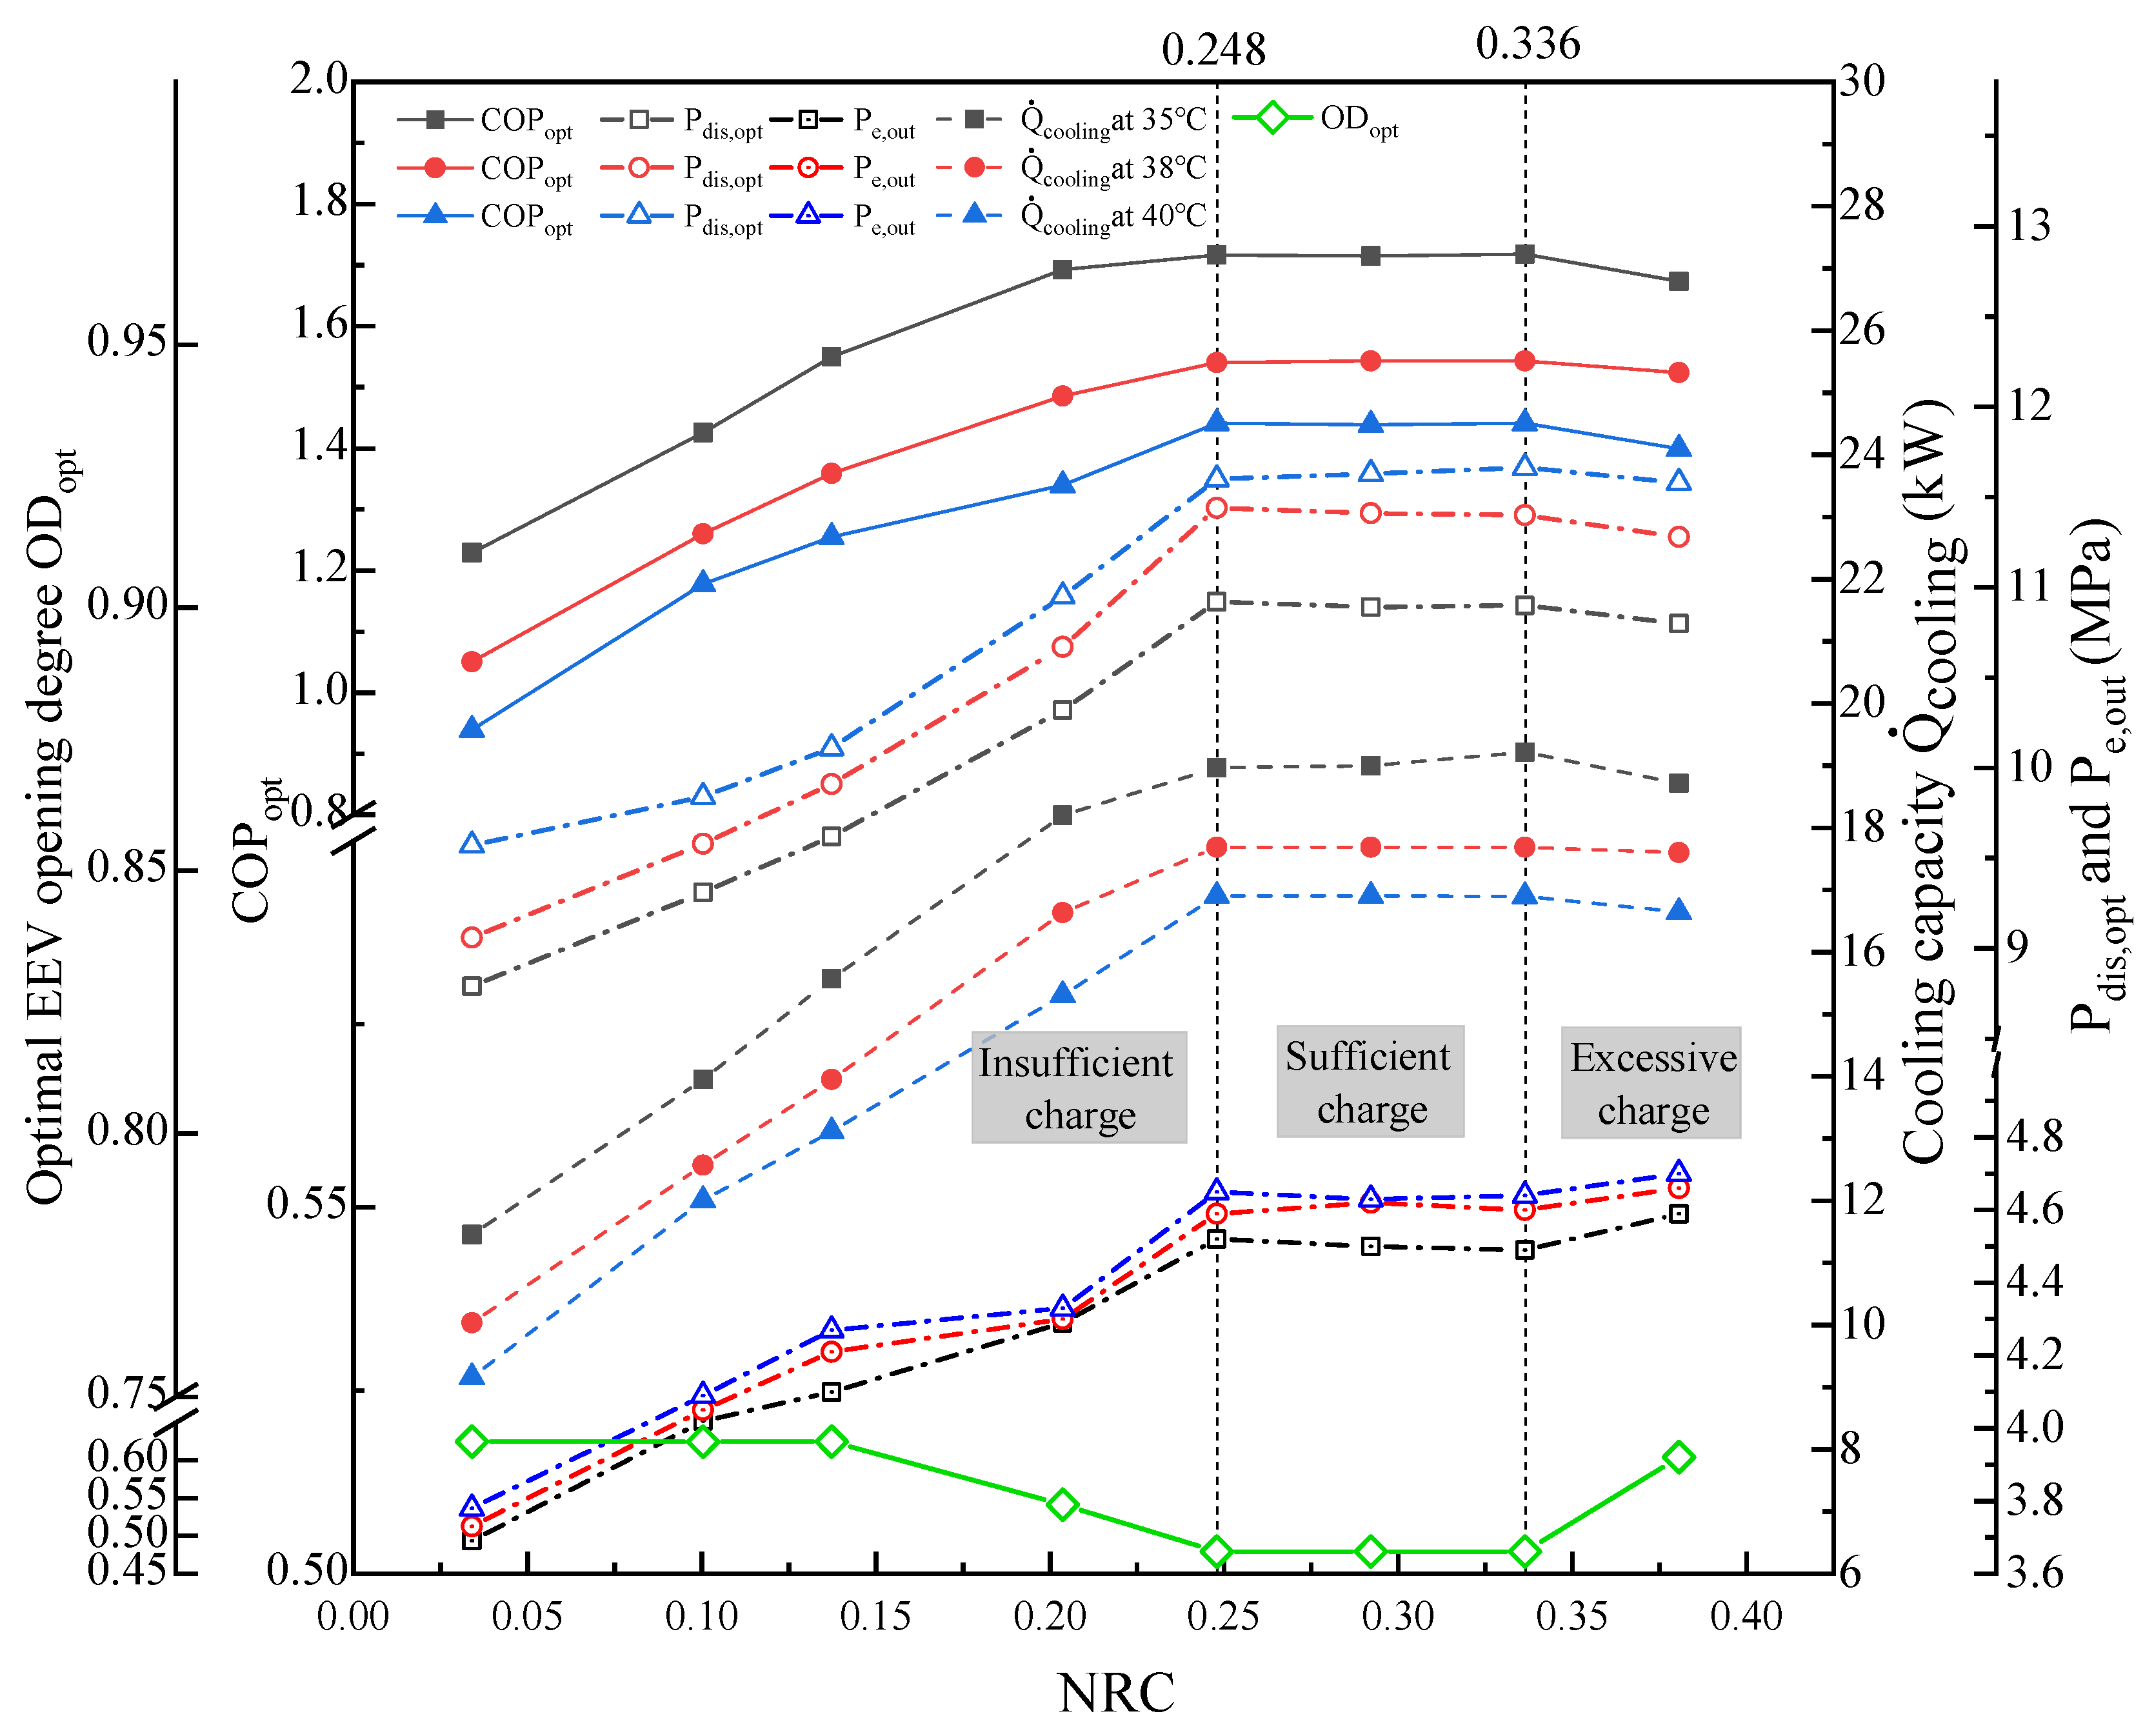
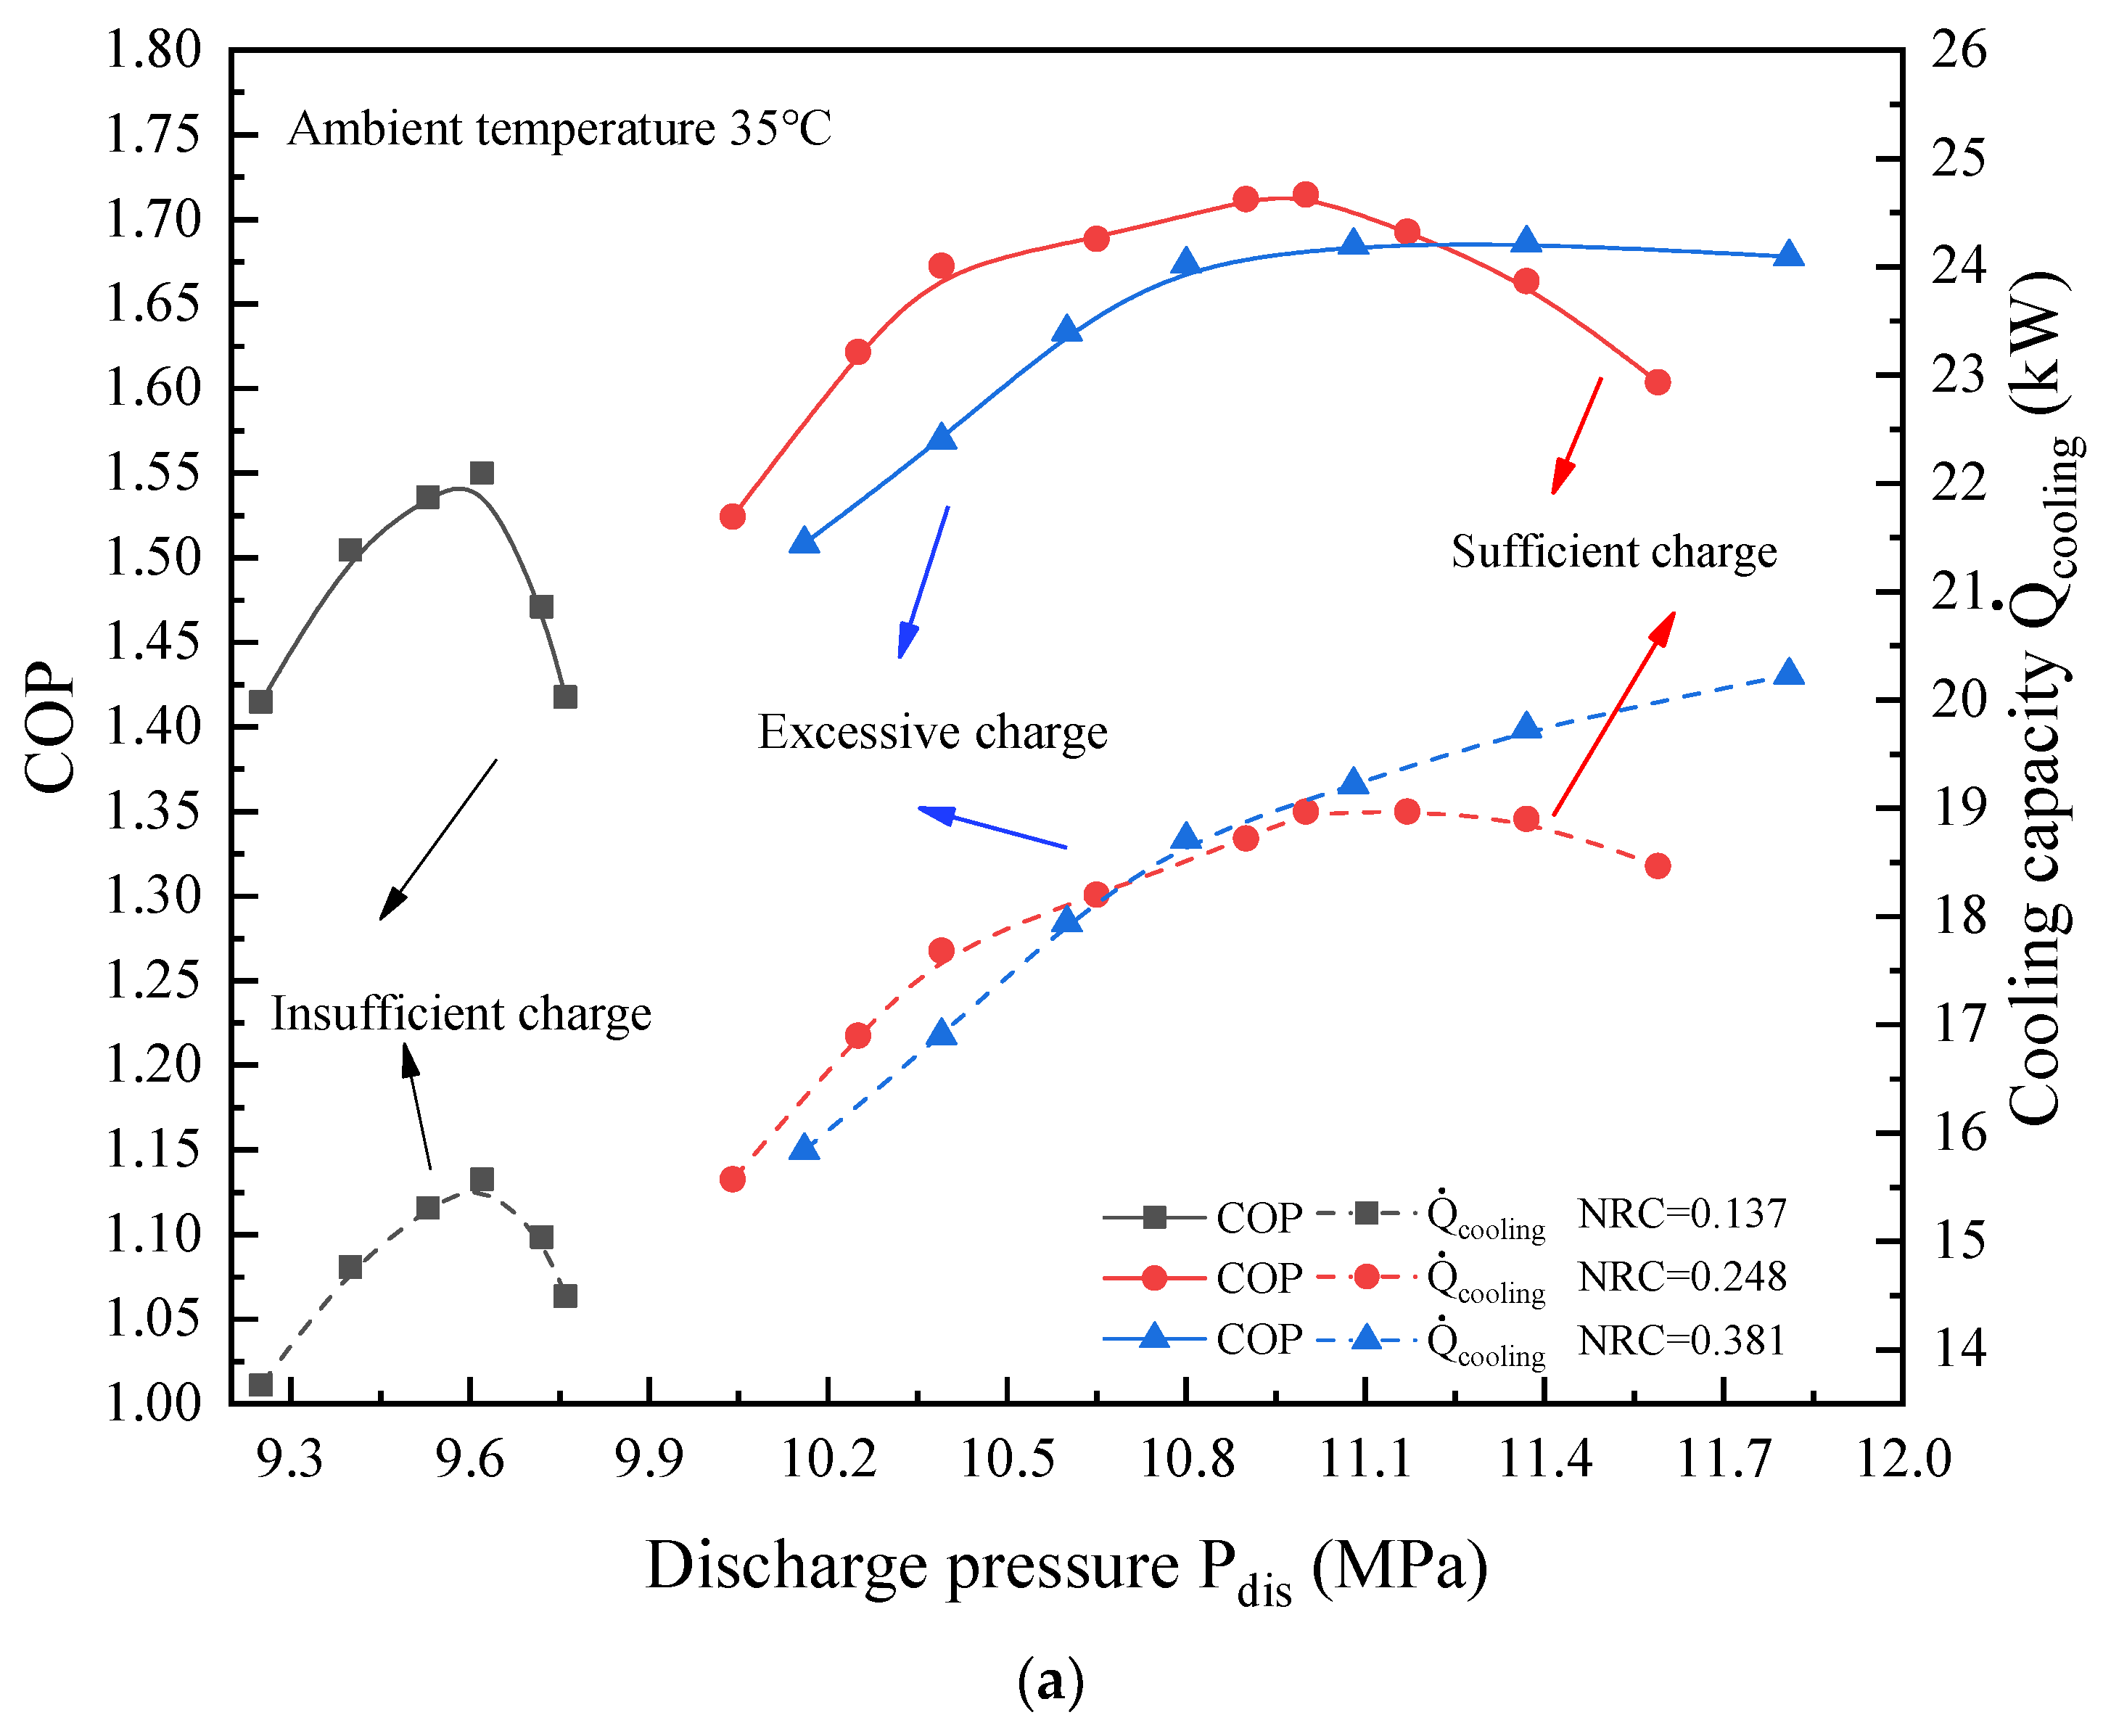
  • In order to ensure the maximum COP, the optimal range of the NRC is between 0.248 and 0.336 for transcritical CO2 electric bus air conditioning units.
  • The effect of an insufficient charge on cooling capacity degradation is more penalizing than that of a slight refrigerant overcharge. This result is more evident with rise in ambient temperature.
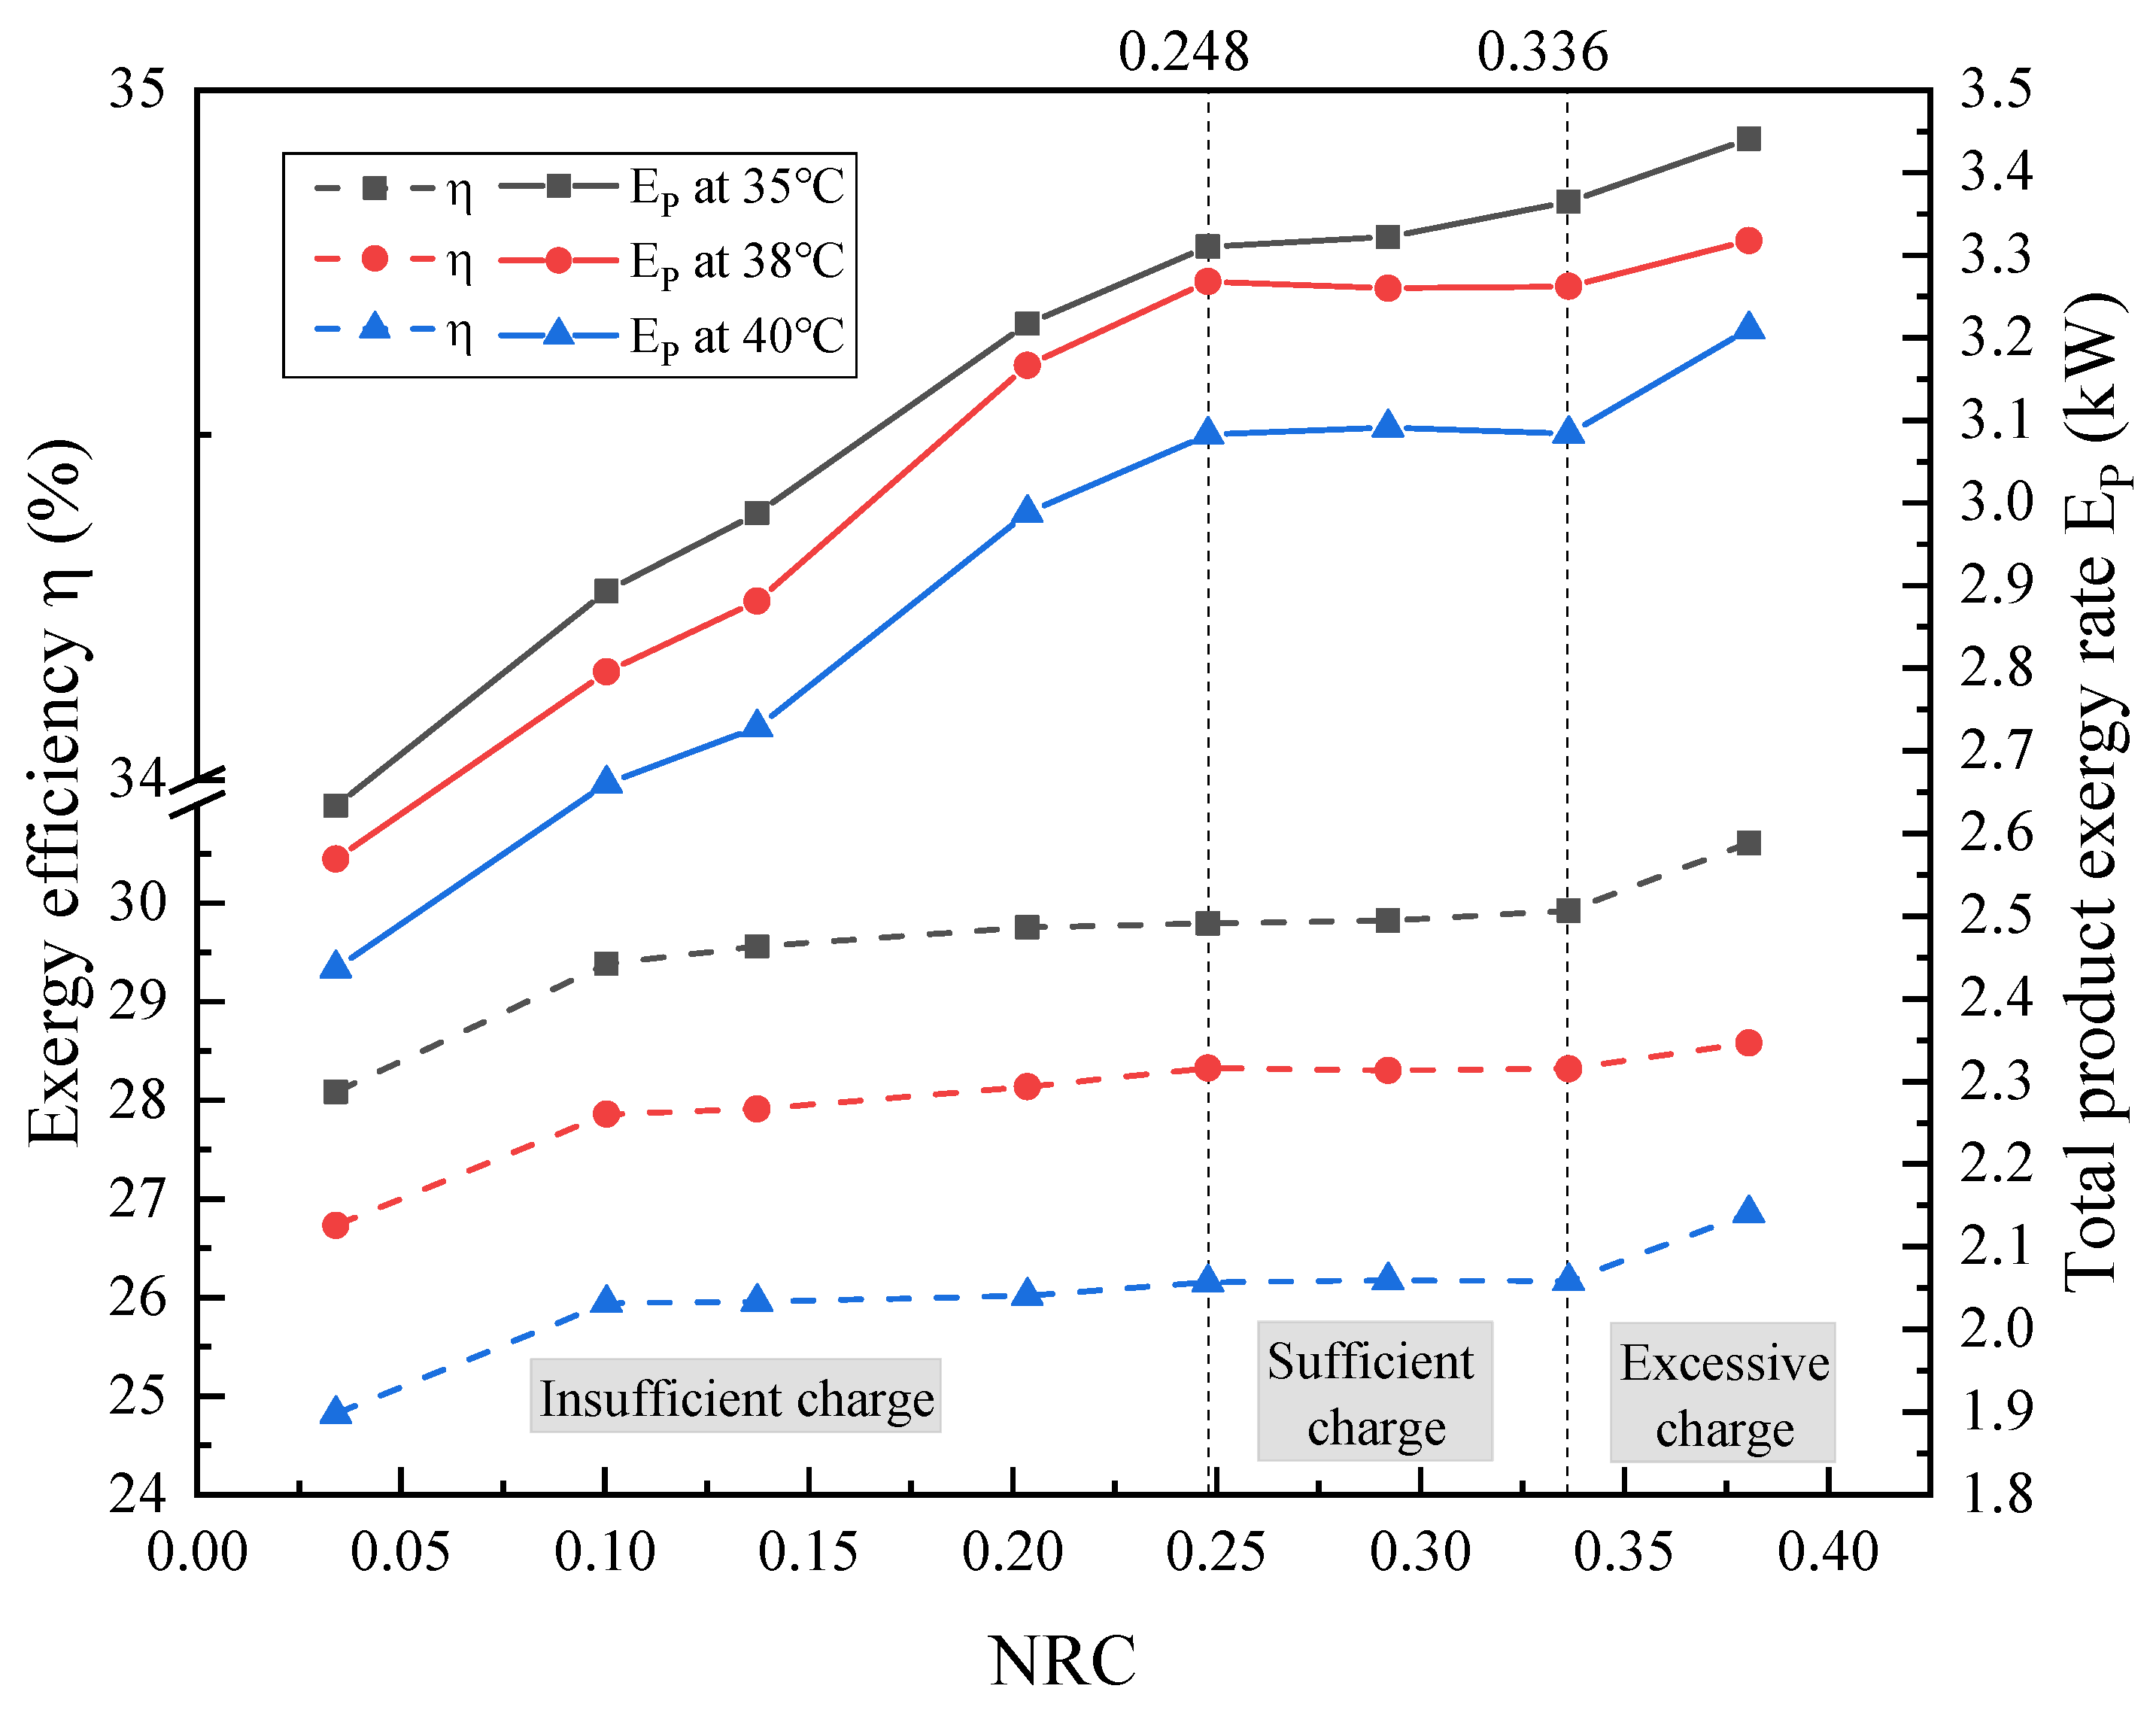
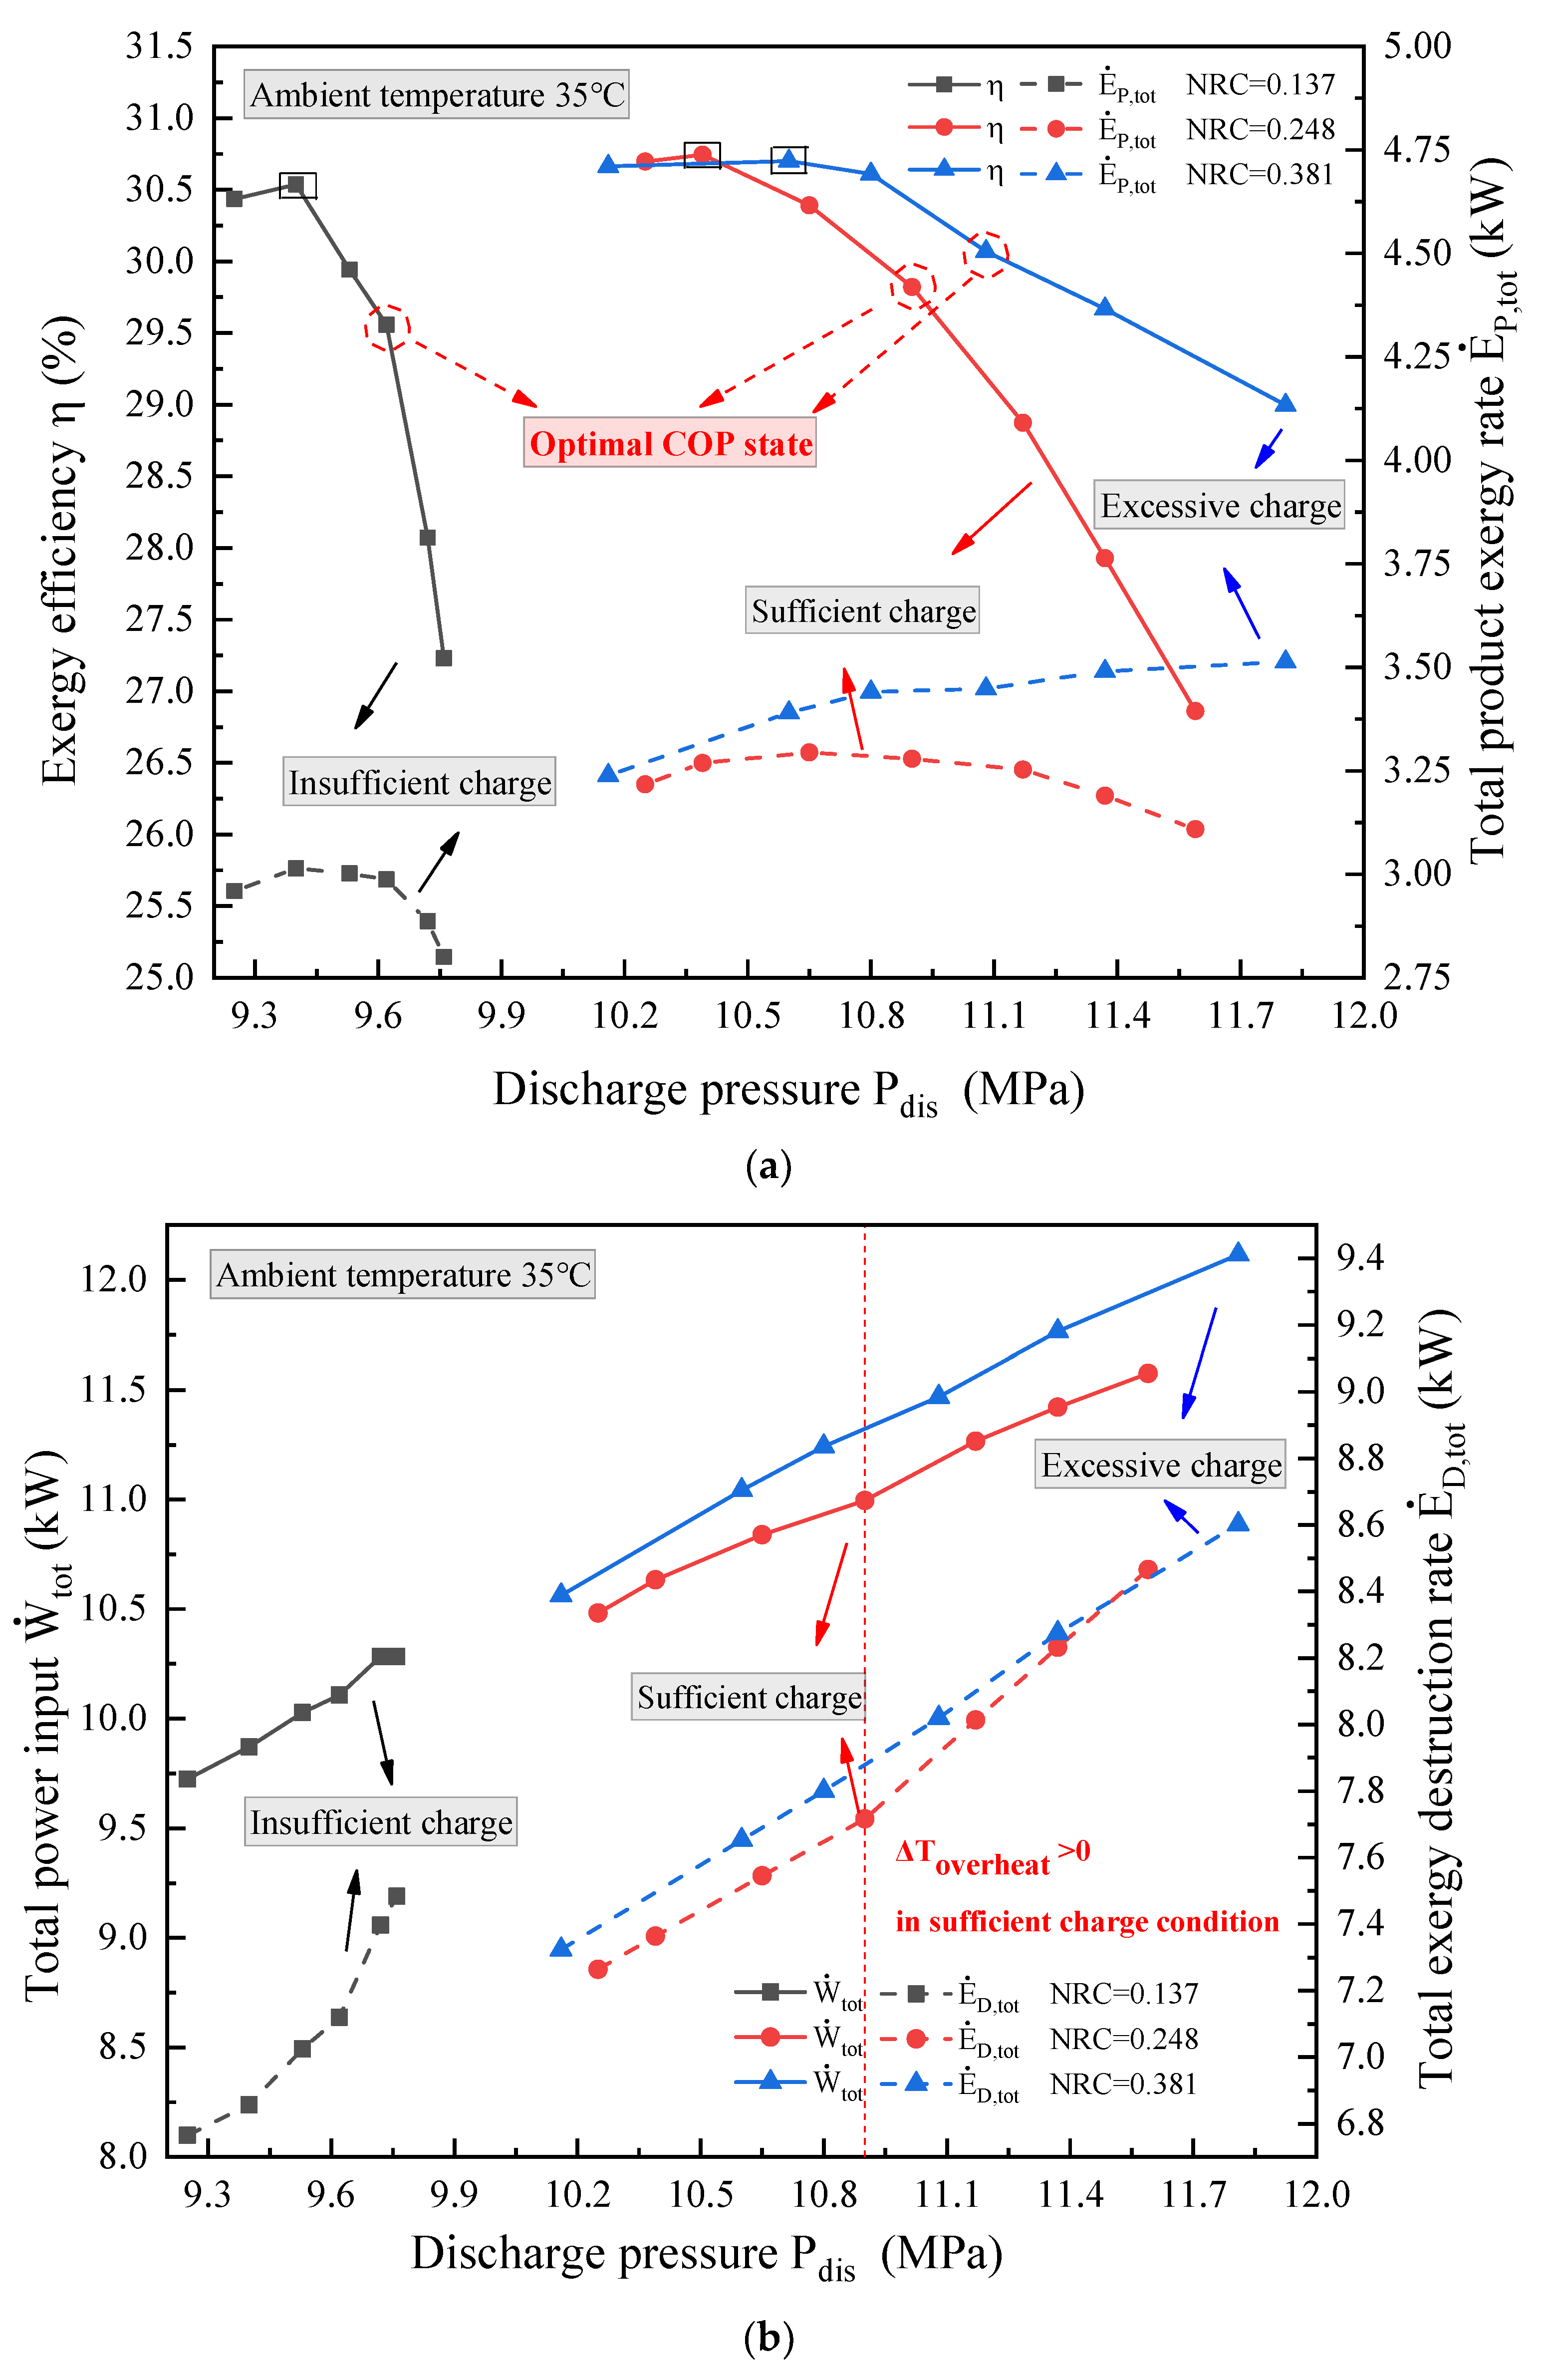
  • The maximum value of the exergy efficiency is equal to 30.74% in the sufficient charging condition. However, the maximum value of the exergy efficiency and the optimal value of COP do not coincide.
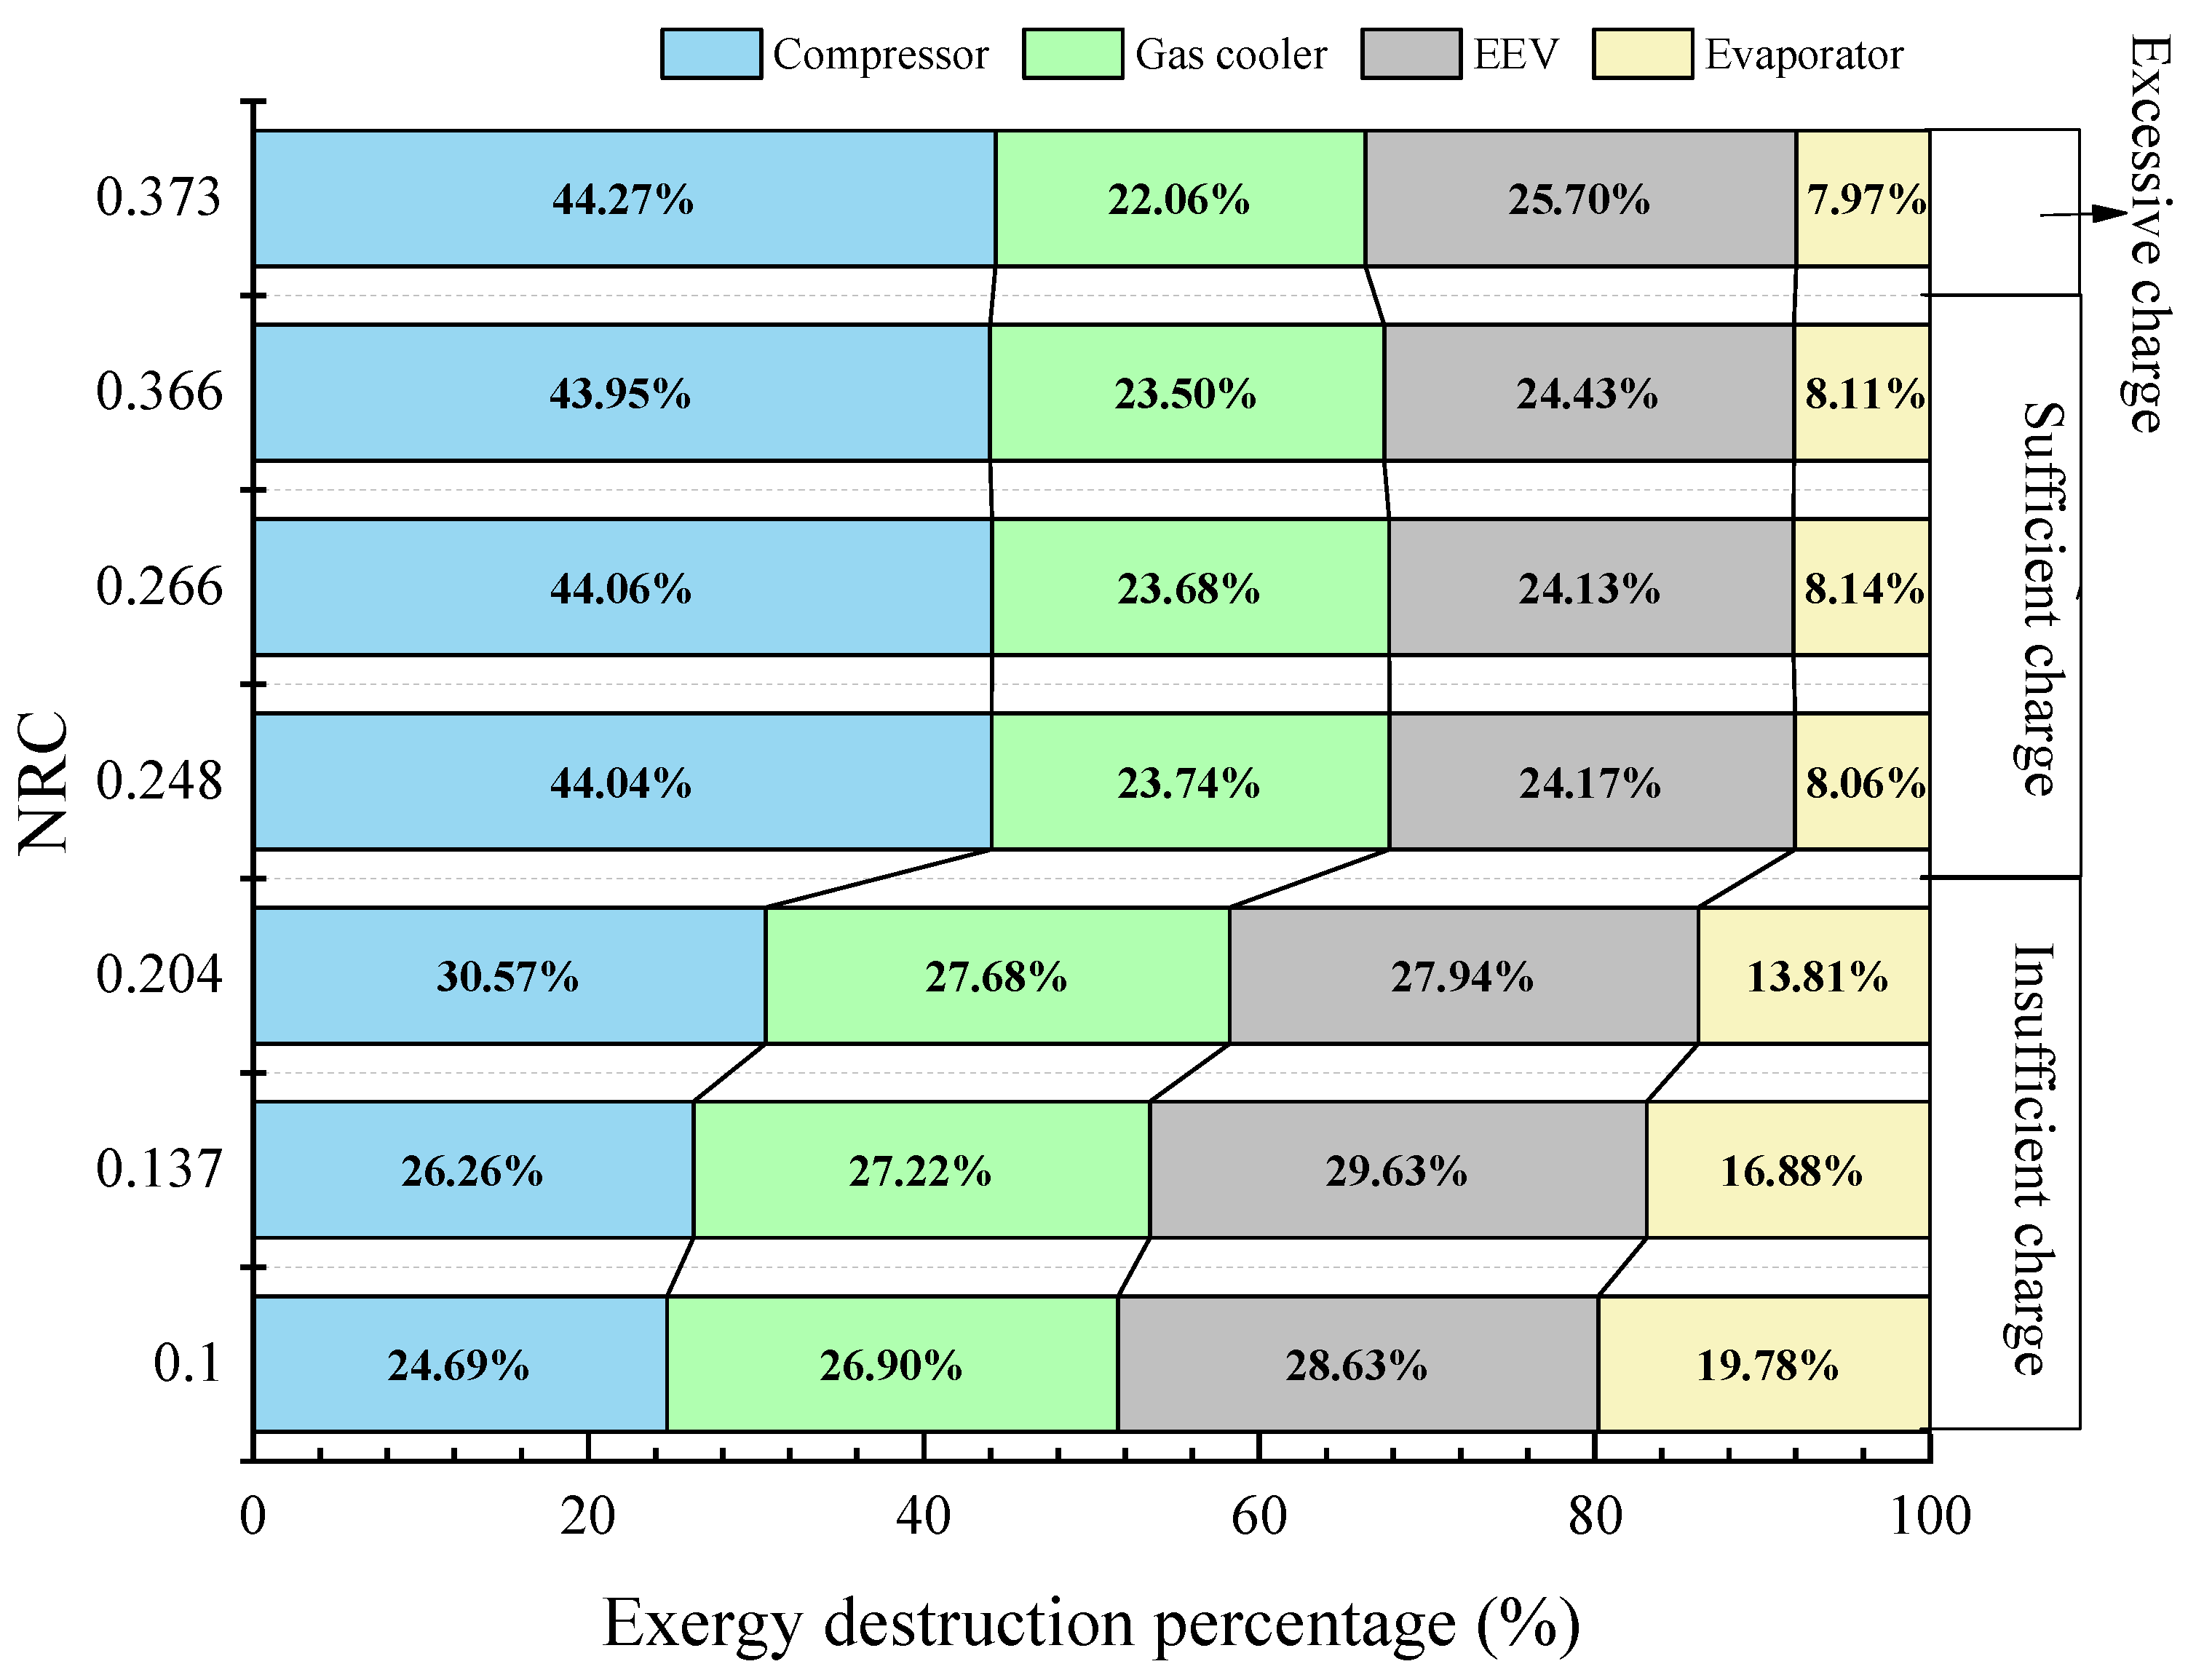
  • Similarly to the optimal COP conditions, the exergy efficiency is not sensitive to slight insufficient charge and refrigerant overcharge is even beneficial to the exergy efficiency. In addition, insufficient refrigerant charge affected the irreversibilities in the indoor and outdoor HXs significantly, whereas slight refrigerant overcharge has little effect on the thermodynamic performance of each component. Finally, the work has revealed the need to enhance the efficiency of the compressor.

Author Contributions

Conceptualization, H.W. and Y.S.; methodology, H.W. and S.L.; software, H.W.; validation, Y.S. and S.L.; formal analysis, Y.S. and X.Y.; investigation, H.W. and S.L.; resources, Y.S. and F.C.; data curation, H.W.; writing—original draft preparation, H.W. and P.G.; writing—review and editing, All authors; visualization, H.W.; supervision, Y.S., X.Y. and F.C.; project administration, Y.S. and F.C.; funding acquisition, F.C. and Y.S. All authors have read and agreed to the published version of the manuscript.

Funding

H.W., S.L., Y.S., X.Y. and F.C. gratefully acknowledge the financial supports from the National Natural Science Foundation of China (No. 51976153 and No. 52006161).

Conflicts of Interest

The authors declare no conflict of interest.

Nomenclature

COPCoefficient of performance
cpSpecific heat at constant pressure, (kJ·(kg−1·°C−1))
EEVElectronic expansion valve
E ˙ D Exergy destruction rate, (kW)
E ˙ l o s s Exergy loss rate, (kW)
E ˙ P Product exergy rate, (kW)
eSpecific exergy, (kJ·kg−1)
GWPGlobal warming potential
HFCHydrofluorocarbons
HXHeat exchanger
hSpecific enthalpy, (kJ·kg−1)
m ˙ Mass flow rate, (kg·s−1)
M a c t u a l Actual refrigerant charge, (kg)
M v a p o r Mass at saturated vapor, (kg)
M l i q u i d Mass at saturated liquid, (kg)
MACMobile air conditioning
NRCNormalized refrigerant charge
ODEEV opening degree, (%)
ODPOzone depletion potential
PPressure, (MPa)
Q ˙ Heat transfer rate, (kW)
RGas constant, (kJ·kg−1·K−1)
TTemperature, (°C)
RPMRound per minute, (r·min−1)
sSpecific entropy, (kJ·(kg−1·K−1))
V ˙ Air volume flow rate, (m3·h−1)
W ˙ Power input, (kW)
η Exergy efficiency, (%)
ω Absolute humidity of air, (kgwater/kgdry air)
ρ a i r Air density, (kg·m−3)
Subscripts
0Dead state
aAir
comComporsor
disDischarge of compressor
eEvaporater
inInlet
optOptimal
outOutlet
rRefrigerant
sucSuction of compressor
totTotal
vVapor

References

  1. Han, X.; Zou, H.; Wu, J.; Tian, C.; Tang, M.; Guangyan, H. Investigation on the heating performance of the heat pump with waste heat recovery for the electric bus. Renew. Energy 2020, 152, 835–848. [Google Scholar] [CrossRef]
  2. Kunith, A.; Goehlich, D.; Mendelevitch, R. Planning and optimization of a fast-charging infrastructure for electric urban bus systems. In Proceedings of the Second International Conference on Traffic and Transport Engineering (ICTTE), Belgrade, Serbia, 27–28 November 2014. [Google Scholar]
  3. Han, X.; Zou HXu, H.; Tian, C.; Kang, W. Experimental study on vapor injection air source heat pump with internal heat exchanger for electric bus. Energy Procedia 2019, 158, 4147–4153. [Google Scholar] [CrossRef]
  4. Lorentzen, G.; Pettersen, J. A new efficient and environmentally benign system for car air-conditioning. Int. J. Refrig. 1993, 16, 4–12. [Google Scholar] [CrossRef]
  5. Wang, D.; Yu, B.; Li, W.; Shi, J.; Chen, J. Heating performance evaluation of a CO2 heat pump system for an electrical vehicle at cold ambient temperatures. Appl. Therm. Eng. 2018, 142, 656–664. [Google Scholar] [CrossRef]
  6. Chen, Y.; Zou, H.; Dong, J.; Wu, J.; Xu, H.; Tian, C. Experimental investigation on the heating performance of a CO2 heat pump system with intermediate cooling for electric vehicles. Appl. Therm. Eng. 2021, 182, 116039. [Google Scholar] [CrossRef]
  7. Kim, S.C.; Min, S.K.; Hwang, I.C.; Lim, T.W. Heating performance enhancement of a CO2 heat pump system recovering stack exhaust thermal energy in fuel cell vehicles. Int. J. Refrig. 2007, 30, 1215–1226. [Google Scholar] [CrossRef]
  8. Dong, J.; Wang, Y.; Jia, S.; Zhang, X.; Huang, L. Experimental study of R744 heat pump system for electric vehicle application. Appl. Therm. Eng. 2021, 183, 116191. [Google Scholar]
  9. Dai, B.; Liu, S.; Sun, Z.; Ma, Y. Thermodynamic performance analysis of CO2 transcritical refrigeration cycle assisted with mechanical subcooling. Energy Procedia 2017, 105, 2033–2038. [Google Scholar] [CrossRef]
  10. Gullo, P.; Hafner, A.; Banasiak, K. Transcritical R744 refrigeration systems for supermarket applications: Current status and future perspectives. Int. J. Refrig. 2018, 93, 269–310. [Google Scholar] [CrossRef]
  11. Song, Y.; Ma, Y.; Wang, H.; Yin, X.; Cao, F. Review on the simulation models of the two-phase-ejector used in the transcritical carbon dioxide systems. Int. J. Refrig. 2020, 119, 434–447. [Google Scholar] [CrossRef]
  12. Hazarika, M.M.; Ramgopal, M.; Bhattacharyya, S. Studies on a transcritical R744 based summer air-conditioning unit: Impact of refrigerant charge on system performance. Int. J. Refrig. 2018, 89, 22–39. [Google Scholar] [CrossRef]
  13. Cho, H.; Ryu, C.; Kim, Y.; Kin, H.Y. Effects of refrigerant charge amount on the performance of a transcritical CO2 heat pump. Int. J. Refrig. 2005, 28, 1266–1273. [Google Scholar] [CrossRef]
  14. Baek, C.; Heo, J.; Jung, J.; Cho, H.; Kim, Y. Optimal control of the gas-cooler pressure of a CO2 heat pump using EEV opening and outdoor fan speed in the cooling mode. Int. J. Refrig. 2013, 36, 1276–1284. [Google Scholar] [CrossRef]
  15. Aprea, C.; Greco, A.; Maiorino, A. An experimental study on charge optimization of a trans-critical CO2 cycle. Int. J. Environ. Sci. Technol. 2015, 12, 1097–1106. [Google Scholar] [CrossRef] [Green Version]
  16. Liu, H.; Chen, J.; Chen, Z. Experimental investigation of a CO2 automotive air conditioner. Int. J. Refrig. 2005, 28, 1293–1301. [Google Scholar] [CrossRef]
  17. Wang, D.; Zhang, Z.; Yu, B.; Wang, X.; Shi, J.; Chen, J. Experimental research on charge determination and accumulator behavior in transcritical CO2 mobile air-conditioning system. Energy 2019, 183, 106–115. [Google Scholar] [CrossRef]
  18. Yin, X.; Wang, A.; Fang, J.; Cao, F.; Wang, X. Coupled effect of operation conditions and refrigerant charge on the performance of a transcritical CO2 automotive air conditioning system. Int. J. Refrig. 2021, 123, 72–80. [Google Scholar] [CrossRef]
  19. Wang, Y.; Dong, J.; Jia, S.; Huang, L. Experimental comparison of R744 and R134a heat pump systems for electric vehicle application. Int. J. Refrig. 2021, 121, 10–20. [Google Scholar] [CrossRef]
  20. Song, X.; Lu, D.; Lei, Q.; Wang, D.; Yu, B.; Shi, J.; Chen, J. Energy and exergy analyses of a transcritical CO2 air conditioning system for an electric bus. Appl. Therm. Eng. 2021, 190, 116819. [Google Scholar] [CrossRef]
  21. Song, X.; Lu, D.; Lei, Q.; Cai, Y.; Wang, D.; Shi, J.; Chen, J. Experimental study on heating performance of a CO2 heat pump system for an electric bus. Appl. Therm. Eng. 2021, 190, 116789. [Google Scholar] [CrossRef]
  22. Gullo, P. Advanced thermodynamic analysis of a transcritical R744 booster refrigerating unit with dedicated mechanical subcooling. Energies 2018, 11, 3058. [Google Scholar] [CrossRef] [Green Version]
  23. Gullo, P. Impact and quantification of various individual thermodynamic improvements for transcritical R744 supermarket refrigeration systems based on advanced exergy analysis. Energy Convers. Manag. 2021, 229, 113684. [Google Scholar] [CrossRef]
  24. Erbay, Z.; Hepbasli, A. Application of conventional and advanced exergy analyses to evaluate the performance of a ground-source heat pump (GSHP) dryer used in food drying. Energy Convers. Manag. 2014, 78, 499–507. [Google Scholar] [CrossRef]
  25. Kline, S.J.; McClintock, F.A. Describing uncertainties in single sample experiments. Mech. Eng. 1953, 75, 3–8. [Google Scholar]
  26. Lemmon, E.W.; Bell, I.H.; Huber, M.L.; McLinden, M.O. NIST Standard Reference Database 23: Reference Fluid Thermodynamic and Transport Properties-REFPROP; version 10.0; Standard Reference Data Program; National Institute of Standards and Technology: Gaithersburg, MD, USA, 2018.
Figure 1. Schematic diagram of the transcritical CO2 electric bus air conditioning system test rig.
Applsci 11 05614 g001
Figure 2. Photos of the transcritical CO2 electric bus air conditioning system rig.
Applsci 11 05614 g002
Figure 3. The boundary in the exergy analysis.
Applsci 11 05614 g003
Figure 4. The effect of normalized refrigerant charge (NRC) on COPopt, cooling capacity ( Q ˙ c o o l i n g ), optimal discharge pressure (Pdis,opt), outlet pressure of evaporator (Pe,out) and optimal EEV opening degree (ODopt) at ambient temperatures of 35 °C, 38 °C and 40 °C.
Applsci 11 05614 g004
Figure 5. (a) Variation of COP and cooling capacity with discharge pressure and (b) P-h diagrams of the transcritical CO2 system at the insufficient charge, sufficient charge and excessive charge at different EEV opening degrees (OD).
Applsci 11 05614 g005aApplsci 11 05614 g005b
Figure 6. The effect of normalized refrigerant charge (NRC) on exergy efficiency (η) and total product exergy rate ( E ˙ P , t o t ) corresponding to the optimal COP at ambient temperatures of 35 °C, 38 °C and 40 °C.
Applsci 11 05614 g006
Figure 7. The effect of discharge pressure (Pdis) on (a) exergy efficiency (η) and total product exergy rate ( E ˙ P , t o t ) as well as on (b) total power input ( W ˙ t o t ) and total exergy destruction rate ( E ˙ D , t o t ) at ambient temperature of 35 °C.
Applsci 11 05614 g007
Figure 8. Variation of exergy destruction percentage of each component corresponding to the optimal COP with NRC at ambient temperature of 35 °C.
Applsci 11 05614 g008
Table 1. Specifications on system components.
Equipment NameQuantitySpecification
Compressor1Type: Rotary compressor
Displacement: 5.4 m3 h−1 at 3600 RPM
Speed range: 1800~5400 RPM
Outdoor HX1Type: Fin tube heat exchanger
Dimension: 1530 mm (length), 76.2 mm (width), 210 mm (height)
Tube (mm): Φ7 × 0.7 copper tube
Fin material: Aluminum
Fins per inch: 15.875
Fin thickness (mm): 0.2
Indoor HX2Type: Fin tube heat exchanger
Dimension: 1150 mm (length), 76.2 mm (width), 162 mm (height)
Tube (mm): Φ7 × 0.7 copper tube
Fin material: Aluminum
Fins per inch: 15.875
Fin thickness (mm): 0.2
EEV1Range of 0–480 step
Driven by a stepper motor
Accumulator14.8 L
Table 2. The actual charge and corresponding normalized charge.
Mactual (kg)Normalized Charge
3.7500.034
4.2000.100
4.4500.137
4.9000.204
5.2000.248
5.5000.292
5.8000.336
6.1000.381
Table 3. Detailed information of the measuring instruments.
ParameterInstrumentAccuracyRange
Refrigerant temperatureT-type±0.20 °C−50–200 °C
Air dry/wet bulb temperaturePt100±0.20 °C−200–450 °C
Refrigerant pressurePressure transmitters±0.25% of full range0–15 MPa
Air volume flow rateStandard nozzle device±0.50% of reading0~10,000 m3·h−1
Power inputElectric power analyzer±0.16% of reading9~600 V
Charge amountElectronic mass scale±20.00 g0.020~40.000 A
Publisher’s Note: MDPI stays neutral with regard to jurisdictional claims in published maps and institutional affiliations.

