Article

Properties of Different Varieties of Durian

by
Supeeraya Arsa
1,
Angkana Wipatanawin
2,
Rachit Suwapanich
1,
Orachorn Makkerdchoo
1,
Niphattha Chatsuwan
1,
Pensiri Kaewthong
1,
Praphan Pinsirodom
1,
Ruchira Taprap
1,
Ratiporn Haruenkit
1,
Sumitra Poovarodom
3,
Martyna Lubinska-Szczygeł
4,
Elena Katrich
5 and
Shela Gorinstein
5,*
1
School of Food Industry, King Mongkut’s Institute of Technology Ladkrabang, 1 Chalong Krung 1 Alley, Chalongkrung Road, Bangkok 10520, Thailand
2
Department of Biotechnology, Faculty of Science, Mahidol University, 272 Thanon Rama VI, Thung Phaya Thai, Ratchathewi, Bangkok 10400, Thailand
3
Department of Soil Science, King Mongkut’s Institute of Technology Ladkrabang, 1 Chalong Krung 1 Alley, Chalongkrung Road, Bangkok 10520, Thailand
4
Department of Analytical Chemistry, Faculty of Chemistry, Gdansk University of Technology, 80-233 Gdansk, Poland
5
Institute for Drug Research, School of Pharmacy, Faculty of Medicine, The Hebrew University of Jerusalem, Jerusalem 9112001, Israel
*
Author to whom correspondence should be addressed.
Submission received: 28 May 2021 / Revised: 15 June 2021 / Accepted: 15 June 2021 / Published: 18 June 2021
(This article belongs to the Special Issue Bioactive Molecules in Food)

Abstract

:
Durian (Durio zibethinus Murr.), like many other exotic, tropical, and conventional fruits, is important in the prevention of different diseases. In this study, the characterization of the main bioactive compounds of the most popular cultivars of durian and their properties are described. The changes in the quality indices of the antioxidant status were determined by CUPRAC, ABTS, FRAP, DPPH, and ORAC assays. The profiling of phytochemicals was carried out by Fourier transform infrared (FTIR) spectroscopy and differential scanning calorimetry (DSC). For the first time, in vitro studies were performed by the interaction of extracted durian polyphenols with human serum proteins (HSP) such as human serum albumin (HSAlb), fibrinogen (HSFib) and globulin (HSGlo) as novel biomarkers of coronary artery disease (CAD). The fluorescence measurements of the resulting intensity and calculated binding properties of the interaction of polyphenols with proteins showed that the most reactive was Monthong durian cultivar. This study suggests that durian cultivars have relatively strong antioxidant, binding, and health potentials and could be a significant source of natural antioxidants used in daily fresh consumption and for functional foods.

Graphical Abstract

1. Introduction

Fruits are one of the important parts of human consumption. All fruits have a rich composition as natural antioxidants. Durian has been recognized as an important fruit, especially for the underlying nutritional attributes of the fruit [1]. Durian belongs to the category of exotic fruits, having specific taste as a mixture of mango and avocado [2]. Durian is also rich in polyphenols such as flavonoids (flavanones, flavonols, flavones, flavanols, anthocyanins), phenolic acids (cinnamic and hydroxybenzoic acids), tannins, and other bioactive components, such as carotenoids and ascorbic acid [3,4,5,6,7]. Durian fruit possessed an acute effect on the blood pressure of hypertensive rats, but heart rate was unaffected [8]. The present studies showed that polyphenols decrease the risk of chronic diseases, such as heart diseases, diabetes, and others [9,10]. Potential health benefits with special regards to cholesterol-lowering effects were described in durian and its products [11]. The ripe and overripe fruits increased the expression of hepatic HK2 and PFKFB4 glycolytic genes and stimulated glucose utilization in HepG2 cells [12]. Although in our previous studies different durian cultivars were used [13], mostly the research was concentrated on the main Monthong cultivar [14]. Metabolic variations in the pulps of two durian cultivars (Thai Chanee and Monthong) identified cultivar-dependent metabolite markers [15], related to durian fruit quality traits, such as nutritional value (pyridoxamine), odor (cysteine, leucine), and ripening process (aminocyclopropane carboxylic acid). As discussed above, durian in vitro studies by antioxidant assays [3], in vivo on the animal model [9,10] and cells experiments [12,14] contained relatively high amounts of potential antioxidants, improved the lipid and serum antioxidant status in diets high in cholesterol and possessed antiproliferative activities and proapoptotic potential in relation to the total content of bioactive compounds. Our findings for the first time indicated that one of the positive benefits of fruit consumption in patients with coronary artery disease (CAD) was diminishing the production of plasma circulation fibrinogen and its stability, which reduced the potential risk exerted by this protein [16], decreasing the triglycerides, total and low-density cholesterol. Phenolic compounds in general, under non-oxidative conditions, form reversible complexes with plasma proteins, involving hydrogen bonds, electrostatic interactions, hydrophobic effects and van der Waals forces. The distribution of drugs and dietary phenolic compounds in the human metabolism depends also on binding to plasma proteins, because of their biological activity, forming phenol-human serum protein complexes [16,17,18]. Despite the significant progress in the investigation of this special fruit, there is a lack of the comparison of durian cultivars, their properties, especially in relation to Monthong, which is the most popular and commonly consumed. The research area of the bioactivity of extracted polyphenols with the main human serum proteins such as albumin, globulin, and fibrinogen, which are the biomarkers of health properties, has not been exhausted yet. In this research, local Thai durian cultivars will be compared on the basis of their physicochemical and antioxidant characterization. The binding properties of the main serum proteins with the extracted polyphenols will be determined by fluorescence studies and antioxidant assays. In addition, the Fourier transform infrared spectroscopy (FTIR) and differential scanning calorimetry (DSC) measurements will be employed in order to characterize the bioactivity of durian cultivars. Therefore, the objectives of this report were the following: determination of physicochemical properties of local Thai durian cultivars as an additional index and fingerprint of the ripening stage; quantitative antioxidant status by phenolic compounds and their antioxidant capacities; qualitative estimation of antioxidant profiles by FTIR and DSC spectra; fluorometric and binding properties of extracted fruit polyphenols in interaction with main serum human proteins as an indicator of health properties of durian; correlation between the activity of new biological markers (albumin, globulin and fibrinogen) in interaction with standards and fruit extracted polyphenols.

2. Materials and Methods

2.1. Chemicals and Materials

The chemicals 2,4,6,-tripyridyl-s-triazine (TPTZ), 6-hydroxy-2,5,7,8-tetra methylchromane-2-carboxylic acid (Trolox), 1,1-diphenyl-2-picrylhydrazyl (DPPH), lanthanum(III) chloride heptahydrate, CuCl2x2H2O, 2,9-dimethyl-1,10-phenanthroline (neocuproine), 2,2-azino-bis (3-ethylbenzothiazloine-6-sulphonic acid) (ABTS) radical cation, ferric chloride, caffeic acid, quercetin, tannic acid, catechin, human serum albumin (HSAlb), fibrinogen (HSFib), globulin (HSGlob), phosphate buffer and Folin-Ciocalteu reagent (FCR) were purchased from were from Sigma (St. Louis, MO, USA) and Fluka Chemie GmbH, Buchs, Switzerland. 2,2′-azobis (2-methylpropanimidamide dihydrochloride) (AAPH) and fluorescein were from Merck Eurolab GmbH (Darmstadt, Germany).

2.2. Sampling

Durian fruits (Durio zibethinus Murr.) of three cultivars Monthong, Chanee and Puangmanee were obtained from the orchard, in Chanthaburi province, eastern Thailand in 2018. All samples were in the ripe stage, according to the definition of ripe durian flesh (DR): harvested and left to soften (the stage when the fruit is ready for consuming) and it normally takes 3–5 days. Five fruits were used for each cultivar. The peeled fruits (pulps) were weighed, chopped and homogenized in liquid nitrogen in a high-speed blender (Silex professional model, Hamilton Beach, VI, USA). A weighed portion (50–100 g) was then lyophilized for 48 h (Virtis model 10–324, Midland, ON, Canada), and the dry weight was determined. The samples were ground to pass through a 60-mesh sieve and stored at −20 °C until the bioactive substances were analyzed [12]. Then, 1 g of each lyophilized sample was extracted with 10 mL of methanol (3 replications). The methanol was evaporated, and the extracts were kept in an aluminum bag at −20 °C before analysis. For a comparison of the maturity levels, local durian cultivars Monthong, Chanee, and Kanyao were obtained from Chanthaburi province in June 2019, and the physicochemical properties assessed.

2.3. Determination of Physicochemical Properties

The immature (young) durians were kept at room temperature until the overripe stage. The maturity of durian was characterized using the following criteria: Immature (young) durian was harvested before mature level 3–5 days, but at this level durian is not consumed, having a hard texture and without any smell. At the mature level durian can be consumed with a firm texture and desirable smell. When mature durian is left for 1–2 days, then it becomes ripe. At this level, durian has a soft texture and a desirable smell. The levels between ripe and overripe (Ripe+) durians are achieved when the ripe durian is left for 1–2 days. This stage of durian had a softer texture and stronger smell than ripe level. In some cases, ripe durian is left for 3–5 days. Durian at this time has a sloppy, mushy texture and odoriferous. This is a standard procedure for durian ripening, taking about 3–5 days from stage to stage, but the duration of the fruit is variable depending on the cultivar and the size of the fruit.
According to Table 1, the first day of each cultivar from the orchard was in the young stage at 0 day. The mature stage began from Kanyao to Monthong (3–5 days). The ripe stage started from Kanyao to Monthong (5–7 days). The ripe + 1 stage began from Kanyao to Monthong (7–9 days). The overripe stage was found in Kanyao (9 days) and in two other investigated cultivars Chanee and Monthong at 10 days (10 days).
The pH, acidity, °Brix and total soluble solids of durian in the ripe stage of three cultivars (Monthong, Chanee and Puangmanee) were determined. The pH, acidity, °Brix, and total soluble solids of durian in different maturity levels of three slightly different cultivars (Monthong, Chanee and Kanyao) were determined as well in order to recheck the ripe stage of durian harvested in 2018. The pH of the durian was determined by the following method: minced durian pulp (10 g) was mixed with 90 mL of distilled water. The mixture was filtered, and the pH was measured using a digital pH meter [19]. The acidity was measured by titrating the samples of durian with 0.1 N NaOH solution, according to AOAC Method 942.15 [20]. Ten grams of sample were diluted with 75 mL of distilled water. Then, the mixture was homogenized and 2–3 drops of phenolphthalein were added. The mixture was titrated with 0.1 N NaOH until the color of the solution turned pink and remained stable for 30 s. The value of titratable acidity was expressed as g malic acid/100 g wet weight, using the following formula: % acid = [NaOH (mL) × molarity of NaOH × (0.067) × 100]/sample (g), where a milliequivalent factor of 0.067 was used, with the assumption that malic acid is the predominant acid [21]. Total soluble solids (°Brix) of fresh durian pulps were determined by the method of Tan et al. [21]. Minced durian pulp (10.0 g) was mixed with 20 mL of distilled water and filtered. The total soluble solids were measured in the mixture, using a digital refractometer. The total soluble solids (%) value was obtained by multiplying °Brix values by 3.

2.4. Determination of Bioactive Compounds

The detailed procedures of bioactive compounds and their antioxidant capacities determinations were described in our very recent reports [22,23]. Folin–Ciocalteu assay was used for the determination of total polyphenol content (TPC) in methanol durian extracts of 0.25 mL with 1 mL of Folin–Ciocalteu reagent. Then, 0.75 mL of 1% sodium carbonate was added. The absorbance of the mixture was measured on Hewlett-Packard, model 8452A spectrophotometer at 750 nm. The results were calculated in mg gallic acid equivalents (GAE) per g of dry weight (DW) [24]. Total flavonoid contents (TFC) were measured at 510 nm after extraction of durian samples with 5% NaNO2, 10% AlCl3xH2O and 1 M NaOH and expressed as mg catechin equivalent (CE) per g DW [25].

2.5. Determination of Antioxidant Capacities

Cupric reducing antioxidant (CUPRAC) assay is based on utilizing the copper (II) − neocuproine reagent as the chromogenic oxidizing agent. The absorbance at 450 nm was measured in a mixture of [Cu(II)-Nc] and NH4Ac buffer solution and fruit methanol extracts [26]. 2,2′-azino-bis(3-ethyl-benzothiazoline-6-sulfonic acid) diammonium salt (ABTS•+) was generated by the interaction of ABTS (7 mM) and K2S2O8 (2.45 mM). This solution was diluted with methanol and measured at 734 nm [27]. Scavenging free radical potentials were tested in a methanolic solution (3.9 mL) of 1,1-diphenyl-2-picrylhydrazyl (DPPH) with the samples extracts in methanol (0.1 mL) [28]. Ferric-reducing/antioxidant power (FRAP) assay measures the ability of the antioxidants in the investigated samples to reduce ferric-tripiridyltriazine (Fe3+-TPTZ) to a ferrous form (Fe2+) [29]. Oxygen radical absorbance capacity (ORAC) assay was carried out using 50 g of the pulp extracted with water and dimethyl sulfoxide (DMSO). The solutions were combined and subjected to ORAC assay [30] with minor modifications [31] on a fluorescent plate reader (Synergy HT, Bio-Tek Instruments Inc., Winooski, VT, USA). The results of all antioxidant assays are expressed as micromoles of Trolox equivalent (TE) per g DW. Radical scavenging activities using DPPH and ABTS were also determined and the results are expressed as inhibition percentage: % radical scavenging activity) (control OD − sample OD/control OD) × 100, where OD is optical density. Changes in the absorbance of the samples were measured at 517 nm for DPPH and for ABTS at 734 nm [32,33].

2.6. Fourier Transform Infrared Spectrometry (FTIR) and Differential Scanning Calorimetry (DSC) Measurements

Spectra profiles of durian extracts were determined by Fourier transform infrared spectrometer (Thermo Scientific, model Nicolet 6700, Dreieich, Germany). The durian extracts were applied to a diamond cell and measured from 4000 to 600 cm−1 with a resolution of 4 cm−1 and 100 scans [34,35]. The 5 mg of durian extracts were weighted in a sealed type aluminum crucible. Then, the samples were analyzed DSC (NETZSCH, model DSC 204 F1, Selb, Germany), using a modification of the procedure. The temperature program started at 0 to 300 °C at a heating rate of 10 °C/min [34].

2.7. Fluorometric Studies

Profiles and properties of polyphenols in methanol extracts were determined by two (2D-FL) and three-dimensional (3D-FL) fluorescence (model FP-6500, Jasco spectrofluorometer, serial N261332, Tokyo, Japan). The 2D-FL measurements were taken at emission wavelengths from 310 to 500 nm and at excitation of 295 nm. The 3D-FL was measured at the emission wavelengths between 200 and 795 nm, and the initial excitation wavelength at 200 nm. For comparison of the obtained results caffeic acid, quercetin, tannic acid and catechin were used [22,23]. Binding properties of durian extracts to human serum albumin (HSAlb), fibrinogen and globulin were evaluated by 2D and 3D-FL. For the fluorescence measurements, 3.0 mL of 1.0 × 10⁻⁵ mol/L HSA were prepared in 0.05 mol/L Tris–HCl buffer (pH 7.4), containing 0.1 mol/L NaCl. Fibrinogen and globulin stock solution was made by dissolving in phosphate buffer (10 mM, pH 7.4) to obtain a concentration of 20 µM. Standards phenolic solutions such as tannic acid, quercetin, catechin, caffeic acid stock solution was prepared daily by dissolving at a concentration of 10 mM in methanol and then diluting with 10 mM phosphate buffer at pH 7.4. Samples were prepared by mixing albumin, globulin fibrinogen, durian extracts, and standards of phenolic compounds solutions in varying proportions. The highest resulting methanol concentration was about 1%, which had no appreciable effect on protein structure. All samples were kept at 4 °C before the analysis. The initial fluorescence intensities of albumin, globulin, and fibrinogen were measured before the interaction with the investigated samples and pure substances and after interaction with the samples (quenching of fluorescence emission of proteins in our case of albumin, globulin and fibrinogen and polyphenols of durian). As it was mentioned above, the changes in the fluorescence intensities were used in the estimation of binding activities [22,23,36].

2.8. Data Analysis

All obtained data were calculated on the basis of statistical analysis of Duncan’s multiple range test. Values are means ± SD per gram dry weight (DW) of 25 measurements, representing the commercial maturity status of fruits and their replicates. Five replications of five extracts from each cultivar were performed. To determine the statistical significance as 95% interval of reliability, ANOVA, one-way analysis of variance, was used.

3. Results and Discussion

3.1. Physicochemical Properties

Four local Thai durian cultivars were investigated in the present study. Durian fruits (Durio zibethinus Murr.) of three cultivars Monthong, Chanee, and Puangmanee (Figure 1) were obtained in the ripe stage, according to the definition of ripe durian flesh (DR): harvested and left to soften for several days (Table 1). In these fruits, which were accepted as ripe ones, the amount of total soluble solids (TSS, %) showed the following values: 25.21 ± 0.43; 25.17 ± 0.41; 25.48 ± 0.39; pH was in the order of 6.81 ± 0.01, 6.68 ± 0.04, 6.79 ± 0.02; acidity (% of malic acid): 0.17 ± 0.01, 0.17 ± 0.01 and 0.15 ± 0.01.
In order to be sure that all investigated methods were applied to the samples in the correct stage of ripening, in the next 2019 harvest year, three similar local cultivars (Monthong, Chanee and Kanyao) were collected (Figure 1) during different stages of ripening, and the results are presented in Table 1. As it was mentioned in Materials and Methods, the samples were collected in different stages of ripening: young, mature, ripe, ripe + 1 and overripe. All the analyses were performed on durian harvested in 2018, except for the physicochemical properties. Most of the results (Figure 2, Figure 3, Figure 4, Figure 5, Figure 6, Figure 7 and Figure 8) were conducted on durian harvested in 2018 and only at the ripe stage (the stage when the fruit is ready for consumption). However, there was no information about the physicochemical properties of durian in different maturity levels which could affect the antioxidant and binding properties and bioactive compounds. Therefore, the physicochemical properties of durian in different maturity levels and cultivars (Table 2) were assessed with the durian harvested in 2019, to confirm the physicochemical properties of the ripe stage with other maturity levels and cultivars. Moreover, this information provides general information about the physicochemical properties of durian in different maturity levels and cultivars for the reader. The physicochemical properties in this study could be used for the maturity levels determination as a fingerprint of local cultivars, because normally and practically the levels of maturity are always done by experts, who are able to characterize the differences of appearance, smell, texture, and maturity levels of durian by their experiences. The pH, acidity, °Brix, and total soluble solids of three slightly different cultivars compared to the harvest of 2018 were determined. Accordingly, the Puangmanee cultivar was unavailable in the local orchard in 2019, so the Kanyao cultivar was provided instead, which is one of the most well-known cultivars obtained from the orchard in Chanthaburi province.
From young to overripe stages (Table 2), the pH for Monthong decreased (7.08–6.62), Chanee (6.83–6.45) and Kanyao (6.82–6.84); acidity (%) increased for Monthong (0.07–0.21), Chanee (0.13–0.19) and Kanyao (0.11–0.18); °Brix increased for Monthong (2.93 to 9.53), Chanee (5.30–9.37), and Kanyao (5.13—10.63); TSS (%) increased for Monthong (8.80 to 28.60), Chanee (15.90–28.10), and Kanyao (15.40—31.90). The results of physicochemical properties are in line with the investigations on varieties of fruits, but some show different dynamics. Biochemical changes in wood apple fruit (Feronia elephantum Corr.) were studied at three different stages (unripe, semi-ripe and ripe). Like most of the ripening fruits, the major observed changes were in a decrease in acidity from 3.5 to 3.2 g/100g. Unlike various other fruits, the total soluble solids were reduced upon ripening from 20.4 to 14.0 °Brix. Unlike most of the fruits, a decrease in TSS from 20.38 to 13.96 °Brix was observed in wood apple fruit during ripening [37]. A similar decrease in TSS has been reported in papaya [38]. The pH of the fruit pulp increased from 3.62 to 3.84 during ripening, while the titratable acidity decreased from 3.53% at the unripe stage to 3.20% at the ripe stage [39]. A significant increase in TSS was observed in all five tropical fruit extract species as the fruits mature. Meanwhile, a significant increase of TSS value (p < 0.05) of Mangifera indica fruit was observed from the mature to the ripe stage. From the young to ripe stages of the fruits, a significant decrease in total acidity (TA) (expressed as the concentration of oxalic acid) was observed in all fruit extracts tested. The value of pH was the lowest in young fruit and increased significantly (p < 0.05) during the early stage of ripening [40]. A very recent report showed the dynamics of six papaya cultivars, obtained from the seed, cultivated in a Mediterranean climate in Sicily in greenhouse conditions and harvested at late stages, where the physicochemical traits were measured in terms of the titratable acidity and soluble content [41].

3.2. Determination of Bioactive Compounds

Figure 2 presents the bioactive substances in three durian cultivars. Total polyphenol compounds (TPC, mg GAE/g DW) were in the range from 4.99 ± 0.45 to 3.17 ± 0.20 with the average values for Chanee (CN) and the lowest for Puangmanee (PM). Total flavonoid compounds (TFC, mg CE/g DW) were estimated as the highest for Monthong (MT) of 2.10 ± 0.12 and 1.33 ± 0.07 for PM. The two phenolic substances were the highest in the MT cultivar.
The obtained results of bioactive substances are in agreement with other recent reports and as well with our previous data. The TPC (mg GAE/g FW) and TFC (mg CE/g FW) in Chanee (CN) were in the range of 0.21–3.21 and 0.02–0.82; for Puangmanee (PM) estimated of 3.11 and 0.03–0.18 and for Monthong (MT) showed 0.56–3.74 and 0.04–0.94, respectively [3,4,6,10,14,42]. Unknown variety of durian [5] showed 0.99 mg GAE/g FW, which was similar to the present data of MT. Similar total polyphenol data were obtained from an unknown variety in another report [43] as 0.79 mg GAE/g FW. It was interesting the comparison of Monthong, Kradum, and Kobtakam varieties which had higher phenolic content of 2.69–2.89 mg GAE/g DW [4] than that of the Chanee variety (0.67 GAE/g DW), which was lower than the level reported from Malaysia (2.54 mg GAE/g DW) [5]. The comparison of total polyphenol content (6.96–9.30 mg GAE/g DW) of five varieties of durian (Monthong, Chanee, Kradum, Kanyao, and Puangmanee) showed that the Monthong variety had the highest TP content, whereas the Kradum variety had the lowest [13]. In the report of four locally available varieties of durian fruit [44], where the total phenolics and flavonoids were extracted using dichloromethane: pentane (1:1 v/v) the results differed from the presented and total phenolics were found in the range of 690.62–998.29 mg/L, showing the significant inter-varietals variations. The total flavonoids were in the range of 211.36–220.34 mg/L. Caffeic acid and quercetin were the dominant antioxidant substances found in durian, therefore for fluorescence studies, these phenolics were used as standards. The bioactivity of ripe durian was high, and the total polyphenols were the main contributors to the overall antioxidant capacity [13,42]. The differences in the results of bioactive metabolites depend on durian investigated varieties, such as Monthong (MT), Chanee (CN), and Puangmanee (PM), extraction time and solvent used, and analytical methods. This affects the physicochemical and biological properties of the plant as a food ingredient.

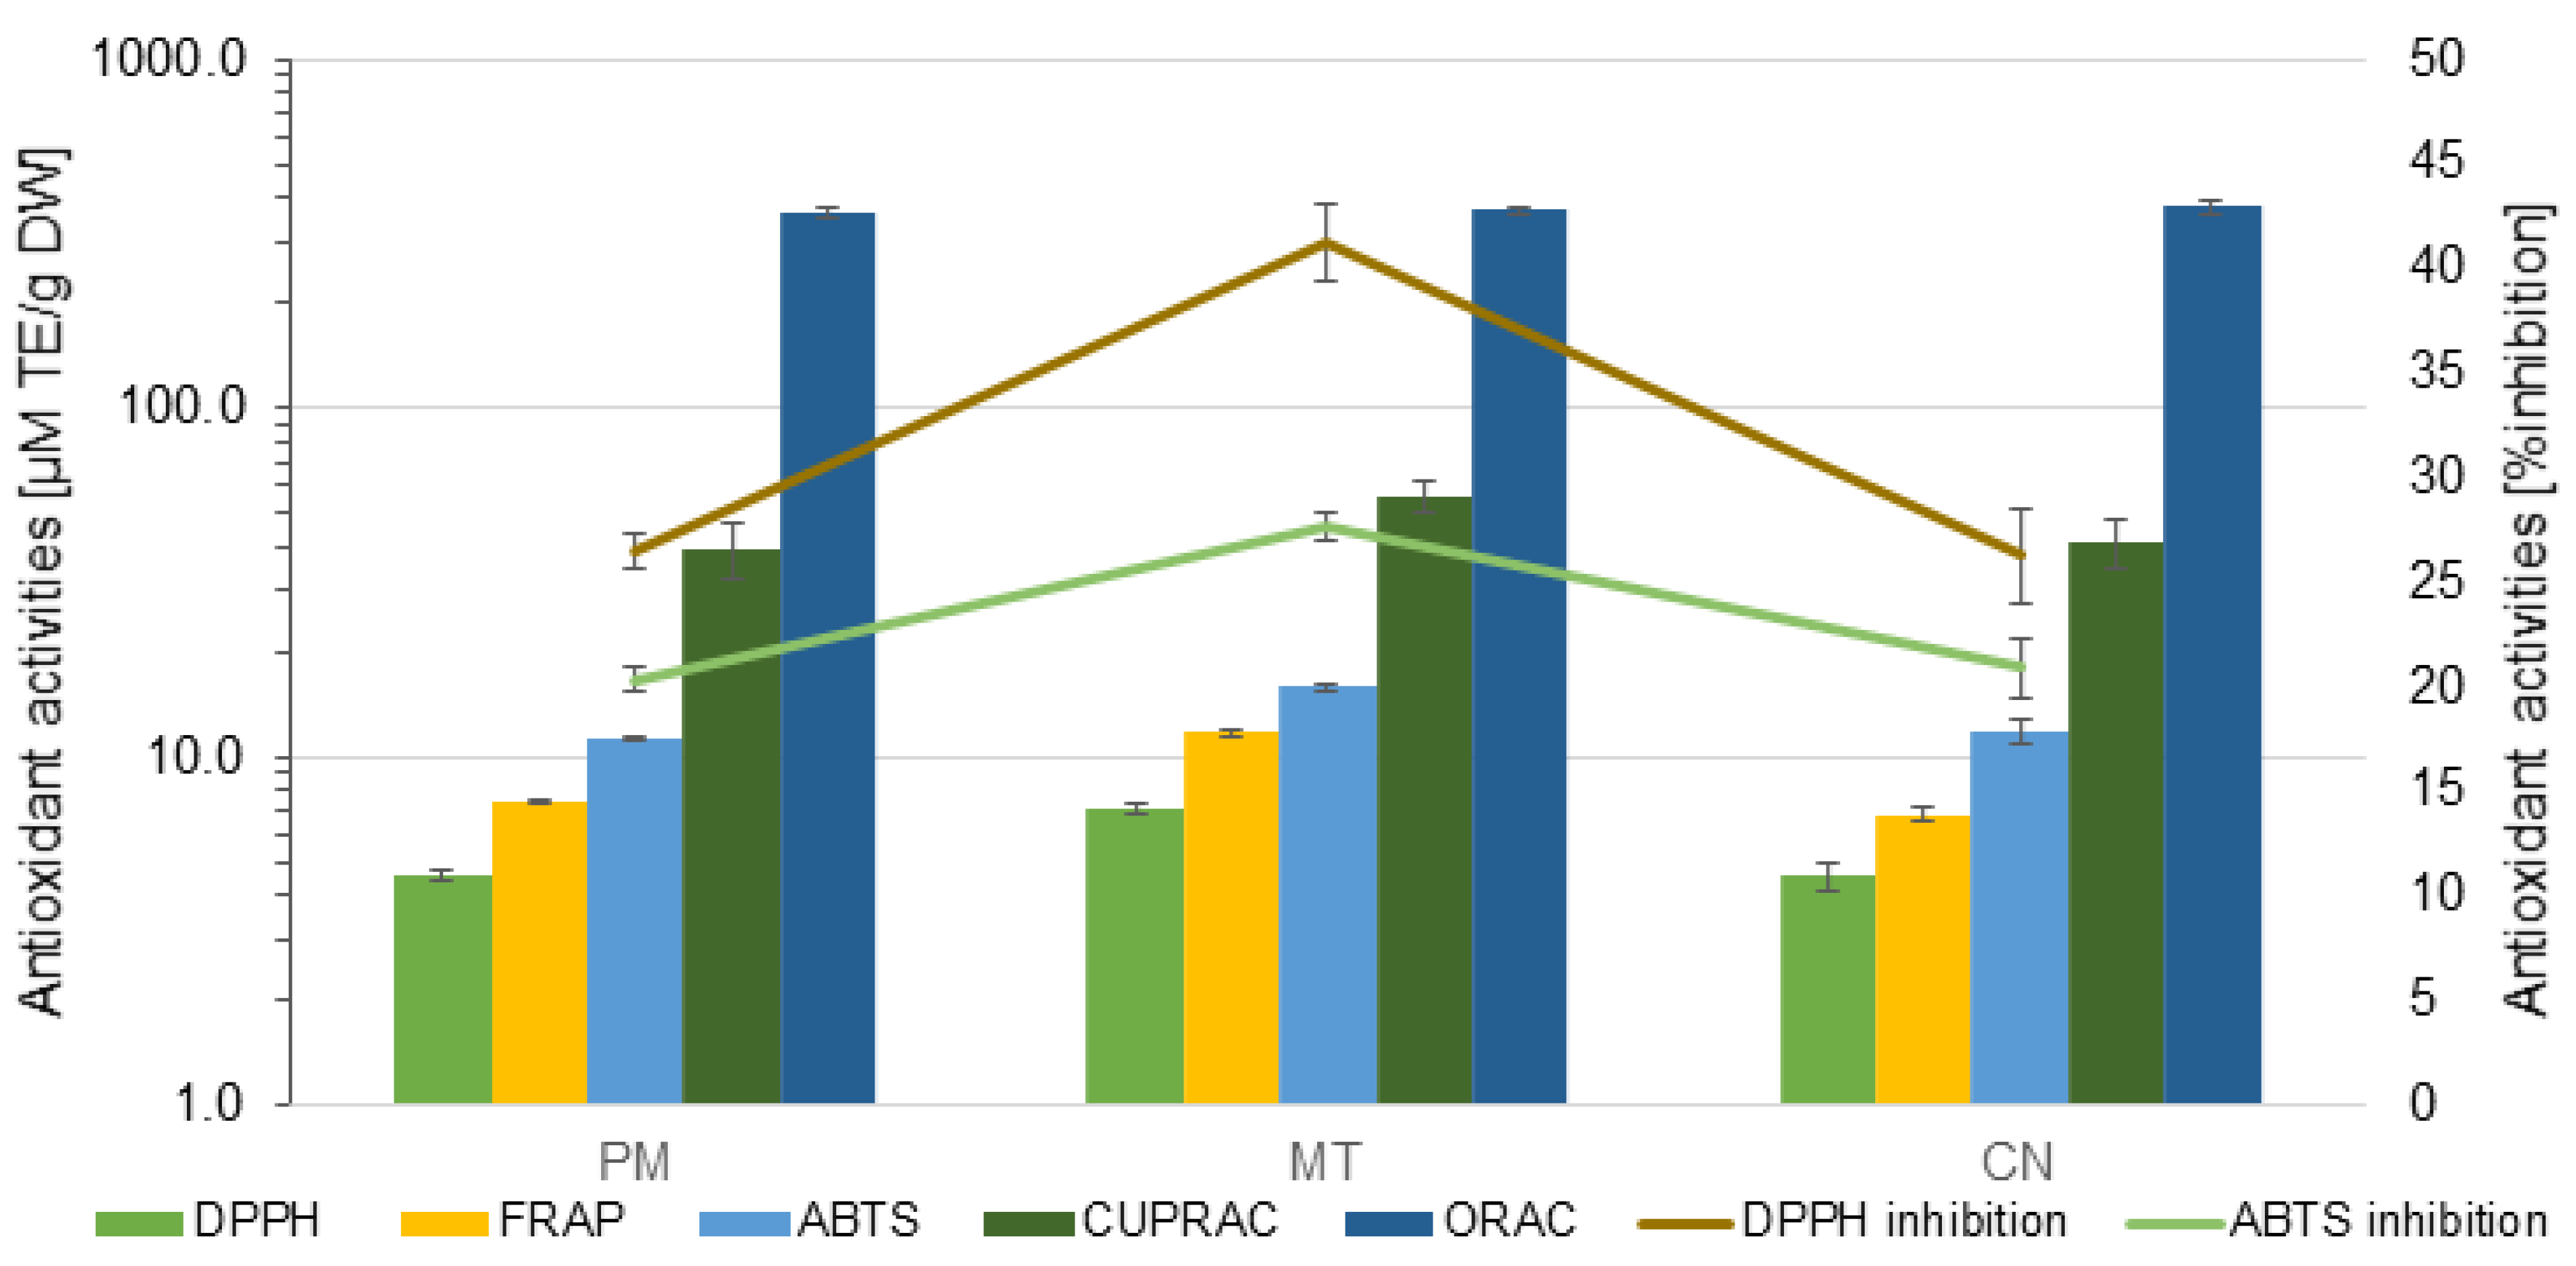
3.3. Antioxidant Properties of Durian Cultivars

The values of five different antioxidant assays are presented in Figure 3. The results of the DPPH assay were the lowest and of ORAC are the highest. The results of antioxidant activities were expressed in µM TE/g DW and showed the following numbers: DPPH—from 4.58 ± 0.43 to 7.05 ± 0.22; FRAP—from 6.82 ± 0.29 to 11.69 ± 0.31; ABTS—from 11.37 ± 0.15 to 15.88 ± 0.37; CUPRAC—from 39.76 ± 7.21 to 56.18 ± 5.89 and ORAC—from 360.87 ± 14.38 to 377.64 ± 18.11.
In DPPH and ABTS assays, where the antioxidant activity was determined as percentages of inhibition, showed the same relationships in the investigated durian cultivars as using the estimation of the antioxidant activities of these assays in µM TE/g DW. All used methods estimated that the Monthong cultivar was the strongest between investigated cultivars, showing in most cases significant differences (Figure 3). As mentioned previously, there are many methods for total antioxidant potential determination, and each has its limitations [45]. As can be concluded from the present results that some of these antioxidant assays give different antioxidant activity trends [45], but all presented methods showed that Monthong variety was higher than others. The obtained results are in line with other investigations [14,42,46,47,48]. So, DPPH (µM TE/g FW) showed 0.98—13.66 and 1.28–2.46 for MT and CN, respectively. FRAP estimation (µM TE/g FW) was 0.72–7.49, 2.32–4.57 and 2.45 for MT, CN and PM, respectively. ORAC assay (µM TE/g FW) for Thai durian cultivars is not applied widely, then for MT is 19.03 and for CN is 23.04, respectively [4]. CUPRAC (µM TE/g FW) varied between the varieties and showed the following numbers: 4.28–10.76, 9.55 and 9.45 for MT, CN and PM, respectively. The obtained results of ABTS (µM TE/g FW) are in agreement with most of the reports and show 2.66–23.53, 20.91, and 20.20 for MT, CN and PM, respectively. Some results were obtained from unknown varieties of durian fruit, as FRAP values of 7.41 µM Fe2+/g FW and TEAC values of 4.98 µM TE/g FW [42,44]. Durian varieties [47] showed antioxidant activities measured by DPPH, FRAP, and ORAC as followed: (4–8, 11–16 and 62–73 µM TE/g DW, respectively). These values were in the same range as the ripe Monthong variety measured by DPPH and FRAP which were proved by present results and reported [14,48]. The ORAC values shown in this report were lower than those found in the present study. The present results of durian extracts (361–378 µM TE/g by ORAC assay) can be compared to other fruits such as Phyllanthus emblica L. (455 µmol TE/g by ORAC assay) and Spondias pinnata (L.f.) Kurz (241 µmol TE/g by ORAC assay). Durian extract was prepared using the mixture of ethanol and 0.2 M HCl (1:1, v/v) exhibited the highest total phenolics value of 116.55 ± 1.51 mg GAE/g extract and the highest total flavonoid value of 92.37 ± 9.27 mg rutin equivalent (RE)/g extract. In antioxidant studies, the ABTS assay of durian fruit extract showed a greater value in antioxidant activity against control [33]. The results derived from DPPH, FRAP, and other assays showed lower antioxidant potential compared to the standard. In DPPH radical scavenging activity, the maximum radical scavenging activity was found (49.11 ± 2.55) at 1000 μg/mL of the sample concentration in comparison with the present results of MT (41.28 ± 1.81).

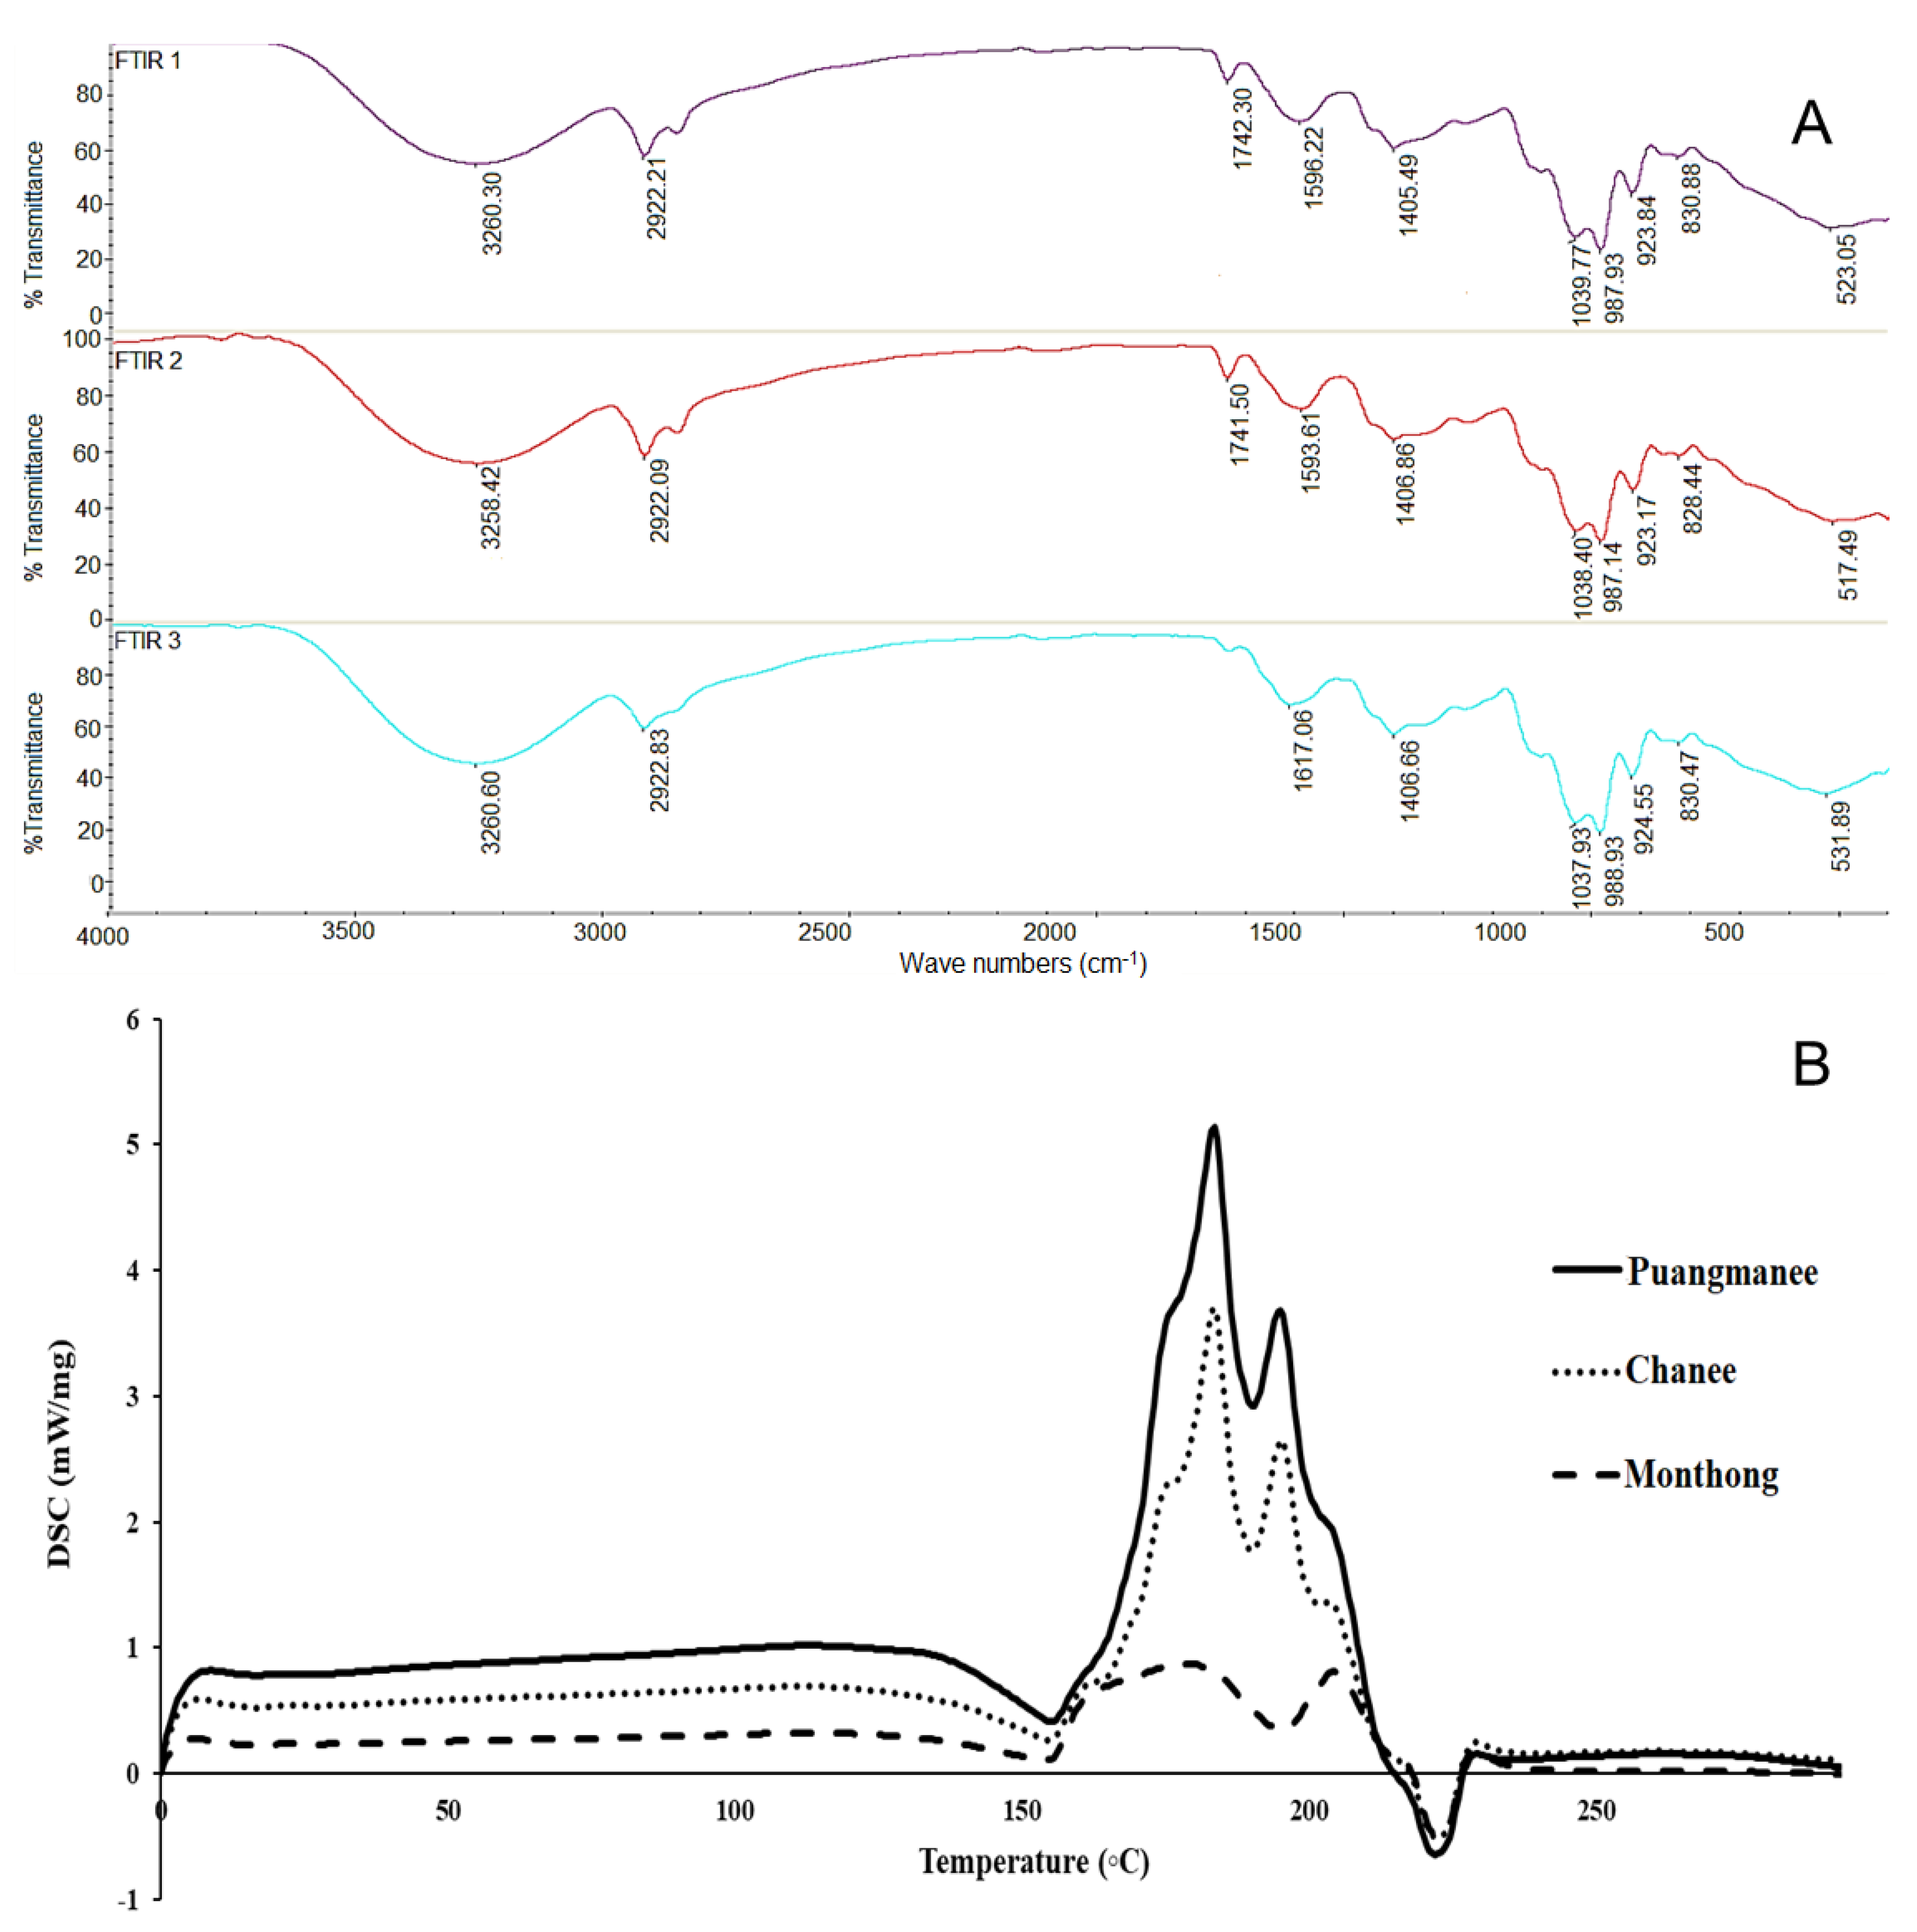
3.4. Fourier Transform Infrared Spectroscopy (FTIR) and Differential Scanning Calorimetry (DSC) Studies

The FTIR spectra and DSC peaks are presented in Figure 4. The main FTIR bands of three cultivars of durian polyphenol extracts were from wavelength numbers from 3200 to 500 cm−1 (3258, 2922, 1741, 1593, 1406, 1039, 987, 923, 828, and 523 cm−1). Three durian cultivars showed similar spectra profile (Figure 4A). The wavelength numbers of FTIR spectra at 828 and 1039 cm−1 were assigned to –C–H alkenes and –C–O alcohols of catechin [3].
A band at a wavelength number of 1617 cm−1 was responsible for gallic acid. Additionally, a band at 923 cm−1 of FTIR spectra was derived from polyphenols in durian extracts [3]. FTIR spectra of Monthong and Chanee cultivars presented a band at 1741 cm−1, which corresponds to the –CO (stretching) and the band at 2922 cm−1 was related to the C–H bond of saturated carbons [9]. Some bands corresponded with the measurements of pineapple fruit [49]. The band presented at 3600–3000 cm−1, with a maximum value close to 3300 cm−1 was associated with the stretching vibration of O–H groups. Similar bands were shown in all durian cultivars at 3258 cm−1. The peak at 1719 cm−1 was estimated for carbonyl group C=O stretching [49]. According to the present procedure of preparation, the samples were lyophilized, and then the O–H stretching band has to show carboxylic acids, alcohols, and phenols, which are important for the bioactivity of the fruits. In the pineapple, the bands between 1800 and 1500 cm−1 have been related to proteins as amide I and amide II ((1700–1600 cm−1 and 1565–1520 cm−1), respectively, and fats (1745–1725 cm−1) [50]. This region was found in durian samples between 1741 and 1593 cm−1. Several peaks were found in the spectral range of 1400–800 cm−1 in pineapple and 1406–523 cm−1 in durian fruits. These bands can be assigned to with the stretching and bending of carbohydrates, organic acids and colour pigments [49,50]. The obtained results of FTIR spectra, showing similar patterns for all durian cultivars can be compared with some standards found in durian and used as well for fluorescence studies. In tannic acid, one peak was found between 3495 and 3280 cm−1, which shows the stretching vibration for O–H group. For durian extracts, one peak at 3258 cm−1 was assigned. The peaks (cm−1) were found for tannic acid and durians at 2929 and 2922, respectively, indicating CH2 asymmetric and symmetric stretching of the compound. The peak at 1703 cm−1 represents the stretching of the carbonyl (C=O) group in the compound. Such a peak does not appear at this number in durian extracts. The peak at 1500–1450 cm−1 allocated the carboxylic acid (O–C–O) and at 1314–1187 cm−1 suggested the bending vibration of the O-H group. In addition, a sharp absorption band at 1021, which assigned to the C-O group of molecules, corresponds with the durian extracts [35,51]. In quercetin, the peak obtained in the range of 3398–3314 cm−1 represented the O-H stretching vibration due to the intramolecular hydrogen bonding. The peak obtained at 1449–1400 cm−1 is indicated of the C-O bond [52]. As it was shown in our previous results, FTIR was widely used for avocado, durian, mango [3], apple, strawberry, red grapefruit, and for the determination of different stages of ripening as well, different kiwifruit cultivars. [36]. Thus, FTIR was used for the determination of functional groups present in different phytochemicals in the plant samples.
DSC profiles of three durian extracts are shown in Figure 4B. The peaks of Puangmanee and Chanee occurred at slightly higher temperatures than Monthong. Monthong showed a broader peak compared to Puangmanee and Chanee extracts. Park et al. [53] reported that a broader peak is an indication of a broader distribution of phenolic molecules having different thermal stabilities. This is in correspondence with the study of antioxidant and nutritional properties, phenolic contents, and proteins of five durian cultivars. The significantly higher amounts for total polyphenols and flavonoids were detected in Monthong [13].

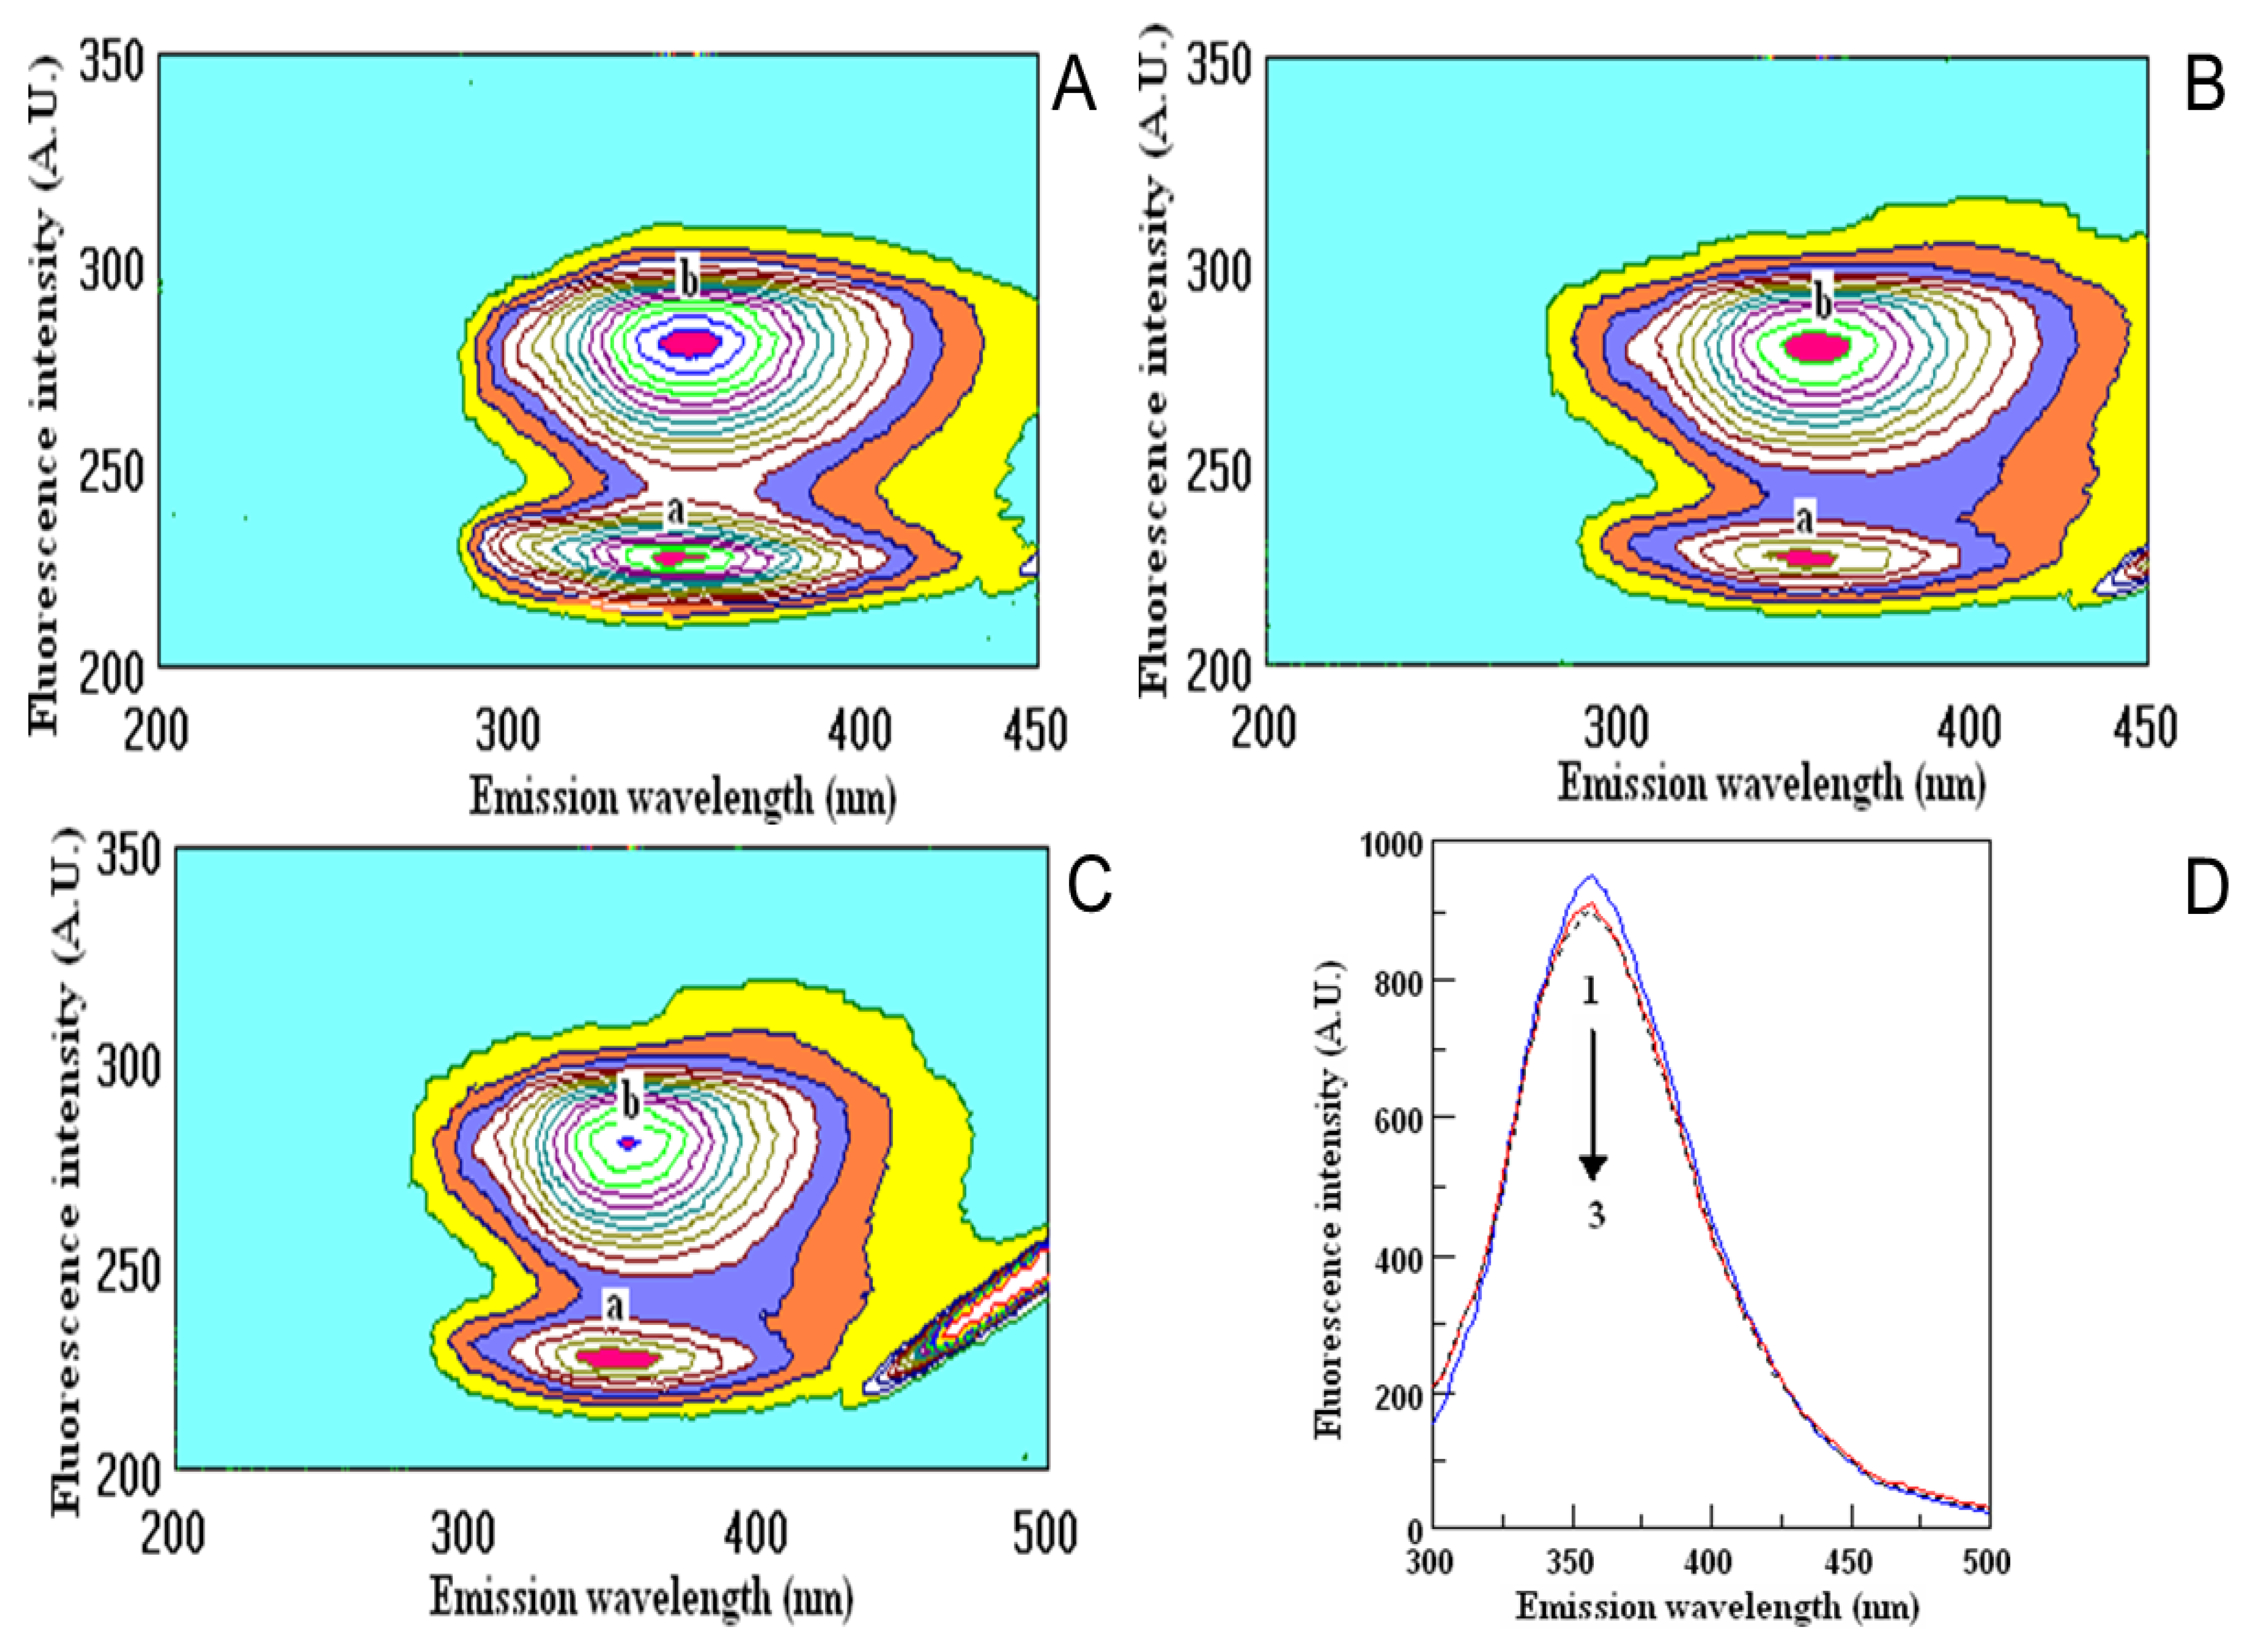
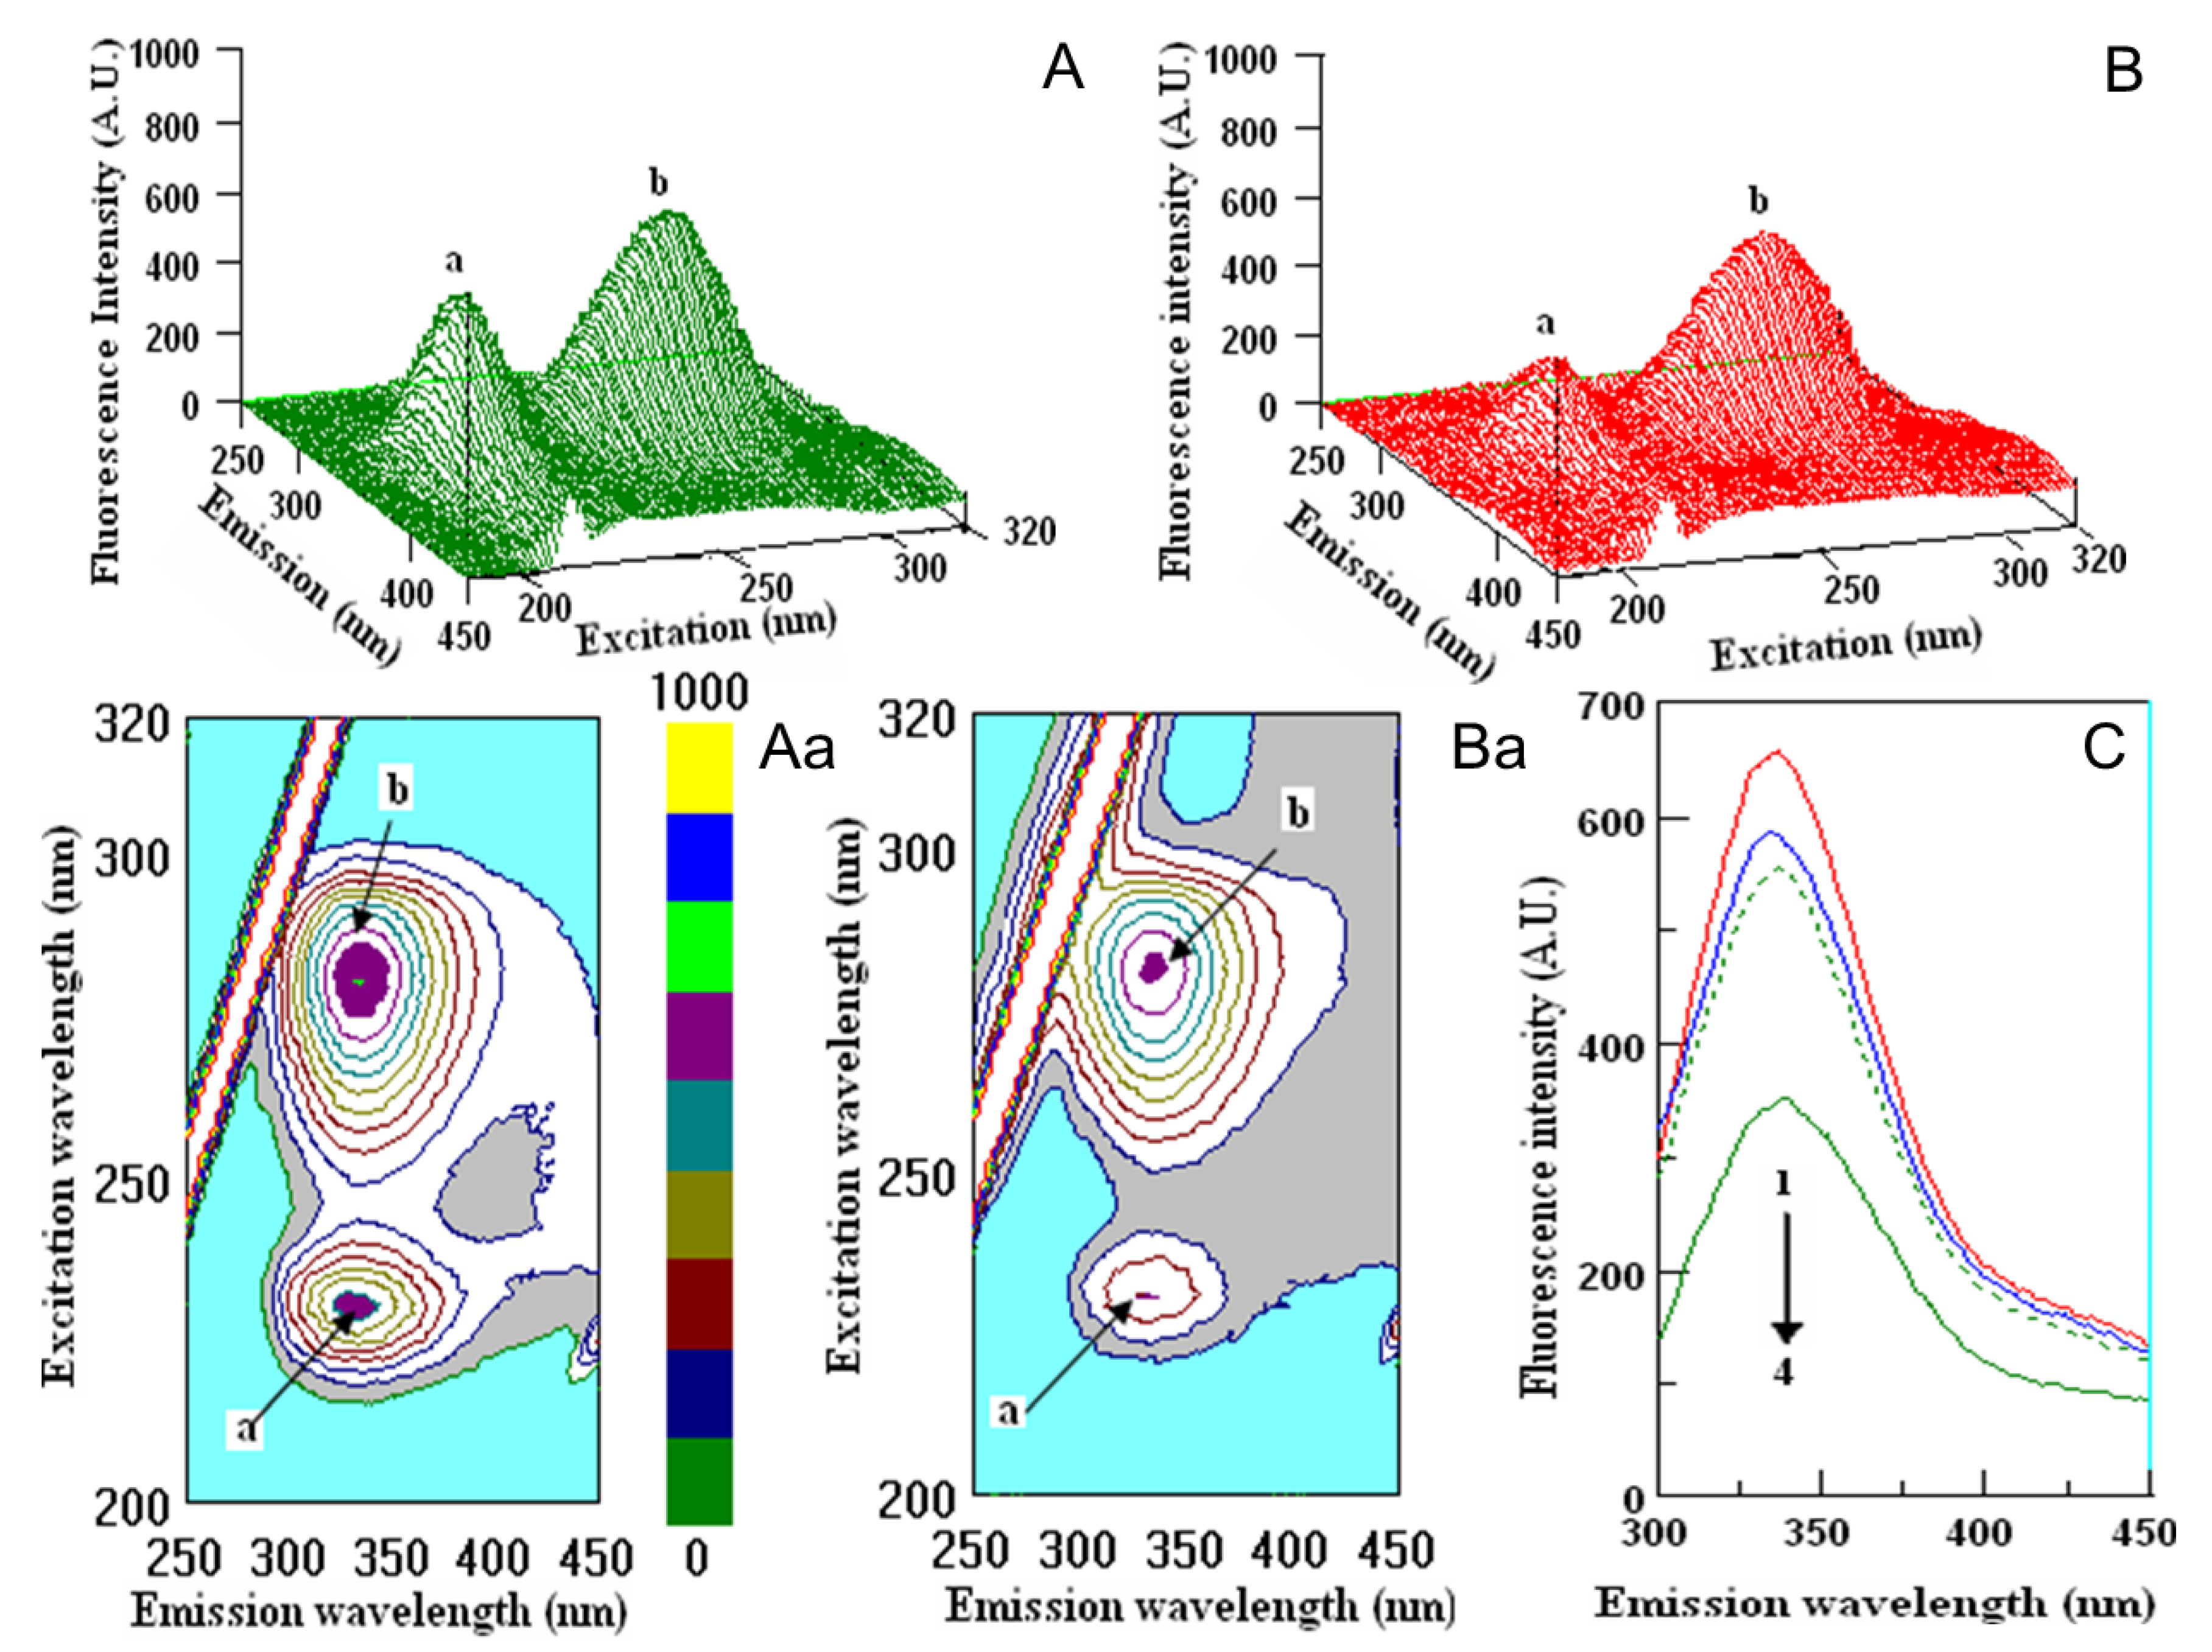
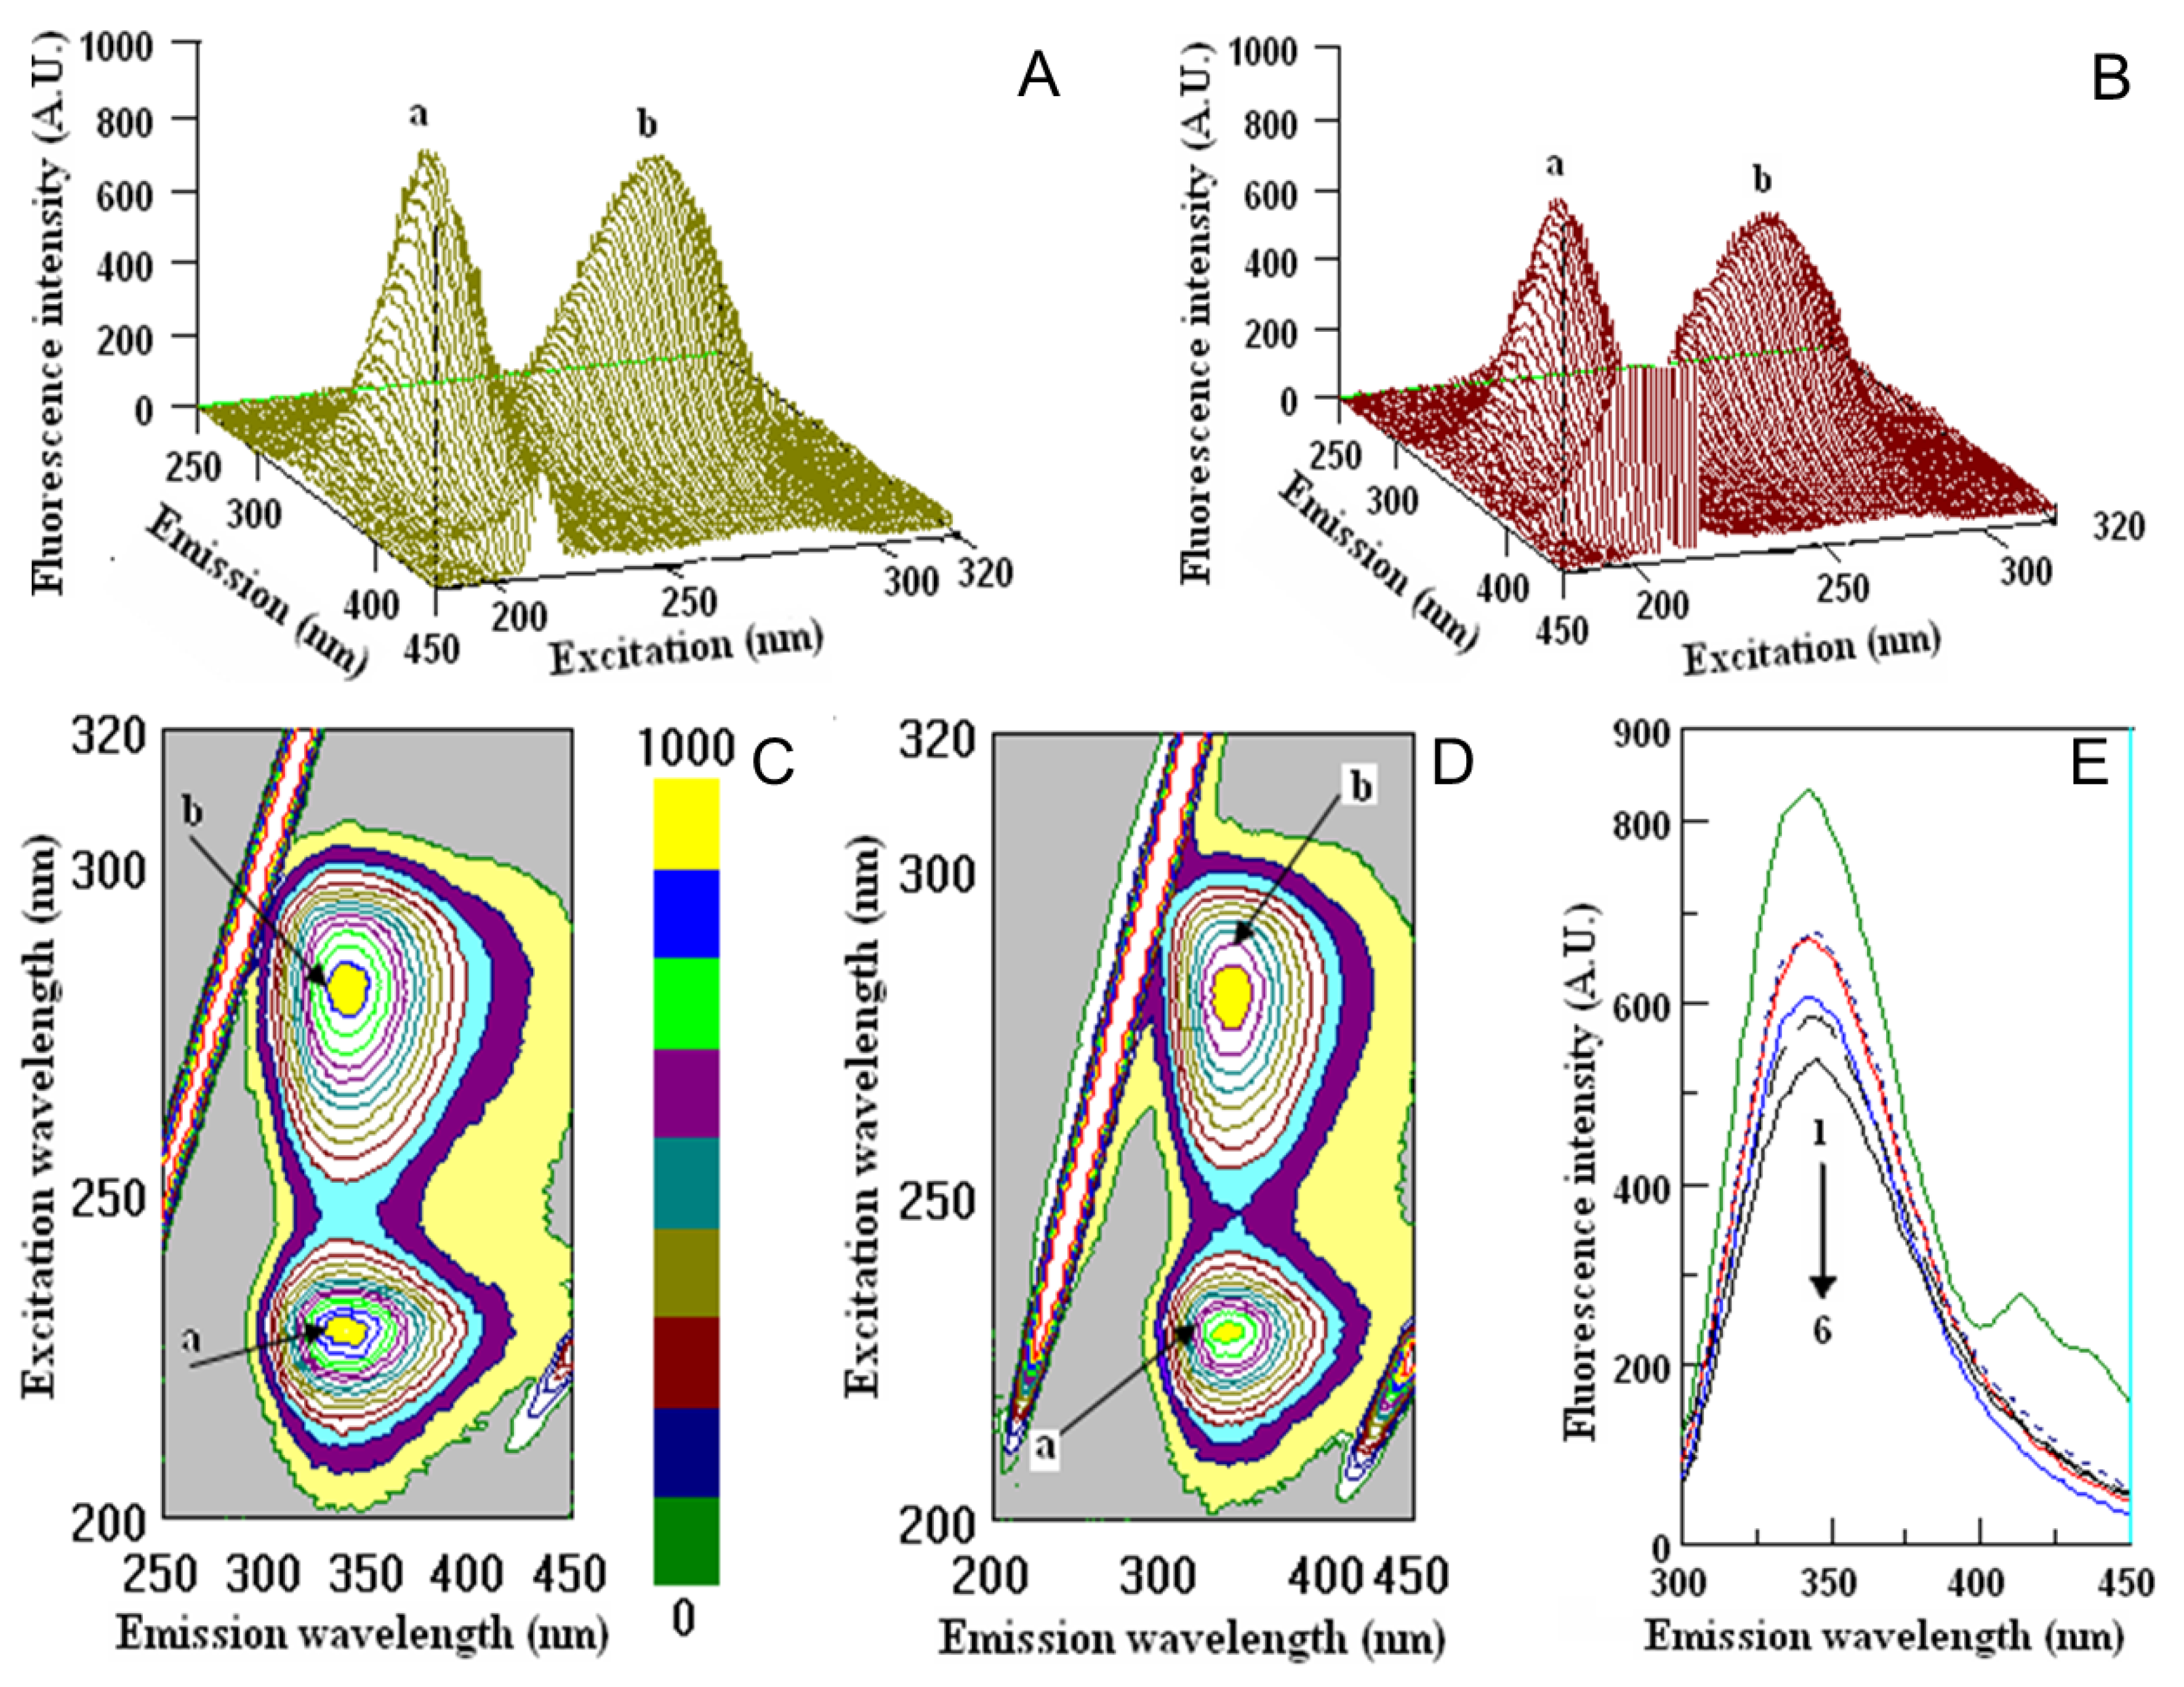
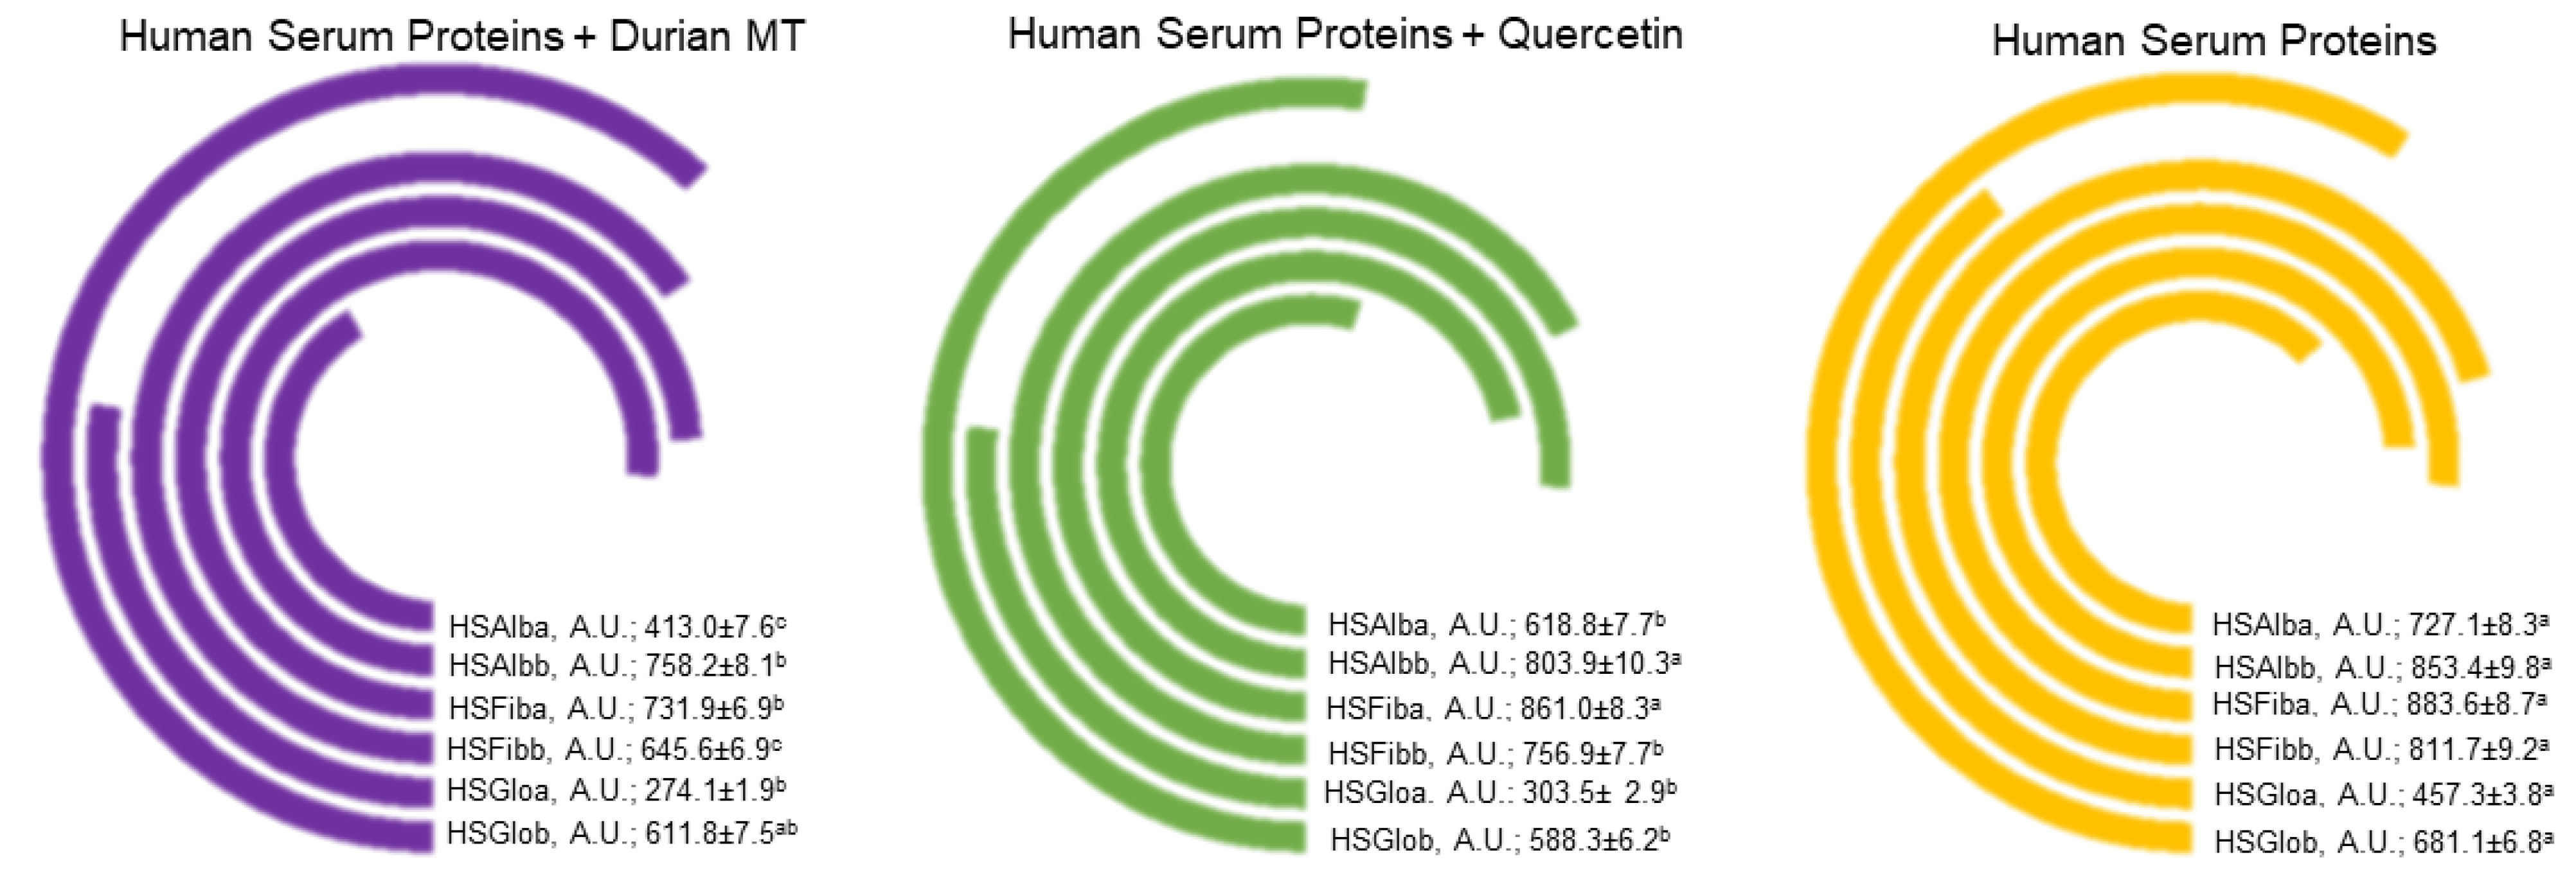
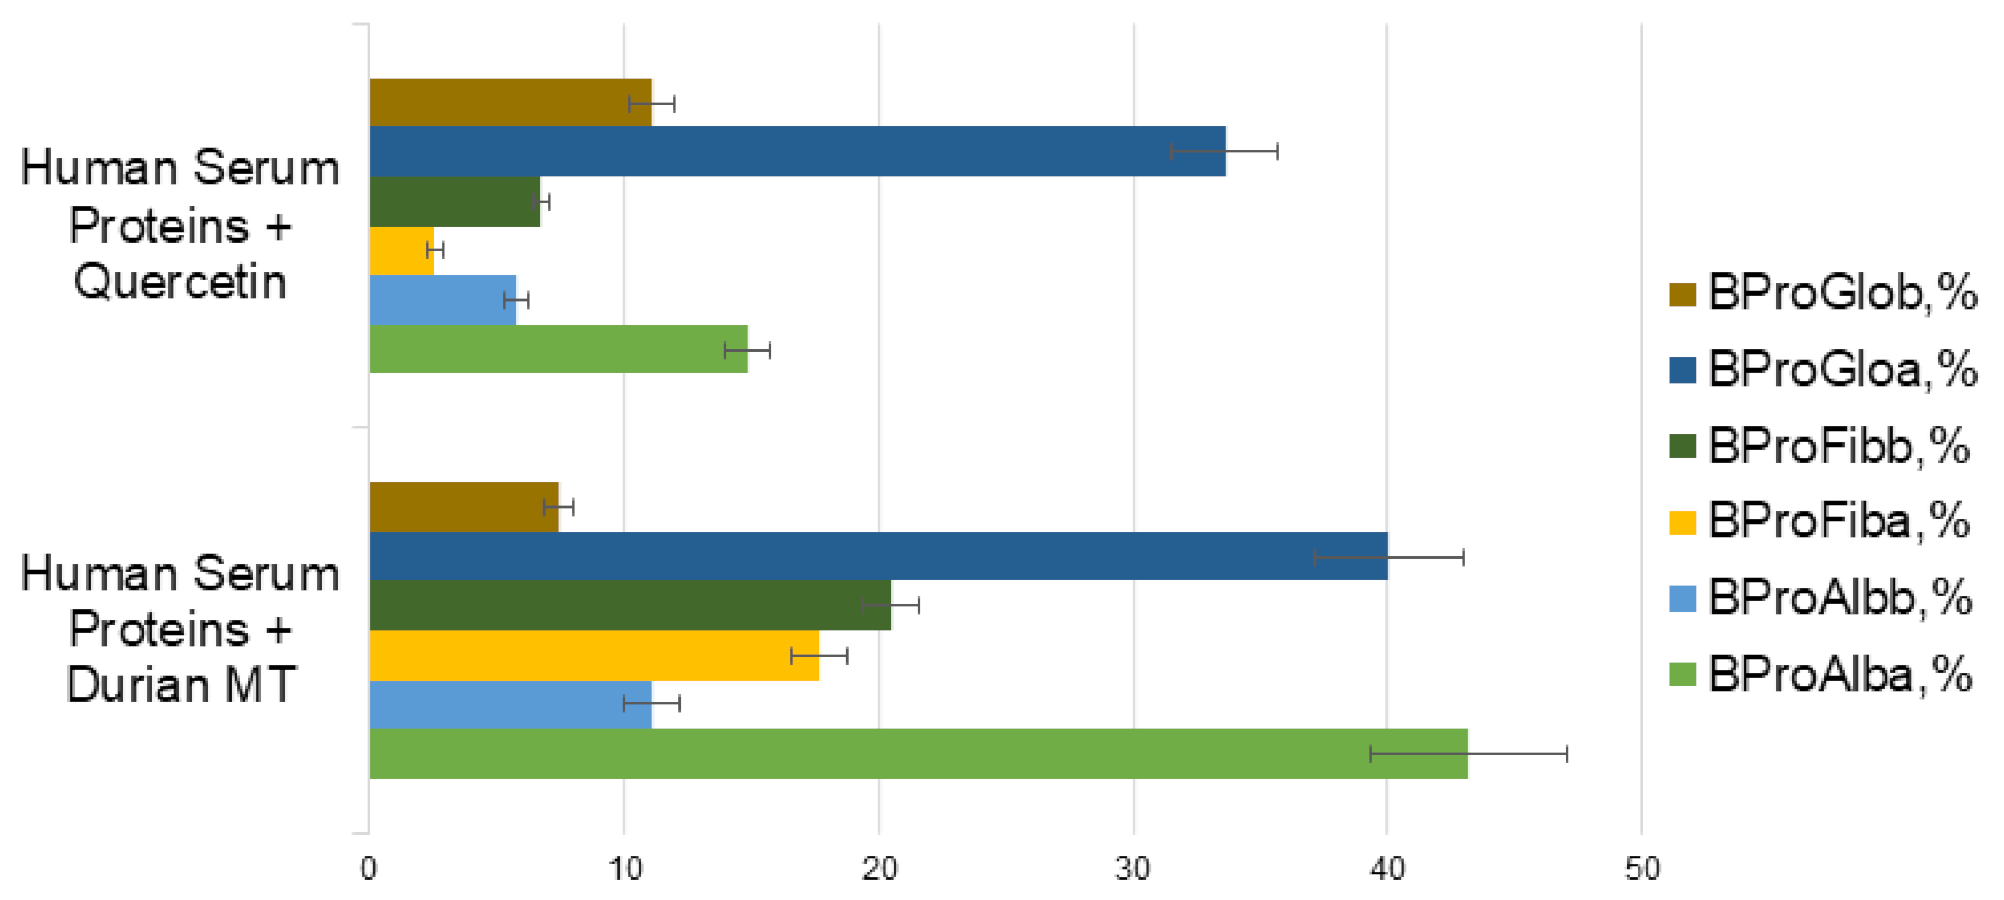
3.5. Binding Properties of Phenolic Properties of Durian Cultivars with Human Serum Proteins

The interaction with the above serum proteins and extracted durian polyphenols are evaluated by the changes in the fluorescence intensity of the proteins. The changes appeared mostly in the positions and values of peaks. The interactions of durian polyphenol extracts with human serum albumin (HSAlb), fibrinogen (HSFib), and globulin (HSGlo) are shown in Figure 5, Figure 6 and Figure 7.
The solution of HSAlb (Figure 5A) in methanol before interaction with polyphenols from three durian cultivars showed the fluorescence intensity (FI) of peak a FIa =727.09 A.U. and of peak b FIb =853.41 A.U. The interaction of HSA with extracted polyphenols from Puangmanee (Figure 5C) showed peak a with FIa =413.04 A.U. and FI of peak b =784.61 A.U. Interaction with Chanee showed similar results as FIa = 412.87 A.U. and FIb = 774.72 A.U. and with Monthong were the lowest in two peaks as FIa = 410.22 A.U. and FIb = 758.24 A.U. The calculated changes in the fluorescence intensity showed the binding properties (%) 51.25, 52.44 and 54.71%, for Puangmanee, Chanee, and Monthong, respectively, by 2 D-fluorescence measurements (Figure 5D). The fluorescence measurements by 3 D-FL showed more precise data, based on the difference in the intensity of two peaks. As it was shown in Figure 5, the bioactivity of the Monthong cultivar was higher than the two others. Therefore, in this report, only interactions of Monthong durian are presented on the Figure 6, Figure 7, Figure 8 and Figure 9 and other samples were omitted. The interaction of human serum globulin (HSGlo) with durian polyphenol extracts and standard solutions is shown in Figure 6. HSGlo fluorescence intensity decreased and was the lowest for tannic acid of 353.2 A.U. and approximately 1.6 times higher than with durian of 587.3 A.U. (Figure 6C).
Lower changes in comparison with the fluorescence intensities of peak a appeared in the position of peak b: the highest peak for durian extract (611.8 A.U.) and the lowest was measured for tannic acid (229.1 A.U.). The images of the interaction of HSGlob with standards and durian showed the maximum peaks a and b and their locations (Figure 6Aa,Ba). The comparison of the values of fluorescence intensity of the native HSGlo (Figure 6C, line 1 from the top) showed that the lowest value was obtained by its interaction with tannic acid (Figure 6C, line 4). Quercetin showed lower bioactivity than tannic acid.
The interaction of investigated samples with human serum fibrinogen (HSFib) is shown in Figure 7. The FI of peak a of HSFib after interaction with durian extracts was 731.9 A.U. (Figure 7B,D) and in comparison with the native HSFib of 883.6 A.U. (Figure 7A,C) and the lowest of tannic acid of 657.4 A.U. The low changes appeared in the position of peak b: for durian of 645.6 A.U., native HSFib of 811.7 and the lowest was measured for tannic acid (595.9 A.U.).
The comparison of the values of fluorescence intensity of the native HSFib (Figure 7E, line 1 from the top) showed that the lowest value was obtained by its interaction with tannic acid (Figure 7E, line 6).
The changes in the fluorescence intensities of peaks a and b in interaction with durian and one of the standards are shown in Figure 8.
The binding properties (%) between human serum proteins and polyphenols extracted from durian pulp are shown in Figure 9.
Binding properties of HSAlb, for polyphenols from durian and quercetin, were 43.2 ± 3.9 and 11.9 ± 0.9, calculated on the basis of fluorescence decrease of peak a and 11.2 ± 1.1 and 5.8 ± 0.5, according to peak b, respectively. Different values were calculated with fibrinogen interaction: for polyphenols from durian and quercetin were in the range of 17.7.6 ± 1.1 and 2.6 ± 0.2, calculated by peak a and 20.5 ± 1.1 and 6.8 ± 0.3, according to peak b, respectively, and with globulin estimated as 40.1 ± 2.9 and 33.6 ± 2.1, calculated by peak a and 7.5 ± 0.6 and 11.8 ± 0.9, according to peak b, respectively (Figure 9).
As it was mentioned previously, the decrease in the fluorescence intensity of native proteins was used for the calculation of the binding properties [22,23]. The comparison of total binding properties of durian polyphenols with main serum proteins showed the following data (%) of durian vs quercetin: HSAlb: 54.4/17.7; HSGlo: 47.6/45.4; HSFib:38.2/9.4. As can be seen from the presented evaluation that quercetin shows lower numbers than durian polyphenols and this can be explained by the synergism of the substances [1,10,18,52]. As it was mentioned, polyphenols might act synergistically with other phytochemicals in different fruits [54,55,56,57]. Our recent studies on the quenching of polyphenols with human serum proteins [22,23] and few reports were focused on the synergism of polyphenols as well as on their affinities for the proteins [58,59,60]. It was also shown that antioxidants may induce conformational and microenvironmental changes in interaction with human serum proteins, acting differently depending on the structure and bioactivity of the substances [61]. It was mentioned previously that the interaction of polyphenols with human serum proteins occurs through hydrophobic interaction. There are many studies explaining the essential role of polyphenolics derived from fruits in the regulation of epigenetic modifications, resulting in antiproliferative protection [42,62]. The doses of polyphenol durian extracts during interaction with human serum proteins showed relatively high bioactivity and binding properties at 0.65 µg/mL. The antiproliferative activity of durian using a breast cancer cell line MCF-7 showed that durian fruit can be considered as a potential source of polyphenols with protective effects against the nitric oxide-induced proliferation of MCF-7 cells. At the concentration of 600 µg/mL, durian fruit extracts inhibited MCF-7 cell growth by 40% [42,63]. Pre-treatment of non-differentiated U937 cells with 40 mg/mL and 20 mg/ mL extract from the pulp of the Monthong cultivar of durian reduced H2O2-induced ROS formation by 30% and 18%, respectively, and with 40 mg/mL of extract of the pulp from Chanee decreased H2O2-induced production of reactive oxygen species (ROS) by 21% while the lower concentrations of this extract failed to significantly alter the generation of ROS. These results suggested that pulp from the Monthong cultivar of durian contained a greater concentration of antioxidant compounds than that of the Chanee cultivar what is exactly in accordance with the present results [18]. MTT (3-(4,5-dimethylthiazol-2-yl)-2,5-diphenyl- tetrazolium bromide) assay was used for the cytotoxicity of durian extract against Chang Liver cell lines [33]. The percentage of cytotoxicity increases with the higher concentrations of durian extract. The maximum cytotoxicity (74%) of fruit extract was recorded at 100 µg/mL. All durian fruit extracts at their higher concentrations (1–5 mg/mL) caused a significant decrease in HepG2 cancer cells viability. The cytotoxic effect (1 mg/mL) of immature and young durian fruits was significantly stronger (29.7 ± 2.5; 27.3 ± 2.1% of alive cells respectively) in comparison to the mature, ripe and overripe durians (51.3 ± 3.1%; 51.3 ± 3.2%; 53.3 ± 4.0% of alive cells, respectively) [33]. The cytotoxic activity of methanol extracts of Monthong durian at different stages of ripening on human pulmonary carcinoma cells Calu-6 and human gastric carcinoma cells SNU-601 of immature, mature, ripe, and overripe durian samples were low, >85% of the cells were alive, even at the highest concentration (2 mg/mL) used in this experiment. The cell survival rate (%) for mature durian fruits was 86.8 ± 1.5 and 88.5 ± 2.5%, on Calu-6 and on SNU-601, respectively, showing the highest activity among the investigated fruits at different ripening state, as opposed to our results, where immature fruits exhibited significantly higher cytotoxic activity in comparison to mature, ripe or overripe durians [14,33]. However, an in vivo study is needed to confirm this effect, based on the interaction of polyphenols with serum proteins in vitro and on cells results obtained. The physiological function of the polyphenols was estimated in the stability of the human proteins and protein-polyphenol system [17,64]. An example of an interaction was reported [62] whereby human serum albumin contributes to the stabilization of (−)-epigallocatechin gallate in serum, showing the participation of reversible covalent binding for interaction and stabilization [65]. These data are in line with other reports, where it was shown that albumin, globulin, and fibrinogen are the main and the most important human serum proteins in metabolism and function, as well in the immune system [66,67]. All these proteins have the capacity to bind metabolites, drugs, organic compounds, and relevant antigens [59,60]. The determined in vitro health properties of durian are in line with some reports [68,69] and our previous studies in vivo [16,31]. The previous studies showed the prevention of coronary artery disease (CAD) by interaction with HSAlb, and in this study, relatively new indicators as globulin and fibrinogen were investigated. In was shown the positive effects of durian fruit at different stages of ripening on the hearts and livers of rats fed diets high in cholesterol [9,46]. The intervention of durian effectively lowered the total cholesterol (TC) and increased the high-density lipoprotein cholesterol (HDL) concentration in hypercholesterolaemic individuals. A reduction in the levels of plasma TC (12.1%), LDL-C (13.3%), and triglycerides (TG) (14.1%) compared with the control group was estimated when durian was added to the diet [10]. Such results were characteristic for a number of fruits [16,31]. The results were consistent when tested with another durian from Thailand varieties (Chanee and Kan Yao) compared with the control. Rats supplemented with ripe durian had significantly lowered TG (26.3%), but not significant in TC (4.8%) and LDL-C (6.3%). Histological analysis demonstrated that ripe durian protected the liver and aorta from exogenous cholesterol loading and protected the intimal surface area of the aorta [9]. The antioxidant potential of durian fruit is relatively high according to its functionality in vitro and in vivo studies and shows against lipid peroxidation metabolism by the production of reactive oxygen species (ROS). The antioxidant capacity of fruit extracts was measured from the suppressive effect on ROS formation. Durian extracts were more potent at suppressing ROS formation and decreasing the secretion of tumor necrosis factor alpha (TNF-α) and interleukin-8 (IL-8) than rambutan extracts [18]. The addition of such fruits to generally accepted diets could be beneficial for hyperlipidemic, especially hypertriglyceridemic patients, suffering from coronary atherosclerosis. We expect that HSAlb, Fib, and Glo will serve as predictors of cardiovascular events.

4. Conclusions

Currently, there are limited studies exploring the health benefits of bioactive components in durian. Hence, we studied the nutritional and bioactive compounds present in durian varieties from Thailand, in comparison with the same fruit grown in similar climate conditions in Indonesia, and mostly in Malaysia. The potential health benefits of durian were carried out by in vitro reactivity with the main human serum proteins, such as albumin, globulin, and fibrinogen. It was shown that durian polyphenols have relatively high binding properties in comparison with other fruits. To the best of our knowledge, this is the first report on the characterization and quantification of phenols and flavonoids, as well as the first investigation of the health properties, including the interaction with the main serum proteins. This study suggests that the durian extracts have strong antioxidant potential and could be a significant source of natural antioxidants and ingredients for functional foods formulation.

Author Contributions

Conceptualization, S.A., R.S., A.W. and S.G.; methodology, P.K., R.H. and R.S.; formal analysis, P.K., P.P., R.T. and E.K.; investigation, S.A., A.W., M.L.-S. and S.G.; resources, O.M., P.P., R.T., R.H. and S.P.; supervision, S.G.; writing—original draft preparation, S.A., M.L.-S. and S.G.; writing—review and editing, M.L.-S. and S.G.; visualization, O.M., E.K., N.C. and S.P.; project administration, S.A., N.C., S.G. and P.P. All authors have read and agreed to the published version of the manuscript.

Funding

This research received no external funding.

Institutional Review Board Statement

Not applicable.

Informed Consent Statement

Not applicable.

Data Availability Statement

The data presented in this study are available on request from the corresponding author. The data are not publicly available due to privacy reasons.

Acknowledgments

Many thanks to Pramoj Ruamsuke (Chanthaburi, Thailand), who during many years supported our joint initiative to investigate the best growing cultivars in Chanthaburi province.

Conflicts of Interest

The authors declare no conflict of interest.

References

  1. Ali, M.M.; Hashim, N.; Abd Aziz, S.; Lasekan, O. Exploring the chemical composition, emerging applications, potential uses, and health benefits of durian: A review. Food Cont. 2020, 113, 107189. [Google Scholar] [CrossRef]
  2. Poovarodom, S.; Haruenkit, R.; Vearasilp, S.; Namiesnik, J.; Cvikrova, M.; Martincova, O.; Ezra, A.; Suhaj, M.; Ruamsuke, P.; Gorinstein, S. Comparative characterization of durian, mango and avocado. J. Food Sci. Technol. 2010, 45, 921–929. [Google Scholar] [CrossRef]
  3. Gorinstein, S.; Haruenkit, R.; Poovarodom, S.; Vearasilp, S.; Ruamsuke, P.; Namiesnik, J.; Leontowicz, M.; Leontowicz, H.; Suhaj, M.; Sheng, G.P. Some analytical assays for the determination of bioactivity of exotic fruits. Phytochem. Anal. 2010, 21, 355–362. [Google Scholar] [CrossRef] [PubMed]
  4. Charoenkiatkul, S.; Thiyajai, P.; Judprasong, K. Nutrients and bioactive compounds in popular and indigenous durian (Durio zibethinus Murr.). Food Chem. 2015, 193, 181–186. [Google Scholar] [CrossRef] [PubMed]
  5. Isabelle, M.; Lee, B.L.; Koh, W.; Huang, D.; Ong, C.N. Antioxidant activity and profiles of common fruits in Singapore. Food Chem. 2010, 123, 77–84. [Google Scholar] [CrossRef]
  6. Kongkachuichai, R.; Charoensiri, R.; Sungpuag, P. Carotenoid, flavonoid profiles and dietary fiber contents of fruits commonly consumed in Thailand. Int. J. Food Sci. Nutr. 2010, 61, 536–548. [Google Scholar] [CrossRef] [PubMed]
  7. Ashraf, M.A.; Maah, M.J.; Yusoff, I. Study of antioxidant potential of tropical fruit durian. Asian J. Chem. 2011, 23, 3357–3361. [Google Scholar]
  8. Jasamai, M.; Samsudin, N.H.; Azmi, N.; Kumolosasi, E. Effects of durian fruit on blood pressure of spontaneously hypertensive rats. Sains Malays. 2018, 47, 1221–1226. [Google Scholar] [CrossRef]
  9. Leontowicz, H.; Leontowicz, M.; Jesion, I.; Bielecki, W.; Poovarodom, S.; Vearasilp, S.; Gonzalez-Aguilar, G.; Robles-Sanchez, M.; Trakhtenberg, S.; Gorinstein, S. Positive effects of durian fruit at different stages of ripening on the hearts and livers of rats fed diets high in cholesterol. Eur. J. Integr. Med. 2011, 3, e169–e181. [Google Scholar] [CrossRef]
  10. Gorinstein, S.; Poovarodom, S.; Leontowicz, H.; Leontowicz, M.; Namiesnik, J.; Vearasilp, S.; Haruenkit, R.; Ruamsuke, P.; Katrich, E.; Tashma, Z. Antioxidant properties and bioactive constituents of some rare exotic Thai fruits and comparison with conventional fruits. In vitro and in vivo studies. Food Res. Int. 2011, 44, 2222–2232. [Google Scholar] [CrossRef]
  11. Korcz, E.; Kerényi, Z.; Varga, L. Dietary fibers, prebiotics, and exopolysaccharides produced by lactic acid bacteria: Potential health benefits with special regard to cholesterol-lowering effects. Food Funct. 2018, 9, 3057–3068. [Google Scholar] [CrossRef]
  12. Paśko, P.; Tyszka-Czochara, M.; Trojan, S.; Bobis-Wozowicz, S.; Zagrodzki, P.; Namieśnik, J.; Haruenkit, R.; Poovarodom, S.; Pinsirodom, P.; Gorinstein, S. Glycolytic genes expression, proapoptotic potential in relation to the total content of bioactive compounds in durian fruits. Food Res. Intern. 2019, 125, 108563. [Google Scholar] [CrossRef]
  13. Toledo, F.; Aranciba-Avila, P.; Park, Y.-S.; Jung, S.-T.; Kang, S.-G.; Heo, B.-G.; Drzewiecki, J.; Zachwieja, Z.; Zagrodzki, P.; Pasko, P.; et al. Screening of the antioxidant and nutritional properties, phenolic contents and proteins of five durian cultivars. Int. J. Food Sci. Nutr. 2008, 59, 415–427. [Google Scholar]
  14. Haruenkit, R.; Poovarodom, S.; Vearasilp, S.; Namiesnik, J.; Sliwka-Kaszynska, M.; Park, Y.-S.; Heo, B.-G.; Cho, J.-Y.; Jang, H.-G.; Gorinstein, S. Comparison of bioactive compounds, antioxidant and antiproliferative activities of Mon Thong durian during ripening. Food Chem. 2010, 118, 540–547. [Google Scholar] [CrossRef]
  15. Pinsorn, P.; Oikawa, A.; Watanabe, M.; Sasaki, R.; Ngamchuachit, P.; Hoefgen, R.; Saito, K.; Sirikantaramas, S. Metabolic variation in the pulps of two durian cultivars: Unraveling the metabolites that contribute to the flavor. Food Chem. 2018, 268, 118–125. [Google Scholar] [CrossRef]
  16. Gorinstein, S.; Caspi, A.; Libman, I.; Katrich, E.; Lerner, H.T.; Trakhtenberg, S. Preventive effects of diets supplemented with sweetie fruits in hypercholesterolemic patients suffering from coronary artery disease. Prev. Med. 2004, 38, 841–847. [Google Scholar] [CrossRef]
  17. López-Yerena, A.; Perez, M.; Vallverdú-Queralt, A.; Escribano-Ferrer, E. Insights into the binding of dietary phenolic compounds to human serum albumin and food-drug interactions. Pharmaceutics 2020, 12, 1123. [Google Scholar] [CrossRef]
  18. Chingsuwanrote, P.; Muangnoi, C.; Parengam, K.; Tuntipopipat, S. Antioxidant and anti-inflammatory activities of durian and rambutan pulp extract. Int. Food Res. J. 2016, 23, 939–947. [Google Scholar]
  19. Li, T.; Li, J.; Hu, W.; Li, S. Quality enhancement in refrigerated red drum (Sciaenops ocellatus) fillets using chitosan coatings containing natural preservatives. Food Chem. 2013, 138, 821–826. [Google Scholar] [CrossRef]
  20. AOAC. Official Methods of Analysis; Association of Analytical Chemists: Washington, DC, USA, 1995. [Google Scholar]
  21. Tan, P.F.; Ng, S.K.; Tan, T.B.; Chong, G.H.; Tan, C.P. Shelf life determination of durian (Durio zibethinus) paste and pulp upon high pressure processing. Food Res. 2019, 3, 221–230. [Google Scholar] [CrossRef]
  22. Shafreen, R.M.B.; Lakshmi, S.A.; Pandian, S.K.; Park, Y.S.; Kim, Y.M.; Pasko, P.; Joseph Deutsch, J.; Katrich, E.; Gorinstein, S. Unraveling the antioxidant, binding and health-protecting properties of phenolic compounds of beers with main human serum proteins: In vitro and in silico approaches. Molecules 2020, 25, 4962. [Google Scholar] [CrossRef] [PubMed]
  23. Kim, Y.M.; Park, Y.S.; Park, Y.-K.; Ham, K.-S.; Kang, S.-G.; Shafreen, R.M.B.; Lakshmi, S.A.; Gorinstein, S. Characterization of bioactive ligands with antioxidant properties of kiwifruit and persimmon cultivars using in vitro and in silico studies. Appl. Sci. 2020, 10, 4218. [Google Scholar] [CrossRef]
  24. Singleton, V.L.; Orthofer, R.; Lamuela-Raventos, R.M. Analysis of total phenols and other oxidation substrates and antioxidants by means of Folin–Ciocalteu reagent. Methods Enzymol. 1999, 299, 152–178. [Google Scholar]
  25. Zhishen, J.; Mengcheng, T.; Jianming, W. The determination of flavonoid contents in mulberry and their scavenging effects on superoxide radicals. Food Chem. 1999, 64, 555–559. [Google Scholar] [CrossRef]
  26. Apak, R.; Guclu, K.; Ozyurek, M.; Karademir, S.E. Novel total antioxidant capacity index for dietary polyphenols and vitamins C and E, using their cupric ion reducing capability in the presence of neocuproine: CUPRAC method. J. Agric. Food Chem. 2004, 52, 7970–7981. [Google Scholar] [CrossRef]
  27. Re, R.; Pellegrini, N.; Proteggente, A.; Pannala, A.; Yang, M.; Rice-Evans, C. Antioxidant activity applying an improved ABTS radical cation decolorization assay. Free. Radic. Biol. Med. 1999, 26, 1231–1237. [Google Scholar] [CrossRef]
  28. Brand-WIlliams, W.; Cuvelier, M.E.; Berset, C. Use of a free radical method to evaluate antioxidant activity. Food Sci. Technol. 1995, 28, 25–30. [Google Scholar] [CrossRef]
  29. Benzie, I.F.F.; Strain, J.J. The ferric reducing ability of plasma (FRAP) as a measure of antioxidant power: The FRAP assay. Anal. Biochem. 1996, 239, 70–76. [Google Scholar] [CrossRef] [Green Version]
  30. Huang, D.; Ou, B.; Hampsch-Woodill, M.; Prior, R.L. High throughput assay of oxygen radical absorbance capacity (ORAC) using a multichannel liquid handling system coupled with a microplate fluorescence reader in 96-well format. J. Agric. Food Chem. 2002, 50, 4437–4444. [Google Scholar] [CrossRef]
  31. Gorinstein, S.; Caspi, A.; Libman, I.; Lerner, H.T.; Huang, D.; Leontowicz, H.; Leontowicz, M.; Tashma, Z.; Katrich, E.; Feng, S.; et al. Red grapefruit positively influences serum triglyceride level in patients suffering from coronary atherosclerosis: Studies in vitro and in humans. J. Agric. Food Chem. 2006, 54, 1887–1892. [Google Scholar] [CrossRef]
  32. Singh, R.P.; Chidamdara, M.; Jayaprakasha, G.K. Studies on the antioxidant activity of pomegranate (Punica granatum) peel and seed extracts using in vitro models. J. Agric. Food Chem. 2002, 50, 81–86. [Google Scholar] [CrossRef]
  33. Saminathan, V.; Doraiswamy, R. Phytochemical analysis, antioxidant and anticancer activities of durian (Durio zibethinus Murr.) fruit extract. J. Res. Pharm. 2020, 24, 882–892. [Google Scholar] [CrossRef]
  34. Mattinen, M.L.; Filpponen, I.; Järvinen, R.; Li, B.; Kallio, H.; Lehtinen, P. Argyropoulos, D. Structure of the polyphenolic component of suberin isolated from potato (Solanum tuberosum var. Nikola). J. Agric. Food Chem. 2009, 57, 9747–9753. [Google Scholar] [CrossRef]
  35. Patle, T.K.; Shrivas, K.; Kurrey, R.; Upadhyay, S.; Jangde, R.; Chauhan, R. Phytochemical screening and determination of phenolics and flavonoids in Dillenia pentagyna using UV–vis and FTIR spectroscopy. Spectrochim. Acta A 2020, 242, 118717. [Google Scholar] [CrossRef]
  36. Park, Y.S.; Cvikrova, M.; Martincova, O.; Ham, K.; Kang, S.; Park, Y.; Namiesnik, J.; Rambola, A.D.; Jastrzebski, Z.; Gorinstein, S. In vitro antioxidative and binding properties of phenolics in traditional, citrus and exotic fruits. Food Res. Int. 2015, 74, 37–47. [Google Scholar] [CrossRef]
  37. Lakshmi, Y.; Ushadevi, A.; Baskaran, R. Post-harvest ripening changes in wood apple (Feronia elephantum Corr), an underutilized fruit. Int. J. Fruit Sci. 2015, 15, 425–441. [Google Scholar] [CrossRef]
  38. Gomez, M.; Lajolo, F.; Cordenunsi, B. Evolution of soluble sugars during ripening of papaya fruit and its relation to sweet taste. J. Food Sci. 2002, 67, 442–447. [Google Scholar] [CrossRef]
  39. Voon, Y.Y.; Sheikh, A.H.N.; Rusul, G.; Osman, A.; Quek, S.Y. Characterisation of Malaysian durian (Durio zibethinus Murr.) cultivars: Relationship of physicochemical and flavour properties with sensory properties. Food Chem. 2007, 103, 1217–1227. [Google Scholar] [CrossRef]
  40. Mokhtar, S.I.; Abd Aziz, N.A. Changes in physicochemical characteristics and organic acids during ripening of five tropical fruit species in Malaysia. J. Teknol. 2015, 77, 119–122. [Google Scholar] [CrossRef] [Green Version]
  41. Farina, V.; Tinebra, I.; Perrone, A.; Sortino, G.; Palazzolo, E.; Mannino, G.; Gentile, C. Physicochemical, nutraceutical and sensory traits of six papaya (Carica papaya L.) cultivars grown in Greenhouse conditions in the Mediterranean climate. Agronomy 2020, 10, 501. [Google Scholar] [CrossRef] [Green Version]
  42. Aziz, A.N.A.; Mhd Jalil, A.M. Bioactive compounds, nutritional value, and potential health benefits of indigenous durian (Durio zibethinus Murr.): A review. Foods 2019, 8, 96. [Google Scholar] [CrossRef] [PubMed] [Green Version]
  43. Fu, L.; Xu, B.; Gan, R.; Zhang, Y.; Xia, E.; Li, H. Antioxidant capacities and total phenolic contents of 62 fruits. Food Chem. 2011, 129, 345–350. [Google Scholar] [CrossRef] [PubMed]
  44. Ashraf, M.A.; Maah, M.J.; Yusoff, I. Estimation of antioxidant phytochemicals in four different varieties of durian (Durio zibethinus murray) fruit. Middle East. J. Sci. Res. 2010, 6, 465–471. [Google Scholar]
  45. Ou, B.; Huang, D.; Hampsch-Woodill, M.; Flanagan, J.; Deemer, E. Analysis of antioxidant activities of common vegetables employing oxygen radical absorbance capacity (ORAC) and ferric reducing antioxidant power (FRAP) assays: A comparative study. J. Agric. Food Chem. 2002, 50, 3122–3128. [Google Scholar] [CrossRef]
  46. Leontowicz, H.; Leontowicz, M.; Haruenkit, R.; Poovarodom, S.; Jastrzebski, Z.; Drzewiecki, J.; Martinez Ayala, A.L.M.; Jesion, I.; Trakhtenberg, S.; Gorinstein, S. Durian (Durio zibethinus Murr.) cultivars as nutritional supplementation to rat’s diets. Food Chem. Toxicol. 2008, 46, 581–589. [Google Scholar] [CrossRef]
  47. Judprasong, K.; Charoenkiatkul, S.; Thiyajai, P.; Sukprasansap, M. Nutrients and bioactive compounds of Thai indigenous fruits. Food Chem. 2013, 140, 507–512. [Google Scholar] [CrossRef]
  48. Poovarodom, S.; Haruenkit, R.; Vearasilp, S.; Ruamsuke, P.; Leontowicz, H.; Leontowicz, M.; Namiesnik, J.; Trakhtenberg, S.; Gorinstein, S. Nutritional and pharmaceutical applications of bioactive compounds in tropical fruits. In International Symposium on Mineral Nutrition of Fruit Crops, 9th ed.; Poovarodom, S., Yingjajaval, Eds.; International Society for Horticultural Science: Korbeek-Lo, Belgium, 2013; Volume 1, pp. 77–86. ISBN 978-90-66052-99-4. [Google Scholar]
  49. Santos, D.I.; Correia, M.J.N.; Mateus, M.M.; Saraiva, J.A.; Vicente, A.A.; Moldão, M. Fourier transform infrared (FT-IR) spectroscopy as a possible rapid tool to evaluate abiotic stress effects on pineapple by-products. Appl. Sci. 2019, 9, 4141. [Google Scholar] [CrossRef] [Green Version]
  50. Stuart, B.H. Industrial and environmental applications. In Infrared Spectroscopy: Fundamentals and Applications; John Wiley & Sons, Ltd.: Chichester, UK, 2005; pp. 167–186. ISBN 9780470011140. [Google Scholar]
  51. Mayra, A.; Castroa, P.; Rodrígueza, H.G. Study by infrared spectroscopy and thermogravimetric analysis of tannins and tannic acid. Rev. Latinoam. Quím. 2011, 39, 107–112. [Google Scholar]
  52. Natarajan, V.; Krithica, N.; Madhan, B.; Sehgal, P.K. Formulation and evaluation of quercetin polycaprolactone microspheres for the treatment of rheumatoid arthritis. J. Pharm. Sci. 2011, 100, 195–205. [Google Scholar] [CrossRef]
  53. Park, Y.S.; Ham, K.S.; Kang, S.G.; Park, Y.K.; Namiesnik, J.; Leontowicz, H.; Leontowicz, M.; Ezra, A.; Trakhtenberg, S.; Gorinstein, S. Organic and conventional kiwifruit, myths versus reality: Antioxidant, antiproliferative, and health effects. J. Agric. Food Chem. 2012, 60, 6984–6993. [Google Scholar] [CrossRef]
  54. Gorinstein, S.; Kulasek, G.W.; Bartnikowska, E.; Leontowicz, M.; Zemser, M.; Morawiec, M.; Trakhtenberg, S. The effects of diets, supplemented with either whole persimmon or phenol-free persimmon, on rats fed cholesterol. Food Chem. 2000, 70, 303–308. [Google Scholar] [CrossRef]
  55. Gorinstein, S.; Zachwieja, Z.; Katrich, E.; Pawelzik, E.; Haruenkit, R.; Trakhtenberg, S.; Martin-Belloso, O. Comparison of the contents of the main antioxidant compounds and the antioxidant activity of white grapefruit and his new hybrid. LWT Food Sci. Tech. 2004, 37, 337–343. [Google Scholar] [CrossRef]
  56. Ketsa, S.; Palapol, Y.; Paull, R.E. The durian: Botany, horticulture and utilization. In Horticultural Reviews; Warrington, I., Ed.; John Wiley & Sons, Inc.: Hoboken, NJ, USA, 2020; Volume 47. [Google Scholar]
  57. Ho, L.H.; Bhat, R. Exploring the potential nutraceutical values of durian (Durio zibethinus L.)—A exotic tropical fruit. Food Chem. 2015, 168, 80–89. [Google Scholar] [CrossRef]
  58. Xiao, J.B.; Kai, G.Y. A review of dietary polyphenol-plasma protein interactions: Characterization, influence on the bioactivity, and structure-affinity relationship. Crit. Rev. Food Sci. Nutr. 2011, 52, 85–101. [Google Scholar] [CrossRef]
  59. He, W.; Hu, Z.; Yao, X.; Chen, G. Comparison of the interaction of alpinetin and cardamonin with human gamma globulin. Acta Chim. Sin. 2010, 68, 679–688. [Google Scholar]
  60. Yang, F.; Zhao, Y.R.; Kai, G.Y.; Xiao, J.B. Interaction of dietary flavonoids with gamma-globulin: Molecular property-binding affinity relationship aspect. Food Funct. 2011, 2, 137–141. [Google Scholar] [CrossRef]
  61. Li, X.; Chen, D.; Wang, G.; Lu, Y. Study of interaction between human serum albumin and three antioxidants: Ascorbic acid, α-tocopherol, and proanthocyanidins. Eur. J. Med. Chem. 2013, 70, 22–36. [Google Scholar] [CrossRef]
  62. Stefanska, B.; Karlic, H.; Varga, F.; Fabianowska-Majeska, K.; Haslberger, A.G. Epigenetic mechanisms in anti-cancer actions of bioactive food components—The implications in cancer prevention. Br. J. Pharmacol. 2012, 167, 279–297. [Google Scholar] [CrossRef] [Green Version]
  63. Jayakumar, R.; Kanthimathi, M.S. Inhibitory effects of fruit extracts on nitric oxide-induced proliferation in MCF-7 cells. Food Chem. 2011, 126, 956–960. [Google Scholar] [CrossRef]
  64. Peng, X.; Wang, X.; Qi, W.; Su, R.; He, Z. Affinity of rosmarinic acid to human serum albumin and its effect on protein conformation stability. Food Chem. 2016, 192, 178–187. [Google Scholar] [CrossRef]
  65. Ishii, T.; Ichikawa, T.; Minoda, K.; Kusaka, K.; Ito, S.; Suzuki, Y.; Akagawa, M.; Mochizuki, K.; Goda, T.; Nakayama, T. Human serum albumin as an antioxidant in the oxidation of (−)-epigallocatechin gallate: Participation of reversible covalent binding for interaction and stabilization. Biosci. Biotech. Biochem. 2011, 75, 100–106. [Google Scholar] [CrossRef] [PubMed] [Green Version]
  66. Williams, S.A.; Kivimaki, M.; Langenberg, C.; Hingorani, A.D.; Casas, J.P.; Bouchard, C.; Jonasson, C.; Sarzynski, M.A.; Shipley, M.J.; Alexander, L.; et al. Plasma protein patterns as comprehensive indicators of health. Nat. Med. 2019, 25, 1851–1857. [Google Scholar] [CrossRef] [PubMed]
  67. Tothova, C.; Nagy, O.; Kovac, G. Serum proteins and their diagnostic utility in veterinary medicine: A review. Vet. Med. 2016, 61, 475–496. [Google Scholar] [CrossRef] [Green Version]
  68. Lakkis, J.I.; Weir, R.W. Hyperkalemia in the hypertensive patient. Curr. Cardiol. Rep. 2018, 20, 12. [Google Scholar] [CrossRef]
  69. Poloni, D.M.; Dangles, O.; Vinson, J.A. Binding of plant polyphenols to serum albumin and LDL: Healthy implications for heart disease. J. Agric. Food Chem. 2019, 67, 9139–9147. [Google Scholar] [CrossRef]
Figure 1. Local cultivars of Thai durian: Monthong (MT), Chanee (CN), Puangmanee (PM) and Kanyao (KN).
Applsci 11 05653 g001
Figure 2. Total polyphenol compounds (TPC, mg GAE/g DW) and total flavonoid compounds (TFC, mg CE/g DW) in local cultivars of Thai durians: Monthong (MT), Chanee (CN) and Puangmanee (PM). Values are means ± SD per g dry weight (DW); n = 5 samples per cultivar, each subsampled and analyzed 5 times. Values with different superscript letters are significantly different (p < 0.05). Abbreviations: GAE, gallic acid equivalent; CE, catechin equivalent.
Applsci 11 05653 g002
Figure 3. Antioxidant activities values (µM TE/g DW) of DPPH (1,1-Diphenyl-2-picrylhydrazyl method); FRAP (Ferric-reducing/antioxidant power); ABTS [(2,2-Azino-bis(3-ethyl-benzothiazoline-6-sulfonic acid)diammonium salt]; CUPRAC (Cupric reducing antioxidant capacity); ORAC (Oxygen radical absorbance capacity); antioxidant activities by DPPH and ABTS assays (% of inhibition) in durian cultivars. Values are means ± SD per g dry weight (DW); n = 5 samples per cultivar, each subsampled and analyzed 5 times. Abbreviations: TE, Trolox equivalent; PM, Puangmanee; MT, Monthong; CN, Chanee.
Applsci 11 05653 g003
Figure 4. (A), Fourier transform infrared (FTIR) spectra of polyphenols of durian extracts from the top: Monthong, Chanee and Puangmanee. (B), Differential scanning calorimetry (DSC) measurements of Puangmanee, Chanee and Monthong.
Applsci 11 05653 g004
Figure 5. Fluorometric measurements in three-dimensional fluorescence analysis (3D-FL) of durian polyphenol extracts after interaction with human serum albumin (HSAlb). (AC) cross images HSAlb in methanol, HSA + Monthong; HSA + Puangmanee; (D), Spectral data of two-dimensional fluorescence measurements (2D-FL) of durian extracts and HSAlb from the top: 1, 2, 3, HSAlb (FI = 954.29 A.U.); HSA+ Puangmanee (FI = 911.86 A.U.); HSA+ Monthong (FI = 897.13 A.U.). The location of peaks a and b are shown in Figure 5, Figure 6 and Figure 7 (for interpretation of the references to color in this figure legend, the reader is referred to the web version of this article).
Applsci 11 05653 g005
Figure 6. Fluorometric measurements in three-dimensional fluorescence analysis (3D-FL) of durian extracts after interaction with globulin (A,B), globulin (HSGlo) in buffer, Glo + Monthong; (Aa) and (Ba), their cross images. (C), Spectral data of two-dimensional fluorescence measurements (2D-FL) of durian extract, standards and Glo from the top: 1, 2, 3, 4, Glo (FI = 658.57 A.U.), Glo + durian (FI = 587.25 A.U.); Glo + quercetin (FI = 554.04 A.U.); Glo + tannic acid (FI = 353.19 A.U.); Abbreviations: Glo, globulin; FI, fluorescence intensity, A.U., arbitral units; The location of peaks a and b are shown in Figure 5, Figure 6 and Figure 7 (for interpretation of the references to color in this figure legend, the reader is referred to the web version of this article).
Applsci 11 05653 g006
Figure 7. Fluorometric measurements in three-dimensional fluorescence analysis (3D-FL) of durian extracts after interaction with fibrinogen. (A,B), 3D-FL of Fib in buffer, Fib+ durian Monthong; (C,D), their cross images. (E), Spectral data of two dimensional fluorescence measurements (2D-FL) of durian extracts and Fib from the top: 1, 2, 3, 4, 5, 6, Fib (FI = 834.71 A.U.), Fib + quercetin (FI = 680.42 A.U.); Fib + caffeic acid (FI = 671.79 A.U.); Fib + catechin (FI = 606.17 A.U.); Fib + MT (FI = 584.43 A.U.); Fib + tannic acid (FI = 538.23 A.U.) Abbreviations: Fib, fibrinogen, FI, fluorescence intensity, A.U, arbitral units; The location of peaks a and b are shown in Figure 5, Figure 6 and Figure 7 (for interpretation of the references to color in this figure legend, the reader is referred to the web version of this article).
Applsci 11 05653 g007
Figure 8. The changes in fluorescence intensity of peaks a and b of human serum albumin, globulin and fibrinogen (HSAlb, HSGlo, HSFib) with durian and quercetin.
Applsci 11 05653 g008
Figure 9. The binding properties (%) of durian extracted polyphenols based on fluorometric measurements interaction with human serum proteins. Abbreviations: MT, Monthong; BProGlob, binding properties of human serum globulin by interaction with quercetin and durian, measured by changes in the fluorescence intensity of peak b; BProGloa, binding properties of human serum globulin by interaction with quercetin and durian, measured by changes in the fluorescence intensity of peak a; BProFibb, binding properties of human serum fibrinogen by interaction with quercetin and durian, measured by changes in the fluorescence intensity of peak b; BProFiba, binding properties of human serum fibrinogen by interaction with quercetin and durian, measured by changes in the fluorescence intensity of peak a; BProAlbb, binding properties of human serum albumin by interaction with quercetin and durian, measured by changes in the fluorescence intensity of peak b; BProAlba, binding properties of human serum albumin by interaction with quercetin and durian, measured by changes in the fluorescence intensity of peak a. The locations and the values of peaks a and b are shown in Figure 5, Figure 6 and Figure 7 (for interpretation of the references to color in this figure legend, the reader is referred to the web version of this article).
Applsci 11 05653 g009
Table 1. The duration (days) of durian ripening at different maturity levels and cultivars.
CultivarsMaturity Levels (Day)
YoungMatureRipeRipe + 1Overripe
Monthong057910
Chanee046810
Kanyao03579
Table 2. The pH, acidity, °Brix and total soluble solid of durian in different maturity levels and cultivars.
CultivarsMaturity LevelspHAcidity (%)(°Brix)Total Soluble Solids (%)
MonthongYoung7.08 ± 0.02 a0.07 ± 0.00 h2.93 ± 0.15 f8.80 ± 0.46 f
Mature6.74 ± 0.03 d0.15 ± 0.01 e6.77 ± 0.15 d20.30 ± 0.46 d
Ripe6.76 ± 0.01 d0.18 ± 0.01 c,d8.33 ± 0.15 c25.00 ± 0.46 c
Ripe + 16.68 ± 0.02 e0.20 ± 0.00 a,b8.53 ± 0.15 c25.60 ± 0.46 c
Overripe6.62 ± 0.02 f0.21 ± 0.01a9.53 ± 0.25 b28.60 ± 0.75 b
ChaneeYoung6.83 ± 0.02 b0.13 ± 0.01 f5.30 ± 0.10 e15.90 ± 0.30 e
Mature6.67 ± 0.05 e0.17 ± 0.01 d,e6.80 ± 0.10 d20.40 ± 0.30 d
Ripe6.61 ± 0.04 f,g0.18 ± 0.01 b,c,d8.37 ± 0.15 c25.10 ± 0.46 c
Ripe + 16.57 ± 0.03 g0.18 ± 0.01 b,c8.63 ± 0.15 c25.90 ± 0.46 c
Overripe6.45 ± 0.01 h0.19 ± 0.00 a,b,c9.37 ± 0.12 b28.10 ± 0.35 b
KanyaoYoung6.82 ± 0.02 b,c0.11 ± 0.01 g5.13 ± 0.12 e15.40 ± 0.35 e
Mature6.77 ± 0.01 c,d0.13 ± 0.01 f6.93 ± 0.25 d20.80 ± 0.75 d
Ripe6.74 ± 0.02 d0.14 ± 0.01 f8.47 ± 0.12 c25.40 ± 0.35 c
Ripe + 16.83 ± 0.03 b0.18 ± 0.01 b,c,d9.63 ± 0.23 b28.90 ± 0.69 b
Overripe6.84 ± 0.01 b0.18 ± 0.01 b,c,d10.63 ± 0.25 a31.90 ± 0.75 a
Values are means ± SD; Different letters in the same column represent significant differences (p < 0.05).
Publisher’s Note: MDPI stays neutral with regard to jurisdictional claims in published maps and institutional affiliations.

