Article

Piezoresistive Characteristics of Nanocarbon Composite Strain Sensor by Its Longitudinal Pattern Design

1
Department of Mechanical and Design Engineering, Pukyong National University, Busan 48513, Korea
2
Mechanical Components and Materials R&D Group, Korea Institute of Industrial Technology (KITECH), Daegu 42994, Korea
3
Innovative Smart Manufacturing R&D Department, Korea Institute of Industrial Technology (KITECH), Cheonan 31056, Korea
4
Department of Mechanical Engineering, Pusan National University, Busan 46241, Korea
*
Author to whom correspondence should be addressed.
These authors contributed equally as a first author to this work.
Submission received: 11 May 2021 / Revised: 16 June 2021 / Accepted: 18 June 2021 / Published: 22 June 2021

Abstract

:
For an engineering feasibility study, we studied a simple design to improve NCSS (nanocarbon composite strain sensor) sensitivity by using its geometric pattern at a macro scale. We fabricated bulk- and grid-type sensors with different filler content weights (wt.%) and different sensor lengths and investigated their sensitivity characteristics. We also proposed a unit gauge factor model of NCSS to find a correlation between sensor length and its sensitivity. NCSS sensitivity was improved proportional to its length incremental ratio and we were able to achieve better linear and consistent data from the grid type than the bulk type one. We conclude that the longer sensor length results in a larger change of resistance due to its piezoresistive unit summation and that sensor geometric pattern design is one of the important issues for axial load and deformation measurement.

1. Introduction

Due to their versatility and exceptional mechanical and electrical properties, nanocarbon materials have been studied for use in reinforced composites as well as in transducers [1,2,3]. The incorporation of nanocarbon materials, with their pertinent electrical properties, allows for applications as sensors in a wide range of fields [4,5,6,7,8,9,10,11].
A nanocarbon composite can be used as a sensory material due to the electrically conductive fillers in the matrix. Having electrical conductivity, the nanocarbon composite has a piezoresistive feature that can be used like a commercial foil strain gauge. We reported the comparable strain sensing performance of a nanocarbon composite strain sensor (NCSS) to a commercial foil strain gauge [12]. Although the strain sensing performances of the two sensors are similar, the piezoresistive mechanism of the NCSS is more complicated than that of the metallic type gauge [13]. The piezoresistive mechanism of the NCSS is related to various factors, such as the properties of the matrix, the content and arrangement of the fillers, and the geometric shape of the composite.
In particular, the piezoresistivity is directly related to the NCSS sensitivity, and it may be controllable via the fabrication process variables. During the sensor fabrication process, we believe that sensor irregularities generally occur due to filler randomness, including quality and dispersion, which dominate a sensor’s electrical properties. Such irregularities may hamper the ability to achieve uniform performance of an individual sensor. To predict nanoscale internal filler behavior, researchers have studied physical models [14,15,16,17], computer-based molecular dynamics, and other types of simulations [18,19,20,21].
Some researchers have studied variations in NCSS sensitivity based on fabrication methodology. Lee et al. fabricated a single-walled carbon nanotube (SWCNT) film strain sensor using the spray method in a grid form and studied the sensor resistance and sensitivity characteristics according to the number of grids and the thickness of the sensor [22]. In addition, Huang et al. fabricated a SWCNT nano strain sensor by alcohol catalytic chemical vapor deposition (ACCVD) and studied the sensor sensitivity characteristics according to the SWCNT growth time and the number of sensor grids [23]. Wang et al. used the spray deposition modeling (SDM) method to fabricate carbon nanotube (CNT) sensors with varying thicknesses and investigated their piezoresistive properties [24]. Kong et al. fabricated a composite sensor using carbon black and PDMS (Polydimethylsiloxane), and proposed an application case with different patterns and shapes for the sensor [25].
There have been other similar macroscopic approaches based on sensor pattern studies. Li et al. fabricated multi-walled carbon nanotube (MWCNT) film sensors using a solution/filtration method, and they tested piezoresistivity with an optimized aspect ratio to obtain a proper signal from the sensor [26]. Xu and Allen fabricated a MWCNT/PDMS strain sensor. They showed the correlation between the initial resistance according to sensor thickness and sensor sensitivity [27]. Other studies have investigated improvements to NCSS sensitivity by using hybrid nanocarbon composites or functionalized nanocarbon fillers [28,29,30].
Since the quality control of most nanocomposites remains a challenge at the mass production level, the electrical characteristics of nanocarbon composites are also hard to consistently control. Consequently, most fabricated NCSSs may not have identical piezoresistive properties in terms of the nanocomposite process at the nano or micro scales. However, a commercial strain sensor yields uniform performance according to specifications, and a customer can expect reliable output from the sensor to meet the desired purpose. Unlike conventional strain sensors, NCSSs tend to involve many complexities at micro and macro scales and, furthermore, they are difficult to fabricate.
Therefore, for an engineering feasibility study, we used a simple design to improve NCSS sensitivity by using its macroscale geometric pattern. We fabricated bulk- and grid-type sensors with different filler contents (wt.%) and different sensor lengths, and we investigated their sensitivity characteristics. We also proposed a unit gauge factor model of NCSS to determine the correlation between sensor length and its sensitivity.

2. Experimental Program

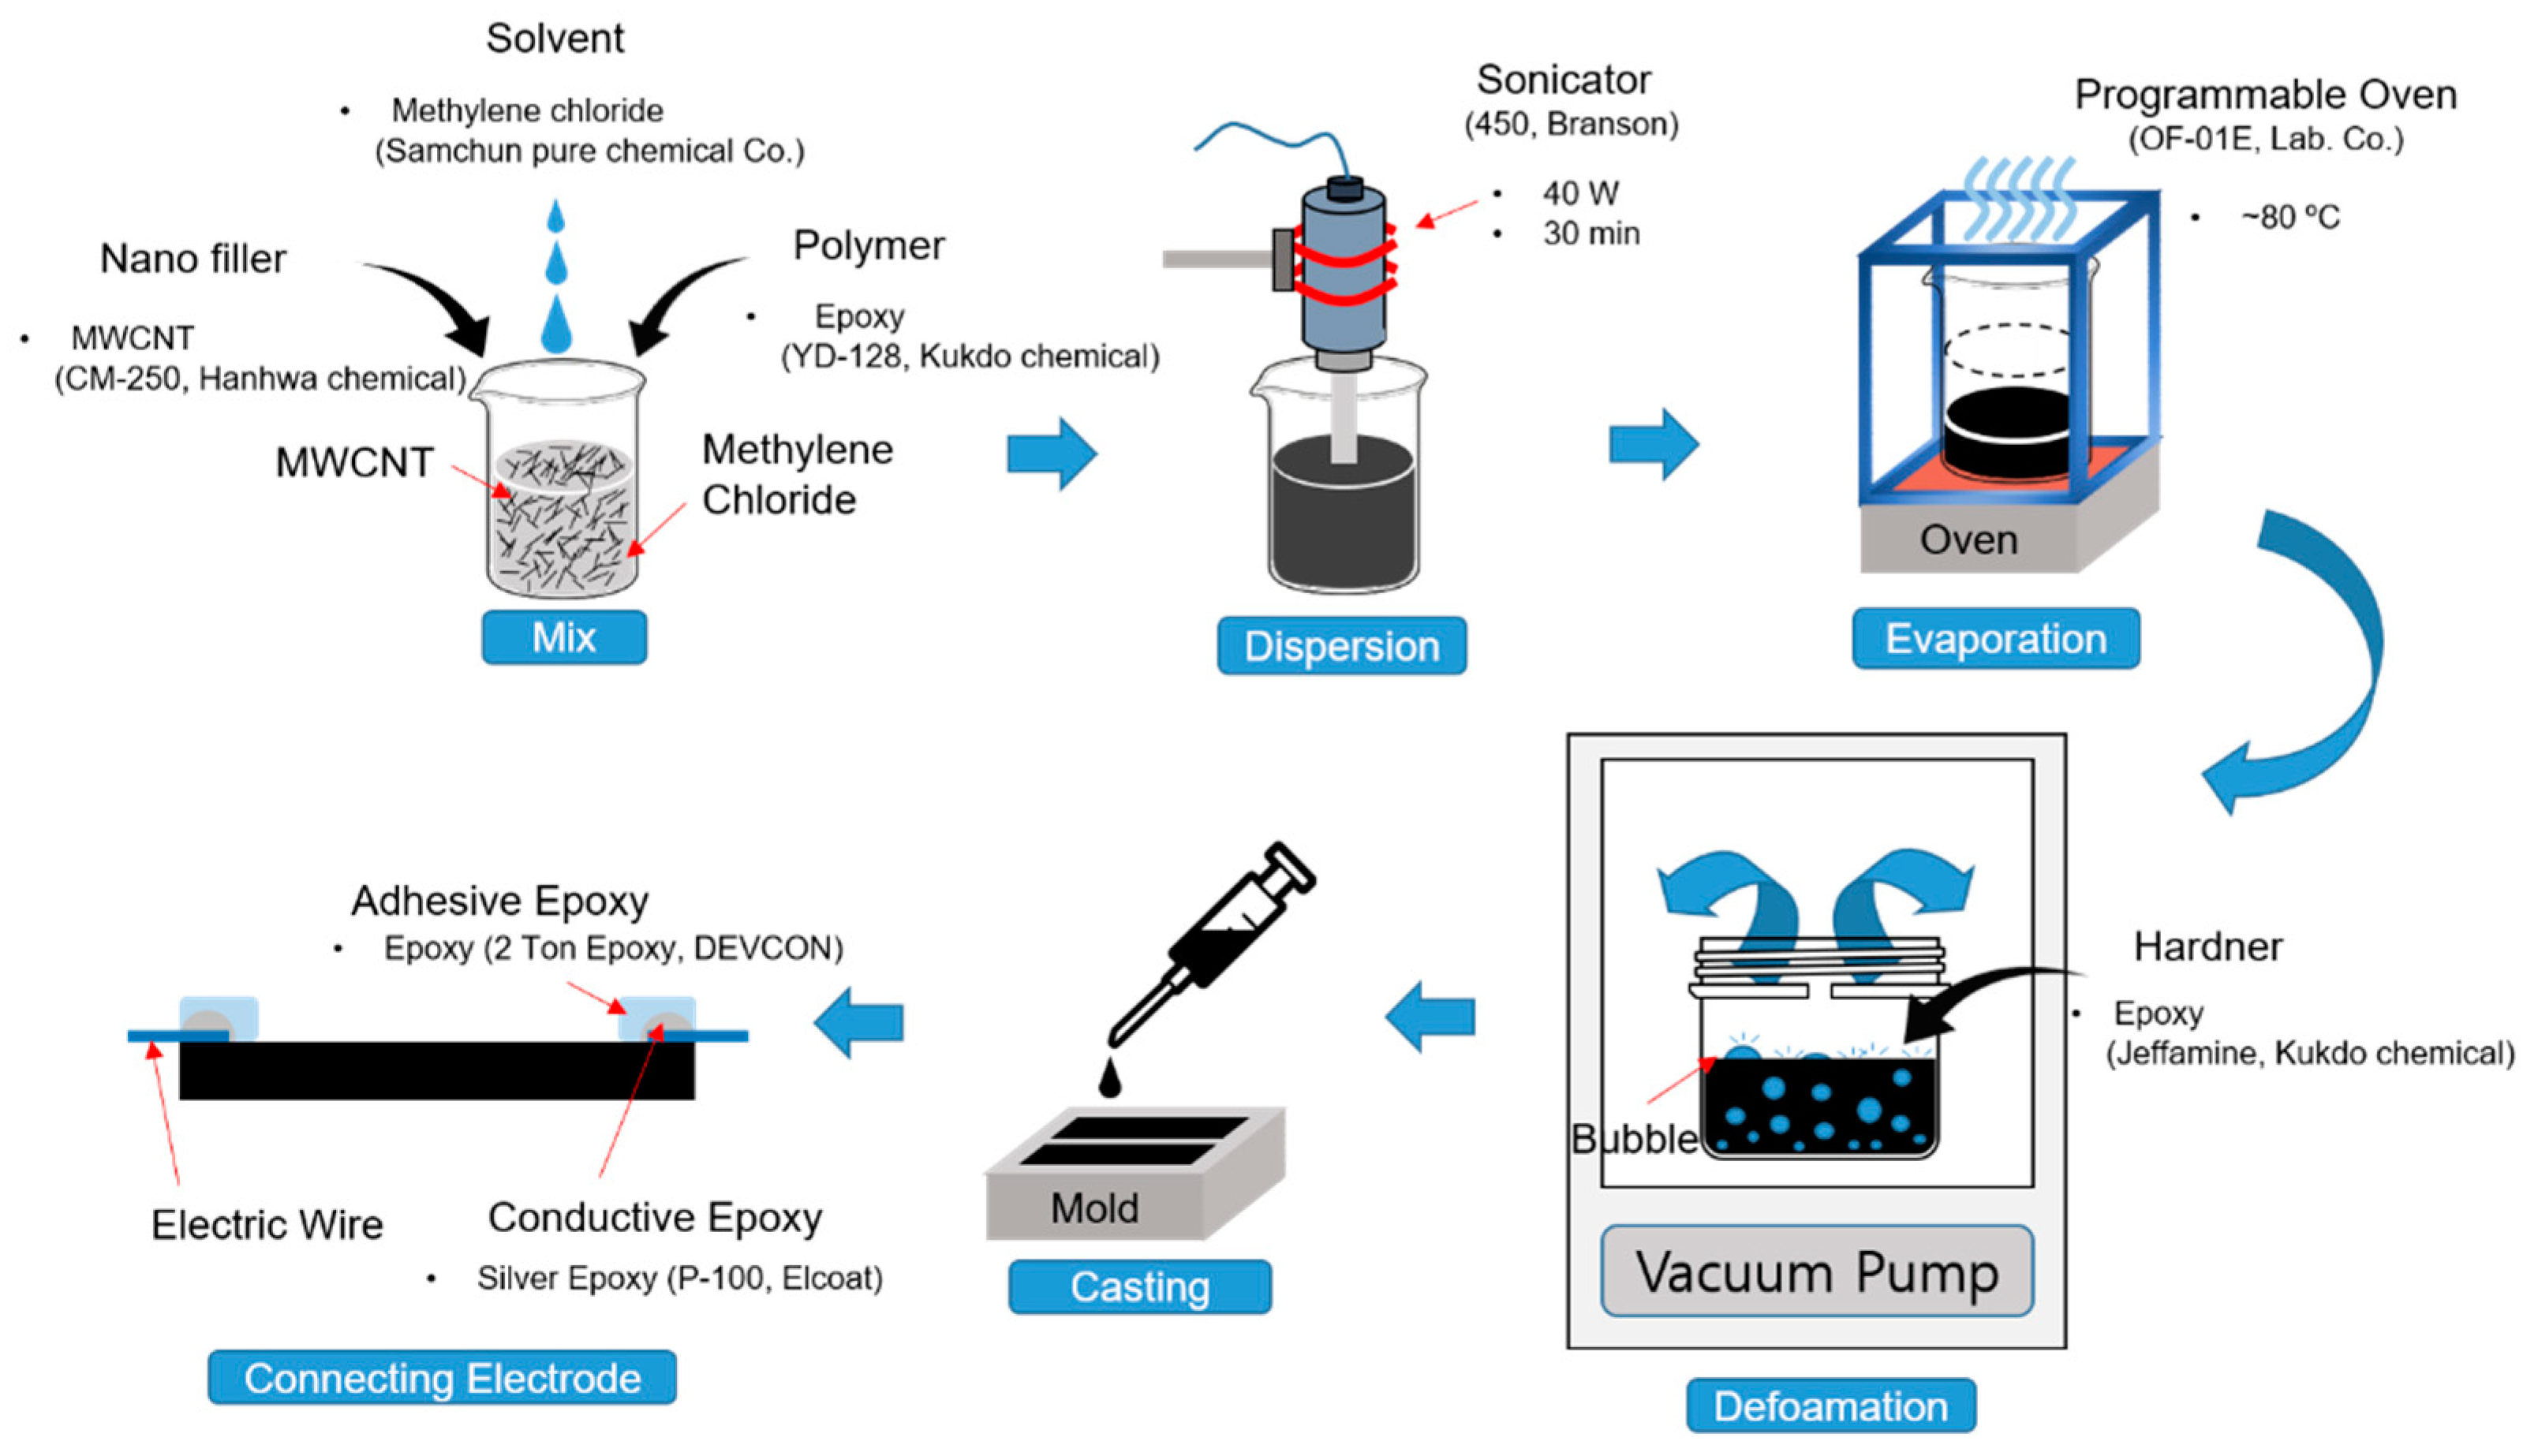
2.1. NCSS Fabrication Process
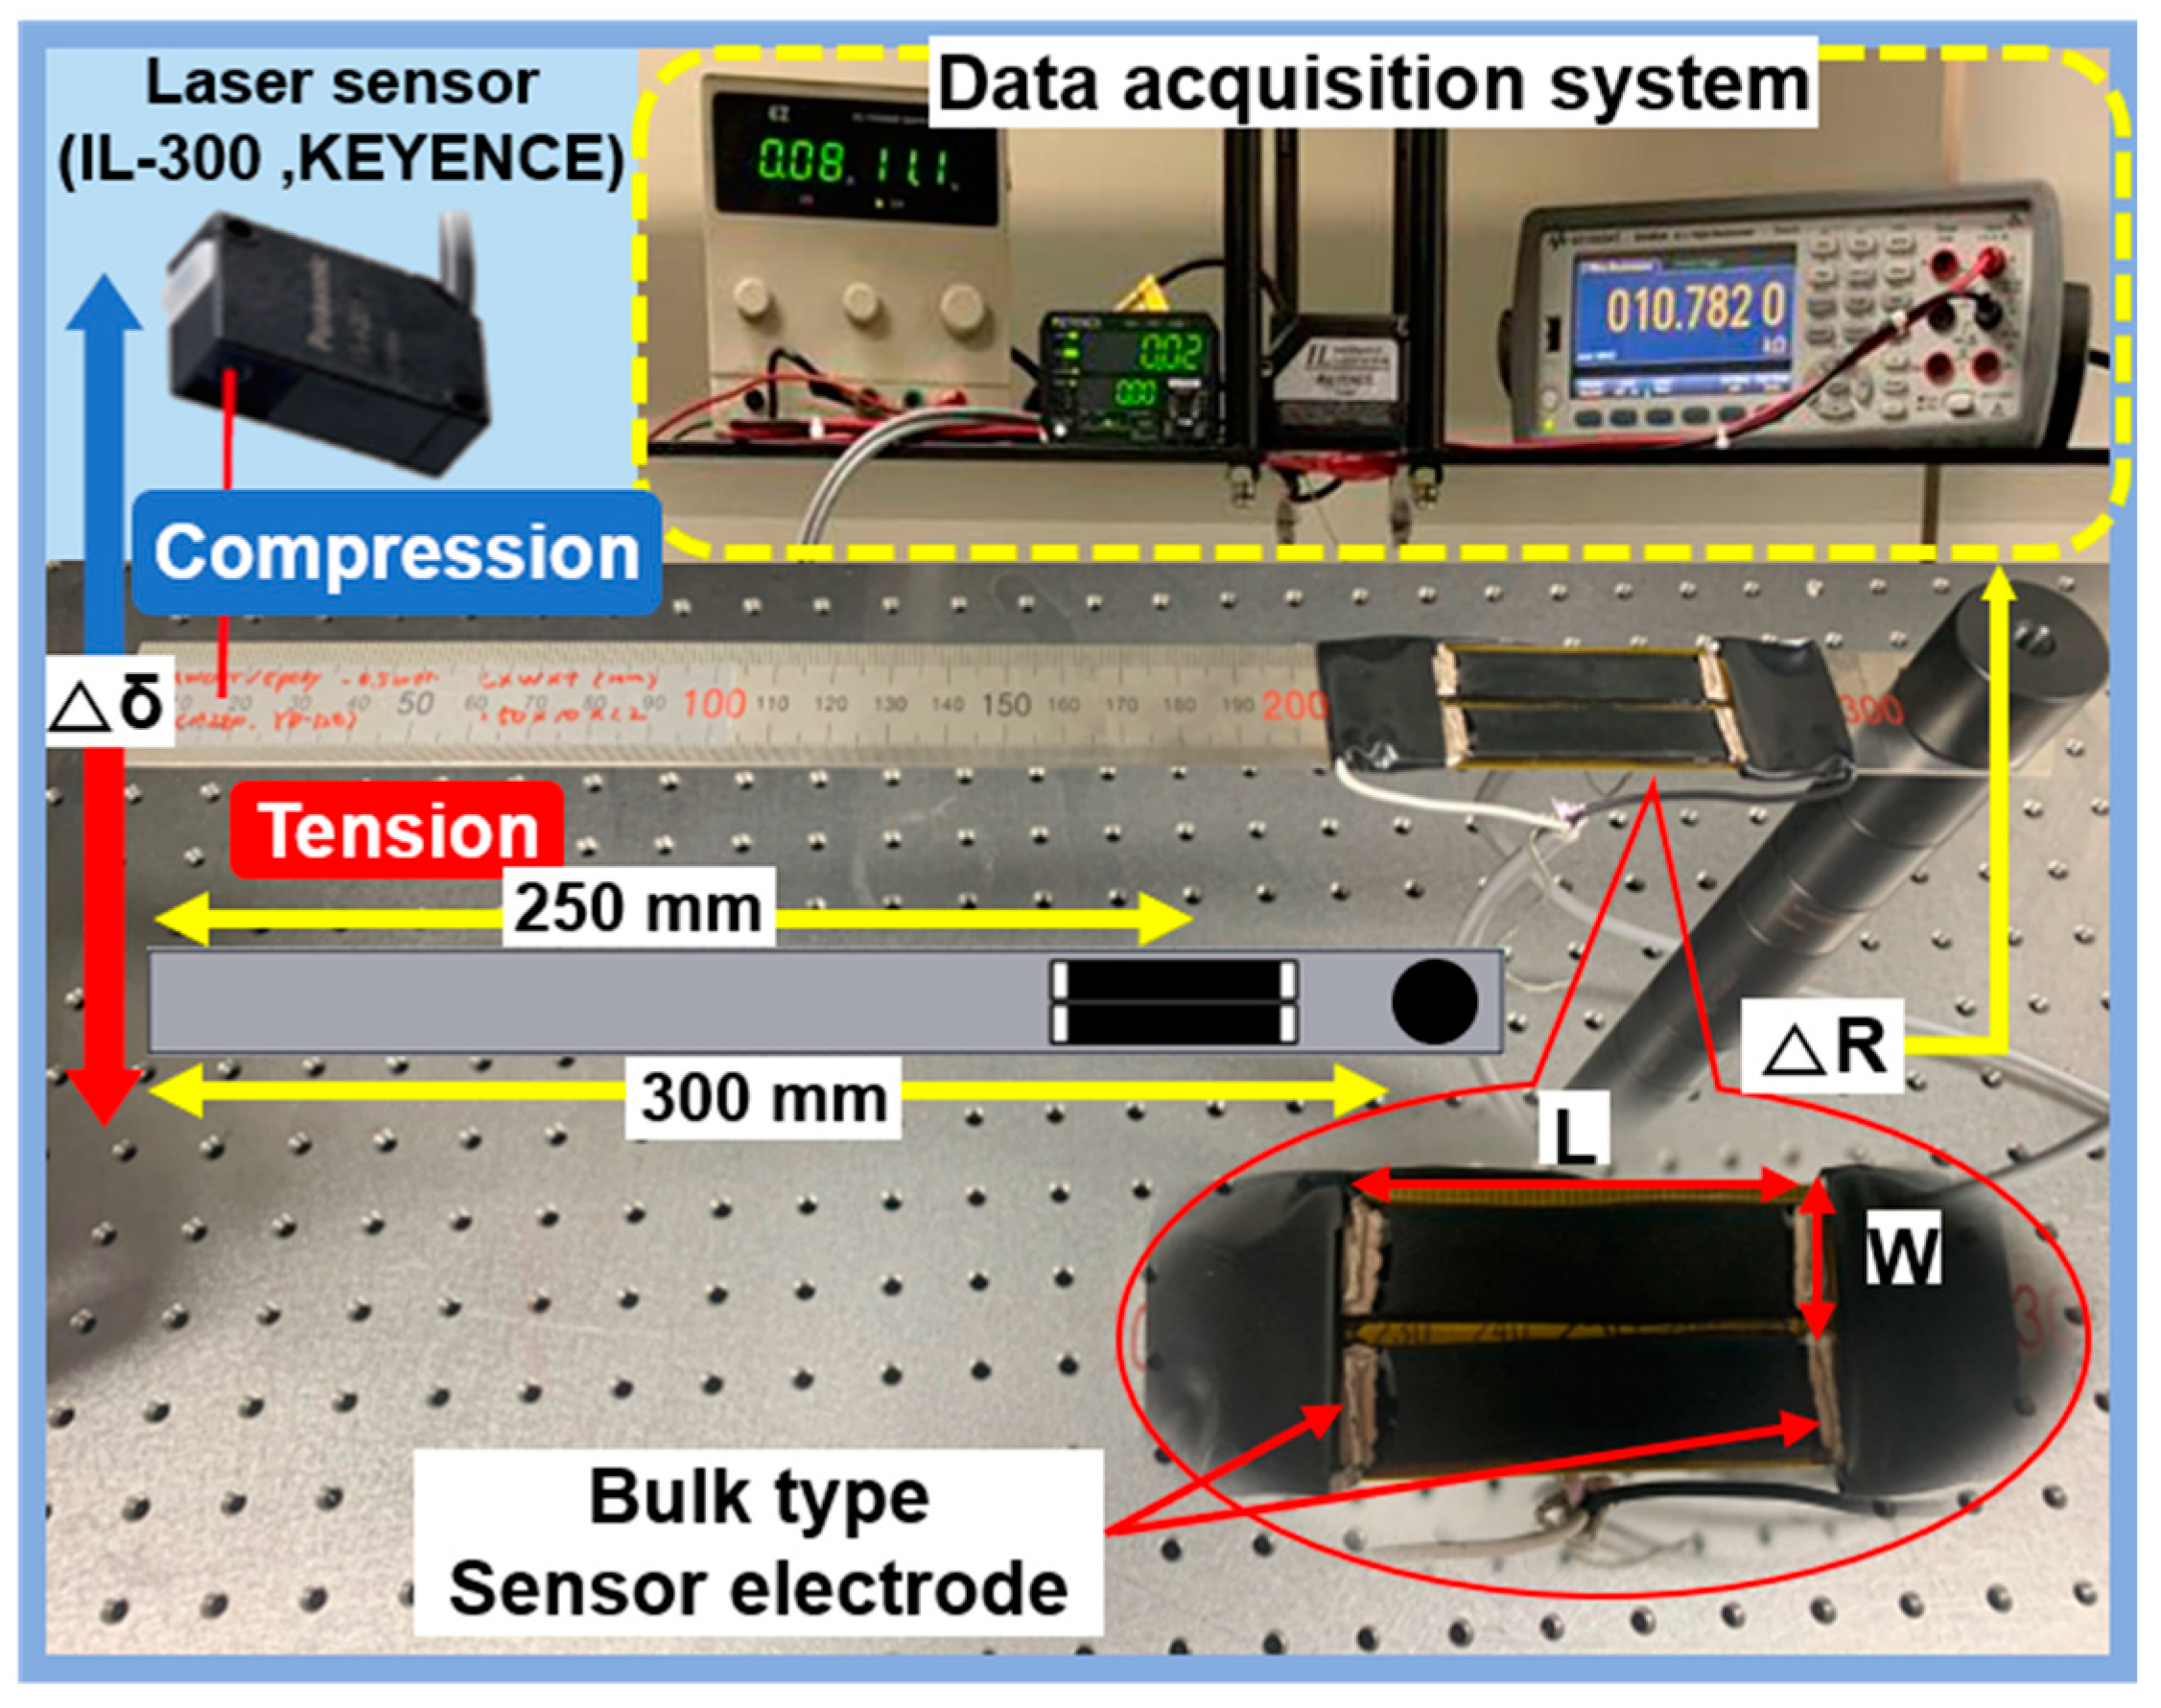
To examine the percolation threshold and sensitivity of nanocarbon composite sensors, we fabricated the samples with five weight ratios (0.125, 0.25, 0.35, 0.5, and 1 wt.%) via the process shown in Figure 1. We used MWCNTs (Hanhwa Chemical Co., Korea, CM-280) as internal electrical fillers, epoxy (Kukdo Chemical Co., Korea, YD-128) as base material, and methylene chloride (Samchun Pure Chemical Co., Korea, purity 99.8%) as a solvent. The MWCNTs have a length of 180~200 μm, a diameter of 10~15 nm, and an aspect ratio of 12,000~20,000.
To obtain the effective electrical performance of the manufactured composite material, the solution was dispersed at about 40 W for 30 min using a sonicator (Branson Co., Brookfield, CT, USA, 450). To control the mixing viscosity with the hardener (Kukdo Chemical Co., Korea, Jeffamine), the dispersed solution was evaporated in a programmable oven (Lab Companion, Daejeon, Korea, OF-01E) at 80 °C. After that, the mixture was degassed in a vacuum oven at 0 atm and 50 °C for about 10 min to remove residual bubbles. The mixture was injected into silicone molds using a syringe. Silicone molds were prepared in various casting widths (8, 10, 12 mm), thicknesses (0.6, 1.2, 2.4, 3.6 mm), and lengths (30, 40, 50 mm) to fabricate different sizes of sensors. The degassed mixture in the mold was cured at 80 °C using the programable oven. To complete the sensor samples, the casted samples were separated from the molds, and electrical wires were connected to the samples with conductive epoxy (CANS, Japan, Elcoat-P-100).

2.2. Test Setup

To investigate the electrical characteristics and sensitivity of the NCSS, the experimental apparatus shown in Figure 2 was constructed. The NCSS was tightly bonded with an adhesive epoxy on top of a thick steel cantilever (300 mm × 25 mm × 2 mm). The center of all sensor samples was located 50 mm from the fixed end of the cantilever. We installed a pair of NCSSs on the cantilever to double-check the outputs. The sensor-installed cantilever was mounted on an optical table by fixtures. We manually bent the free end of cantilever at steps of 20 mm from −140 mm to 140 mm, and the deflection was measured with a laser sensor (KEYENCE Co., Seongnam-si, Korea, IL-300). When a displacement is applied to the free end of the cantilever, strain is generated on the sensor attached to the upper part of the cantilever. The induced strain changes into sensor resistance change due to its piezoresistive characteristics. The sensor resistance was measured by a multi-meter (KEYSIGHT technologies Co., Santa Rosa, CA, USA, 34465A) with the two-probes method. The induced strain was later calculated in terms of the deflection by strain and bending relation equation.

3. Results

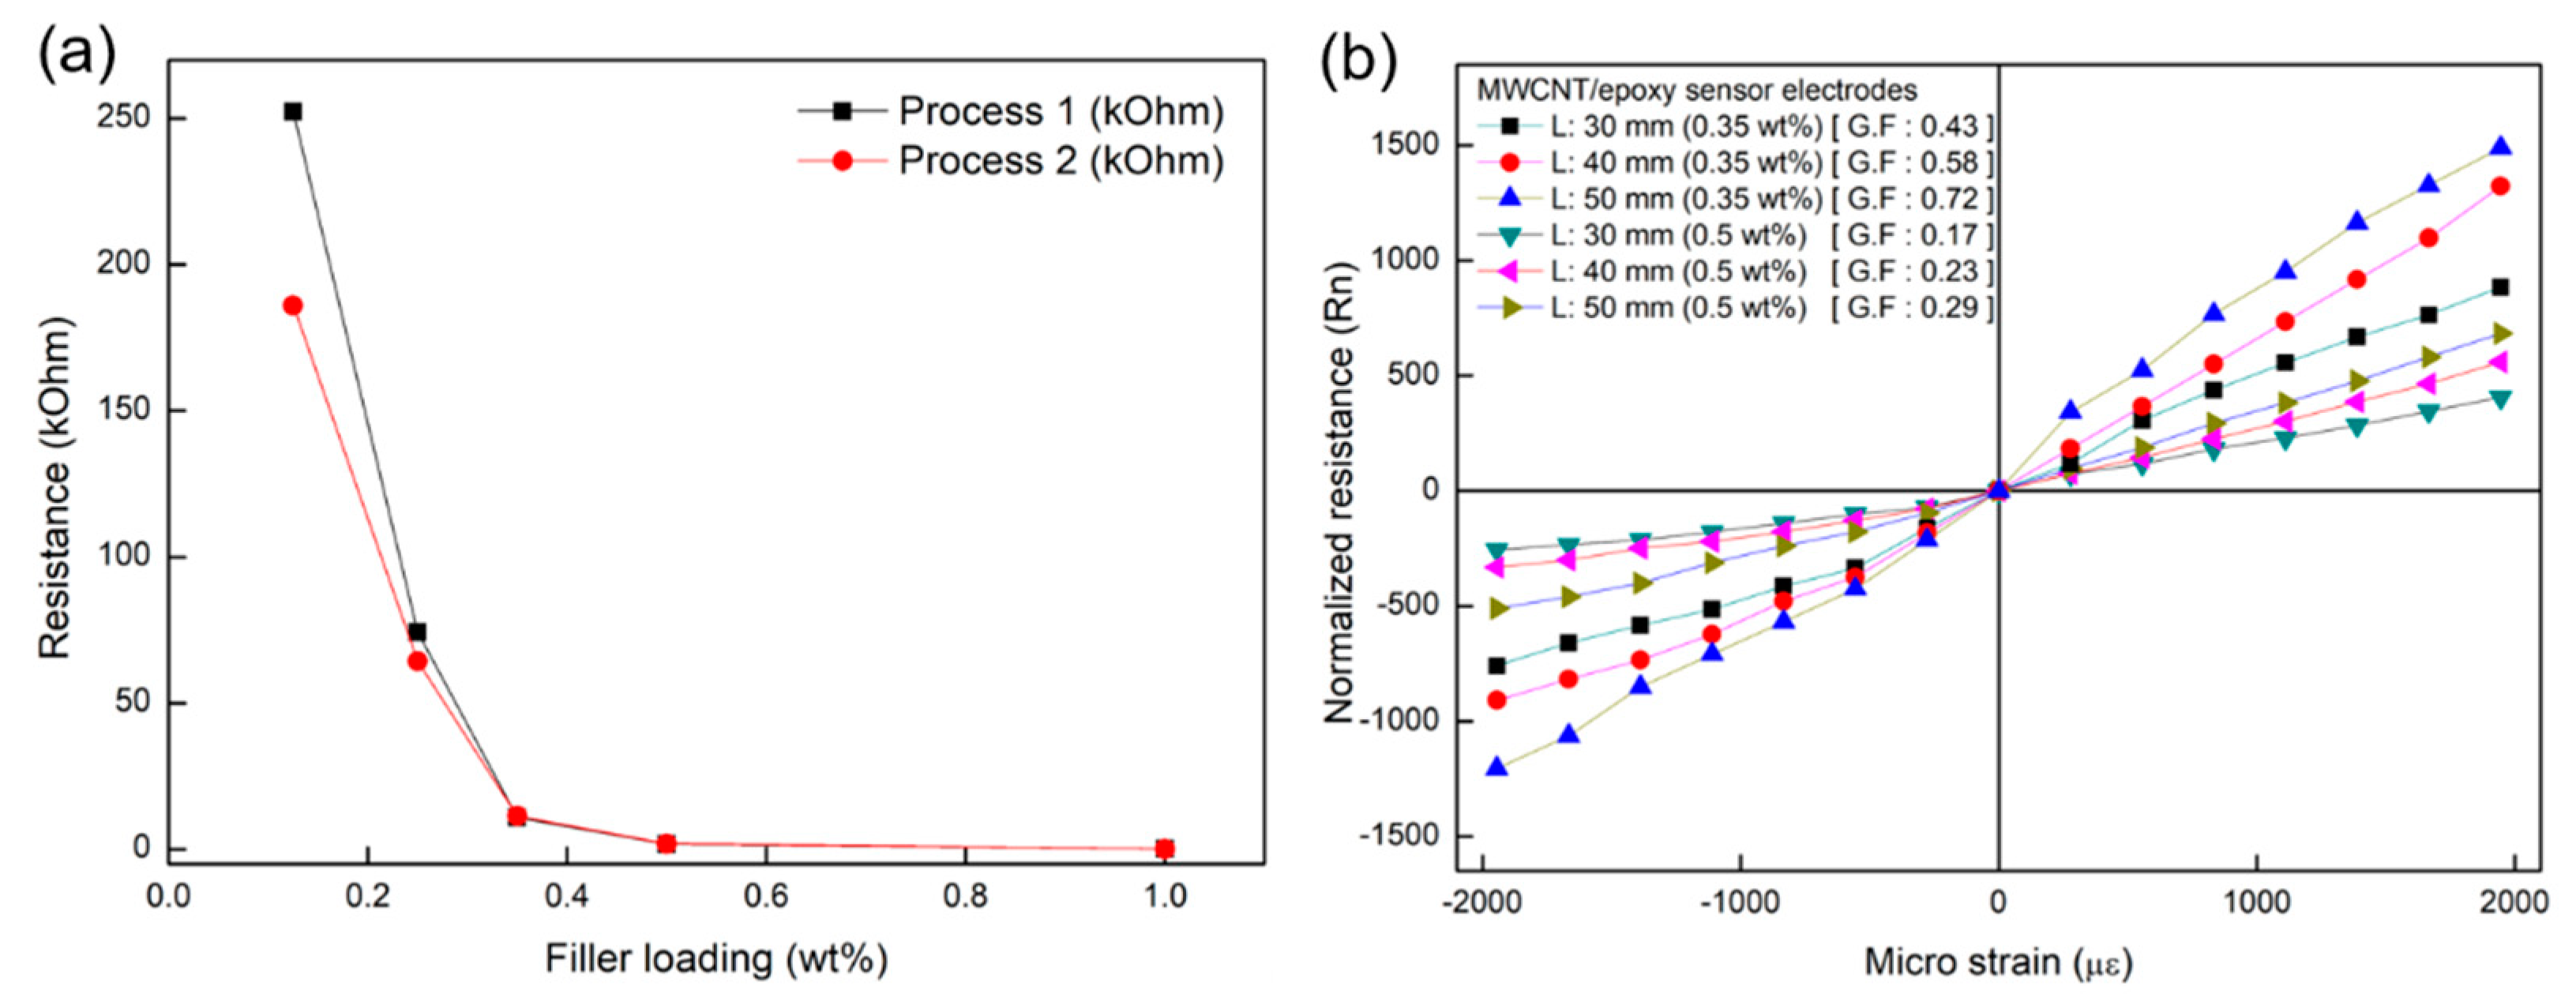
3.1. Percolation Threshold and Sensor Sensitivity Characteristics

We varied the percolation threshold to find an appropriate piezoresistivity boundary and to check the uniformity of the samples fabricated in each batch. We fabricated the samples at five different MWCNT weight fractions and measured their resistances, as shown in Figure 3a. The fabrication procedure was repeated two times to obtain reliable data. The resistances changed rapidly below 0.35 wt.%, and we decided on which piezoresistive design to use based on these results.
When the samples were fabricated using a different process with the same recipe, their electrical properties were not identical under 0.35 wt.%, as shown in Figure 3a. This may be due to the relationship between the electrical conducting path and the filler-loading fraction in composites. In the case of higher filler content, we might be able to obtain similar electrical conductivity from the samples due to their high electrical filler density, as shown for 0.5 wt.% in Table 1. However, in the case of lower filler content, the electrical conducting path may vary widely due to their lower filler-loading fraction, as shown for 0.35 wt.% in Table 1. We also fabricated sensor samples with different lengths for cases with both 0.35 and 0.5 wt.% filler to test the piezoresistivity in terms of the geometrical factors of the sensors. We prepared samples with lengths of 30, 40, and 50 mm and fixed their width (10 mm) and thickness (1.2 mm), as shown in Table 1. The resistance change ratio (normalized resistance, Rn) of the sensors were also increased according to their length, as shown in Figure 3b. This indicates that the sensor length may correlate with sensitivity, and the length should therefore be one of the factors considered in sensor design.

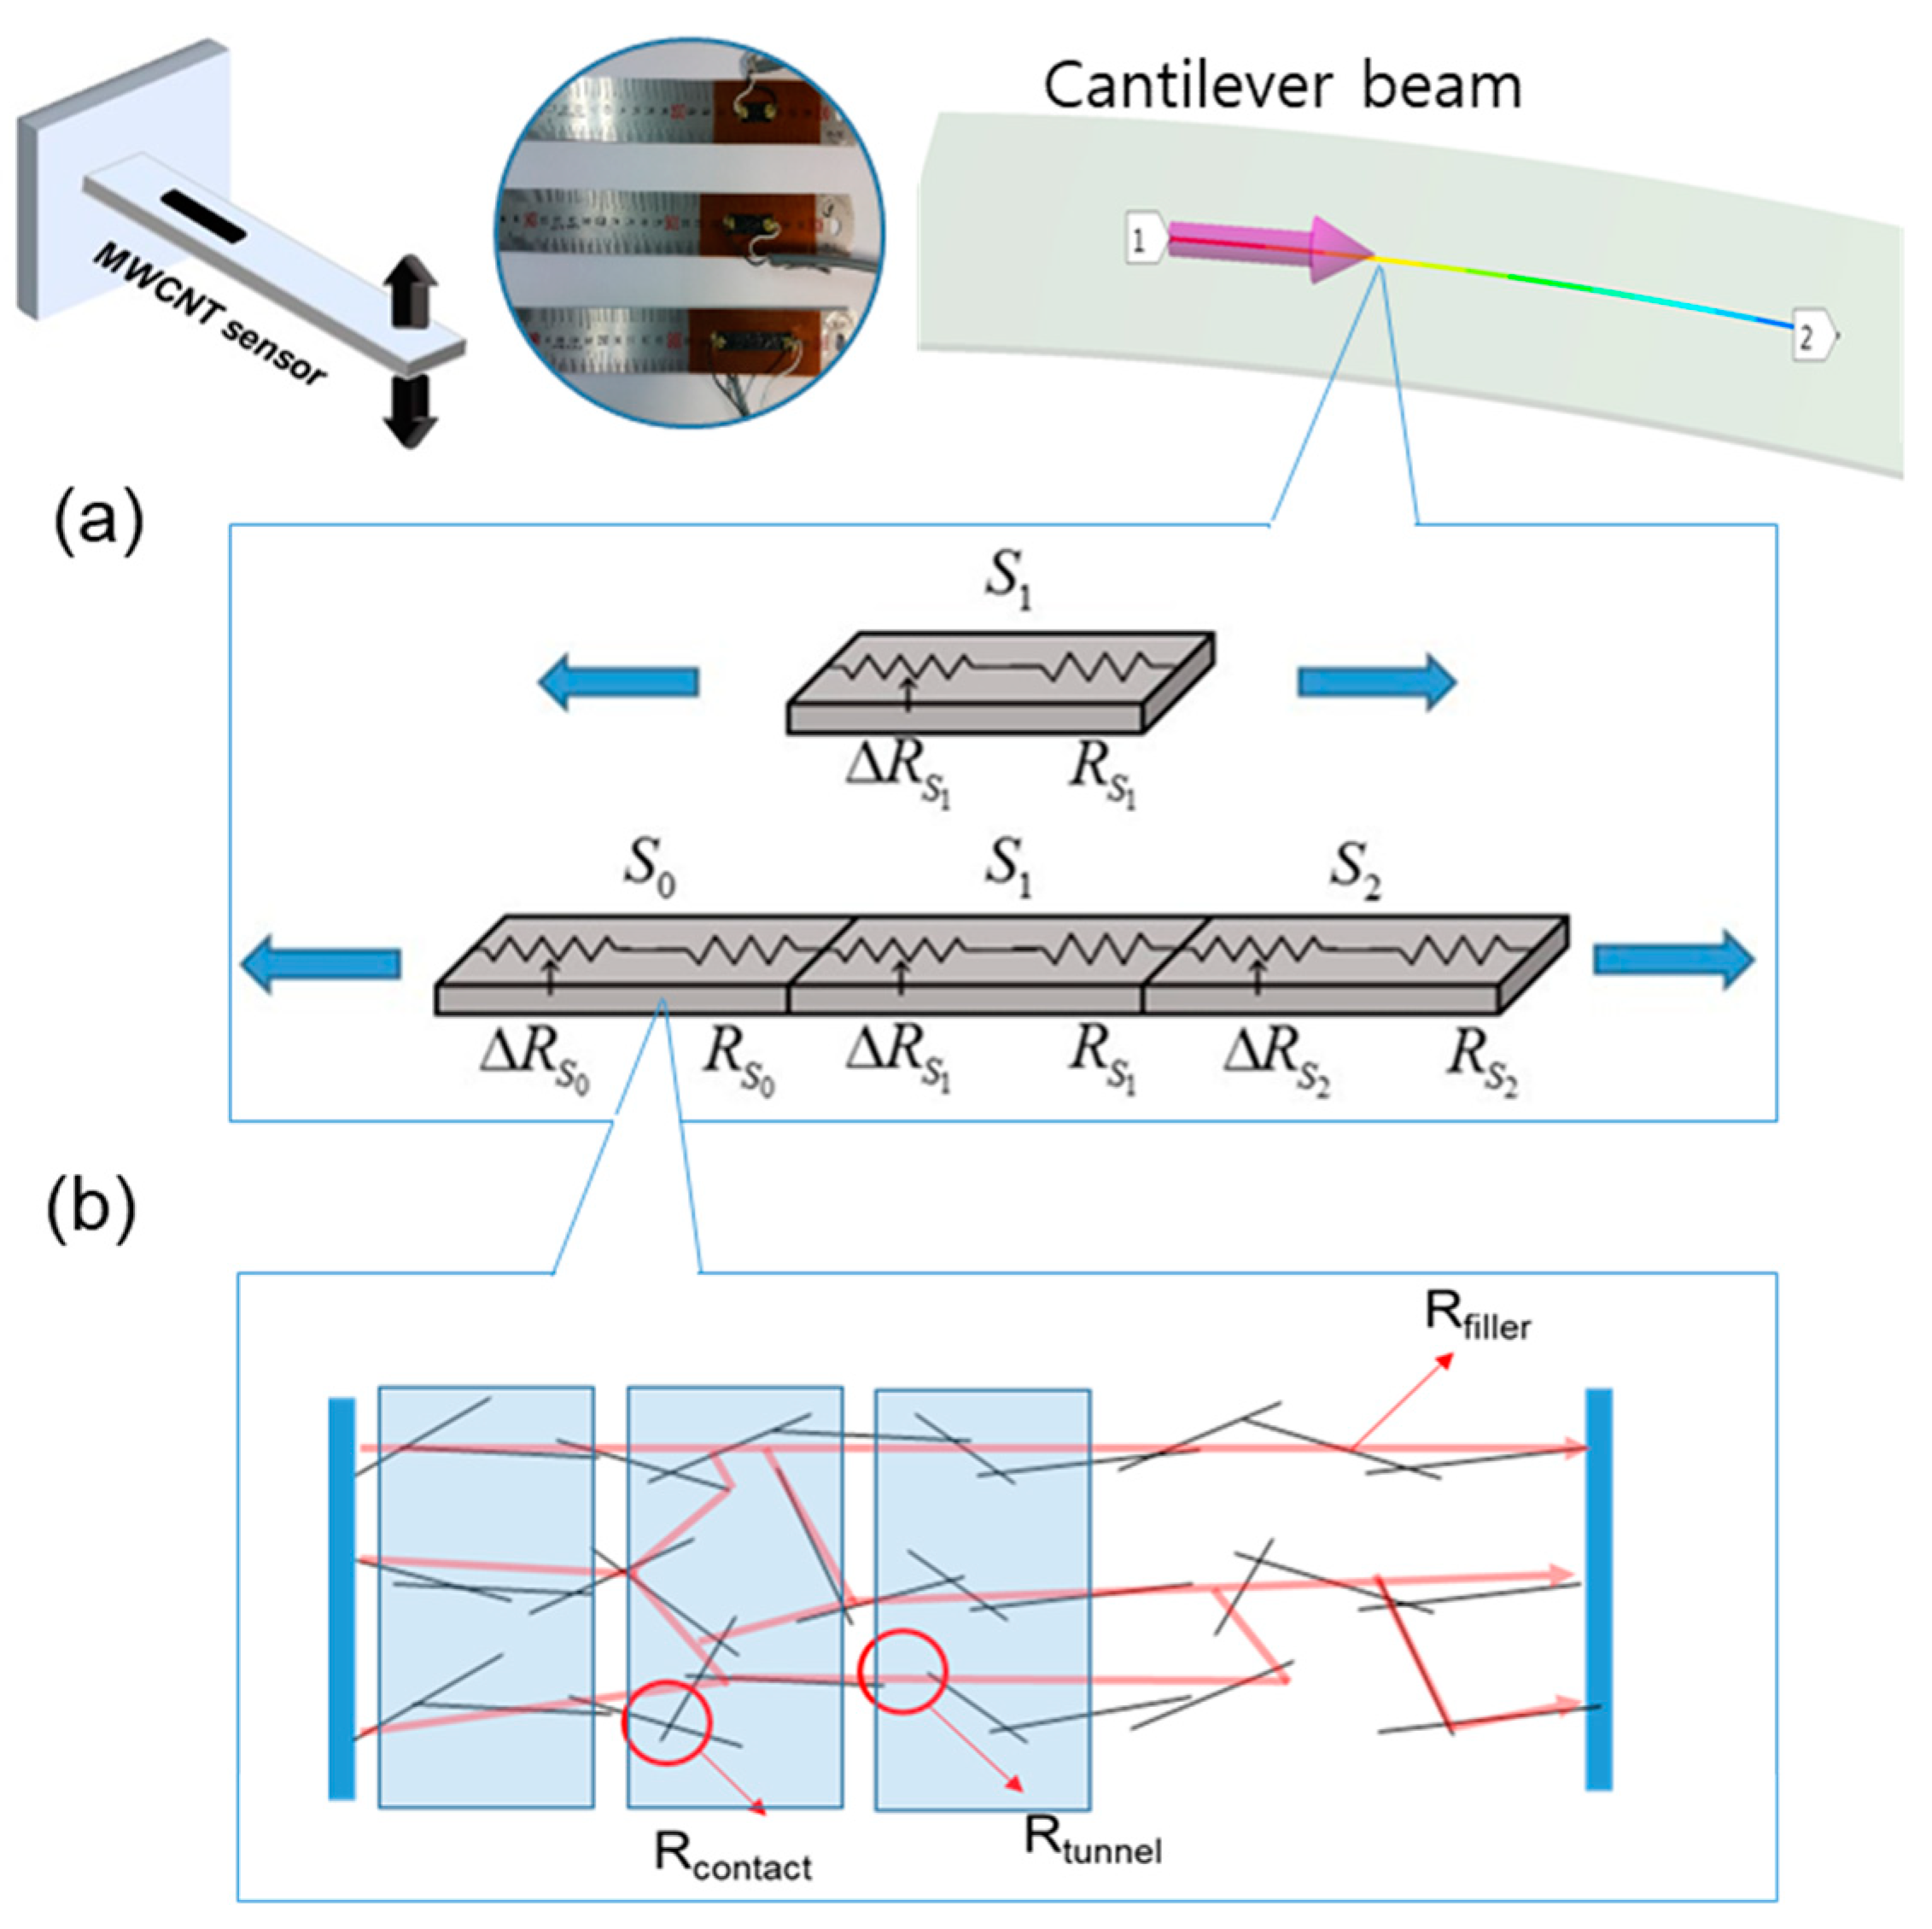
3.2. Length and Sensitivity Correlation Based on Piezoresistive Effect

To determine the correlation between sensor length and sensitivity, we proposed a unit gauge factor model of NCSS. The gauge factor (G. F.) is defined in Equation (1), and the strain (ε) of the cantilever is given in Equation (2).
G . F . = R n ε = Δ R R ε
ε = 3 c ( L a ) L 3 y ( L )
Here, c is the height from the center of the cantilever, L is the length of the cantilever, a is the distance from the fixed end of the cantilever to the center of the sensor, and y (L) is the displacement applied to the end of the cantilever. Substituting the above equation into the general gauge factor equation, we yield the following.
G . F . = Δ R R 3 c ( L a ) L 3 y ( L ) = L 3 Δ R 3 c ( L a ) y ( L ) R
Because the fillers dispersed in the matrix construct the electrical conductive paths with contact resistance, its conductivity is less than that of a metal. Therefore, we assumed that the NCSS is an electrical conductive series based on an electrical conductivity model of nanocomposites and tried to determine its piezoresistive sensitivity mechanism based on this assumption. The NCSS is considered as a chain series of piezoresistive units having the same geometric size (Figure 4a). The electrical resistance of the sensor can be expressed as a linear summation of each unit, as shown in Figure 4b.
As strains happen across all of the units of the NCSS, the gauge factor with respect to the strain can be expressed as follows.
G . F . = Δ R S 0 R S 0 ε S 0 + Δ R S 1 R S 1 ε S 1 + Δ R S 2 R S 2 ε S 2
In addition, the electrical resistance model of the nanocarbon composite, shown in Figure 4b, can be expressed as follows:
R C N T c o m p o s i t e s = R f i l l e r + R t u n n e l + R c o n t a c t
where R f i l l e r is the electrical resistance of the fillers in the composite, R t u n n e l is the resistance between the fillers inside the composite, and R c o n t a c t is the contact resistance between fillers. Substituting the above equation into the gauge factor equation, the gauge factor of the nanocarbon composite sensor can be expressed as follows.
G . F . C N T c o m p o s i t e s = R N ε = Δ R R ε = Δ R f i l l e r + Δ R t u n n e l + Δ R c o n t a c t R f i l l e r + R t u n n e l + R c o n t a c t ε
Thus, the electrical resistance change of the composite is dominated by Δ R t u n n e l [12], and the resistance due to the tunneling effect can be expressed as follows in Equation (7) [31]:
R t u n n e l = h 2 d A e 2 2 m λ e x p ( 4 π d h 2 m λ )
where h is Planck’s constant, d is the spacing between fillers, A is the cross-sectional area of the tunnel, e is the quantum of electricity, m is the mass of electrons, and λ is the height of the matrix barrier. The amount of change in the tunneling resistance is generated exponentially by the applied strain of each single unit part. Accordingly, the amount of change in the tunneling resistance with respect to the strain of the entire sensor line, that is, the sensitivity to the length of the nanocarbon composite, may be expressed as follows:
G . F . C N T c o m p o s i t e s = Δ R t u n n e l S 0 R f i l l e r S 0 + R t u n n e l S 0 + R c o n t a c t S 0 ε S 0 + Δ R t u n n e l S 1 R S 1 ε S 1 + Δ R t u n n e l S 2 R S 2 ε S 2 + = n = S 0 S S Δ R t u n n e l n R n ε n   ( ; R S 0 = R S 1 = = R S S )
From the above hypothesis, in this study, we supposed that the NCSS is a chain series of individual piezoresistive units, and the whole piezoresistive change is a linear summation of the units.

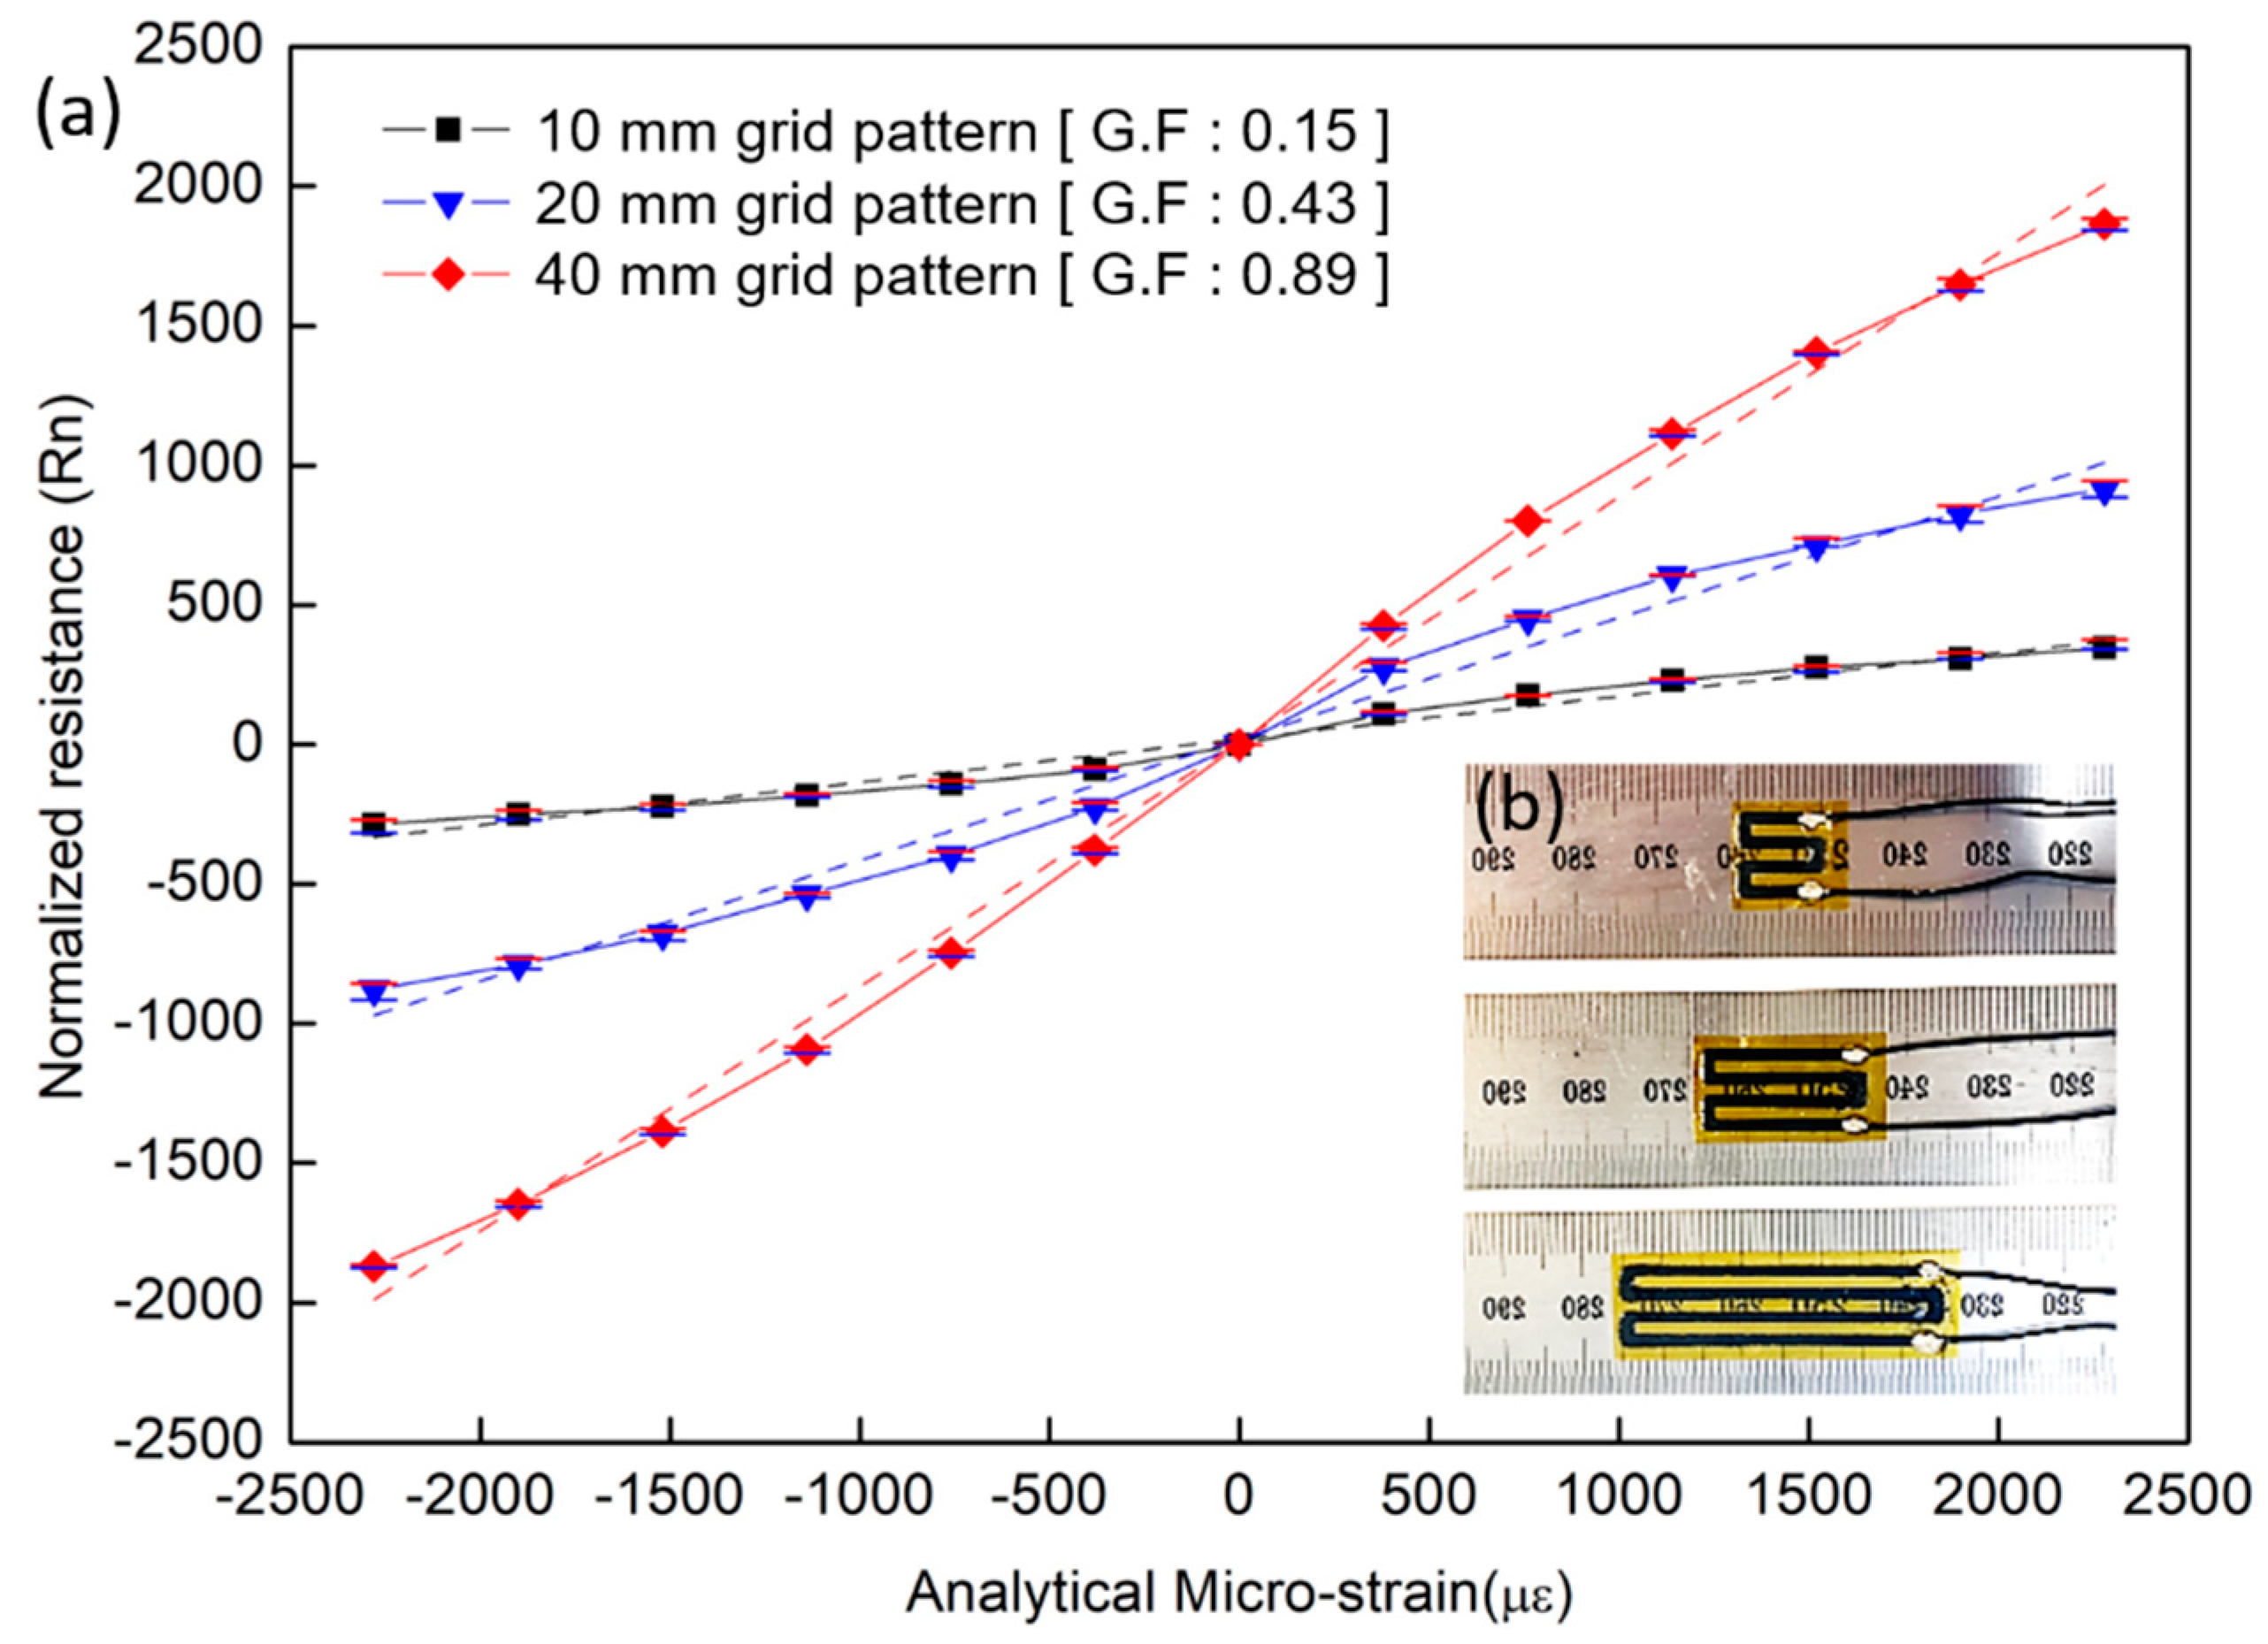
3.3. Improvement of Piezoresistive Characteristics by Using Sensor Pattern

Based on the first experiment described in Section 3.2, we hypothesized that the sensitivity of the NCSS is closely related to its length because structural deformation brings whole piezoresistive change from entire units of the sensor. We designed three grid sensors via a thin polyimide film mask. The mask pattern was designed by CAD (Computer Aided Design) program and was fabricated by laser cutting process. The CNT ink was manually printed through the mask on the cantilever, as shown in the lower right-hand corner of Figure 5. To secure sensor electrical stability with better conductivity, we conservatively used the 0.5 wt.% to fabricate the grid sensor samples.
We measured each resistance change with respect to beam bending five times and averaged the measured values after eliminating the maximum and minimum data points. Figure 5 shows the results. When comparing the amount of change in the normalized resistance with respect to the strain of the sensor samples shown in Figure 3 and Figure 5, it can be seen that the 40-mm pattern type (G.F.: 0.87) has a larger change in the normalized resistance for the same strain than the 40-mm bulk type (G.F.: 0.22).
As we expected from the above, the NCSS sensitivity improvement is exactly proportional to its incremental length ratio. We obtained higher sensitivity in cases where the sensor had a longer length or denser pattern per unit area. We also achieved more linear, higher sensitivity and consistent data from the grid-type NCSS than from the bulk-type sensor. Additionally, we deduced that NCSS strain output may be expressed by the summation of the entire sensor covered surface. According to our literature survey, the strain sensitivity of a conventional foil strain gauge is only related to its material properties and is not much affected by its length [32], which is a notable piezoresistive feature of the NCSS. We conclude that since NCSSs are affected by the overall strain change in a given direction, the geometric pattern design is one of the most important variables in axial load and deformation measurements.

4. Conclusions

In this study, the piezoresistive characteristics of NCSSs were experimentally studied in terms of the sensor’s geometric length to determine its sensitivity to the design. We fabricated bulk- and grid-type sensors with different filler contents (wt.%) and different sensor lengths.
In the first experiment, we used silicone molds to prepare samples with three different lengths (30, 40, 50 mm) and two different filler compositions (0.35 and 0.5 wt.%). We measured the sensor resistance change with respect to the bending strain variation of a cantilever. For both compositions, we obtained higher sensitivity at longer sensor lengths, which suggested the possibility of using the geometric design to control the sensitivity.
We deduced that sensor length may correlate with sensitivity, and we proposed a unit gauge factor model of NCSSs to explain the proportional relationship between their length and sensitivity. We supposed that the NCSS is a chain series of individual piezoresistive units and that the whole piezoresistive change can be a linear summation of these units. To verify our hypothesis, we performed a second experiment with more sophisticated samples. We designed grid-type sensors by using thin polyimide film masks. We printed the grid-type NCSS (0.5 wt.% filler) on a cantilever and repeated the same test. Results indicated that the improvement in NCSS sensitivity was exactly proportional to its incremental length ratio (because structural deformation brings piezoresistive change from whole units of the sensor). We were able to obtain higher sensitivity in the cases where the sensor had a longer length and denser pattern per unit area. We also achieved more linear and consistent data from the grid-type NCSS than from the bulk-type sensor.
From the analysis, we concluded that the greater sensor length brings a greater change in resistance due to its piezoresistive unit summation. Eventually, the sensitivity of NCSSs directly relates to their length, and the patternized length can be used to easily control the sensor sensitivity. We also found that the fine sensor pattern can improve its performance, allowing better results to be achieved. Sensor geometric pattern design is one of the most important aspects of axial load and deformation measurements. For further study, we are studying advanced sensitivity design considering the three-dimensional pattern variables of the NCSS as well.

Author Contributions

Conceptualization: S.-Y.K., B.-G.C., and I.K.; methodology: S.-Y.K., B.-G.C., C.-J.K., Y.-S.J., J.-S.J., J.-H.S., and I.K.; formal analysis: S.-Y.K. and B.-G.C.; investigation: S.-Y.K. and B.-G.C.; data curation: S.-Y.K., B.-G.C., and G.-W.O.; writing—original draft preparation: S.-Y.K. and B.-G.C.; writing—review and editing: C.-J.K., Y.-S.J., J.-S.J., K.-Y.J., and J.-H.S.; visualization: S.-Y.K., B.-G.C., and G.-W.O.; project administration: I.K.; funding acquisition: I.K. All authors have read and agreed to the published version of the manuscript.

Funding

This work was supported by a Research Grant of Pukyong National University (2019).

Institutional Review Board Statement

Not applicable.

Informed Consent Statement

Not applicable.

Data Availability Statement

Data available in a publicly accessible repository.

Conflicts of Interest

The authors declare no conflict of interest.

References

  1. Salvado, R.; Lopes, C.; Araujo, P.; Gorski, M.; Velez, F.J.; Gomez, J.C.; Krzywon, R. Carbon fiber epoxy composites for both strengthening and health monitoring of structures. Sensors 2015, 15, 10753–10770. [Google Scholar] [CrossRef] [Green Version]
  2. Arash, B.; Park, H.S.; Rabczuk, T. Mechanical properties of carbon nanotube reinforced polymer nanocomposites: A coarse-grained model. Compos. B. Eng. 2015, 80, 92–100. [Google Scholar] [CrossRef] [Green Version]
  3. Cho, B.G.; Hwang, S.H.; Park, Y.B. Fabrication and characterization of carbon nanotube/carbon fiber/polycarbonate multiscale hybrid composites. Compos. Res. 2016, 29, 269–275. [Google Scholar] [CrossRef] [Green Version]
  4. Kang, I.; Schulz, M.J.; Kim, J.H.; Shanov, V.; Shi, D. A carbon nanotube strain sensor for structural health monitoring. Smart Mater. Struct. 2006, 15, 737–748. [Google Scholar] [CrossRef]
  5. Loyola, B.R.; Saponara, V.L.; Loh, K.J. In situ strain monitoring of fiber-reinforced polymers using embedded piezoresistive nanocomposites. J. Mater. Sci. 2010, 45, 6786–6798. [Google Scholar] [CrossRef] [Green Version]
  6. Hu, N.; Itoi, T.; Akagi, T.; Kojima, T.; Xue, J.; Yan, C.; Atobe, S.; Fukunaga, H.; Yuan, W.; Ning, H.; et al. Alamusi Ultrasensitive strain sensors made from metal-coated carbon nanofiller/epoxy composites. Carbon 2013, 51, 202–212. [Google Scholar] [CrossRef] [Green Version]
  7. Dinh, N.T.; Kanoun, O. Temperature-compensated force/pressure sensor based on multi-walled carbon nanotube epoxy composites. Carbon 2015, 15, 11133–11150. [Google Scholar] [CrossRef] [Green Version]
  8. Ferreira, A.; Mendez, S.L. Piezoresistive response of spray-printed carbon nanotube/poly(vinylidene fluoride) composites. Compos. B. Eng. 2016, 96, 242–247. [Google Scholar] [CrossRef]
  9. Kim, S.Y.; Kang, I. A study on the development of a novel pressure sensor based on nano carbon piezoresistive composite by using 3D printing. Trans. Korean Soc. Mech. Eng. A 2017, 41, 187–192. [Google Scholar]
  10. Kim, S.Y.; Park, S.H.; Choi, B.G.; Kang, I.; Park, S.W.; Shin, J.W.; Kim, J.H.; Baek, W.K.; Lim, K.T.; Kim, Y.; et al. Development of a spoke type torque sensor using painting carbon nanotube strain sensors. J. Nanosci. Nanotechnol. 2018, 18, 1782–1786. [Google Scholar] [CrossRef]
  11. Le, T.H.; Lee, D.H.; Kim, J.H.; Park, S.J. Polypyrrole/graphene quantum dot composites as a sensor media for epinephrine. J. Nanosci. Nanotechnol. 2020, 20, 4005–4010. [Google Scholar] [CrossRef] [PubMed]
  12. Choi, G.; Lee, J.W.; Cha, J.Y.; Kim, Y.; Choi, Y.; Schulz, M.J.; Moon, C.K.; Lim, K.T.; Kim, S.Y.; Kang, I. A Spray-On Carbon Nanotube Artificial Neuron Strain Sensor for Composite Structural Health Monitoring. Sensors 2016, 16, 1171. [Google Scholar] [CrossRef] [Green Version]
  13. Kim, S.Y.; Choi, B.G.; Baek, W.K.; Park, S.H.; Park, S.W.; Shin, J.W.; Kang, I. Impact paint sensor based on polymer/multi-dimension carbon nano isotopes composites. Smart Mater. Struct. 2019, 28, 035025. [Google Scholar] [CrossRef]
  14. Hu, N.; Karube, Y.; Yan, C.; Masuda, Z.; Fukunaga, H. Tunneling effect in a polymer/carbon nanotube nanocomposite strain sensor. Acta Mater. 2008, 56, 2929–2936. [Google Scholar] [CrossRef] [Green Version]
  15. Ram, R.; Rahaman, M.; Khastgir, D. Electrical properties of polyvinylidene fluoride (PVDF)/multi-walled carbon nanotube (MWCNT) semi-transparent composites: Modelling of DC conductivity. Compos. Part A Appl. Sci. Manuf. 2015, 69, 30–39. [Google Scholar] [CrossRef]
  16. Bonavolonta, C.; Camerlingo, C.; Carotenuto, G.; Nicola, S.; Longo, A.; Meola, C.; Boccardi, S.; Palomba, M.; Pepe, G.P.; Valentino, M. Characterization of piezoresistive properties of graphene-supported polymer coating for strain sensor application. Sens. Actuator A Phys. 2016, 252, 26–34. [Google Scholar] [CrossRef]
  17. Liu, R.; Xu, Z.; Yin, J.; Huang, J.; Liu, D.; Xie, G. A coupled mechanical and electrical model concerning piezoresistve effect of CFRP materials. Compos. B. Eng. 2016, 96, 125–135. [Google Scholar] [CrossRef]
  18. Hu, N.; Karube, Y.; Arai, M.; Watanabe, T.; Yan, C.; Li, Y.; Liu, Y.; Fukunaga, H. Investigation on sensitivity of a polymer/carbon nanotube composite strain sensor. Carbon 2010, 48, 680–687. [Google Scholar] [CrossRef]
  19. Rahman, R.; Soltanian, S.; Servati, P. Coupled effects of film thickness and filler length on conductivity and strain sensitivity of carbon nanotube/polymer composite thin film. IEEE Sens. J. 2016, 16, 77–87. [Google Scholar] [CrossRef]
  20. Micaela, C.; Massimo, R.; Imran, S.M.; Alberto, T. Conductivity in carbon nanotube polymer composites: A comparison between model and experiment. Compos. Part A Appl. Sci. Manuf. 2016, 87, 237–242. [Google Scholar]
  21. Lee, B.M.; Loh, K.J. Carbon nanotube thin film strain sensors: Comparison between experimental tests and numerical simulations. Nanotechnology 2017, 28, 155502. [Google Scholar] [CrossRef] [PubMed] [Green Version]
  22. Lee, D.; Hong, H.P.; Lee, C.J.; Park, C.W.; Min, N.K. Microfabrication and characterization of spray-coated single-wall carbon nanotube film strain gauges. Nanotechnology 2011, 22, 455301. [Google Scholar] [CrossRef]
  23. Huang, Y.; Huang, S.; Hsu, C.; Chao, R.; Vu, T.K. Design and fabrication of single-walled carbon nanonet flexible strain sensors. Sensors 2012, 12, 3269–3280. [Google Scholar] [CrossRef] [PubMed] [Green Version]
  24. Wang, X.; Sparkman, J.; Gou, J. Strain sensing of printed carbon nanotube sensors on polyurethane substrate with spray deposition modeling. Compos. Commun. 2017, 3, 1–6. [Google Scholar] [CrossRef]
  25. Kong, J.H.; Jang, N.S.; Kim, S.H.; Kim, J.M. Simple and rapid micropatterning of conductive carbon composites and its application to elastic strain sensors. Carbon 2014, 77, 199–207. [Google Scholar] [CrossRef]
  26. Li, X.; Levy, C.; Elaadil, L. Multiwalled carbon nanotube film for strain sensing. Nanotechnology 2008, 19, 045501. [Google Scholar] [CrossRef] [PubMed]
  27. Xu, W.; Allen, M.G. Deformable strain sensors based on patterned MWCNTs/polydimethylsiloxane composites. J. Polym. Sci. B. Polym. Phys. 2013, 51, 1505–1512. [Google Scholar] [CrossRef]
  28. Chun, K.Y.; Oh, Y.; Rho, J.; Ahn, J.H.; Kim, Y.J.; Choi, H.R.; Baik, S. Highly conductive, printable and stretchable composite films of carbon nanotubes and silver. Nat. Nanotechnol. 2010, 5, 853–857. [Google Scholar] [CrossRef]
  29. Wei, Y.; Chen, S.; Dong, X.; Lin, Y.; Liu, L. Flexible piezoresistive sensor based on “dynamic bridging effect” of silver nanowired toward graphene. Carbon 2017, 113, 395–403. [Google Scholar] [CrossRef]
  30. Pei, Z.; Liu, Y.; Zhang, Q.; Zhao, D.; Wang, J.; Yuan, Z.; Zhang, W.; Sang, S. Highly sensitive, stretchable strain sensor based on Ag@COOH- functionalized CNTs for stroke and pronunciation recognition. Adv. Electron. Mater. 2019, 5, 1900227. [Google Scholar] [CrossRef]
  31. Esmaeli, A.; Sbarufatti, C.; Casati, R.; Jiménez-Suárez, A.; Ureña, A.; Hamouda, A.M.S. Effective addition of nanoclay in enhancement of mechanical and electromechanical properties of SWCNT reinforced epoxy: Strain sensing and crack-induced piezoresistivity. Theor. Appl. Fract. Mech. 2020, 110, 102831. [Google Scholar] [CrossRef]
  32. Hoffmann, K. An Introduction to Stress Analysis and Transducer Design using Strain Gauges. HBM 2012, 34–41. [Google Scholar]
Figure 1. Schematic diagram of the nanocarbon composite fabrication process. MWCNT: multi-walled carbon nanotube.
Applsci 11 05760 g001
Figure 2. Experimental setup for the electrical and sensitivity characteristics of the nanocarbon composite strain sensor (NCSS).
Applsci 11 05760 g002
Figure 3. (a) Percolation threshold of the samples and (b) sensitivity characteristics (according to wt.%) of the NCSS electrodes.
Applsci 11 05760 g003
Figure 4. Unit gauge factor model of NCSS: (a) Single piezoresistive unit (top) and chain series of the units with linear summation (bottom) under uniaxial load; and (b) an electrical conductivity schematic concept model of nanocomposite.
Applsci 11 05760 g004
Figure 5. Grid-type NCSS experiment: (a) grid-type NCSS samples and (b) sensitivity characteristic of the grid-type NCSS with respect to length pattern change.
Applsci 11 05760 g005
Table 1. The resistance of the sensor according to the length and wt.% at no load.
Sensor 0.35 wt.%0.5 wt.%
T = 1.2, W = 10 (mm)L = 30L = 40L = 50L= 30L = 40L = 50
Sample 1 (kΩ)9.4711.3714.331.531.872.33
Sample 2 (kΩ)8.6310.8914.101.441.872.50
Publisher’s Note: MDPI stays neutral with regard to jurisdictional claims in published maps and institutional affiliations.

