
Computer-Assisted Detection of Cemento-Enamel Junction in Intraoral Ultrasonographs


 , and
, and
Abstract
:Featured Application
Abstract
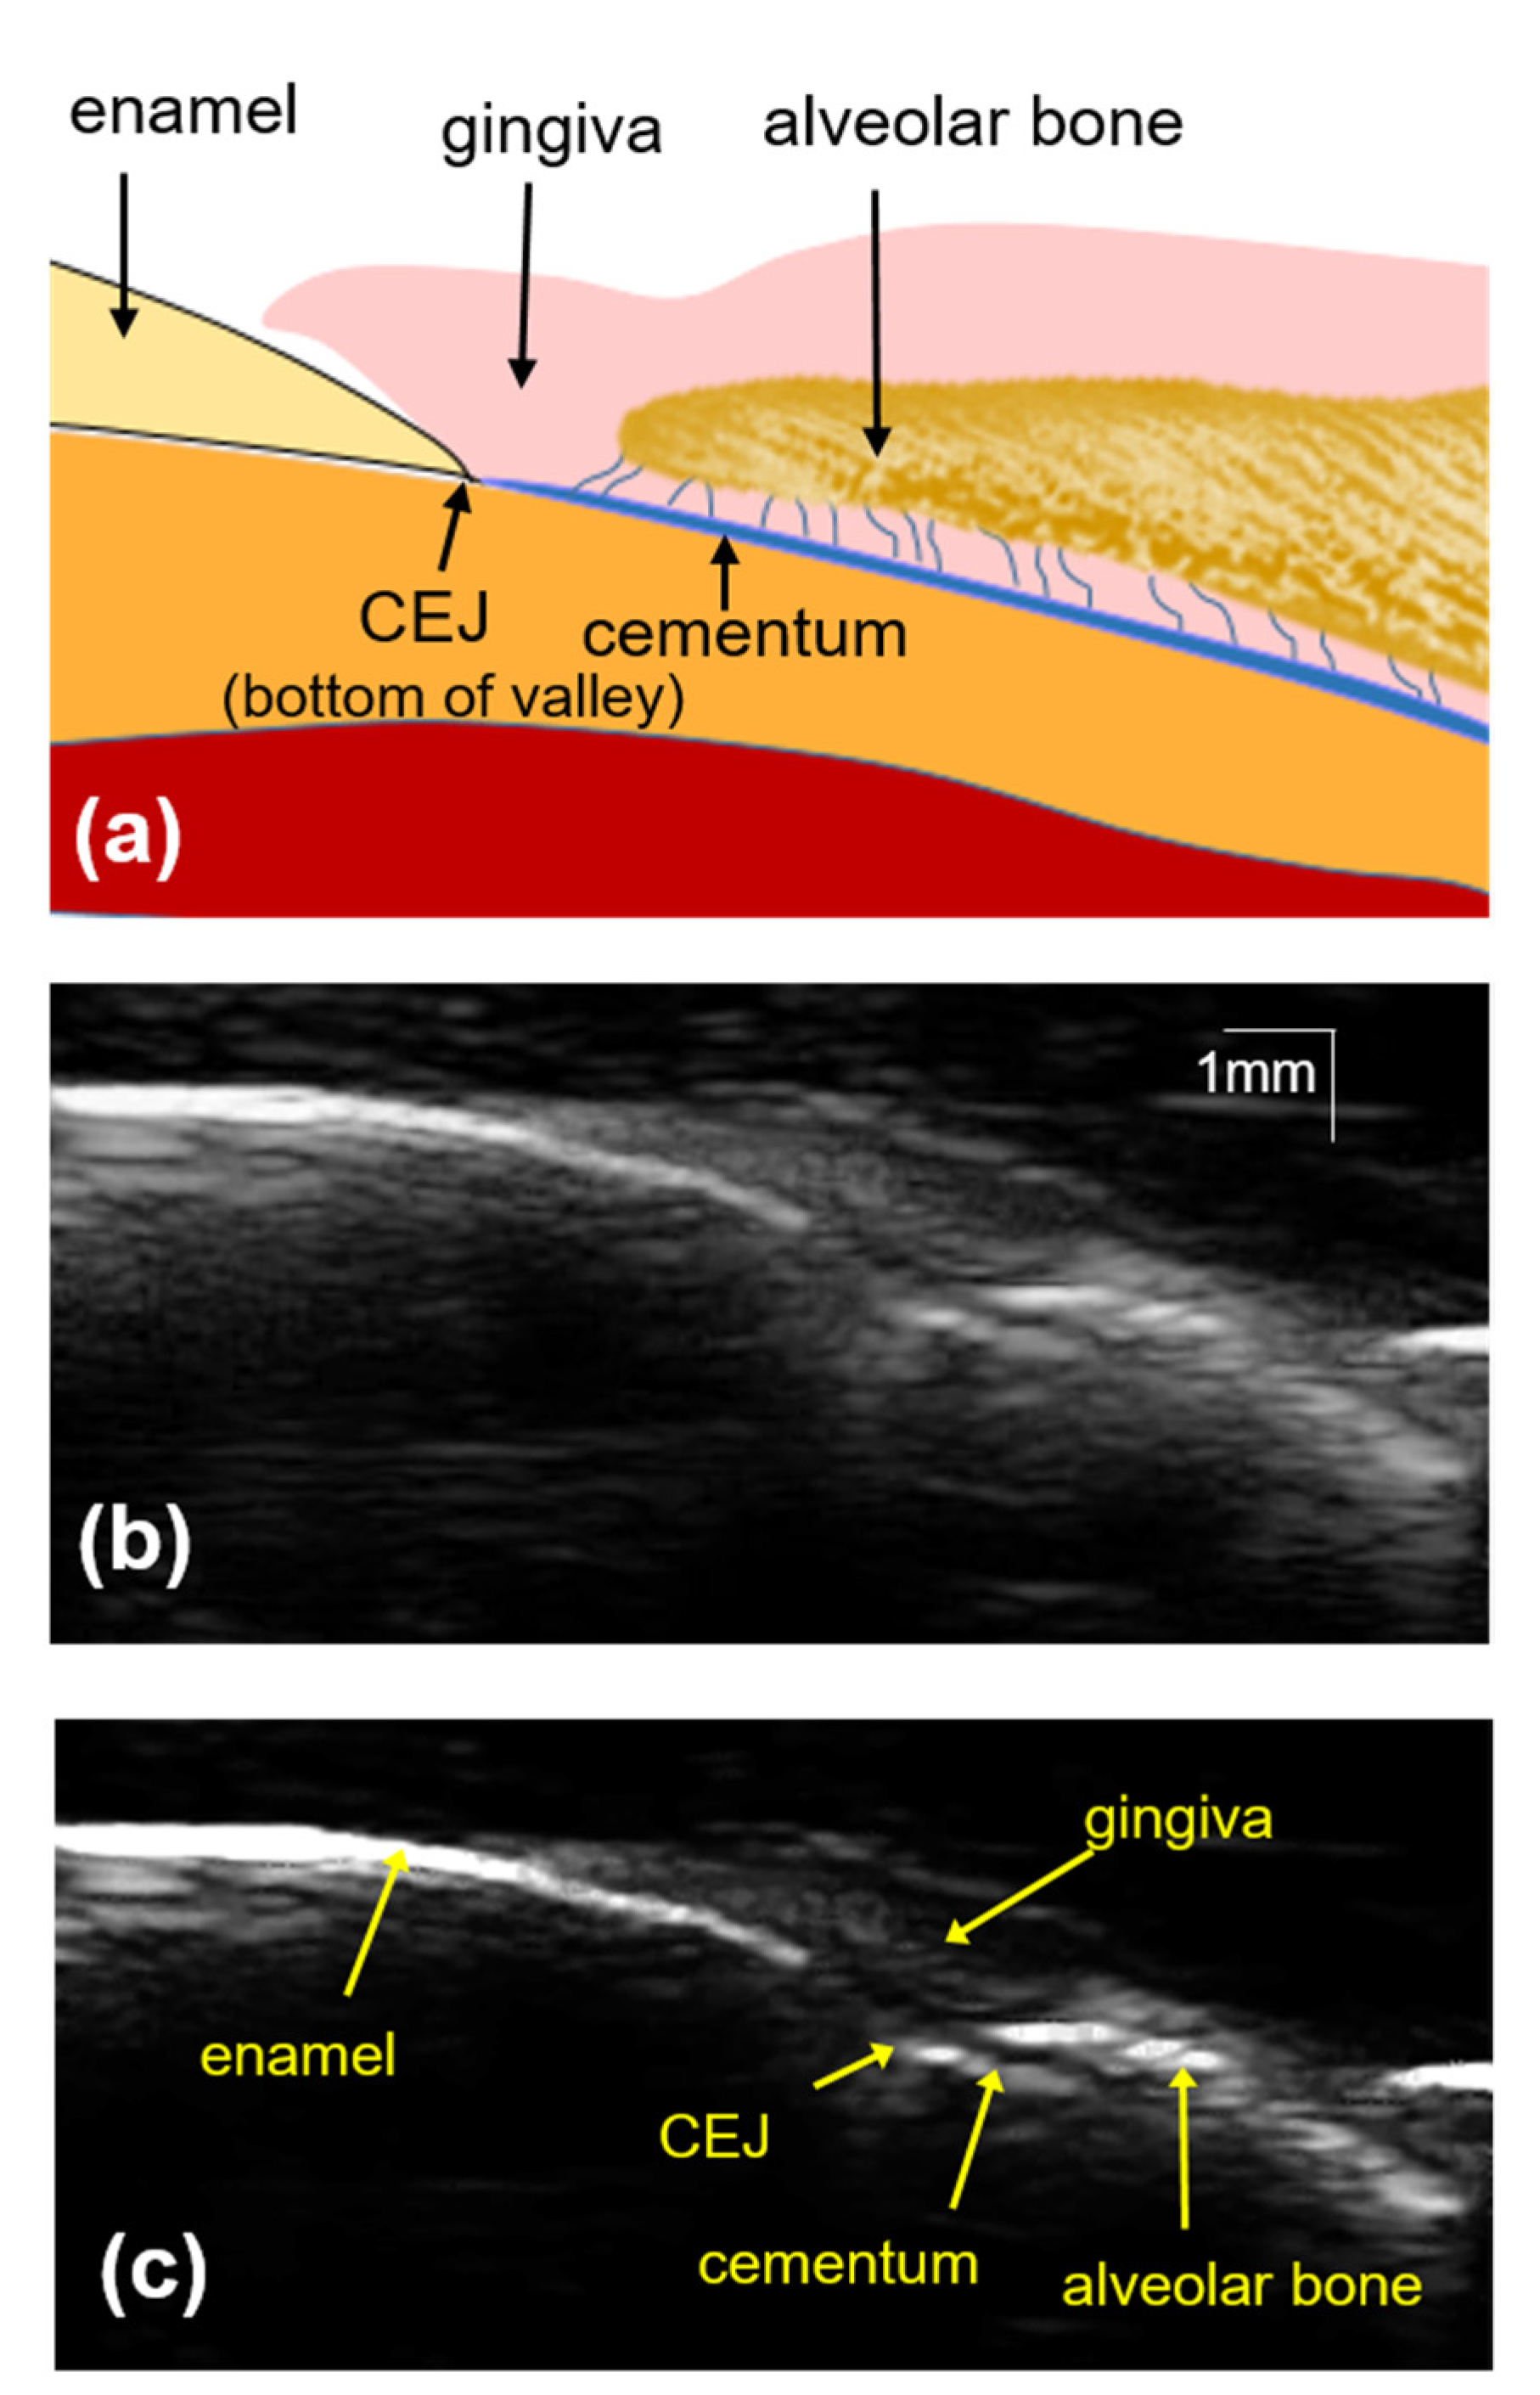
1. Introduction
2. Materials and Methods
2.1. Data Collection
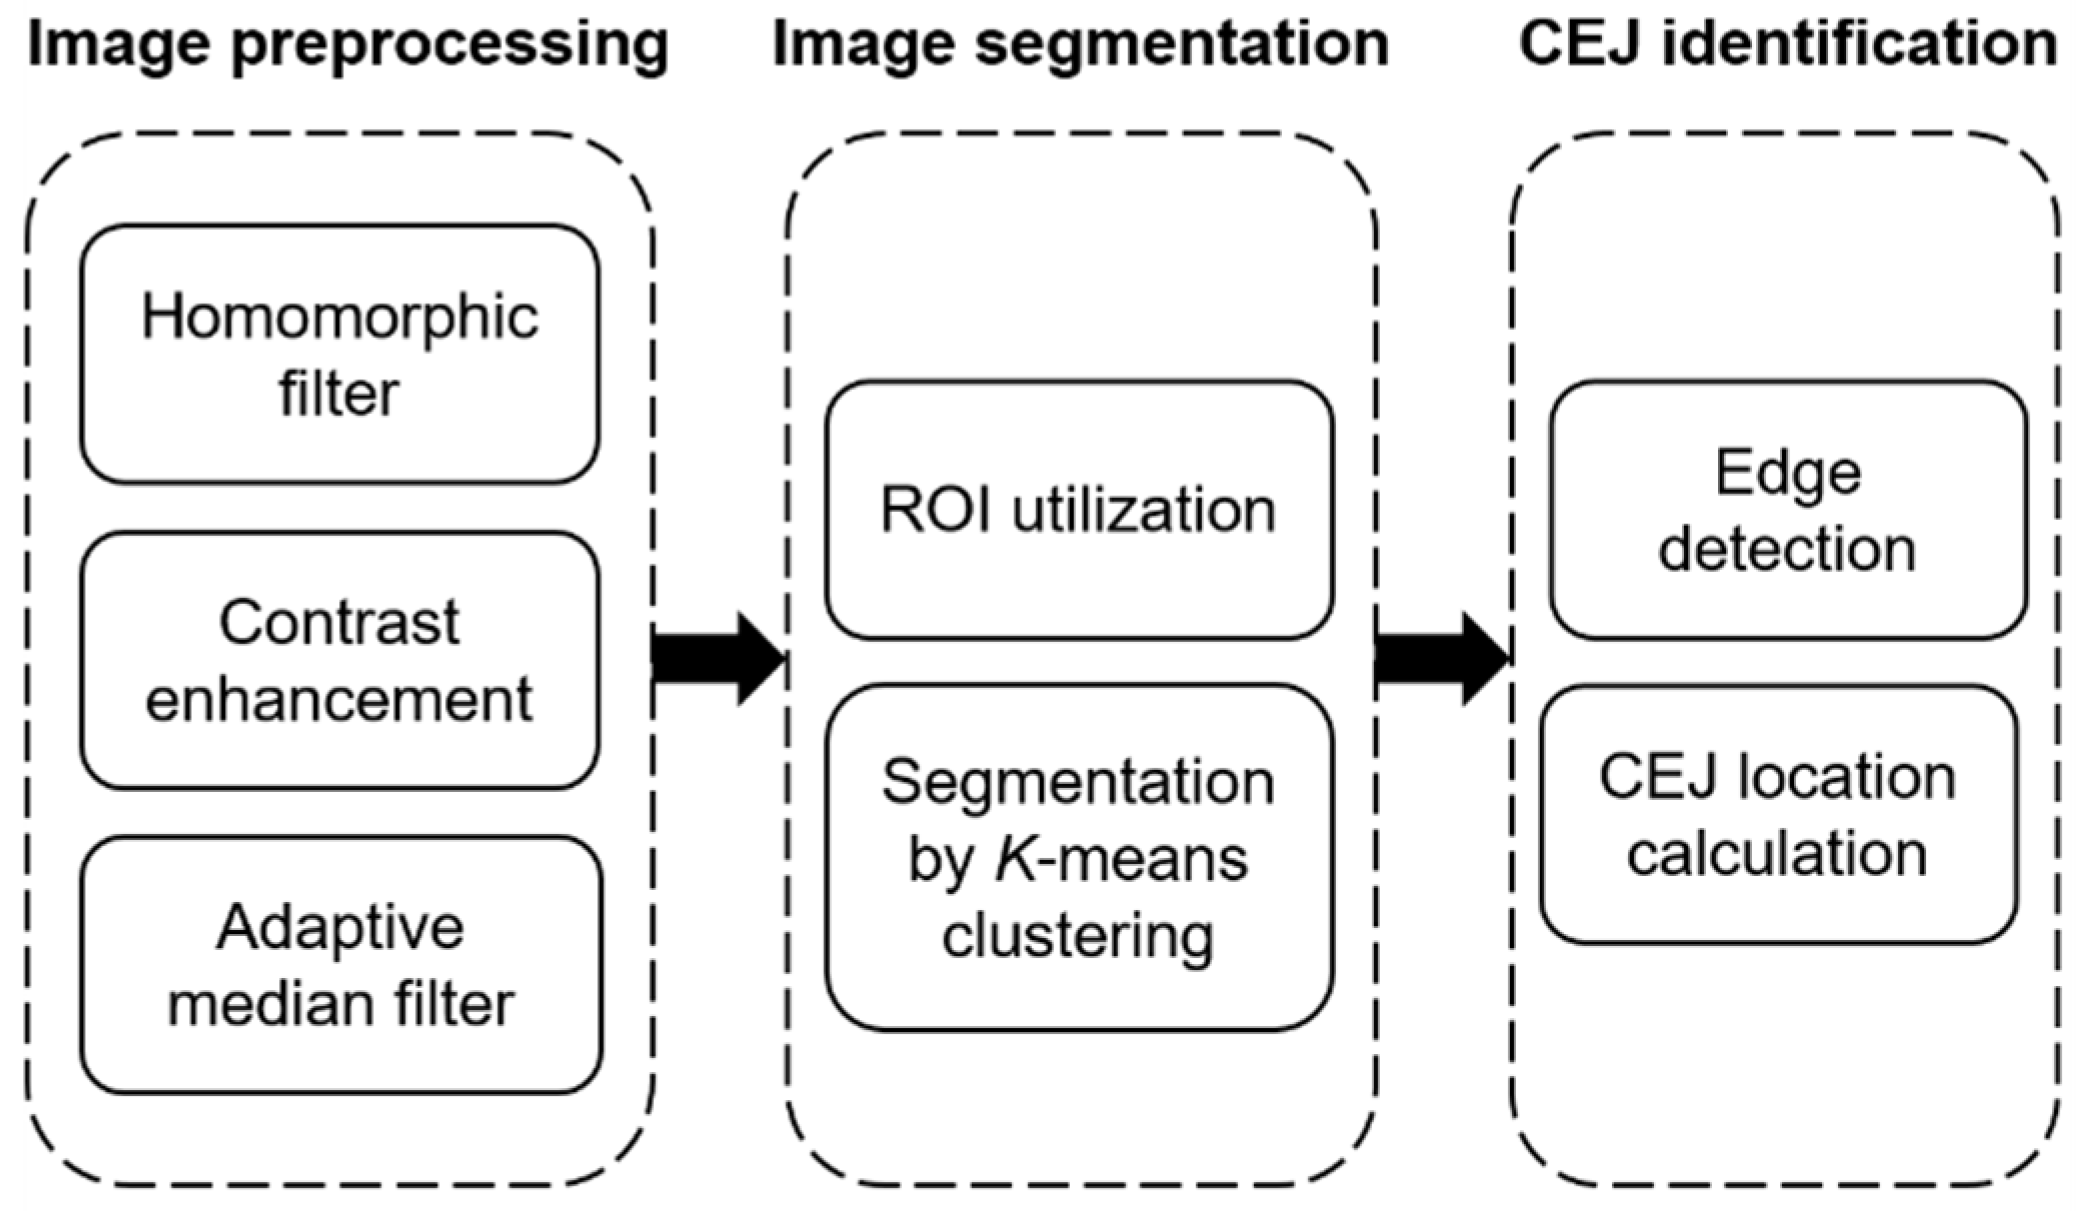
2.2. Image Preprocessing
2.2.1. Homomorphic Filtering
2.2.2. Contrast Enhancement
2.2.3. Adaptive Median Filtering
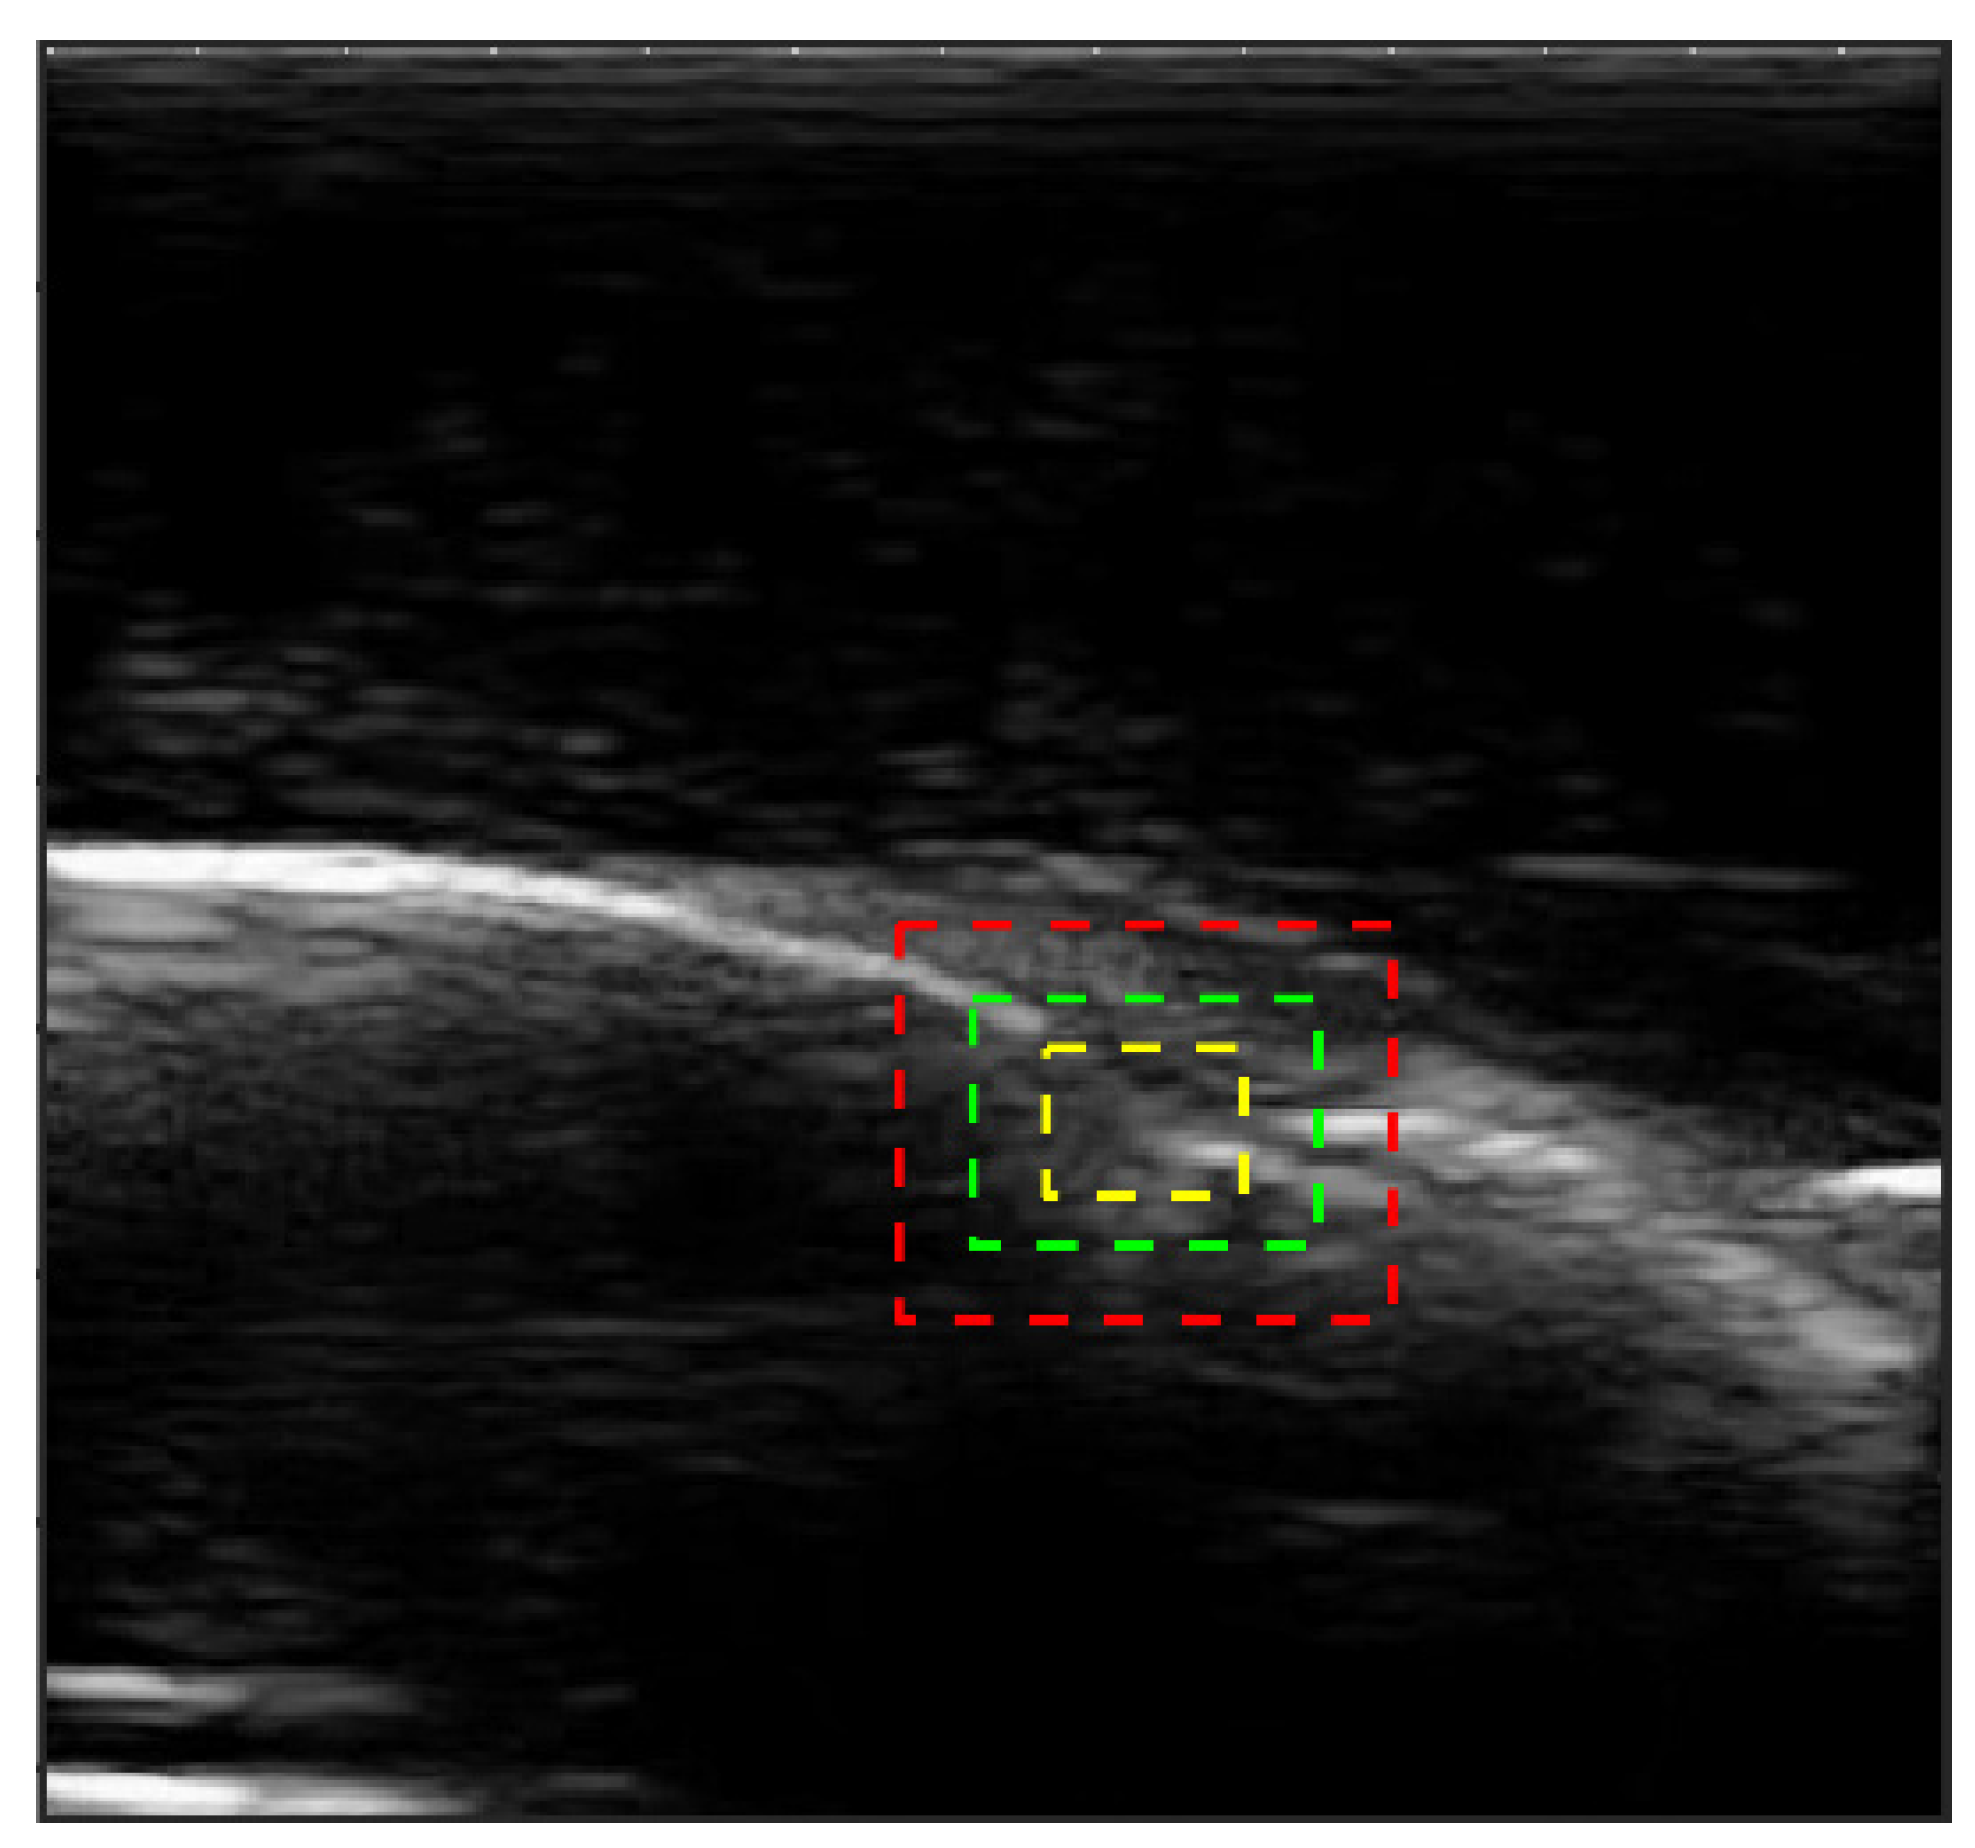
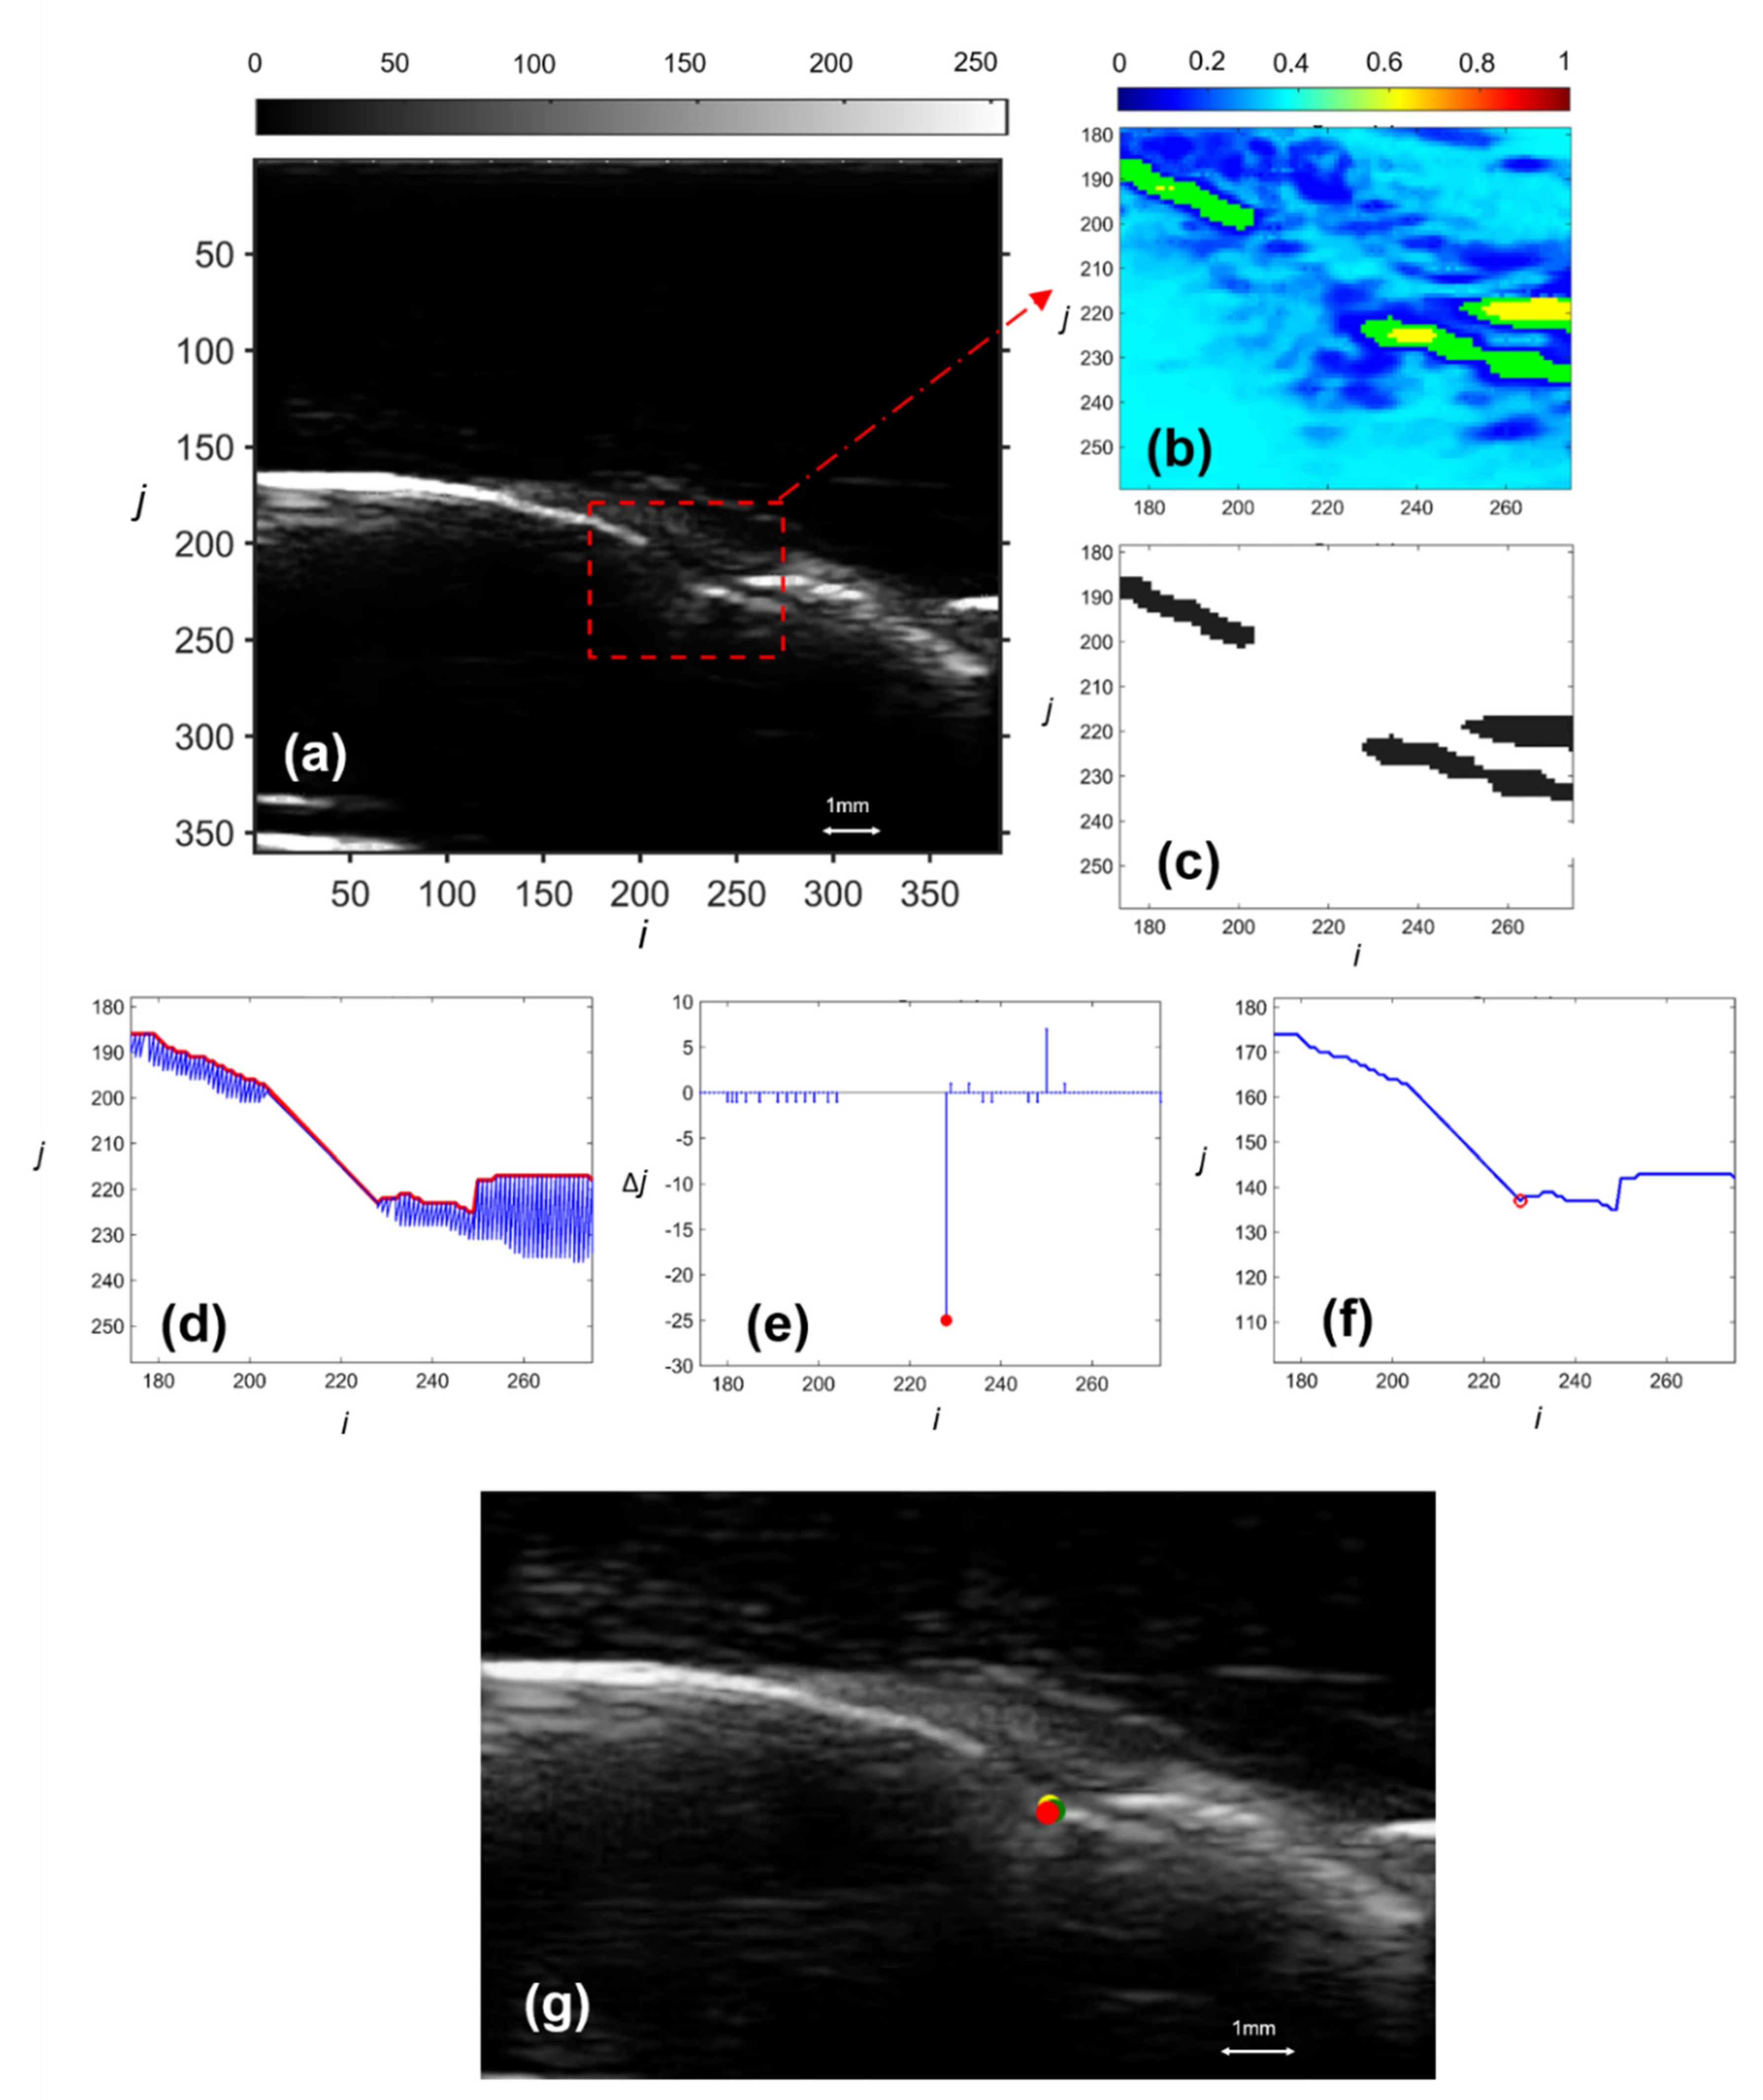
2.3. Image Segmentation
2.4. CEJ Selection
2.5. Validation
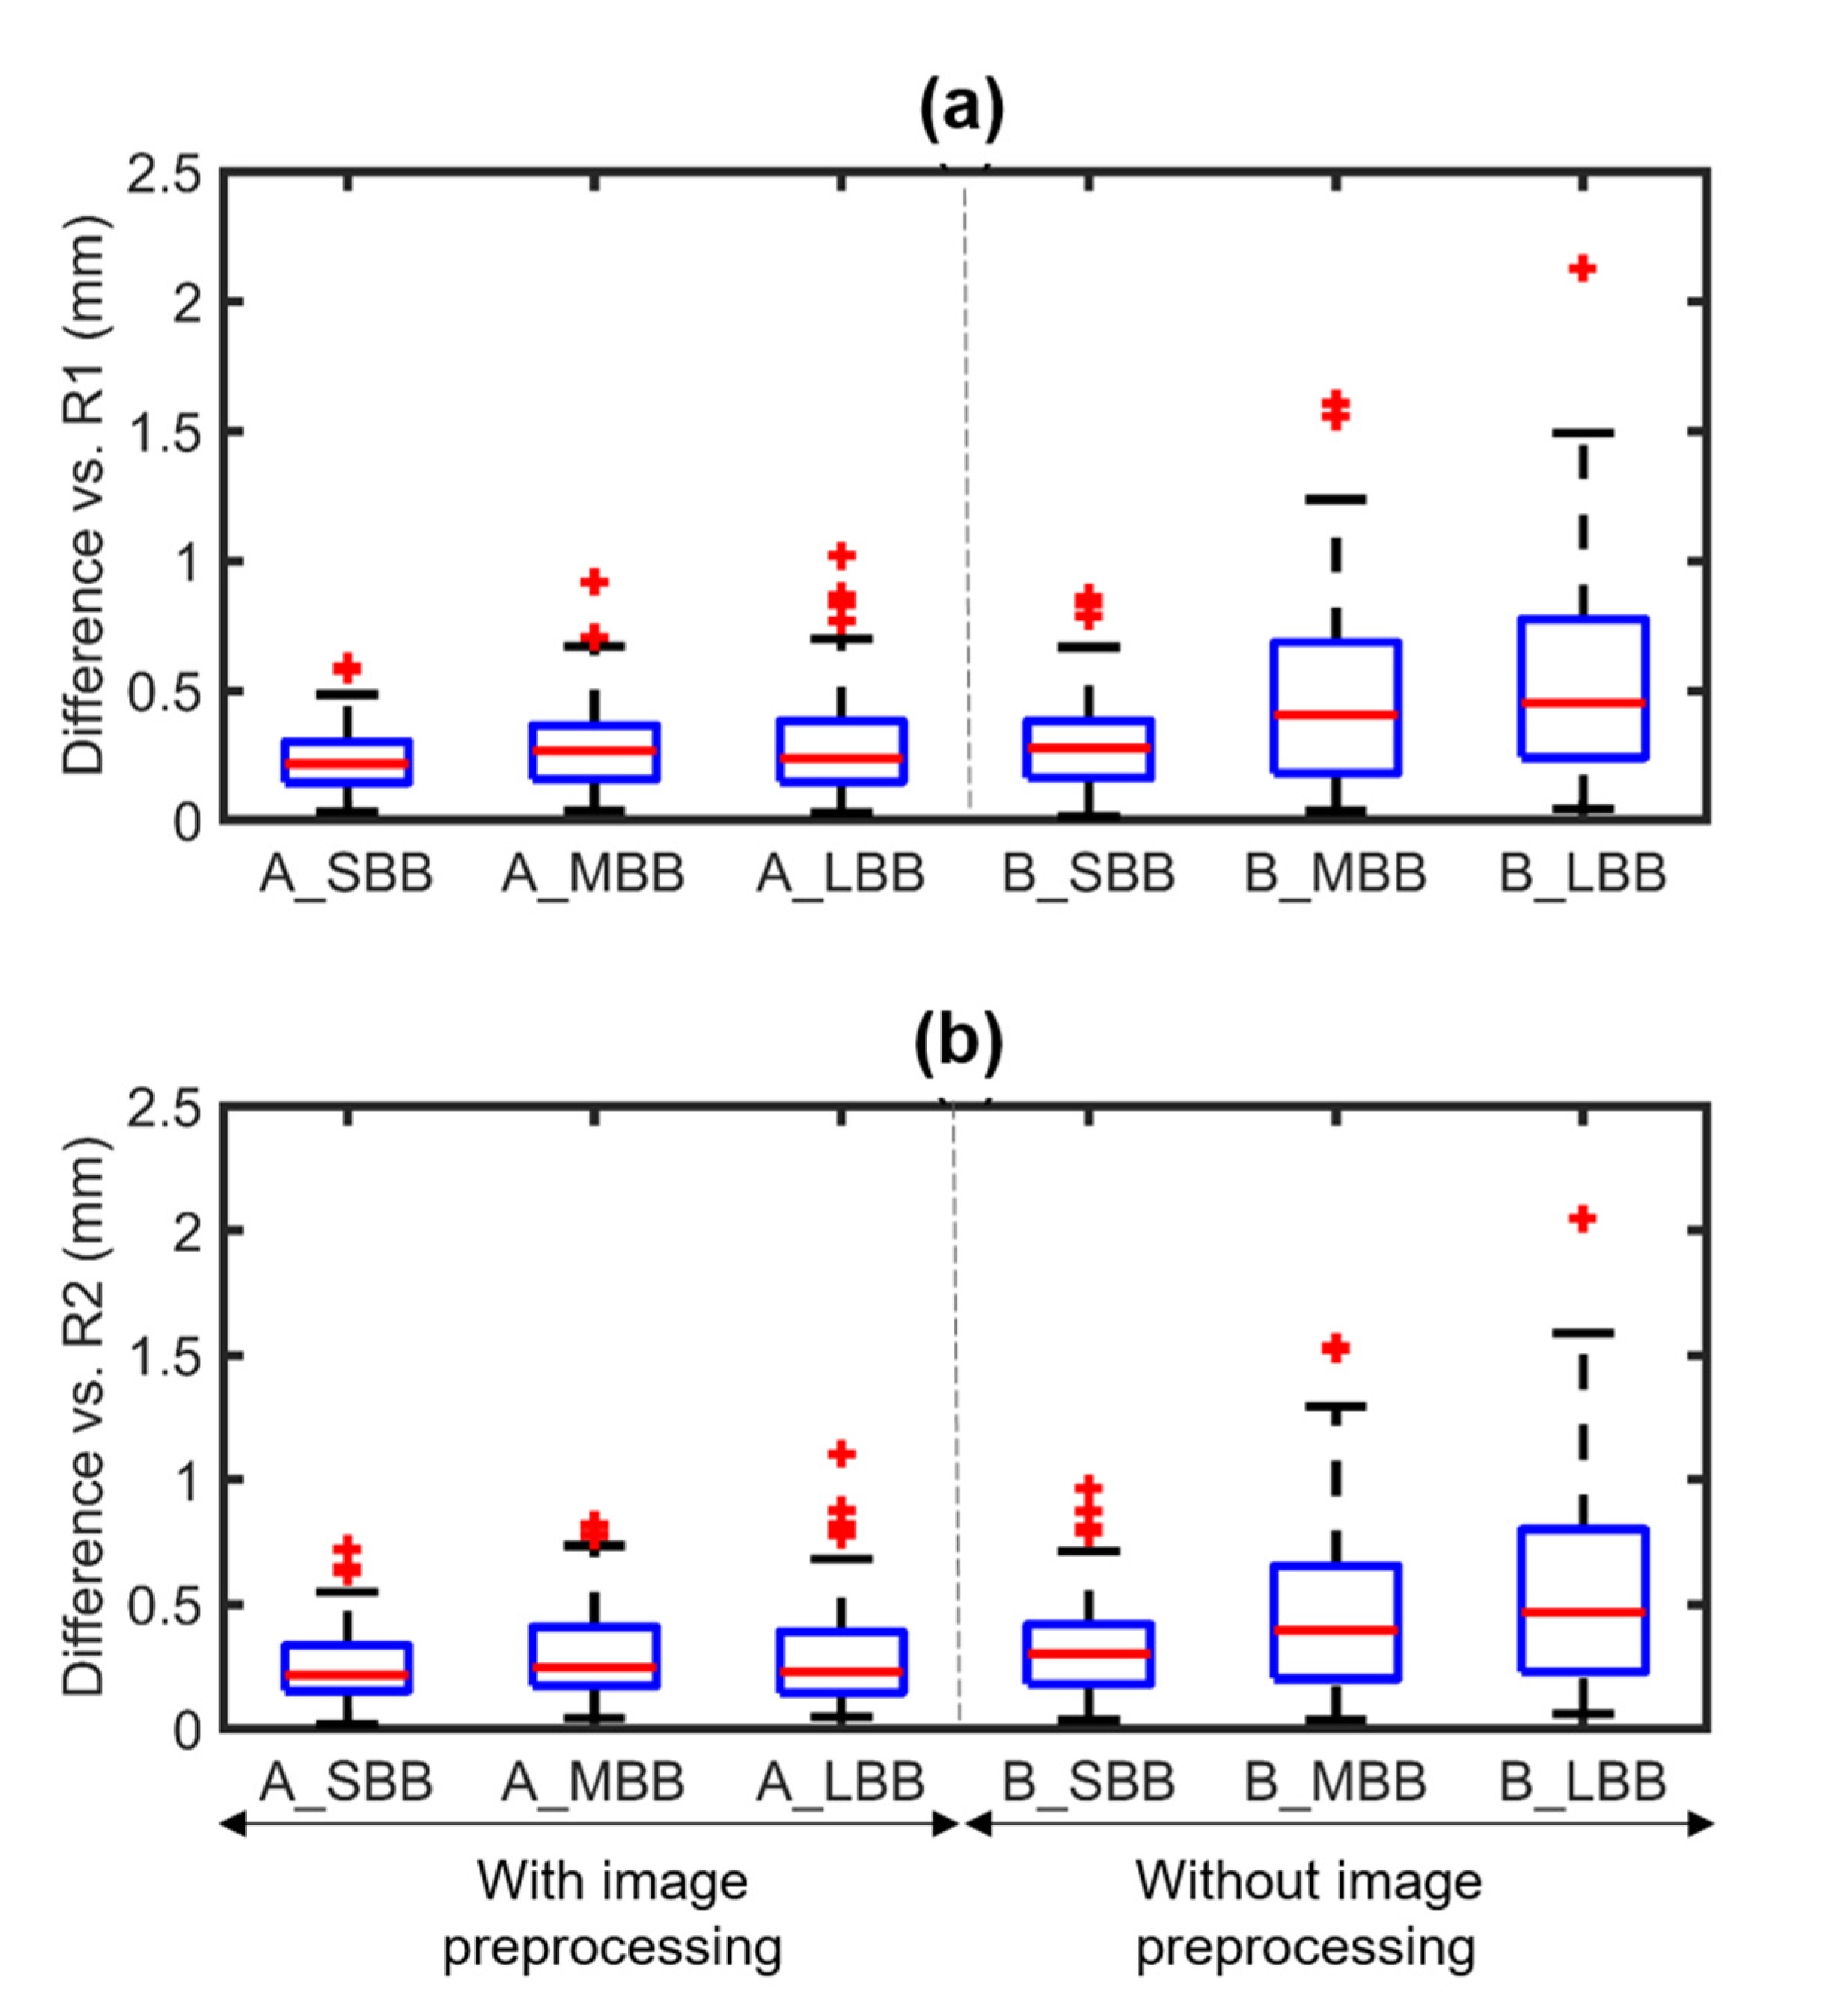
3. Results
4. Discussion
5. Conclusions
Author Contributions
Funding
Institutional Review Board Statement
Informed Consent Statement
Data Availability Statement
Acknowledgments
Conflicts of Interest
References
- Sanz, M.; D’Aiuto, F.; Deanfield, J.; Fernandez-Avilés, F. European workshop in periodontal health and cardiovascular disease--scientific evidence on the association between periodontal and cardiovascular diseases: A review of the literature. Eur. Heart J. Suppl. 2010, 12, B3–B12. [Google Scholar] [CrossRef]
- Dentino, A.; Lee, S.; Mailhot, J.; Hefti, A.F. Principles of periodontology. Periodontol. 2000 2013, 61, 16–53. [Google Scholar] [CrossRef] [Green Version]
- Charalampakis, G.; Dahlén, G.; Carlén, A.; Leonhardt, Å. Bacterial markers vs. clinical markers to predict progression of chronic periodontitis: A 2-yr prospective observational study. Eur. J. Oral Sci. 2013, 121, 394–402. [Google Scholar] [CrossRef] [PubMed]
- Khaw, A.; Liberali, S.; Logan, R.; Keefe, D.; Bartold, P.M. Influence of periodontitis on the experience of oral mucositis in cancer patients undergoing head and neck radiotherapy: A pilot study. Support. Care Cancer 2014, 22, 2119–2125. [Google Scholar] [CrossRef]
- Cairo, F.; Carnevale, G.; Nieri, M.; Mervelt, J.; Cincinelli, S.; Martinolli, C.; Pini-Prato, G.P.; Tonetti, M.S. Benefits of fibre retention osseous resective surgery in the treatment of shallow infrabony defects. A double-blind, randomized, clinical trial describing clinical, radiographic and patient-reported outcomes. J. Clin. Periodontol. 2013, 40, 163–171. [Google Scholar] [CrossRef]
- Pecoraro, M.; Azadivatan-Le, N.; Janal, M.; Khocht, A. Comparison of observer reliability in assessing alveolar bone height on direct digital and conventional radiographs. Dentomaxillofac. Radiol. 2005, 34, 279–284. [Google Scholar] [CrossRef] [PubMed]
- Hou, G.-L.; Hung, C.-C.; Yang, Y.-S.; Shieh, T.-Y.; Tsai, C.-C. Radiographic alveolar bone loss in untreated Taiwan Chinese subjects with adult periodontitis measured by the digital scanning radiographic image analysis method. Dentomaxillofac. Radiol. 2003, 32, 104–108. [Google Scholar] [CrossRef] [PubMed]
- Wang, H.-L.; Burgett, F.G.; Shyr, Y.; Ramfjord, S. The Influence of Molar Furcation Involvement and Mobility on Future Clinical Periodontal Attachment Loss. J. Periodontol. 1994, 65, 25–29. [Google Scholar] [CrossRef] [Green Version]
- Tihanyi, D.; Gera, I.; Eickholz, P. Influence of individual brightness and contrast adjustment on accuracy of radiographic measurements of infrabony defects. Dentomaxillofac. Radiol. 2011, 40, 177–183. [Google Scholar] [CrossRef] [Green Version]
- Haralick, R.; Ramesh, V.; Haußmann, E.; Allen, K. Computerized detection of cemento-enamel junctions in digitized dental radiographs. In The Images of the Twenty-First Century, Proceedings of the Annual International Engineering in Medicine and Biology Society, Seattle, WA, USA, 9–12 November 1989; Institute of Electrical and Electronics Engineers (IEEE): Piscataway Township, NJ, USA, 2003. [Google Scholar]
- Vasconcelos, K.D.F.; Evangelista, K.M.; Rodrigues, C.D.; Estrela, C.; De Sousa, T.O.; Silva, M.A.G. Detection of periodontal bone loss using cone beam CT and intraoral radiography. Dentomaxillofac. Radiol. 2012, 41, 64–69. [Google Scholar] [CrossRef] [Green Version]
- Leung, C.C.; Palomo, L.; Griffith, R.; Hans, M.G. Accuracy and reliability of cone-beam computed tomography for measuring alveolar bone height and detecting bony dehiscences and fenestrations. Am. J. Orthod. Dentofac. Orthop. 2010, 137, S109–S119. [Google Scholar] [CrossRef]
- Ludlow, J.B.; Davies-Ludlow, L.E.; Brooks, S.L.; Howerton, W.B. Dosimetry of 3 CBCT devices for oral and maxillofacial radiology: CB Mercuray, NewTom 3G and i-CAT. Dentomaxillofac. Radiol. 2014. [Google Scholar] [CrossRef]
- Chen, Y.-L.; Chang, H.-H.; Chiang, Y.-C.; Lin, C.-P. Application and development of ultrasonics in dentistry. J. Formos. Med Assoc. 2013, 112, 659–665. [Google Scholar] [CrossRef] [Green Version]
- Chifor, R.; Hedeşiu, M.; Bolfa, P.; Catoi, C.; Crişan, M.; Serbănescu, A.; Badea, A.F.; Moga, I.; Badea, M.E. The evaluation of 20 MHz ultrasonography, computed tomography scans as compared to direct microscopy for periodontal system assessment. Med Ultrason. 2011, 13, 120–126. [Google Scholar] [PubMed]
- Chan, H.-L.; Sinjab, K.; Chung, M.-P.; Chiang, Y.-C.; Wang, H.-L.; Giannobile, W.V.; Kripfgans, O.D. Non-invasive evaluation of facial crestal bone with ultrasonography. PLoS ONE 2017, 12, e0171237. [Google Scholar] [CrossRef] [Green Version]
- Nguyen, K.-C.T.; Le, L.H.; Kaipatur, N.R.; Zheng, R.; Lou, E.H.; Major, P.W. High-Resolution Ultrasonic Imaging of Dento-Periodontal Tissues Using a Multi-Element Phased Array System. Ann. Biomed. Eng. 2016, 44, 2874–2886. [Google Scholar] [CrossRef]
- Nguyen, K.-C.T.; Le, L.H.; Kaipatur, N.R.; Major, P.W. Imaging the Cemento-Enamel Junction Using a 20-MHz Ultrasonic Transducer. Ultrasound Med. Biol. 2016, 42, 333–338. [Google Scholar] [CrossRef]
- Nguyen, K.-C.T.; Pachêco-Pereira, C.; Kaipatur, N.R.; Cheung, J.; Major, P.W.; Le, L.H. Comparison of ultrasound imaging and cone-beam computed tomography for examination of the alveolar bone level: A systematic review. PLoS ONE 2018, 13, e0200596. [Google Scholar] [CrossRef]
- Nguyen, K.-C.T.; Shi, D.; Kaipatur, N.R.; Lou, E.H.M.; Major, P.W.; Punithakumar, K.; Le, L.H. Graph Cuts-based Segmentation of Alveolar Bone in Ultrasound Imaging. In Proceedings of the 2018 IEEE International Conference on Bioinformatics and Biomedicine (BIBM), Madrid, Spain, 3–6 December 2018; pp. 2049–2055. [Google Scholar]
- Nguyen, K.; Duong, D.; Almeida, F.; Major, P.; Kaipatur, N.; Pham, T.; Lou, E.; Noga, M.; Punithakumar, K.; Le, L. Alveolar Bone Segmentation in Intraoral Ultrasonographs with Machine Learning. J. Dent. Res. 2020, 99, 1054–1061. [Google Scholar] [CrossRef]
- Tattan, M.; Sinjab, K.; Lee, E.; Arnett, M.; Oh, T.; Wang, H.; Chan, H.; Kripfgans, O.D. Ultrasonography for chairside evaluation of periodontal structures: A pilot study. J. Periodontol. 2020, 91, 890–899. [Google Scholar] [CrossRef] [PubMed]
- Mathieu, V.; Anagnostou, F.; Soffer, E.; Haïat, G. Ultrasonic Evaluation of Dental Implant Biomechanical Stability: An In Vitro Study. Ultrasound Med. Biol. 2011, 37, 262–270. [Google Scholar] [CrossRef]
- Sawant, A.R.; Zeman, H.D.; Muratore, D.M.; Samant, S.S.; Dibianca, F.A. Adaptive median filter algorithm to remove impulse noise in x-ray and CT images and speckle in ultrasound images. Med. Imaging 1999, 3661, 1263–1274. [Google Scholar] [CrossRef]
- Jain, A.K. Fundamentals of Digital Image Processing; Prentice-Hall, Inc.: Hoboken, NJ, USA, 1989. [Google Scholar]
- Solbo, S.; Eltoft, T. Homomorphic wavelet-based statistical despeckling of SAR images. IEEE Trans. Geosci. Remote Sens. 2004, 42, 711–721. [Google Scholar] [CrossRef]
- Achim, A.; Bezerianos, A.; Tsakalides, P. Novel Bayesian multiscale method for speckle removal in medical ultrasound images. IEEE Trans. Med. Imaging 2001, 20, 772–783. [Google Scholar] [CrossRef] [Green Version]
- Gonzalez, R.C.; Woods, R.E. Digital Image Processing; Prentice hall: Upper Saddle River, NJ, USA, 2002. [Google Scholar]
- Arce, G.R. Nonlinear Signal Processing: A Statistical Approach; John Wiley & Sons: Hoboken, NJ, USA, 2005. [Google Scholar]
- Khalid, M.; Pal, N.; Arora, K. Clustering of Image Data Using K-Means and Fuzzy K-Means. Int. J. Adv. Comput. Sci. Appl. 2014, 5, 160–163. [Google Scholar] [CrossRef] [Green Version]
- Roa, I.; Del Sol, M.; Cuevas, J. Morphology of the Cement-Enamel Junction (CEJ), Clinical Correlations. Int. J. Morphol. 2013, 31, 894–898. [Google Scholar] [CrossRef] [Green Version]
- Portney, L.G.; Watkins, M.P. Foundations of Clinical Research: Applications to Practice, 2nd ed.; Prentice Hall Health: Highland Park, NJ, USA, 2000. [Google Scholar]
- Badersten, A.; Nilvéaus, R.; Egelberg, J. Reproducibility of probing attachment level measurements. J. Clin. Periodontol. 1984, 11, 475–485. [Google Scholar] [CrossRef]
- Williamson, D.F.; Parker, R.A.; Kendrick, J.S. The Box Plot: A Simple Visual Method to Interpret Data. Ann. Intern. Med. 1989, 110, 916–921. [Google Scholar] [CrossRef]
- Abolhassani, N.; Patel, R.; Moallem, M. Needle insertion into soft tissue: A survey. Med. Eng. Phys. 2007, 29, 413–431. [Google Scholar] [CrossRef]
- Hacihaliloglu, I.; Abugharbieh, R.; Hodgson, A.; Rohling, R. Bone Segmentation and Fracture Detection in Ultrasound Using 3D Local Phase Features. In Medical Image Computing and Computer-Assisted Intervention—MICCAI 2008; Metaxas, D., Axel, L., Fichtinger, G., Székely, G., Eds.; Springer: Berlin/Heidelberg, Germany, 2008; pp. 287–295. [Google Scholar]
- Chifor, R.; Badea, M.E.; Mitrea, D.A.; Badea, I.C.; Crisan, M.; Chifor, I.; Avram, R. Computer-assisted identification of the gingival sulcus and periodontal epithelial junction on high-frequency ultrasound images. Med. Ultrason. 2015, 17, 273–279. [Google Scholar] [CrossRef] [Green Version]
- Duong, D.Q.; Nguyen, K.-C.T.; Kaipatur, N.R.; Lou, E.H.M.; Noga, M.; Major, P.W.; Punithakumar, K.; Le, L.H. Fully Automated Segmentation of Alveolar Bone Using Deep Convolutional Neural Networks from Intraoral Ultrasound Images. In Proceedings of the 2019 41st Annual International Conference of the IEEE Engineering in Medicine and Biology Society (EMBC), Berlin, Germany, 23–27 July 2019; Volume 2019, pp. 6632–6635. [Google Scholar]
- Abdolali, F.; Kapur, J.; Jaremko, J.L.; Noga, M.; Hareendranathan, A.R.; Punithakumar, K. Automated thyroid nodule detection from ultrasound imaging using deep convolutional neural networks. Comput. Biol. Med. 2020, 122, 103871. [Google Scholar] [CrossRef]
- He, K.; Gkioxari, G.; Dollar, P.; Girshick, R.B. Mask R-CNN. In Proceedings of the IEEE International Conference on Computer Vision, Venice, Italy, 22–29 October 2017; pp. 22386–22397. [Google Scholar]


| MD (mm) | SD (mm) | ICC | Images with Difference < 0.5 mm (%) | ||
|---|---|---|---|---|---|
| Full size | R11–R12 | 0.21 | 0.24 | 0.983 [0.978,0.987] | 90 |
| R21–R22 | 0.31 | 0.32 | 0.969 [0.960,0.978] | 85 | |
| R1–R2 | 0.23 | 0.24 | 0.983 [0.979,0.987] | 93 | |
| SBB 31 × 41 (pixel) | R1–A | 0.23 | 0.12 | 0.991 [0.989,0.993] | 98 |
| R2–A | 0.26 | 0.15 | 0.988 [0.984,0.991] | 94 | |
| R1–B | 0.30 | 0.20 | 0.985 [0.980,0.988] | 87 | |
| R2–B | 0.33 | 0.19 | 0.980 [0.974,0.985] | 83 | |
| MBB 51 × 71 (pixel) | R1–A | 0.28 | 0.16 | 0.985 [0.981,0.989] | 92 |
| R2–A | 0.30 | 0.17 | 0.984 [0.979,0.987] | 91 | |
| R1–B | 0.46 | 0.33 | 0.959 [0.948,0.968] | 62 | |
| R2–B | 0.47 | 0.33 | 0.957 [0.945,0.967] | 63 | |
| LBB 81 × 101 (pixel) | R1–A | 0.29 | 0.18 | 0.983 [0.978,0.986] | 90 |
| R2–A | 0.30 | 0.20 | 0.981 [0.976,0.985] | 89 | |
| R1–B | 0.54 | 0.38 | 0.944 [0.928,0.956] | 57 | |
| R2–B | 0.56 | 0.38 | 0.941 [0.924,0.954] | 53 |
Publisher’s Note: MDPI stays neutral with regard to jurisdictional claims in published maps and institutional affiliations. |
© 2021 by the authors. Licensee MDPI, Basel, Switzerland. This article is an open access article distributed under the terms and conditions of the Creative Commons Attribution (CC BY) license (https://creativecommons.org/licenses/by/4.0/).
Share and Cite
Nguyen, K.-C.T.; Yan, Y.; Kaipatur, N.R.; Major, P.W.; Lou, E.H.; Punithakumar, K.; Le, L.H. Computer-Assisted Detection of Cemento-Enamel Junction in Intraoral Ultrasonographs. Appl. Sci. 2021, 11, 5850. https://0-doi-org.brum.beds.ac.uk/10.3390/app11135850
Nguyen K-CT, Yan Y, Kaipatur NR, Major PW, Lou EH, Punithakumar K, Le LH. Computer-Assisted Detection of Cemento-Enamel Junction in Intraoral Ultrasonographs. Applied Sciences. 2021; 11(13):5850. https://0-doi-org.brum.beds.ac.uk/10.3390/app11135850
Chicago/Turabian StyleNguyen, Kim-Cuong T., Yuening Yan, Neelambar R. Kaipatur, Paul W. Major, Edmond H. Lou, Kumaradevan Punithakumar, and Lawrence H. Le. 2021. "Computer-Assisted Detection of Cemento-Enamel Junction in Intraoral Ultrasonographs" Applied Sciences 11, no. 13: 5850. https://0-doi-org.brum.beds.ac.uk/10.3390/app11135850