Article

Informative Biomarkers for Autism Spectrum Disorder Diagnosis in Functional Magnetic Resonance Imaging Data on the Default Mode Network

by
Aikaterini S. Karampasi
*,
Antonis D. Savva
,
Vasileios Ch. Korfiatis
,
Ioannis Kakkos
and
George K. Matsopoulos
Laboratory of Biomedical Optics & Applied Biophysics, School of Electrical and Computer Engineering, National Technical University of Athens, 15780 Athens, Greece
*
Author to whom correspondence should be addressed.
Submission received: 24 May 2021 / Revised: 23 June 2021 / Accepted: 2 July 2021 / Published: 5 July 2021
(This article belongs to the Special Issue Advances in Biomedical Signal Processing in Health Care)

Abstract

:
Effective detection of autism spectrum disorder (ASD) is a complicated procedure, due to the hundreds of parameters suggested to be implicated in its etiology. As such, machine learning methods have been consistently applied to facilitate diagnosis, although the scarcity of potent autism-related biomarkers is a bottleneck. More importantly, the variability of the imported attributes among different sites (e.g., acquisition parameters) and different individuals (e.g., demographics, movement, etc.) pose additional challenges, eluding adequate generalization and universal modeling. The present study focuses on a data-driven approach for the identification of efficacious biomarkers for the classification between typically developed (TD) and ASD individuals utilizing functional magnetic resonance imaging (fMRI) data on the default mode network (DMN) and non-physiological parameters. From the fMRI data, static and dynamic connectivity were calculated and fed to a feature selection and classification framework along with the demographic, acquisition and motion information to obtain the most prominent features in regard to autism discrimination. The acquired results provided high classification accuracy of 76.63%, while revealing static and dynamic connectivity as the most prominent indicators. Subsequent analysis illustrated the bilateral parahippocampal gyrus, right precuneus, midline frontal, and paracingulate as the most significant brain regions, in addition to an overall connectivity increment.

1. Introduction

Autism spectrum disorder (ASD) is a neurodevelopmental disorder described by social interaction and communication deficiencies, as well as restricted repetitive behaviors [1]. ASD is predominantly diagnosed by an expert clinician via the observation of the individual’s characteristics, specific questionnaires, and/or family members’ descriptions. However, due to the large range of attibutes incorporated in ASD, as well as the clinician’s subjective diagnostic criteria, ASD identification is prone to misdiagnosis [2,3]. To that end, the main obstacle for accurate ASD detection is the lack of quantitative characteristics/biomarkers clearly linked to autism-related attributes with any kind of imaging modality, with the exception of a limited number of magnetic resonance imaging (MRI) volumetric differences between ASD and typically developed (TD) individuals [4,5,6].
Towards identifying discriminative ASD patterns in a functional level, functional connectivity (FC) is ideal to represent the statistical dependencies between the various brain regions [7]. To that end, recent studies employing resting state functional MRI (fMRI) data report FC differences in the default mode network (DMN) between ASD and TD subjects, therefore suggesting it can serve as a possible ASD biomarker [8,9]. DMN is a widespread brain network implicated in mumerous cognitive conditions and states and consists of the superior frontal gyrus, the medial prefrontal cortex, the precuneus, the posterior cingulate cortex, the inferior parietal lobules, and the hippocampus [9]. In this regard, FC analysis in the DMN has indicated the precuneus to be important for the identification of ASD individuals [9]. Furthermore, Jung et al. [10] found statistically significant FC alterations among the regions of the DMN and specifically an overall autism-related under-connectivity pattern. On the contrary, Abbott et al. reported higher connectivity in specific DMN regions of interest (ROIs) related to individuals with ASD [8]. Of note is that between different studies, over- or under-connectivity patterns can vary relevant to several factors such as the brain atlas selected, the FC design and methodological precedures. Despite these facts, however, ROIs consisting the DMN have been found to improve the diagnosis, due to the functionalities they have been linked to (such as the social interaction capabilities, theory of mind, and the manner autistic people identify the world and themselves) [11,12,13].
Towards enhancing ASD identification, artificial intelligence techniques have become a well-established tool for the development and application of decision support systems as diagnostic aid [14,15]. In this direction, the majority of recent studies employ the Autism Brain Imaging Data Exchange (ABIDE) dataset (or parts of it), which provides multiple brain parcellation schemes of 17 clinics in the USA, including 1112 individuals in total, along with a variety of machine learning methods, brain atlases, and pre-processing pipelines [16]. For instance, Plitt et al. combined whole-brain FC and behavioral features on 90 individuals from three sites of the ABIDE I dataset and achieved a classification accuracy of 73.89% using an L2-regularized logistic regression and a stratified 10-fold validation scheme [17]. In a similar manner, Chen et al. reached 66% accuracy by utilizing a custom brain parcellation precedure on 20% of the initial ABIDE I dataset (based on age and head motion criteria) paired with whole-brain FC and a support vector machine (SVM) classifier [18]. More recently, Wang et al. used approximately 50% of the ABIDE I dataset to calculate FC among 35 ROIs and attained SVM accuracy of 90.6% [19]. In ABIDE I subset analogous studies, age-matched data and the Craddock brain parcellation atlas combined with convolutional neural networks deep learning methods presented 72.73% [20] and 70.22% [21] classification performance.
A major limitation of related studies concerns the diversity of the dataset that they utilize, since a small number of instances/subjects or a targeted group can result in low sample heterogeneity and might fail to produce a universal model regarding distinct autistic biomarkers [22]. This is further supported when classification architectures are expanded in the whole ABIDE I dataset, usually leading to inferior results. Particulalry, in Abraham et al., the entire ABIDE I dataset was employed using the Harvard–Oxford (HO) brain atlas and FC features, attaining 66.9% accuracy in inter-site validation [22]. In the same manner, the ABIDE I dataset with HO atlas was used to calculate FC features, resulting in 70.4% mean accuracy when using graph convolutional network [23], whereas in [24], whole-brain FC of the Craddock atlas (CC200) was fed to a deep neural network achieving 70% accuracy. Moreover, an implementation of a multi-atlas classification scheme employing FC along with a neural network obtained 78.7% accuracy [25]. In our previous work [26], static FC and image-related features were incorporated (i.e., the Haralick texture features and the Kullback–Leibler divergence) to discriminate between ASD and TD individulars resulting in 72.5% accuracy. Our results demonstrated that additional characteristics, when applied to machine learning paradigms, can enhance classification performance and provide additional indicators of the autism-regulated mechanisms that govern brain functions.
Taking into account all the above, it can be inferred that the intoduction of new biomarkers is essential for the effective detection of ASD in a global manner. As such, the aim of this paper is to identify the neural substrates that contain autism-related information fused with behavioral and experimental parameters to better support ASD diagnosis. To that end, we employ the blood oxygenated level dependent (BOLD) time series, using the CC200 brain parcellation scheme in all of the 17 sites of the ABIDE I pre-processed dataset (1034 individuals) to extract indicative attributes and assess their predicitve power. Specifically, the FC of the DMN’s 18 brain regions is estimated (static and dynamic FC) combined with features that are related to the dataset diversity (movement and acquisition parameters), demographics (age and handedness) in a feature selection (FS) and classification framework to evaluate the quality of the selected features and highlight possible ASD biomarkers. Our results demostrate the overall framework’s efficacy attaining 76.63% classification accuracy with a small number of discriminative features. Specifically, the selected features analysis suggests static and dynamic connectivity as the predominant autism-related indicators especially in the paracingulate, midline frontal, bilateral parahippocampal gyrus, and right precuneus brain regions. Furthermore, an increasing ASD-related connectivity trend was observed on all the significant connections, illustrating the potential of novel biomarkers inclusion as an objective and automated assistance to the clinicians, enhancing their own observations.

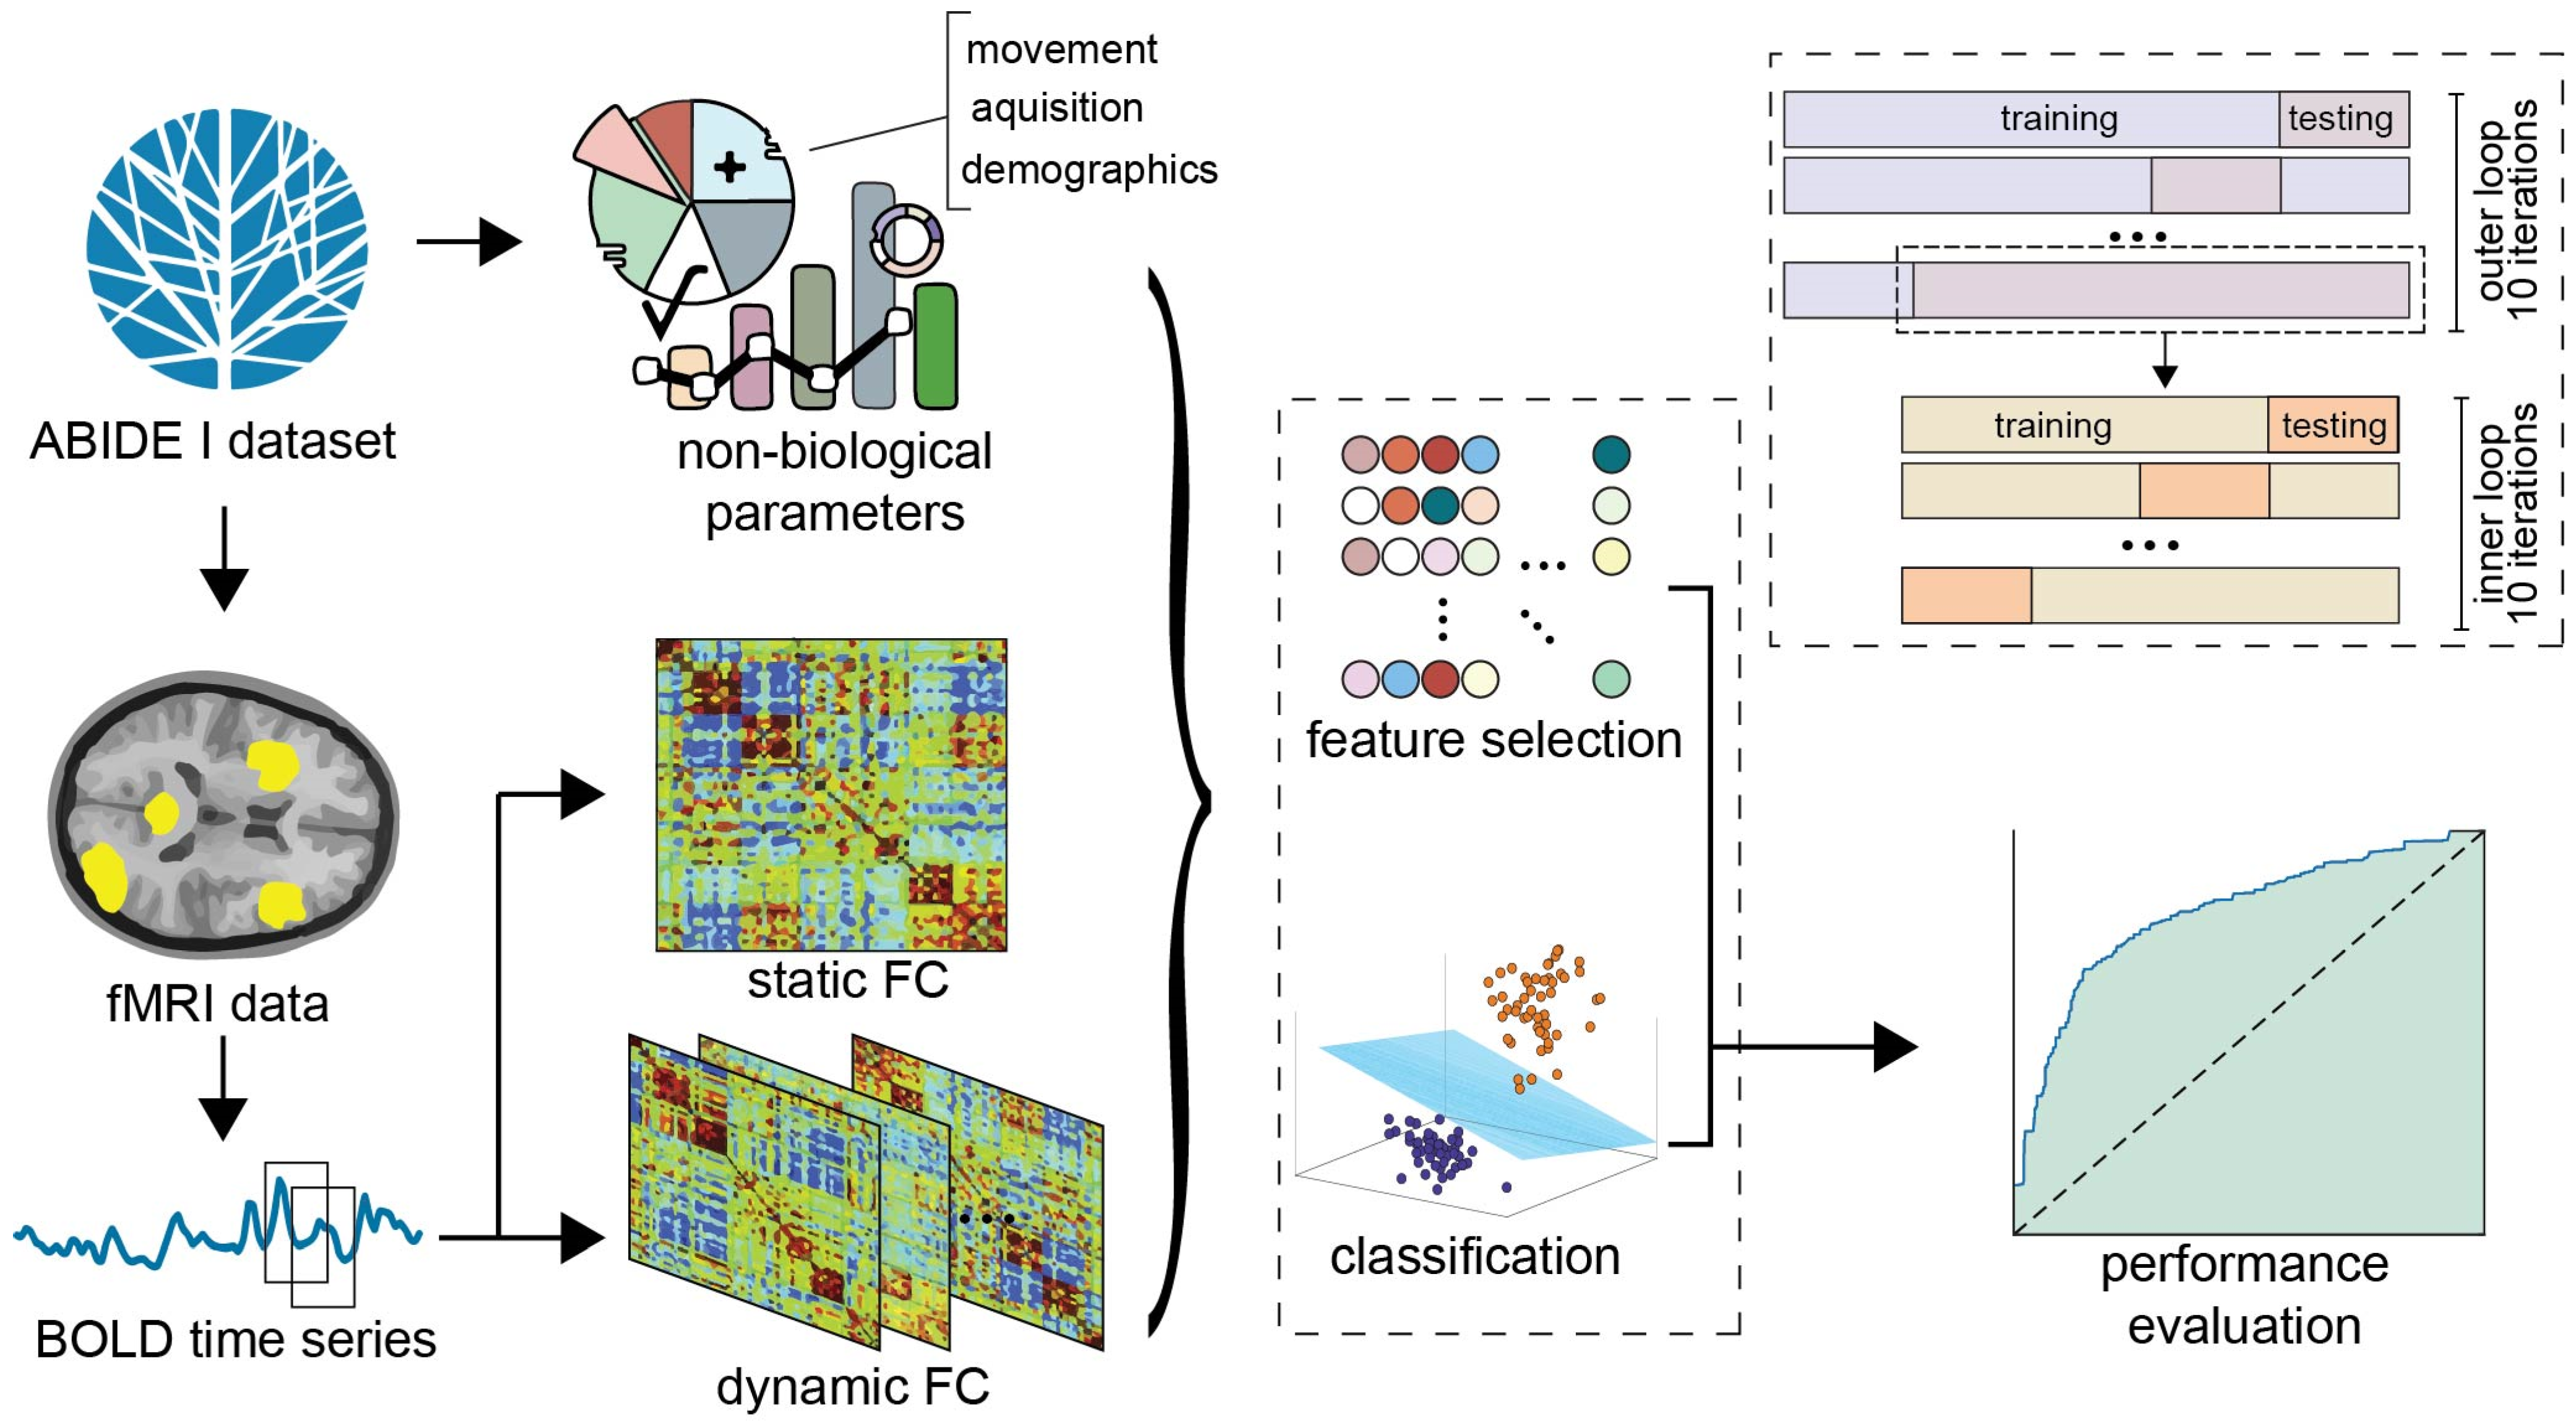
2. Materials and Methods

2.1. fMRI Data Acquisition

Rs-fMRI data were retrieved from the publicly accessible ABIDE I dataset [16], involving a total of 1112 participants from 17 sites (539 ASD and 573 sex-group matched TD individuals) with age range 7–64 years. Data pre-processing has been applied and publicly released by the ABIDE consortium as presented below.

2.2. Inclusion/Exclusion Criteria and Pre-Processing

In the present study, Craddock’s brain parcellation scheme (CC200) [27] was obtained with inclusion criteria encompassing individuals who had moved on average less than 0.2 mm during the acquisition, resulting in 883 samples [28].
Pre-processing included structural and functional procedures performed on the fMRI data acquired. Structural pre-processing followed the steps of brain extraction, normalization to the MNI152 standard space (1 mm3 isotropic) with linear algorithms and segmentation of the brain tissue with respect to the CC200 parcellation scheme. Functional pre-processing involved brain extraction, slice timing correction, global mean intensity normalization to 1000, motion correction, nuisance signal regression, band-pass filtering in the range 0.01–0.1 Hz, and finally, registration to the MNI152 standard space. The resulted data were then utilized to extract the BOLD time series of each region. The abovementioned procedure is described thoroughly in the ABIDE Pipeline for the Analysis of Connectomes [29].
On the available data the BOLD time series of the 18 brain regions constituting the DMN were further inspected to identify confounding elements [30,31]. As such, the individuals’ data where one of the BOLD time series was zero (due to the calculation of the correlation of a zero element) were removed from subsequent analysis, leading to the final sample size of 871 individuals. Of note is that the portion between ASD and TD individuals included was approximately 1.18, meaning the two groups were represented by almost equal instances, avoiding the usage of imbalanced ASD and TD groups.

2.3. Feature Extraction

As stated in the introduction, the purpose of this study was to assess indicative ASD biomarkers and illustrate their discriminative power. From this standpoint, features that encompass exclusion criteria in previous works (such as demographic information and patient movement information while in the MRI system) were also evaluated in the present analysis. The rationale behind this was that by incorporating additional characteristics (usually detrimental for the machine learning performance) in the feature set, the FS procedure could rank the parameters involved, providing indications as to the degree they affect the constructed classification model. However, subjective parameters, such as intelligence quotient (IQ), were not included in an attempt of creating a model derived from objective parameters only.
In this context, feature extraction involved the FC calculation of DMN (as static and dynamic FC), acquisition parameters of the magnets’ protocol, demographic features (age and handedness), and information regarding the movement of the individuals during the scanning period. Feature estimation for each parameter is presented in the following sections.

2.3.1. Static Functional Connectivity

Since whole-brain analysis requires resources with high computational power and based on the fact that evidence form previous studies suggest that no significant changes are found in whole-brain ASD FC patterns [32], FC was calculated only among the 18 DMN regions.
As such, static functional connectivity (sFC) assumes that there are no changes in FC over time and is estimated by calculating the Pearson linear correlation using pairs of BOLD time series from the entire scanning period [7], as shown in Equation (1).
sFC = ρ = Cov ( x , y ) Var ( x ) Var ( y )
where x and y are the BOLD time series, Cov(.) represents the covariance, and Var(.) the variance operators. sFC is calculated for each pair of the 18 DMN regions, leading to 153 pairs.

2.3.2. Dynamic Functional Connectivity

Dynamic functional connectivity (dFC) has been recently introduced, suggesting that brain regions may be associated to each other at different time scales, during the scanning session [33]. Similar to sFC, the dFC was estimated in the DMN brain regions, using the sliding window technique [34]. In this context, the time series are divided into segments of equal length (window size), and a correlation metric is calculated between the data inside these windows, followed by the calculation of the Fisher z-transformation:
dFC = FC ( i ) = 0.5 log ( 1 + ρ ( i ) 1 ρ ( i ) )
where ρ(i) is the Pearson’s correlation shown in Equation (2) in each sliding window.
Regarding the window size, window length of 65 s was employed, shifted by one repetition time (TR) point, which can be several time points depending on the aggregate acquisition time. As a result a windowed correlation time series (FC(i)) was calculated for each DMN region pair, whose mean value and variance across the time axis are considered as feature vectors in this study. In total, 153 features are derived for each parameter, leading to 306 features.

2.3.3. Demographics

In order to consider the corresponding demographic inhomogeneity of the dataset, two demographic features have been utilized, namely age and handedness. A numerical conversion concerning the handedness data was employed to create a feature matrix as follows: 1—left, 2—right, 3—ambidextrous. The demographic information for the data included in this study is presented in Table 1.

2.3.4. Acquisition Parameters

The employed fMRI data were obtained using a variety of data acquisition protocols and scanners. In this regard, MRI system parameters are utilized as features for the subsequent analysis (9 features in total). Specifically, acquisition parameters included the field of view (FOV, 3 features—one for each dimension, x, y, and z), repetition time (TR, 1 feature), echo time (TE, 1 feature), voxel size (3 features corresponding to space dimensions), and number of slices (1 feature). For each clinic, the same parameters were utilized for the acquisition process concerning ASD and TD individuals.

2.3.5. Motion Parameters

Despite the majority of relevant studies consider motion as part of exclusion criteria (as stated in the introduction), we incorporate subject motion as a feature (for the individuals whose motion was on average less than 0.2 mm during acquisition) [28]. On this premise, the movement parameters could be assessed based on their relevance in the FS and classification precedures, while expanding the subject pool as much as possible. Motion features were estimated by utilizing the framewise displacement (FD) provided from each datacenter (2 features corresponding to FD mean value and percentage of slices with FD over 0.2 mm). Additionally, the rate of change in the BOLD signal (DVARS), corresponding to the temporal derivative of time courses and the variance over voxels of root mean square, was also calculated and incorporated (1 feature).

2.4. Feature Selection and Biomarker Assessment

The feature extraction procedure resulted in a large feature vector set compared to the number of instances. Specifically, the entire feature set comprised of 473 variables estimated for the 871 participants, which is suggested to be prone to overfitting due to the relevant feature size (optimal feature sets are required to incorporate approximately 1/3 ratio of features and instances) [35]. To address this and at the same time facilitate the evaluation of the features based on their discriminative power, an FS framework was adopted. FS can cope with the high-dimensional feature vector by characterizing the parameters incorporated based on an objective function, excluding redundant or non-informative features from the full feature set. As such, the resulted subset can alleviate overfitting bias, enabling the construction of an efficient model and consequently to increase classification accuracy. More importantly, the objective function employed can illustrate the feature importance with regard to the classification performance, providing indications as to the degree they relate to discrimination processes. A schematic of the framework employed is presented in Figure 1.
On this premise, the recursive feature elimination with correlation bias reduction (RFE-CBR) FS algorithm was employed that utilizes an internal linear SVM as an objective function estimation [36,37]. In detail, RFE-CBR is a sequential backward elimination method, which utilizes a linear SVM’s weights to create a ranking criterion on the feature set. As such, each iteration of the algorithm removes the least important feature from the set until all are removed. In addition, highly correlated features are further removed by the calculation of the correlation coefficient of each. The final RFE-CBR set consists of all the features, ranked in the reverse order of elimination. Although the FS ranking might be assessed due to the features’ ability to reduce unrelated noise and by extension increase classification performance while not being associated with explicit autism biomarkers, the internal procedure employed by the RFE-CBR (on the basis of a weight-related mathematical approach) allows for data-driven interpretations on the variance of the biomarkers utilized. The FS procedure was part of a nested 10-fold cross-validation (CV) workflow, ensuring that the subsequent classification processes would be more objective when selecting distinct subsets of features [35]. Moreover, RFE-CBR parameter optimization was performed using grid searching among the input FS parameters.

2.5. Classification

Following the application of the FS algorithm, the most prominent features are fed into a classifier to estimate the class (ASD vs. TD) of each individual/instance. Specifically, a linear kernel SVM was employed to discriminate between the different classes, based on the premise that linear models represent better the importance of the feature within the model (compared to non-linear models such as neural networks) [38]. In detail, SVM is a supervised binary classifier that utilizes known variables (training set; selected from all the available data) to create a projection on a multi-dimensional space. Then, a hyperplane is generated corresponding to the maximum distance from all the training instances of both classes. The unknown data elements (testing set; the non-selected data) are then evaluated as to the class they belong to and according to the side of the hyperplane separator they are subsequently mapped.
The classification precedure utilized the RFE-CBR ranked set by adding one by one the most common feature from all folds and evaluating the overall performance. Consequently, in each iteration, the SVM classifier estimated the accuracy of the features set deriving from the previous iterations with the inclusion of the next ranked feature in succession, starting from a null feature subset. The overall process was performed until all features were included in the classification subset, in order to investigate the optimal number of features that would provide the highest performance, optimizing internal parameters with a Bayesian procedure aiming at minimizing the error as shown in Equation (3) [39]:
error = 1 AUC
where AUC is the area under curve (Equation (4)):
AUC = 1 k = 1 n ( X k X k 1 ) ( Y k + Y k 1 )
with X denoting the false positive rate and Y the true positive rate.
Similar to the FS process, the classification framework employed a nested 10-fold CV scheme. Specifically, in order to tune SVM’s hyperparameters and select the optimal classification model based on the selected features, the nine initial folds are further split into training and validation sets using an inner new 10-fold CV scheme coupled with a grid search approach. The maximum number of epochs for SVM training is 50 (determined by varying the epoch number from 40 to 60 with a step of 1). The best model (optimal set of hyper-parameters) according to the validation procedure is retrained on the whole 90% of the initial dataset and is tested on the remaining 10%, evaluating the overall performance. The process is repeated for all folds (10 × 10), and the average results on the testing data are presented.
The performance of the classification process is assessed in terms of accuracy, sensitivity, and specificity using the equations:
Accuracy = TP + TN TP + TN + FP + FN
Sensitivity = TP TP + FN
Specificity = TN TN + FP
where TP is true positive, TN is true negative, FP is false positive, and FN is false negative.

3. Results

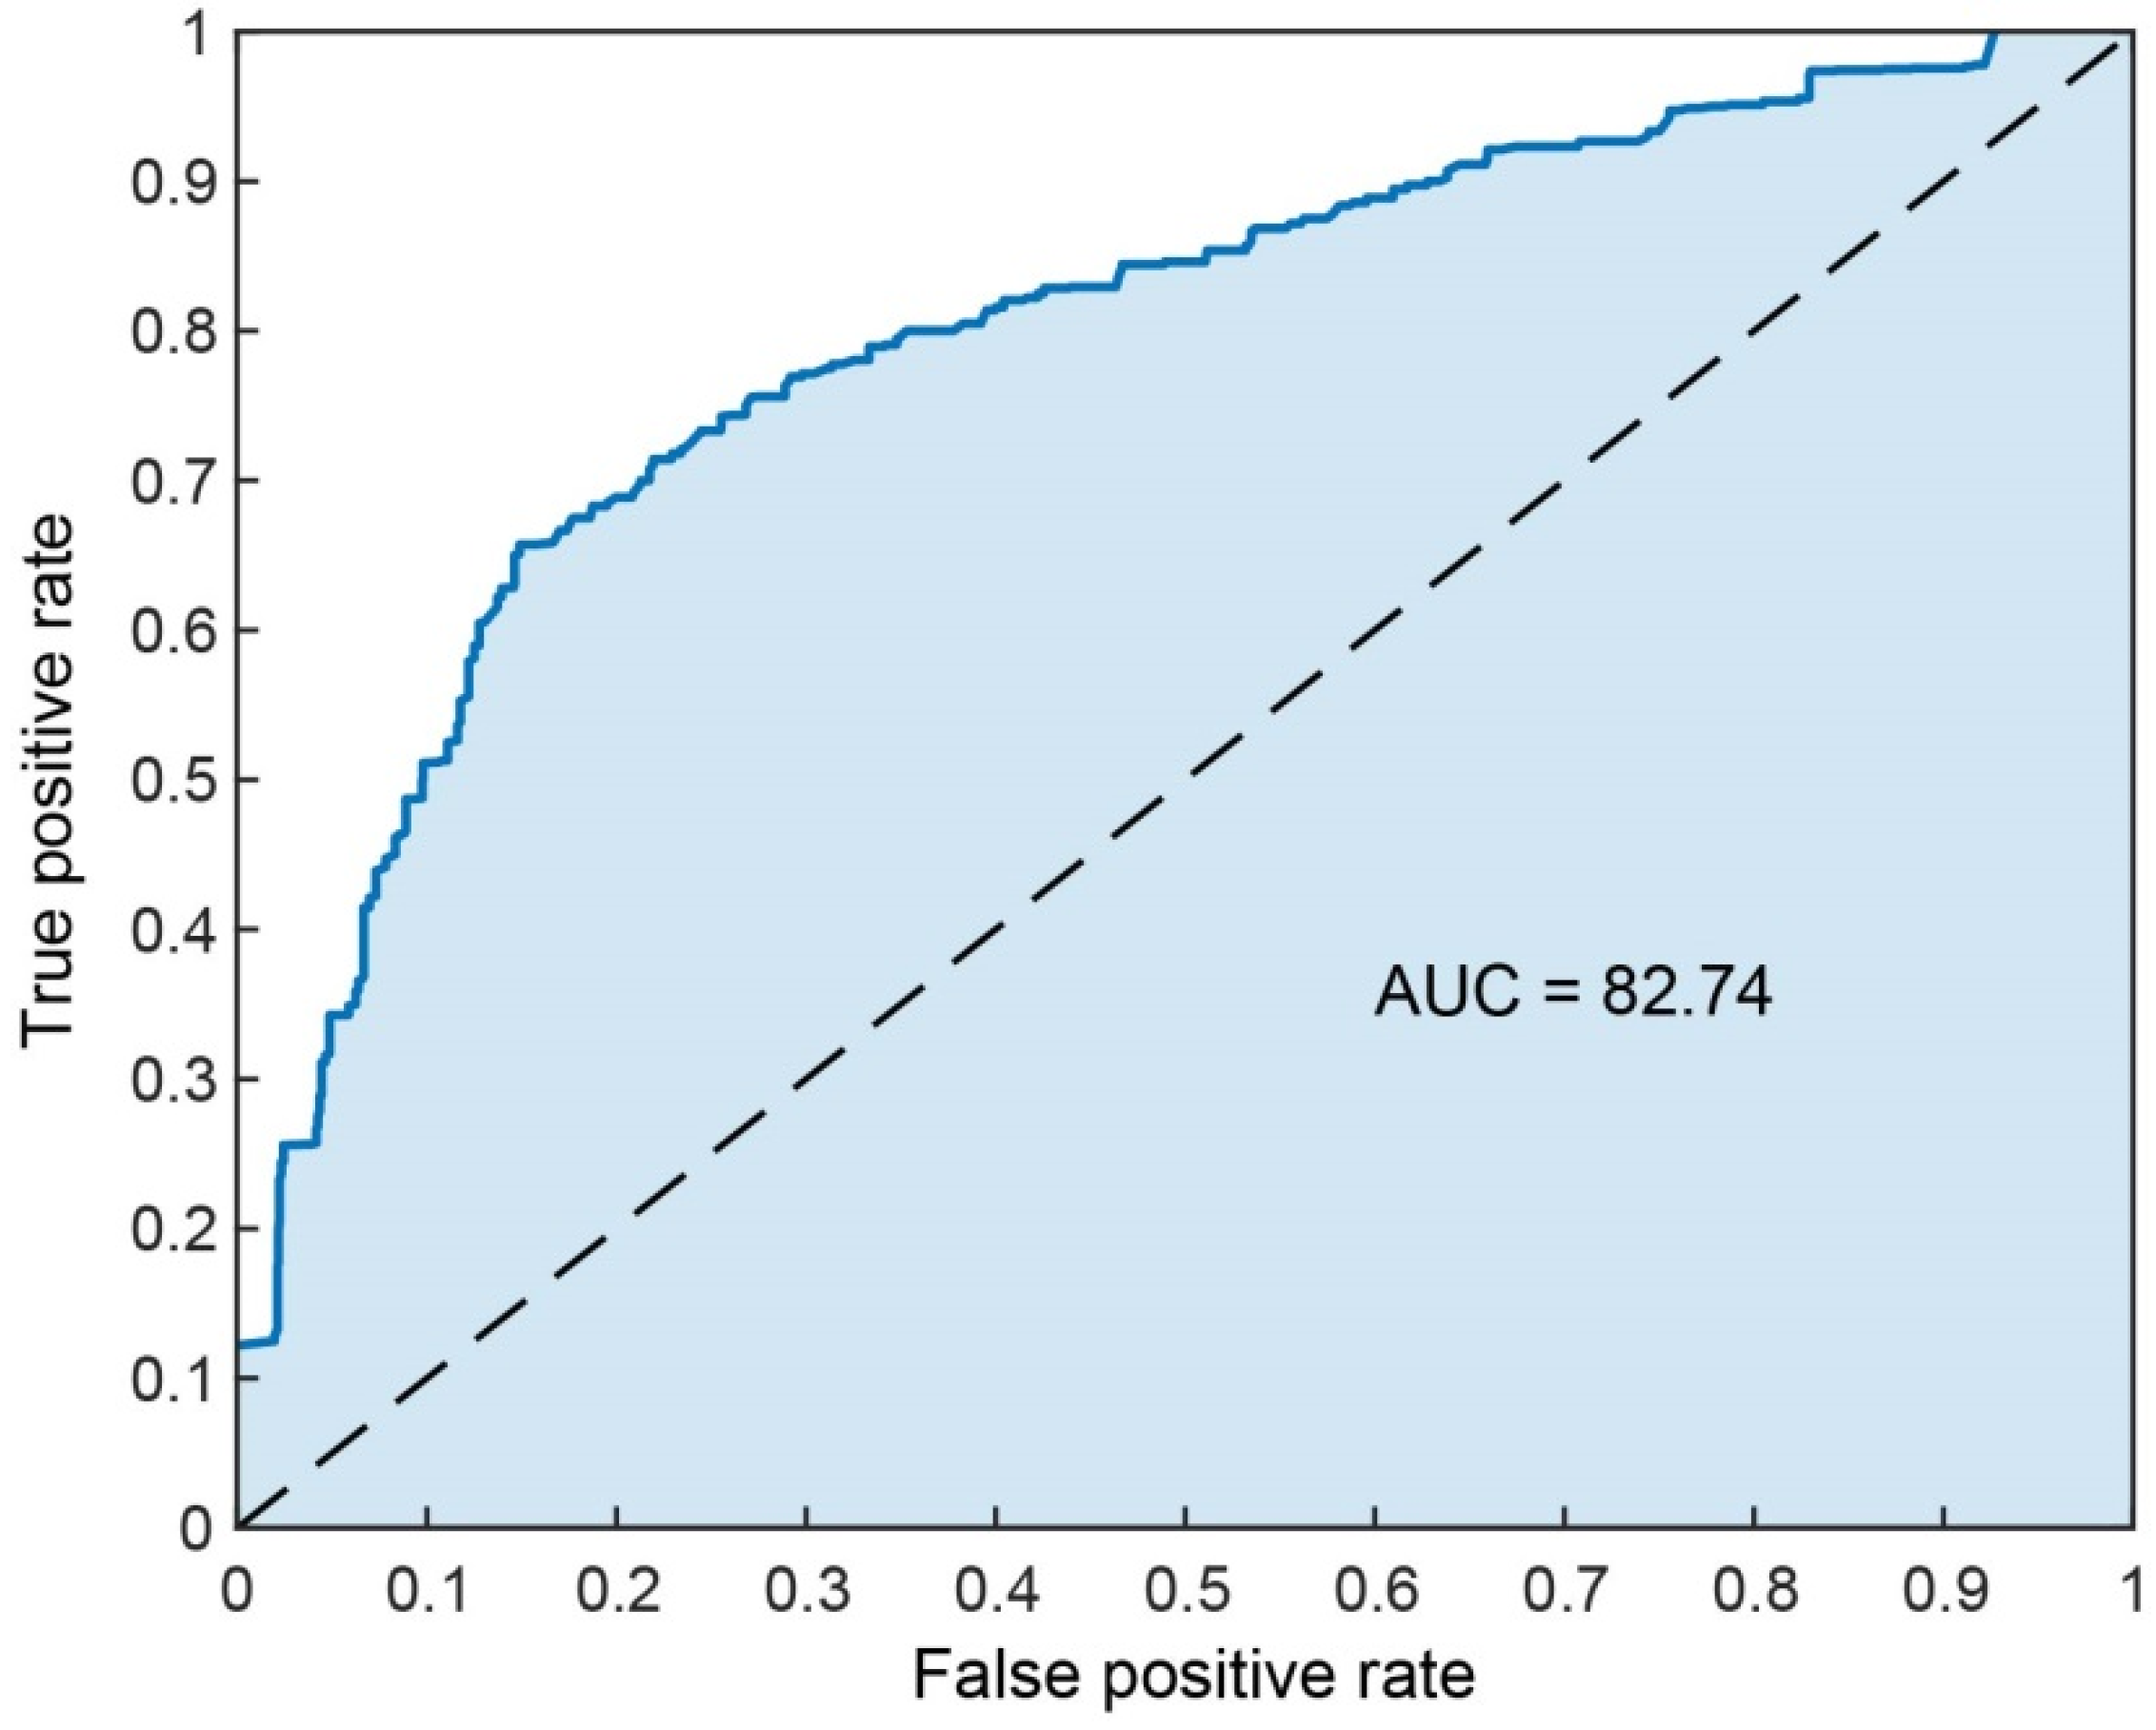
3.1. Classification Performance Results

In this study, the ABIDE I pre-processed dataset was utilized within an FS and classification framework aiming for the automatic classification of ASD and TD subjects, while investigating potential discriminative biomarkers.
The optimal performance was obtained when employing 136 features yielding 76.63% accuracy, 78.63% sensitivity, 74.27% specificity, and 82.74% AUC. The discrimination ability of the classification model is presented by the receiver operating characteristic (ROC) curve in Figure 2. The small number of discriminative features (comparatively to the number of instances) included in the produced feature subset also suggests that overfitting was avoided. Considering the 4:1 ratio among females and males, gender was also investigated as a potential biomarker; however, it resulted in inferior performance compared to the framework proposed in this study.
From the selected 136 features, the majority included dFC characteristics (47 and 45 out of the 136 total features for mean dFC and variance dFC, respectively), with sFC incorporating 43 (out of the 136) features (Figure 3). Interestingly, from the non-biological attributes, only one was selected, namely the echo time (TE), while demographics, motion, and the rest of the acquisition features (FOV, voxel size, and repetition time) were excluded from the optimal feature subset. In this regard, an additional analysis of FS excluding the aforementioned features took place (the results and implications of which are presented in the Supplementary Material), although it failed to produce any increment to the overall performance.

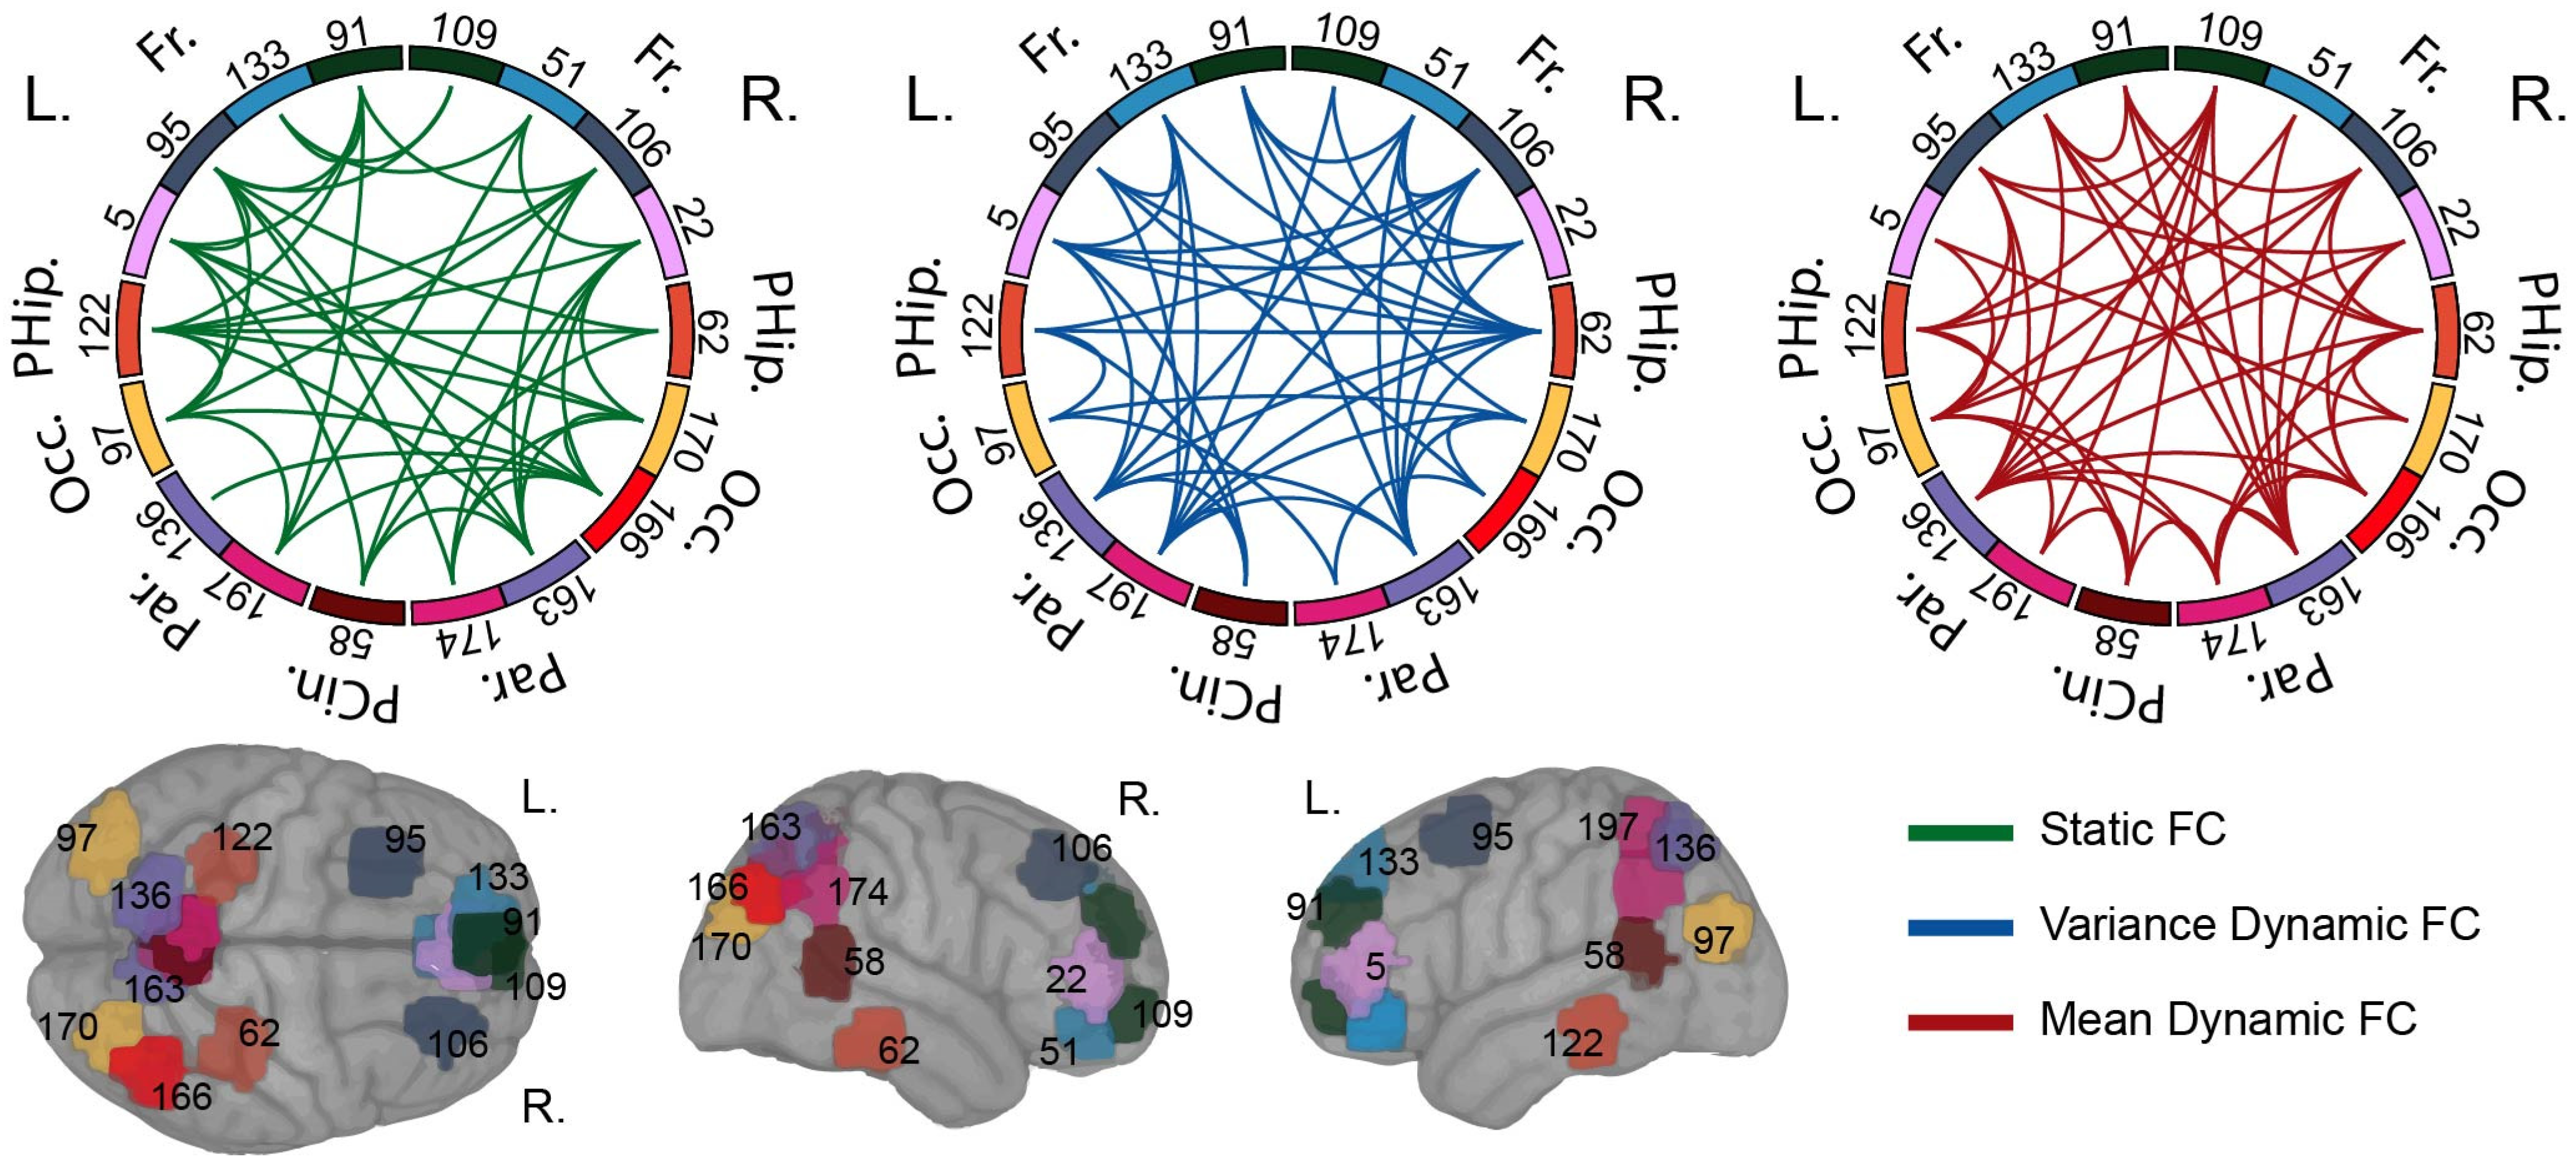
3.2. Analysis of Selected Biomarkers

As mentioned above, feature extraction included the calculation of dFC and sFC, demographic information, acquisition, and movement parameter features, producing the initial set that was subsequently fed to the FS and SVM classification framework. According to the proposed approach, the feature subset (136 features) that attained the optimal performance was composed almost entirely (135 out of 136 features) of FC features (sFC, mean dFC and variance dFC) (Figure 3). From the overall 135 FC features, no clear trend could be detected regarding inter- or intra-hemispheric connections.
Regarding the sFC from the total of 43 interconnected pairs, the DMN region that appears to be mostly involved as a discriminative feature is the right angular (code region 166), involved in seven connections. In addition, the left frontal area (code region 95), right parietal lobule (code region 163), right middle occipital gyrus (code region 170), and middle frontal area (code region 91) are engaged in six connections, while the left parahippocampal gyrus (code region 122) is included in five edges among the DMN areas. In relation to the mean dFC (47 connections), the majority of the features implicate the parietal lobule, with nine pairs including the right (code region 163) and eight its counterpart left (code region 136) region. The right parahippocampal gyrus (code region 62) and middle frontal (code region 109) also demonstrate a high inclusion rate with regard to the optimal feature set, being incorporated in seven and six connections, respectively. The selected variance dFC features (45 total connectivity edges) predominantly include the right parahippocampal gyrus (code region 62) with 10 overall pairs and a smaller number of connections deriving from the bilateral parietal lobules (code regions 163/136), with eight connections involving the right and six the left brain areas. Moreover, the inferior parietal lobule (code region 197) also presents a significant inclusion ratio with eight connections added to the optimal feature subset.
As to the features that correspond to common connections between the sFC, mean dFC, and variance dFC, the subset exhibits five interconnected pairs: left middle occipital gyrus–left parahippocampal gyrus (code regions 97–122), middle frontal–left parahippocampal gyrus (code regions 106–122), precuneus–right angular (code regions 174–166), right parietal lobule–right cingulum anterior (code regions 163–22), and right parietal lobule–middle frontal area (code regions 163–106).

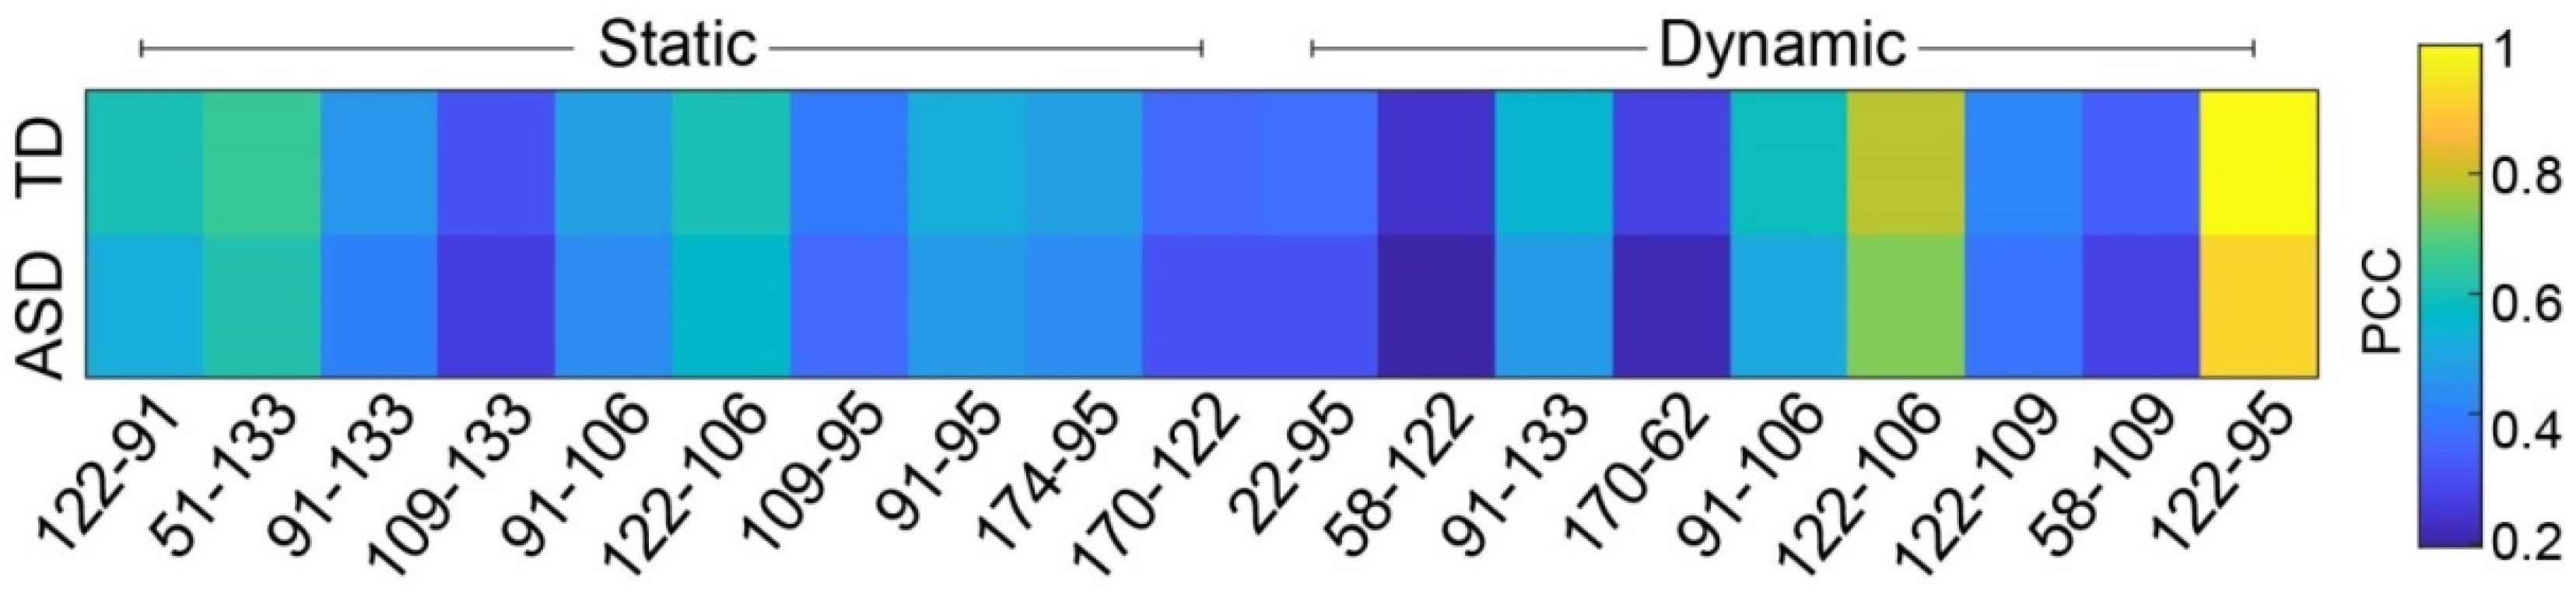
3.3. Functional Connectivity Features Validation

In order to further investigate the selected features in terms of feature value alterations, a post hoc Wilcoxon test was performed to indicate significant deviations between the ASD and TD groups (significance level set to 0.05). As such, 19 features presented significant differences (p-value < 0.05). Interestingly, all the resulting features included sFC and mean dFC, while no important distinction could be discerned in variance dFC values. These included frontal and occipital areas, the paracingulate, and the precuneus region, as well as the bilateral parahippocampal gyrus (Figure 4).
In detail, sFC connections incorporated six pairs implicating frontal areas and one pair involving the precuneus and the middle occipital gyrus. On the contrary, the Wilcoxon test demonstrated mean dFC significant variations in eight connections in frontal areas, five in the parahippocampal gyrus, two in the paracingulate region, and one pair involving the right middle occipital gyrus. Although the importance of the common connections between the FC features was additionally verified by the statistical test, it is noteworthy that in all 19 connections, the Pearson correlation coefficient exhibited a significant increment from TD to ASD indicating autism-related over-connectivity patterns.

3.4. Evaluation of the Adopted Framework and Relationship to Prior Work

As indicated in the previous sections, in order to validate the discriminative ability of the various biological and non-biological biomarkers, we applied an FS and classification scheme and assessed the classification performance. From this standpoint, few recent studies (after 2017) have employed the CC200 parcellation scheme in the ABIDE I dataset along with an SVM classifier. In this context, a quantitative comparison of the proposed approach with the highest (CC200 parcellation) SVM classification performance recent works is provided in Table 2.
The proposed framework provided higher performance compared to related studies, with the difference in classification accuracy ranging from 4.13% up to 11.65%. All the studies have utilized physiological FC features, with the exception of [42] that has also utilized sex, age, and IQs. Furthermore, most works utilize only sFC features; although, in our previous analysis [26], we additionally incorporated texture features to identify biological variables that might affect ASD identification, in an image-related analysis of the BOLD signals. On the contrary, in the proposed approach, we employ a more sophisticated method, by combining static and dynamic connectivity fused with non-physiological characteristics to investigate their associations towards automated autism detection. Although the current approach did in fact exclude non-physiological variables, it illustrates the potential for acquisition parameters to be included as additional indicators in inhomogeneous groups (i.e., data from different clinics, protocols, and experimental designs).

4. Discussion

In this study, we aim to assess the biological and non-biological biomarkers and utilize them in a data-driven machine learning framework to differentiate between ASD and TD individuals. On this premise, a diverse set of descriptive features was calculated employing FC, demographics, acquisition, and motion-related features to identify possible biomarkers by exploiting the FS and classification methodological characteristics, highlighting the attributes that exhibited the most discriminative power. More importantly, the dataset incorporated a heterogeneous approach with no exclusion criteria (regarding the clinical site, age, sex, handedness, or IQ scores), thus providing a more global and objective indication of the features diagnostic quality. Our results suggest FC as a predominant autism-related indicator, displaying over-connectivity properties in ASD, while the interpretation and implications of the corresponding brain regions are discussed in detail below.

4.1. Classification Performance

Although various recent studies have utilized parts of the ABIDE I dataset in various machine learning paradigms, the discrepancy between the data employed makes the identification of the optimal methodological approach unclear. In this regard, comparison and/or evaluation of classification performance works cannot be definitely quantified due to the divergent information included in each study and it is beyond the scope of this paper. However, the nature of the employed features in similar methodological procedures enables an indicative comparison. As such, the framework that was employed in this work utilized a linear SVM classifier as the base for both classification and FS (applied as an internal procedure by the RFE-CBR) along with a 10-fold nested CV strategy and Bayesian optimization, resulting in 76.63% accuracy, 78.42% sensitivity, 74.27% specificity and 82.74% AUC.
To the best of our knowledge, this is the highest performance achieved so far when incorporating the whole CC200 parcellation ABIDE I dataset with an SVM adaptation (Table 2). Of note is that several other studies have achieved high accuracy levels with other brain atlases (such as the AAL, HO, or Craddock CC400); however, our selection of brain parcellation scheme was based on the fact the CC200 atlas is deemed to provide superior results, especially in whole-ABIDE/SVM applications [41,43,44]. In parallel, different machine learning methods have demonstrated exceptional performance (mostly with deep learning structures) [45]. Nevertheless, since our goal was to obtain information concerning important autism biomarkers, SVM models are considered ideal for comprehensive interpretation, effectively assessing the relation between class labels and features. On the contrary, deep learning approaches (such as artificial neural networks) diffuse the feature-contained information in a manner that is extremely difficult to define, sometimes missing the global picture [46].
Another important aspect to be taken into consideration is the number of data integrated in the machine learning initial set. By definition, excessive exclusion criteria can not only provide a homogenous group for subsequent classification processes, but also contribute to high performance leading to the effectiveness of the methods employed [47]. Howbeit, utilizing a small portion of the overall samples could disregard the inhomogeneous traits of autism-related attributes, thus overlooking the global aspects of ASD. On the other hand, inclusion of all subjects might have an impact on feature calculation (i.e., inaccurate FC due to high noise levels from head movement) [28]. As such, the dataset included in the proposed framework comprised of as much data as possible presuming that samples from distinct clinics and acquisition protocols could be utilized in the same training sample without issues (with exclusion criteria being individuals whose average movement was less than 0.2 mm during acquisition). On this premise, the framework analysis incorporated data despite age and gender characteristics, creating an overall training model under our hypothesis of the existance of universal ASD properties. In this regard, obtaining a model from smaller datasets would provide us with a less divergent model, which would undermine the detection of global biomarkers. Moreover, the fact that the overall machine learning design obtained high classification accuracy by employing a small feature subset implies that overfitting was avoided, while the overall procedures were able to construct an objective and unbiased model [35].

4.2. Informative Biomarkers

The proposed framework incorporated multiple biological and non-biological attributes in order to identify discriminative biomarkers containing autism-related information in a global manner. As such, the selected 136 features included 43 interconnected pairs of sFC, 47 mean dFC, 45 variance FC, and one acquisition parameter. This fact suggests the effectiveness of FC in the context of ASD detection, while at the same time provides indications of the small relevance of non-physiological measurements with regard to ASD classification. However, the addition of the protocol’s attributes of each fMRI magnet acquisition process in the form of the TE feature denotes the use of mixed datasets (with data from various clinics) as an interesting possibility to decipher the global autism substrates regardless of acquisition parameter deviations. From this standpoint, it can be inferred that the employment of the fMRI setup specifications, when mapped to higher dimensions, can augment classification performance with heterogeneous data deriving from different sites, while increasing the sample size and, therefore, generalization.
In regard to the physiological features, FC was estimated for the DMN regions from the CC200 brain parcellation scheme. Although whole-brain analysis would provide an expanded number of FC to incorporate in the FS and classification framework offering additional ASD information, evidence suggests that autism-related regulations are more prominent in the DMN. For instance, in [32], the DMN FC patterns are identified as differentiated in ASD individuals; nevertheless, when whole-brain analysis was conducted, no significant changes could be discerned. This fact along with the higher computational cost of calculating the FC for a plethora of brain regions further promotes the DMN utilization over whole-brain analysis.
Pertaining to the selected FC features, dFC was involved in almost 2/3 (90 out of 136) of all the incorporated feature vectors, denoting distinct states as a relation of time-variable brain activation. In fact, several studies also demonstrate the efficiency of dynamic connectivity in comparison to stationary brain dynamics, suggesting that dynamic analysis can provide evidence about smaller nodes activation (concealed in the stationary analysis) and revealing hidden information of the way the various illnesses can regulate brain-related mechanisms [33,48].
Concerning specific connectivity notes, our results indicate several DMN areas as potential biomarkers for autism detection. In detail, the frontal medial cortex has been associated to the individuals’ emotional state [49,50], while the paracingulate is linked to reality monitoring and emotion processing [51,52]. Since ASD individuals typically demonstrate socio-emotional difficulties and/or social withdrawal [53], FC implicating the aforementioned brain regions is expected. In a similar manner, ASD display atypical relational memory processes [54], corroborating our findings with regard to FC edges implicating the parahippocampal gyrus (related to relational encoding [55,56]) and the precuneus (involved in environmental perception, cue reactivity, and episodic memory retrieval [57]). Moreover, our results indicate the occipital areas as important biomarkers for autism detection. This is supported by other relevant studies, linking occipital regions with categorization/organization of various information, as well as with face recognition [58,59], of which deficits are consistently reported in ASD [60]. Further analysis was performed by employing a Wilcoxon test in the selected features. In this light, most features did not display statistically significant differences between the ASD and TD groups, which can be attributed to subject variability, acquisition protocol, etc.
From the overall of 136 features, 19 demonstrated significant divergence between the two groups. Remarkably, all features consisted of sFC and mean dFC with a clear overall trend of an increasing Pearson correlation coefficient from TD to ASD. This is in line with several other autism-related studies, exhibiting over-connectivity in ASD [8,13,61,62], although the deviations of the different relevant works suggest that ASD condition has varying FC patterns [63,64]. On the same direction, both hyper- and hypo-synchrony have been reported in ASD individuals relative to different frequency oscillations and distinct brain regions. For instance, alpha band hypo-synchrony has been related to the social processing brain areas, while hyper-synchrony has been observed in theta band, particularly in temporal–occipital circuits [65] and right anterior brain region [66]. This was also present in non-human subjects, with the relationship of imbalanced excitatory (hyper-synchrony) and inhibitory (hypo-synchrony) behavior being indicated as part of the pathophysiological mechanisms underlying in ASD [67,68].
Taking this into consideration, it can be inferred that the DMN functional connections provide an effective approach to assess the interactions among the different brain areas in ASD. Moreover, the incorporation of dynamic connectivity patterns alludes to non-stationary autism-related traits that can enhance ASD comprehension and diagnosis. Towards this direction, we intend to extend this work in the future, investigating the multiple dynamic (and stationary) characteristics of ASD (as well as age- and gender-related subdivisions of the dataset) and their implications in neuroscience.

5. Conclusions

In this study, we employ a machine learning approach to discriminate between heterogeneous ASD and TD groups incorporating 871 individuals from the ABIDE I dataset. On this premise, we utilize non-biological information (demographics, acquisition, and motion-related features) combined with FC features calculated on the Craddock (CC200) brain parcellation DMN regions. The feature selection and classification framework applied was able to attain 76.63% classification accuracy (the highest to the best of our knowledge with an SVM classifier) using a small number of informative characteristics. More importantly, the subsequent analysis on the selected feature subset provides insights as to the effectiveness of the biomarkers adopted, assessing their relevance to autism-related aspects. Within this context, FC (static and dynamic) was indicated as the predominant attribute, displaying higher discriminative power, while suggesting that the informational flow between the different brain regions has divergent stationary and dynamic properties between the two groups. Moreover, the magnets’ acquisition parameters illustrate the potential of inhomogeneous data sample incorporation (i.e., data from different sites with different acquisition hardware), allowing for a more generalized and universal classification model construction.

Supplementary Materials

Further exploration concerning the appropriate feature vector is provided in the supplementary material, online at https://0-www-mdpi-com.brum.beds.ac.uk/article/10.3390/app11136216/s1.

Author Contributions

Conceptualization, A.S.K. and A.D.S.; methodology, A.S.K., A.D.S., and V.C.K.; software, A.S.K. and A.D.S.; validation, A.S.K., V.C.K., I.K., and G.K.M.; formal analysis, A.S.K.; investigation, A.S.K.; resources, G.K.M.; data curation, A.S.K. and A.D.S.; writing—original draft preparation, A.S.K.; writing—review and editing, A.D.S., V.C.K., I.K., and G.K.M.; visualization, I.K.; supervision, G.K.M.; project administration, G.K.M. All authors have read and agreed to the published version of the manuscript.

Funding

This research received no external funding.

Institutional Review Board Statement

Not applicable.

Informed Consent Statement

Not applicable.

Data Availability Statement

The data employed in the current study, were derived from the 17 clinics of the ABIDE I consortium, which is publicly available [16]. More specifically, pre-processed data are available in [29] for the Craddock atlas (CC200), among others.

Conflicts of Interest

The authors declare no conflict of interest.

References

  1. American Psychiatric Association. Diagnostic and Statistical Manual of Mental Disorders, 5th ed.; American Psychiatric Association: Arlington, VA, USA, 2013. [Google Scholar]
  2. Kasari, C. Are we there yet? The state of early prediction and intervention in autism spectrum disorder. J. Am. Acad. Child Adolesc. Psychiatry 2014, 53, 133–134. [Google Scholar] [CrossRef] [Green Version]
  3. Shen, M.D.; Piven, J. Brain and behavior development in autism from birth through infancy. Dialog-Clin. Neurosci. 2017, 19, 325–333. [Google Scholar]
  4. Ha, S.; Sohn, I.-J.; Kim, N.; Sim, H.J.; Cheon, K.-A. Characteristics of Brains in Autism Spectrum Disorder: Structure, Function and Connectivity across the Lifespan. Exp. Neurobiol. 2015, 24, 273–284. [Google Scholar] [CrossRef] [PubMed] [Green Version]
  5. Im, W.Y.; Ha, J.H.; Kim, E.J.; Cheon, K.-A.; Cho, J.; Song, D.-H. Impaired White Matter Integrity and Social Cognition in High-Function Autism: Diffusion Tensor Imaging Study. Psychiatry Investig. 2018, 15, 292–299. [Google Scholar] [CrossRef] [PubMed] [Green Version]
  6. Lange, N.; Travers, B.G.; Bigler, E.D.; Prigge, M.B.; Froehlich, A.L.; Nielsen, J.A.; Cariello, A.N.; Zielinski, B.A.; Anderson, J.S.; Fletcher, P.T.; et al. Longitudinal Volumetric Brain Changes in Autism Spectrum Disorder Ages 6-35 Years. Autism Res. 2015, 8, 82–93. [Google Scholar] [CrossRef]
  7. Friston, K.J. Functional and Effective Connectivity: A Review. Brain Connect. 2011, 1, 13–36. [Google Scholar] [CrossRef]
  8. Abbott, A.E.; Nair, A.; Keown, C.L.; Datko, M.; Jahedi, A.; Fishman, I.; Müller, R.-A. Patterns of Atypical Functional Connectivity and Behavioral Links in Autism Differ Between Default, Salience, and Executive Networks. Cereb. Cortex 2016, 26, 4034–4045. [Google Scholar] [CrossRef]
  9. Rolls, E.T.; Zhou, Y.; Cheng, W.; Gilson, M.; Deco, G.; Feng, J. Effective connectivity in autism. Autism Res. 2019, 13, 32–44. [Google Scholar] [CrossRef] [Green Version]
  10. Jung, M.; Kosaka, H.; Saito, D.N.; Ishitobi, M.; Morita, T.; Inohara, K.; Asano, M.; Arai, S.; Munesue, T.; Tomoda, A.; et al. Default mode network in young male adults with autism spectrum disorder: Relationship with autism spectrum traits. Mol. Autism 2014, 5, 35. [Google Scholar] [CrossRef] [Green Version]
  11. Hyatt, C.J.; Calhoun, V.D.; Pittman, B.; Corbera, S.; Bell, M.D.; Rabany, L.; Pelphrey, K.; Pearlson, G.D.; Assaf, M. Default mode network modulation by mentalizing in young adults with autism spectrum disorder or schizophrenia. NeuroImage Clin. 2020, 27, 102343. [Google Scholar] [CrossRef]
  12. Nair, A.; Jolliffe, M.; Lograsso, Y.S.S.; Bearden, C.E. A Review of Default Mode Network Connectivity and Its Association with Social Cognition in Adolescents with Autism Spectrum Disorder and Early-Onset Psychosis. Front. Psychiatry 2020, 11, 614. [Google Scholar] [CrossRef]
  13. Neufeld, J.; Kuja-Halkola, R.; Mevel, K.; Cauvet, É.; Fransson, P.; Bölte, S. Alterations in resting state connectivity along the autism trait continuum: A twin study. Mol. Psychiatry 2017, 23, 1659–1665. [Google Scholar] [CrossRef]
  14. Janardhanan, P.; Heena, L.; Sabika, F. Effectiveness of Support Vector Machines in Medical Data mining. J. Commun. Softw. Syst. 2015, 11, 25–30. [Google Scholar] [CrossRef]
  15. Shahid, N.; Rappon, T.; Berta, W. Applications of artificial neural networks in health care organizational decision-making: A scoping review. PLoS ONE 2019, 14, e0212356. [Google Scholar] [CrossRef] [PubMed]
  16. Di Martino, A.; Yan, C.-G.; Li, Q.; Denio, E.; Castellanos, F.; Alaerts, K.; Anderson, J.S.; Assaf, M.; Bookheimer, S.Y.; Dapretto, M.; et al. The autism brain imaging data exchange: Towards a large-scale evaluation of the intrinsic brain architecture in autism. Mol. Psychiatry 2014, 19, 659–667. [Google Scholar] [CrossRef] [PubMed]
  17. Plitt, M.; Barnes, K.A.; Martin, A. Functional connectivity classification of autism identifies highly predictive brain features but falls short of biomarker standards. NeuroImage Clin. 2015, 7, 359–366. [Google Scholar] [CrossRef] [Green Version]
  18. Chen, C.P.; Keown, C.L.; Jahedi, A.; Nair, A.; Pflieger, M.E.; Bailey, B.A.; Müller, R.-A. Diagnostic classification of intrinsic functional connectivity highlights somatosensory, default mode, and visual regions in autism. NeuroImage Clin. 2015, 8, 238–245. [Google Scholar] [CrossRef] [PubMed] [Green Version]
  19. Wang, C.; Xiao, Z.; Wu, J. Functional connectivity-based classification of autism and control using SVM-RFECV on rs-fMRI data. Phys. Med. 2019, 65, 99–105. [Google Scholar] [CrossRef] [PubMed]
  20. Aghdam, M.A.; Sharifi, A.; Pedram, M.M. Diagnosis of Autism Spectrum Disorders in Young Children Based on Resting-State Functional Magnetic Resonance Imaging Data Using Convolutional Neural Networks. J. Digit. Imaging 2019, 32, 899–918. [Google Scholar] [CrossRef]
  21. Sherkatghanad, Z.; Akhondzadeh, M.; Salari, S.; Zomorodi-Moghadam, M.; Abdar, M.; Acharya, U.R.; Khosrowabadi, R.; Salari, V. Automated Detection of Autism Spectrum Disorder Using a Convolutional Neural Network. Front. Neurosci. 2020, 13, 1325. [Google Scholar] [CrossRef] [Green Version]
  22. Abraham, A.; Milham, M.P.; Di Martino, A.; Craddock, R.C.; Samaras, D.; Thirion, B.; Varoquaux, G. Deriving reproducible biomarkers from multi-site resting-state data: An Autism-based example. NeuroImage 2017, 147, 736–745. [Google Scholar] [CrossRef] [Green Version]
  23. Parisot, S.; Ktena, S.I.; Ferrante, E.; Lee, M.; Guerrero, R.; Glocker, B.; Rueckert, D. Disease prediction using graph convolutional networks: Application to Autism Spectrum Disorder and Alzheimer’s disease. Med. Image Anal. 2018, 48, 117–130. [Google Scholar] [CrossRef] [PubMed] [Green Version]
  24. Heinsfeld, A.S.; Franco, A.R.; Craddock, R.C.; Buchweitz, A.; Meneguzzi, F. Identification of autism spectrum disorder using deep learning and the ABIDE dataset. NeuroImage Clin. 2018, 17, 16–23. [Google Scholar] [CrossRef] [PubMed]
  25. Epalle, T.M.; Song, Y.; Liu, Z.; Lu, H. Multi-atlas classification of autism spectrum disorder with hinge loss trained deep architectures: ABIDE I results. Appl. Soft Comput. 2021, 107, 107375. [Google Scholar] [CrossRef]
  26. Karampasi, A.; Kakkos, I.; Miloulis, S.-T.; Zorzos, I.; Dimitrakopoulos, G.N.; Gkiatis, K.; Asvestas, P.; Matsopoulos, G. A Machine Learning fMRI Approach in the Diagnosis of Autism. In Proceedings of the 2020 IEEE International Conference on Big Data (Big Data), Atlanta, GA, USA, 10–13 December 2020; Institute of Electrical and Electronics Engineers (IEEE): Piscataway, NJ, USA, 2020; pp. 3628–3631. [Google Scholar]
  27. Cameron, C.; Sharad, S.; Brian, C.; Ranjeet, K.; Satrajit, G.; Chaogan, Y.; Qingyang, L.; Daniel, L.; Joshua, V.; Randal, B.; et al. Towards Automated Analysis of Connectomes: The Configurable Pipeline for the Analysis of Connectomes (C-PAC). Front. Aging Neurosci. 2013, 42, 3310–3389. [Google Scholar] [CrossRef]
  28. Power, J.D.; Barnes, K.A.; Snyder, A.Z.; Schlaggar, B.L.; Petersen, S.E. Spurious but systematic correlations in functional connectivity MRI networks arise from subject motion. NeuroImage 2012, 59, 2142–2154. [Google Scholar] [CrossRef] [PubMed] [Green Version]
  29. ABIDE Preprocessed. Available online: http://preprocessed-connectomes-project.org/abide/cpac.html (accessed on 3 July 2021).
  30. Smith, S.M.; Fox, P.; Miller, K.; Glahn, D.C.; Mackay, C.; Filippini, N.; Watkins, K.E.; Toro, R.; Laird, A.R.; Beckmann, C.F. Correspondence of the brain’s functional architecture during activation and rest. Proc. Natl. Acad. Sci. USA 2009, 106, 13040–13045. [Google Scholar] [CrossRef] [Green Version]
  31. Shirer, W.R.; Ryali, S.; Rykhlevskaia, E.; Menon, V.; Greicius, M.D. Decoding Subject-Driven Cognitive States with Whole-Brain Connectivity Patterns. Cereb. Cortex 2011, 22, 158–165. [Google Scholar] [CrossRef] [PubMed]
  32. Harlalka, V.; Bapi, R.S.; Vinod, P.K.; Roy, D. Atypical Flexibility in Dynamic Functional Connectivity Quantifies the Severity in Autism Spectrum Disorder. Front. Hum. Neurosci. 2019, 13, 6. [Google Scholar] [CrossRef] [Green Version]
  33. Preti, M.G.; Bolton, T.W.A.; Van De Ville, D. The dynamic functional connectome: State-of-the-art and perspectives. NeuroImage 2017, 160, 41–54. [Google Scholar] [CrossRef]
  34. Savva, A.D.; Karampasi, A.S.; Matsopoulos, G.K. Chapter 6-Deriving Resting-State fMRI Biomarkers for Classification of Autism Spectrum Disorder. In Autism 360°; Das, U., Papaneophytou, N., El-Kour, T., Eds.; Academic Press: Amsterdam, The Netherlands, 2020; pp. 101–123. ISBN 978-0-12-818466-0. [Google Scholar]
  35. Ambroise, C.; McLachlan, G.J. Selection bias in gene extraction on the basis of microarray gene-expression data. Proc. Natl. Acad. Sci. USA 2002, 99, 6562–6566. [Google Scholar] [CrossRef] [Green Version]
  36. Yan, K.; Zhang, D. Feature selection and analysis on correlated gas sensor data with recursive feature elimination. Sens. Actuators B Chem. 2015, 212, 353–363. [Google Scholar] [CrossRef]
  37. Kakkos, I.; Dimitrakopoulos, G.N.; Gao, L.; Zhang, Y.; Qi, P.; Matsopoulos, G.K.; Thakor, N.; Bezerianos, A.; Sun, Y. Mental Workload Drives Different Reorganizations of Functional Cortical Connectivity Between 2D and 3D Simulated Flight Experiments. IEEE Trans. Neural Syst. Rehabil. Eng. 2019, 27, 1704–1713. [Google Scholar] [CrossRef] [PubMed]
  38. Burges, C.J. A Tutorial on Support Vector Machines for Pattern Recognition. Data Min. Knowl. Discov. 1998, 2, 121–167. [Google Scholar] [CrossRef]
  39. Ariafar, S.; Coll-Font, J.; Brooks, D.; Dy, J. ADMMBO: Bayesian Optimization with Unknown Constraints using ADMM. J. Mach. Learn. Res. 2019, 20, 20. [Google Scholar]
  40. Eslami, T.; Mirjalili, V.; Fong, A.; Laird, A.R.; Saeed, F. ASD-DiagNet: A Hybrid Learning Approach for Detection of Autism Spectrum Disorder Using fMRI Data. Front. Aging Neurosci. 2019, 13, 70. [Google Scholar] [CrossRef] [PubMed]
  41. Kunda, M.; Zhou, S.; Gong, G.; Lu, H. Improving Multi-Site Autism Classification Based on Site-Dependence Minimisation and Second-Order Functional Connectivity. bioRxiv 2020, 2, 930073. [Google Scholar] [CrossRef] [Green Version]
  42. Niu, K.; Guo, J.; Pan, Y.; Gao, X.; Peng, X.; Li, N.; Li, H. Multichannel Deep Attention Neural Networks for the Classification of Autism Spectrum Disorder Using Neuroimaging and Personal Characteristic Data. Complexity 2020, 2020, 1–9. [Google Scholar] [CrossRef]
  43. Liu, Y.; Xu, L.; Li, J.; Yu, J.Y.A.X.; Yu, X. Attentional Connectivity-based Prediction of Autism Using Heterogeneous rs-fMRI Data from CC200 Atlas. Exp. Neurobiol. 2020, 29, 27–37. [Google Scholar] [CrossRef] [PubMed] [Green Version]
  44. Yang, X.; Islam, M.S.; Khaled, A.M.A. Functional connectivity magnetic resonance imaging classification of autism spectrum disorder using the multisite ABIDE dataset. In Proceedings of the 2019 IEEE EMBS International Conference on Biomedical & Health Informatics (BHI), Hong Kong, China, 5–7 January 2012; Institute of Electrical and Electronics Engineers (IEEE): Piscataway, NJ, USA, 2019; pp. 1–4. [Google Scholar]
  45. Wang, C.; Xiao, Z.; Wang, B.; Wu, J. Identification of Autism Based on SVM-RFE and Stacked Sparse Auto-Encoder. IEEE Access 2019, 7, 118030–118036. [Google Scholar] [CrossRef]
  46. Min, S.; Lee, B.; Yoon, S. Deep learning in bioinformatics. Brief. Bioinform. 2016, 18, bbw068–869. [Google Scholar] [CrossRef] [PubMed] [Green Version]
  47. Kazeminejad, A.; Sotero, R.C. Topological Properties of Resting-State fMRI Functional Networks Improve Machine Learning-Based Autism Classification. Front. Neurosci. 2019, 12, 1018. [Google Scholar] [CrossRef] [PubMed]
  48. Kiviniemi, V.; Vire, T.; Remes, J.; Elseoud, A.A.; Starck, T.; Tervonen, O.; Nikkinen, J. A Sliding Time-Window ICA Reveals Spatial Variability of the Default Mode Network in Time. Brain Connect. 2011, 1, 339–347. [Google Scholar] [CrossRef] [PubMed] [Green Version]
  49. Washington, S.D.; Gordon, E.; Brar, J.; Warburton, S.; Sawyer, A.T.; Wolfe, A.; Mease-Ference, E.R.; Girton, L.; Hailu, A.; Mbwana, J.; et al. Dysmaturation of the default mode network in autism. Hum. Brain Mapp. 2014, 35, 1284–1296. [Google Scholar] [CrossRef] [PubMed] [Green Version]
  50. Yerys, B.E.; Gordon, E.; Abrams, D.N.; Satterthwaite, T.; Weinblatt, R.; Jankowski, K.F.; Strang, J.; Kenworthy, L.; Gaillard, W.D.; Vaidya, C.J. Default mode network segregation and social deficits in autism spectrum disorder: Evidence from non-medicated children. NeuroImage Clin. 2015, 9, 223–232. [Google Scholar] [CrossRef] [Green Version]
  51. Garrison, J.R.; Fernyhough, C.; McCarthy-Jones, S.; Haggard, M.; Simons, J.S. Paracingulate Sulcus Morphology Is Associated with Hallucinations in the Human Brain. Nat. Commun. 2015, 6, 8956. [Google Scholar] [CrossRef] [PubMed] [Green Version]
  52. Zeuner, K.E.; Sidiropoulos, C. Cognitive behavioral therapy in functional tremor. Neurology 2019, 93, 825–826. [Google Scholar] [CrossRef]
  53. Warrier, V.; Toro, R.; Won, H.; Leblond, C.S.; Cliquet, F.; Delorme, R.; De Witte, W.; Bralten, J.; Chakrabarti, B.; Børglum, A.D.; et al. Social and non-social autism symptoms and trait domains are genetically dissociable. Commun. Biol. 2019, 2, 1–13. [Google Scholar] [CrossRef] [Green Version]
  54. Gaigg, S.B.; Gardiner, J.M.; Bowler, D. Free recall in autism spectrum disorder: The role of relational and item-specific encoding. Neuropsychology 2008, 46, 983–992. [Google Scholar] [CrossRef] [Green Version]
  55. Cooper, R.; Richter, F.R.; Bays, P.M.; Plaisted-Grant, K.C.; Baron-Cohen, S.; Simons, J.S. Reduced Hippocampal Functional Connectivity During Episodic Memory Retrieval in Autism. Cereb. Cortex 2017, 27, 888–902. [Google Scholar] [CrossRef] [Green Version]
  56. Takeuchi, H.; Taki, Y.; Nouchi, R.; Sekiguchi, A.; Kotozaki, Y.; Miyauchi, C.M.; Yokoyama, R.; Iizuka, K.; Hashizume, H.; Nakagawa, S.; et al. Regional gray matter density is associated with achievement motivation: Evidence from voxel-based morphometry. Brain Struct. Funct. 2014, 219, 71–83. [Google Scholar] [CrossRef] [PubMed] [Green Version]
  57. Borsook, D.; Maleki, N.; Burstein, R. Chapter 42-Migraine. In Neurobiology of Brain Disorders; Zigmond, M.J., Rowland, L.P., Coyle, J.T., Eds.; Academic Press: San Diego, CA, USA, 2015; pp. 693–708. ISBN 978-0-12-398270-4. [Google Scholar]
  58. Zhang, B.; He, S.; Weng, X. Localization and Functional Characterization of an Occipital Visual Word form Sensitive Area. Sci. Rep. 2018, 8, 1–11. [Google Scholar] [CrossRef]
  59. Zhen, Z.; Fang, H.; Liu, J. The Hierarchical Brain Network for Face Recognition. PLoS ONE 2013, 8, e59886. [Google Scholar] [CrossRef] [PubMed] [Green Version]
  60. Weigelt, S.; Koldewyn, K.; Kanwisher, N. Face Recognition Deficits in Autism Spectrum Disorders Are Both Domain Specific and Process Specific. PLoS ONE 2013, 8, e74541. [Google Scholar] [CrossRef] [Green Version]
  61. Cerliani, L.; Mennes, M.; Thomas, R.M.; Di Martino, A.; Thioux, M.; Keysers, C. Increased Functional Connectivity between Subcortical and Cortical Resting-State Networks in Autism Spectrum Disorder. JAMA Psychiatry 2015, 72, 767–777. [Google Scholar] [CrossRef]
  62. Chen, H.; Nomi, J.S.; Uddin, L.Q.; Duan, X.; Chen, H. Intrinsic functional connectivity variance and state-specific under-connectivity in autism. Hum. Brain Mapp. 2017, 38, 5740–5755. [Google Scholar] [CrossRef] [Green Version]
  63. Graña, M.; Silva, M. Impact of Machine Learning Pipeline Choices in Autism Prediction from Functional Connectivity Data. Int. J. Neural Syst. 2021, 31, 2150009. [Google Scholar] [CrossRef]
  64. Cheng, W.; Rolls, E.; Gu, H.; Zhang, J.; Feng, J. Autism: Reduced connectivity between cortical areas involved in face expression, theory of mind, and the sense of self. Brain 2015, 138, 1382–1393. [Google Scholar] [CrossRef] [Green Version]
  65. Ghuman, A.S.; Honert, R.N.V.D.; Huppert, T.J.; Wallace, G.; Martin, A. Aberrant Oscillatory Synchrony Is Biased Toward Specific Frequencies and Processing Domains in the Autistic Brain. Biol. Psychiatry Cogn. Neurosci. Neuroimaging 2017, 2, 245–252. [Google Scholar] [CrossRef] [Green Version]
  66. Aykan, S.; Puglia, M.H.; Kalaycıoğlu, C.; Pelphrey, K.A.; Tuncalı, T.; Nalçacı, E. Right Anterior Theta Hypersynchrony as a Quantitative Measure Associated with Autistic Traits and K-Cl Cotransporter KCC2 Polymorphism. J. Autism Dev. Disord. 2021, 1–12. [Google Scholar] [CrossRef]
  67. Arbab, T.; Battaglia, F.P.; Pennartz, C.M.; Bosman, C.A. Abnormal hippocampal theta and gamma hypersynchrony produces network and spike timing disturbances in the Fmr1-KO mouse model of Fragile X syndrome. Neurobiol. Dis. 2018, 114, 65–73. [Google Scholar] [CrossRef] [PubMed]
  68. Kissinger, S.T.; Wu, Q.; Quinn, C.J.; Anderson, A.K.; Pak, A.; Chubykin, A.A. Visual Experience-Dependent Oscillations and Underlying Circuit Connectivity Changes Are Impaired in Fmr1 KO Mice. Cell Rep. 2020, 31, 107486. [Google Scholar] [CrossRef] [PubMed]
Figure 1. The workflow of the proposed approach.
Applsci 11 06216 g001
Figure 2. The receiver operating characteristic (ROC) displaying the classification performance of the proposed framework.
Applsci 11 06216 g002
Figure 3. The discriminative features selected by the FS procedure corresponding to sFC (green), variance dFC (blue), and mean value dFC (red). In the lower part of the figure, the DMN areas are highlighted and denoted based on the CC200 brain atlas region codes; color-coded information of the DMN areas is presented with reference to the ribbon colors in the upper part of the figure.
Applsci 11 06216 g003
Figure 4. Pearson correlation coefficient (PCC) values of the statistically significant FC features (p-value < 0.05). Connectivity pairs are indicated by CC200 brain atlas region codes.
Applsci 11 06216 g004
Table 1. Demographic features.
ASDTD
Handedness334 R/54 L/11 A432 R/32 L/8 A
Age16.4197 F/17.7835 M17.3202 F/14.5929 M
Sex49 F/350 M93 F/379 M
Note: Age denotes the mean value of age for each subgroup; Hand: handedness, L: left handed, R: right handed, A: ambidextrous, F: female, M: male.
Table 2. Classification results of previous studies utilizing the ABIDE I set and the CC200 brain parcellation scheme. The proposed study outperformed the previously reported results and is indicated in bold. Notation: #—number.
ReferenceClassifierData#Total
Features
#Selected FeaturesAccuracy (%)
Proposed WorkRFE-CBR/SVM472 TD/399 ASD47313676.63
Karampasi et al. (2020) [26]RFE/SVM472 TD/399 ASD56111772.5
Heinsfeld et al. (2017) [24]SVM530 TD 505 ASD19,90060065
Eslami et al. (2019) [40]SVM530 TD/505 ASD19,900995068.3
Kunda et al. (2020) [41]SVM530 TD/505 ASD--71
Niu et al. (2020) [42]SVM401 TD/408 ASD19,90519,90269.3
Liu et al. (2020) [43]Extra-Trees/SVM548 TD/506 ASD19,900193572.2
Publisher’s Note: MDPI stays neutral with regard to jurisdictional claims in published maps and institutional affiliations.

