
Real-Time Egress Model for Multiplex Buildings under Fire Based on Artificial Neural Network


1
Department of Architectural Engineering and Smart City Interdisciplinary Major Program, University of Seoul, 163 Seoulsiripdae-ro, Dongdaemun-gu, Seoul 02504, Korea
2
Department of Architectural Engineering, University of Seoul, 163 Seoulsiripdae-ro, Dongdaemun-gu, Seoul 02504, Korea
3
Technology Center/R&D Manager, Dream Structural Engineers Co Ltd., 25 Seongsuilro 4-gil, Seongdong-gu, Seoul 04871, Korea
*
Author to whom correspondence should be addressed.
Appl. Sci. 2021, 11(14), 6337; https://0-doi-org.brum.beds.ac.uk/10.3390/app11146337
Submission received: 16 June 2021
/
Revised: 1 July 2021
/
Accepted: 6 July 2021
/
Published: 8 July 2021
(This article belongs to the Special Issue New Challenges in Civil Structure for Fire Response)
Abstract
:When fire occurs in a large multiplex building, the direction of smoke and flames is often similar to that of the evacuation of building occupants. This causes evacuation bottlenecks in a specific compartment, especially when the occupant density is very high, which unfortunately often leads to many fatalities and injuries. Thus, the development of an egress model that can ensure the safe evacuation of occupants is required to minimize the number of casualties. In this study, the correlations between fire temperature with visibility and toxic gas concentration were investigated through a fire simulation on a multiplex building, from which databases for training of artificial neural networks (ANN) were created. Based on this, an ANN model that can predict the available safe egress time was developed, and it estimated the available safe egress time (ASET) very accurately. In addition, an egress model that can guide rapid and safe evacuation routes for occupants was proposed, and the rationality of the proposed model was verified in detail through an application example. The proposed model provided the optimal evacuation route with the longest margin of safety in consideration of both ASET and the movement time of occupants under fire.
1. Introduction
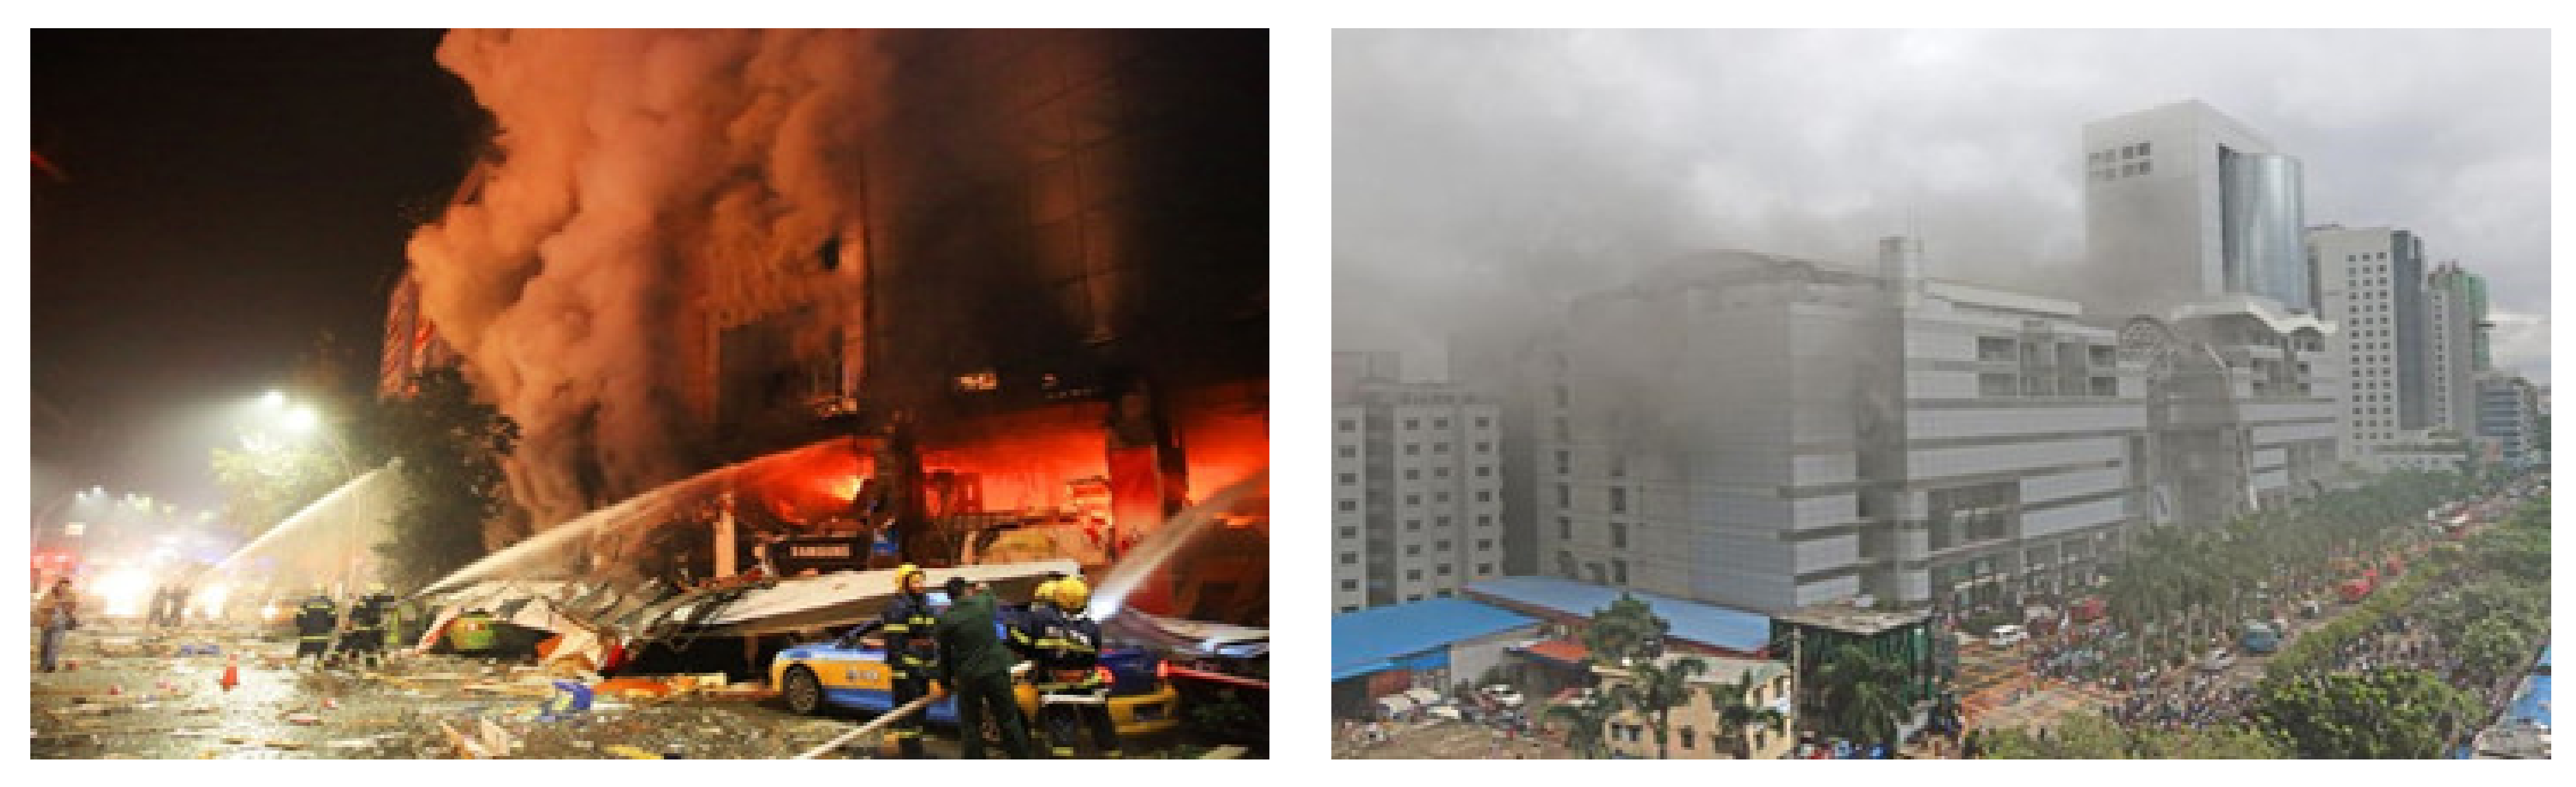
In recent years, the number of fires in multiplex buildings used for various purposes has increased. When a fire occurs in multiplex buildings, as shown in Figure 1, many casualties arise since the direction of smoke and flames is similar to that of the evacuation of occupants [1,2]. The smoke caused by fire drastically reduces the visibility required for the occupants to escape, and this in turn leads to a decrease in the occupant walking speeds and available safe egress time (ASET) [3]. In addition, as the occupant densities are very high in multiplex buildings, bottlenecks may occur in a specific compartment, resulting in a larger number of casualties. Therefore, in order to minimize the number of casualties, it is essential to develop an egress model capable of ensuring the safe evacuation of occupants. At present, however, a fire simulation needs to be conducted to estimate ASET, which is the most important factor for the development of an egress model, and it poses a disadvantage that requires a large amount of time and manpower.
Park et al. [4] proposed standardized fire scenarios to perform quantitative fire risk assessments for high-rise buildings, and Wahyu et al. [5] conducted a fire simulation on a 20-story apartment building to derive the temperature and concentrations of toxic gases in each compartment, and evaluated the ASET. Based on the simulation results, they reported that as the temperatures rise, the heat can have a life-threatening effect in about 8 min after the fire, and flashover occurs after about 9 min. Kim et al. [6] performed egress safety evaluations on movie theaters and provided the details about the size and location of openings to facilitate occupants’ evacuation process, and Oh et al. [7] conducted evacuation simulations on commercial office buildings and evaluated the ASET, which depends on the behavior of toxic gases. Nardo et al. [8] performed quantitative fire and explosion risk assessment based on the system dynamic (SD) simulation model. They considered a risk due to the use of liquefied petroleum gas (LPG) cylinders and reflected the human characteristics in their SD model. Recently, research has been actively done to develop evacuation facilities for efficient occupant evacuation in addition to the evaluation of fire safety [9,10].
In the field of engineering, studies have been conducted to solve problems that pose difficulties in numerical analysis due to the large uncertainty of input and output variables and complex mechanisms with the use of an artificial neural network (ANN) model [11,12,13]. The ANN is a regression analysis model that can examine complex nonlinear relationships between the input and output variables based on a database (DB), and has advantages in that it can minimize the error of output through the training process and provide output in a very short time when input data are given for the pre-trained model. If an ANN algorithm is utilized in the fire and evacuation analysis, the time required to derive the ASET can be reduced to about 1/100 s [14]. In the event of a fire in buildings, data obtained from temperature and toxic gas detection sensors can be used to estimate ASET in real time, and it is possible to provide the optimal evacuation route for the occupants.
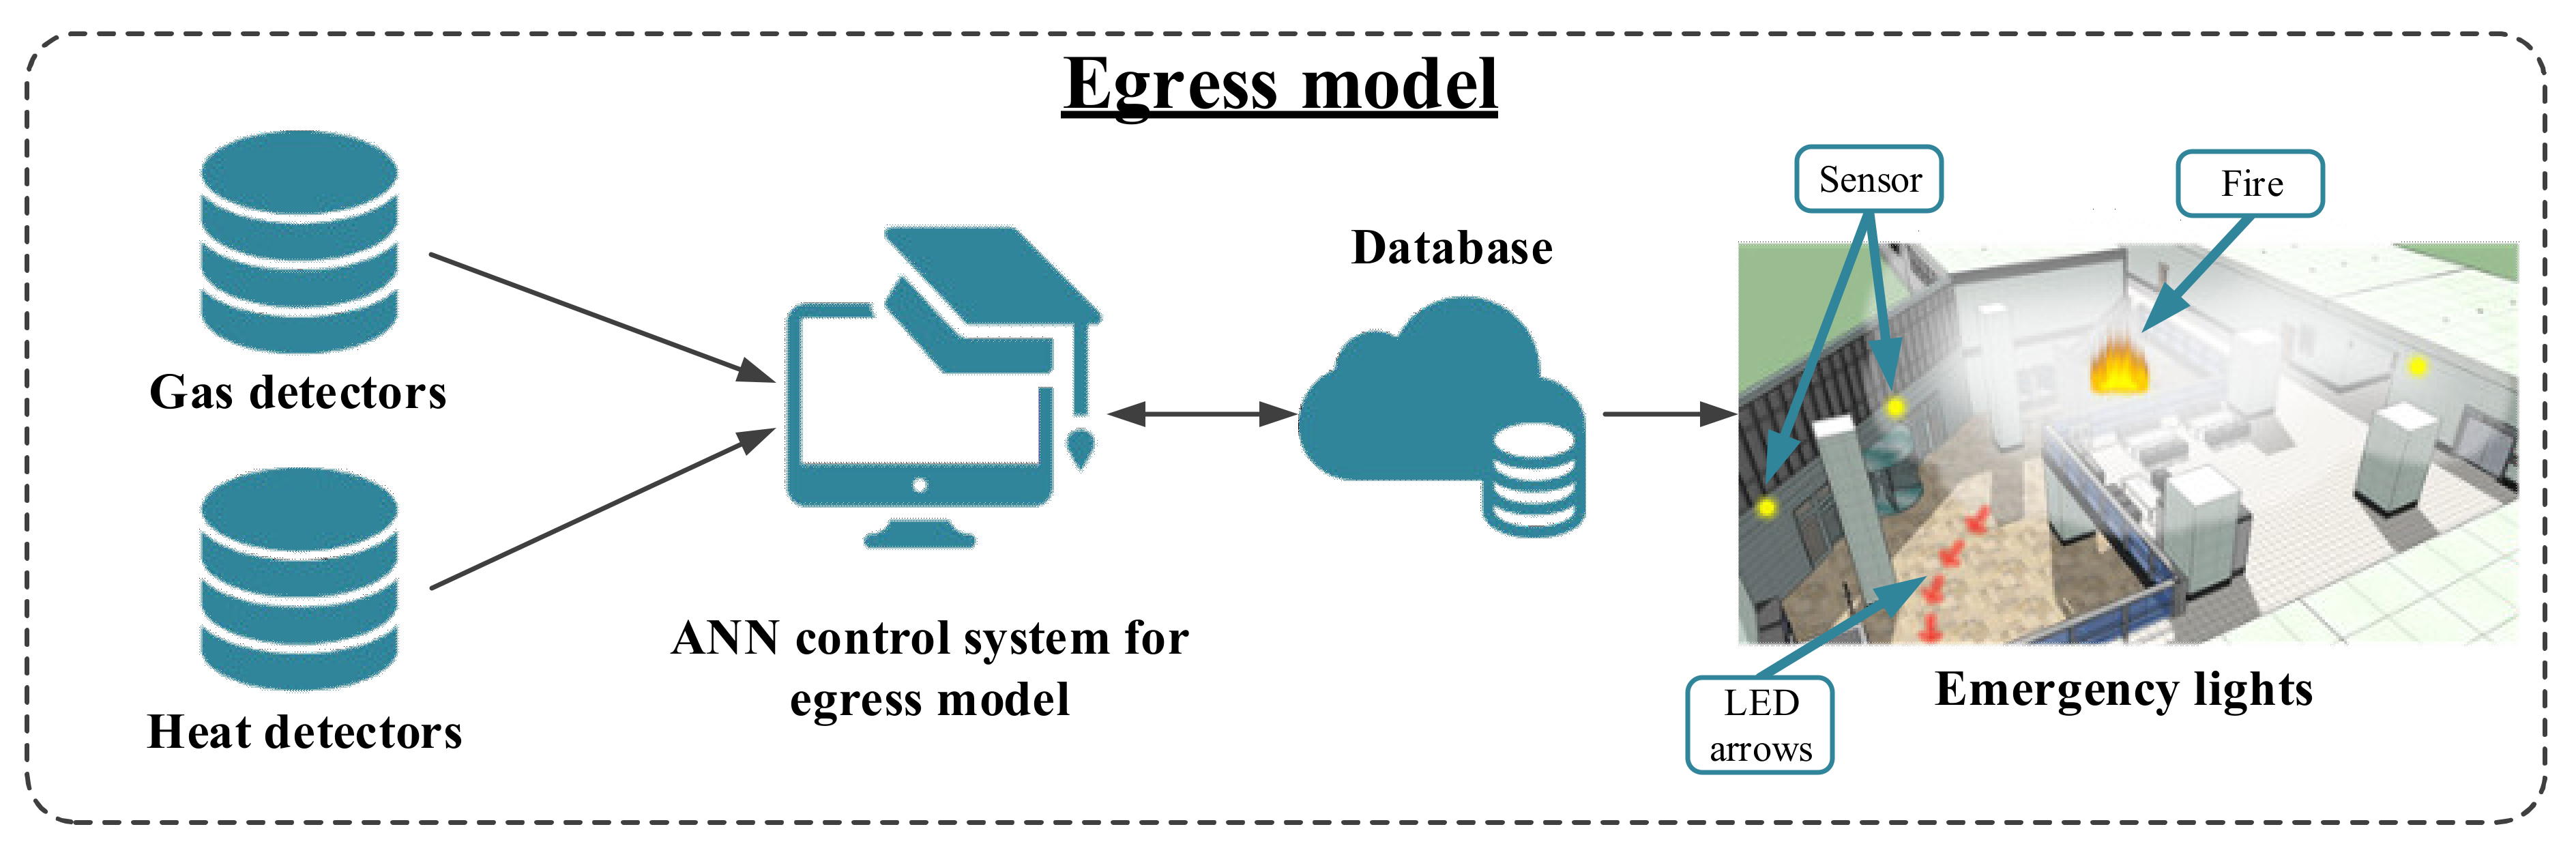
In this study, a fire simulation was conducted on the assumption of various fire scenarios for general multiplex buildings. The correlations between fire temperature and visibility, and between fire temperature and gas concentration, were investigated based on the simulation results, and DBs were built in those connections. In addition, an algorithm that can calculate real-time ASET in the case of a fire was developed using DB and ANN. The rationality of the proposed ANN model was verified by comparing the ASET derived using the proposed model with the ASET derived from the fire simulation. In addition, the ANN-based egress model that can provide optimal evacuation routes in the event of a fire was proposed, as shown in Figure 2, and an example was presented to verify the applicability of the proposed egress model.
2. Fire Simulation for Multiplex Building
2.1. Description of Fire Simulation
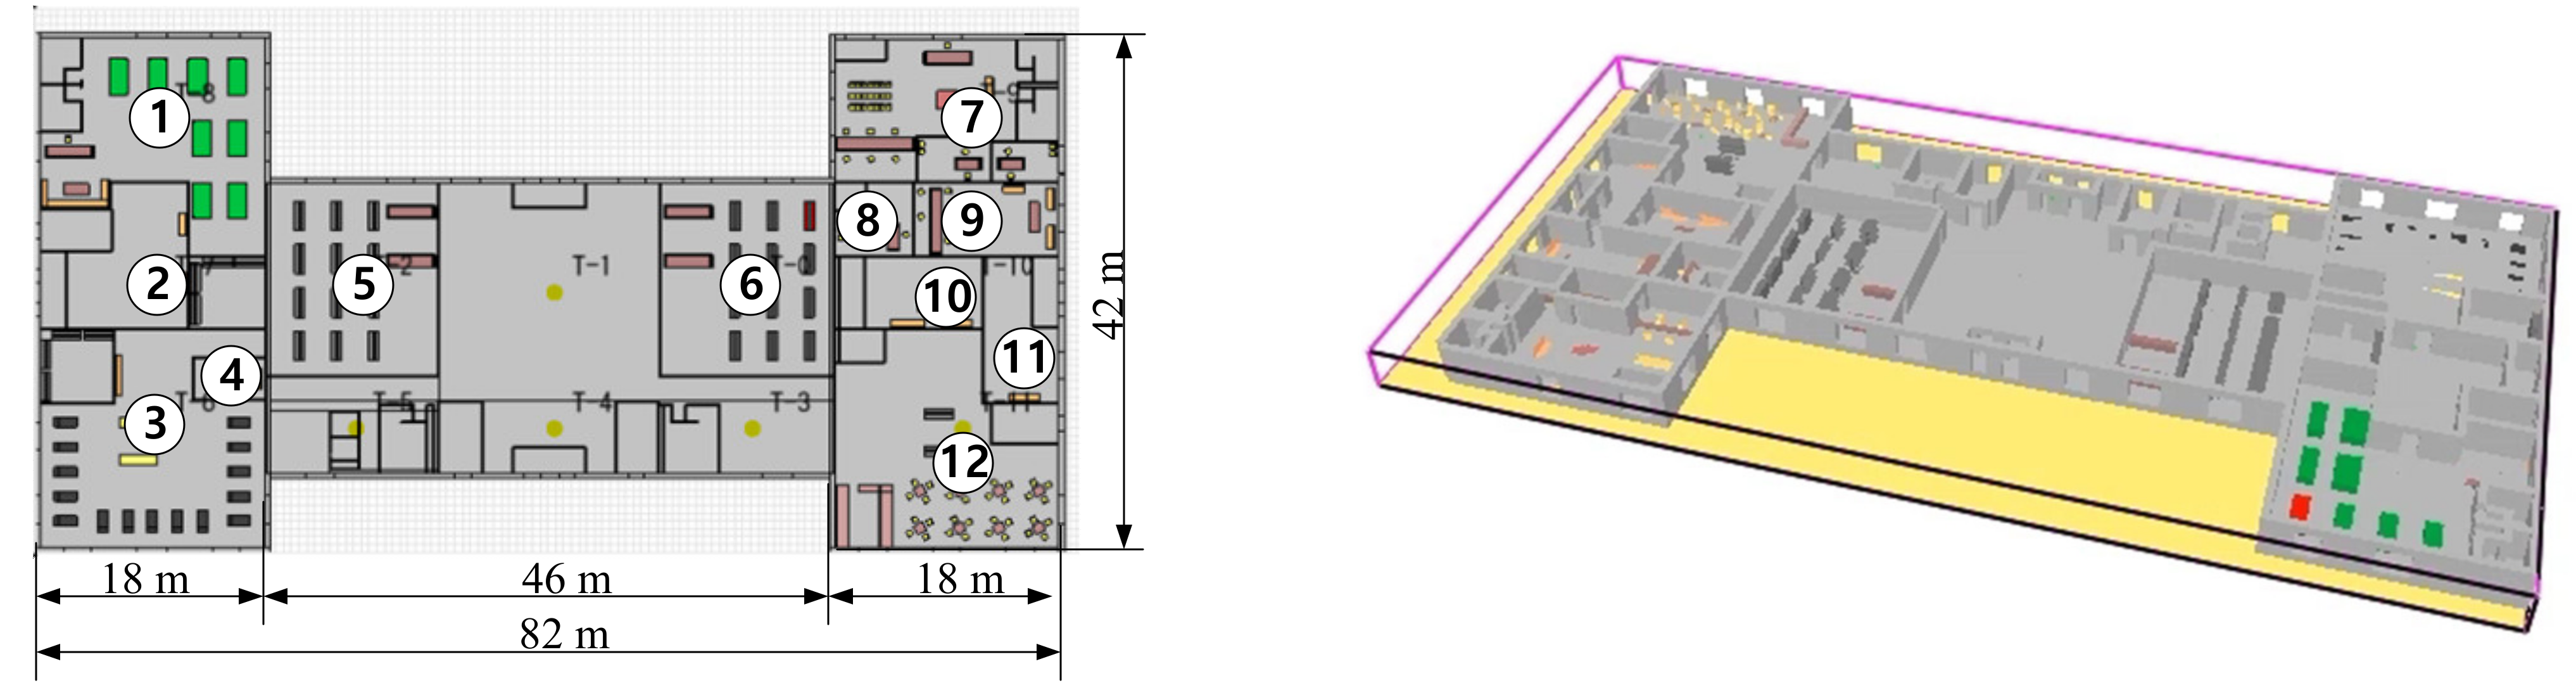
The Fire Dynamics Simulator (FDS) [15], based on large eddy simulation (LES) [16], has been widely used for fire simulation and well verified by many researchers [1,2,3,4]. In this study, therefore, the FDS was chosen to simulate the event of fire in multiplex buildings. As shown in Figure 3, the multiplex building has a room height of 3.2 m with a floor area of 3444 m2 (82 m × 42 m), and a mesh size of 0.62 m × 0.62 m × 0.72 m [15]. The mesh sizes were determined based on the method mentioned in the FDS User Guide [15]. A nondimensional parameter () was set to 4, where is a characteristic fire diameter (m), and is the nominal size of a mesh cell (m). can be calculated as follows:
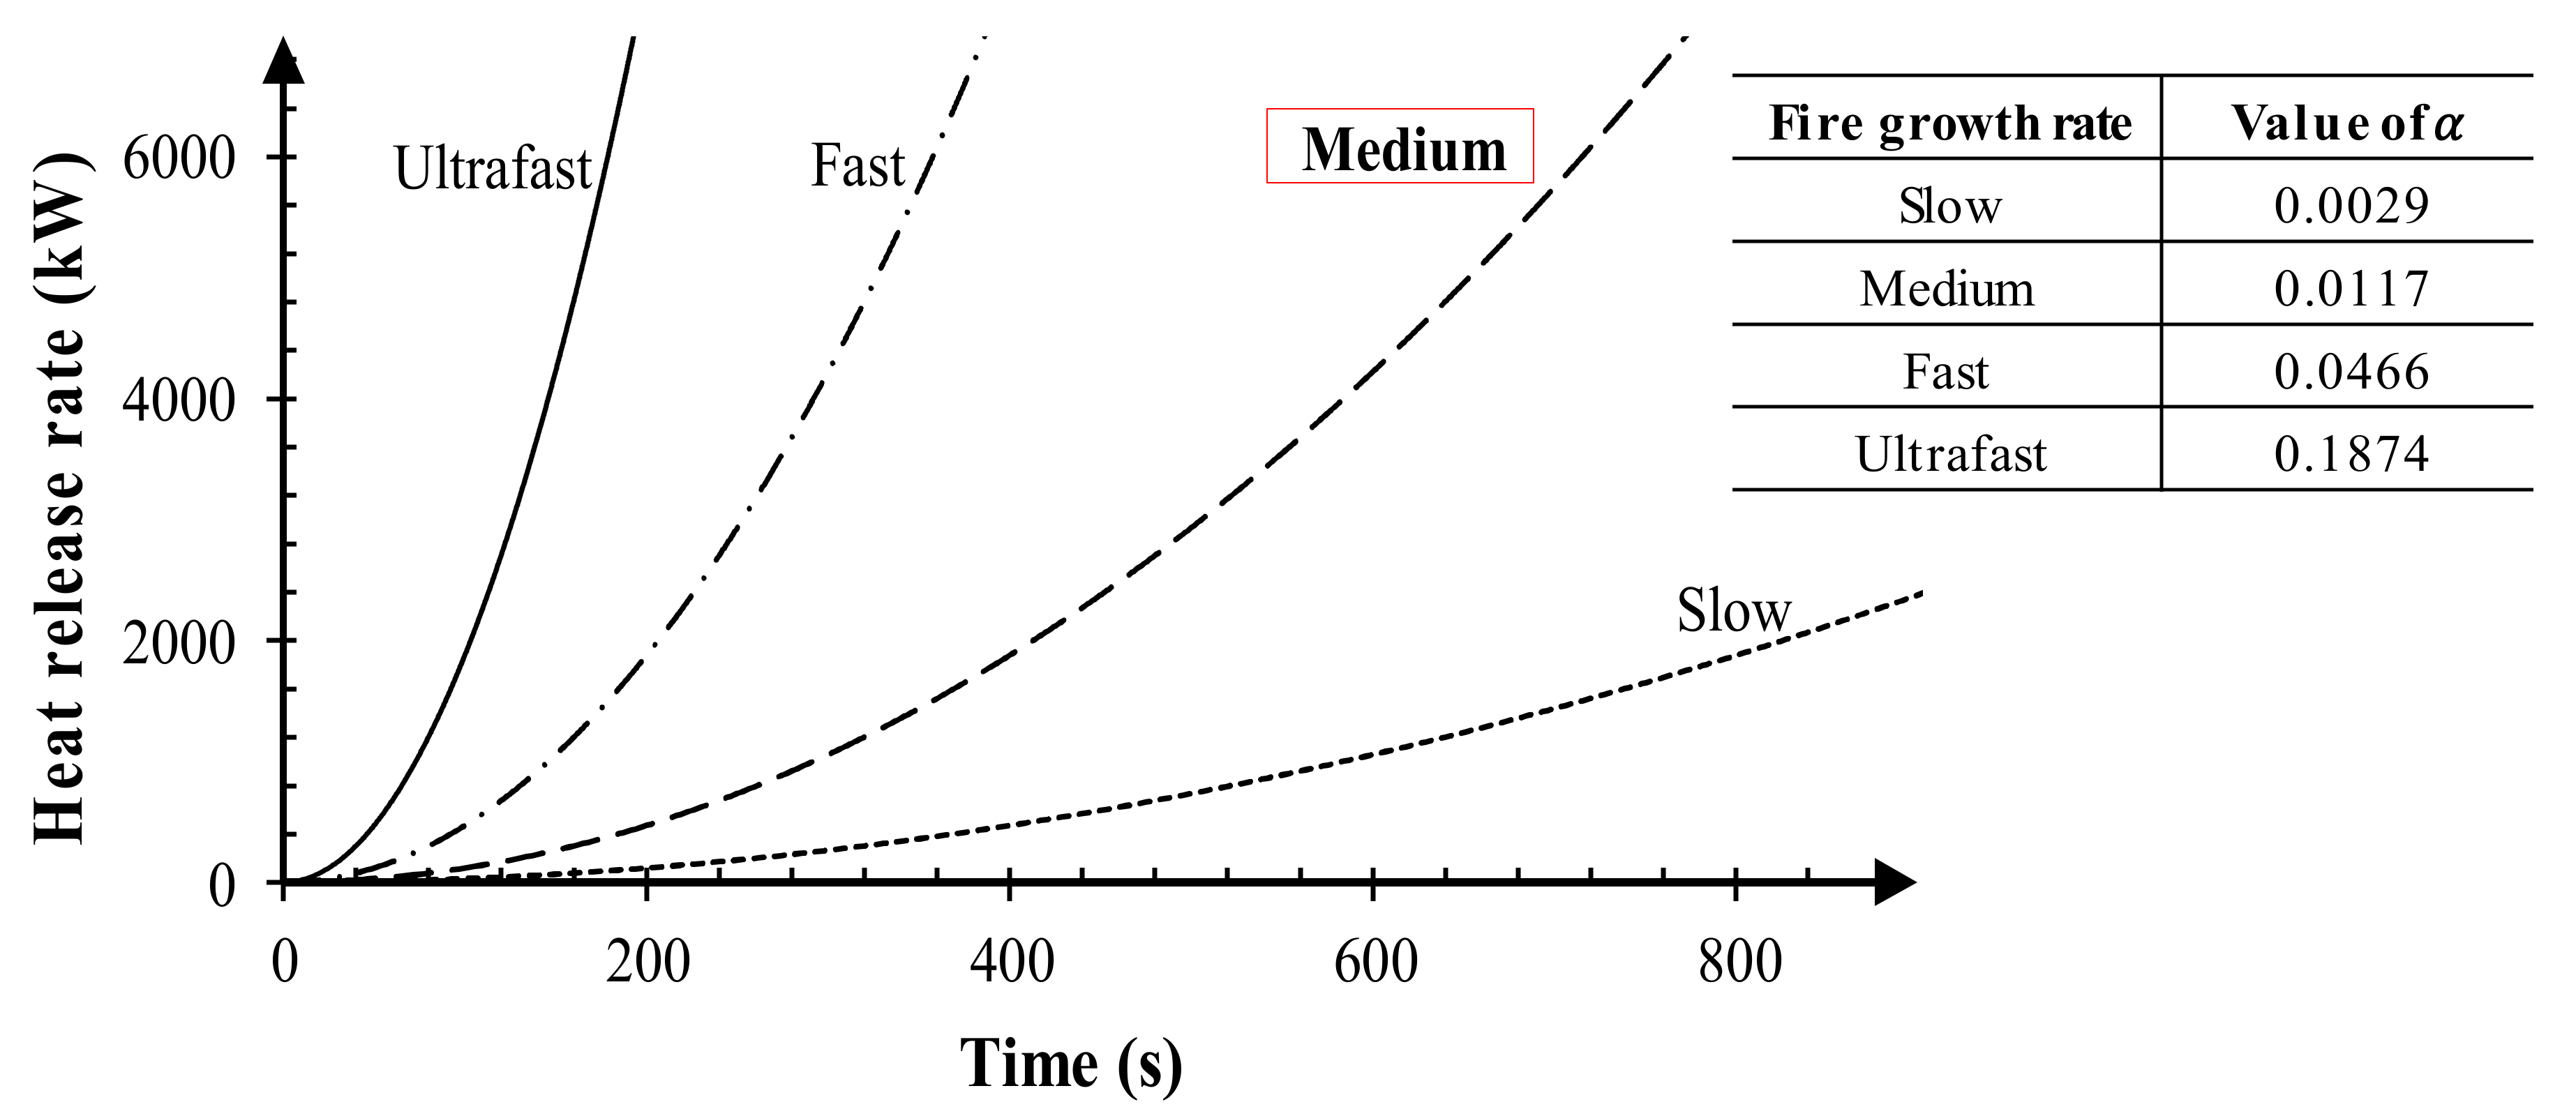
where is the total heat release rate of fire (kW), is the density of air (1.204 kg/m3), is the specific heat (1.005 kJ/kg-K), is the ambient temperature (293 K), and is the acceleration of gravity (9.8 m/s2). The type of fuels and the location of fire sources were set as the main variables for the analysis. A total of five fuel types, which include ethanol, kerosene, polystyrene foams, polyurethane foams and wood, were used, and the location of fire sources were divided into 12 compartments, as indicated by the numbers in circles, as shown in Figure 3. The values presented in the Society of Fire Protection Engineers (SFPE) handbook [17] were used as the material properties of fuels, as shown in Table 1. The combustibles were assumed to be chairs, tables, and sofas, which are mainly placed on the floor in the multiplex building, and the heat release rate (HRR) of each combustible was set by referring to the DB provided by the National Center for Forensic Science (NCFS) [18]. As shown in Figure 4, heat release rates over time were calculated using a t-squared fire curve [19]:
where the fire growth rate is classified into ‘slow’, ‘medium’, ‘fast’, and ‘ultra fast’. is the HRR (kW), is the coefficient for fire growth, and is the time (s). In the fire simulation conducted in this study, the burning area was set as 1 m × 1 m, and the fire growth rate was assumed to be of a medium level with reference to the Structural Design for Fire Safety [20].
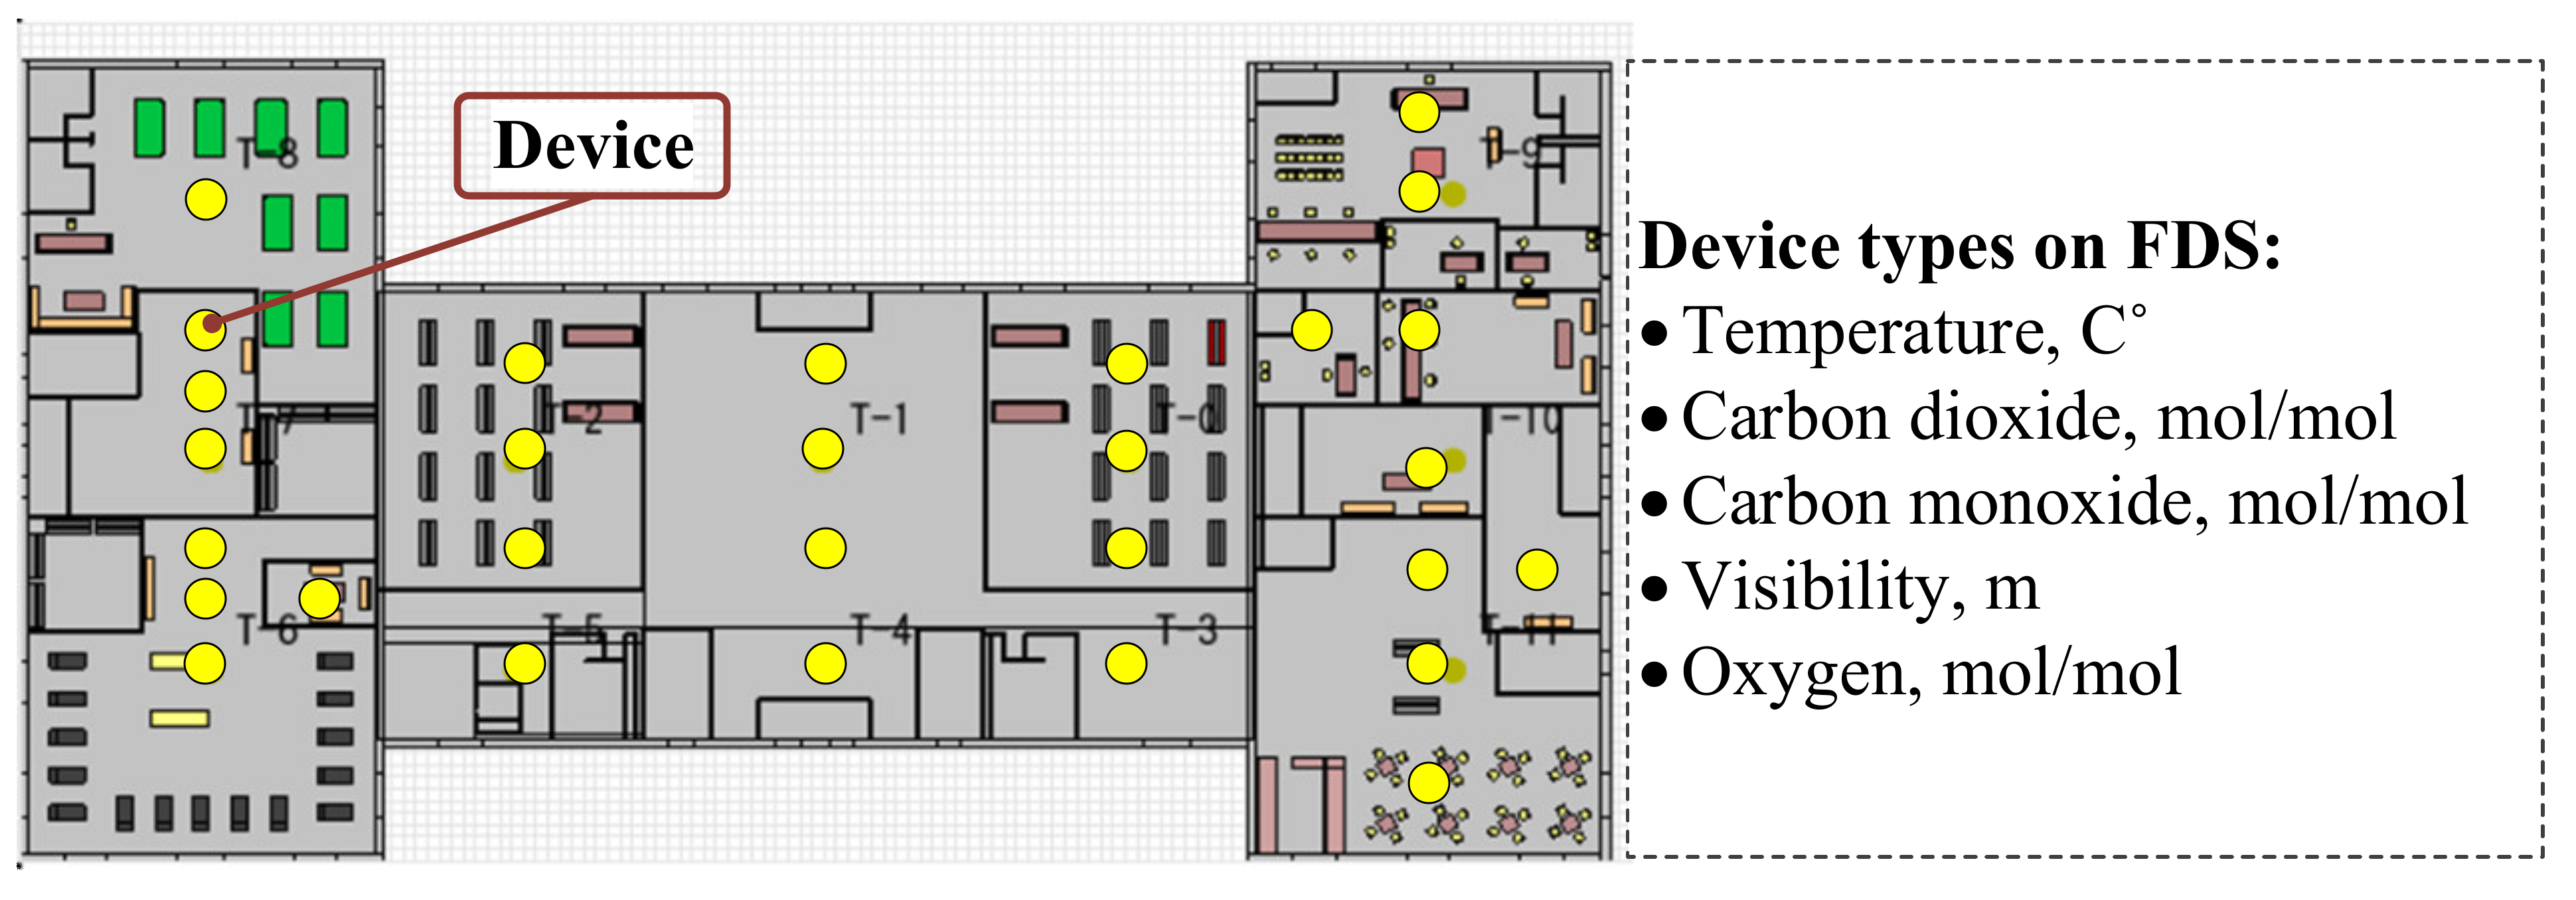
In general, factors that directly influence the safety of the occupants in the event of a fire include toxic gases, heat, and visibility [17], and the National Fire Protection Association (NFPA) presents tenability criteria, as shown in Table 2. In this study, a simulation was conducted on fire scenarios for a total of 60 cases, as shown in Table 3, and the temperature, visibility, and concentrations of oxygen (O2), carbon dioxide (CO2), and carbon monoxide (CO) at the fire compartment and nonfire compartment were measured for each scenario with the use of measurement devices placed in a total of 27 locations at intervals of 1 m, as shown in Figure 5. In order to evaluate the spread of fire and the safety of life during evacuation of occupants, the measurement devices were installed at a height of 1.8 m from the floor as suggested by NFPA. Ventilation systems can reduce concentrations of toxic gases, which keeps occupants safer under fire. The ventilation systems in multiplex buildings are in fact diverse, which makes it very difficult to conduct numerical simulations when considering all the different cases. In the simulation conducted in this study, therefore, it was assumed that there was no forced (or active) ventilation system in the multiplex building. Instead, as a worst-case scenario, the FDS analysis was performed considering only natural ventilation conditions through openings, i.e., doors and windows. Note that the building for training the ANN has 42 openings (windows and doors), which is 17.4% of the opening ratio, i.e., the ratio of total opening area to outer wall perimetric area.
2.2. Fire Simulation Results
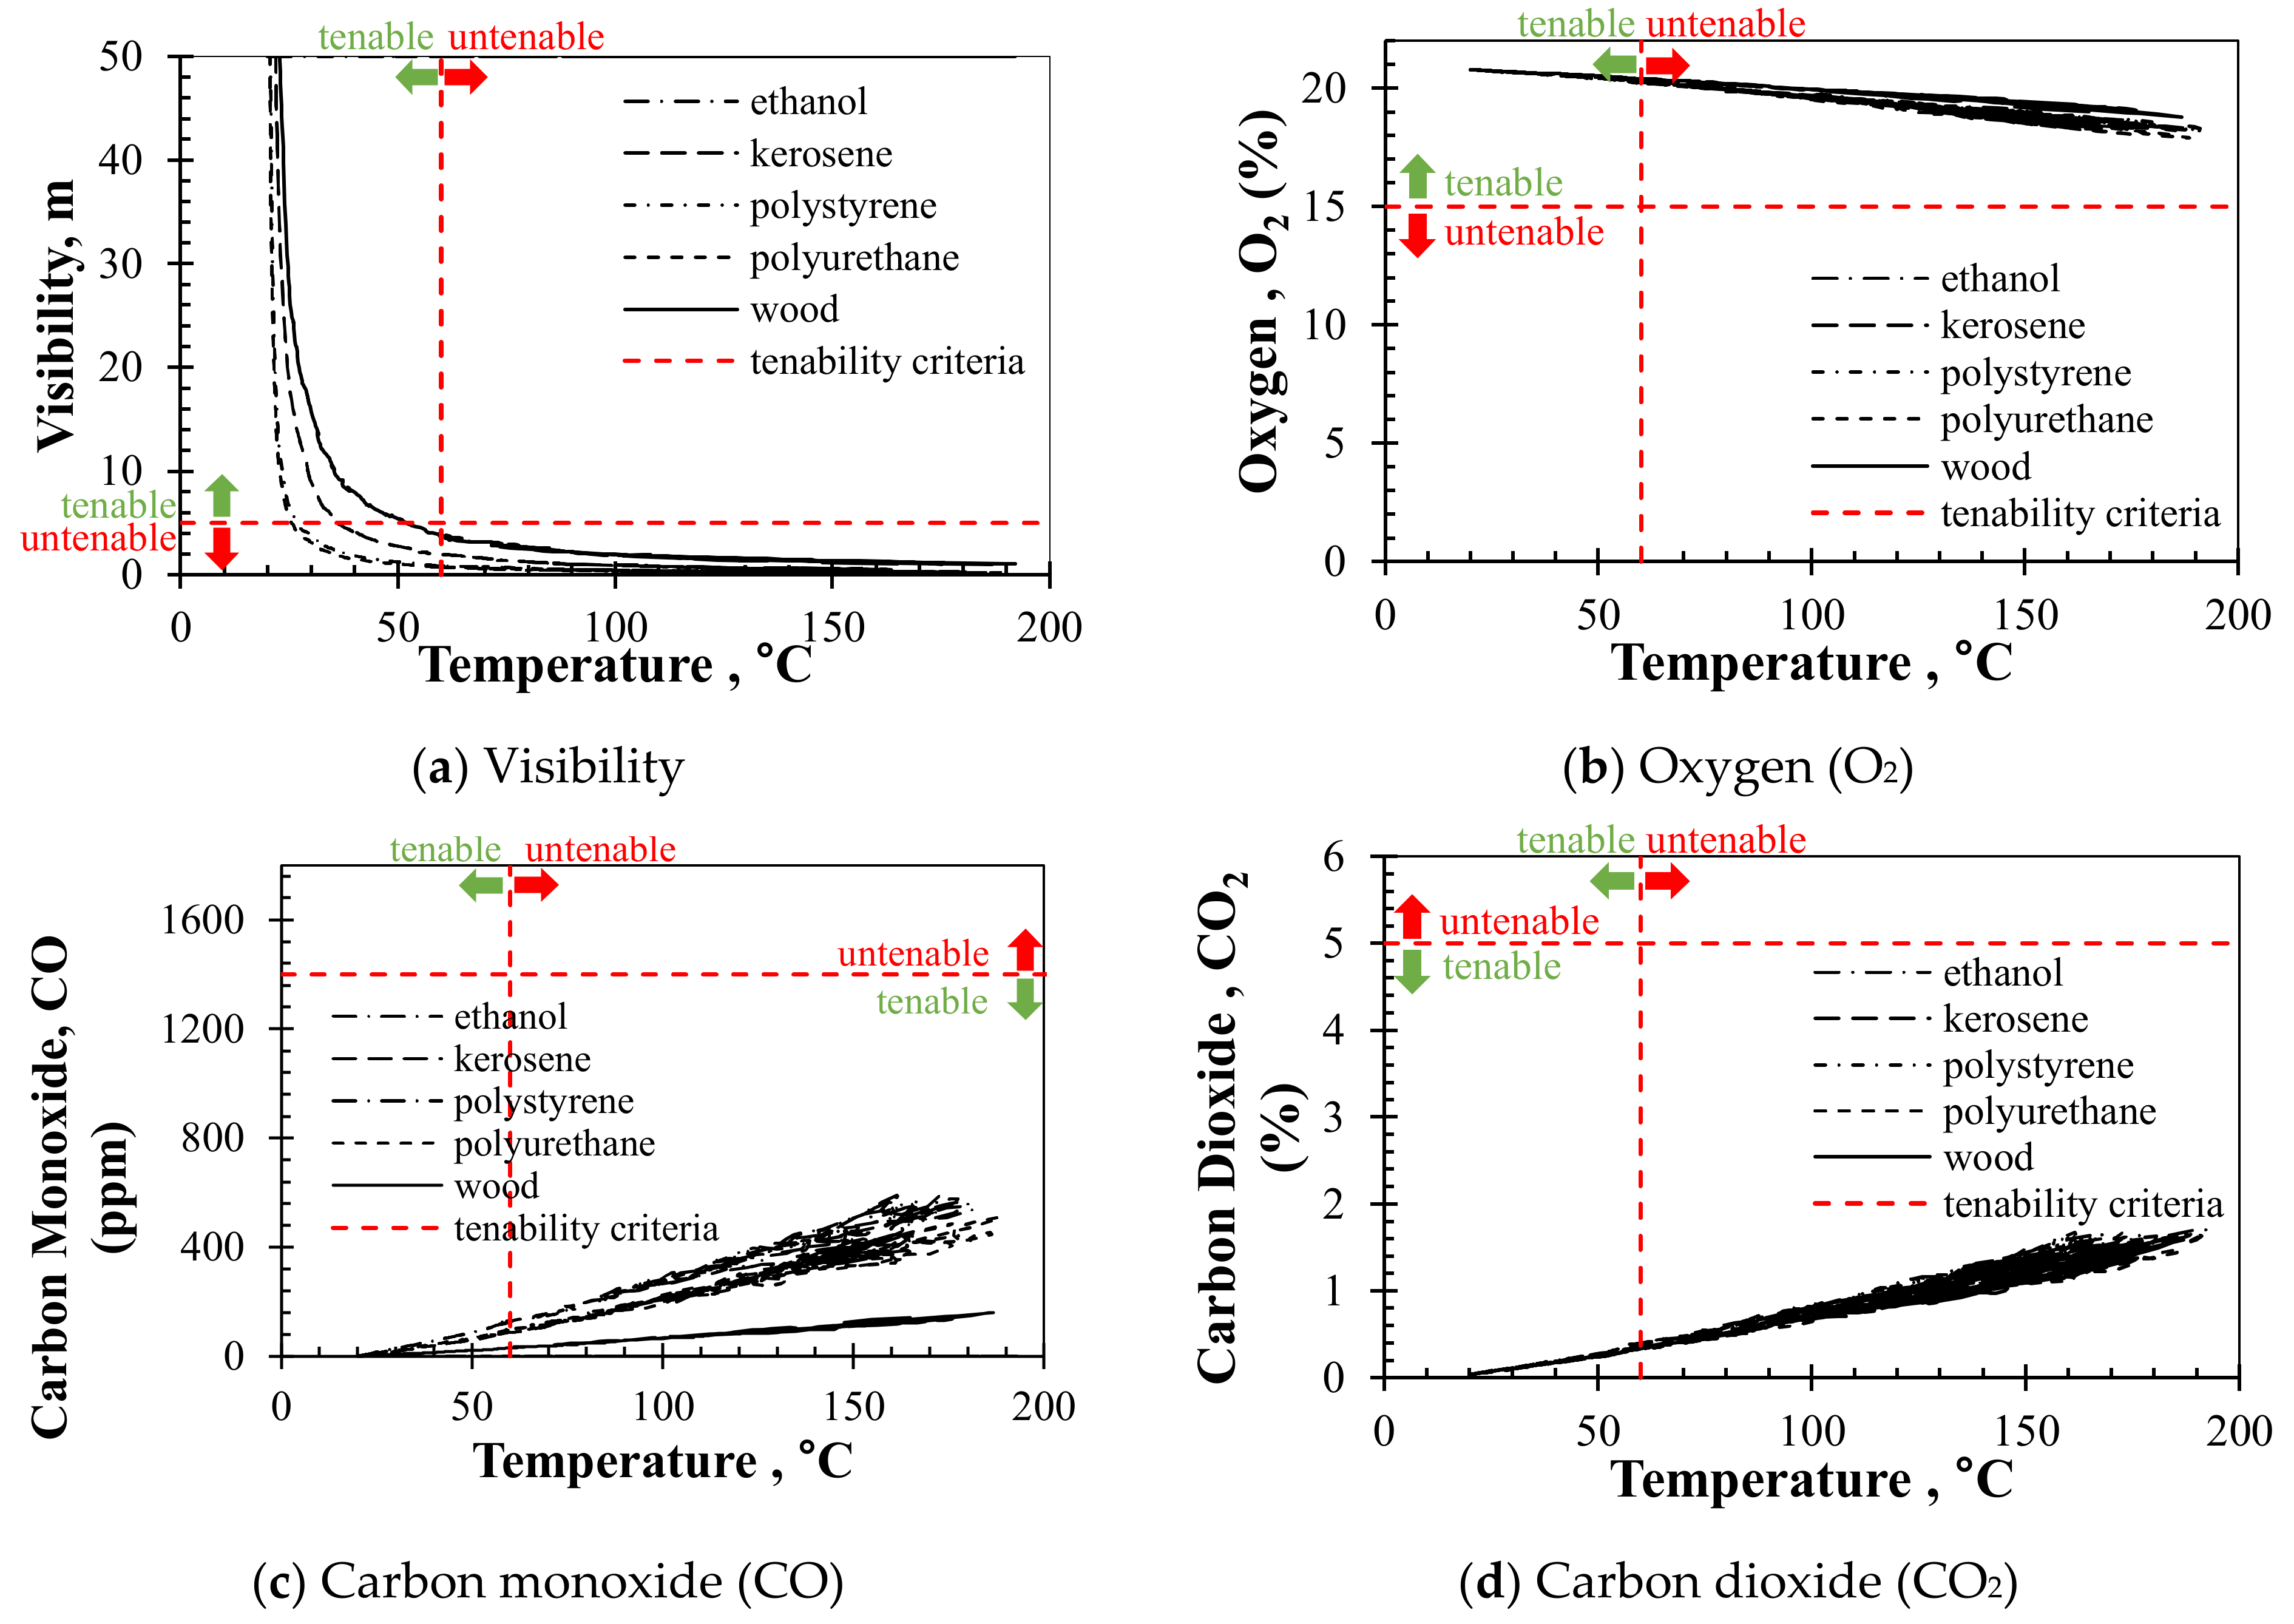
The DBs for fire simulation results were built for the fire compartment and nonfire compartment, respectively. Figure 6 shows the visibility and concentrations of oxygen, carbon monoxide and carbon dioxide according to the fuel type and temperature at the fire compartment. The red dotted lines in each graph indicate the tenability criteria given in Table 2. As shown in Figure 6a, the visibility at the point in time when the temperature at the fire compartment reached its limit (60 °C) ranged from 0.7 m to 3.8 m (ethanol: 0.8 m, kerosene: 2.0 m, polystyrene: 0.9 m, polyurethane: 0.7 m, wood: 3.8 m) with respect to the fuel types. In addition, the time at which the temperature at the fire compartment reached 60 °C ranged from 207 to 225 s (ethanol: 225 s, kerosene: 207 s, polystyrene: 223 s, polyurethane: 221 s, wood: 217 s). For the concentration of oxygen according to the temperature shown in Figure 6b, when the temperature at the fire compartment reached 60 °C, the concentration of oxygen ranged from 20.1% to 20.7%, indicating that the fuel type has no significant effect on oxygen concentration. In addition, as shown in Figure 6c, the concentration of carbon monoxide ranged from 31 to 140 ppm (ethanol: 140 ppm, kerosene: 87 ppm, polystyrene: 129 ppm, polyurethane: 101 ppm, wood: 31 ppm) with respect to the fuel types, and the concentration of carbon dioxide showed a similar increasing tendency regardless of the fuel type, as shown in Figure 6d.
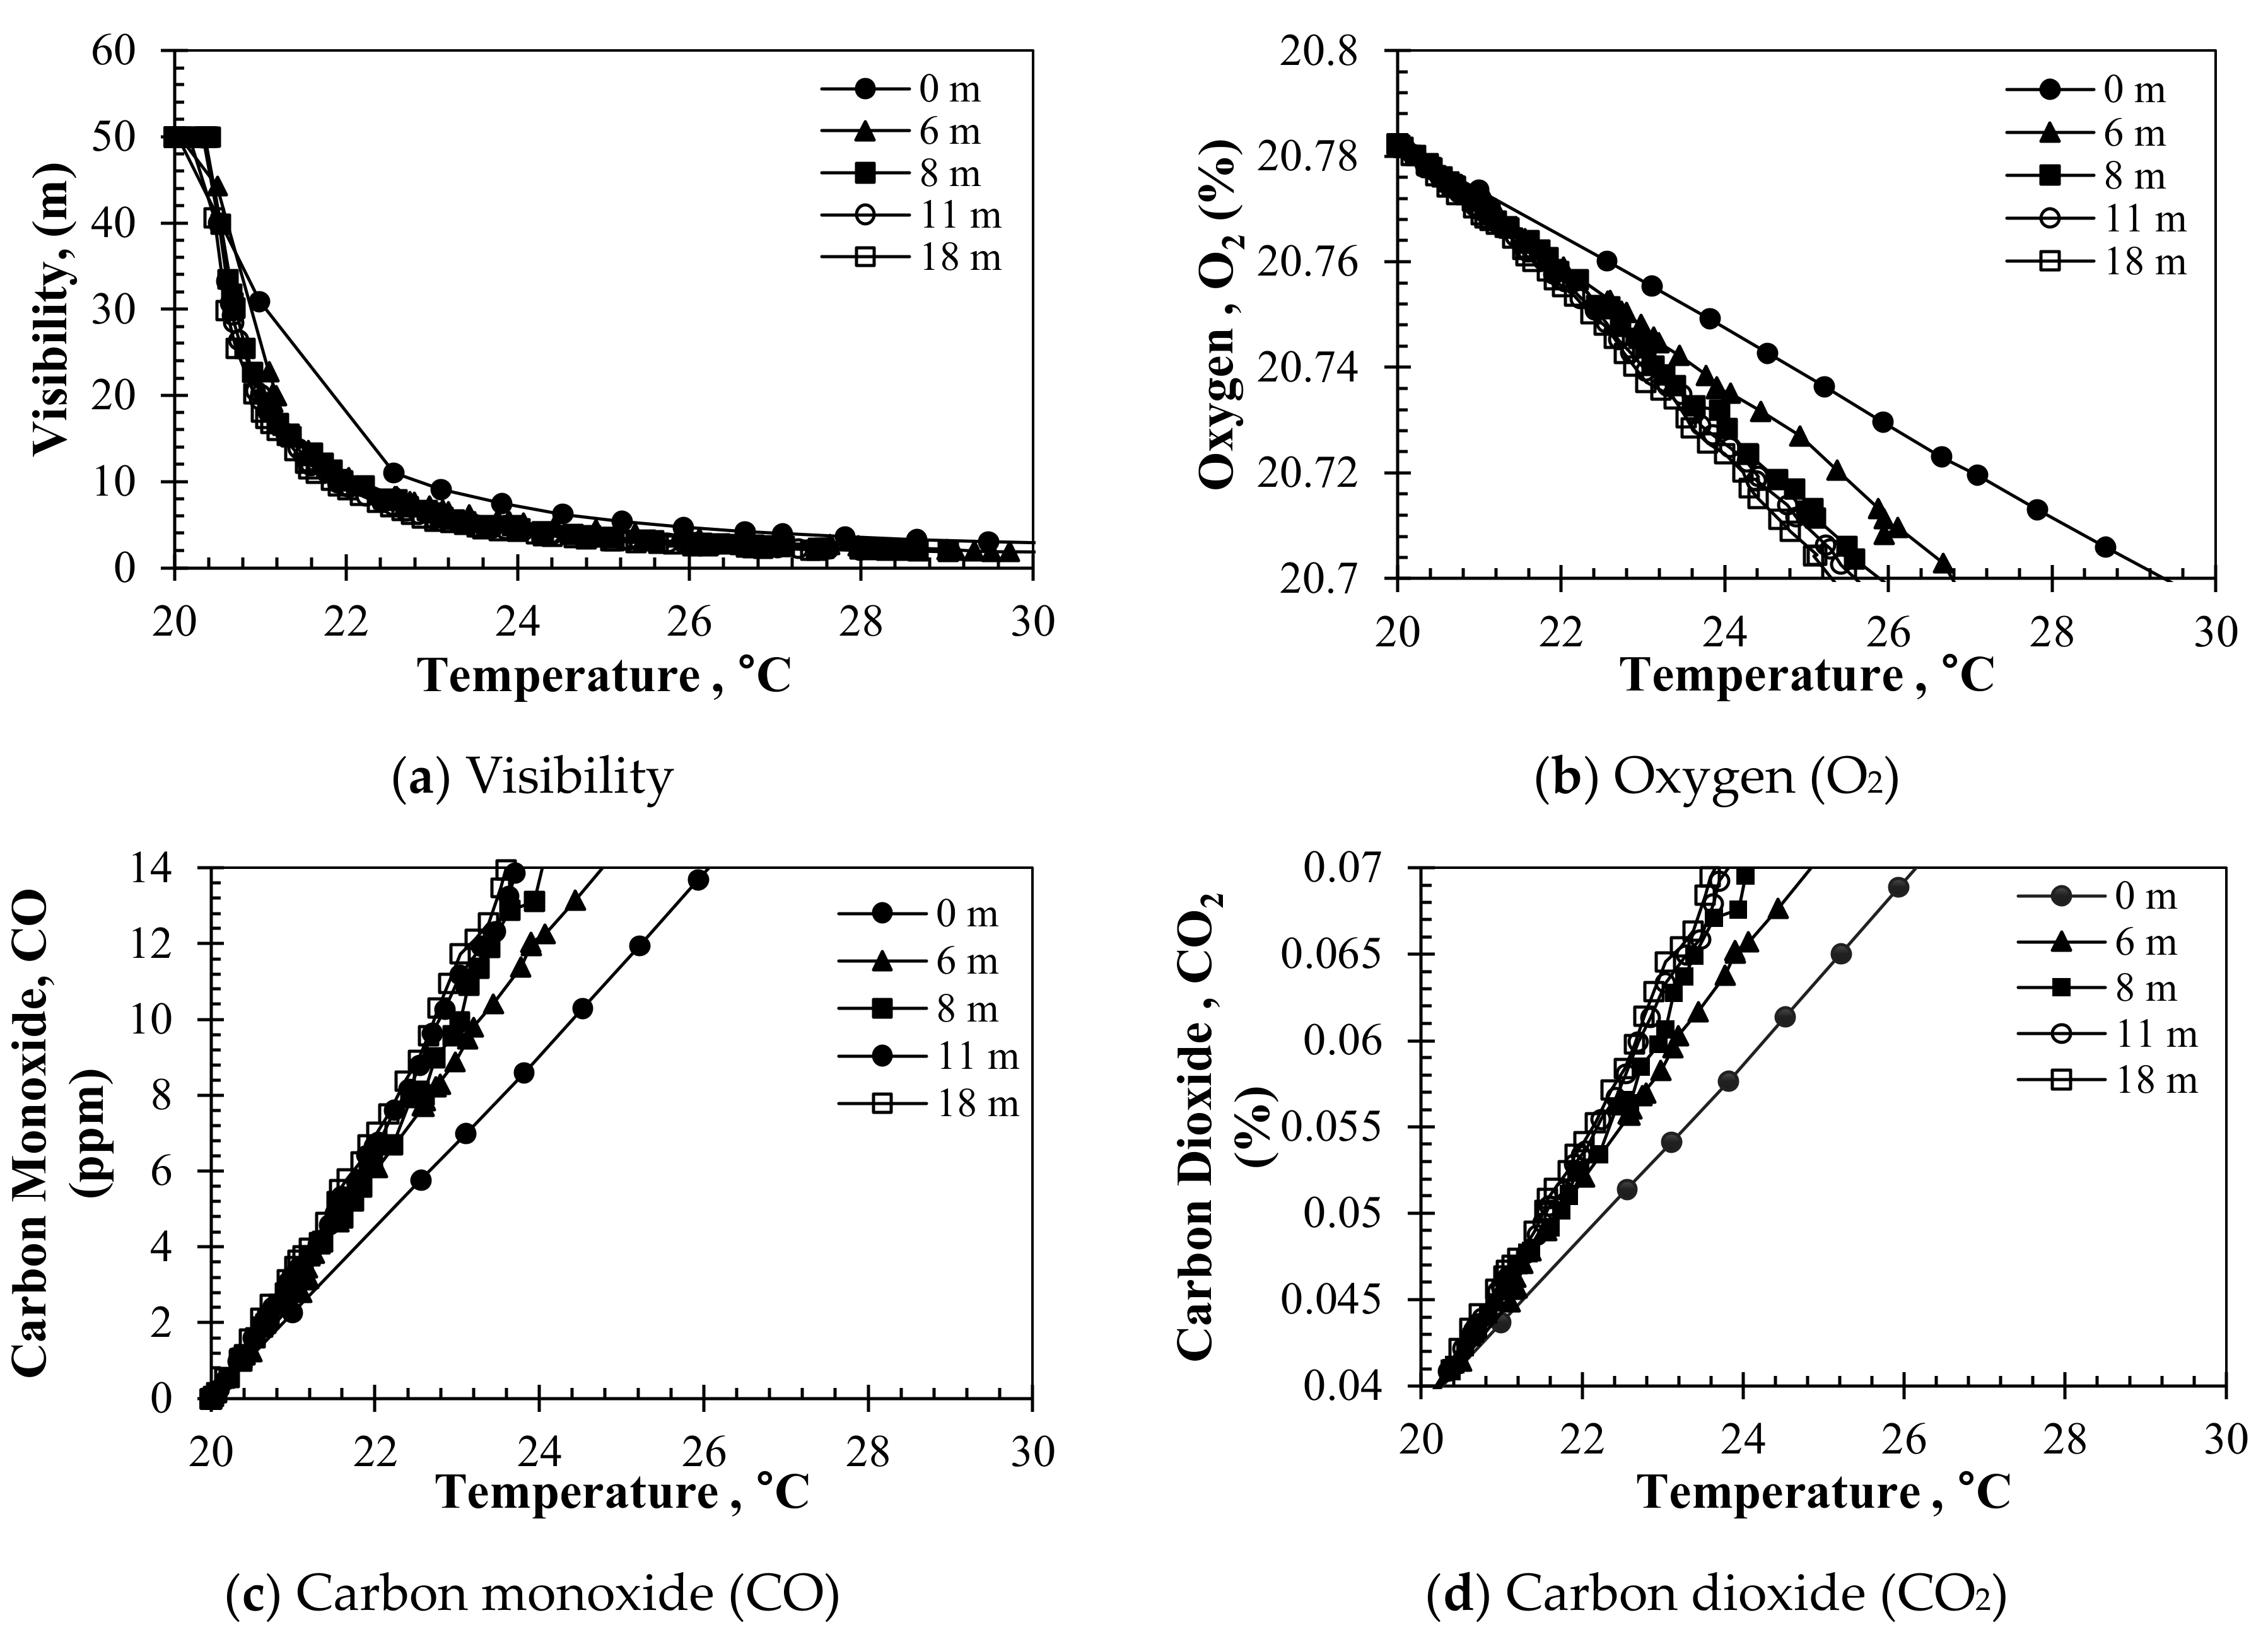
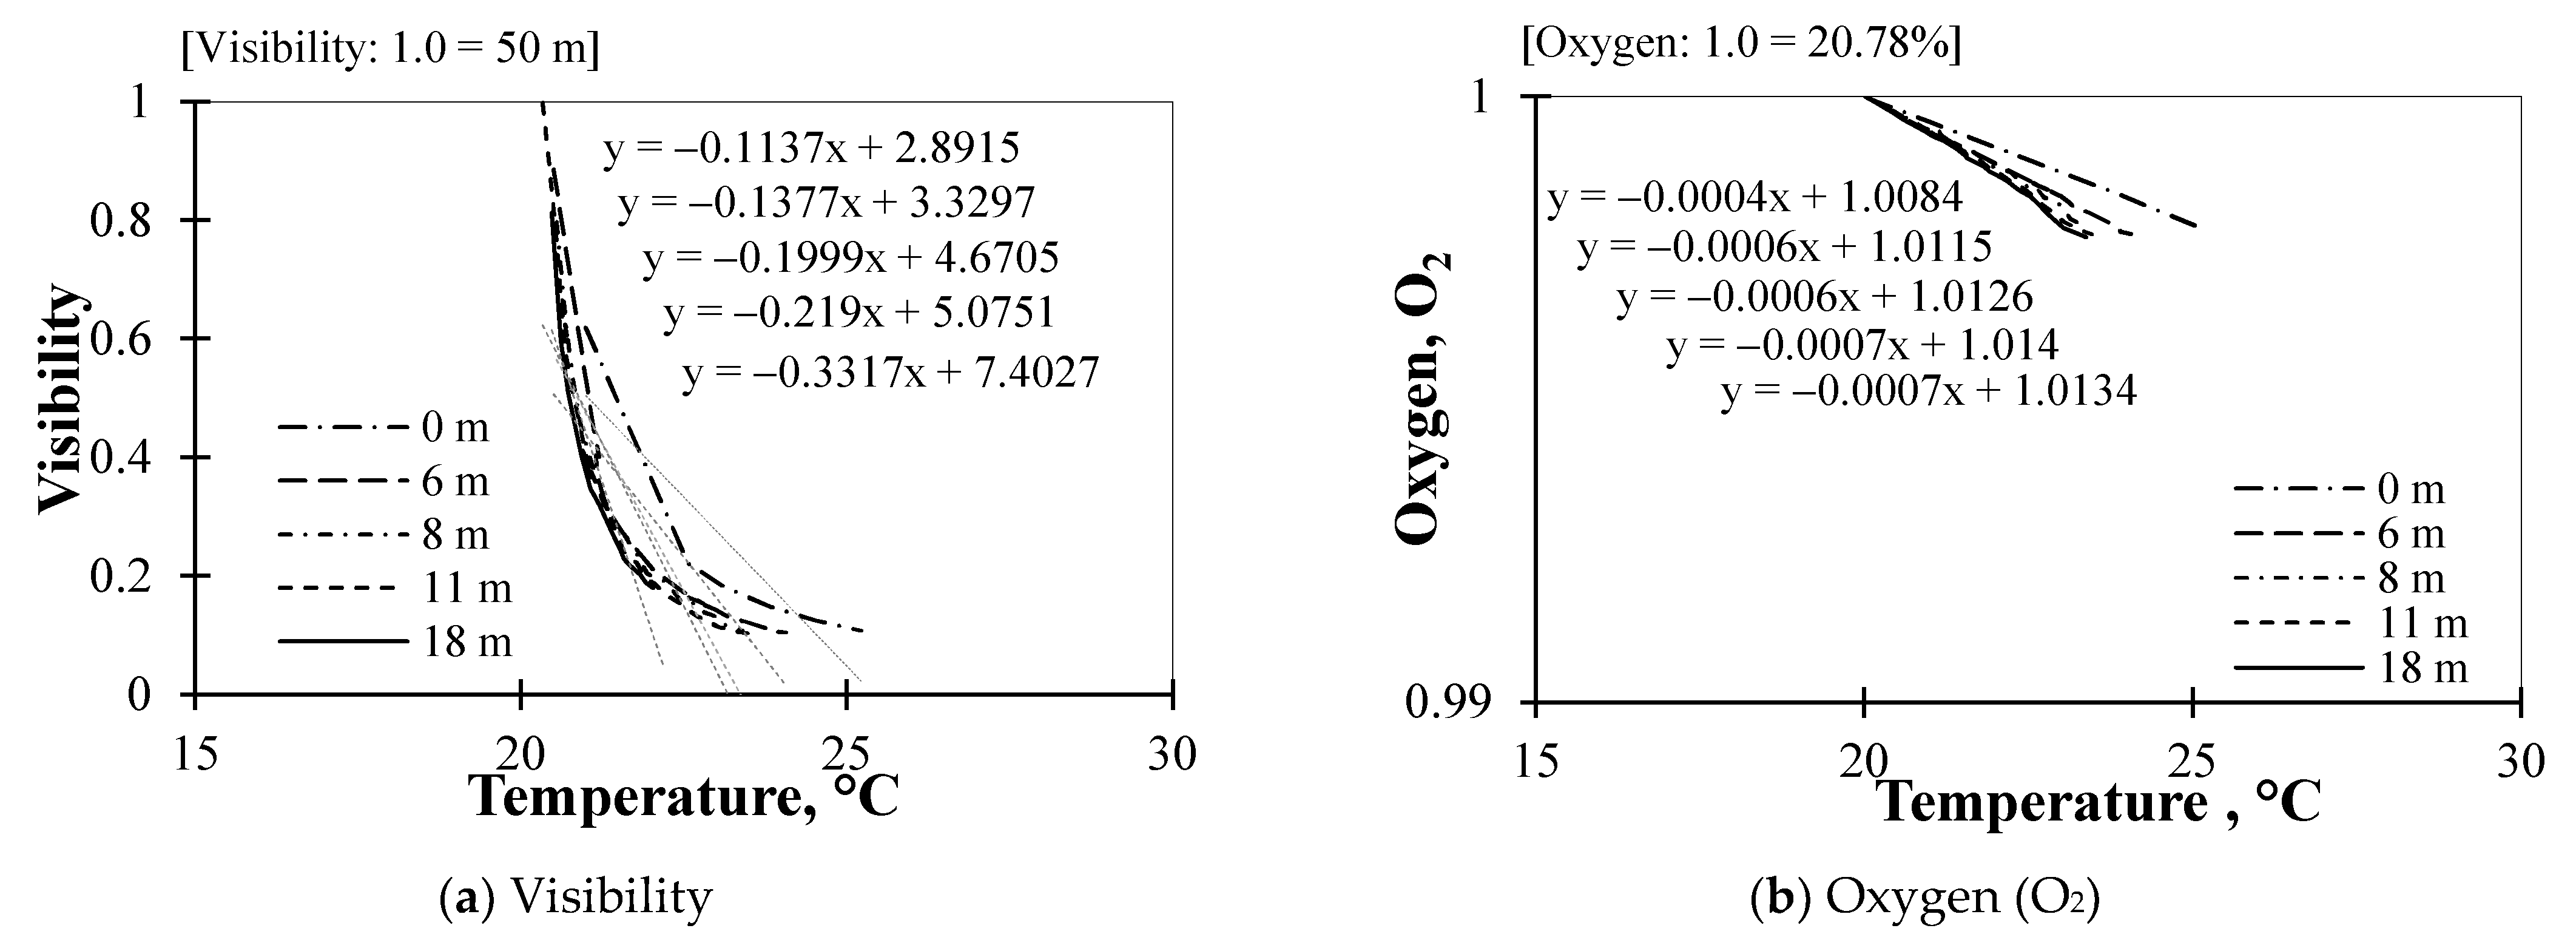
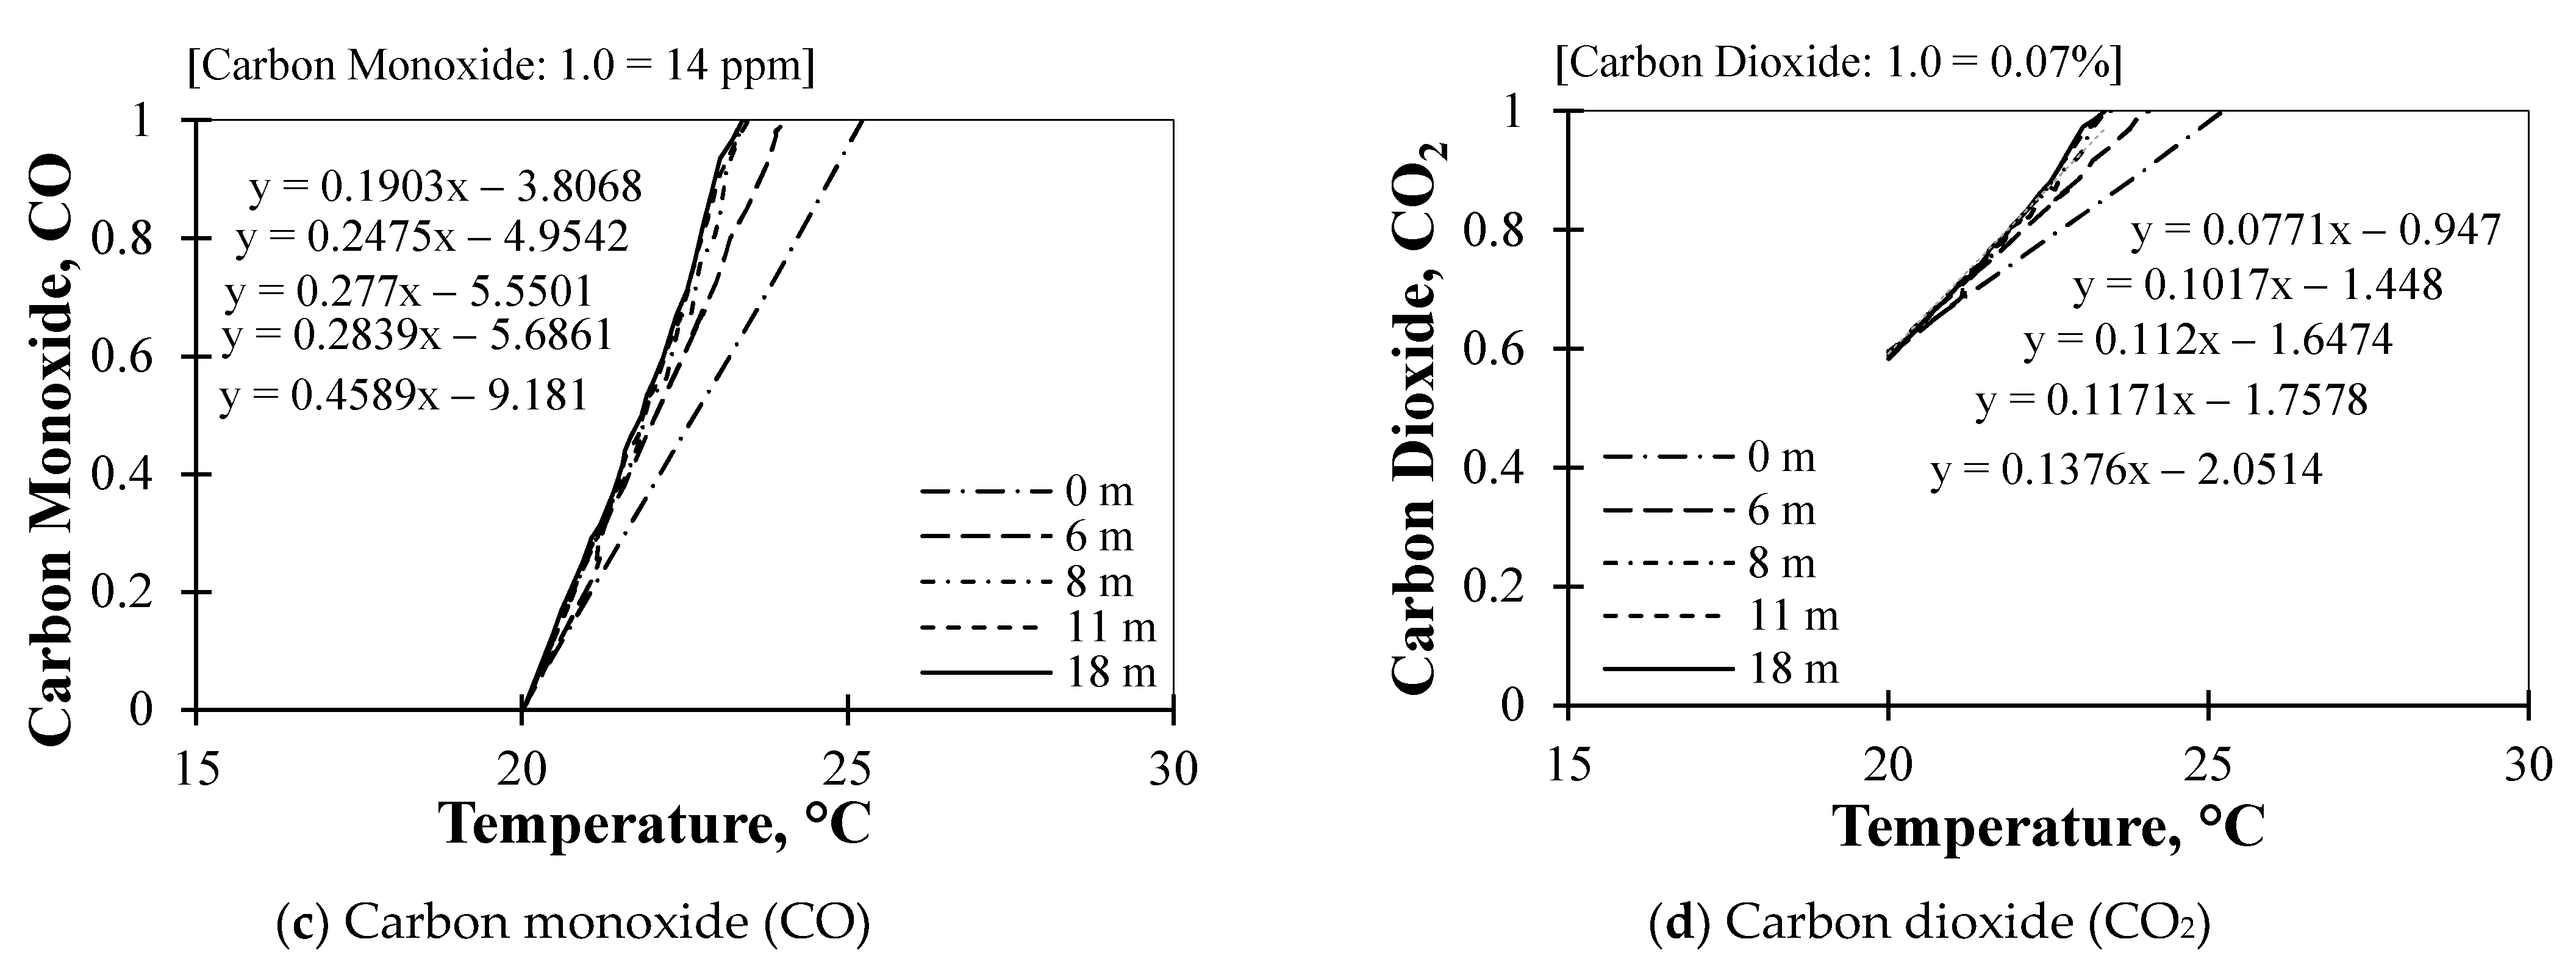
Figure 7 shows the visibility and concentrations of oxygen, carbon monoxide, and carbon dioxide at the nonfire compartment, depending on the temperature and distance from the fire source. Since the analysis results did not show a large difference according to the type of fuel, the analysis result obtained using polyurethane for fuels was used as a representative case. As shown in Figure 7a, the visibility according to the temperature tended to decrease significantly regardless of the distance from the fire location because the smoke spread rapidly after a fire occurred. In addition, the concentration of oxygen depending on the temperature decreased rapidly as the distance from the fire location decreased, as shown in Figure 7b. Meanwhile, in the case of the carbon monoxide and carbon dioxide concentrations with respect to the temperature, the slope of the line on the graph tended to increase with the increasing distance from the fire location, as shown in Figure 7c,d.
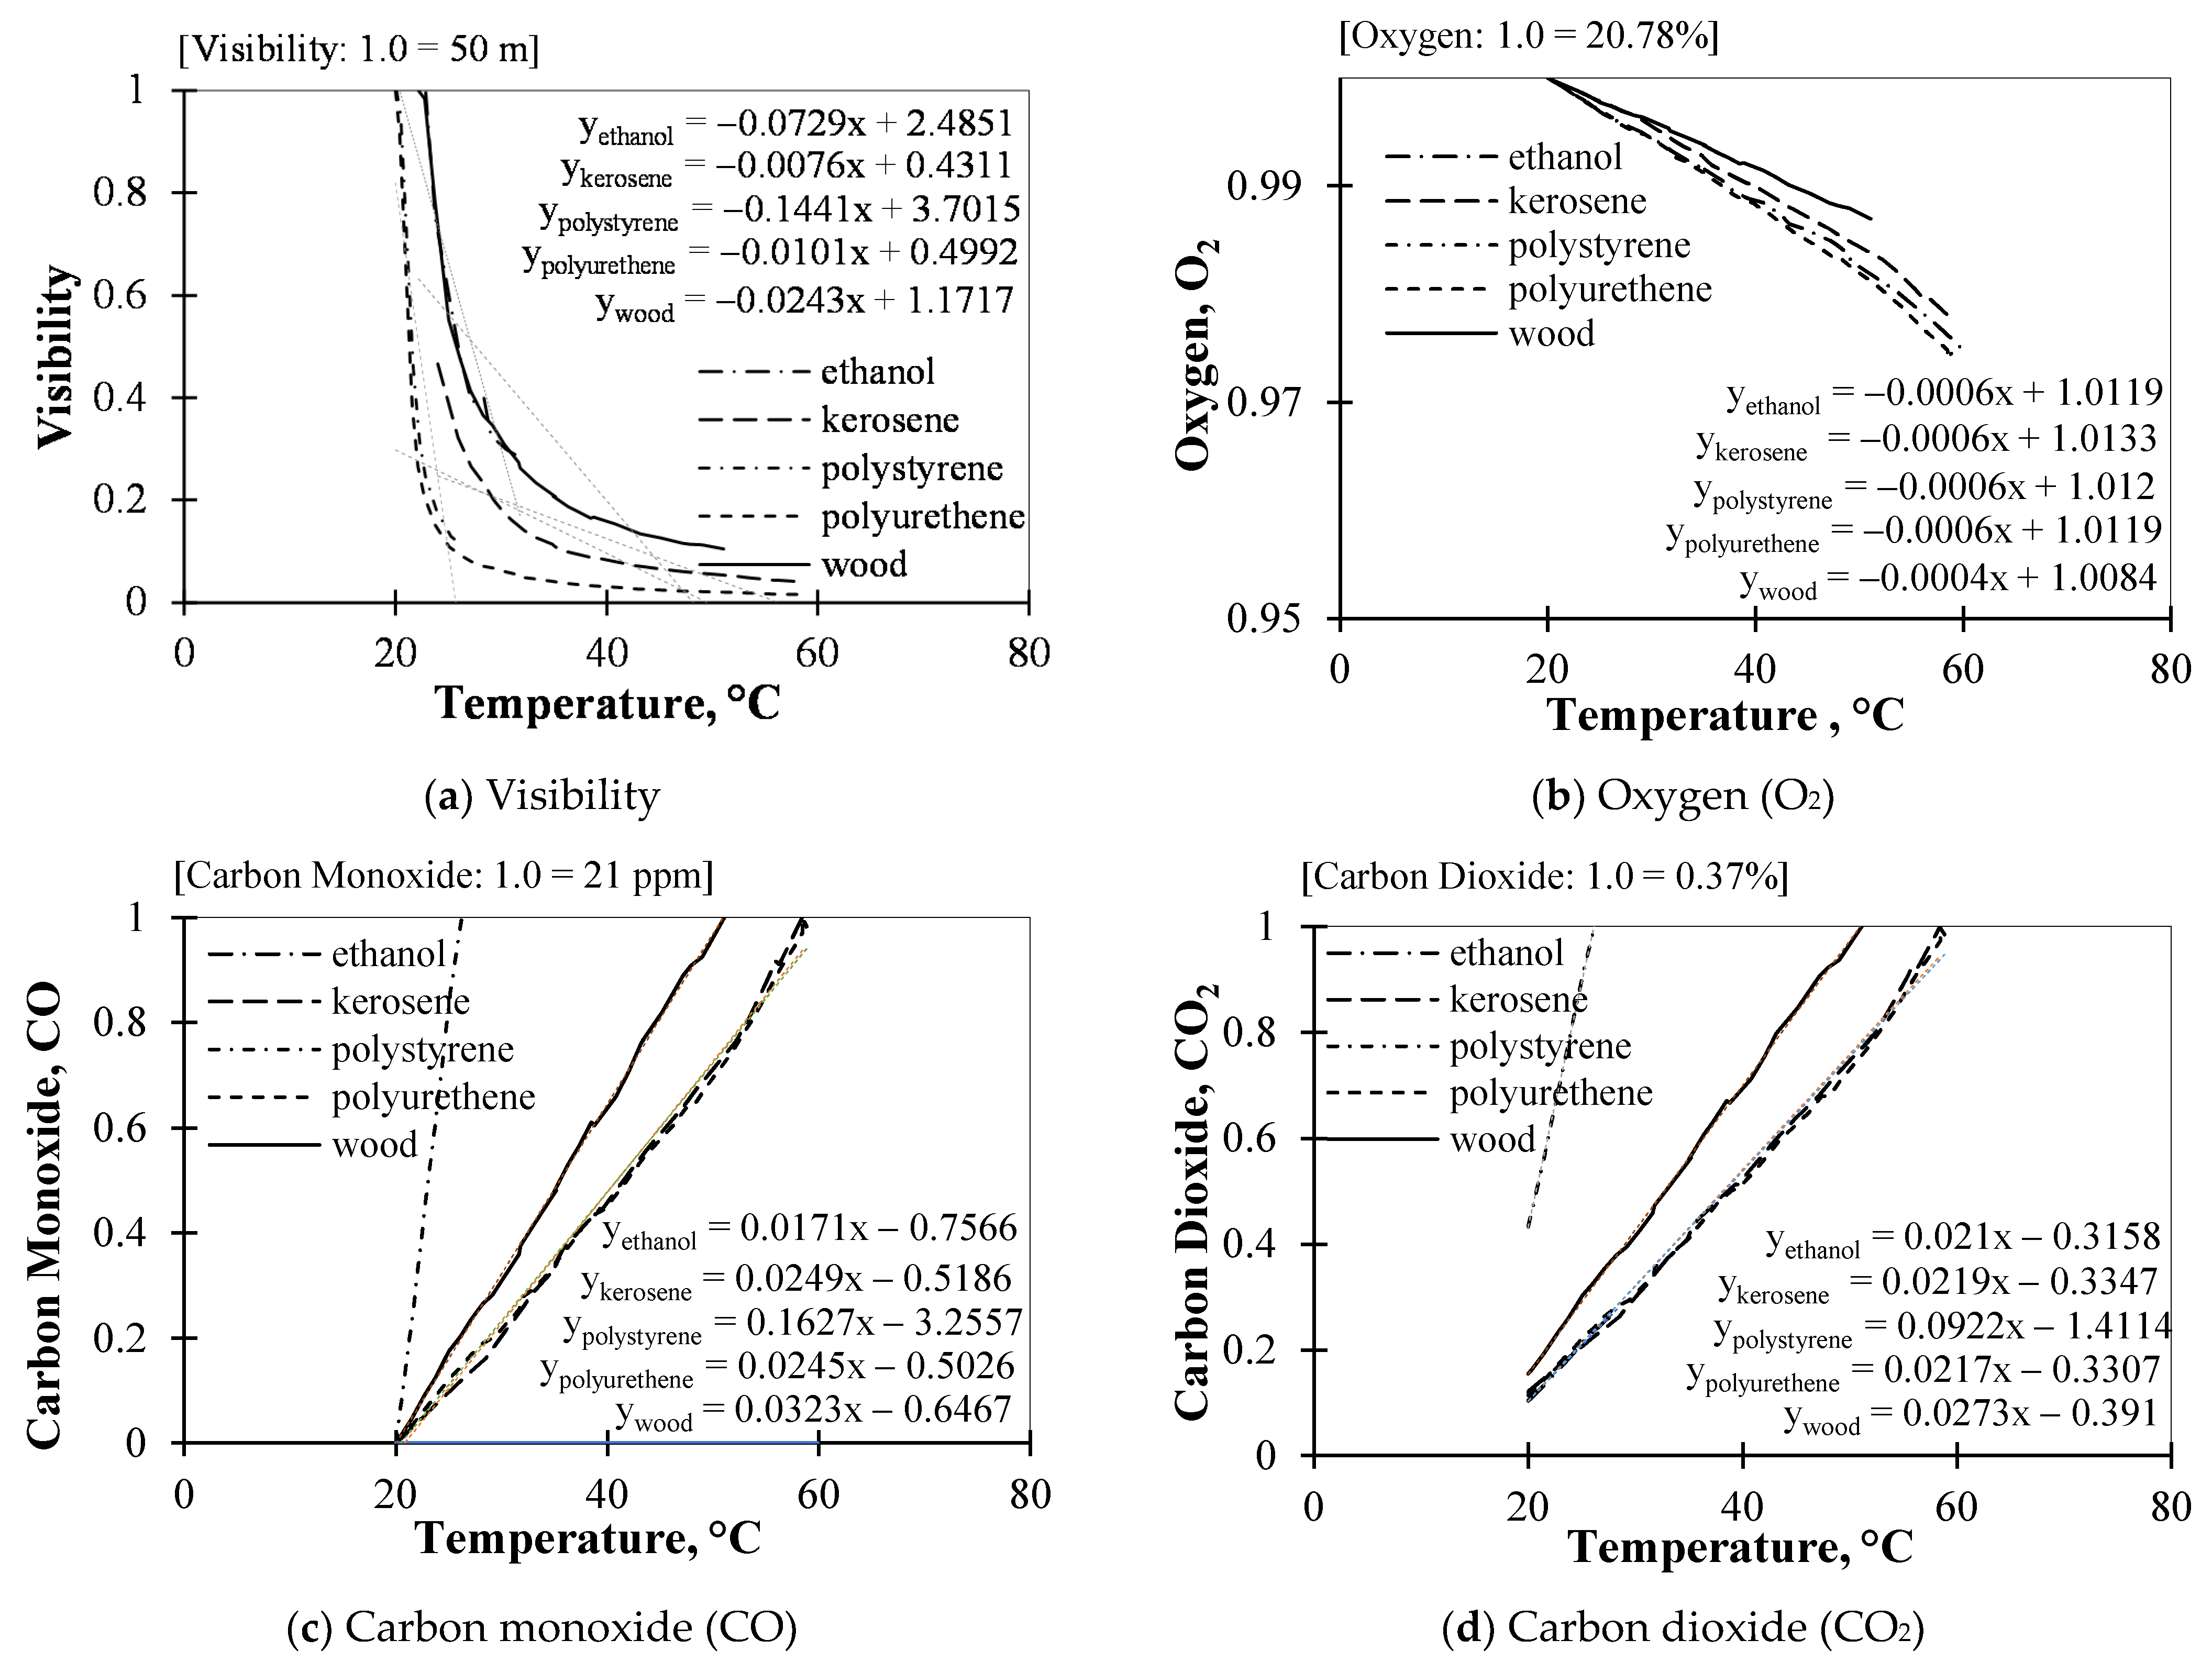
In this study, the ASET was evaluated in accordance with the tenability criteria shown in Table 2, based on the results of the simulation on the fire compartment and nonfire compartment, and DBs were built in this connection. Figure 8 and Figure 9 show the fire simulation results of fire compartment and nonfire compartment. In the NFPA, it is stipulated that the visibility should be larger than 5 m, the temperature less than 60 °C, CO concentration less than 1400 ppm, O2 greater than 15%, and CO2 less than 5%, in order to secure egress of occupants under fire. Therefore, the values in Figure 8 and Figure 9 were normalized in accordance with the tenability criteria of the NFPA, based on which DB groups were classified for ANN training. Table 4 and Table 5 summarize the slope values derived through the linear regression analysis for each graph. As shown in Figure 8 and Table 4, the DB group for ANN training was not divided into groups for the fire compartment. In case of the nonfire compartment, however, it was divided into three DB groups: i.e., group 1 (1–15 m), group 2 (16–25 m), and group 3 (26–50 m), according to the distance from the fire location, as shown in Figure 9 and Table 5. In addition, the maximum and minimum values of input and output parameters used in ANN training for the fire compartment and nonfire compartment are summarized in Table 6 and Table 7.
3. Artificial Neural Network (ANN) Model for Estimating Available Safe Egress Time (ASET)
3.1. ANN Training Algorithm
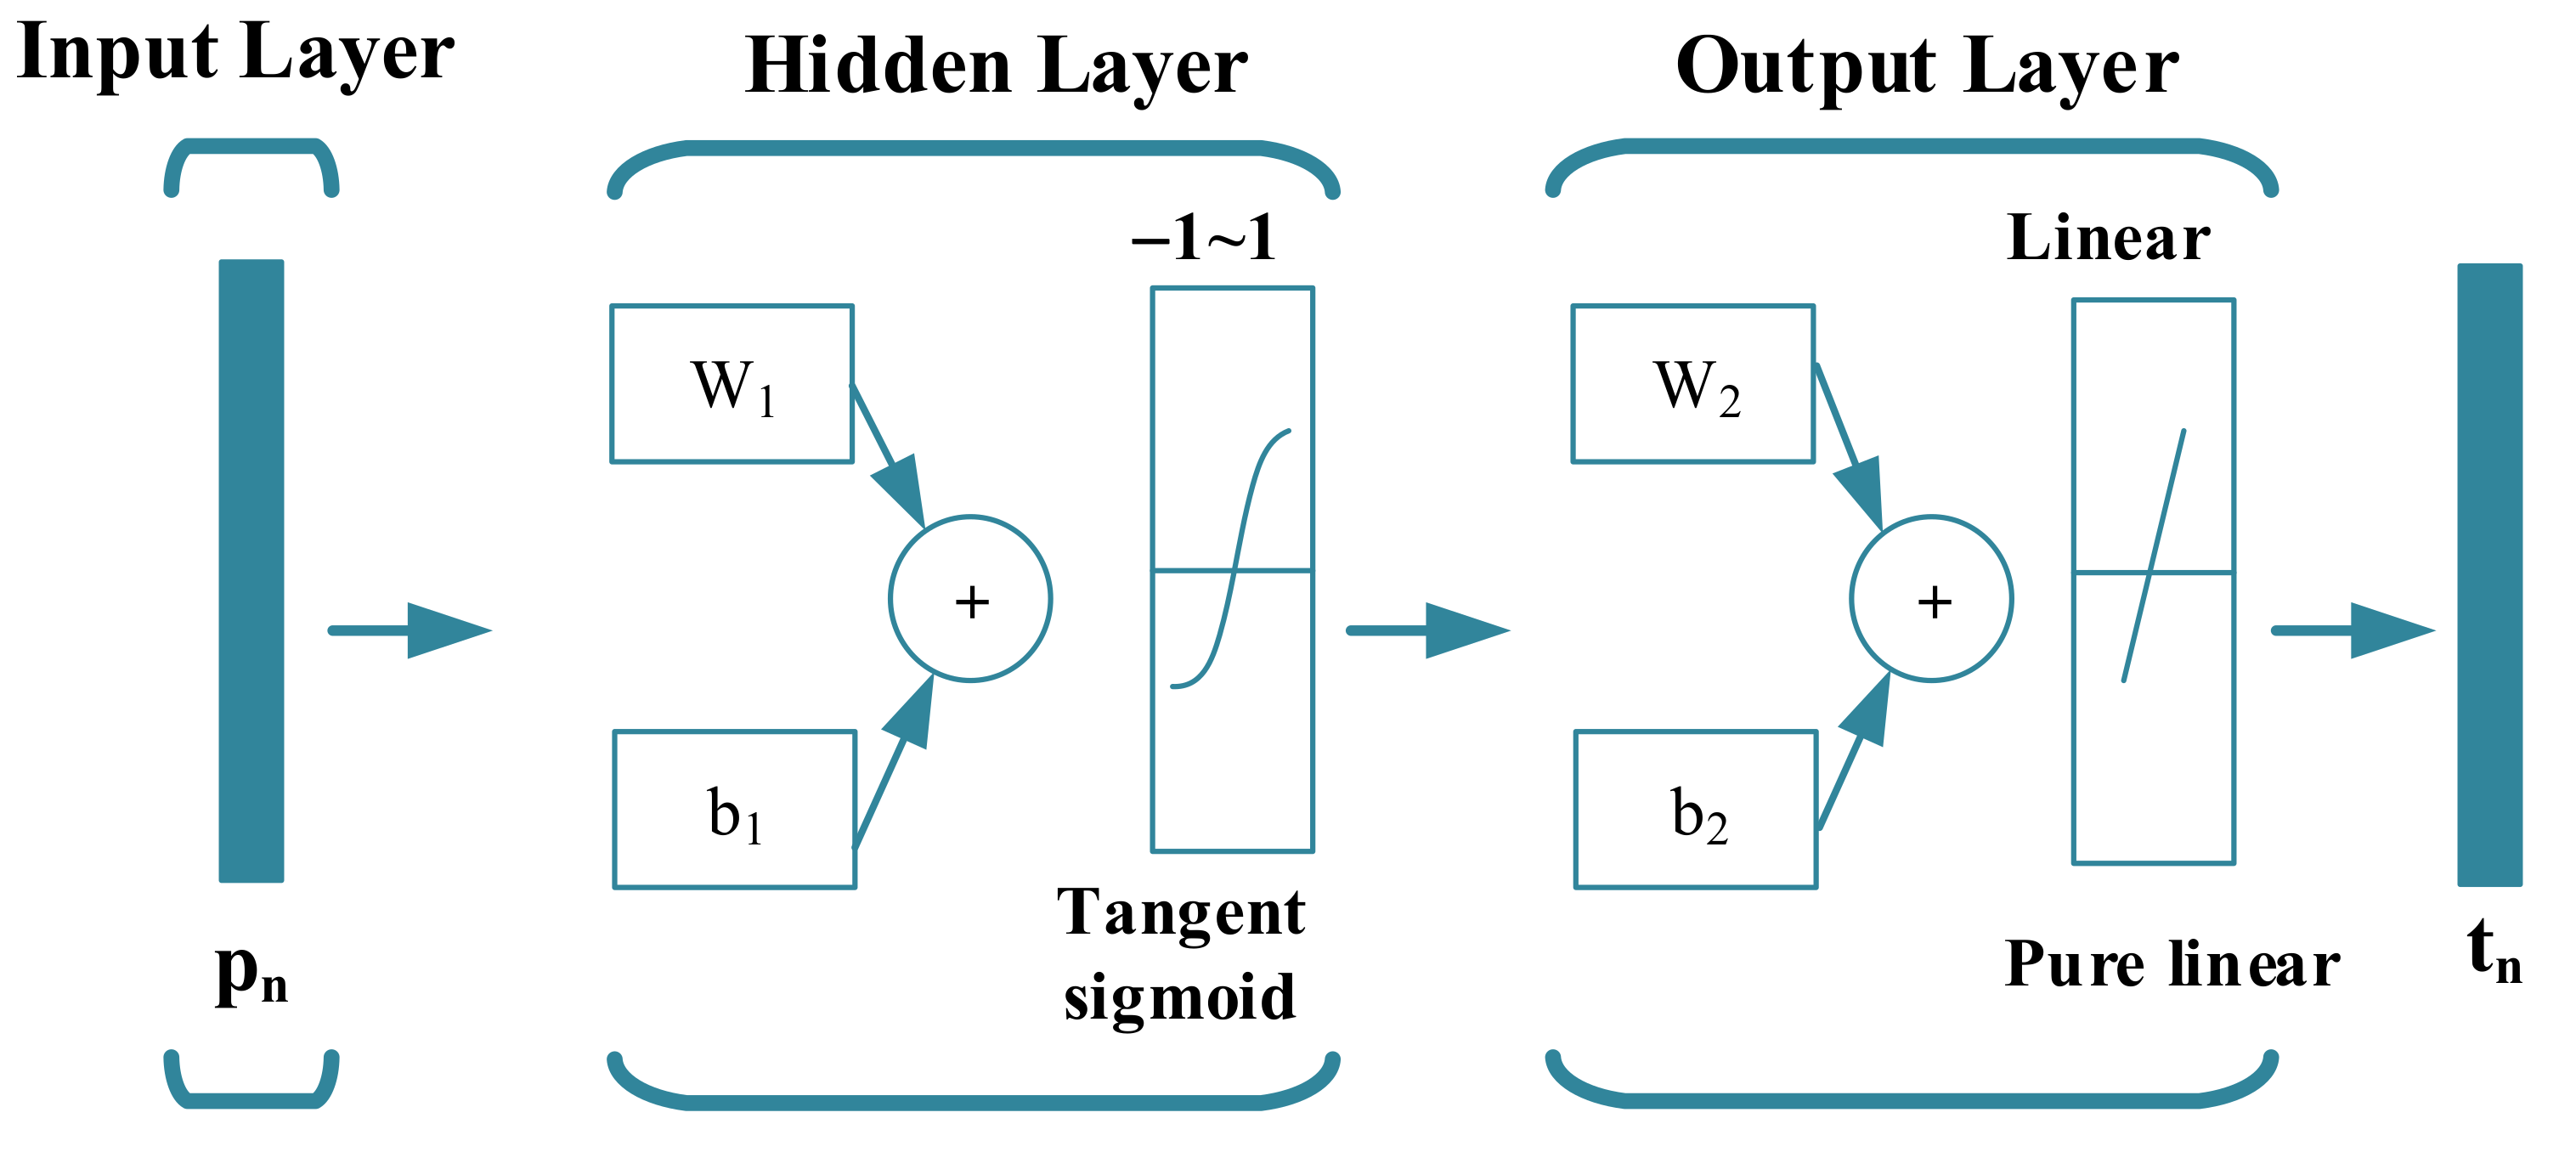
The ANN can be used to identify complex nonlinear relationships between input and output variables based on a database. In the ANN model, there exists information-processing units called neurons, and the neurons are connected to different weights indicating the strength of a relationship between the input and output variables. Training refers to a phase in which the weights are continuously adjusted to minimize the error [21,22,23,24]. The ANN model consists of an input layer, hidden layer, and output layer, as shown in Figure 10. In addition, the weight is applied differently for each neuron, and the bias applies to the neurons in the hidden and output layers. In this study, a hyperbolic tangent sigmoid transfer function was used as the activation function for the transfer from the input layer to the output layer, and a pure linear activation function was applied in the output layer [25,26,27].
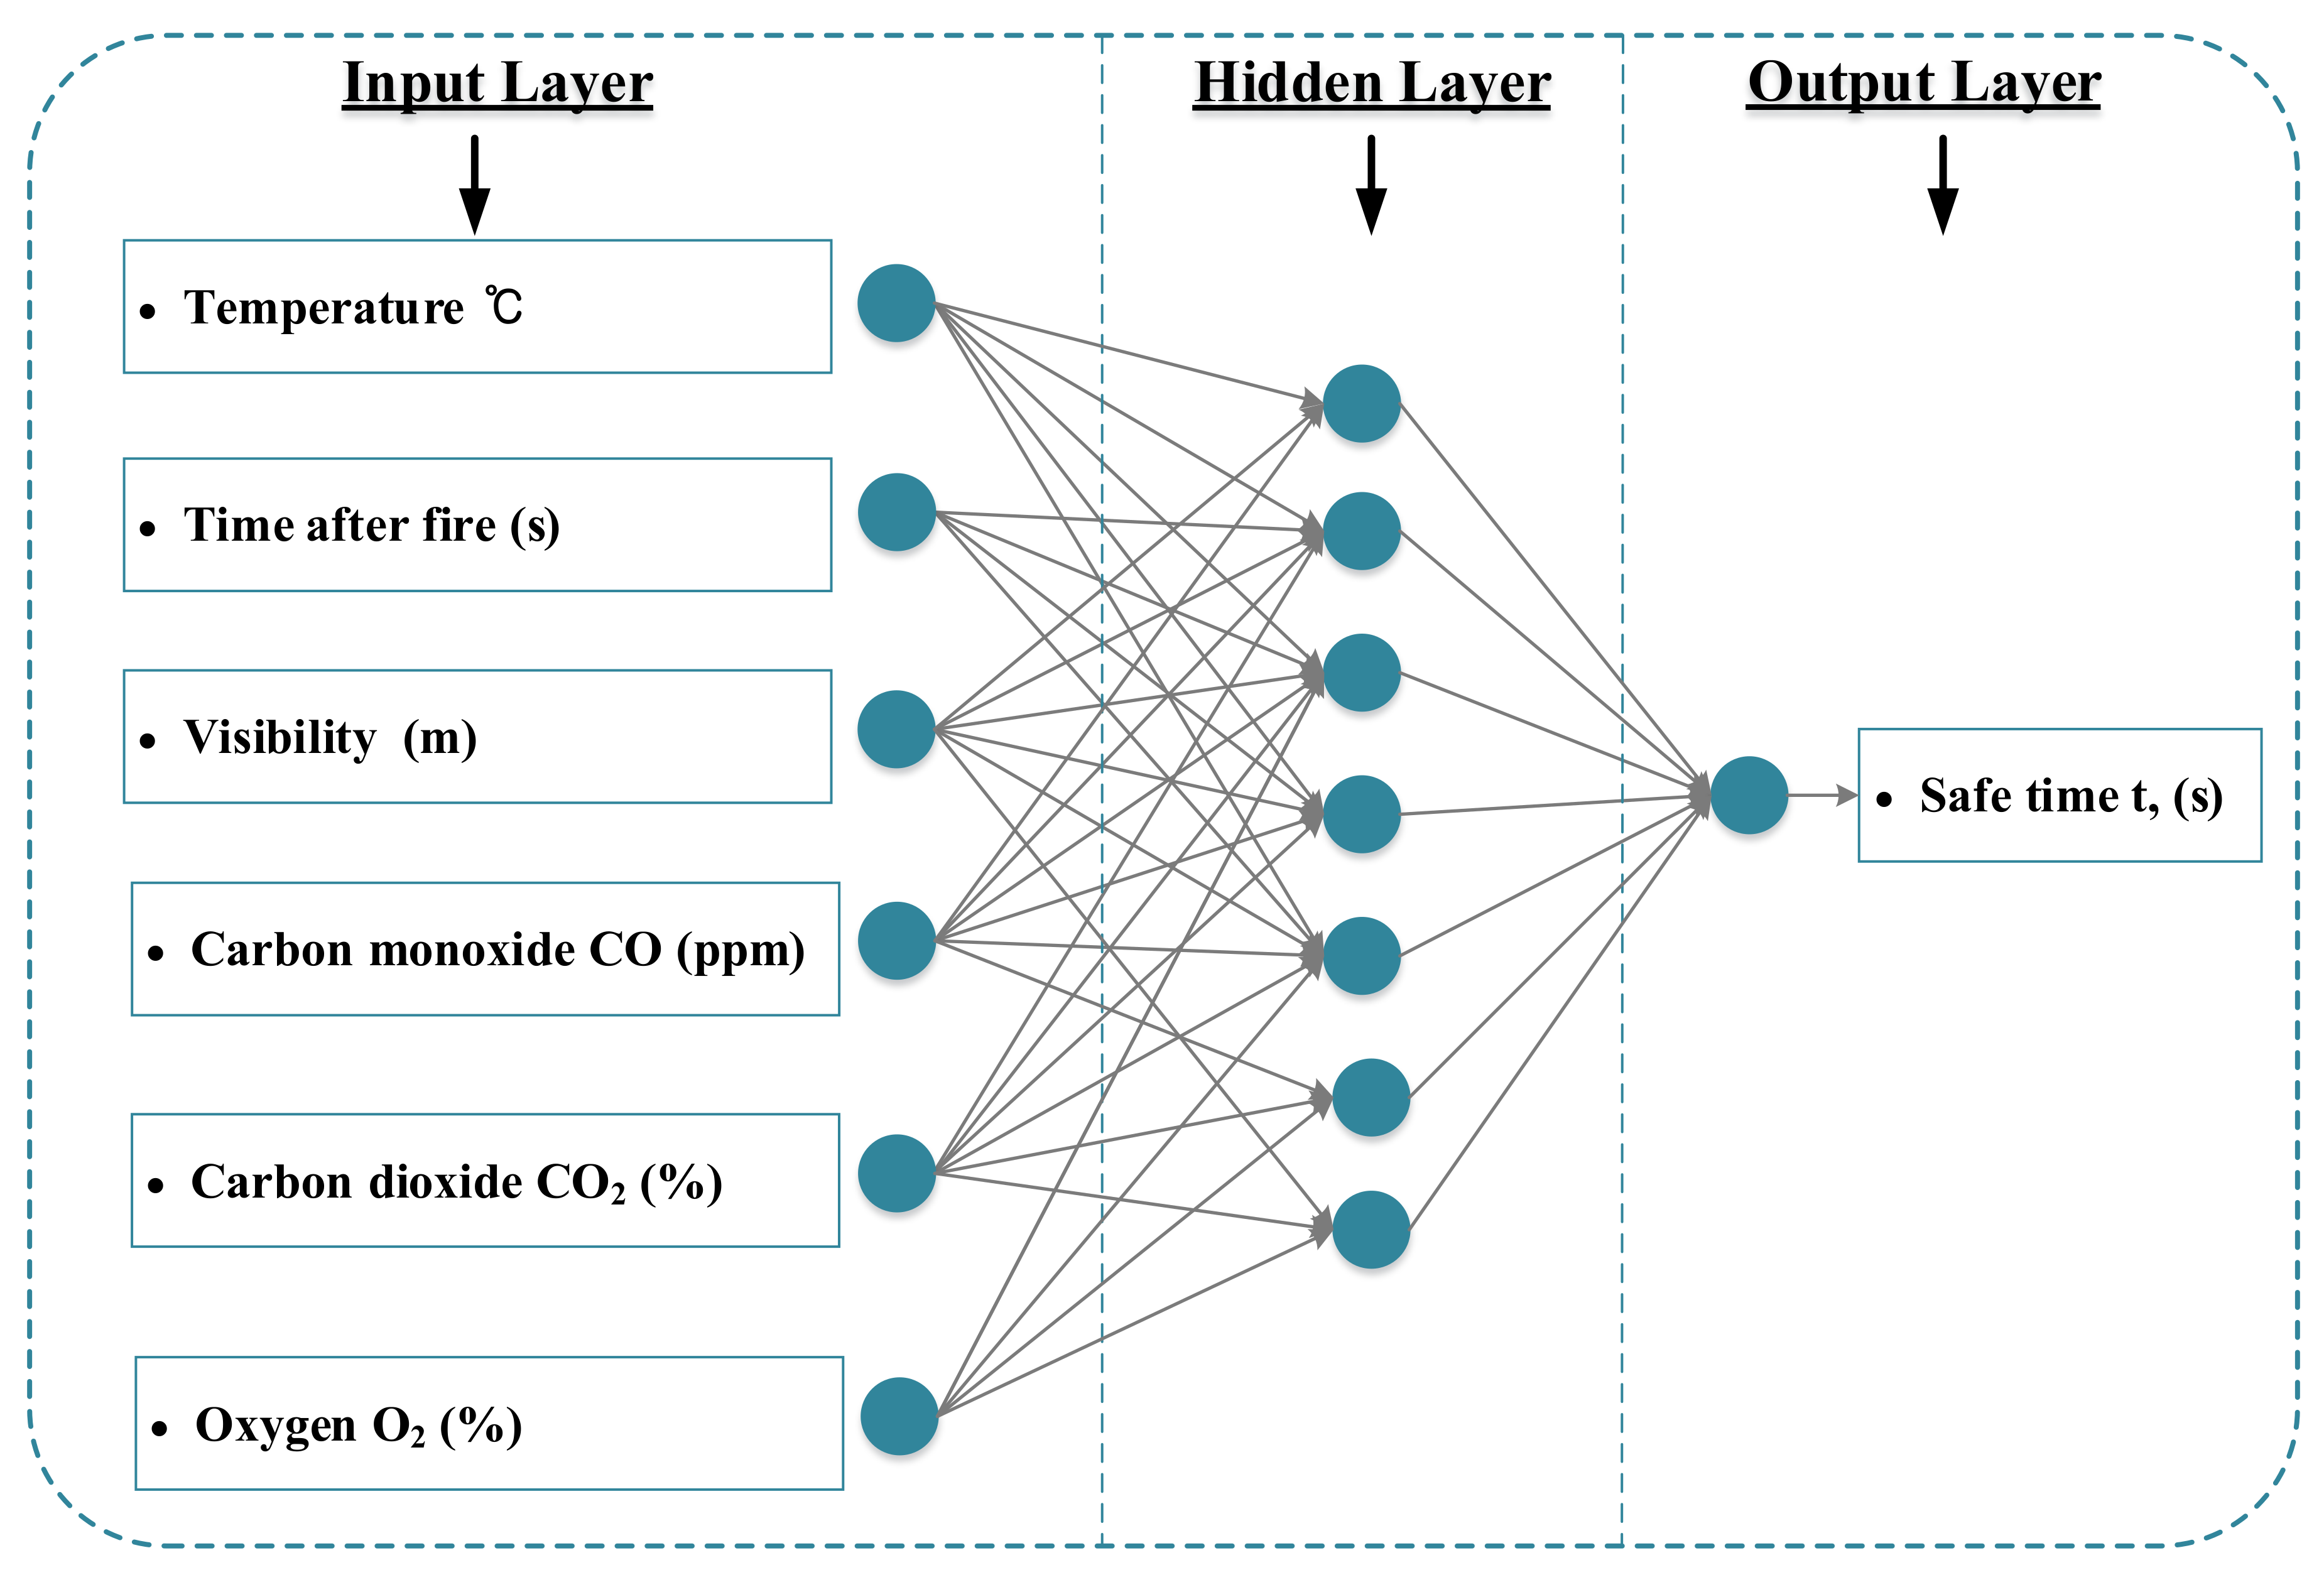
ANN training was performed for the fire compartment and nonfire compartment, and all the influencing factors essential for the ASET evaluation were set as input variables. In the ANN model for the fire compartment, six input variables were considered: the temperature, time after fire, visibility and concentrations of oxygen (O2), carbon dioxide (CO2), and carbon monoxide (CO). In the case of the ANN model for the nonfire compartment, the distance from the fire compartment was additionally considered in the input layers. As shown in Figure 11, the ANN model consists of one input layer, seven hidden layers, and one output layer. The ratios of data used in the training, validation, and test of the ANN model in the constructed DB were 70%, 15%, and 15%, respectively, and the data were randomly selected. The output derived from the ANN algorithm proposed in this study can be represented by the following function:
where, respectively, and are the normalized input and output values, and represent the weight and bias between the input and hidden layer, and are the weight and bias between the hidden and output layer, and and are the activation function in hidden and output layer.
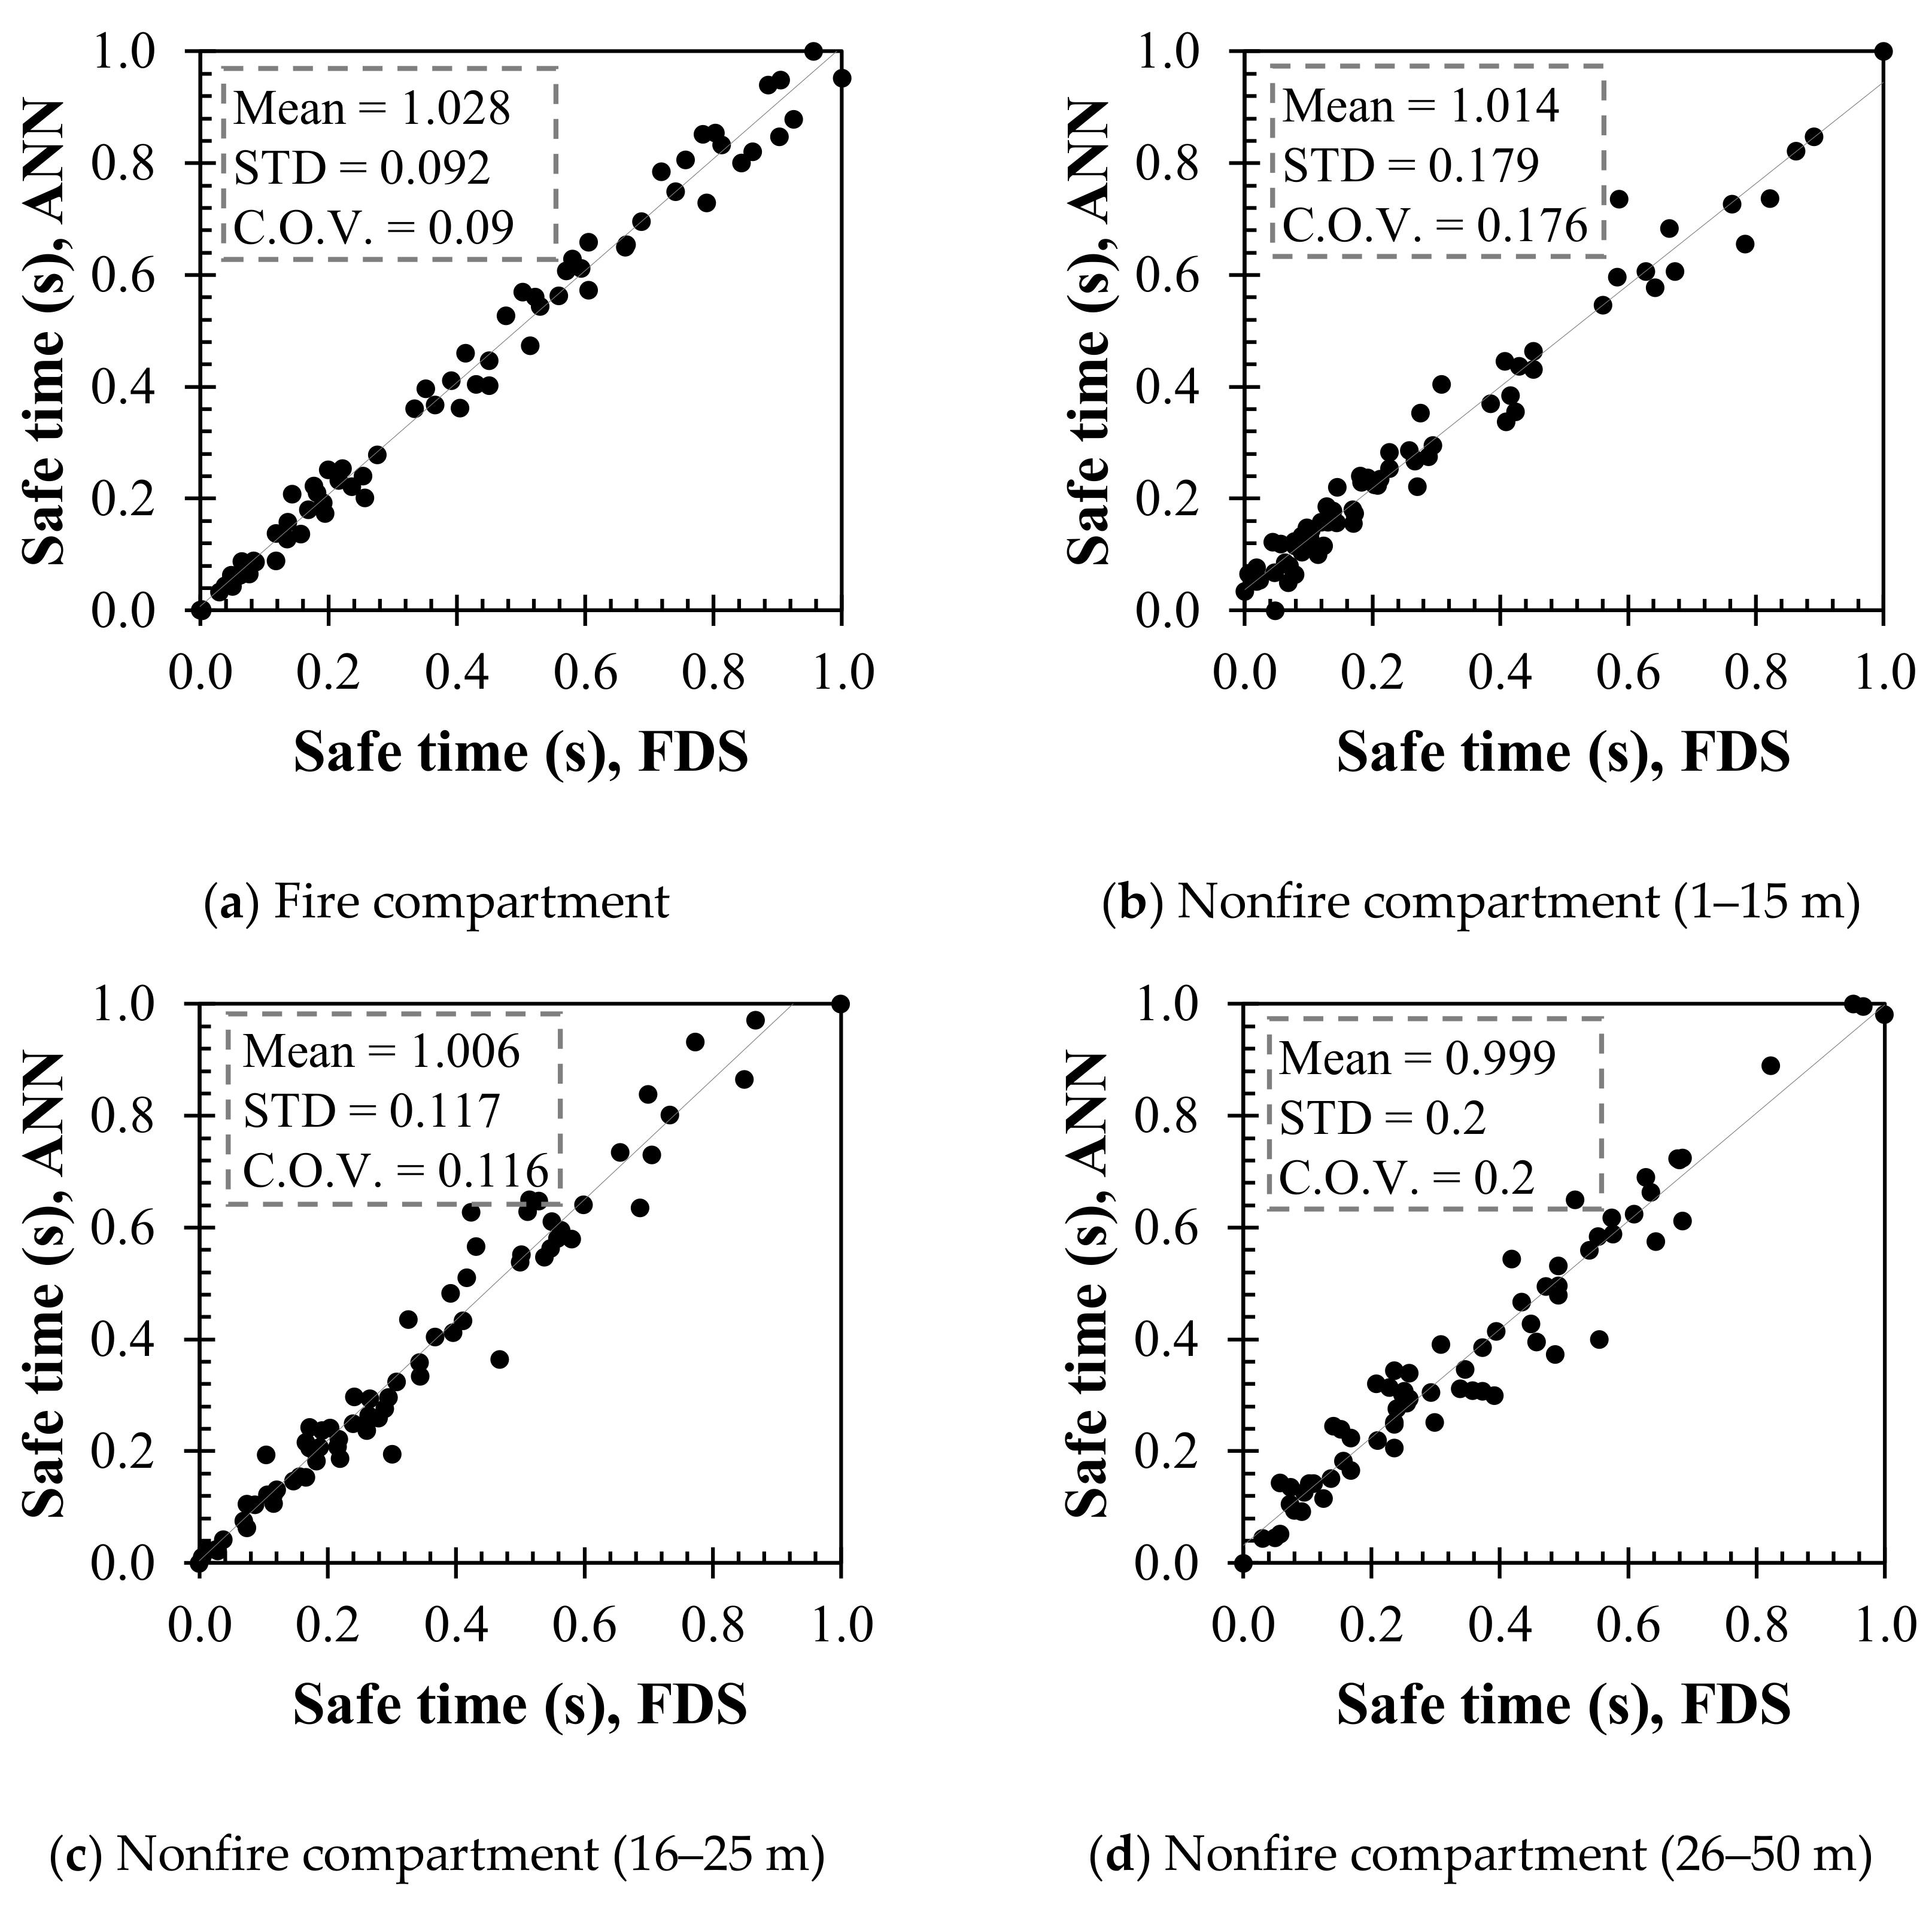
3.2. Training Results
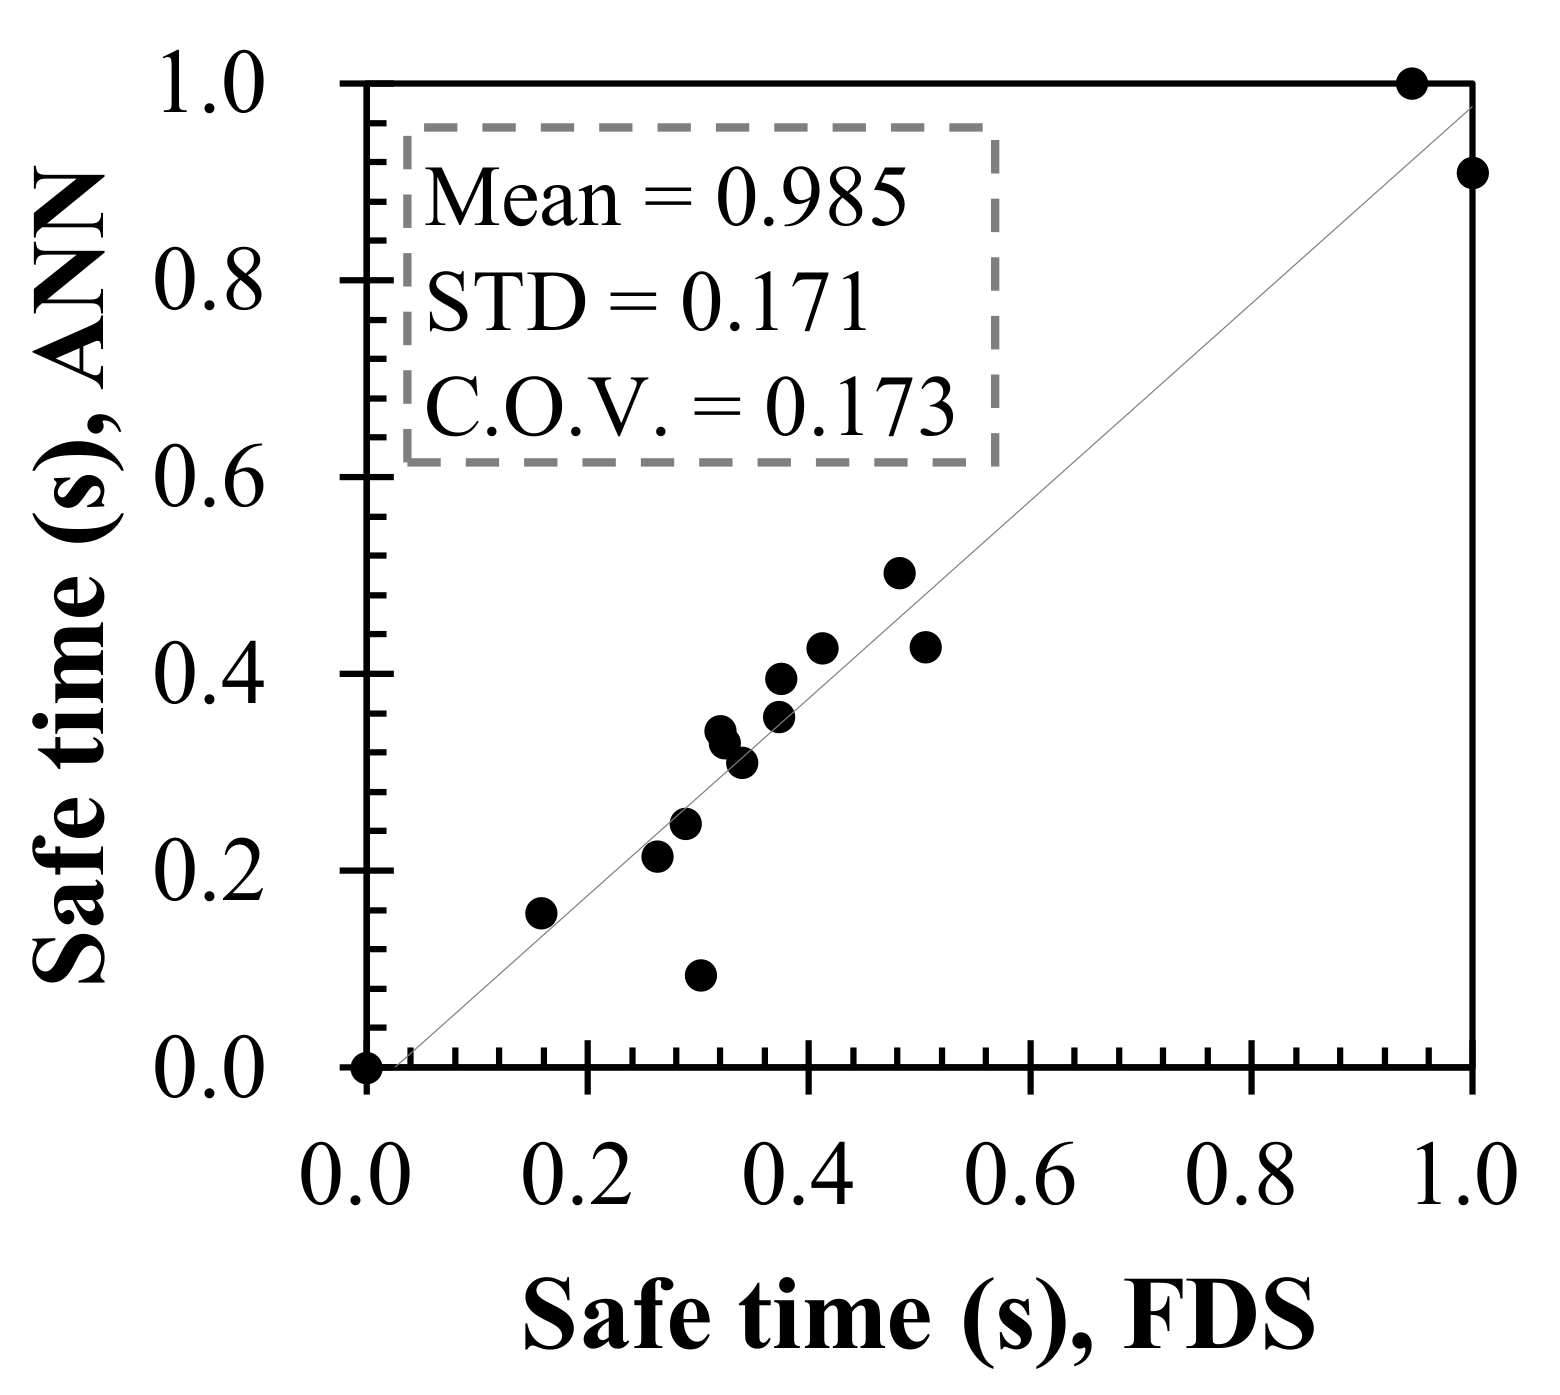
The weight and bias of the ASET prediction algorithm for the fire compartment and nonfire compartment were derived through the ANN training. Table 8 represents the weight and bias values at the fire compartment, and Figure 12 shows the training results of the proposed ANN model. The ANN model was found to be well trained because the COV (coefficient of variation) of the analysis results for both the fire compartment and nonfire compartment were 0.2 or less. Later, the reliability of the ANN model was verified using 15 fire simulation data that were not used in the training process. As shown in Figure 13, the COV for the ratio of the ANN analysis results to the FDS analysis results was 0.173, and this result suggests that the proposed model provides ASET, which is similar to the fire simulation.
3.3. Verification of ANN Model
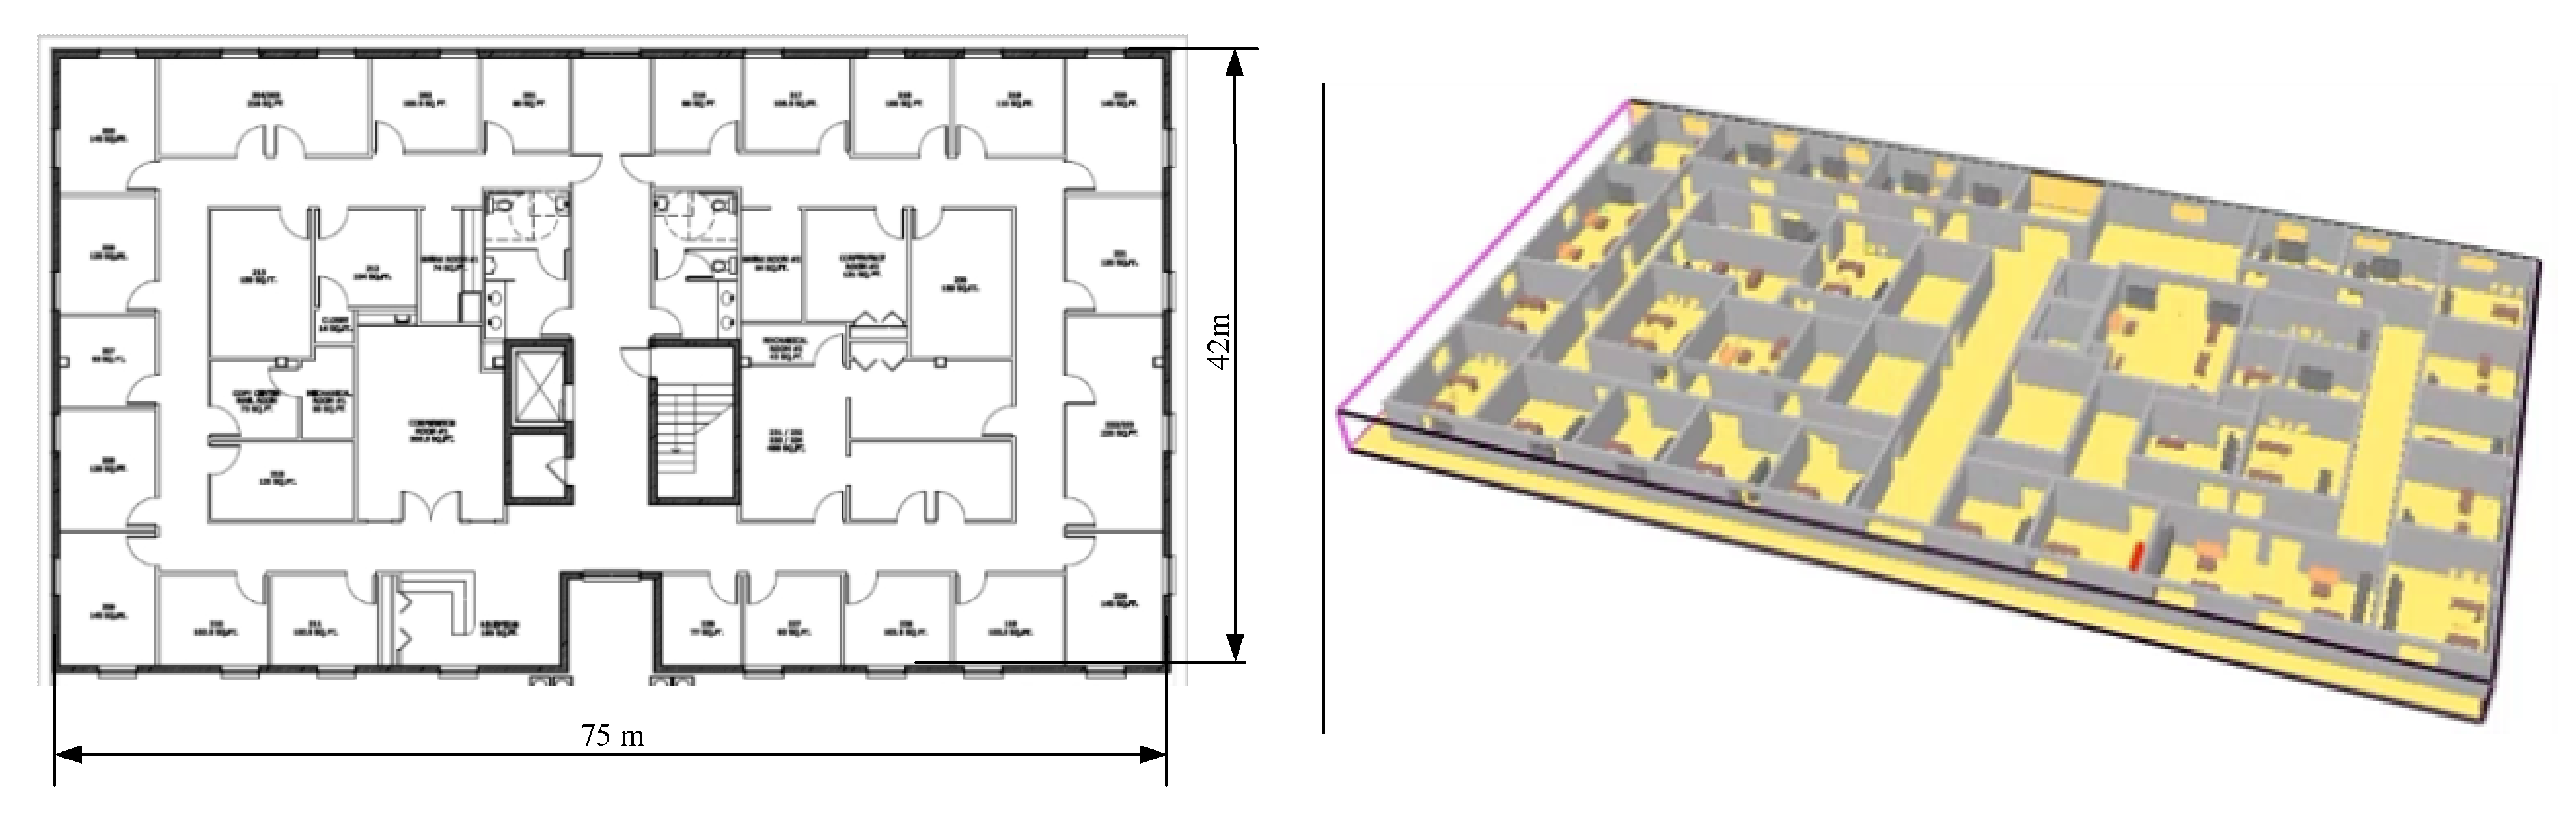
In order to examine whether the proposed ANN model can be applied to other multiplex buildings, a fire simulation was carried out on a new multiplex building with a floor area of 3150 m2 (75 m × 42 m), as shown in Figure 14. The type of fuels and the location of fire sources were set as main variables in the same way as in the simulation conducted previously. Polystyrene foams and polyurethane foams were considered as fuels, and the location of fire sources was divided into ten compartments. As shown in Table 9, the fire simulation was conducted on a total of 20 scenarios. For the fire growth curve, fire loads according to the fuel type were calculated based on the DB provided by NCFS [18], and the maximum HRR value was applied to the t-squared fire curve, in which the fire growth rate was set to medium. The natural ventilation condition was considered as in the simulation conducted earlier, and the building has 26 openings (windows and doors) which is 14.1% of the opening ratio, i.e., the ratio of total opening area to outer wall perimetric area.
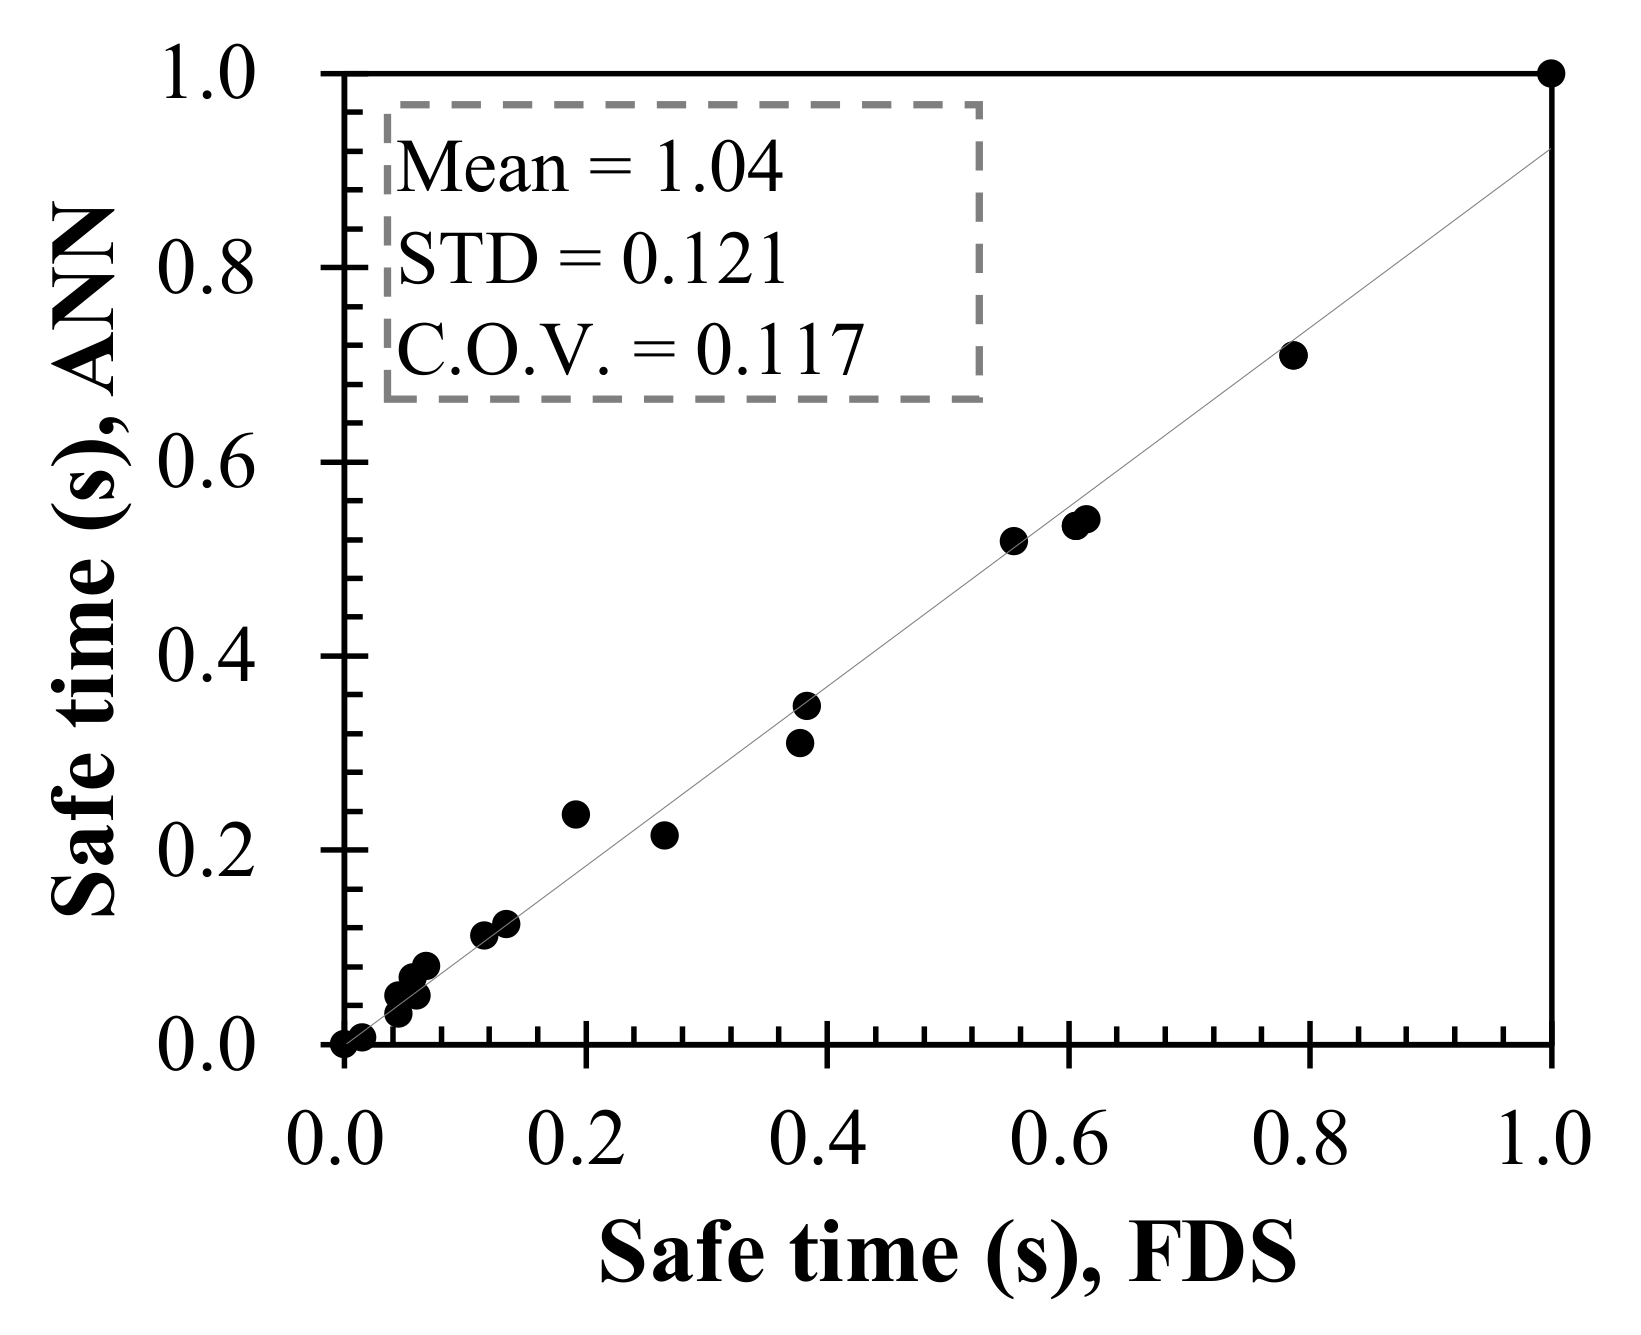
Table 10 summarizes the FDS analysis results at a random fire point. The temperature, visibility, and concentrations of oxygen (O2), carbon dioxide (CO2), and carbon monoxide (CO) obtained from the FDS analysis were entered into the proposed ANN model to estimate the ASET. Figure 15 and Table 11 show a comparison between the FDS and ANN analysis results. The verification results showed that the average error rate of the FDS and ANN models was only 8.3%, and the COV of the ratio of the ANN analysis results to the FDS analysis results was 0.117, which means that the proposed model had achieved high levels of reliability.
4. Egress Model for Multiplex Buildings in Fire
4.1. Egress Model Algorithm
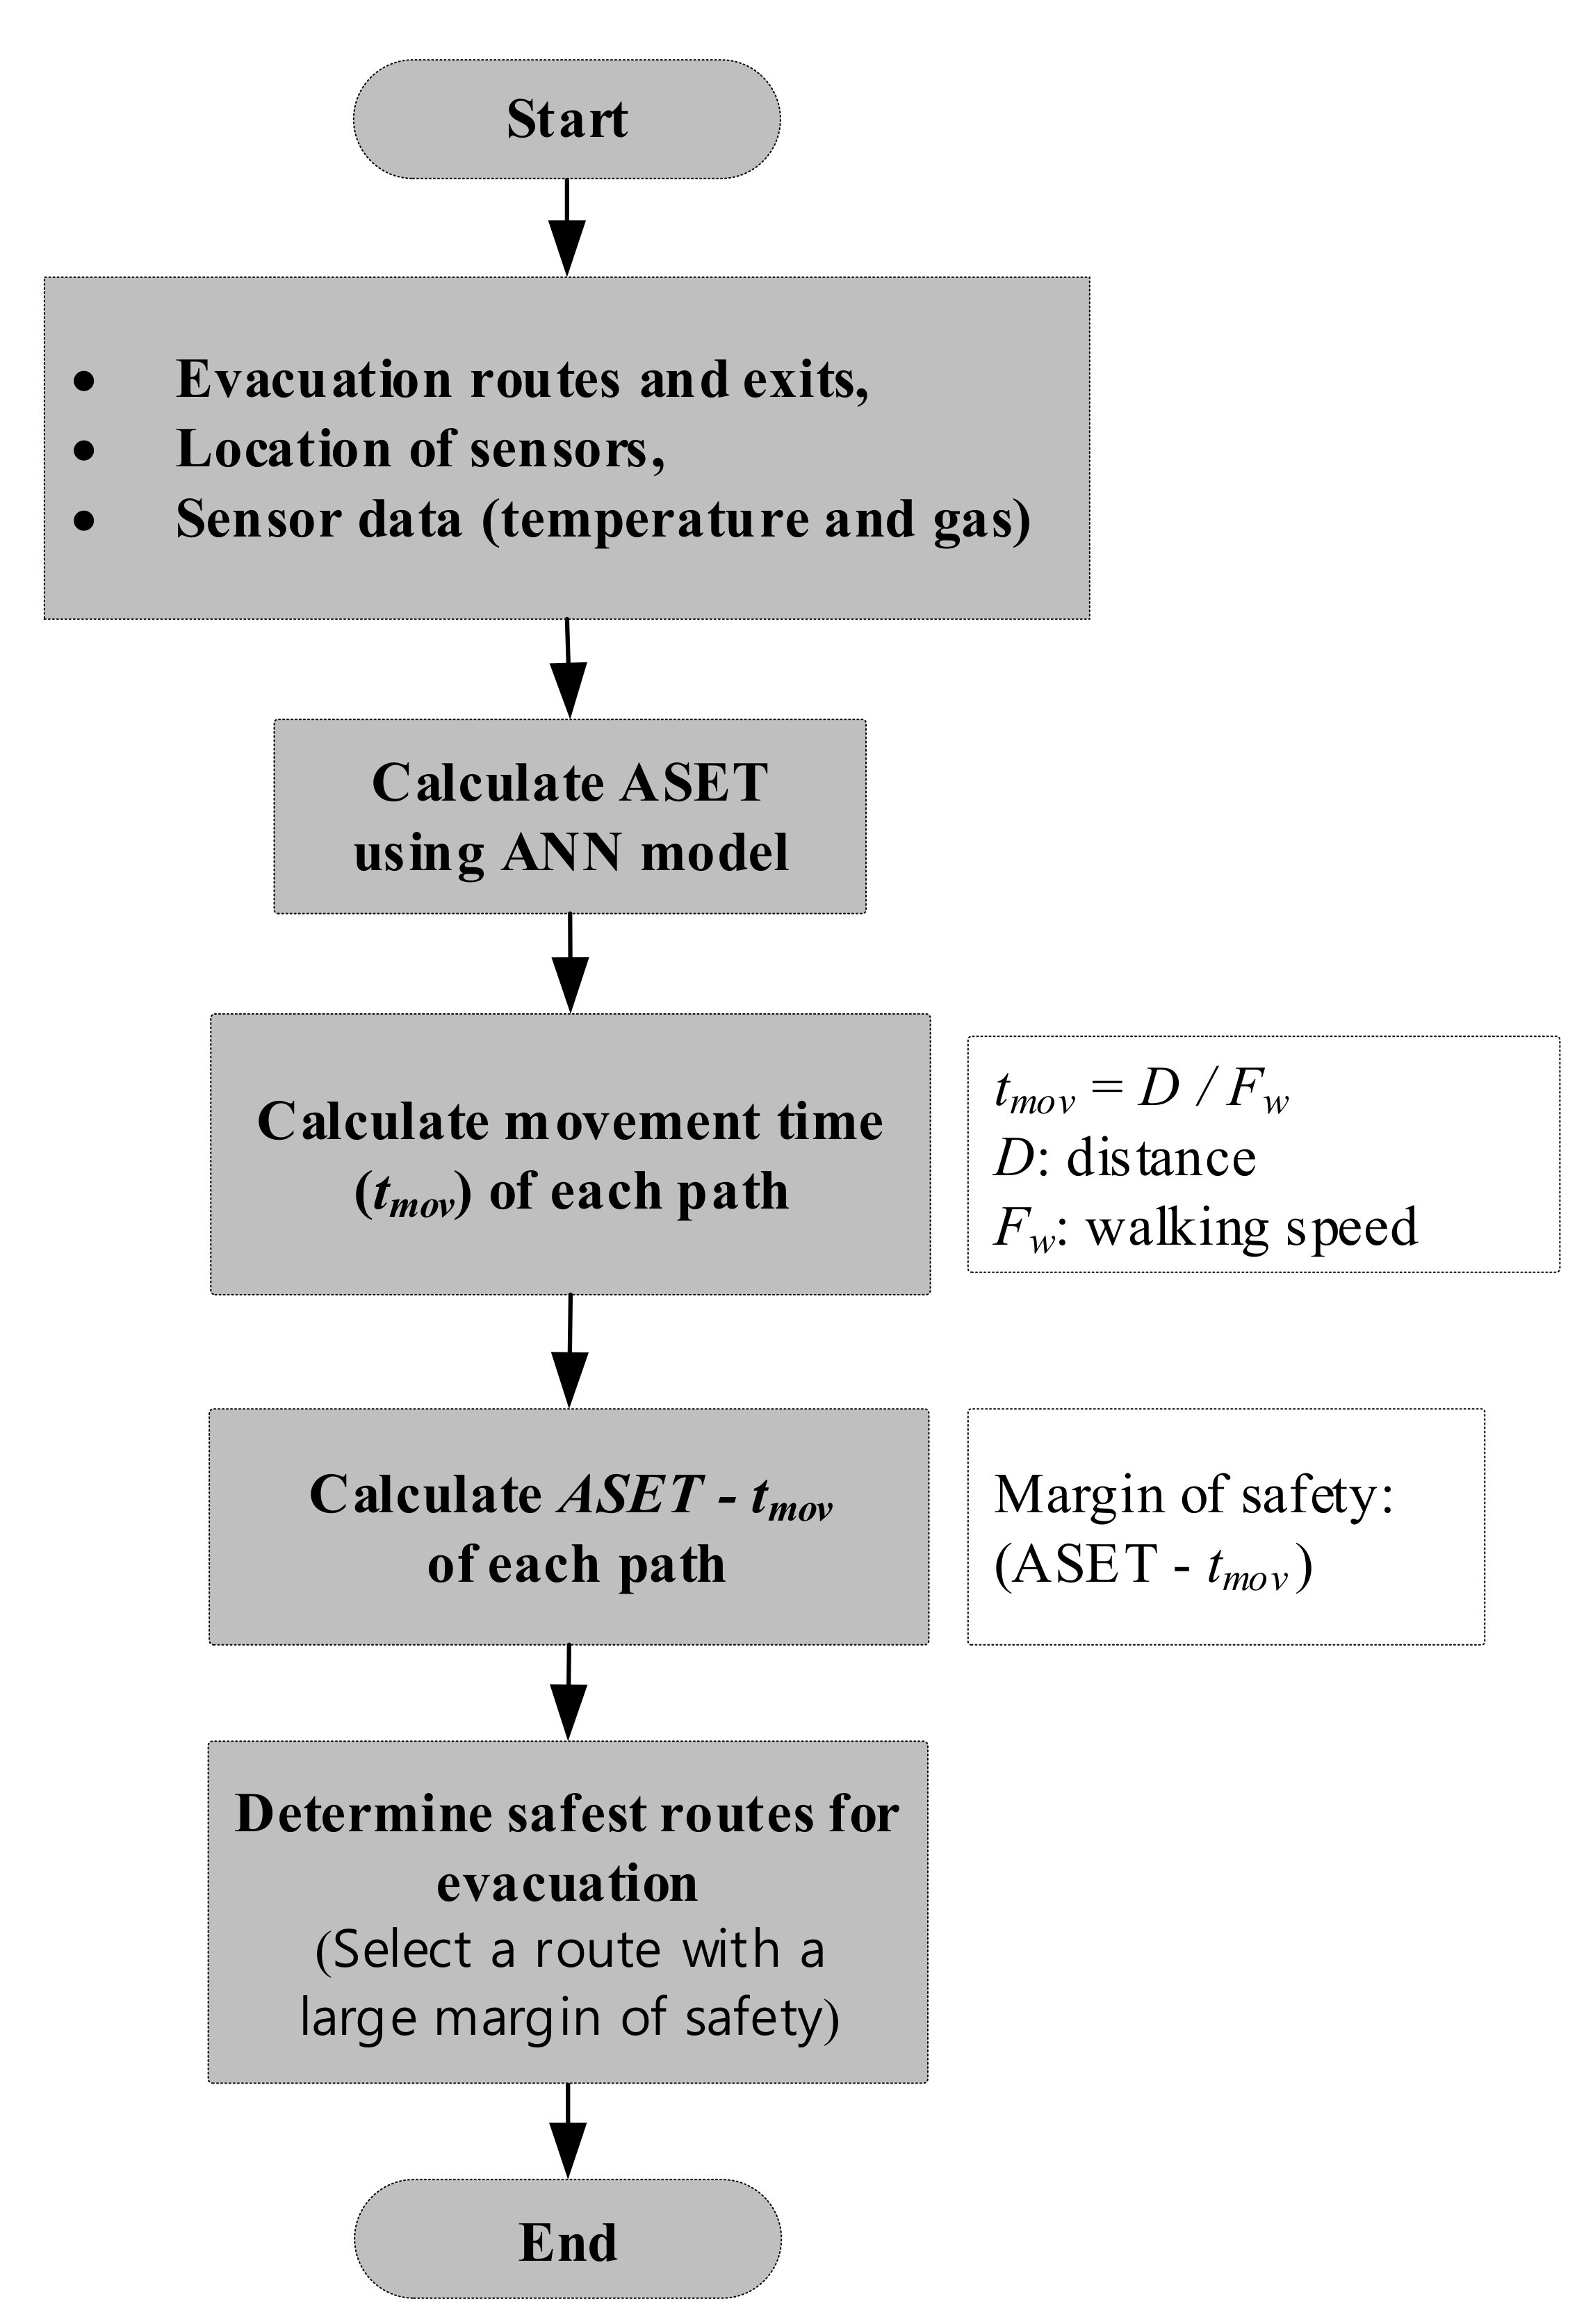
In this study, an egress model that can provide optimal evacuation routes for occupants when a fire occurs in multiplex buildings was proposed based on the ANN model developed. Figure 16 shows the flowchart of the proposed egress model. First, the visibility and concentrations of oxygen, carbon monoxide, and carbon dioxide are measured using sensors installed at each compartment in the event of a fire, and the data are then entered into the ANN model to estimate ASET for each compartment. Later, the optimum routes that ensure safety can be provided in real time based on the ASET of each compartment and drawings for the building.
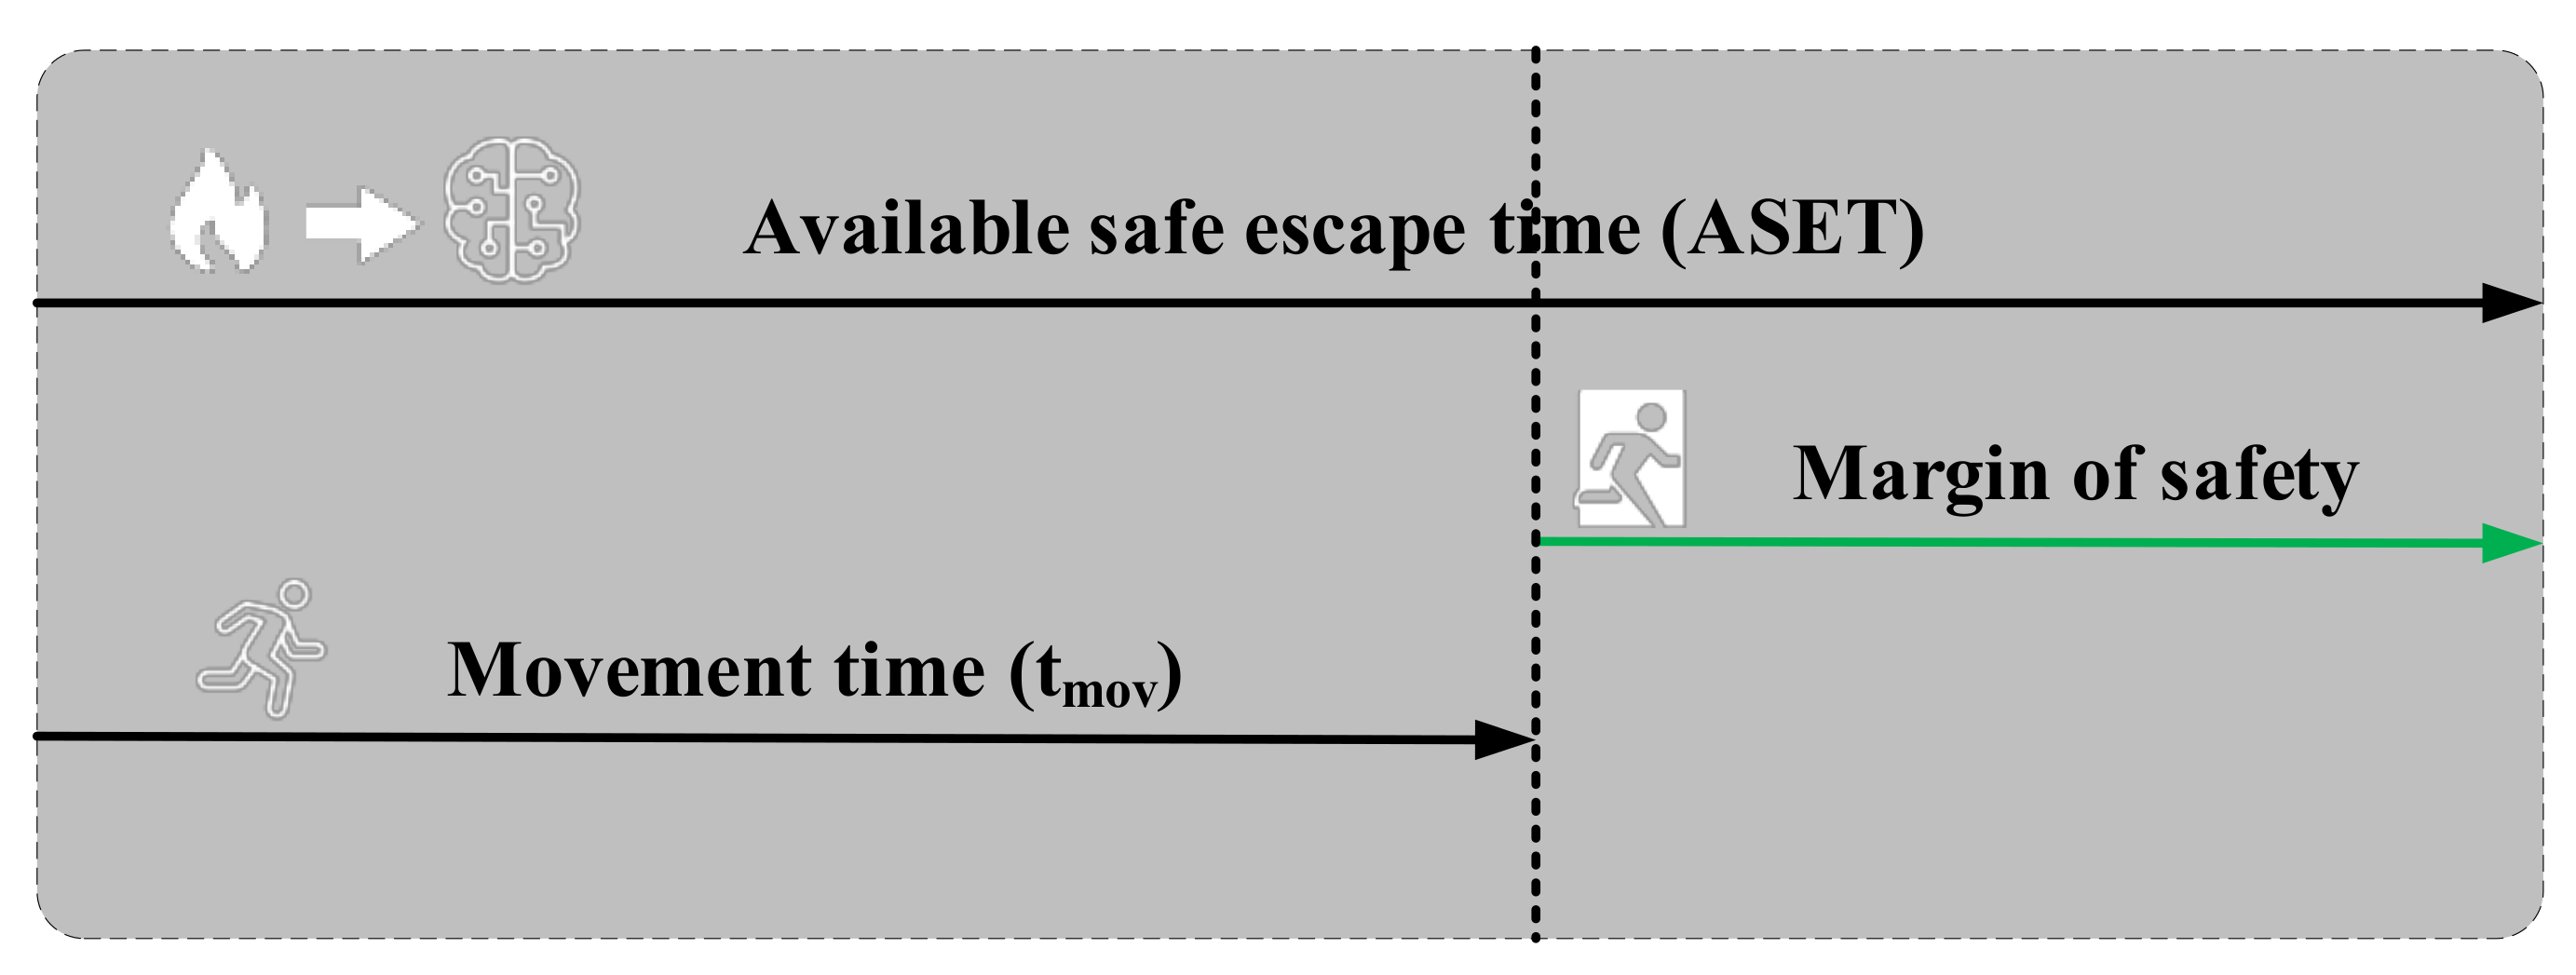
The ANN-based egress model is an algorithm in which the position of each measurement sensor installed in a multiplex building is set to each node, and the ASET at each node in the event of a fire is calculated to induce evacuation to the node with the highest level of safety among the adjacent nodes. In this case, it is essential to compare movement time between nodes and ASET. The movement time between the nodes () can be calculated in consideration of occupants’ walking speeds and distance between the nodes:
where is the movement distance between the nodes, and is the occupant’s walking speed, which is taken to be 1.272 m/s based on the results of research conducted by Bohannon [28]. Note that in this research, the occupant was assumed to be elderly (i.e., age = 70, sex = female) in a conservative manner, which certainly can always be adjusted depending on the purpose of the analysis. If the movement time between specific nodes is less than the ASET predicted using the ANN model, i.e., , the evacuation route is determined as the path between the nodes. Even in this case, a route with a large margin of safety (i.e., ) is preferentially selected over others. The repetition of this calculation procedure can lead to the optimum evacuation route to ensure the safety of occupants, as shown in Figure 17.
4.2. Application of Proposed Egress Model
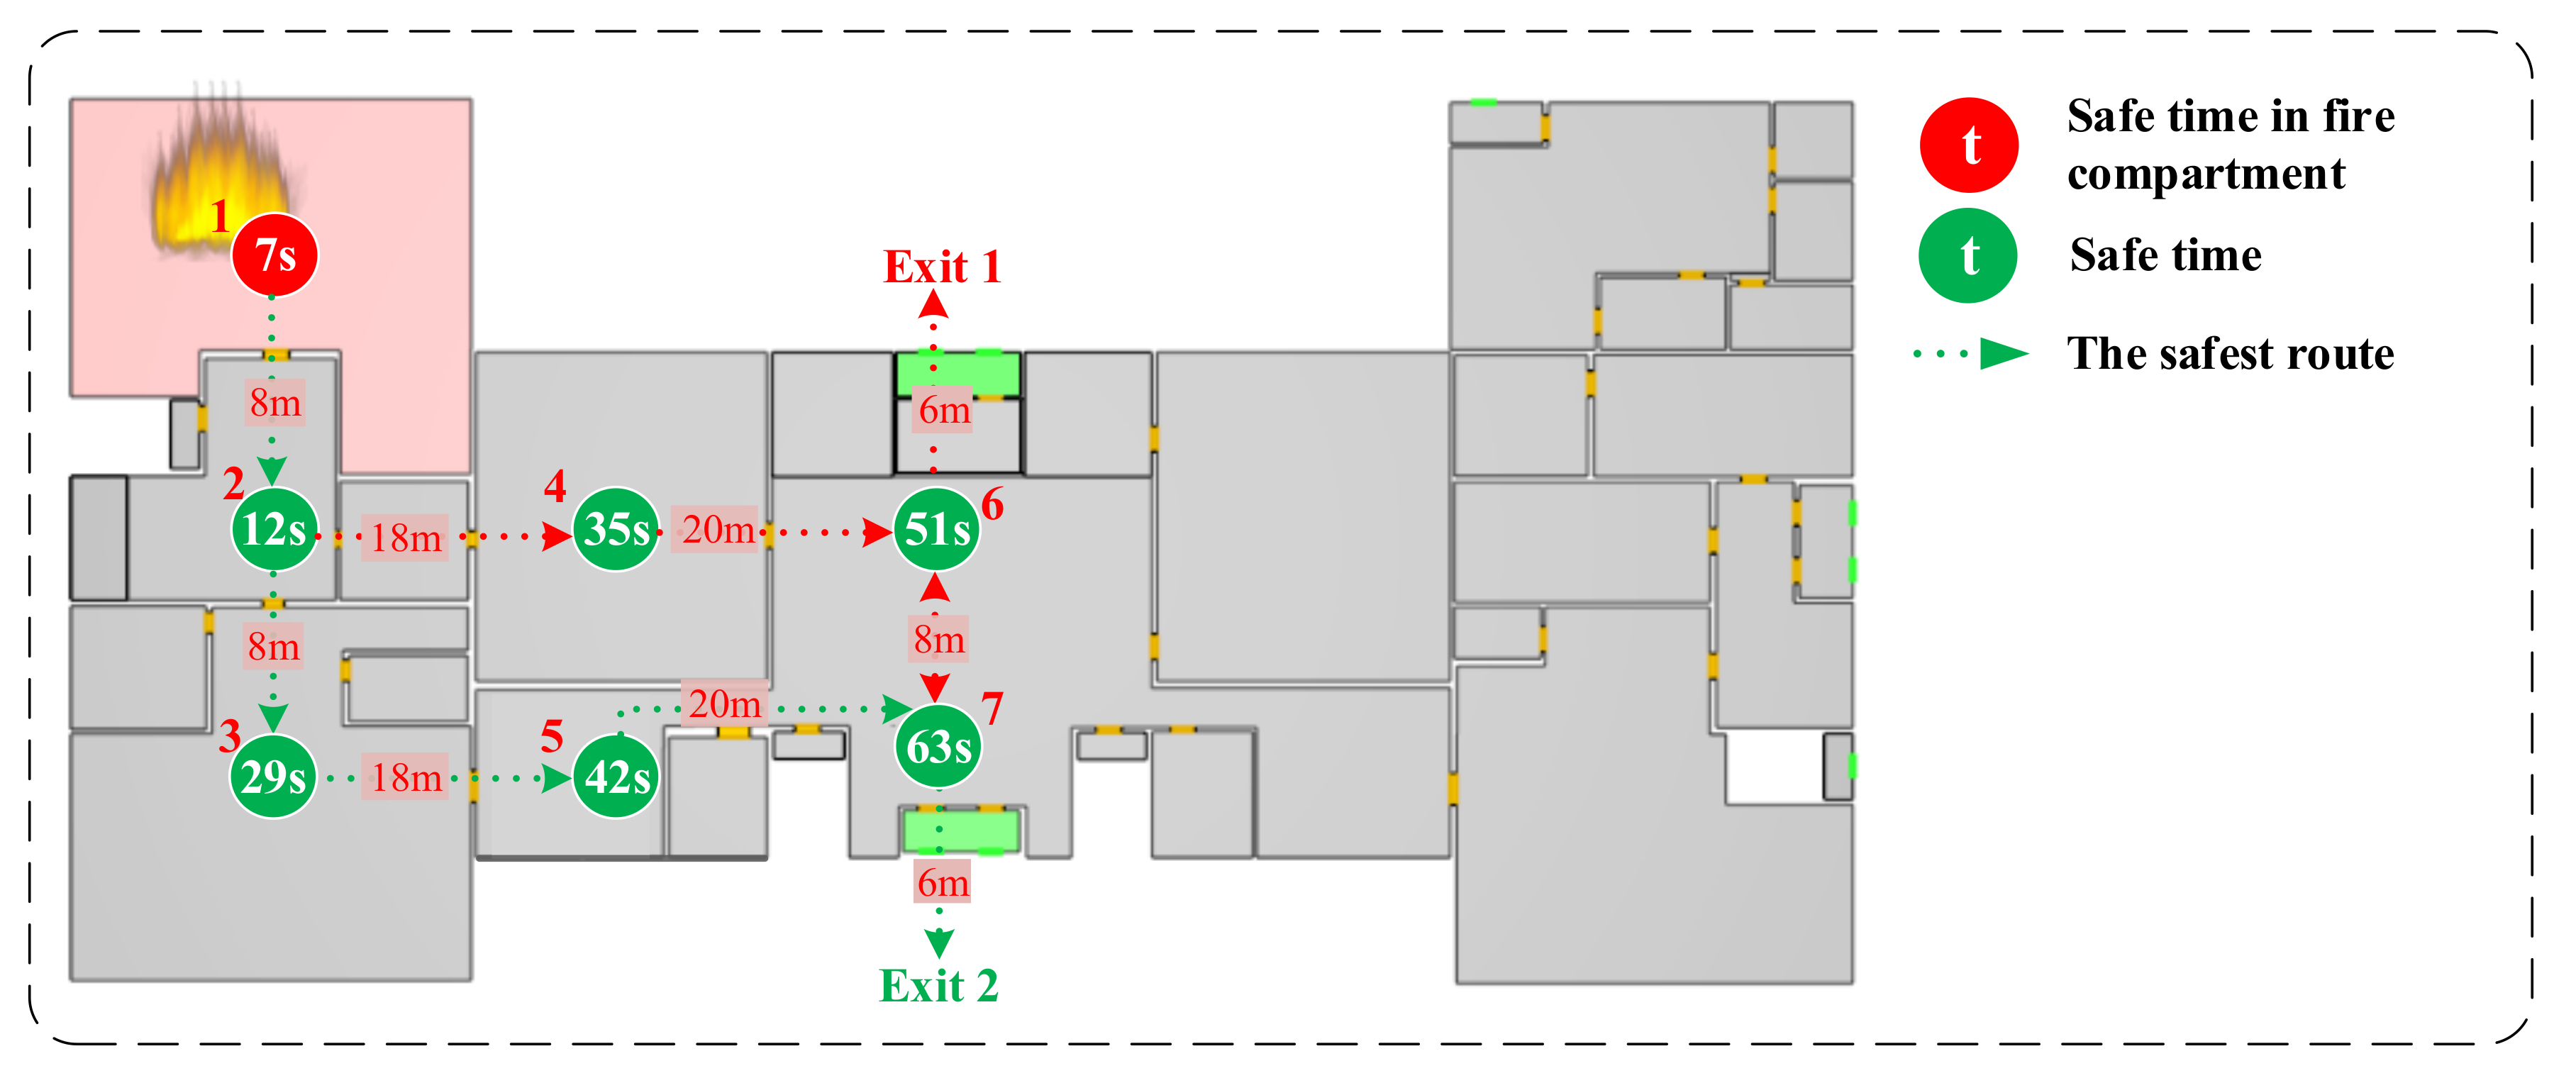
In this study, the optimal evacuation route for the simulated fire scenario was derived using the proposed egress model. As shown in Figure 18, it was assumed that a fire occurred at No. 1 position, and the walking speed of the occupant was set at 1.272 m/s. The visibility and gas measurement sensors were installed at No. 2–7 nodes, and the emergency exits were expressed as Exit 1 and Exit 2.
Table 12 shows a summary of the available safe egress time (ASET), movement time between adjacent nodes (), and margin of safety () calculated using the proposed model. The last column of Table 12 shows whether or not the evacuation path is safe. In other words, if the calculated margin of safety is greater than zero, the value is ‘1’, otherwise it is ‘0’. If the occupant considers only the shortest route for evacuation, the evacuation route is 1 → 2 → 4 → 6 → Exit 1, as shown in Figure 18. On the other hand, since the proposed model considers not only the movement time of occupants but also ASET at the fire compartment and nonfire compartments, it can offer the evacuation route with the highest margin of safety, which would be 1 → 2 → 3 → 5 → 7 → Exit 2. In other words, although the evacuation time of the shortest route was 40.88 s, whereas that of the route provided by the proposed model was 47.17 s, the margin of safety was 108.12 s for the shortest route, but was 161.83 s for the proposed route. This suggests that the proposed route can lead to the safe evacuation of more occupants. Therefore, it is expected that the use of the proposed egress model can contribute to reducing the number of casualties when a fire occurs in a multiplex building.
5. Conclusions
This study developed a model capable of deriving the optimized evacuation route in the event of fire for general multiplex buildings. The correlations between fire temperature and visibility distance, and between fire temperature and gas concentration, were examined through fire simulations. Based on this, an artificial neural network (ANN) model was proposed, which can estimate the available safe egress time (ASET) for the fire compartment and nonfire compartment in multiplex buildings under fire. The proposed ANN model was then used to develop an egress model that considers not only ASET but also the movement time of occupants. The rationality of the proposed model was verified through the application to the simulated fire scenario. Based on this study, the following conclusions can be drawn.
- 1.
- The fire simulation results showed that temperature and visibility are the most influential factors on the safety of occupants under fire and the concentrations of oxygen (O2) and carbon dioxide (CO2) are relatively less influential.
- 2.
- The ANN model was developed based on the normalized correlations between fire simulation variables, and it estimated the ASET derived from the simulation results very accurately. In addition, this study examined whether the proposed ANN model can be used to obtain the ASET of another multiplex building that was not used in the development of the model, and it was confirmed that the proposed ANN model also provided a good estimation of the ASET for the building.
- 3.
- Based on the ANN model, an egress model was proposed to ensure the safety of occupants under fire, and it provided optimal evacuation routes with the highest margin of safety in consideration of both ASET and the movement time of occupants..
- 4.
- In this study, however, the application of the proposed ANN algorithm and egress model was limited to multiplex buildings. Therefore, there is a need to secure fire simulation data of various types of buildings, such as apartment houses and underground structures, to further expand the application ranges of the proposed model in the future.
Author Contributions
Investigation, H.-C.C.; verification, I.H. and S.-J.H.; writing—original draft, K.D.; writing—review and editing, K.S.K. All authors have read and agreed to the published version of the manuscript.
Funding
This work is supported by the Korea Agency for Infrastructure Technology Advancement (KAIA) grant funded by the Ministry of Land, Infrastructure and Transport (Grant 21RMPP-C163162-01).
Institutional Review Board Statement
Not applicable.
Informed Consent Statement
Not applicable.
Data Availability Statement
The data presented in this study are available on request from the corresponding author.
Conflicts of Interest
The authors declare no conflict of interest.
References
- Choi, J.A.; Lee, M.G.; Lee, D.D. Fire Modeling and Smoking Control Characteristic Analysis of Electric Room by Using FDS. J. Korea Acad. Ind. Coop. Soc. 2018, 19, 662–668. [Google Scholar] [CrossRef]
- Han, H.S.; Hwang, C.H. Study on the Available Safe Egress Time (ASET) Considering the Input Parameters and Model Uncertainties in Fire Simulation. Fire Sci. Eng. 2019, 33, 112–120. [Google Scholar] [CrossRef]
- Jang, J.S.; Kong, I.C.; Rie, D.H. A Study of Optimal Evacuation Simulation by Artificial Intelligence Evacuation Guidance Application. J. Korean Soc. Saf. 2019, 28, 118–122. [Google Scholar] [CrossRef] [Green Version]
- Park, Y.J.; Sung, W.K.; Kim, H.G. Developing Fire Scenario of High-Rise Buildings. In Proceedings of the Korea Institute of Fire Science and Engineering Conference; Korean Institute of Fire Science and Engineering: Seoul, Korea, 2011; pp. 262–265. [Google Scholar]
- Sujatmiko, W.; Dipojono, H.K.; Soelami, F.N. Study on fire dynamic development in a multistory building compartment. Procedia Eng. 2017, 170, 162–168. [Google Scholar] [CrossRef]
- Kim, J.H.; Joo, S.Y.; Lee, J.J. An Evaluation on Evacuation Safety in Multiplex Cinema Based on Fire & Evacuation Simulation. Korean Inst. Archit. Sustain. Environ. Build. Syst. 2007, 1, 7–13. [Google Scholar]
- Oh, H.J.; Baek, S.T.; Kim, W.S.; Lee, S.K. A study on the Evacuation Performance Review for the Office Buildings. T. Korean Inst. Fire Sci. Eng. 2003, 17, 1–6. [Google Scholar]
- Nardo, M.D.; Gallo, M.; Murino, T.; Santillo, L.C. System Dynamics Simulation for Fire and Explosion Risk Analysis in Home Environment. IREMOS 2017, 10, 1. [Google Scholar] [CrossRef]
- Nimlyat, P.S.; Audu, A.U.; Ola-Adisa, E.O.; Gwatau, D. An evaluation of the fire safety measures in high-rise buildings in Nigeria. Sustain. Cities Soc. 2017, 35, 774–785. [Google Scholar] [CrossRef]
- Baek, E.S.; Baek, G.J.; Shin, H.; Song, M.J.; Kook, C.; Kim, S.W. A Study on the Awareness of Fire Safety and Evacuation Guide System. J. Korean Inst. Fire Sci. Eng 2010, 24, 45–53. [Google Scholar]
- Stanković, G.; Petelin, S.; Vidmar, P.; Perkovič, M. Impact of LNG Vapor Dispersion on Evacuation Routes inside LNG Terminals. Stroj. Vestn.-J. Mech. Eng. 2018, 64, 176–184. [Google Scholar] [CrossRef] [Green Version]
- Popescu, Ileana.; Nikitopoulos, D.; Constantinou, P.; Nafornita, I. Comparison of ANN Based Models for Path Loss Prediction in Indoor Environment. IEEE Veh. Technol. 2006. [Google Scholar] [CrossRef]
- Saadatseresht, M.; Varshosaz, M. Visibility prediction based on artificial neural networks used in automatic network design. Photogramm. Rec. 2007, 22, 336–355. [Google Scholar] [CrossRef]
- Shin, D.C. Development of an Artificial Neural Networks Model for the Required Safety Egress Time of an Office Room. J. Korean Soc. Hazard Mitig. 2014, 14, 27–33. [Google Scholar] [CrossRef] [Green Version]
- McGrattan, K. Fire Dynamics Simulator—User’s Guide; Simo, H., Randall, M., Jason, F., Craig, W., Kristopher, O., Eds.; National Institute of Standards and Technology Special Publication 1019: Gaithersburg, MD, USA, 2013. [Google Scholar]
- McGrattan, K. Fire Dynamics Simulator, Technical Reference Guide; Hostikka, S., McDermott, R., Floyd, J., Weinschenk, C., Overholt, K., Eds.; National Institute of Standards and Technology Special Publication 1018-1: Gaithersburg, MD, USA, 2016. [Google Scholar]
- DiNenno, P.J. SFPE Handbook of Fire Protection Engineering; National Fire Protection Association: Quincy, MA, USA, 2002. [Google Scholar]
- Kim, H.J.; David, G.L. Heat Release Rates of Burning Items in Fires. In Proceedings of the 38th Aerospace Sciences Meeting and Exhibit, Reno, NV, USA, 10–13 January 2000. [Google Scholar] [CrossRef]
- NFPA 92B. Standard for Smoke Management Systems in Malls, Atria and Large Spaces; National Fire Protection Association: Quincy, MA, USA, 2005. [Google Scholar]
- Buchanan, A.H.; Abu, A.K. Structural Design for Fire Safety; John Wiley & Sons LTD: Hoboken, NJ, USA, 2001. [Google Scholar]
- Russell, S.; Norvig, P. Artificial Intelligence A Modern Approach; Pearson: London, UK, 2010. [Google Scholar]
- Cho, H.C.; Lee, D.H.; Ju, H.J.; Kim, K.S.; Kim, K.H.; Monteiro, P.J. Remaining Service Life Estimation of Reinforced Concrete Buildings based on Fuzzy Approach. Comput. Concr. 2015, 15, 879–902. [Google Scholar] [CrossRef]
- Cho, H.C.; Lee, D.H.; Ju, H.J.; Park, H.C.; Kim, H.Y.; Kim, K.S. Fire Damage Assessment of Reinforced Concrete Structures Using Fuzzy Theory. Appl. Sci. 2017, 7, 518. [Google Scholar] [CrossRef] [Green Version]
- Kang, H.; Cho, H.C.; Choi, S.H.; Heo, I.W.; Kim, H.Y.; Kim, K.S. Estimation of Heating Temperature for Fire-Damaged Concrete Structures Using Adaptive Neuro-Fuzzy Inference. Syst. Mater. 2019, 12, 964. [Google Scholar] [CrossRef] [PubMed] [Green Version]
- Hagan, M.T.; Menhaj, M. Training feedforward networks with the Marquardt algorithm. IEEE Trans. Neural Netw. 1994, 5. [Google Scholar] [CrossRef] [PubMed]
- Lee, J.S.; Suh, K.D. Calculation of Stability Number of Tetrapods Using Weight and Biases of ANN Model. J Korean Soc. Coast Ocean Eng. 2016, 28, 277–283. [Google Scholar] [CrossRef]
- Nielsen, R.H. Theory of the Backpropagation Neural Network. IEEE IJCNN N. Y. 1989, 1593–1605. [Google Scholar] [CrossRef]
- Bohannon, R.W. Comfortable and maximum walking speed of adults aged 20–79 years: Reference values and determinants. Age Ageing 1997, 26, 15–19. [Google Scholar] [CrossRef] [PubMed] [Green Version]
Figure 1.
Multiplex buildings in fire.

Figure 2.
General structure of an egress model based on ANN.

Figure 3.
Plan of the multiplex building

Figure 4.
Heat release rates for t2 fires.

Figure 5.
Locations of measurement devices.

Figure 6.
FDS analysis results with respect to fuel types at the fire compartment.

Figure 7.
FDS analysis results with respect to distance from fire compartment for the polyurethane fuel case.
Figure 7.
FDS analysis results with respect to distance from fire compartment for the polyurethane fuel case.

Figure 8.
Normalized curves with respect to fuel type at the fire compartment.

Figure 9.
Normalized curves with respect to distance from the fire compartment.


Figure 10.
Structure of an ANN model.

Figure 11.
ANN model at the fire compartment.

Figure 12.
ANN training results.

Figure 13.
Comparison of ANN model and unused data on training.

Figure 14.
Plan of multiplex buildings for verification.

Figure 15.
Comparison of FDS and ANN analysis results.

Figure 16.
Flowchart of the egress model.

Figure 17.
Calculation of margin of safety.

Figure 18.
Application example of the egress model.


Table 1.
Material properties of fuels.
| Materials (Fuel Type) | Chemical Formula | CO Yield, yco (g/g) | Soot Yield, ysoot (g/g) |
|---|---|---|---|
| Ethanol | C2H5OH | 0.008 | - |
| Kerosene | C14H30 | 0.012 | 0.042 |
| Polystyrene, GM47 | CH1.1 | 0.06 | 0.18 |
| Polyurethane foams, GM27 | CH1.7 | 0.042 | 0.198 |
| Wood (red oak) | C1.7H0.72O0.001 | 0.004 | 0.015 |
Table 2.
Tenability criteria.
| Physical Property | Performance Criteria | |
|---|---|---|
| Breath height limit | 1.8 m from the bottom | |
| Temperature limit | Less than 60 °C | |
| Allowable visibility | More than 5 m | |
| Allowable toxicity limit | CO | Less than 1400 ppm |
| O2 | More than 15% | |
| CO2 | Less than 5% | |
Table 3.
Fire scenarios.
| Case No. * | Fuel Type | Total HRR, kW | Ramp-Up Time, s |
|---|---|---|---|
| Q | t | ||
| 1, 13, 25, 37, 49 | Ethanol Kerosene Polystyrene, GM47 Polyurethane foams, GM27 Wood (red oak) | 16,139.1 | 1173.5 |
| 2, 14, 26, 38, 50 | 1148 | 313.0 | |
| 3, 15, 27, 39, 51 | 6963.6 | 770.8 | |
| 4, 16, 28, 40, 52 | 22,885 | 1397.4 | |
| 5, 17, 29, 41, 53 | 22,885 | 1397.4 | |
| 6, 18, 30, 42, 54 | 13,243.9 | 1063.0 | |
| 7, 19, 31, 43, 55 | 9113.2 | 881.8 | |
| 8, 20, 32, 44, 56 | 1570.5 | 366.1 | |
| 9, 21, 33, 45, 57 | 22,940 | 1399.0 | |
| 10, 22, 34, 46, 58 | 2144.5 | 427.8 | |
| 11, 23, 35, 47, 59 | 3141 | 517.7 | |
| 12, 24, 36, 48, 60 | 3436.2 | 541.5 |
* Each series has 5 scenarios according to the fuel type.
Table 4.
Slope with respect to fuel type at the fire compartment measured in the fire area.
| Parameters | Slope at the Fire Compartment | |
|---|---|---|
| O2 | Ethanol | −0.0006 |
| Kerosene | −0.0006 | |
| Polystyrene | −0.0006 | |
| Polyurethane | −0.0006 | |
| Wood | −0.0004 | |
| AVG | −0.0006 | |
| CO2 | Ethanol | 0.0210 |
| Kerosene | 0.0219 | |
| Polystyrene | 0.0922 | |
| Polyurethane | 0.0217 | |
| Wood | 0.0273 | |
| AVG | 0.0368 | |
| Visibility | Ethanol | 0.0729 |
| Kerosene | 0.0076 | |
| Polystyrene | 0.1441 | |
| Polyurethane | 0.0101 | |
| Wood | 0.0243 | |
| AVG | 0.0518 | |
| CO | Ethanol | 0.0171 |
| Kerosene | 0.0249 | |
| Polystyrene | 0.1627 | |
| Polyurethane | 0.0245 | |
| Wood | 0.0323 | |
| AVG | 0.0523 | |
Table 5.
Slope with respect to fuel type and distance from the fire compartment measured in the nonfire area.
Table 5.
Slope with respect to fuel type and distance from the fire compartment measured in the nonfire area.
| Locations | Slope at the Distance from Fire Compartment | ||||||
|---|---|---|---|---|---|---|---|
| Parameters | 1 m | 15 m | 16 m | 25 m | 26 m | 50 m | |
| O2 | Polyurethane | −0.0013 | −0.0009 | −0.0021 | −0.003 | −0.0024 | −0.0036 |
| Polystyrene | −0.0013 | −0.0009 | −0.0022 | −0.0010 | −0.0014 | −0.0026 | |
| Ethanol | −0.0012 | −0.0008 | −0.0023 | 0.0011 | −0.0005 | −0.0011 | |
| Kerosene | −0.0011 | −0.0009 | −0.0017 | −0.0009 | −0.0013 | −0.0033 | |
| Wood | −0.0009 | −0.0006 | −0.0014 | −0.0008 | −0.0009 | −0.0012 | |
| AVG | −0.0012 | −0.0008 | −0.0019 | −0.0009 | −0.0013 | −0.0024 | |
| CO2 | Polyurethane | 0.0099 | 0.0303 | 0.0898 | 0.0932 | 0.2054 | 0.2995 |
| Polystyrene | 0.0120 | 0.0295 | 0.0530 | 0.0284 | 0.0985 | 0.1935 | |
| Ethanol | 0.0140 | 0.0287 | 0.0351 | 0.0518 | 0.0759 | 0.0993 | |
| Kerosene | 0.0086 | 0.0280 | 0.0427 | 0.0313 | 0.0789 | 0.0896 | |
| Wood | 0.0084 | 0.0271 | 0.0419 | 0.0940 | 0.0818 | 0.0948 | |
| AVG | 0.0106 | 0.0287 | 0.0525 | 0.0598 | 0.1081 | 0.1942 | |
| Visibility | Polyurethane | −0.0223 | −0.1811 | −0.2979 | −0.4640 | −0.4251 | −0.5966 |
| Polystyrene | −0.1509 | −0.2027 | −0.2428 | −0.1969 | −0.3507 | −0.4523 | |
| Ethanol | −0.1467 | −0.2560 | −0.3668 | −0.3668 | −0.9863 | −0.6662 | |
| Kerosene | −0.0658 | −0.1050 | −0.2857 | −0.1663 | −0.3998 | −0.5133 | |
| Wood | −0.0450 | −0.8123 | −0.2292 | −0.1306 | −0.1054 | −0.2966 | |
| AVG | −0.0861 | −0.3114 | −0.2845 | −0.2649 | −0.4535 | −0.505 | |
| CO | Polyurethane | 0.0102 | 0.0340 | 0.1191 | 0.1353 | 0.3443 | 0.1287 |
| Polystyrene | 0.0123 | 0.0327 | 0.0581 | 0.0309 | 0.1221 | 0.1942 | |
| Ethanol | 0.0976 | 0.0251 | 0.0474 | 0.0541 | 0.2433 | 0.2093 | |
| Kerosene | 0.0488 | 0.0311 | 0.0472 | 0.0352 | 0.0980 | 0.1081 | |
| Wood | 0.0386 | 0.0303 | 0.0462 | 0.1503 | 0.1058 | 0.1488 | |
| AVG | 0.0415 | 0.0306 | 0.0636 | 0.0812 | 0.1827 | 0.1578 | |
Table 6.
Range of input and output parameters at the fire compartment.
| Temperature, ℃ | CO, ppm | CO2, % | Time after Fire | O2, % | Visibility, m | Safe Time | |
|---|---|---|---|---|---|---|---|
| Min | 20.57 | 1.30 | 0.04 | 15 | 20.73 | 5.41 | 3 |
| Max | 27.19 | 11.81 | 0.07 | 65 | 20.78 | 48.39 | 93 |
Table 7.
Range of input and output parameters at the nonfire compartment.
| Distance from Fire Compartment: 1 m to 15 m | ||||||||
|---|---|---|---|---|---|---|---|---|
| Distance, m | Temperature, ℃ | CO, ppm | CO2, % | Time after Fire | O2, % | Visibility, m | Safe Time | |
| Min | 1 | 20.33 | 1.30 | 0.04 | 65 | 20.7 | 6.81 | 10 |
| Max | 15 | 23.47 | 9.34 | 0.06 | 318 | 20.7 | 48.27 | 217 |
| Distance from Fire Compartment: 16 m to 25 m | ||||||||
| Distance, m | Temperature, ℃ | CO, ppm | CO2, % | Time after fire | O2, % | Visibility, m | Safe time | |
| Min | 16 | 20.33 | 1.24 | 0.04 | 128 | 20.7 | 5.30 | 7 |
| Max | 25 | 22.71 | 11.95 | 0.07 | 434 | 20.7 | 46.23 | 229 |
| Distance from Fire Compartment: 26 m to 50 m | ||||||||
| Distance, m | Temperature, ℃ | CO, ppm | CO2, % | Time after fire | O2, % | Visibility, m | Safe time | |
| Min | 26 | 20.18 | 1.35 | 0.04 | 158 | 20.7 | 6.36 | 9 |
| Max | 50 | 21.70 | 9.94 | 0.06 | 493 | 20.7 | 46.53 | 283 |
Table 8.
Weight and bias at the fire compartment.
| Hidden Neurons` | Bias 1 (b1) | Weight1 (W1) | Weight2 (W2) | |||||
|---|---|---|---|---|---|---|---|---|
| Temperature, ℃ | CO, ppm | CO2, % | Time after Fire | O2, % | Visibility, m | ASET, s | ||
| 1 | 2.827 | −0.210 | 2.907 | 0.855 | −3.355 | −0.889 | −0.169 | −2.264 |
| 2 | 0.991 | −1.009 | 2.153 | 0.676 | −0.616 | 0.346 | 0.564 | −0.859 |
| 3 | −1.025 | 1.805 | 0.720 | −2.775 | 1.821 | 2.318 | 0.014 | −3.989 |
| 4 | −0.045 | 1.413 | −0.428 | −0.124 | 0.842 | 0.643 | 1.850 | 1.098 |
| 5 | −1.740 | −0.940 | −1.285 | 0.426 | 1.668 | 0.293 | −0.763 | −0.476 |
| 6 | −1.628 | −2.821 | −0.480 | −1.333 | 2.461 | −0.537 | −0.734 | 2.599 |
| 7 | −2.787 | 0.243 | 1.280 | 1.316 | −0.818 | −0.657 | 0.640 | −0.361 |
| Bias 2 (b2) = 1.093 | ||||||||
Table 9.
Verification scenarios.
| Case No. * | Fuel Type | Total HRR, kW | Ramp-Up Time, s |
|---|---|---|---|
| Q | t | ||
| 1, 11 | Polyurethane foams, Polystyrene foams | 11404.90 | 986.47 |
| 2, 12 | 20099.10 | 1309.56 | |
| 3, 13 | 7968.70 | 824.57 | |
| 4, 14 | 10137.40 | 930.04 | |
| 5, 15 | 8233.90 | 838.18 | |
| 6, 16 | 5068.70 | 657.63 | |
| 7, 17 | 2168.70 | 430.17 | |
| 8, 18 | 34214.70 | 1708.61 | |
| 9, 19 | 14299.10 | 1104.56 | |
| 10, 20 | 8504.90 | 851.87 |
* Each series has 2 scenarios according to the fuel type.
Table 10.
FDS analysis results for verification.
| No. | Distance, m | Time after Fire, s | Temperature, ℃ | CO, ppm | CO2, % | O2, % | Visibility, m | Safe Time, s (FDS) |
|---|---|---|---|---|---|---|---|---|
| 1 | 0 | 22.7 | 22.5 | 5.6 | 0.05 | 20.8 | 11.2 | 13.8 |
| 2 | 26 | 305.3 | 21.59 | 5.57 | 0.06 | 20.8 | 11.3 | 60.2 |
| 3 | 0 | 29.5 | 24.3 | 9.8 | 0.06 | 20.7 | 6.5 | 7.1 |
| 4 | 0 | 32.3 | 24.9 | 11.1 | 0.06 | 20.7 | 5.8 | 4.3 |
| 5 | 16 | 128.8 | 20.84 | 2.51 | 0.04 | 20.8 | 25.1 | 77.2 |
| 6 | 14 | 114.1 | 21.4 | 5.1 | 0.05 | 20.8 | 12.5 | 38.6 |
| 7 | 14 | 124.7 | 21.9 | 6.9 | 0.05 | 20.8 | 9.1 | 27.9 |
| 8 | 26 | 305.3 | 21.59 | 5.57 | 0.06 | 20.8 | 11.3 | 60.2 |
| 9 | 25 | 196.7 | 21.9 | 8.7 | 0.06 | 20.7 | 7.3 | 15.5 |
| 10 | 15 | 119.2 | 20.7 | 2.8 | 0.04 | 20.8 | 22.9 | 39.1 |
| 11 | 15 | 199.6 | 20.51 | 1.76 | 0.04 | 20.8 | 35.8 | 97.4 |
| 12 | 15 | 137.3 | 21.8 | 6.7 | 0.05 | 20.8 | 9.4 | 21.0 |
| 13 | 0 | 21.3 | 22.9 | 6.6 | 0.05 | 20.8 | 9.7 | 8.2 |
| 14 | 15 | 236.0 | 21.22 | 4.91 | 0.05 | 20.8 | 12.8 | 61.0 |
| 15 | 5 | 79.9 | 20.7 | 2.2 | 0.04 | 20.8 | 28.5 | 55.3 |
| 16 | 0 | 22.7 | 23.4 | 7.7 | 0.06 | 20.8 | 8.2 | 8.5 |
| 17 | 0 | 24.8 | 24.9 | 10.9 | 0.06 | 20.7 | 5.9 | 2.8 |
| 18 | 0 | 18.5 | 22.6 | 5.7 | 0.05 | 20.8 | 11.1 | 9.2 |
| 19 | 16 | 128.8 | 20.84 | 2.51 | 0.04 | 20.8 | 25.1 | 77.2 |
| 20 | 0 | 20.6 | 23.5 | 7.7 | 0.06 | 20.8 | 8.3 | 7.1 |
Table 11.
Verification results of the proposed ANN model.
| Case No. | Safe Time, s (FDS) | Safe Time, s (ANN) | Error, s | Error, % |
|---|---|---|---|---|
| 1 | 13.8 | 14.7 | 0.9 | 6.0 |
| 2 | 60.2 | 57.8 | 2.4 | 4.1 |
| 3 | 7.1 | 6.4 | 0.7 | 10.5 |
| 4 | 4.3 | 4.0 | 0.3 | 6.3 |
| 5 | 77.2 | 75.7 | 1.5 | 1.9 |
| 6 | 38.6 | 35.0 | 3.6 | 10.3 |
| 7 | 27.9 | 25.2 | 2.7 | 10.9 |
| 8 | 60.2 | 57.8 | 2.4 | 4.1 |
| 9 | 15.5 | 15.9 | 0.4 | 2.3 |
| 10 | 39.1 | 38.8 | 0.3 | 0.7 |
| 11 | 97.4 | 105.4 | 8 | 7.6 |
| 12 | 21.0 | 27.4 | 6.4 | 23.5 |
| 13 | 8.2 | 10.3 | 2.1 | 20.9 |
| 14 | 61.0 | 58.5 | 2.5 | 4.3 |
| 15 | 55.3 | 56.2 | 0.9 | 1.6 |
| 16 | 8.5 | 8.4 | 0.1 | 1.6 |
| 17 | 2.8 | 3.2 | 0.4 | 11.8 |
| 18 | 9.2 | 11.5 | 2.3 | 19.8 |
| 19 | 77.2 | 75.7 | 1.5 | 1.9 |
| 20 | 7.1 | 8.4 | 1.3 | 15.7 |
| AVG | 34.5 | 34.8 | 2.03 | 8.3 |
Table 12.
Application results.
| Path | Distance (m) | Available Safe Egress Time (sec.) | Movement Time (sec.) | Margin of Safety (sec.) | Result * Safe = 1 Unsafe = 0 |
|---|---|---|---|---|---|
| D | ASET | tmov | ASET- tmov | ||
| 1 → 2 | 8 | 12 | 6.29 | 5.71 | 1 |
| 2 → 4 | 18 | 35 | 14.15 | 20.85 | 0 |
| 2 → 3 | 8 | 29 | 6.29 | 22.71 | 1 |
| 3 → 5 | 18 | 42 | 14.15 | 27.85 | 1 |
| 4 → 6 | 20 | 51 | 15.72 | 35.28 | 0 |
| 5 → 7 | 20 | 63 | 15.72 | 47.28 | 1 |
| 6 → 7 | 8 | 63 | 6.29 | 56.71 | 0 |
| 6 → Exit 1 | 6 | 51 | 4.72 | 46.28 | 0 |
| 7 → Exit 2 | 6 | 63 | 4.72 | 58.28 | 1 |
* The safest route = 1 → 2 → 3 → 5 → 7 → Exit 2.
Publisher’s Note: MDPI stays neutral with regard to jurisdictional claims in published maps and institutional affiliations. |
© 2021 by the authors. Licensee MDPI, Basel, Switzerland. This article is an open access article distributed under the terms and conditions of the Creative Commons Attribution (CC BY) license (https://creativecommons.org/licenses/by/4.0/).
Share and Cite
MDPI and ACS Style
Darkhanbat, K.; Heo, I.; Han, S.-J.; Cho, H.-C.; Kim, K.S. Real-Time Egress Model for Multiplex Buildings under Fire Based on Artificial Neural Network. Appl. Sci. 2021, 11, 6337. https://0-doi-org.brum.beds.ac.uk/10.3390/app11146337
AMA Style
Darkhanbat K, Heo I, Han S-J, Cho H-C, Kim KS. Real-Time Egress Model for Multiplex Buildings under Fire Based on Artificial Neural Network. Applied Sciences. 2021; 11(14):6337. https://0-doi-org.brum.beds.ac.uk/10.3390/app11146337
Chicago/Turabian StyleDarkhanbat, Khaliunaa, Inwook Heo, Sun-Jin Han, Hae-Chang Cho, and Kang Su Kim. 2021. "Real-Time Egress Model for Multiplex Buildings under Fire Based on Artificial Neural Network" Applied Sciences 11, no. 14: 6337. https://0-doi-org.brum.beds.ac.uk/10.3390/app11146337
Note that from the first issue of 2016, this journal uses article numbers instead of page numbers. See further details here.