Article

Modification of Angular Kinematics and Spatiotemporal Parameters during Running after Central and Peripheral Fatigue

by
Alberto Encarnación-Martínez
1,2,*,
Pedro Pérez-Soriano
1,
Roberto Sanchis-Sanchis
1,3,
Rafael Berenguer-Vidal
4 and
Antonio García-Gallart
2,5
1
Research Group in Sports Biomechanics (GIBD), Department of Physical Education and Sports, University of Valencia, 46010 Valencia, Spain
2
Faculty of Sport, Universidad Católica de Murcia UCAM, 30107 Murcia, Spain
3
Physical Education and Sport Faculty, University of Alicante, 03690 San Vicente del Raspeig, Spain
4
Grupo de Investigación en Telecomunicaciones Avanzadas (GRITA), Universidad Católica de Murcia UCAM, 30107 Guadalupe, Spain
5
The Civil Guard, Secretary of State for Security, Ministry of the Interior, 28010 Madrid, Spain
*
Author to whom correspondence should be addressed.
Submission received: 16 June 2021 / Revised: 14 July 2021 / Accepted: 15 July 2021 / Published: 19 July 2021
(This article belongs to the Special Issue New Trends in Fitness and Sports Performance Analysis)

Abstract

:
Fatigue causes kinematics modifications during running, and it could be related to injuries. The aim was to identify and compare the effects of central and peripheral fatigue on angular kinematics and spatiotemporal parameters during running. Angular kinematics and spatiotemporal parameters were evaluated using an infrared motion capture system and were registered during 2 min treadmill running in pre- and post-fatigue states in eighteen male recreational runners. Central fatigue was induced by a 30 min running fatigue protocol on a treadmill, while peripheral fatigue in quadriceps and hamstrings muscles was induced by an isokinetic dynamometer fatigue protocol. Central fatigue increased the anterior shank oscillation during the initial contact, knee flexion during the maximum absorption, posterior shank oscillation during propulsion, and stance time (p < 0.05). Peripheral fatigue decreased ankle dorsiflexion during initial contact and increased knee flexion and posterior shank oscillation during propulsion (p < 0.05). Moreover, central fatigue increased to a greater extent the hip and knee flexion and ankle dorsiflexion during initial contact and maximum absorption as well as stance time and propulsion time (p < 0.05). These results suggested that central fatigue causes greater increases in the range of movements during the midstance than peripheral fatigue.

1. Introduction

The popularity of running has been increasing over the last decade due to its ben-efits for health, accessibility, and low cost, becoming one of the most common ways to exercise [1]. Despite health benefits, running-related injuries are inherent to the activity itself, with a high yearly incidence ranging from 19.4 to 79.3% [2]. Several factors were associated with running injuries, and the fatigue related to prolonged running is one of the most common factors, being pointed out as one of the possible causes of injury [2].
Fatigue is an intrinsic process related to every physical activity, and it has been traditionally divided into peripheral and central fatigue, producing limitations at the spinal or supraspinal level and modifications at the muscular level, respectively [3,4].
Although there is little modest scientific evidence, unfatigued running allows the athletes to maintain the preferred movement path [5], but it becomes altered when running into fatigue by reducing the capacity of the muscles to control sagittal [6,7,8,9,10,11] and non-sagittal [12] plane joint movements, inducing kinetic and kinematics modifications during running [6,7,8,9,10,11].
While the effects of central fatigue have been widely investigated, few studies have analyzed the influence of peripheral fatigue on running biomechanics [9,13,14,15].
An increase of range of movements during stance phase, especially of knee joint, has been shown after central [6,7] or peripheral fatigue [9,15] in order to reduce vertical ground reaction forces (vGRF) during fatigued running. Moreover, some investigations suggested an increased stance time after central fatigue [8,11,16,17] and also a sustained frequency and length stride if the running speed was constant [8,11,16,18]. However, the evidence is limited in these spatiotemporal parameters after peripheral fatigue.
A moderate increase in central fatigue and small increase in peripheral fatigue evaluated by maximal voluntary isometric contraction after a half-marathon race has been described [3]. It has also been shown that central mechanisms were mainly responsible for the reduction of maximum knee flexors torque after 24 h on a treadmill compared with peripheral fatigue [4]. Nevertheless, there are no studies that compare the effects of both types of fatigue evaluated in isolation using the same methodology in running kinematics.
So, the aim of this study was to identify and compare the effects of central and peripheral fatigue on angular kinematics and spatiotemporal parameters during running using the same methodology. Based on previous research [6,7,8,9,10,11], we hypothesized that changes associated with central and peripheral fatigue would increase the range of movements of the lower limb at stand phases (absorption and propulsion phases), and no modifications would be found in the swing phase. Additionally, spatiotemporal parameters also would be altered, including increased stance time, but not frequency and length stride, related to changes in running kinematics. We also hypothesized that changes would be higher after central fatigue protocol.

2. Materials and Methods

2.1. Participants

Eighteen male recreational runners (age of 28.2 ± 8.6 years, height of 177.8 ± 6.5 cm, body mass of 71.74 ± 8.44 kg) with a running experience of 7.3 ± 5.3 years agreed to participate and gave written informed consent before their inclusion in the study. Inclusion criteria included being physically active (to run a minimum of twice a week in the last year), a training volume of at least 20 km per week, no history of lower limb injuries within the last six months, no suffering of heart failure, neurological or musculoskeletal disorders affecting normal locomotion, and to not be taking medication that interferes with stability during running. Exclusion criteria included injury, surgery or illness within the previous six months, and overweight or obesity (BMI > 24.9 kg/m2). This investigation was approved by the University Ethics Committee (registry number: 6775).

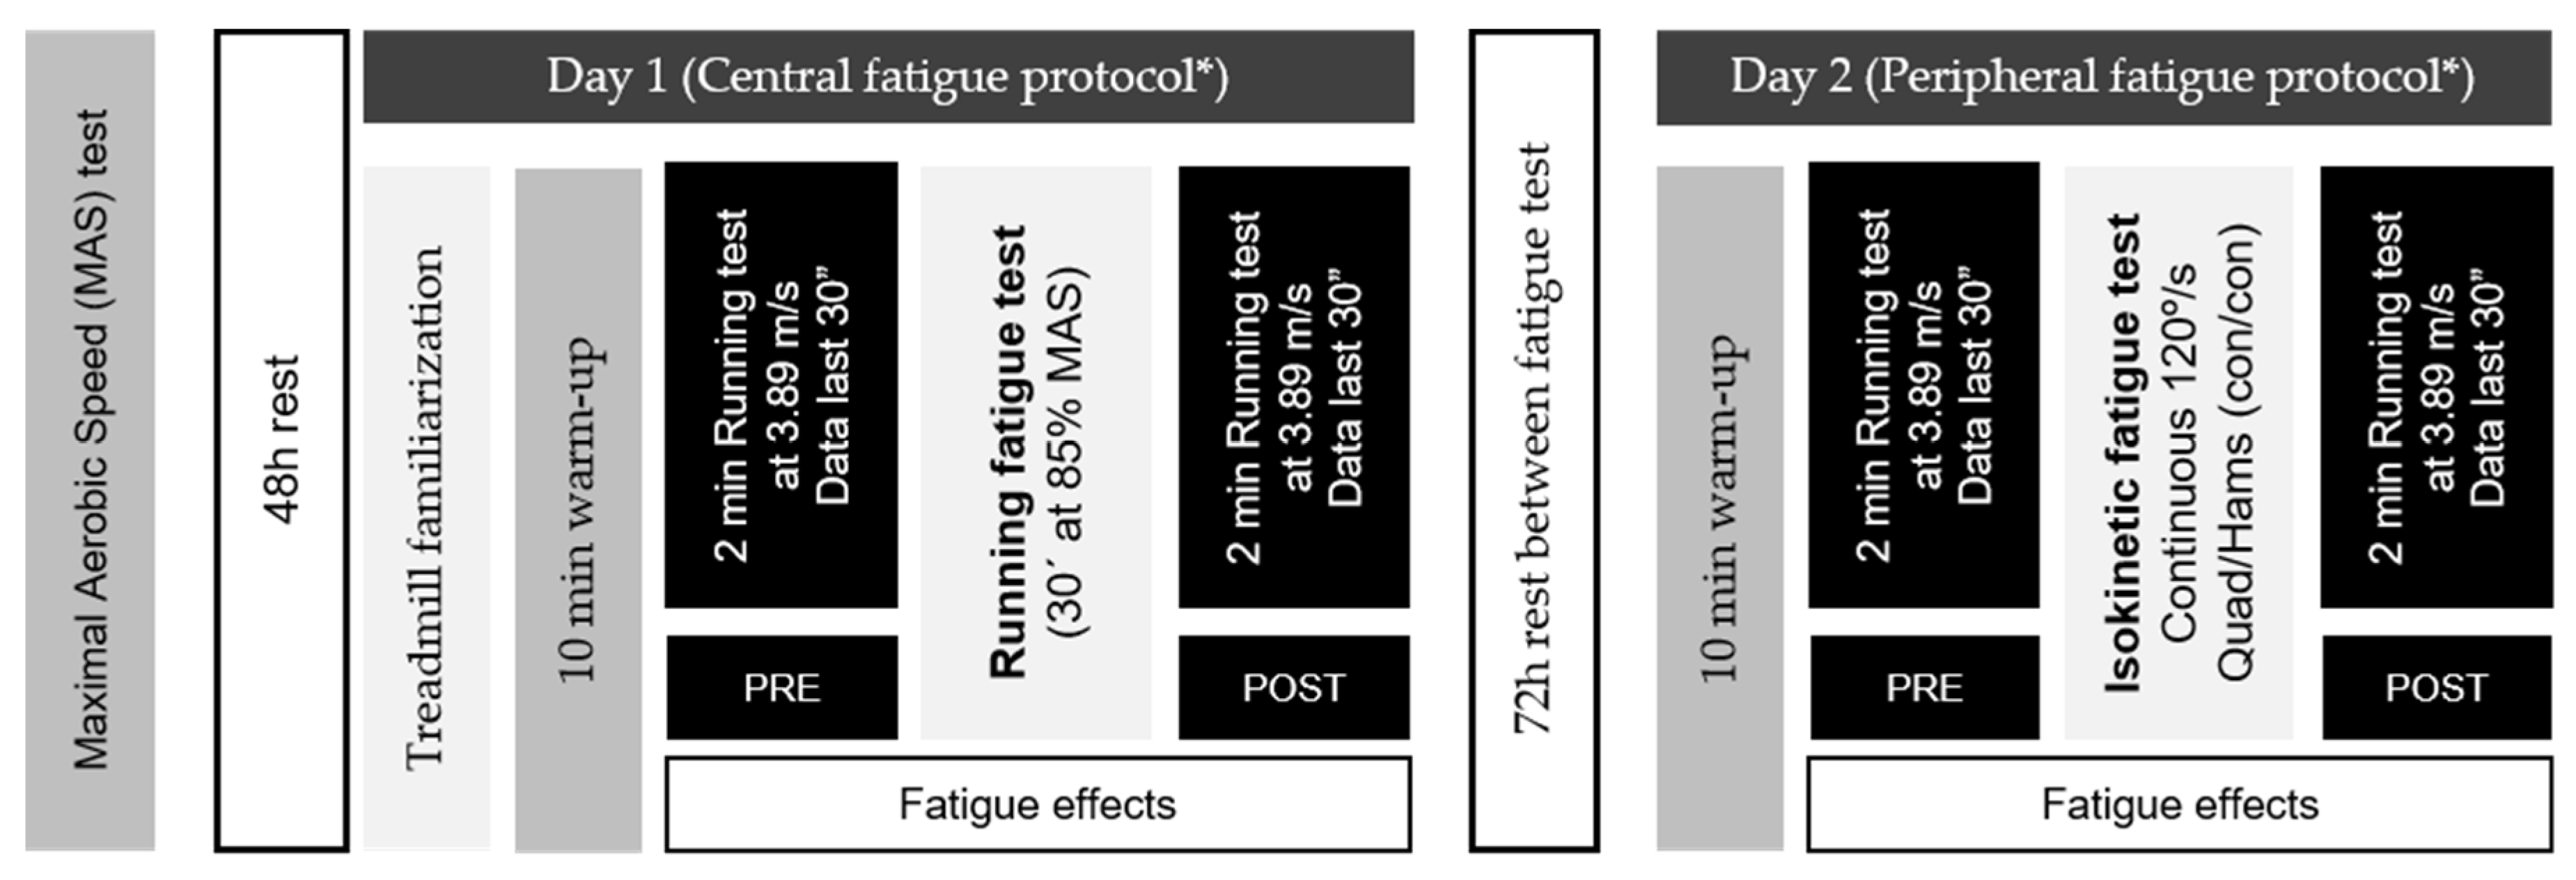
2.2. Experimental Protocol

We carried out an experimental study with a quantitative approach without a control group and with a repeated measures design.
With at least 48 h before laboratory measurements, maximal aerobic speed (MAS) was calculated by a maximal effort 5 min running test on a 400 m track [18,19,20] in order to determine the individual fatigue speed for every participant.
Effects of central and peripheral fatigue on running kinematics were evaluated in two randomized sessions separated by a minimum of 72 h. Both sessions were identical, changing only the fatigue protocol applied (Figure 1). A familiarization with the treadmill (Excite®+ Run MD Inclusive, Technogym Trading S.A., Barcelona, Spain) and a 10 min at self-selected speed warm-up were carried out [18,20] before the capture period. A completely randomized design protocol, using opaque envelopes for allocation concealment, was used to determine the fatigue condition order. Envelopes were equal in weight, similar in appearance, and tamper-proof [21].
Angular kinematics and spatiotemporal parameters were evaluated by a 2 min treadmill running test at 3.89 m/s before and after the central or peripheral fatigue protocol. Variables were captured in the last 30 s of the running test using an Optitrack V120:Trio (NaturalPoint, Inc., Corvallis, OR, USA) infrared motion capture system running at 120 Hz. A 0% slope was maintained to be sure that the parameters evaluated were not affected [22]. It should be noted that the transition between fatigue protocols and post-fatigue evaluation was done as quickly as possible to avoid recovery processes.
Retro-reflective markers, placed in the dominant lower limb on the lateral aspects of the greater trochanter, femoral condyle, lateral malleolus, and 5th meta-tarsal head were tracked during each measurement. Moreover, four posterior markers were located on the shoe and lower leg as Nigg, De Boer, and Fisher [23] described.
To avoid marker loss due to the participant’s sweat during fatigue protocols, a strict protocol for fixing the markers was followed to prevent them from peeling off. Firstly, the skin was shaved, and the anatomical point was marked with a marker pencil. Secondly, an adhesive spray (Tensospray®, BSN Medical, Hamburg, Germany) and a double-sided adhesive (3MTM, 3M Company, Saint Paul, MN, USA) were applied, and an adhesive circle (TRAYMA, Vizcaya, Spain) was glued above this point where a retro-reflective marker was fixed through velcro. Finally, the retro-reflective marker was reinforced with a non-woven adhesive material (Omnifix® Elastic, Hartmann, Barcelona, Spain) (Figure 2).

2.3. Central Fatigue Protocol

A 30 min treadmill running fatigue protocol at 85% of the maximal aerobic speed was used to induce central fatigue [20]. Additionally, runners must manifest a perceived effort equal to or greater than 17 or “Very Hard” [24] on the Borg’s Scale 6–20 [25]. The treadmill slope was adjusted at 0% [22].

2.4. Peripheral Fatigue Protocol
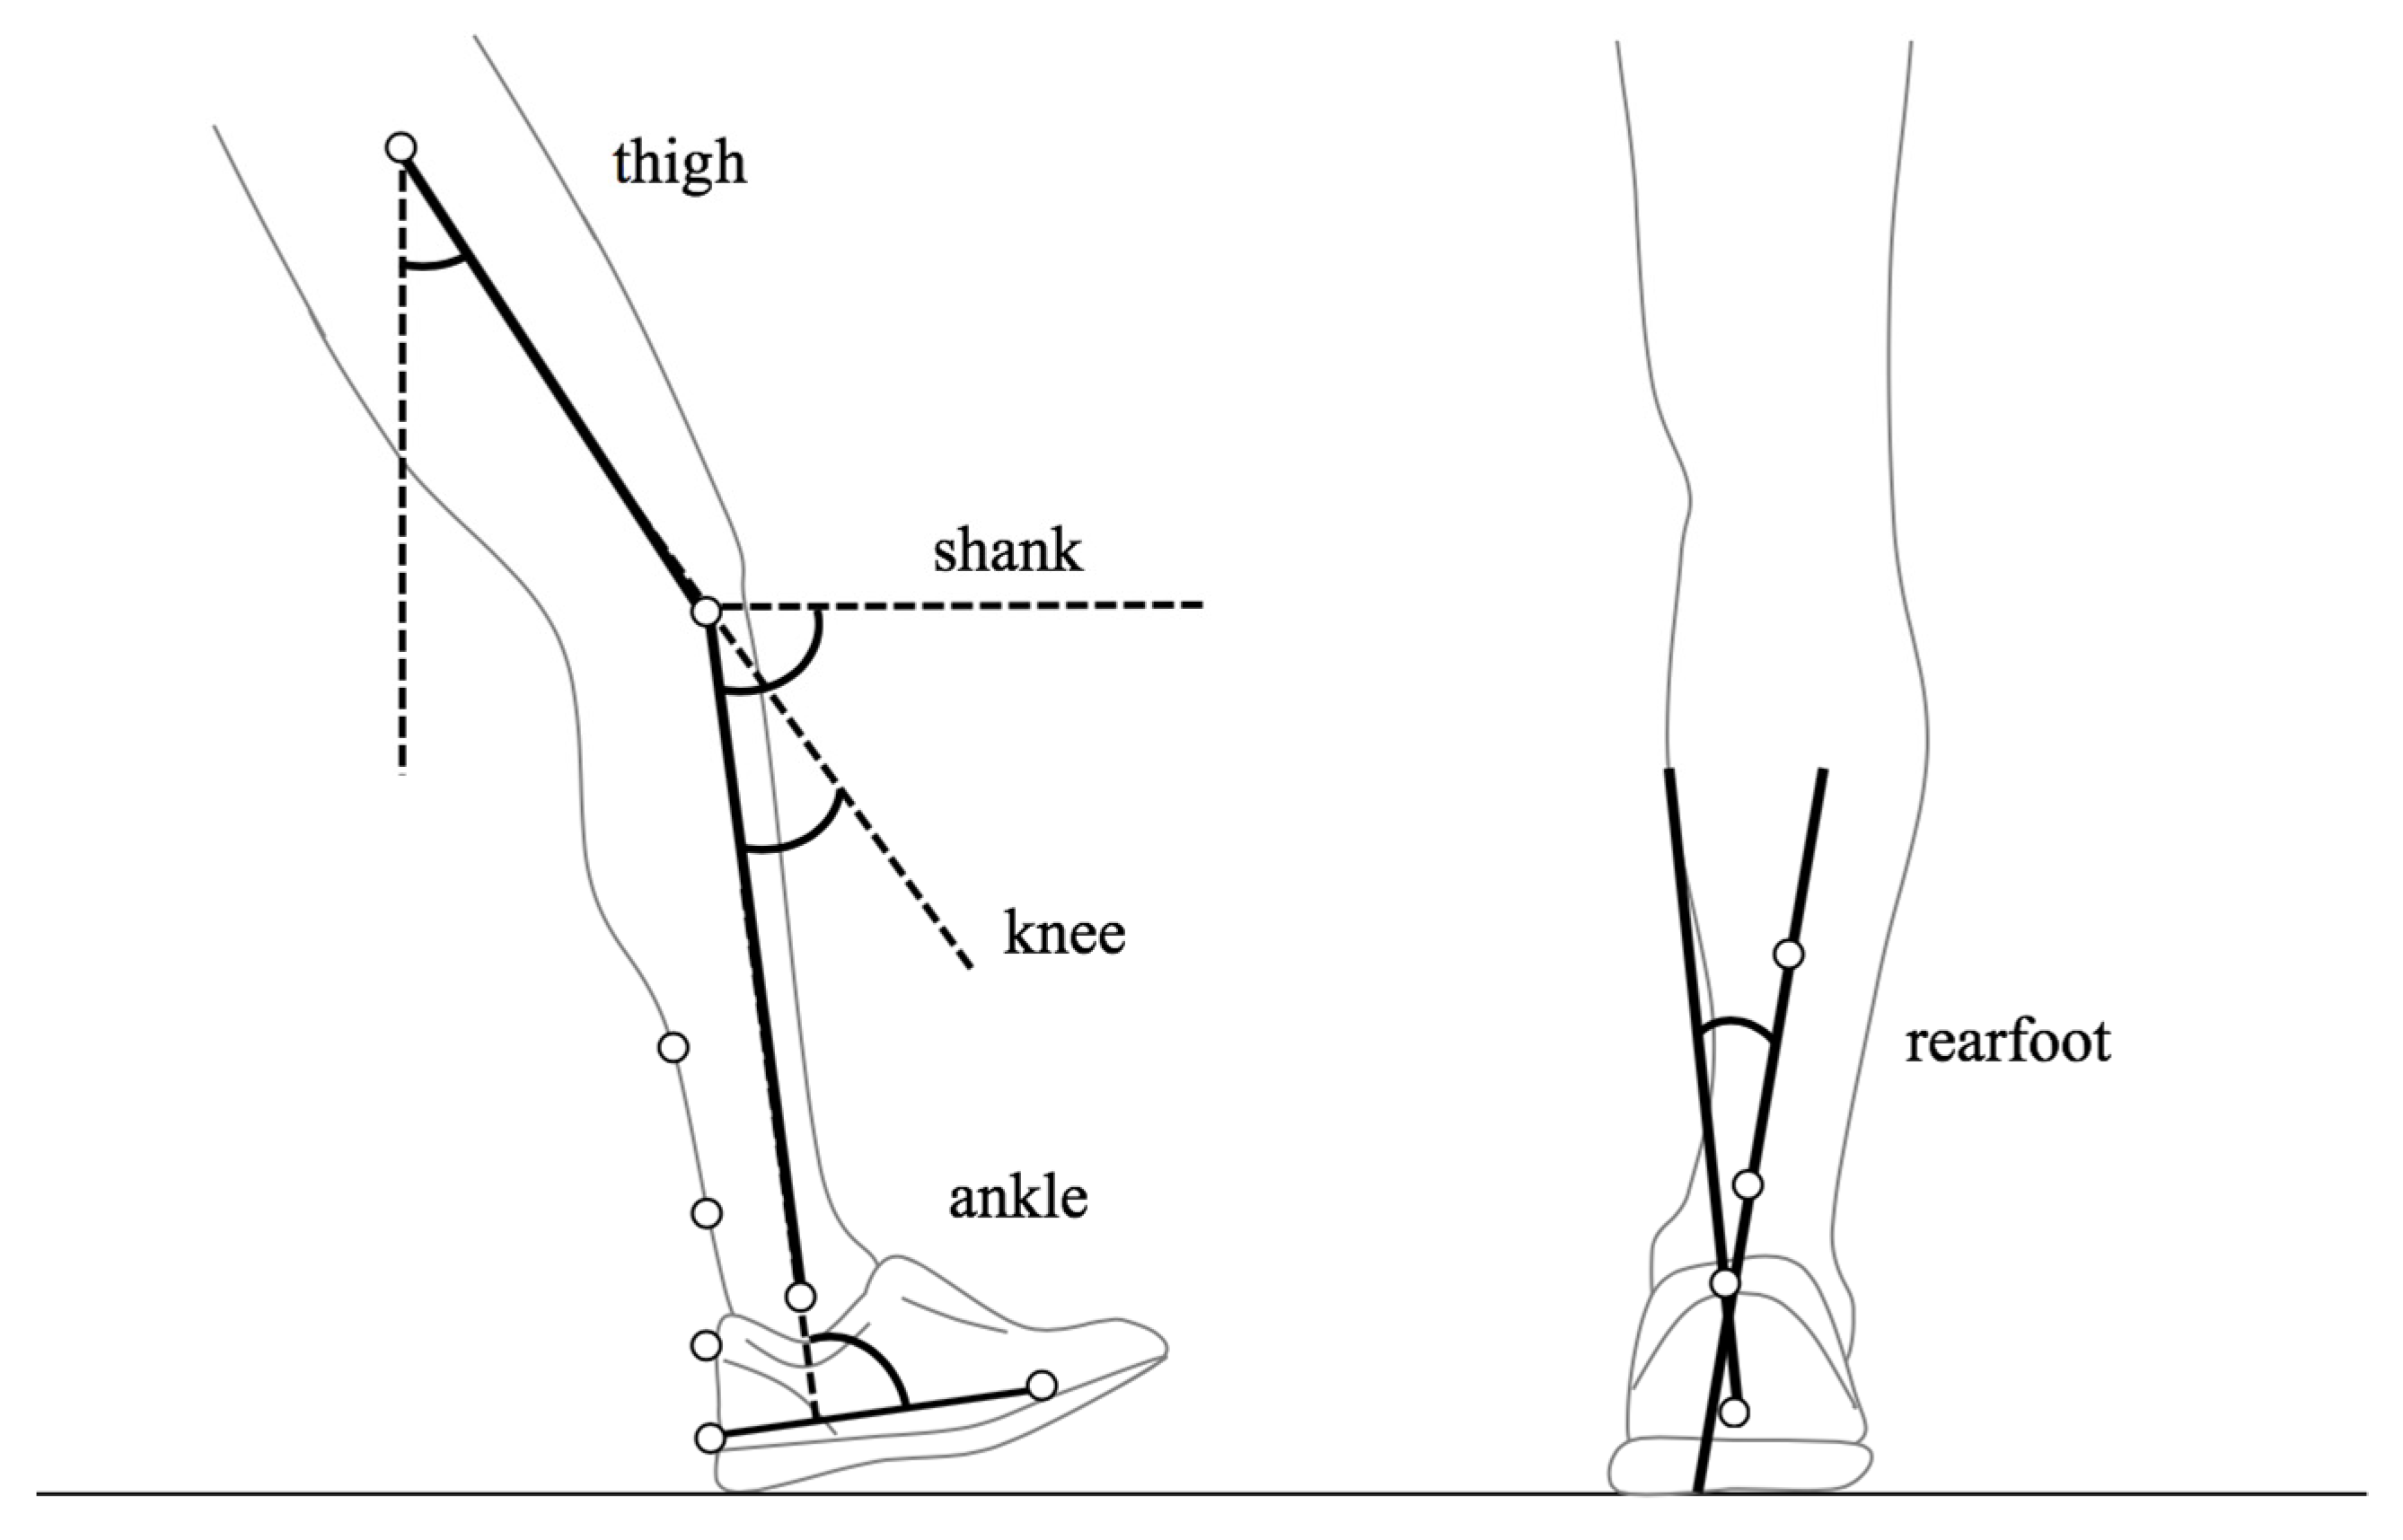
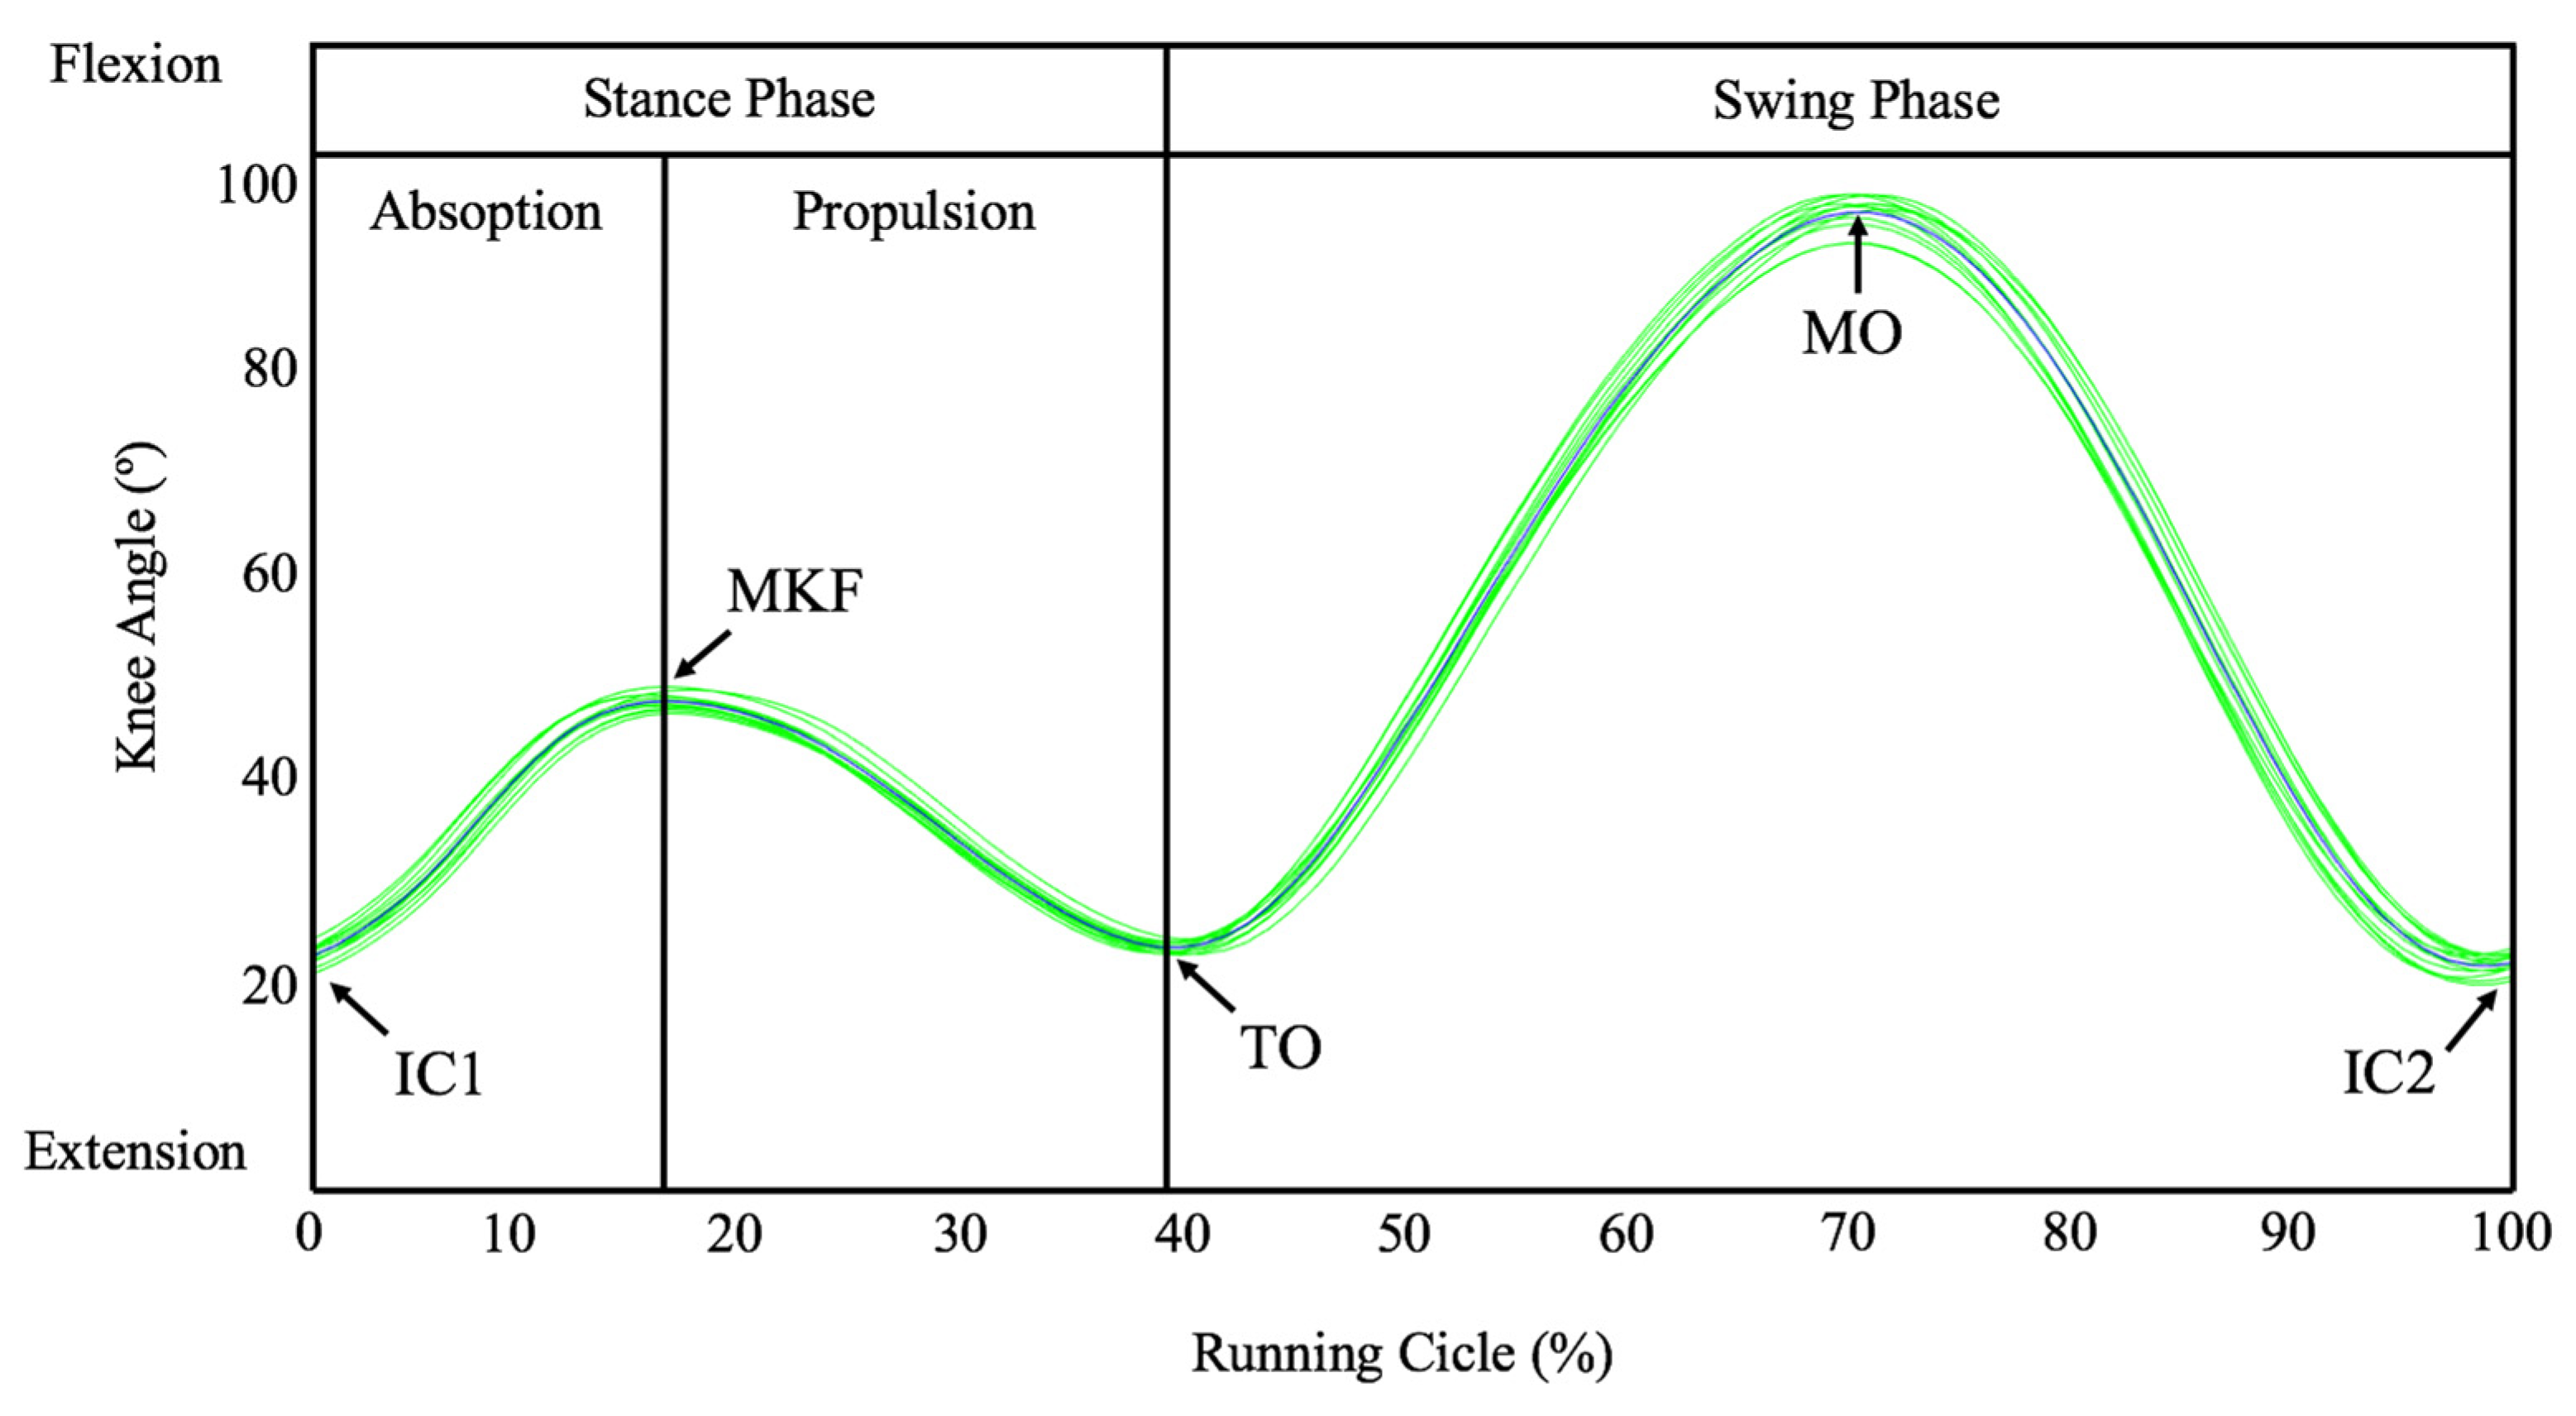
Peripheral fatigue in quadriceps and hamstring muscles of the dominant leg was induced using an isokinetic dynamometer (Biodex System Pro 3™, Biodex Medical Systems, Inc., New York, NY, USA). Participants performed the test in a seated position with a hip flexion angle of 85°, and the trunk, waist, and thigh of the lower extremity domain were stabilized with straps [9,26]. Motion ranged from 0° (full extension) to 90° of knee flexion [9,26].
Previous to fatigue protocol, 2 sets of concentric/concentric knee flexion–extension movements at 120°/s were performed to evaluate the quadriceps and hamstrings peak torque [26]. The first set was conducted as familiarization and consisted of three submaximal and three maximal contractions [26]. In the second set, the concentric peak torque was registered to perform three repetitions of maximal effort through the whole range of motion within rest [9,26]. The highest quadriceps and hamstrings peak torque of three repetitions was recorded as concentric peak torque [9,26].
Peripheral fatigue protocol was performed 3 min later [26] where participants were instructed to perform continuous concentric/concentric knee flexion–extension movements at 120°/s exerting maximal effort through the whole range of motion within rest. Fatigue protocol finished when the concentric peak torque fell below 50% for 3 consecutive movements in both directions [26].

2.5. Data Analysis

Motive software (NaturalPoint, Inc., Corvallis, OR, USA) was used to process the initial data. During 30 s of recording, a minimum of 45 stride cycles was registered approximately in each condition. Marker data were filtered with a fourth-order low-pass Butterworth filter with a cut-off frequency of 6 Hz [27].
Angular kinematics and spatiotemporal parameters were calculated using a custom routine performed with the MatLab R2013b program (Mathworks Inc, Natick, MA, USA). To detect the movements of hip and knee flexion–extension, shank oscillation, ankle dorsi-flexion–plantar flexion, and rearfoot eversion–inversion, the angle convention shown in Figure 3 was used. Thereby, the absolute angle of the thigh with respect to the vertical angle and shank with respect to the horizontal and relative angles between the thigh and shank, shank and foot [28], and posterior leg and heel [23] for knee, ankle, and rearfoot respectively were calculated. Before recording, a standing calibration trial was collected, and the angular positions of body segments analyzed were considered as the anatomical position. Positive values represented the hip flexion, knee flexion, greater shank oscillation, ankle plantar flexion, and rearfoot inversion, while negative values described the hip extension, knee extension, lower shank oscillation, ankle dorsiflexion, and rearfoot eversion.
Angular kinematics were calculated using an XYZ Cardan sequence of rotation, and root mean square error (RMSE) was calculated to determinate the 3D reconstruction accuracy obtaining a systematic error of 0.005, 0.012, and 0.037 mm for X (mediolateral), Y (anteroposterior), and Z (vertical) axes, respectively.
Angular kinematics was registered at the initial contact, maximum knee flexion, toe-off, and maximum oscillation. Running phases and gait cycles were normalized to 100 data points. The stance was divided into absorption phase—from the initial contact to maximum knee flexion in the midstance—and generation phase—from maximum knee flexion to toe-off [29] (Figure 4).
Traditionally, initial contact has been identified using the vertical velocity of the heel but only is valid in rearfoot strike runners [30]. Milner and Paquette [31] showed that the vertical velocity of the pelvis describes a similar behavior in all foot strike patterns, representing a better method to identify the initial contact. Thus, initial contact was identified as the frame of maximum downward velocity of the trochanter. Maximum knee flexion during the stance phase was detected as the knee flexion peak located between the two knee extension peaks produced in the initial contact and take-off. Toe-off was identified as the second knee extension peak [30], and maximum oscillation was defined as the knee flexion peak during the swing phase, which is located between the two knee extension peaks produced in the toe-off and initial contact. Figure 5 represents the kinematic shape of every anatomical segment during the running test.
Regarding spatiotemporal parameters, stride frequency (Hz) was calculated using (1) the time (s) between consecutive initial contact of the same foot and (2) stride length (m) dividing treadmill speed (3.89 m/s) by stride frequency. Moreover, the time (s) between initial contact and toe-off, toe-off and initial contact, initial contact and maximum knee flexion, and maximum knee flexion and toe-off were described as stance time, swing time, absorption time, and propulsion time, respectively.

2.6. Statistics

Statistical analyses were carried out using SPSS.25 statistics software package (SPSS Inc., Chicago, IL, USA). Descriptive statistics are described as the means ± standard deviation (SD). The normality of the data distribution, the homoscedasticity of variances, and the sphericity were confirmed using the Shapiro–Wilk test, Levene test, and Mauchly test, respectively. The degrees of freedom for the within-subject comparisons were corrected for deviance from sphericity using Greenhouse–Geisser correction. Angular kinematics and spatiotemporal parameters during running between pre- and post-fatigue conditions and peripheral and central fatigue were compared by a GLM of two-way repeated measures or Friedman test (non-parametric alternative), with the effect of fatigue (pre-post) and the fatigue type (central vs. peripheral) as the within-subjects’ factors. Otherwise, delta (Δ), or pre-post fatigue modifications between peripheral and central fatigue were evaluated by paired samples t-test or Wilcoxon test for non-parametric parameters.
The meaningful changes were identified through the confidence intervals of the differences (95%CI) and effect sizes (ES). Effect size (ES) was analyzed using Cohen´s d [32] through the formula proposed by Hunter and Schmidt [33], and it was interpreted as 0.0–0.2, very small; 0.2–0.5, small; 0.5–0.8, medium; 0.8–1.2, large; 1.2–2.0, very large; and >2.0, huge [34]. The level of significance was set at p < 0.05.

3. Results

Peripheral fatigue protocol was completed by eighteen participants (N = 18), while seventeen runners (N = 17) performed the central fatigue protocol because of the exclusion due to the injury of a participant. Peripheral fatigue protocol caused a mean decrease of 55.8 ± 5.8% and 53.5 ± 6.4% in quadriceps and hamstrings respectively in concentric peak torque, and the average quadriceps and hamstrings concentric peak torque was 242.7 ± 39.9 Nm/BW and 125.4 ± 30.5 Nm/BW for these muscle groups. Regarding the central fatigue protocol, all runners finished the 30 min stipulated; the average running speed was 4.2 ± 0.3 m/s, and the perceived effort was 17.6 ± 0.5.

3.1. Fatigue Effects (Pre vs. Post Fatigue Test)

Before and after fatigue test descriptive results are shown in Table 1 for angular kinematics modification and Table 2 for spatiotemporal parameters.
The effect of fatigue (pre vs. post) was shown at the initial contact, maximum knee flexion, and toe-off phases, whereas peripheral or central fatigue did not modify the angular kinematics during the maximum oscillation phase.
Specifically, during the initial contact, the shank angle increased (p < 0.05), only after central fatigue protocol, between pre and post evaluation (95%CI = −1.204/−0.054°, ES = 0.908, p = 0.034), and ankle plantarflexion increased after fatigue protocol (95%CI = 0.698/1.918°, ES = 0.316, p = 0.035). At maximum knee flexion instant, knee flexion increased (p = 0.007) only after central fatigue protocol (95%CI = 1.033/2.302°, ES = 0.979, p = 0.000). At the toe-off instant, knee flexion was increased by the effect of fatigue (pre vs. post) (p = 0.010) only in peripheral fatigue (95%CI = −2.415/−0.602°, ES = 1.036, p = 0.003). Shank angle also increased after the fatigue test (p = 0.010) in central (95%CI = 0.536/1.444°, ES = −1.497, p = 0.002) and peripheral (95%CI = 0.105/1.035°, ES = −0.844, p = 0.020) fatigue protocols.
Stride frequency and stride length were not significantly altered by central and peripheral fatigue (p > 0.05). Stance time was significantly higher (p = 0.044), only after central fatigue protocol, at post evaluation instant compared with pre-evaluation (95%CI = −0.009/−0.003 s, ES = 1.325, p = 0.025).

3.2. Fatigue Type (Central vs. Peripheral)

The type of fatigue differences (central vs. peripheral) was shown at initial contact and maximum knee flexion instants, whereas peripheral or central fatigue did not modify the angular kinematics during the toe-off and maximum oscillation instants.
At initial contact, ankle plantarflexion was greater in peripheral fatigue at post-instant than central fatigue (95%CI = 1.586/3.474, ES = 1.346, p = 0.011).
Changes produced after fatigue protocols, as indicated by the delta parameter, were significantly higher at the thigh (95%CI = 0.424/1.144, ES = 3.353, p = 0.027) and knee (95%CI = −2.302/−0.015, ES = 2.389, p = 0.047) flexion parameters during central fatigue than peripheral fatigue, which showed a slight increase of thigh and knee extension.
At maximum knee flexion, ankle dorsiflexion was higher at central post-fatigue than peripheral post-fatigue instant (95%CI = 1.021/3.858°, ES = −1.789, p = 0.020). In addition, changes after central fatigue protocol (delta) were higher at the thigh (95%CI = −2.851/−0.520°, ES = 4.821, p = 0.008) and knee flexion parameter (95%CI = −3.105/−0.529, ES = 4.687, p = 0.009) than after peripheral fatigue protocol.
The spatiotemporal parameters showed that stance time was higher after central fatigue (post instant) (95%CI = −0.012/−0.006 s, ES = 1.800, p = 0.039) than during peripheral fatigue at post-test. Stance percentage described a tendency to statistical significance toward the same behavior (p = 0.051), while the swing percentage was lower in central fatigue at post-test than peripheral fatigue protocol (95%CI = 0.140/2.054%, ES = −1.743, p = 0.027). Finally, propulsion time changes (delta) were significantly higher after central fatigue than after peripheral fatigue protocol (95%CI = −0.012/−0.003 s, ES = 5.060, p = 0.001).

4. Discussion

The aim of this study was to identify and compare the effects of central and peripheral fatigue on angular kinematics and spatiotemporal parameters during running under the same methodology. Significant changes were observed after central and peripheral fatigue protocols in kinematics parameters. Central fatigue mainly increased the ankle, shank, and knee range of movement in the sagittal plane at initial contact, maximal knee flexion, and toe-off instants, increasing stand time. Our results supported the first hypothesis. In contrast, peripheral fatigue only induced small changes at the initial contact and toe-off instants, with no changes at MKF instant nor spatiotemporal parameters.
Kinematics and spatiotemporal alterations were higher after central than peripheral fatigue, showing a reduction in the capability of dynamically stabilizing the knee after central fatigue, showing a more flexed ankle, knee, and thigh at MKF instant, and increasing the stance time by means of a reduction in swing percentage and a subsequent increment in propulsion time compared with peripheral fatigue. The second hypothesis also was supported by the results.
Regarding the effect of fatigue (pre vs. post) on angular kinematics and spatiotemporal parameters, prolonged running fatigue protocols on a treadmill caused kinematics modifications in the stance phase without altering the swing phase. Central fatigue protocol resulted in a greater shank anterior oscillation at initial contact, while the thigh and knee flexion and ankle dorsiflexion were sustained. Previous studies suggested that after central fatigue, an anterior displacement of the center of mass [10] caused by an increased forward trunk lean (trunk flexion) [8,10,24] and pelvis anterior tilt [10] occurs. The authors suggest that the knee flexion was sustained [35], and in order to maintain balance after kinematics changes [35], the increased shank anterior oscillation could be an adaptation that would cause the initial contact to happen more forward.
Coinciding with our results at initial contact, some studies showed that knee flexion was not altered in central fatigue [10,24,36]. Contrary, Chan-Roper, Hunter, Myrer, Eggett, and Seeley [37] described a decrease of knee flexion associated with the decline in pace runs, which is an aspect that did not happen in our study, since the speed was kept constant. Pace reduction in a real situation was associated with the muscle breakdown blood markers related to fatigue [38]. The knee joint acts as a low-pass filter, so the more flexed the knee, the greater the shock attenuation [39,40], but hitting the ground with a more extended knee can increase not only the forces received but also the risk of injury.
However, other investigations reported a gradual increase in knee flexion as fatigue increase. The knee flexion/extension during the midstance phase is directly related to the severity of the received forces [7,41]. Therefore, greater knee flexion acts as a corporal compensatory strategy to reduce the vGRF [6,7,41]. Our results showed a greater knee flexion in the maximum knee flexion instant or also called midstance after central fatigue protocol, reflecting the bodily protective mechanism to reduce external forces. It is important to mention that each knee angle increase means a 68 N reduction in vGRF approximately [41], but the metabolic cost also increases [6]. So, the oxygen consumption (VO2) could be increased by 25% for each 5-degree increase in midstance knee flexion angle [42].
In our study, both ankle dorsiflexion and rearfoot eversion were not affected by central fatigue during the stance phase. Similarly, other investigations reported the same behavior of the ankle dorsiflexion [24,43]. However, an increased rearfoot eversion during fatigued running seems to be an accepted action in the literature [7,24]. This increment could be affected by the foot strike patterns because, as Jewell, Boyer, and Hamill [44] affirmed, fatigue effects on rearfoot behavior are opposite in rearfoot and forefoot runners.
In the take-off phase, Jewell et al. [44] described a plantar flexion increase during a fatigued run. Nevertheless, our results showed higher shank posterior oscillation after central fatigue. It could be explained by a possible increase in trunk flexion [24] that would cause an adaptation of leg position to accelerate the center of mass in its new location with fatigue.
It seems accepted that changes in movement patterns cause an increase in stance time [8,11,16,17,37,45] and a decrease in swing time [8,16,17,45]. Central fatigue increased stance time by 2.65%, but the swing time remained constant. It would be explained by quadriceps and hamstrings fatigue that damaged the stretching–shortening mechanism in the hip and knee joints [7,37], leading to the aforementioned increase in knee flexion during stance [37] and increasing the stance time.
Stride frequency and stride length remained constant after the central fatigue. It has been shown that stride frequency and length are not affected by fatigue when speed or pace run is constant, both in overground [8,11,16] and treadmill running [18,45]. Conversely, stride frequency and length decrease as the speed decreases in overground running [11,37]. Therefore, changes in these two parameters can be very dependent on the speed [11]. In fact, Ogueta-Alday, Morante, Gomez-Molina, and Garcia-Lopez [46] already suggested that running speed, along with foot strike pattern, are responsible for spatiotemporal differences.
The hypothesis that peripheral fatigue increased the range of movements of the lower limb in the propulsion phase, and the maintenance of swing phase, stride frequency, and stride length, was supported. Instead, the increase of the range of movements of the lower limb in the absorption phase and stance time was not supported.
In our study, knee range of movement during the absorption phase was not modified after peripheral fatigue. Conversely, Kellis, Zafeiridis, and Amiridis [9] and Kellis and Liassou [15] showed an increased knee flexion in the initial contact after quadriceps and hamstring isokinetic fatigue protocol. This increment could be caused by changes in muscle activation in favor of the quadriceps muscle, because this muscular group has a greater capacity to produce strength at high knee-flexion angles. This adaptation is called a quadriceps-dominant strategy, and it may reduce vGRF, improve the impact absorption, and maintain the hip and knee control during the initial contact [9].
Ankle dorsiflexion decreased in the initial contact after peripheral fatigue. With a greater plantar flexion during contact (forefoot/midfoot strike patterns), the ankle and foot behave as shock absorbers immediately after impact decreasing vGRF [44]. It has been demonstrated that fatigue causes a greater activation or a shift toward greater reliance in non-fatigued muscles [9]. Kellis, Zafeiridis, and Amiridis [9] showed that gastrocnemius activation increased when hamstrings muscles were fatigued to compensate the diminished hamstring strength. Therefore, the increased plantar flexion could manifest a corporal compensatory strategy to reduce the vGRF when quadriceps and hamstrings are fatigued. Nevertheless, this adaptation could lead to excessive demand on the muscles of the ankle and foot [44].
In the take-off phase, knee flexion increased after peripheral fatigue. This result coincides with those obtained by Kellis and Liassou [15] who found an increase of both knee flexion and hip extension after the isokinetic knee fatigue protocol. In addition, we also founded a greater shank posterior oscillation. These kinematics modifications during take-off in the fatigue state could occur as a response of lower force production capacity to extend hip by hamstrings and to extend the knee by rectus femoris [15].
Regarding spatiotemporal parameters, Fischer, Storniolo, and Peyre-Tartaruga [14] described that 60 s of Counter-Movement Jumps fatigue protocol increased the stride frequency when the speed was constant, with no modifications in stance time, swing time, stride length, and vertical stiffness. However, in our research, stride frequency was not modified after peripheral fatigue. As far as we know, few studies analyzed the effects of muscular fatigue in spatiotemporal parameters during running, so more investigations are needed to clarify this disagreement.
The third hypothesis, that central fatigue increased to a greater extent the range of movements of the lower limb in absorption and propulsion phases and stance time than peripheral fatigue, was supported.
For all we know, there are no studies that compare the effects of central and peripheral fatigue in angular kinematics during running. In our investigation, the differences between the effects of central and peripheral fatigue were found during the absorption phase, showing similar effects in take-off and oscillation phases.
Compared to peripheral fatigue, central fatigue caused greater increases in thigh and knee flexion, and ankle position was more dorsiflexed during the initial contact and maximum absorption phases. It could describe compensatory adaptations to maintain balance by shifting the body’s center of mass [10,35] and to reduce the vGRF [7,41], diminishing knee loading without increasing the energetics or biomechanics demand in ankle [47].
These postural forward modifications and the decreased strength of knee extensors [47] would explain the higher increase of propulsion time after central than peripheral fatigue. Furthermore, the increment of range of movements during the absorption phase after central fatigue would be responsible for the increased stance time [8,11,16,17,37,45].
Peripheral fatigue produced a higher extended hip and knee during the initial contact and also during the maximum knee flexion phase compared to central fatigue. This greater knee extension during stance increases the vGRF received [6,7], and it may increase the risk of lower extremity injuries [6,7,11]. Moreover, the greater plantar flexion during peripheral fatigue to compensate the absorption with ankle and foot could override these structures and lead to injuries [44].
Running patterns in a central fatigue state were characterized by an increase in ranges of movement oriented toward a greater hip and knee flexion and ankle dorsiflexion during the initial contact and maximum absorption, increasing the stance time and propulsion time. While running with peripheral fatigue in quadriceps and hamstrings muscles was based on an increase in hip and knee extension during phases dedicated to the cushioning.
Finally, this study had some limitations. Firstly, although there are studies that suggest that fatigue affects the dominant and non-dominant limbs in a similar way [48], we believe that the analysis of the two limbs could provide an extra quality to this research. Fatigue only of the dominant limb could cause the athlete to run compensating for this fatigue with the non-dominant and non-fatigued leg. However, the time required to fatigue both limbs on the isokinetic dynamometer was too long, and it could compromise the state of fatigue by helping the first-place fatigued leg to recover. Secondly, the infrared camera system used did not allow both extremities to be recorded at the same time, which is an aspect that would have provided more information on the processes of fatigue in athletes.
The authors believe that future research should focus on knowing the effect of central and peripheral fatigue in both extremities at the same time, seeking protocols and instruments that allow a specific muscle group to be locally fatigued in both extremities at the same time, in addition to using a three-dimensional filming system that allows both extremities to be recorded during running.

5. Conclusions

Central fatigue, induced by a prolonged running protocol on treadmill, increased the knee range of movements during absorption, posterior shank oscillation during propulsion, and stance time. Quadriceps and hamstrings isokinetic fatigue decreased ankle dorsiflexion during initial contact and increased knee flexion and posterior shank oscillation during propulsion. Furthermore, central fatigue increased to a greater extent the hip and knee flexion and ankle dorsiflexion during initial contact and maximum absorption as well as stance time and propulsion time. Our results suggested that running patterns adopted during running in the central fatigue state were different and in the opposite direction to variations caused by peripheral fatigue.

Author Contributions

Conceptualization, A.E.-M., P.P.-S. and A.G.-G.; methodology, A.E.-M., P.P.-S., A.G.-G. and R.B.-V.; software, A.E.-M., R.B.-V. and P.P.-S.; formal analysis, A.E.-M., A.G.-G., R.S.-S. and P.P.-S.; investigation, A.E.-M., A.G.-G., R.S.-S. and P.P.-S.; resources, A.E.-M., R.B.-V. and P.P.-S.; data curation, A.E.-M., A.G.-G. and P.P.-S.; writing—original draft preparation, A.E.-M., A.G.-G., R.B.-V., R.S.-S. and P.P.-S.; writing—review and editing, A.E.-M. and P.P.-S.; visualization, A.E.-M., A.G.-G., R.B.-V., R.S.-S. and P.P.-S.; supervision, A.E.-M.; project administration, A.E.-M., R.B.-V. and P.P.-S.; funding acquisition, A.E.-M. All authors have read and agreed to the published version of the manuscript.

Funding

This research was funded by Bodytone International Sport, S.L., within the framework of the research project between the Universidad Católica de Murcia UCAM and Bodytone International Sport, with grant number CFE-BODYTONE-03-18.

Institutional Review Board Statement

The study was conducted according to the guidelines of the Declaration of Helsinki and approved by the Institutional Review Board of the Universidad Católica de Murcia UCAM (registry number: 6775, date: 21 July 2017).

Informed Consent Statement

Informed consent was obtained from all subjects involved in the study.

Data Availability Statement

The dataset generated and analyzed during the current study are available from the corresponding author on reasonable request.

Acknowledgments

The authors want to thank all participants for their participation in this study.

Conflicts of Interest

The authors declare no conflict of interest. The funders had no role in the design of the study; in the collection, analyses, or interpretation of data; in the writing of the manuscript, or in the decision to publish the results.

References

  1. Junior, L.C.H.; Pillay, J.D.; Van Mechelen, W.; Verhagen, E. Meta-analyses of the effects of habitual running on indices of health in physically inactive adults. Sports Med. 2015, 45, 1455–1468. [Google Scholar] [CrossRef] [Green Version]
  2. Fields, K.B.; Sykes, J.C.; Walker, K.M.; Jackson, J.C. Prevention of running injuries. Curr. Sports Med. Rep. 2010, 9, 176–182. [Google Scholar] [CrossRef] [PubMed]
  3. Boccia, G.; Dardanello, D.; Tarperi, C.; Festa, L.; La Torre, A.; Pellegrini, B.; Schena, F.; Rainoldi, A. Women show similar central and peripheral fatigue to men after half-marathon. Eur. J. Sport Sci. 2018, 18, 695–704. [Google Scholar] [CrossRef] [PubMed]
  4. Martin, V.; Kerhervé, H.; Messonnier, L.A.; Banfi, J.-C.; Geyssant, A.; Bonnefoy, R.; Féasson, L.; Millet, G. Central and peripheral contributions to neuromuscular fatigue induced by a 24 h treadmill run. J. Appl. Physiol. 2010, 108, 1224–1233. [Google Scholar] [CrossRef] [PubMed]
  5. Nigg, B.M.; Baltich, J.; Hoerzer, S.; Enders, H. Running shoes and running injuries: Mythbusting and a proposal for two new paradigms: “Preferred movement path” and “comfort filter”. Br. J. Sports Med. 2015, 49, 1290–1294. [Google Scholar] [CrossRef] [PubMed] [Green Version]
  6. Derrick, T.R. The effects of knee contact angle on impact forces and accelerations. Med. Sci. Sports Exerc. 2004, 36, 832–837. [Google Scholar] [CrossRef] [PubMed]
  7. Derrick, T.R.; Dereu, D.; McLean, S.P. Impacts and kinematic adjustments during an exhaustive run. Med. Sci. Sports Exerc. 2002, 34, 998–1002. [Google Scholar] [CrossRef]
  8. Elliott, B.C.; Roberts, A.D. A biomechanical evaluation of the role of fatigue in middle-distance running. J. Can. Sci. Appl. Sport 1980, 5, 203–207. [Google Scholar]
  9. Kellis, E.; Zafeiridis, A.; Amiridis, I.G. Muscle coactivation before and after the impact phase of running following isokinetic fatigue. J. Athl. Train. 2011, 46, 11–19. [Google Scholar] [CrossRef] [Green Version]
  10. Maas, E.; De Bie, J.; Vanfleteren, R.; Hoogkamer, W.; Vanwanseele, B. Novice runners show greater changes in kinematics with fatigue compared with competitive runners. Sports Biomech. 2017, 17, 350–360. [Google Scholar] [CrossRef]
  11. Winter, S.; Gordon, S.; Watt, K. Effects of fatigue on kinematics and kinetics during overground running: A systematic review. J. Sports Med. Phys. Fit. 2016, 57, 887–899. [Google Scholar]
  12. Willwacher, S.; Sanno, M.; Brüggemann, G.-P. Fatigue matters: An intense 10 km run alters frontal and transverse plane joint kinematics in competitive and recreational adult runners. Gait Posture 2020, 76, 277–283. [Google Scholar] [CrossRef] [PubMed]
  13. Christina, K.A.; White, S.C.; Gilchrist, L.A. Effect of localized muscle fatigue on vertical ground reaction forces and ankle joint motion during running. Hum. Mov. Sci. 2001, 20, 257–276. [Google Scholar] [CrossRef]
  14. Fischer, G.; Storniolo, J.L.; Peyré-Tartaruga, L.A. Effects of fatigue on running mechanics: Spring-mass behavior in recreational runners after 60 seconds of countermovement jumps. J. Appl. Biomech. 2015, 31, 445–451. [Google Scholar] [CrossRef]
  15. Kellis, E.; Liassou, C. The effect of selective muscle fatigue on sagittal lower limb kinematics and muscle activity during level running. J. Orthop. Sports Phys. Ther. 2009, 39, 210–220. [Google Scholar] [CrossRef] [Green Version]
  16. Rabita, G.; Couturier, A.; Dorel, S.; Hausswirth, C.; Le Meur, Y. Changes in spring-mass behavior and muscle activity during an exhaustive run at V . O2max. J. Biomech. 2013, 46, 2011–2017. [Google Scholar] [CrossRef] [Green Version]
  17. Rabita, G.; Slawinski, J.; Girard, O.; Bignet, F.; Hausswirth, C. Spring-mass behavior during exhaustive run at constant velocity in elite triathletes. Med. Sci. Sports Exerc. 2011, 43, 685–692. [Google Scholar] [CrossRef] [Green Version]
  18. Lucas-Cuevas, A.G.; Priego-Quesada, J.I.; Aparicio, I.; Giménez, J.V.; Llana-Belloch, S.; Pérez-Soriano, P. Effect of 3 weeks use of compression garments on stride and impact shock during a fatiguing run. Int. J. Sports Med. 2015, 36, 826–831. [Google Scholar] [CrossRef]
  19. Berthon, P.; Fellmann, N.; Bedu, M.; Beaune, B.; Dabonneville, M.; Coudert, J.; Chamoux, A. A 5 min running field test as a measurement of maximal aerobic velocity. Graefe Arch. Clin. Exp. Ophthalmol. 1997, 75, 233–238. [Google Scholar] [CrossRef]
  20. García-Pérez, J.A.; Pérez-Soriano, P.; Llana-Belloch, S.; Lucas, A.; Sánchez-Zuriaga, D. Effects of treadmill running and fatigue on impact acceleration in distance running. Sports Biomech. 2014, 13, 259–266. [Google Scholar] [CrossRef]
  21. Doig, G.S.; Simpson, F. Randomization and allocation concealment: A practical guide for researchers. J. Crit. Care 2005, 20, 187–191. [Google Scholar] [CrossRef]
  22. Lucas, A.; Pérez-Soriano, P.; Llana-Belloch, S.; Macián-Romero, C.; Sánchez-Zuriaga, D. Effect of custom-made and prefabricated insoles on plantar loading parameters during running with and without fatigue. J. Sports Sci. 2014, 32, 1712–1721. [Google Scholar] [CrossRef] [PubMed]
  23. Nigg, B.M.; De Boer, R.W.; Fisher, V. A kinematic comparison of overground and treadmill running. Med. Sci. Sports Exerc. 1995, 27, 98–105. [Google Scholar] [CrossRef]
  24. Koblbauer, I.F.; van Schooten, K.S.; Verhagen, E.A.; van Dieën, J.H. Kinematic changes during running-induced fatigue and relations with core endurance in novice runners. J. Sci. Med. Sport 2014, 17, 419–424. [Google Scholar] [CrossRef] [PubMed]
  25. Borg, G.A. Psychophysical bases of perceived exertion. Med. Sci. Sports Exerc. 1982, 14, 377–381. [Google Scholar] [CrossRef] [PubMed]
  26. Soleimanifar, M.; Salavati, M.; Akhbari, B.; Moghadam, M. The interaction between the location of lower extremity muscle fatigue and visual condition on unipedal postural stability. Graefe Arch. Clin. Exp. Ophthalmol. 2012, 112, 3495–3502. [Google Scholar] [CrossRef]
  27. Ferrari, D.; Briani, R.V.; Silva, D.D.O.; Pazzinatto, M.F.; Ferreira, A.S.; Alves, N.; de Azevedo, F.M. Higher pain level and lower functional capacity are associated with the number of altered kinematics in women with patellofemoral pain. Gait Posture 2018, 60, 268–272. [Google Scholar] [CrossRef]
  28. Hall, S.J. Angular kinematics of human movement. In Basic Biomechanics; Hall, S.J., Ed.; McGraw-Hill Higher Education: New York, NY, USA, 2015. [Google Scholar]
  29. Novacheck, T. The biomechanics of running. Gait Posture 1998, 7, 77–95. [Google Scholar] [CrossRef]
  30. Fellin, R.E.; Rose, W.C.; Royer, T.D.; Davis, I.S. Comparison of methods for kinematic identification of footstrike and toe-off during overground and treadmill running. J. Sci. Med. Sport 2010, 13, 646–650. [Google Scholar] [CrossRef] [Green Version]
  31. Milner, C.E.; Paquette, M.R. A kinematic method to detect foot contact during running for all foot strike patterns. J. Biomech. 2015, 48, 3502–3505. [Google Scholar] [CrossRef]
  32. Cohen, J. A power primer. Psychol. Bull. 1992, 112, 155–159. [Google Scholar] [CrossRef]
  33. Hunter, J.; Schmidt, F. Methods of meta-analysis. In Methods of Meta-Analysis; SAGE Publications: Thousand Oaks, CA, USA, 2004. [Google Scholar]
  34. Sawilowsky, S.S. New effect size rules of thumb. J. Mod. Appl. Stat. Methods 2009, 8, 597–599. [Google Scholar] [CrossRef]
  35. Saha, D.; Gard, S.; Fatone, S. The effect of trunk flexion on able-bodied gait. Gait Posture 2008, 27, 653–660. [Google Scholar] [CrossRef]
  36. Abt, J.P.; Sell, T.C.; Chu, Y.; Lovalekar, M.; Burdett, R.G.; Lephart, S.M. Running kinematics and shock absorption do not change after brief exhaustive running. J. Strength Cond. Res. 2011, 25, 1479–1485. [Google Scholar] [CrossRef] [Green Version]
  37. Chan-Roper, M.; Hunter, I.; Myrer, J.W.; Eggett, D.L.; Seeley, M.K. Kinematic changes during a marathon for fast and slow runners. J. Sports Sci. Med. 2012, 11, 77–82. [Google Scholar]
  38. Del Coso, J.; Fernández, D.; Abián-Vicén, J.; Salinero, J.J.; González-Millán, C.; Areces, F.; Ruiz, D.; Gallo, C.; Gonzalez, J.M.C.; Pérez-González, B. Running pace decrease during a marathon is positively related to blood markers of muscle damage. PLoS ONE 2013, 8, e57602. [Google Scholar] [CrossRef]
  39. Reenalda, J.; Maartens, E.; Buurke, J.H.; Gruber, A.H. Kinematics and shock attenuation during a prolonged run on the athletic track as measured with inertial magnetic measurement units. Gait Posture 2019, 68, 155–160. [Google Scholar] [CrossRef] [PubMed]
  40. Edwards, W.B.; Derrick, T.R.; Hamill, J. Musculoskeletal attenuation of impact shock in response to knee angle manipulation. J. Appl. Biomech. 2012, 28, 502–510. [Google Scholar] [CrossRef] [PubMed]
  41. Gerritsen, K.G.; Bogert, A.V.D.; Nigg, B.M. Direct dynamics simulation of the impact phase in heel-toe running. J. Biomech. 1995, 28, 661–668. [Google Scholar] [CrossRef]
  42. Valiant, G.A. Transmission and attenuation of heelstrike accelerations. In Biomechanics of Distance Running; Cavanagh, P.R., Ed.; Human Kinetics: Champaign, IL, USA, 1990; pp. 225–247. [Google Scholar]
  43. Shih, Y.; Ho, C.-S.; Shiang, T.-Y. Measuring kinematic changes of the foot using a gyro sensor during intense running. J. Sports Sci. 2013, 32, 550–556. [Google Scholar] [CrossRef]
  44. Jewell, C.; Boyer, K.A.; Hamill, J. Do footfall patterns in forefoot runners change over an exhaustive run? J. Sports Sci. 2016, 35, 74–80. [Google Scholar] [CrossRef] [PubMed]
  45. Fourchet, F.; Girard, O.; Kelly, L.; Horobeanu, C.; Millet, G.P. Changes in leg spring behaviour, plantar loading and foot mobility magnitude induced by an exhaustive treadmill run in adolescent middle-distance runners. J. Sci. Med. Sport 2015, 18, 199–203. [Google Scholar] [CrossRef] [PubMed]
  46. Ogueta-Alday, A.; Morante, J.C.; Gómez-Molina, J.; García-López, J. Similarities and differences among half-marathon runners according to their performance level. PLoS ONE 2018, 13, e0191688. [Google Scholar] [CrossRef] [PubMed] [Green Version]
  47. Teng, H.-L.; Powers, C.M. Influence of trunk posture on lower extremity energetics during running. Med. Sci. Sports Exerc. 2015, 47, 625–630. [Google Scholar] [CrossRef] [PubMed]
  48. Brown, A.M.; Zifchock, R.A.; Hillstrom, H.J. The effects of limb dominance and fatigue on running biomechanics. Gait Posture 2014, 39, 915–919. [Google Scholar] [CrossRef]
Figure 1. Schematic representation of the study protocol. * The order of fatigue protocol was randomized.
Applsci 11 06610 g001
Figure 2. Protocol followed for fixing the retro-reflective markers. (A): fit shorts, (B): shave the area, (C): mark the anatomical point, (D): add adhesive spray, (E): wait for it to dry, (F): stick the marker, (G): reinforce with a non-woven adhesive material, (H): add adhesive spray again on the non-woven adhesive material.
Applsci 11 06610 g002
Figure 3. Conventions used for lower extremity angles.
Applsci 11 06610 g003
Figure 4. Representation of maximum knee flexion (MKF), toe-off (TO), and maximum oscillation (MO) events using the knee angular kinematics once the initial contact (IC) instant is known through the vertical velocity of the trochanter. The black line represents the mean movement pattern, and the green lines represent every running stride.
Applsci 11 06610 g004
Figure 5. Angular kinematics of thigh, knee, shank, ankle, and rearfoot in peripheral pre-fatigue (continuous black line), peripheral post-fatigue (dotted black line), central pre-fatigue (continuous gray line), and central post-fatigue (dotted gray line). IC: Initial Contact. TO: Toe-Off.
Applsci 11 06610 g005
Table 1. Results of angular kinematics pre- and post-fatigue.
Peripheral FatigueCentral Fatiguep Values
Pre-FatiguePost-FatiguePre-FatiguePost-FatigueFatigue Effect
(Pre-Post)
Fatigue Type (Per-Cent)Interaction
Mean ± SD Mean ± SD Mean ± SD Mean ± SD Mean ± SD Mean ± SD
Initial contact (IC)
Thigh IC (°)24.36 ± 0.824.14 ± 0.75−0.22 ± 0.3023.77 ± 0.8524.59 ± 0.980.82 ± 0.32 *-0.0270.027
Knee IC (°)12.65 ± 1.2211.71 ± 1.24−0.94 ± 0.5112.34 ± 1.4012.56 ± 1.400.22 ± 0.46 *-0.047-
Shank IC (°)3.27 ± 0.753.93 ± 0.660.66 ± 0.443.85 ± 0.574.45 ± 0.74 0.60 ± 0.360.035--
Ankle IC (°) §2.54 ± 1.963.15 ± 1.90 +0.62 ± 0.210.48 ± 1.670.84 ± 1.51 0.36 ± 0.690.0000.011-
Rearfoot IC (°)−0.71 ± 1.75−1.52 ± 1.82−0.81 ± 1.10−0.50 ± 1.76−1.92 ± 1.41−1.42 ± 1.44---
Maximal Knee Flexion (MKF)
Thigh MKF (°) §16.43 ± 1.1716.08 ± 1.12−0.35 ± 0.3715.61 ± 1.1116.95 ± 1.121.34 ± 0.33 *-0.008-
Knee MKF (°)32.29 ± 1.7432.14 ± 1.72−0.15 ± 0.4632.12 ± 1.7333.79 ± 1.68 ‡‡1.67 ± 0.30 *0.0070.009-
Shank MKF (°) §−24.30 ± 0.58−24.56 ± 0.50−0.26 ± 0.22−24.09 ± 0.61−24.42 ± 0.64−0.33 ± 0.17---
Ankle MKF (°) §−11.74 ± 1.84−11.33 ± 1.920.41 ± 0.29−13.66 ± 1.21−14.11 ± 1.07 −0.45 ± 0.56-0.020-
Rearfoot MKF (°) §−9.92 ± 2.90−10.46 ± 4.01−0.54 ± 1.67−11.76 ± 1.78−13.84 ± 1.44−2.08 ± 1.46---
Toe-Off Instant (TO)
Thigh TO (°)−17.50 ± 0.92−16.86 ± 0.860.64 ± 0.29−18.30 ± 0.83−18.48 ± 0.89−0.18 ± 0.41---
Knee TO (°)14.33 ± 1.1015.48 ± 1.12 ++1.15 ± 0.3814.32 ± 1.2015.12 ± 1.270.80 ± 0.440.010--
Shank TO (°) §−40.27 ± 0.70−40.84 ± 0.65 +−0.57 ± 0.27−40.19 ± 0.62−41.18 ± 0.70 ‡‡−0.98 ± 0.190.010--
Ankle TO (°)19.06 ± 1.5319.56 ± 1.480.49 ± 0.6917.91 ± 1.5319.20 ± 1.671.29 ± 0.81---
Rearfoot TO (°) §8.20 ± 3.266.14 ± 5.31−2.06 ± 3.376.48 ± 2.934.68 ± 3.35−1.80 ± 1.53---
Oscillation Instant (MO)
Thigh MO (°)18.76 ± 0.9219.06 ± 0.570.30 ± 0.5918.00 ± 0.8918.87 ± 0.810.87 ± 0.81---
Knee MO (°)92.95 ± 2.8092.26 ± 2.28−0.69 ± 1.2892.29 ± 2.5893.27 ± 2.410.97 ± 1.18---
Shank MO (°) §−51.05 ± 12.27−57.68 ± 12.57−6.63 ± 7.65−56.31 ± 13.36−55.61 ± 13.420.70 ± 3.50---
Ankle MO (°) §12.75 ± 2.1013.37 ± 2.170.62 ± 0.5712.35 ± 2.4113.00 ± 1.870.65 ± 1.29---
Rearfoot MO (°)98.2 ± 18.47103.34 ± 14.925.14 ± 12.1891.60 ± 20.69107.19 ± 17.3715.59 ± 18.55---
§: Non-parametric variables (Friedman Test and Wilcoxon Test), SD: Standard Deviation, ∆: Delta changes, IC: Initial Contact, MKF: Maximum Knee Flexion, TO: Toe-Off, MO: Maximum Oscillation, Inv: Rearfoot Inversion, Ev: Rearfoot Eversion, : p < 0.05 peripheral pre-fatigue vs. peripheral post-fatigue, ++: p < 0.01 peripheral pre-fatigue vs. peripheral post-fatigue, : p < 0.05 central pre-fatigue vs. central post-fatigue, ‡‡: p < 0.01 central pre-fatigue vs. central post-fatigue, : p < 0.05 peripheral post-fatigue vs. central post-fatigue, *: p < 0.05 ∆ peripheral fatigue vs. ∆ central fatigue.
Table 2. Results of spatiotemporal parameters and spring-mass model pre- and post-fatigue.
Peripheral FatigueCentral Fatigue
Pre-FatiguePost-FatiguePre-FatiguePost-Fatigue
Mean ± SDMean ± SDMean ± SDMean ± SDMean ± SDMean ± SD
Stride Frequency (Hz)177.18 ± 2.48176.65 ± 2.47−0.526 ± 0.959176.39 ± 2.34174.89 ± 2.14−1.503 ± 1.407
Stride Length (m)2.63 ± 0.1452.63 ± 0.1450.006 ± 0.0542.65 ± 0.1432.68 ± 0.133−0.121 ± 0.603
Stride Time (s)0.679 ± 0.0090.681 ± 0.0090.002 ± 0.0040.682 ± 0.0090.688 ± 0.0090.006 ± 0.005
Stance Time (s) §0.222 ± 0.0050.223 ± 0.0050.000 ± 0.0000.226 ± 0.0040.232 ± 0.005 ‡,†0.010 ± 0.000
Swing Time (s)0.457 ± 0.0090.459 ± 0.0080.000 ± 0.0000.457 ± 0.0080.456 ± 0.0080.000 ± 0.000
Stance Time (%)32.71 ± 0.7232.67 ± 0.6−0.041 ± 0.2833.13 ± 0.5433.76 ± 0.650.636 ± 0.283
Swing Time (%)67.29 ± 0.7267.33 ± 0.60.041 ± 0.2866.87 ± 0.5466.24 ± 0.65 −0.636 ± 0.283
Absorption Time (s)0.097 ± 0.0020.098 ± 0.0030.001 ± 0.0010.099 ± 0.0020.099 ± 0.0030.000 ± 0.002
Propulsion Time (s)0.125 ± 0.0040.124 ± 0.004−0.001 ± 0.0010.127 ± 0.0030.133 ± 0.0040.007 ± 0.002 **
§: Non-parametric variables (Friedman Test and Wilcoxon Test), SD: Standard Deviation, ∆: Delta changes, Hz: Stride per second, : p < 0.05 central pre-fatigue vs. central post-fatigue, : p < 0.05 peripheral post-fatigue vs. central post-fatigue, **: p < 0.01 ∆ peripheral fatigue vs. ∆ central fatigue.
Publisher’s Note: MDPI stays neutral with regard to jurisdictional claims in published maps and institutional affiliations.

