
Effect of C-S-H Nucleating Agent on Cement Hydration


1
College of Mechanics and Materials, Hohai University, Nanjing 211100, China
2
State Key Laboratory of High Performance Civil Engineering Materials, Jiangsu Research Institute of Building Science, Jiangsu Sobute New Materials Co., Ltd., Nanjing 210008, China
*
Author to whom correspondence should be addressed.
†
Co-first authors. These authors contributed to the work equally and should be regarded as co-first authors.
Appl. Sci. 2021, 11(14), 6638; https://0-doi-org.brum.beds.ac.uk/10.3390/app11146638
Submission received: 21 June 2021
/
Revised: 12 July 2021
/
Accepted: 17 July 2021
/
Published: 20 July 2021
(This article belongs to the Topic Sustainability in Buildings: New Trends in the Management of Construction and Demolition Waste)
Abstract
:This work aims to study the effect of a nucleating agent on cement hydration. Firstly, the C-S-H crystal nucleation early strength agent (CNA) is prepared. Then, the effects of CNA on cement hydration mechanism, early strength enhancement effect, C-S-H content, 28-days hydration degree and 28-days fractal dimension of hydration products are studied by hydration kinetics calculation, resistivity test, BET specific surface area test and quantitative analysis of backscattered electron (BSE) images, respectively. The results show that CNA significantly improves the hydration degree of cement mixture, which is better than triethanolamine (TEA). CNA shortens the beginning time of the induction period by 49.3 min and the end time of the cement hydration acceleration period by 105.1 min than the blank sample. CNA increases the fractal dimension of hydration products, while TEA decreases the fractal dimension. CNA significantly improves the early strength of cement mortars; the 1-day and 3-days strength of cement mortars with CNA are more than the 3-days and 7-days strength of the blank sample. These results will provide a reference for the practical application of the C-S-H nucleating agent.
1. Introduction
In recent years, the use of prefabricated components has become more and more frequent in the construction industry [1,2,3]. Compared with traditional buildings, it has the advantages of energy saving, environmental protection and cost reduction [4,5]. However, in the process of the production of precast components, accelerating the development of early concrete strength and achieving a high turnover of mold is a key issue that needs to be solved urgently in the current precast concrete industry [6]. At present, component factories usually use high-temperature autoclave curing methods to quickly improve the early strength of prefabricated components, thereby improving the turnover efficiency of molds. However, high-temperature autoclave curing has the disadvantages of high energy consumption, heavy environmental pollution, high use cost and impact on the durability and later strength of concrete [7,8,9]. This is not friendly to the environment and enterprises. Therefore, seeking a method to improve the early strength of cement-based materials has become a research focus.
With the further research of various scholars on the process of cement hydration, dissolution and precipitation theory has become the mainstream theory to explain cement hydration, accelerating dissolution or accelerating precipitation has become a new way to explore early-strength admixtures [10,11,12]. Traditional concrete early-strength agents have certain application defects. For example, chlorine-based early-strength agents can cause corrosion of steel bars in concrete [13]. Triethanolamine (TEA) can significantly increase the early strength of cement-based materials, but cause a decrease in the flexural strength and late strength of cement [14], The mixing amount of traditional concrete early-strength is difficult to determine, and it may cause corrosion damage to concrete products due to alkali–aggregate reaction or excessive sulfate [15]. The C-S-H crystal nucleation early strength agent (CNA) as a nucleation-type early strength agent can provide nucleation sites for hydration products of the initial stage of cement hydration, accelerate the generation of hydration products and promote the early hydration of cement [16,17,18].
In this paper, CNA is prepared by a precipitation method, and then, the effect of CNA on cement hydration is mainly introduced and compared with traditional early strength agent TEA, based on hydration kinetic calculation, resistivity test and BSE analysis methods and combined with fractal theory, which aims to reveal the mechanism of CNA, and provides theoretical support and technical guidance for the practical application of CNA.
2. Materials and Methods
2.1. Materials
P·II portland cement (types 42.5, Nanjing Conch Cement Co., Ltd., Nanjing, China) is used as cementitious materials in this work; its chemical composition is shown in Table 1. Triethanolamine (TEA, Chengdu Kelong Chemical Reagent Field, Chengdu, China) and C-S-H crystal nucleation (CNA) are used as early strength agents of cement. Polyoxyethylene (5) nonylphenyl ether (NP5, Chengdu Kelong Chemical Reagent Field), cyclohexane and Na2SiO3·9H2O, and Ca(NO)3·4H2O are prepared to synthesis C-S-H crystal nucleation (CNA). The standard sand is used as a fine aggregate of cement mortar.
2.2. Synthesis of CNA
Firstly, NP5 and cyclohexane were mixed at a 1:10 volume ratio to form a solution A. Then, 0.2 mL Na2SiO3·9H2O and 0.2 mL Ca(NO)3·4H2O were dropped into 0.8 mL solution A at rate of 1.6 mL/min and 0.6 mL/min, respectively. Then the pH value of the mixed solution was adjusted to about 13 by dropping NaOH solution. Finally, the mixed solution was held at 40 °C for 24 h to form the final C-S-H crystal nucleation agent (CNA). The XRD and infrared spectrum of CNA are shown in Figure 1a,b, respectively.
It can be seen from Figure 1a that the characteristic peaks of C-S-H mainly appear at 2 h = 29°, 31.8°, 49.7°, and 55°, and these peaks refer to the reflection of d110, d200, d020, and d112, respectively. As can be seen from the XRD diagram, there is no other miscellaneous peak, so the reaction product obtained is C-S-H with high purity. From Figure 1b, the wide absorption peak near 970 cm−1 corresponds to the tensile vibration of the Si–O bond of type Q2 Si–O tetrahedron, the absorption peak near 830 cm−1 corresponds to the tensile vibration of the Si–O bond of type Q1 Si–O tetrahedron, the peak near 450 cm−1 corresponds to the bending vibration of Si–O–Si bond, and the absorption peaks near 1634 cm−1 and 3438 cm−1 corresponds to the O–H stretching vibration. It can be seen from Figure 1 that the synthesized C-S-H has a higher purity.
2.3. Specimen Preparation
In this work, the water–cement ratio of cement paste was set as 0.29, and the dosage of CNA and TEA was 1% and 2‰ (by mass) of the cementitious material, respectively.
BET samples preparation: The central block samples were broken into small pieces and soaked in anhydrous ethanol to stop the hydration. For about 10 days, the anhydrous ethanol was changed three times to ensure that the water in the test block was completely replaced. Then, the sample was placed in an oven for drying at 50 °C for later use.
BSE sample preparation: The hydrated samples were broken up and placed in anhydrous ethanol to stop the hydration; the soaking time was over 10 days, during which the anhydrous ethanol was changed three times, and when the soaking was completed, it was then dried. The hardened cement paste was pre-polished with 800 mesh sandpaper to form a surface to be measured, and then the resin and curing agent were stirred in a certain proportion on a magnetic stirrer for 5 min. The sample was then mixed with the inlaying resin for vacuum inlaying and then dried at 60 °C for 6 h after the inlaying was completed to cure the resin. The pre-polished surface of the inlaying sample was sanded with 125 μm, 70 μm and 30 μm sandpapers for 10 s, and the rotation speed was set to 150 revolutions/min until the hardened cement slurry was exposed. The inlaid samples were polished to further improve the flatness of the test surface. The samples were polished with polishing cloths of 9 um, 3 um and 0.25 um and a diamond polishing liquid of matching fineness, and the rotation speed was set to 100 revolutions/min.
2.4. Methods
2.4.1. Hydration Heat Test and Calculation of Hydration Kinetics
The hydration heat test was obtained by a TAM air eight-channel microcalorimeter, and the test temperature was controlled at 20 °C. The weighed water was mixed with the early strength agent to form a wet component, and then the wet component and cement were added to the 20 mL plastic bottle. This mixture was stirred with an egg beater for 60 s at a slow speed and then for 60 s at a fast speed to form a uniform cement slurry. Finally, the plastic bottle was placed into the tester, and thermal data were recorded.
The isothermal hydration heat curves are used to calculated hydration kinetic parameters based on the Krstulovic–Dabic formula. The cement hydration process can be divided into three stages, including nucleation and crystal growth stage (NG), interactions at phase boundaries diffusion stage (I) and diffusion stage (D), and the corresponding kinetic equations are [19]:
where dQ⁄dt represents the hydration exothermic rate of mixtures, Q is the hydration exothermic quantity and t is the hydration time; these parameters can be obtained through the hydration heat test. α is the hydration degree of cement, K1, K2, K3, , , are the reaction rate constant, n is reaction exponent, t0 is the end time of cement hydration induction period, r is the particle size participating in the reaction and Qmax is the theoretical maximum hydration heat of infinite age, which is obtained by the instrument’s own software. In addition, according to Formulas (4) and (5), the hydration heat data can be converted into the hydration degree α and hydration rate required by the kinetic model.
α(t) = Q(t)/Qmax
dα/dt = dQ/dt
The hydration degree α(t) obtained from Equation (4) is substituted into Equation (1), draw a double logarithmic curve of (as the formula shows ), then the kinetic parameters n and in the NG stage are obtained by linear fitting. In the same way, the same calculation is made for Equations (2) and (3) to obtain the reaction rate constants and in the I and D stage, then, the kinetic parameters obtained are substituted into the differential expressions of Equations (1)–(3), the kinetic curves of reaction rate F1(α), F2(α), F3(α) and reaction degree α for the NG, I and D stage are obtained, respectively.
2.4.2. Electrical Resistivity Test
A CCR-III non-contact electrodeless resistivity meter (ERM, Shanghai Lorui Instrument Equipment Co., Ltd., Shanghai, China) is used to continuously monitor the resistivity of cement slurry with different early strength agents [20]. Firstly, the petroleum jelly is used to seal the joints of the annular mold, and then the stirred cement slurry is poured into the annular mold. Gently vibrate the edge of the mold to ensure the compactness of the cement slurry. Cover the mold with plastic film and mold cover to prevent the evaporation of water. The computer automatically collects data within 48 h with an interval of 1 min. After the test, the vernier caliper is used to measure the height of the test piece and set the corresponding height on the running program to correct the resistivity data. All tests are carried out at a constant temperature of 20 °C.
2.4.3. Backscattered Electron Imaging Analysis (BSE)
The technique of backscattered electron image analysis (BSE) helps to further understand the microstructure and hydration properties of cement slurry, which can make up for the shortages of other research methods [21]. In this work, the JEOL-JXA-840A scanning electron microscope was used to obtain the SEM and BSE images. The magnification of the BSE image is 250 times, and the acceleration voltage was 15 kV. When the shooting conditions of the BSE image are the same, the gray-scale characteristic value of the phase has repeatability in different images so that BSE can be used to quantitatively count the volume content of the phase-in cement [22]. In this work, the number of pictures taken in the quantitative calculation was six. Each BSE image was analyzed to estimate the capillary porosity and hydration degree of cement. A gray-level histogram was obtained for each image. This histogram indicates the number of pixels in the image having each possible brightness value (between 0 and 255). The gray level of a phase in a BSE image is related to its backscattering coefficient η. The larger η is, the brighter phase is in the BSE image [23,24]. For hydrated cement paste, capillary pores are darkest, calcium silicate hydrate (C-S-H) and other (aluminate) hydration products are dark gray, calcium hydroxide (CH) is light gray, and unhydrated cement is the brightest. The backscattering coefficient of a single phase can be calculated by the following formula [25]:
where Ci and ηi are the mass fraction and backscattering coefficient of atoms that make up the phase, respectively. The content of each component (such as pore and unhydrated cement) in cement paste can be obtained by the threshold segmentation method [26], and the hydration degree of cement is estimated according to Equation (7).
where α is the hydration degree of the cement, Vcem(t) is the volume (area) fraction of unhydrated cement at time t, and VRS the initial volume fraction of readily soluble phases in cement. In this work, VRS = 8%. Vcem(0) is calculated based on the w/c of the prepared paste, and the cement density is 3150 kg/m3.
η = ∑iCiηi
In addition, based on the BSE images, the fractal dimension of cement hydration products can be calculated. Fractal characteristics can effectively quantify and compare the complexity of hydration products, which is related to the macron performance of concrete [27]. In this work, the box-counting dimension is used to evaluate the fractal characteristics of hydration products in the BSE image. For complex structures with autocorrelation, the box-counting dimension Db can be expressed as:
where Nk is the minimum number of grids that covering the surface of a complex structure with a square grid with side length k. The box-counting dimension indicates that the number of square grids Nk increases with the decrease of side length k, and the calculation algorithm of box-counting dimension on the BSE image is shown in Figure 2. Figure 2 is Calculation algorithm of box-counting dimension based on BSE image (a) and BSE image processing process. Original BSE image b)-1, BSE image after binarization b)-2, schematic diagram of meshing b)-3 and schematic diagram of fractal dimension fitting b)-4.
Db = log(Nk)/log(1/k)
2.4.4. Semi-Quantitative Analysis of C-S-H Content
It is different from quantitative C-S-H content directly due to both a lack of crystallinity and not precisely defined composition [28]. C-S-H gel obtains a higher surface area per unit volume that is at least an order of magnitude higher than any other component in hardened cement paste [29,30]. Thus, a semi-quantitative analysis method of C-S-H content is proposed, based on the BET-specific surface area testing. In the author’s previous study, a quantitative relationship between the BET-specific surface area and C-S-H content of hardened cement paste is proposed [31].
where C is the C-S-H content of hardened cement paste, and S is the BET-specific surface area. A SA3100 nitrogen adsorption tester is used to measure the BET-specific surface area of the sample.
C = 0.01129S − 0.07157
2.4.5. Mechanical Properties Test
In this work, the cement mortar (water–cement ratio: 0.5 and cement–sand ratio: 1:3) with different types of early strength agent was used for mechanical properties test. The dosage of CNA and TEA were 1% and 2‰ (by mass) of the cementitious material, respectively. Blocks with a size of 40 mm × 40 mm × 160 mm were selected to test the mechanical properties (flexural and compressive strength) of cement mortars with a different type of early strength agent curing at 1 day, 3 days, 7 days and 28 days, respectively. A YZH-300.10 computerized electronic universal testing machine (LUDA, Shaoxing, China) was employed. In the flexural strength test, 40 mm × 40 mm × 160 mm blocks were tested at a loading speed of 0.05 kN/s. In the compressive strength test, 40 mm × 40 mm × 40 mm blocks were utilized at a loading speed of 2.4 kN/s. For each mix, three specimens were tested and averaged.
3. Results and Discussion
3.1. Hydration Heat
The cement hydration process may be divided into five stages, including the dissolution period, the induction period, the acceleration period, the deceleration period and the slow reaction period [32]. Figure 3 shows the isothermal hydration heat curves of mixtures with and without CNA; the hydration heat emission rate and hydration heat in Figure 3 are equal to heat flow and heat, respectively. It can be found that the exothermic peak of the specimen with CNA appeared first, which is advanced by approximately 1.5 h than the blank specimen. It was also found that the cumulative heat released by the specimens with CNA is significantly higher than that without CNA. This indicates that CNA may effectively promote the early hydration process of cement. According to the instrument measurement, the theoretical maximum hydration heat (Qmax) of cement slurry with CNA (356.4 J·g−1) is slightly higher than that without CNA (343.3 J·g−1). This indicates that CNA may slightly increase the total heat release from cement hydration.
Figure 4 shows the fitting process of the hydration kinetic parameters of the CNA group and the blank group. The reaction exponent n and reaction rate constant , , of the mixtures with and without CNA are summarized in Table 2.
The kinetic parameters in Table 2 are substituted into the differential equations of Equations (1)–(3), the kinetic curves of reaction rate F1(α), F2(α), F3(α) and reaction degree α for NG, I and D processes are obtained, respectively, as shown in Figure 5.
From Figure 5, both of the dynamic differential curves of mixtures with and without CNA can accurately fit the dα⁄dt curve obtained from the hydration heat test, which verifies that the hydration process of cement mixtures with and without CNA is dominated by the NG-I-D mechanism. In Figure 5, α1 represents the transition point from the NG stage to the I stage, and α2 represents the transition point from the I stage to the D stage. The mixture with CNA obtains a higher value of α1 (0.20) than that without CNA (0.15), which indicates that CNA effectively promotes the hydration process in the NG stage. This phenomenon may be explained by that CNA sol particles with small particle size may provide a crystal nucleus for the generation of the C-S-H gel when silicate ions are saturated in the NG stage, which reduces the potential energy of C-S-H gel generation and promotes the generation of C-S-H gel. Compared with the blank group, in stage I, the CNA group’s hydration degree increased by 0.02, which also promoted cement hydration.
3.2. Electrical Resistivity
Figure 6a shows the electrical resistivity curve of cement slurry with a different type of early strength agent (ρ represents electrical resistivity). All the electrical resistivity curve exhibits the same trend. Firstly, during the dissolution and precipitation processes of cement particles, more ions will be released into the system, causing a decreasing trend in the electrical resistivity curve. Then the electrical resistivity curve reaches a dynamic balance due to the competitive balance between dissolution and precipitation processes [33]. When the calcium hydroxide (CH) is supersaturated in the solution, hydration products will precipitate on the surface of the cement particles [34], which results in a rapid increase in electrical resistivity.
From Figure 6a, it can be found that the electrical resistivity curve with CNA increases rapidly, which is always higher than that with TEA. The electrical resistivity curve with TEA is also higher than the blank sample. This indicates that the beginning of precipitation processes of mixture with CNA is earlier than that with TEA and blank sample. Both CNA and TEA may promote the early hydration process and early strength development of cement, but CNA is better.
Peak1 appears at the beginning of the induction period, and the hydration age corresponding to Peak1 time may be understood as the beginning time of the induction period [35]. Peak2 mutation occurs during the acceleration period. At this time, the AFt content increases and the gypsum content is insufficient, and AFt starts to transform to AFm [36]. Peak2 time can be considered as the boundary point between cement setting and hardening periods. Primary Peak time corresponds to the time point where the electrical resistivity curve increases rapidly. Table 3 summarizes the characteristic points of mixtures with a different type of early strength agent.
Compared with the blank sample, the Peak1 time, Peak2 time and Primary Peak time of mixtures with CNA are earlier 49 min, 82.1 min and 105 min, respectively. This indicates that CNA may effectively shorten the beginning time of the induction period, shorten the acceleration period of cement hydration and decreases the final setting time of cement. TEA may also reduce the value of Peak1 time, Peak2 time and Primary Peak time of cement mixtures, but its effect is not as well as CNA.
3.3. Amount of C-S-H
Figure 7 shows the 1-day BET adsorption diagram of cement paste with different types of early strength agents. The C-S-H content calculated based on the BET specific surface area is summarized in Table 4. The mixture with CNA obtains the maximum value of BET-specific surface area, while the mixtures with TEA possess the minimum value. The value of blank specimens is located in between these two values. Though it can be inferred that CNA may increase the compactness of the cement mixture, and TEA may decrease the compactness due to the size of the BET specific surface area being positively correlated with the compactness of the cement paste.
From Table 4, it can be found that the mixture with CNA obtains the largest amount of C-S-H, blank sample the second, and the mixture with TEA the least. Compared with the blank sample, the mixture with TEA has lower C-S-H content. This may be explained by TEA, which can improve the early strength mainly by promoting the formation of ettringite in cement mixture rather than C-S-H gel. More ettringite is produced in cement mixture, and it even inhibits the hydration of the C3S phase, which may be the main explanation for the lower flexural strength and late compressive strength of cement mixtures. The C-S-H content of cement mixture with CNA is higher (about twice) than the blank sample, which may be the main reason for the super early strength effect of CNA.
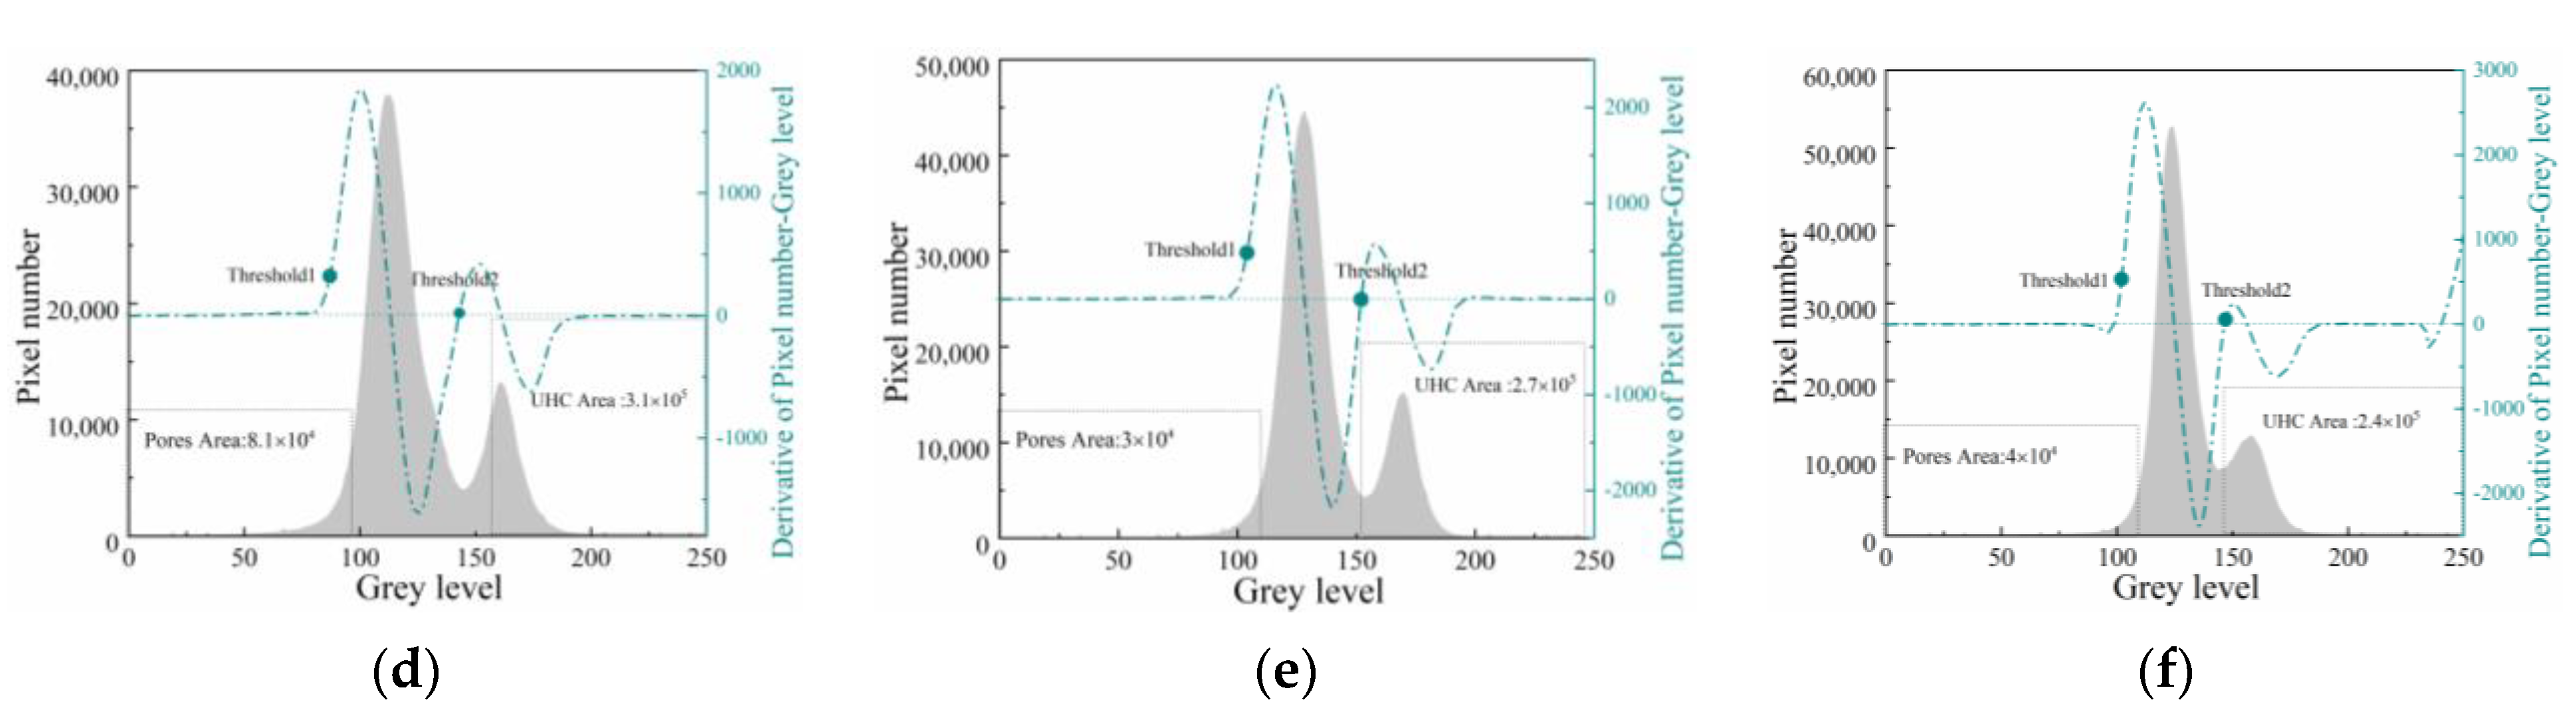
3.4. BSE Images Analysis
The 28-days hydration degree of cement could be obtained by the threshold segmentation of the BSE image of cement-based materials. As shown in Figure 8, the box-counting dimension of 28-days hydration products may be calculated based on the binary image, as shown in Figure 9. The fractal dimension of the 28-day hydration products and the hydration degree of the 28-day cement mixed with different early strength agents are summarized in Table 5.
From Table 5, it can be found that the hydration degree of the mixture with CNA (0.641) is 4.2% and 1.4%, higher than that of the mixture with TEA (0.615) and blank sample (0.632), respectively. This indicates that at the later stage of cement hydration, CNA may maintain a slightly promoting effect on the hydration of cement, but the effect is not significant. This may be explained by can, which mainly provides crystal nuclei for the formation of early cement hydration products. With the hydration process, hydration products are continuously deposited on the surface of cement particles, and the crystal nucleation effect of CNA is gradually weakened. The hydration degree of the cement mixture with TEA (0.615) is lower than the blank sample (0.632), which is a possible reason for the unsatisfactory late strength of the cement mixture with TEA [37].
It can also be found that the fractal dimension of hydration products with CNA (1.67) is 7.1% and 3.1% higher than that of mixture with TEA (1.56) and blank sample (1.62), respectively. This can be explained by the fact that more solid hydration products form and fill the pore space of cement mixture with CNA due to the higher hydration degree, which leads to a mature and complex pore network with tortuous channels [38]. Furthermore, TEA decreases the hydration degree of cement at 28-days and hinders the formation of hydration products at later ages, which is the reason that the fractal dimension of hydration products with TEA is lower than that of the blank sample.
3.5. Mechanical Properties of Cement Mortars
Figure 9 shows the compressive strength and flexural strength of cement mortars with different types of early strength agents. For all curing ages, the cement mortar with CNA obtains the largest compressive strength and flexural strength. For 1 day of age, the compressive strength of cement mortars with CNA (34.5 MPa) is 54.7% and 94.9% higher than that of mixture with TEA (22.3 MPa) and the blank sample (17.7 MPa); the flexural strength of cement mortars with CNA (5.5 MPa) is 44.7% and 57.1% higher than that of mixture with TEA (3.8 MPa) and the blank sample (3.5 MPa), respectively. For 3 days of age, the compressive strength of cement mortars with CNA (46.0 MPa) is 29.2% and 39.4% higher than that of mixture with TEA (35.6 MPa) and the blank sample (33.0 MPa); the flexural strength of cement mortars with CNA (7.6 MPa) is 40.7% and 35.7% higher than that of mixture with TEA (5.4 MPa) and the blank sample (5.6 MPa), respectively. This indicates that both CNA and TEA may significantly increase the early (1~3 days) compressive strength and flexural strength of cement mortars. In the hydration process, CNA provides nucleation sites for C-S-H and reduces the potential energy required for C-S-H nucleation, which promotes the form of C-S-H gel, fills up the remaining pores evenly and leads to a relative dense microstructure. This may explain why the cement mortars with CNA obtain the largest compressive strength and flexural strength. Meanwhile, as a traditional organic early-strength agent, TEA can chelate the aluminate phase to promote the formation of ettringite and ultimately improve the early strength of cement mortars [39].
For 28-days of age, the compressive strength of cement mortars with CNA (59.4 MPa) is 2.6% higher than the blank sample (57.9 MPa), while the compressive strength of cement mortars with TEA (56.4 MPa) is 2.7% lower than blank sample (57.9 MPa). The flexural strength has the same trend. This indicates that CNA has little effect on the mechanical properties of cement in the later stage, while TEA has certain side effects on the mechanical properties of cement in the later stage. This is consistent with the research results of Zhang et al. [40].
4. Conclusions
In this study, the influence of CNA on cement hydration mechanism, early strength enhancement effect, 28 d hydration degree and 28 d hydration product fractal dimension was mainly investigated via hydration kinetic calculation, resistivity test, BSE image analysis and mechanical properties. Triethanolamine (TEA) and the blank group are the control groups. The following results were obtained:
- The incorporation of CNA does not change the hydration mechanism of cement, which increases the hydration degree in the nucleation and crystal growth stage (NG) by 0.5, and the interactions at phase boundaries diffusion stage(I) by 0.02, which makes the cement obtain a higher degree of hydration in the initial stage of hydration;
- CNA shortens the beginning time of the induction period by 49.3 min and the end time of the cement hydration acceleration period by 105.1 min than the Blank sample, which can accelerate the setting and hardening of the cement;
- CNA significantly improves the hydration degree of cement mixtures cured for 28 days, which is better than triethanolamine (TEA). CNA increases the fractal dimension of hydration products, while TEA decreases the fractal dimension;
- CNA used in this work may provide a crystal nucleus for the generation of C-S-H gel, which reduces the potential energy of C-S-H gel generation and promotes the generation of C-S-H gel. The C-S-H content of cement mixtures with CNA is higher than that with TEA or the blank sample;
- CNA significantly improves the early strength of cement mortars; the 1-day and 3-day strength of cement mortars with CNA are more than the 3-day and 7-day strength of the blank sample, which shows that it has an excellent early strength effect.
Author Contributions
Conceptualization, Y.J.; data curation, W.Z. and T.P.; formal analysis, W.Z., Y.J. and X.J.; funding acquisition, Y.J.; methodology, X.J. and T.P.; project administration, Y.J.; writing—original draft, W.Z.; writing—review and editing, Y.J., X.J. and W.Z. All authors have read and agreed to the published version of the manuscript.
Funding
This work was supported by the National Natural Science Foundation of China [grant numbers 51738003, 11772120] and the National Natural Science Foundation of China [grant numbers 52008191, 11772120] and the National Natural Science Foundation of China [grant numbers 51978318]; and the Primary Research and Development Plan of Jiangsu Province [grant number BE2016187].
Institutional Review Board Statement
Not applicable.
Informed Consent Statement
Not applicable.
Data Availability Statement
Data sharing is not applicable.
Conflicts of Interest
The authors declare no conflict of interest. The funders had no role in the design of the study; in the collection, analyses, or interpretation of data; in the writing of the manu-script, or in the decision to publish the results.
References
- Scrivener, K.L.; John, V.M.; Gartner, E.M. Eco-efficient cements: Potential economically viable solutions for a low-CO2 cement-based materials industry. Cem. Concr. Res. 2018, 114, 2–26. [Google Scholar] [CrossRef]
- Du, Q.; Pang, Q.; Bao, T.; Guo, X.; Deng, Y. Critical factors influencing carbon emissions of prefabricated building supply chains in China. J. Clean. Prod. 2021, 280, 124398. [Google Scholar] [CrossRef]
- Chang, Y.; Li, X.; Masanet, E.; Zhang, L.; Huang, Z.; Ries, R. Unlocking the green opportunity for prefabricated buildings and construction in China. Resour. Conserv. Recycl. 2018, 139, 259–261. [Google Scholar] [CrossRef]
- Yu, S.; Liu, Y.; Wang, D.; Bahaj, A.S.; Wu, Y.; Liu, J. Review of thermal and environmental performance of prefabricated buildings: Implications to emission reductions in China. Renew. Sustain. Energy Rev. 2021, 137, 110472. [Google Scholar] [CrossRef]
- Zhang, C.; Hu, M.; Laclau, B.; Garnesson, T.; Yang, X.; Tukker, A. Energy-carbon-investment payback analysis of prefabricated envelope-cladding system for building energy renovation: Cases in Spain, the Netherlands, and Sweden. Renew. Sustain. Energy Rev. 2021, 145, 111077. [Google Scholar] [CrossRef]
- Wang, J.; Qian, C.; Qu, J.; Guo, J. Effect of lithium salt and nano nucleating agent on early hydration of cement based materials. Constr. Build. Mater. 2018, 174, 24–29. [Google Scholar] [CrossRef]
- Zou, C.; Long, G.; Ma, C.; Xie, Y. Effect of subsequent curing on surface permeability and compressive strength of steam-cured concrete. Constr. Build. Mater. 2018, 188, 424–432. [Google Scholar] [CrossRef]
- Castellano, C.C.; Bonavetti, V.L.; Donza, H.A.; Irassar, E.F. The effect of w/b and temperature on the hydration and strength of blastfurnace slag cements. Constr. Build. Mater. 2016, 111, 679–688. [Google Scholar] [CrossRef]
- Zou, C.; Long, G.; Zeng, X.; Ma, K.; Xie, Y. Hydration and multiscale pore structure characterization of steam-cured cement paste investigated by X-ray CT. Constr. Build. Mater. 2021, 282, 122629. [Google Scholar] [CrossRef]
- Sun, J.; Shi, H.; Qian, B.; Xu, Z.; Li, W.; Shen, X. Effects of synthetic C-S-H/PCE nanocomposites on early cement hydration. Constr. Build. Mater. 2017, 140, 282–292. [Google Scholar] [CrossRef]
- Alizadeh, R.; Raki, L.; Makar, J.M.; Beaudoin, J.J.; Moudrakovski, I. Hydration of tricalcium silicate in the presence of synthetic calcium–silicate–hydrate. J. Mater. Chem. 2009, 19, 7937–7946. [Google Scholar] [CrossRef] [Green Version]
- Land, G.; Stephan, D. The influence of nano-silica on the hydration of ordinary Portland cement. J. Mater. Sci. 2012, 7, 1011–1017. [Google Scholar] [CrossRef]
- Yang, D.; Yan, C.; Zhang, J.; Liu, S.; Li, J. Chloride threshold value and initial corrosion time of steel bars in concrete exposed to saline soil environments. Constr. Build. Mater. 2021, 267, 120979. [Google Scholar] [CrossRef]
- Lu, Z.; Kong, X.; Jansen, D.; Zhang, C.; Wang, J.; Pang, X.; Yin, J. Towards a further understanding of cement hydration in the presence of triethanolamine. Cem. Concr. Res. 2020, 132, 106041. [Google Scholar] [CrossRef]
- Andrade Neto, J.d.S.; De la Torre, A.G.; Kirchheim, A.P. Effects of sulfates on the hydration of Portland cement—A review. Constr. Build. Mater. 2021, 279, 122428. [Google Scholar] [CrossRef]
- John, E.; Matschei, T.; Stephan, D. Nucleation seeding with calcium silicate hydrate—A review. Cem. Concr. Res. 2018, 113, 74–85. [Google Scholar] [CrossRef]
- Li, J.; Zhang, W.; Xu, K.; Monteiro, P.J.M. Fibrillar calcium silicate hydrate seeds from hydrated tricalcium silicate lower cement demand. Cem. Concr. Res. 2020, 137, 106195. [Google Scholar] [CrossRef]
- Land, G.; Stephan, D. Controlling cement hydration with nanoparticles. Cem. Concr. Compos. 2015, 57, 64–67. [Google Scholar] [CrossRef]
- Meng, T.; Hong, Y.; Wei, H.; Xu, Q. Effect of nano-SiO2 with different particle size on the hydration kinetics of cement. Thermochim. Acta 2019, 675, 127–133. [Google Scholar] [CrossRef]
- Lu, Y.; Shi, G.; Liu, Y.; Ding, Z.; Pan, J.; Qin, D.; Dong, B.; Shao, H. Study on the effect of chloride ion on the early age hydration process of concrete by a non-contact monitoring method. Constr. Build. Mater. 2018, 172, 499–508. [Google Scholar] [CrossRef]
- Monteiro, P.J.M.; Geng, G.; Marchon, D.; Li, J.; Alapati, P.; Kurtis, K.E.; Qomi, M.J.A. Advances in characterizing and understanding the microstructure of cementitious materials. Cem. Concr. Res. 2019, 124, 105806. [Google Scholar] [CrossRef]
- Igarashi, S.; Kawamura, M.; Watanabe, A. Analysis of cement pastes and mortars by a combination of backscatter-based SEM image analysis and calculations based on the Powers model. Cem. Concr. Compos. 2004, 26, 977–985. [Google Scholar] [CrossRef] [Green Version]
- Li, Y.; Guo, W.; Li, H. Quantitative analysis on ground blast furnace slag behavior in hardened cement pastes based on backscattered electron imaging and image analysis technology. Constr. Build. Mater. 2016, 110, 48–53. [Google Scholar] [CrossRef]
- Shuxia, F.; Peiming, W.; Liu, X. SEM-backscattered electron imaging and image processing for evaluation of unhydrated cement volume fraction in slag blended Portland cement pastes. J. Wuhan Univ. Technol. Mat. Sci. Ed. 2013, 28, 968–972. [Google Scholar]
- Zhao, H.; Darwin, D. Quantitative backscattered electron analysis of cement paste. Cem. Concr. Compos. 1992, 22, 695–706. [Google Scholar] [CrossRef]
- Scrivener, K.L. Backscattered electron imaging of cementitious microstructures: Understanding and quantification. Cem. Concr. Compos. 2004, 26, 935–945. [Google Scholar] [CrossRef]
- Gao, Y.; Wu, K.; Yuan, Q. Limited fractal behavior in cement paste upon mercury intrusion porosimetry test: Analysis and models. Constr. Build. Mater. 2021, 276, 122231. [Google Scholar] [CrossRef]
- De Belie, N.; Kratky, J.; Van Vlierberghe, S. Influence of pozzolans and slag on the microstructure of partially carbonated cement paste by means of water vapour and nitrogen sorption experiments and BET calculations. Cem. Concr. Res. 2010, 40, 1723–1733. [Google Scholar] [CrossRef]
- Odler, I. The BET-specific surface area of hydrated Portland cement and related materials. Cem. Concr. Res. 2003, 33, 2049–2056. [Google Scholar] [CrossRef]
- Olson, R.A.; Jennings, H.M. Estimation of C-S-H content in a blended cement paste using water adsorption. Cem. Concr. Res. 2001, 31, 351–356. [Google Scholar] [CrossRef]
- Chen, C.; Jiang, Y.Q.; Pan, Y.F.; Xiang, Q.D. Semi-quantitative study on hydrated calcium silicate by BET/XRD. New Build Mater. 2017, 44, 124–126. [Google Scholar]
- Li, H.; Xue, Z.; Liang, G.; Wu, K.; Dong, B.; Wang, W. Effect of C-S-Hs-PCE and sodium sulfate on the hydration kinetics and mechanical properties of cement paste. Constr. Build. Mater. 2021, 266, 121096. [Google Scholar] [CrossRef]
- Yousuf, F.; Xiaosheng, W. Investigation of the early-age microstructural development of hydrating cement pastes through electrical resistivity measurements. Case Stud Constr Mater. 2020, 13, e00391. [Google Scholar]
- Scrivener, K.L.; Juilland, P.; Monteiro, P.J.M. Advances in understanding hydration of Portland cement. Cem. Concr. Res. 2015, 78, 38–56. [Google Scholar] [CrossRef]
- Yousuf, F.; Wei, X.; Zhou, J. Monitoring the setting and hardening behaviour of cement paste by electrical resistivity measurement. Constr. Build. Mater. 2020, 252, 118941. [Google Scholar] [CrossRef]
- Liu, L.; Yang, P.; Zhang, B.; Huan, C.; Guo, L.; Yang, Q.; Song, K.-I. Study on hydration reaction and structure evolution of cemented paste backfill in early-age based on resistivity and hydration heat. Constr. Build. Mater. 2021, 272, 121827. [Google Scholar] [CrossRef]
- Yang, X.; Liu, J.; Li, H.; Xu, L.; Ren, Q.; Li, L. Effect of triethanolamine hydrochloride on the performance of cement paste. Constr. Build. Mater. 2019, 200, 218–225. [Google Scholar] [CrossRef]
- Chen, X.; Yao, G.; Herrero-Bervera, E.; Cai, J.; Zhou, K.; Luo, C.; Jiang, P.; Lu, J. A new model of pore structure typing based on fractal geometry. Mar. Petrol. Geol. 2018, 98, 291–305. [Google Scholar] [CrossRef]
- Yaphary, Y.L.; Yu, Z.; Lam, R.H.W.; Lau, D. Effect of triethanolamine on cement hydration toward initial setting time. Constr. Build. Mater. 2017, 141, 94–103. [Google Scholar] [CrossRef]
- Yan-Rong, Z.; Xiang-Ming, K.; Zi-Chen, L.; Zhen-Bao, L.; Qing, Z.; Bi-Qin, D.; Feng, X. Influence of triethanolamine on the hydration product of portlandite in cement paste and the mechanism. Cem. Concr. Res. 2016, 87, 64–76. [Google Scholar] [CrossRef]
Figure 1.
XRD (a) and infrared spectrum (b) of CNA.

Figure 2.
Calculation algorithm of box-counting dimension based on BSE image (a) and BSE image processing process (b).
Figure 2.
Calculation algorithm of box-counting dimension based on BSE image (a) and BSE image processing process (b).

Figure 3.
Cement hydration rate and heat of hydration curve.

Figure 4.
Fitting curves of kinetics parameters in NG stage (a), I stage (b) and D stage (c) of blank sample; Fitting curves of kinetics parameters in NG stage (d), I stage (e) and D stage (f) of cement mixture with CNA.
Figure 4.
Fitting curves of kinetics parameters in NG stage (a), I stage (b) and D stage (c) of blank sample; Fitting curves of kinetics parameters in NG stage (d), I stage (e) and D stage (f) of cement mixture with CNA.

Figure 5.
Hydration reaction rate curve of cement mixture with nothing (a) and CNA (b).

Figure 6.
Resistivity development curve of cement slurry with different types of early strength agent (a) and the differential resistivity curve of the blank sample (b).
Figure 6.
Resistivity development curve of cement slurry with different types of early strength agent (a) and the differential resistivity curve of the blank sample (b).

Figure 7.
1-day BET specific surface area of cement hydration products with nothing (a), CNA (b) and TEA (c).
Figure 7.
1-day BET specific surface area of cement hydration products with nothing (a), CNA (b) and TEA (c).

Figure 8.
28 d BSE image of cement mixture with nothing (a), CNA (b) and TEA (c); the gray histogram of cement mixture with nothing (d), CNA (e) and TEA (f).
Figure 8.
28 d BSE image of cement mixture with nothing (a), CNA (b) and TEA (c); the gray histogram of cement mixture with nothing (d), CNA (e) and TEA (f).


Figure 9.
Compressive strength (a) and flexural strength (b) of cement mortars with different types of early strength agents.
Figure 9.
Compressive strength (a) and flexural strength (b) of cement mortars with different types of early strength agents.


Table 1.
Chemical composition of cement clinker.
| Composition | SiO2 | Fe2O3 | Al2O3 | CaO | MgO | SO3 | f-CaO | LOI | Total |
|---|---|---|---|---|---|---|---|---|---|
| Content (%) | 22.62 | 3.65 | 5.29 | 65.12 | 1.61 | 0.45 | 1.0 | 0.26 | 100 |
Table 2.
Dynamic parameter solution results.
| Types | Temperature of Hydration/℃ | n | KNG | KI | KD |
|---|---|---|---|---|---|
| BLANK | 20.0 | 1.98 | 0.050 | 0.013 | 0.0025 |
| CNA | 20.0 | 1.81 | 0.059 | 0.017 | 0.0033 |
Table 3.
Characteristic time of resistivity differential curve with different early strength agents.
Table 3.
Characteristic time of resistivity differential curve with different early strength agents.
| Types | Peak1 Time (min) | Peak2 Time (min) | Primary Peak Time (min) |
|---|---|---|---|
| BLANK | 124.2 | 422.7 | 555.4 |
| CNA | 74.9 | 340.6 | 450.3 |
| TEA | 93.6 | 368.6 | 481.7 |
Table 4.
The C-S-H content calculation results and BET data statistics of each group.
| Types | BET Surface (m2/g) | Amount of C-S-H (%) |
|---|---|---|
| BLANK | 18.29 | 13.49 |
| CNA | 28.87 | 25.44 |
| TEA | 17.77 | 12.91 |
Table 5.
The hydration degree of the hardened cement slurry at 28 days.
| Types | Hydration Degree | Fractal Dimension of Hydration Products |
|---|---|---|
| BLANK | 0.632 | 1.62 |
| CNA | 0.641 | 1.67 |
| TEA | 0.615 | 1.56 |
Publisher’s Note: MDPI stays neutral with regard to jurisdictional claims in published maps and institutional affiliations. |
© 2021 by the authors. Licensee MDPI, Basel, Switzerland. This article is an open access article distributed under the terms and conditions of the Creative Commons Attribution (CC BY) license (https://creativecommons.org/licenses/by/4.0/).
Share and Cite
MDPI and ACS Style
Zhao, W.; Ji, X.; Jiang, Y.; Pan, T. Effect of C-S-H Nucleating Agent on Cement Hydration. Appl. Sci. 2021, 11, 6638. https://0-doi-org.brum.beds.ac.uk/10.3390/app11146638
AMA Style
Zhao W, Ji X, Jiang Y, Pan T. Effect of C-S-H Nucleating Agent on Cement Hydration. Applied Sciences. 2021; 11(14):6638. https://0-doi-org.brum.beds.ac.uk/10.3390/app11146638
Chicago/Turabian StyleZhao, Wenhao, Xuping Ji, Yaqing Jiang, and Tinghong Pan. 2021. "Effect of C-S-H Nucleating Agent on Cement Hydration" Applied Sciences 11, no. 14: 6638. https://0-doi-org.brum.beds.ac.uk/10.3390/app11146638
Note that from the first issue of 2016, this journal uses article numbers instead of page numbers. See further details here.