Article

Combined Multi-Time Series SAR Imagery and InSAR Technology for Rice Identification in Cloudy Regions

1
Land Satellite Remote Sensing Application Center, Ministry of Natural Resources, Beijing 100048, China
2
College of Resources and Environment, Xingtai University, Xingtai 054001, China
3
Chongqing Institute of Geology and Mineral Resources, Chongqing 401120, China
4
College of Geographical Science, Southwest University, Chongqing 400715, China
*
Authors to whom correspondence should be addressed.
Submission received: 7 April 2021 / Revised: 24 June 2021 / Accepted: 25 June 2021 / Published: 28 July 2021
(This article belongs to the Special Issue Spatial Analysis of Agricultural Data)

Abstract

:
The use of remote sensing technology to monitor farmland is currently the mainstream method for crop research. However, in cloudy and misty regions, the use of optical remote sensing image is limited. Synthetic aperture radar (SAR) technology has many advantages, including high resolution, multi-mode, and multi-polarization. Moreover, it can penetrate clouds and mists, can be used for all-weather and all-time Earth observation, and is sensitive to the shape of ground objects. Therefore, it is widely used in agricultural monitoring. In this study, the polarization backscattering coefficient on time-series SAR images during the rice-growing period was analyzed. The rice identification results and accuracy of InSAR technology were compared with those of three schemes (single-time-phase SAR, multi-time-phase SAR, and combination of multi-time-phase SAR and InSAR). Results show that VV and VH polarization coherence coefficients can well distinguish artificial buildings. In particular, VV polarization coherence coefficients can well distinguish rice from water and vegetation in August and September, whereas VH polarization coherence coefficients can well distinguish rice from water and vegetation in August and October. The rice identification accuracy of single-time series Sentinel-1 SAR image (78%) is lower than that of multi-time series SAR image combined with InSAR technology (81%). In this study, Guanghan City, a cloudy region, was used as the study site, and a good verification result was obtained.

1. Introduction

Satellite remote sensing has become an important means of crop monitoring. Optical remote sensing can be used to monitor relevant parameters in an all-around manner during the rice-growing period. To classify agricultural crops by remote sensing, a discriminant function is established on the basis of crop characteristics, including brightness, hue, position, texture, and structure. However, optical remote sensing data are often affected by cloud, rain, fog, and other bad weather conditions in practical applications. For example, cloud cover and frequent rainfall in mountainous or basin areas make it difficult to find a suitable image for studying the rice-growing season. In addition, the optical image may contain similar objects with different spectra and different objects with similar spectra. Therefore, the use of optical remote sensing data in the identification and monitoring of rice and other crops will be greatly limited.
Synthetic aperture radar (SAR) can make up for the deficiency of optical remote sensing due to its high resolution; multi-mode; multi-polarization direction; all-weather acquisition; cloud cover penetration; all-time Earth observation; and sensitivity to the shape, material, moisture, and surface roughness of ground objects [1,2,
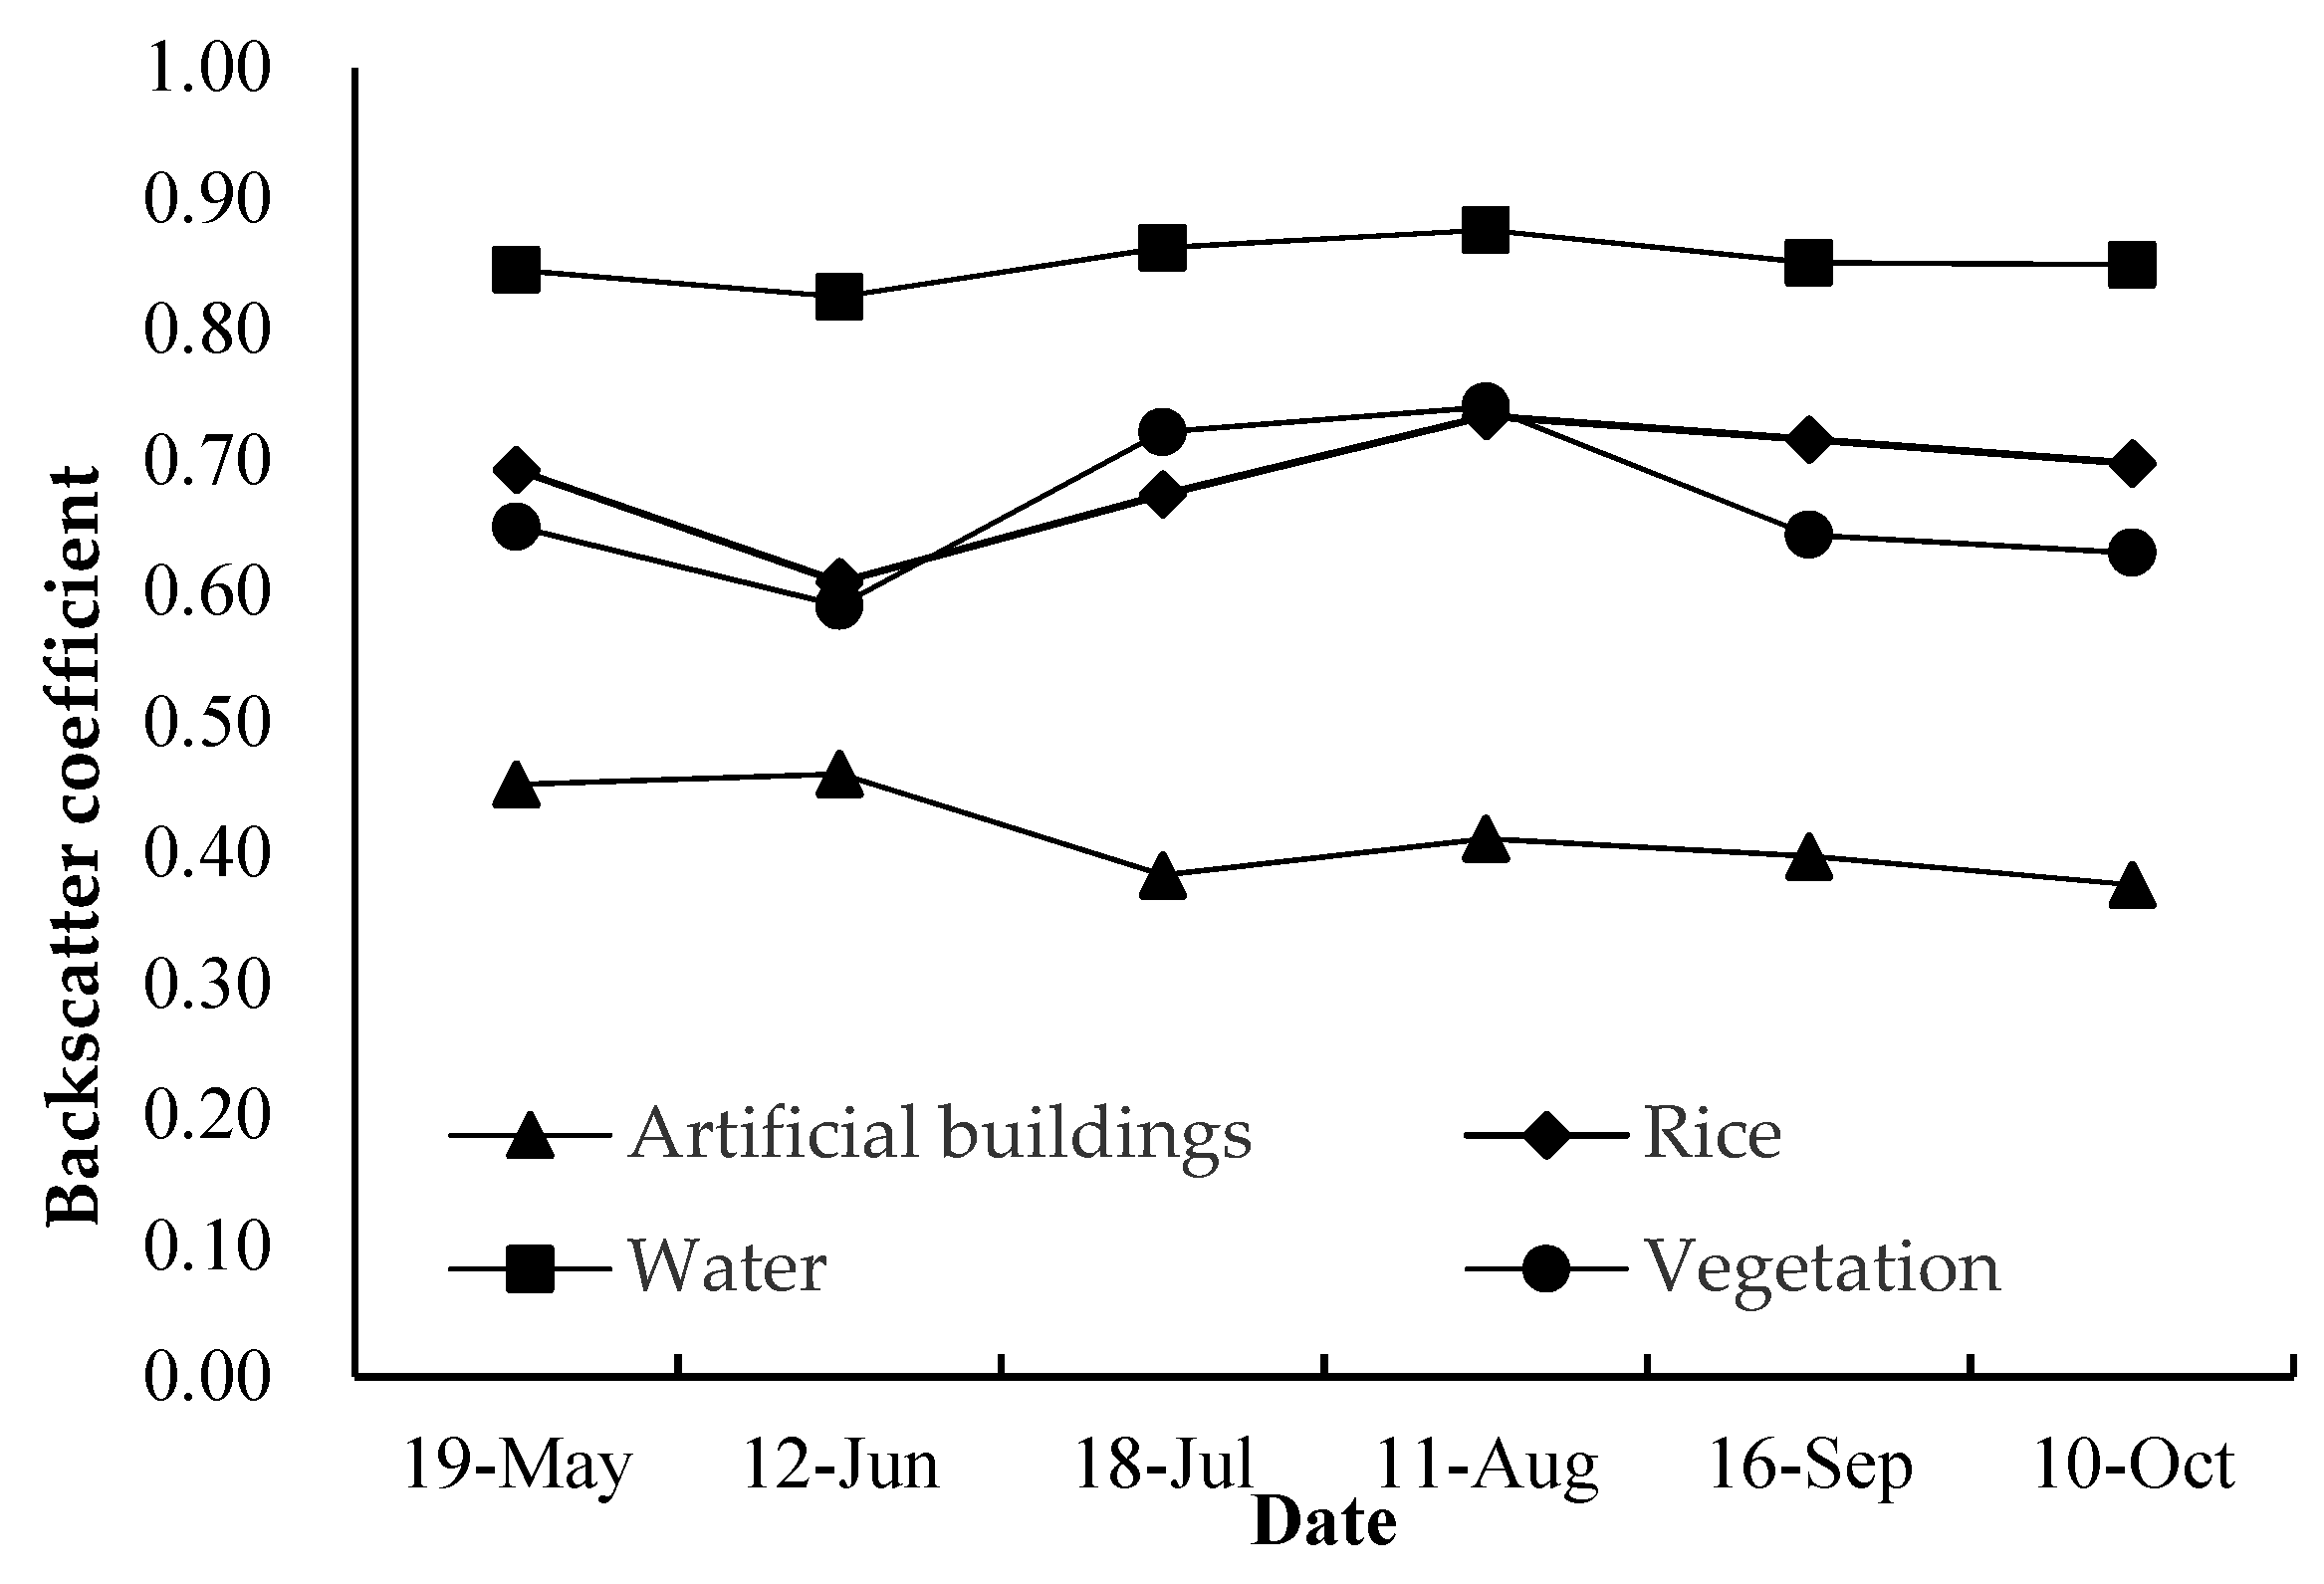
3]. For SAR imagery, the time-phase change in backscattering characteristics of rice is much greater than that of other crops. Therefore, the use of SAR imagery in monitoring rice in cloudy regions is of great significance.
At present, two primary methods are used to map rice-planting areas using SAR imagery. One is to identify by using the threshold of SAR data before and after rice planting. The other is to classify by using multi-time-phase SAR data. Previous studies identified rice-planting areas by only using single-time-phase radar images [4,5]. In addition, most of them are in the C and L bands. The main data types include ERS-1/2, JERS-1, ENVISAT ASAR, and RADARSAT-1. The polarization mode used is VV or HH. In 1989, LeToan [6] first put forward the feasibility of rice identification by using SAR imagery. By analyzing the backscattering characteristics of ground objects in the X-band radar image, they found that the change in the backscattering coefficient of rice with time was much greater than that of other crops. Therefore, the use of SAR imagery in rice identification was proposed. Gaohan [7] classified crops in Dongting Lake experimental area using Gaofen-3 SAR imagery. The overall classification accuracy of rice and other crops was 85%, and the Kappa coefficient was greater than 0.8. The single-time-phase SAR imagery has single polarization mode and only one time phase. In addition, the early SAR imagery has low spatial resolution and poor image quality, which greatly restricts the effect of crop classification and identification by SAR, especially in regions with tattered farmland and complex planting structure.
Multi-time-phase SAR imagery, which makes use of a number of time-phase SAR images, can fully reflect the change of rice in the growth cycle and has more advantages than single-time-phase radar [8,9,10]. On the basis of the comparative analysis of the difference in backscattering strength between rice in the growing period and other ground objects, the most different time phases are selected to distinguish rice from other ground objects. Bazzi [11] used the time-series Sentinel-1 SAR imagery to extract rice-planting areas with an accuracy of >80%. Nguyen [12] mapped rice-planting areas in the Mekong Delta on the basis of time-series dual-polarization (VV/VH) Sentinel-1A interferometric wide (IW) images. The accuracy reached 87.2%. Several studies demonstrated that time-series SAR can efficiently extract rice-planting areas and achieve good results. Compared with single-time phase, multi-time phase [13,14,15,16] can better reflect the polarization backscattering strength of rice in the growing period and its changes so as to better separate other ground objects.
The coherent processing is performed by using two SAR imagery in the same region taken at similar times but different viewing geometries. The phase difference information (interference phase) between the corresponding pixels is obtained, and the phase information is used to acquire the displacement along the line of sight of the radar in the target region. Thus, interference SAR (InSAR) [17,18] is established. InSAR technology is very sensitive to the spatial distribution, height, shape, and direction of surface scatterers. Therefore, interferometric radar has more advantages than single polarimetric radar in the extraction of vertical structure information of surface vegetation. The one relevant for most satellite systems is the repeat-pass interferometry configuration. This mode utilizes the fact that the repeat cycle of the satellite is not perfect, resulting in an across-track shift of orbits of typically a few hundred meters. And this means that the repeat-pass data are acquired at different times compared with the single-pass modes. This provides the possibility to study phenomena related to surface changes and feature sensitivity such as land deformation, land cover changes, and crop identification occurring between the satellite acquisitions. InSAR technology combined with time-series SAR can improve the application accuracy of SAR imagery to a certain extent. The coherent images obtained by Ghula [19] in invasive plant species, which were based on L-band PALSAR (HH/VV) data combined with InSAR technology, played an important role in mapping invasive plant species in the sub-coronal layer of tropical rain forests. Thus, the invasive and fast-growing plants were successfully identified. Jiang [20] improved the accuracy of land-cover research by using InSAR covariance matrix of HH polarimetric TerraSAR-X. The overall accuracy reached 82.46%, and the classification accuracy by InSAR was improved by about 9%. At present, InSAR technology has been widely used in the monitoring, identification, and classification of forests, snow, wetlands, soil, and cities, as well as in digital elevation model (DEM) production generation, deformation measurement, earthquake observation and measurement, and 3D reconstruction [21,22,23].
In cloudy regions, the use of optical remote sensing image in the monitoring and identification of rice and other crops is greatly restricted. However, the traditional method is mainly used in single- and multi-time-phase radar images; that is, the difference in the backscattering strength among ground objects is based to distinguish rice from other ground objects while overcoming the problems of the SAR image itself. Polarimetric InSAR technology is used for rice identification. It is very sensitive to the spatial distribution, height, shape, and direction of surface vegetation scatterers. Therefore, it can more efficiently extract the rice-planting areas compared with other technologies.
Although it is not a precedent to monitor rice based on InSAR technology, some studies only calculated and adopted the theoretical coherence diagram, namely, the coherence diagram of the two most different time phases. Based on the time-series polarimetric interference radar, combined with the change of backscattering strength of rice and coherence coefficients, this study created pairs across time, performed rice identification using a time-series Sentinel-1 and a time-series Sentinel-1 scheme incorporating the polarization coherence coefficient, and used high-resolution Sentinel-2 optical images as the result validation. The rice-planting areas were extracted by using the object-oriented classification method, which provides a reference for the monitoring and identification of rice and other crops in cloudy regions.

2. Materials and Methods

2.1. Study Area

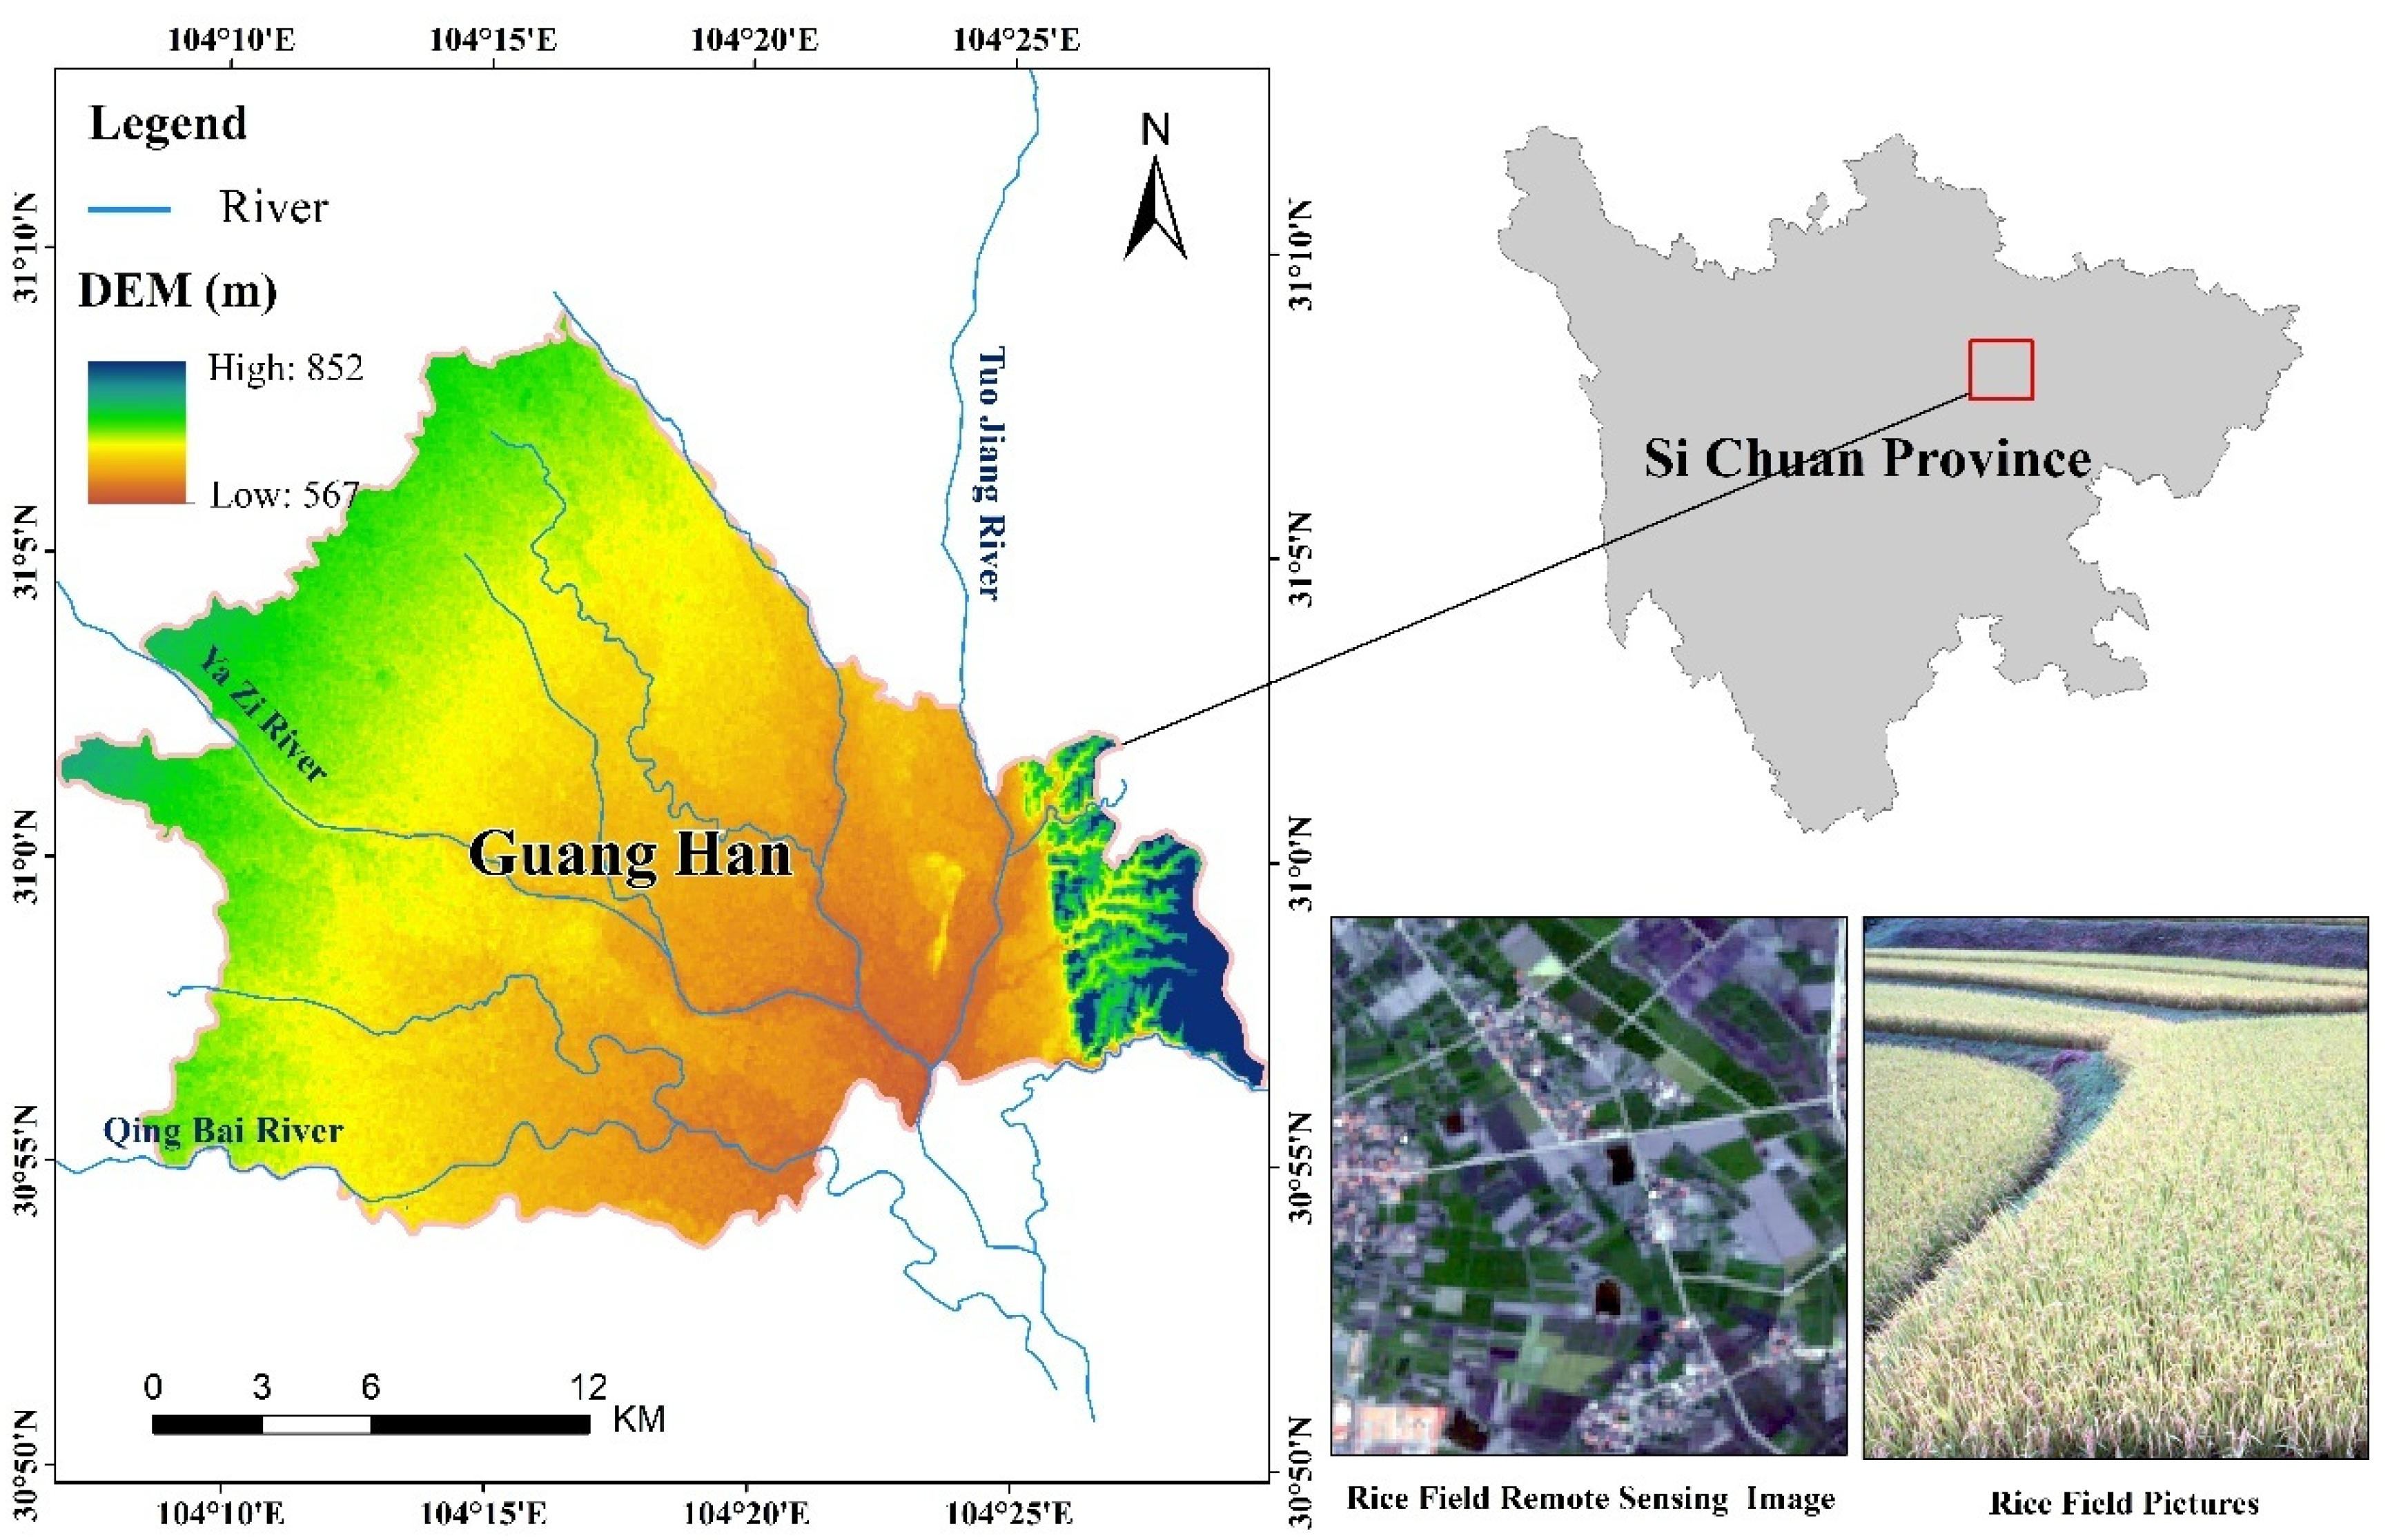
Guanghan is located in the core area of Chengdu Plain in Sichuan Basin, with a total area of 538 km2, and is gently inclined from northwest to southeast in the topography. It mainly features plains, combined with low hills, mountains, and flat dams. Among them, the hills are mainly concentrated in the south, and the mountains are mainly in the northeast. The average altitude is around 450 m, with the lowest value of 442 m and the highest value of 734 m in the east. Guanghan (Figure 1) is located in subtropical monsoon climate zone. It is mainly characterized by abundant precipitation, with annual precipitation of more than 800 mm, less rainfall in spring, and more rainstorm in summer. Affected by basin effect and climate, it is cloudy and foggy. Rice has one or two growth seasons annually, and it is transplanted in May, matures in mid-August, and is harvested in mid-September. According to the widely used Biologische Bundesanstalt, Bundessortenamt und CHemische scale (a German scale used to identify the phenological development stages of cereals, BBCH), the phenological stage of rice growth is shown in Table 1. We determined the rice-planting area according to the crop growth terminal, and the whole area in Chengdu Plain is mainly rice.

2.2. Methodology

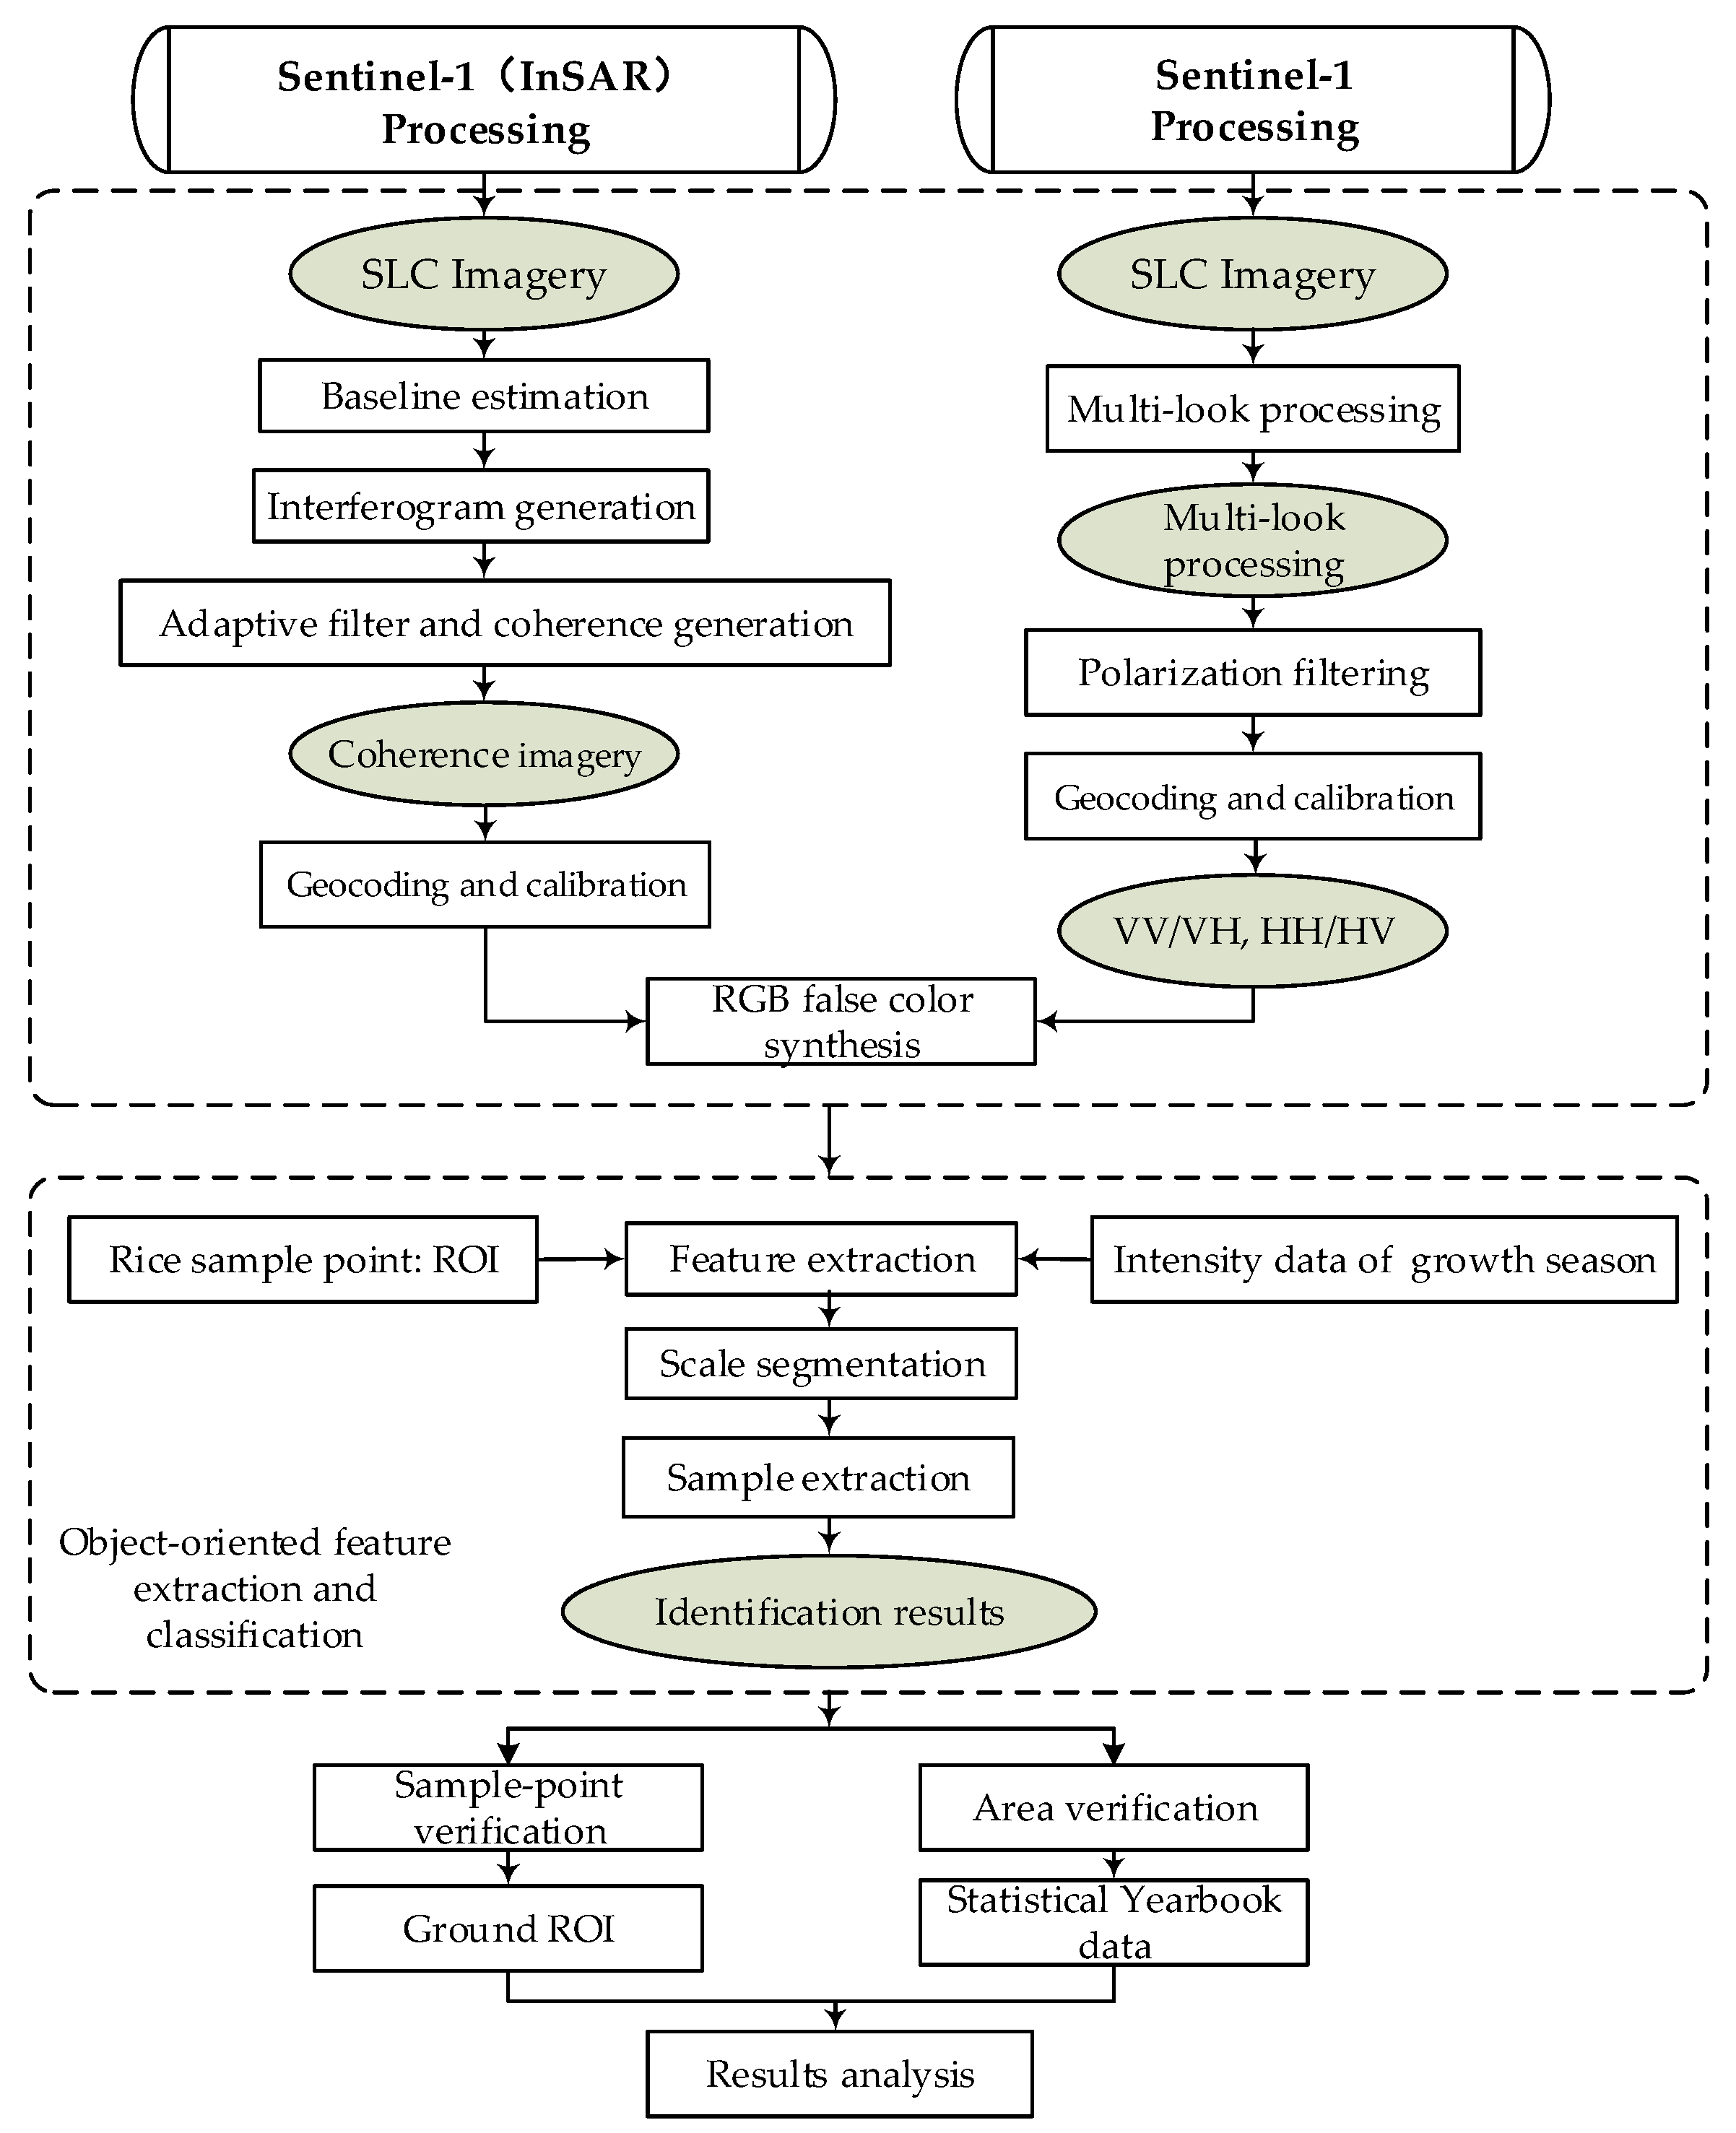
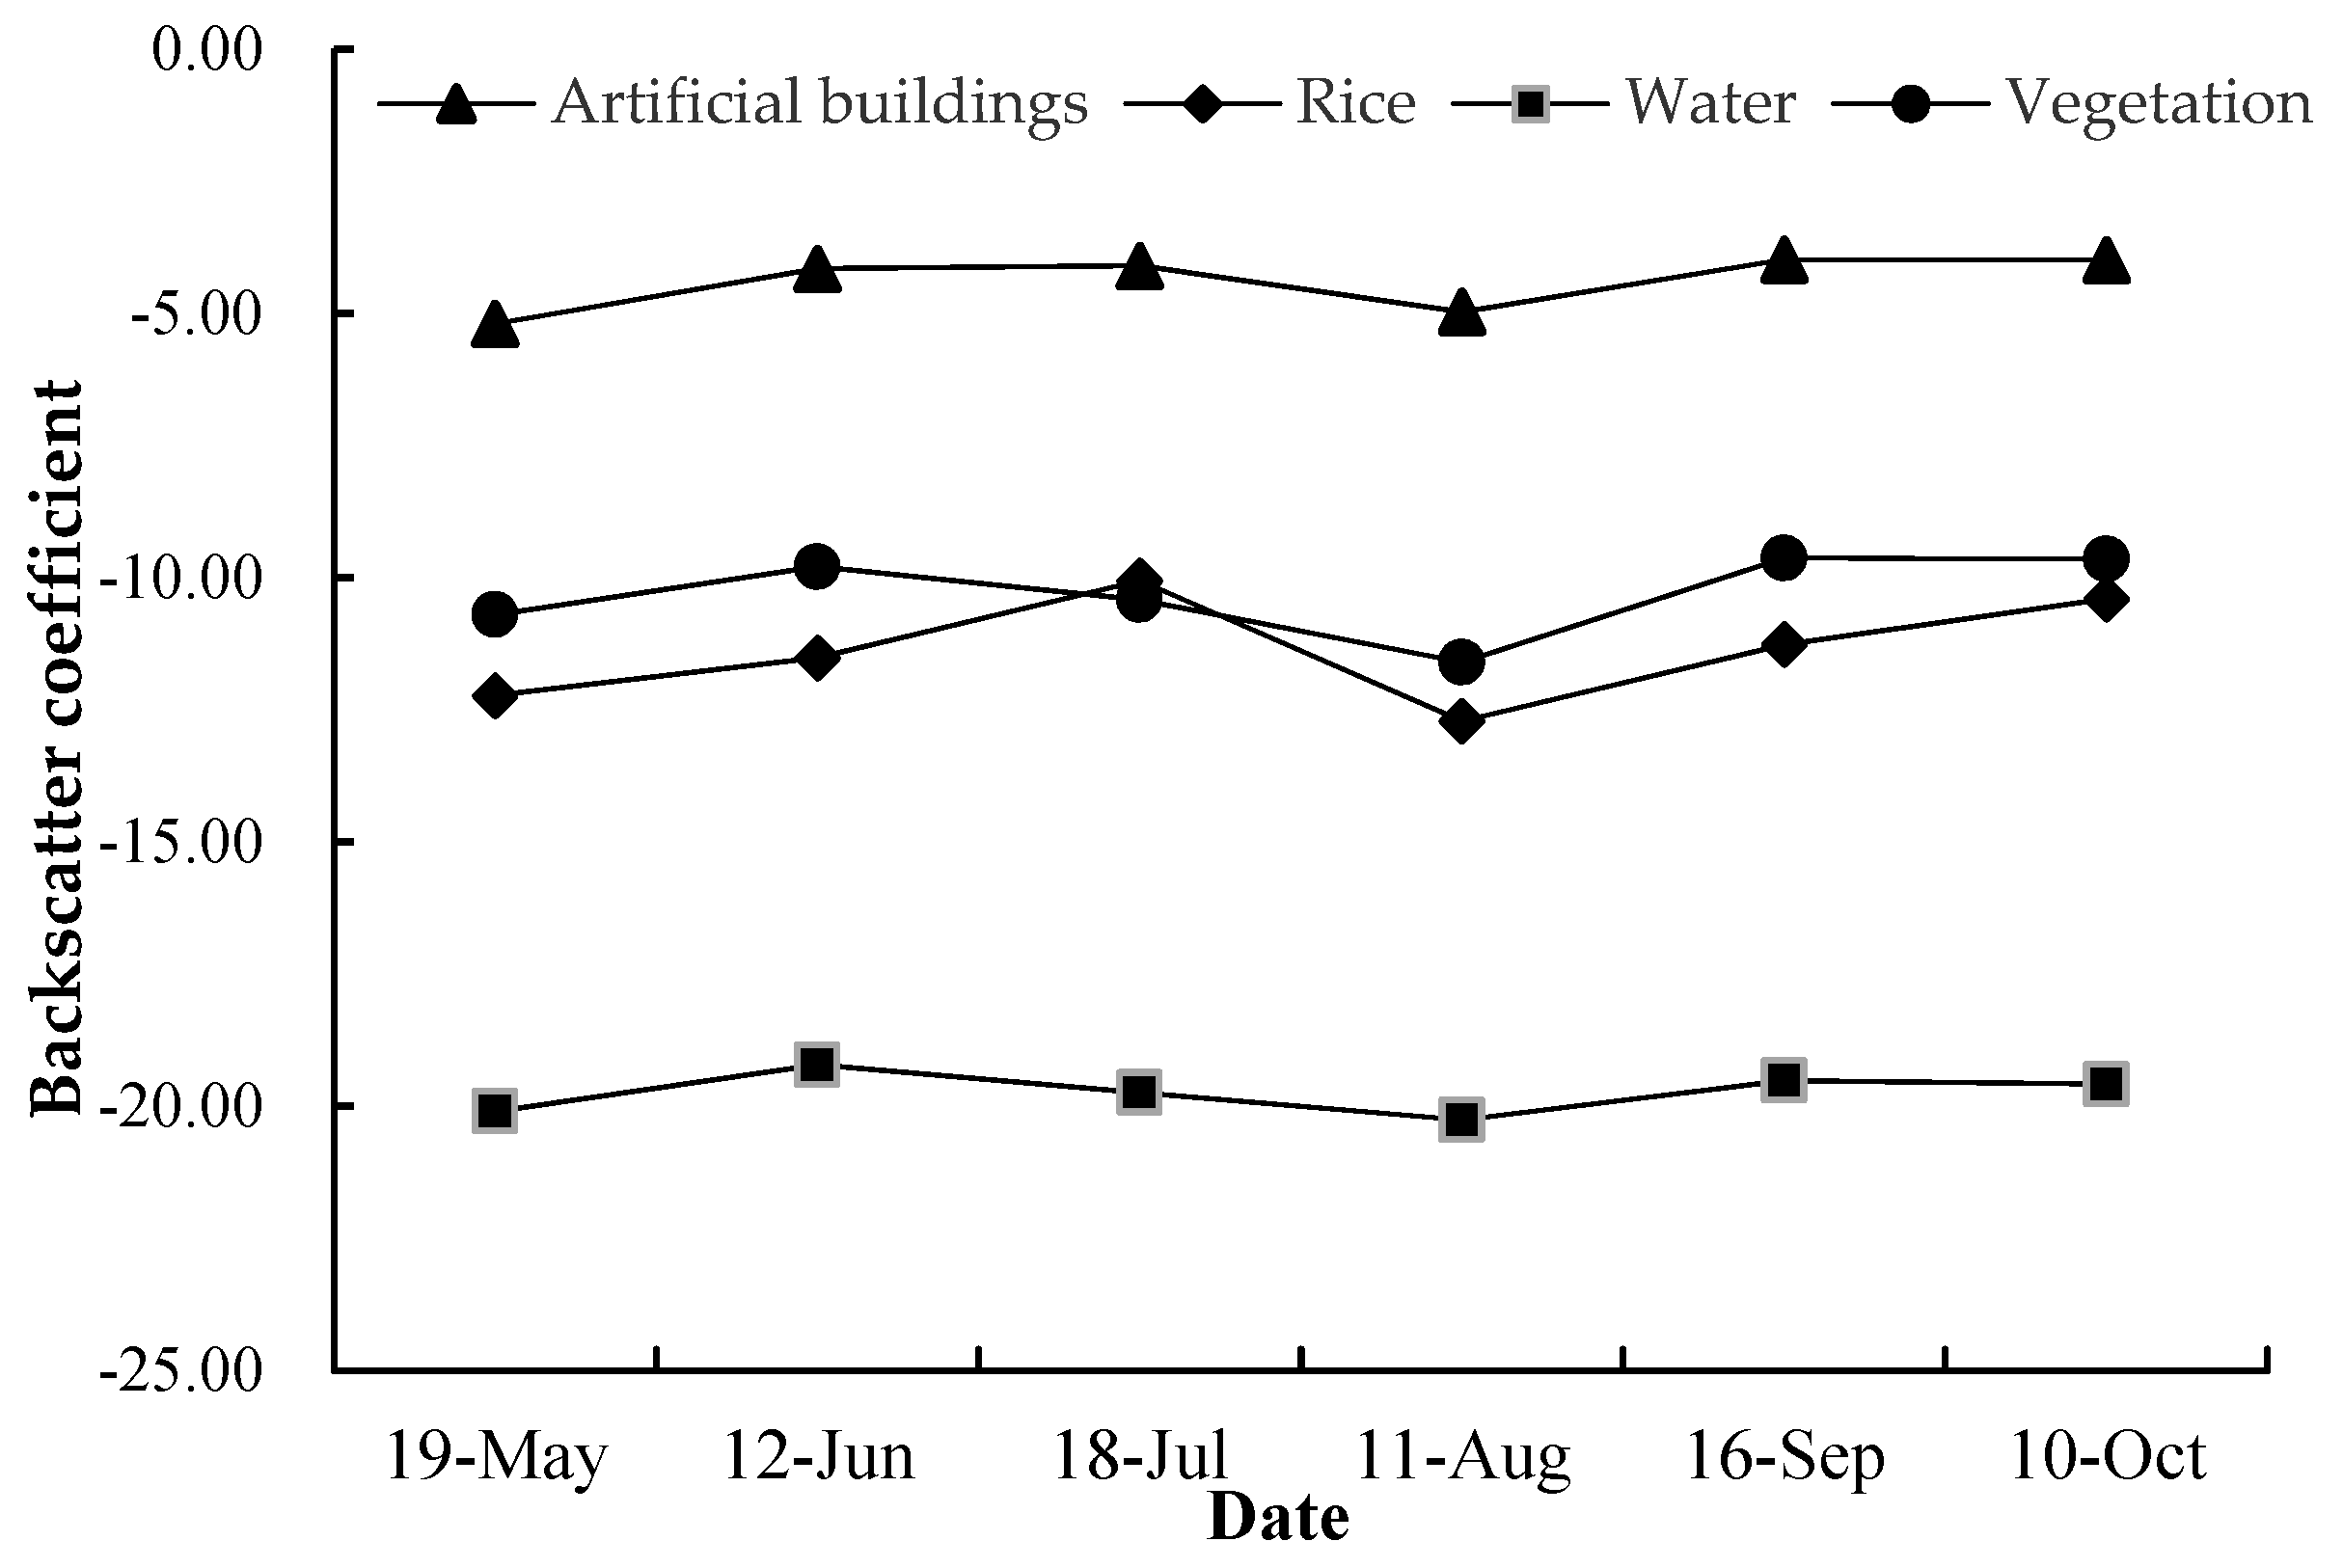
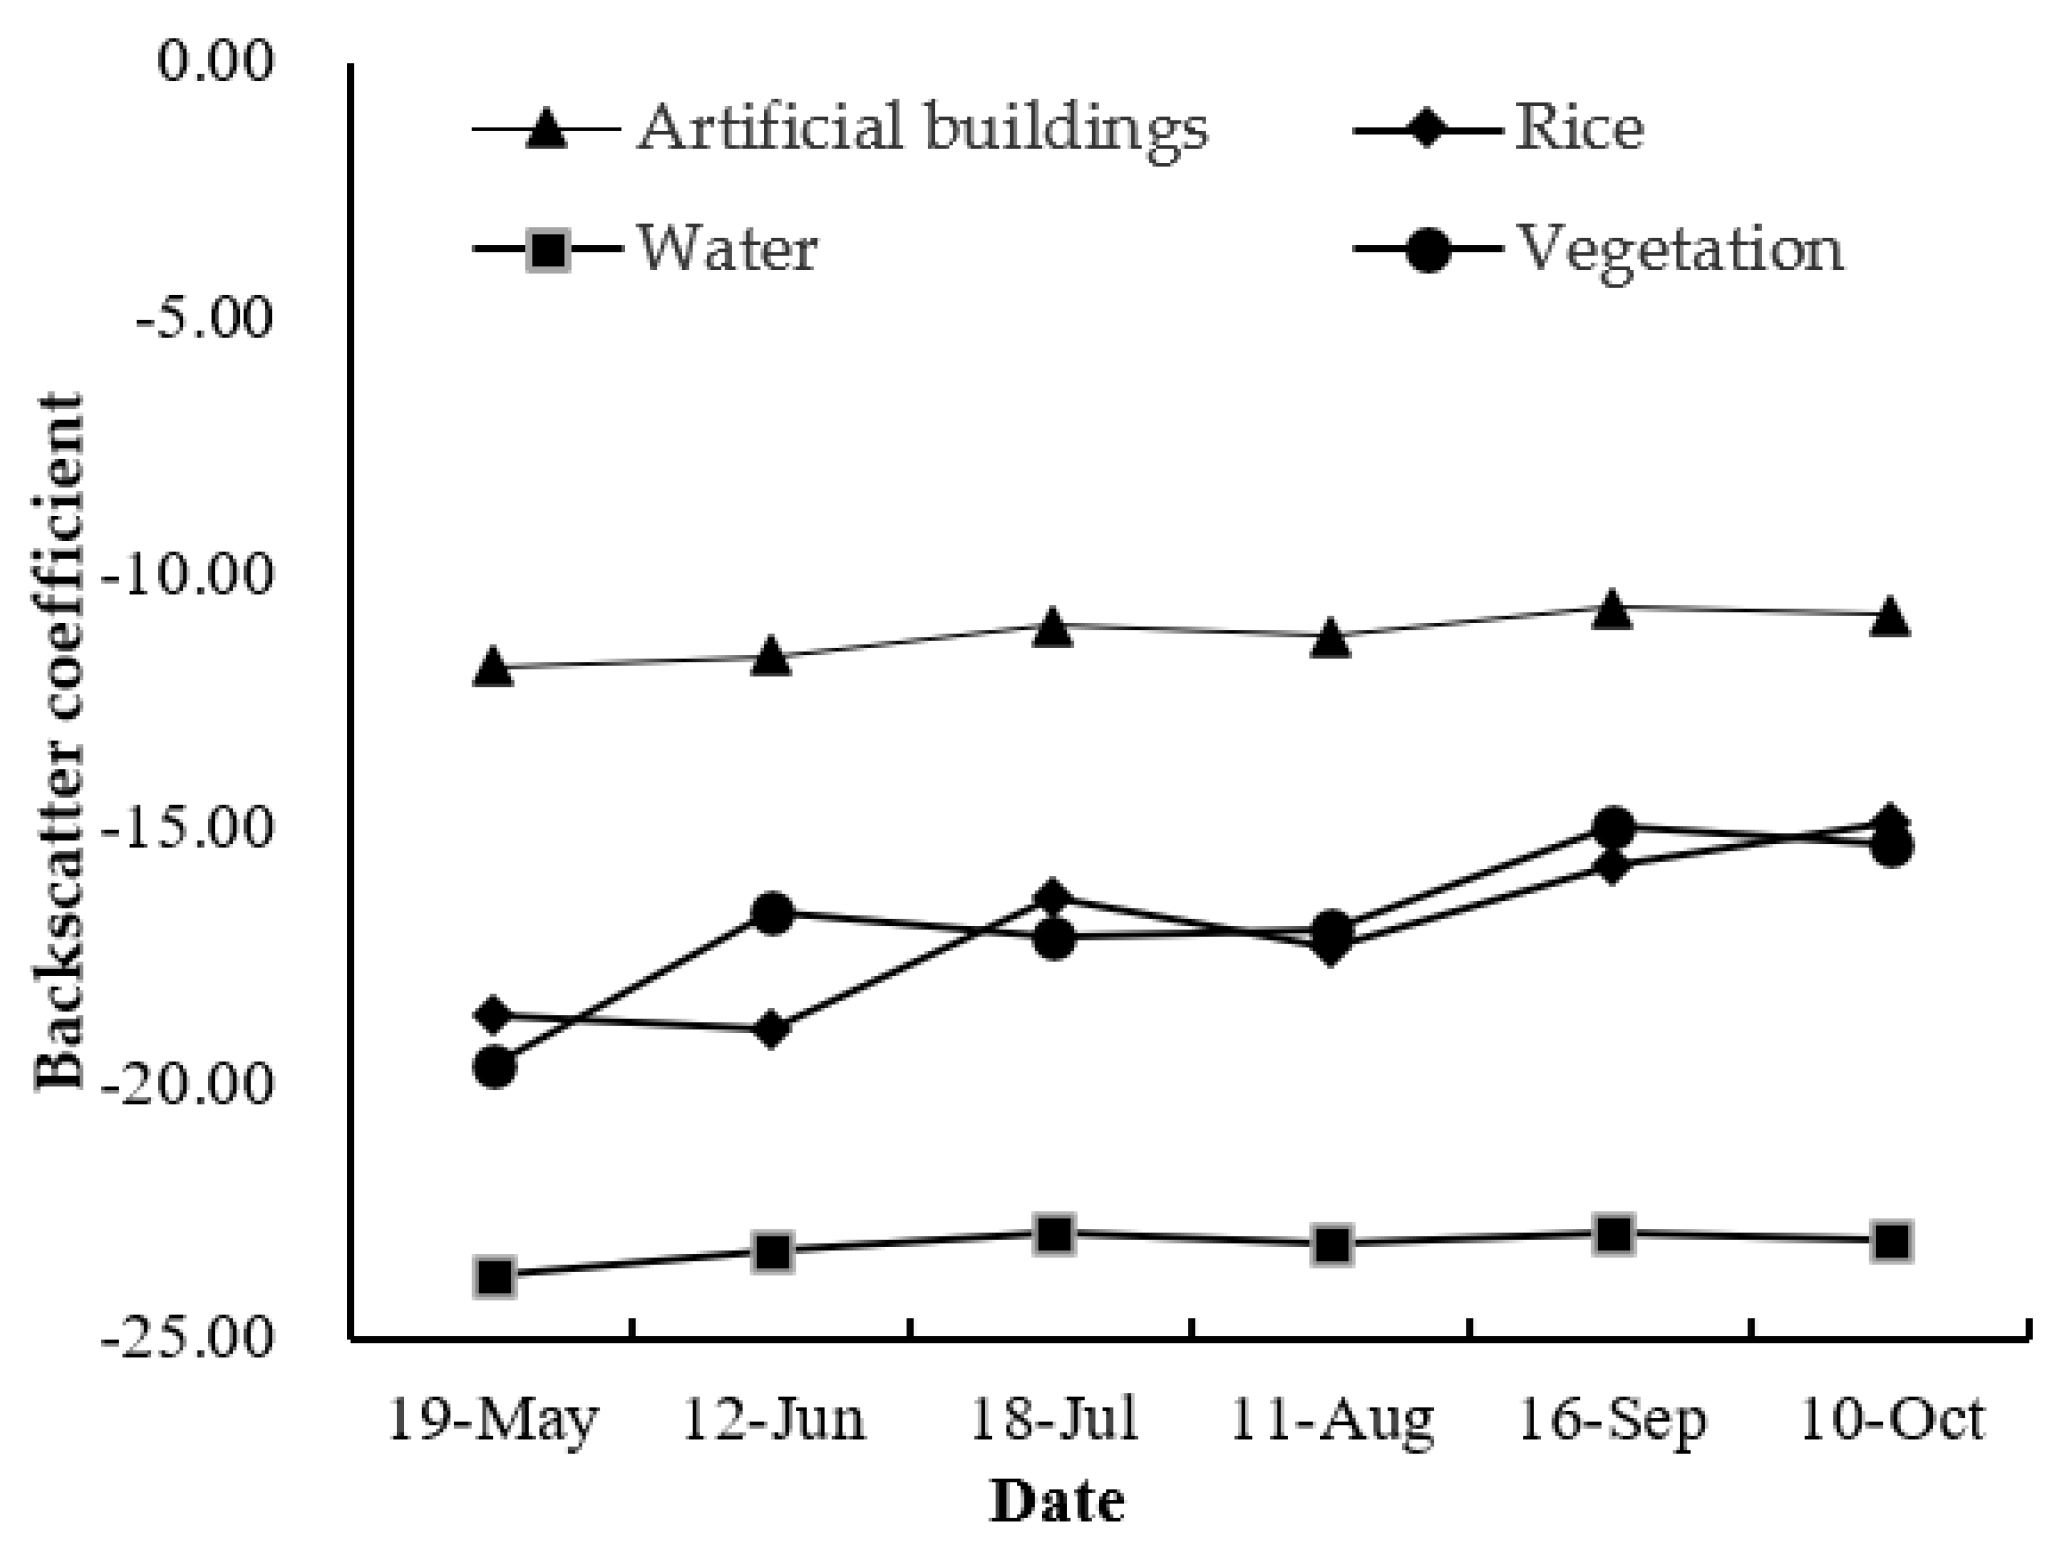
Based on the time-series SAR images of rice-growing season, after multi-looking processing, registration, polarization filtering, and geographic coding, the polarization post-scattering coefficient of typical ground such as rice, artificial building, water, and vegetation was extracted by sample point. After combining with the InSAR technology, the baseline estimation, interference generation, adaptive filtering, and coherence calculations, the VV and VH polarization coherence coefficients of the SAR images were obtained. The polarization coherence coefficient of typical samples such as rice, artificial building, water, and vegetation was extracted from sample data, and then the variation of the time-series coherence coefficient of typical ground objects was analyzed. Selecting the appropriate time-series SAR image polarization information and the coherence coefficient, the contribution of coherence coefficient to time-series SAR image was studied. How to select the appropriate polarization information and the coherence coefficient to extract the rice-planting area information was the key point and difficulty of this study.
Based on the time-series SAR images and rice improvement identification results of coherence-coefficient SAR images, Sentinel-2 optical image and grain statistical data were verified data with the aim to verify the reliability of rice identification results of SAR images.
The framework of the study was as follows (Figure 2).

2.3. Data and Preprocessing

2.3.1. Data Used in This Study

Six Sentinel-1A single-look complex (SLC) images covering the study area in 2017 were selected in this study. The parameters are shown in Table 2. The Sentinel-1 satellite [24,25], equipped with C-band SAR sensor, can be used for all-weather Earth observation. It has four imaging modes, namely, IW swath mode, stripmap mode, wave mode, and extra-wide swath mode, and it can be used to realize single and dual polarization. SLC products are SAR data with focus. Sufficient signal bandwidth is adopted to realize the single-look processing in each dimension in these products, and the complex is used to save the phase information. The SLC in IW mode includes three images corresponding to three bands in single polarization. The interferometric wide (IW) swath mode is the main acquisition mode over land and satisfies the majority of service requirements. It acquires data with a 250 km swath at 5 m by 20 m spatial resolution (single look). IW mode captures three sub-swaths using Terrain Observation with Progressive Scans SAR (TOPSAR). TOPSAR mode replaces the conventional ScanSAR mode, achieving the same coverage and resolution as ScanSAR but with a nearly uniform signal-to-noise ratio and distributed target ambiguity ratio. IW SLC products contain one image per sub-swath and one per polarization channel, for a total of three (single-polarization) or six (dual-polarization) images in an IW product.

2.3.2. SAR Data Preprocessing

Sentinel-1 data preprocessing [
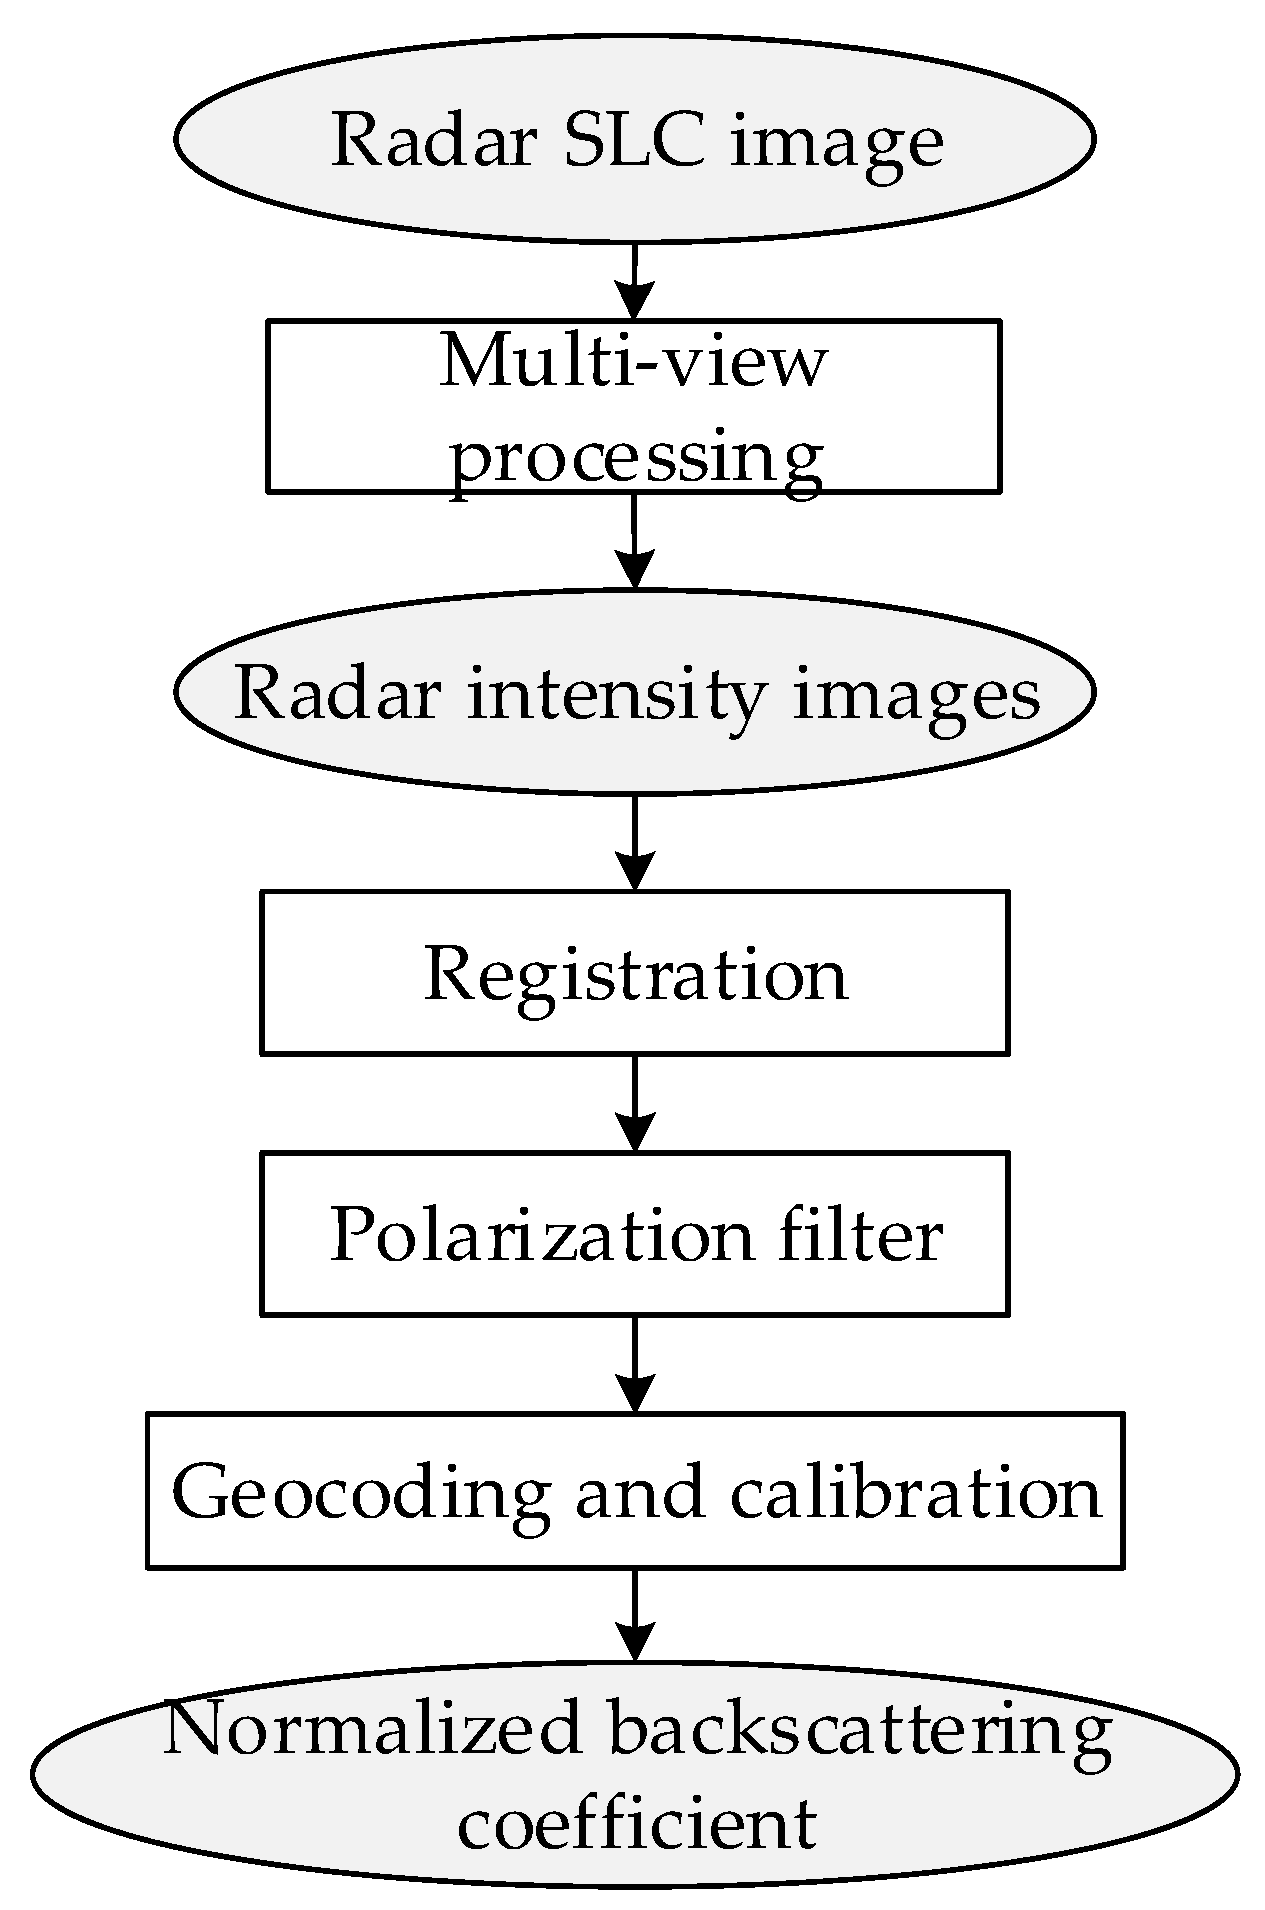
26] involves track correction, thermal denoising, radiometric calibration, multi-look processing, filtering, topographic correction, and backscatter normalization. The ENVI-based SARscape module is used in Sentinel-1A data preprocessing. This module can comprehensively preprocess and analyze polarimetric radar data in various bands. SARscape currently supports the import, geometric correction, multi-look processing, registration, denoising, geocoding, and polarization decomposition of radar data and a series of basic processing functions. Because the study area is mainly in the plain with relatively flat terrain and mountainous area less than 3% of the total area, the slope effect cannot be considered in the processing. Preprocessing is made for VV polarization and VH polarization at the same time. The preprocessing process mainly includes the import, multi-look processing, registration, polarization, filtering, and geocoding of the data (Figure 3).
Taking VV and VH data on May 19 as the benchmark image, five images from June to October were registered. Time-series filtering [
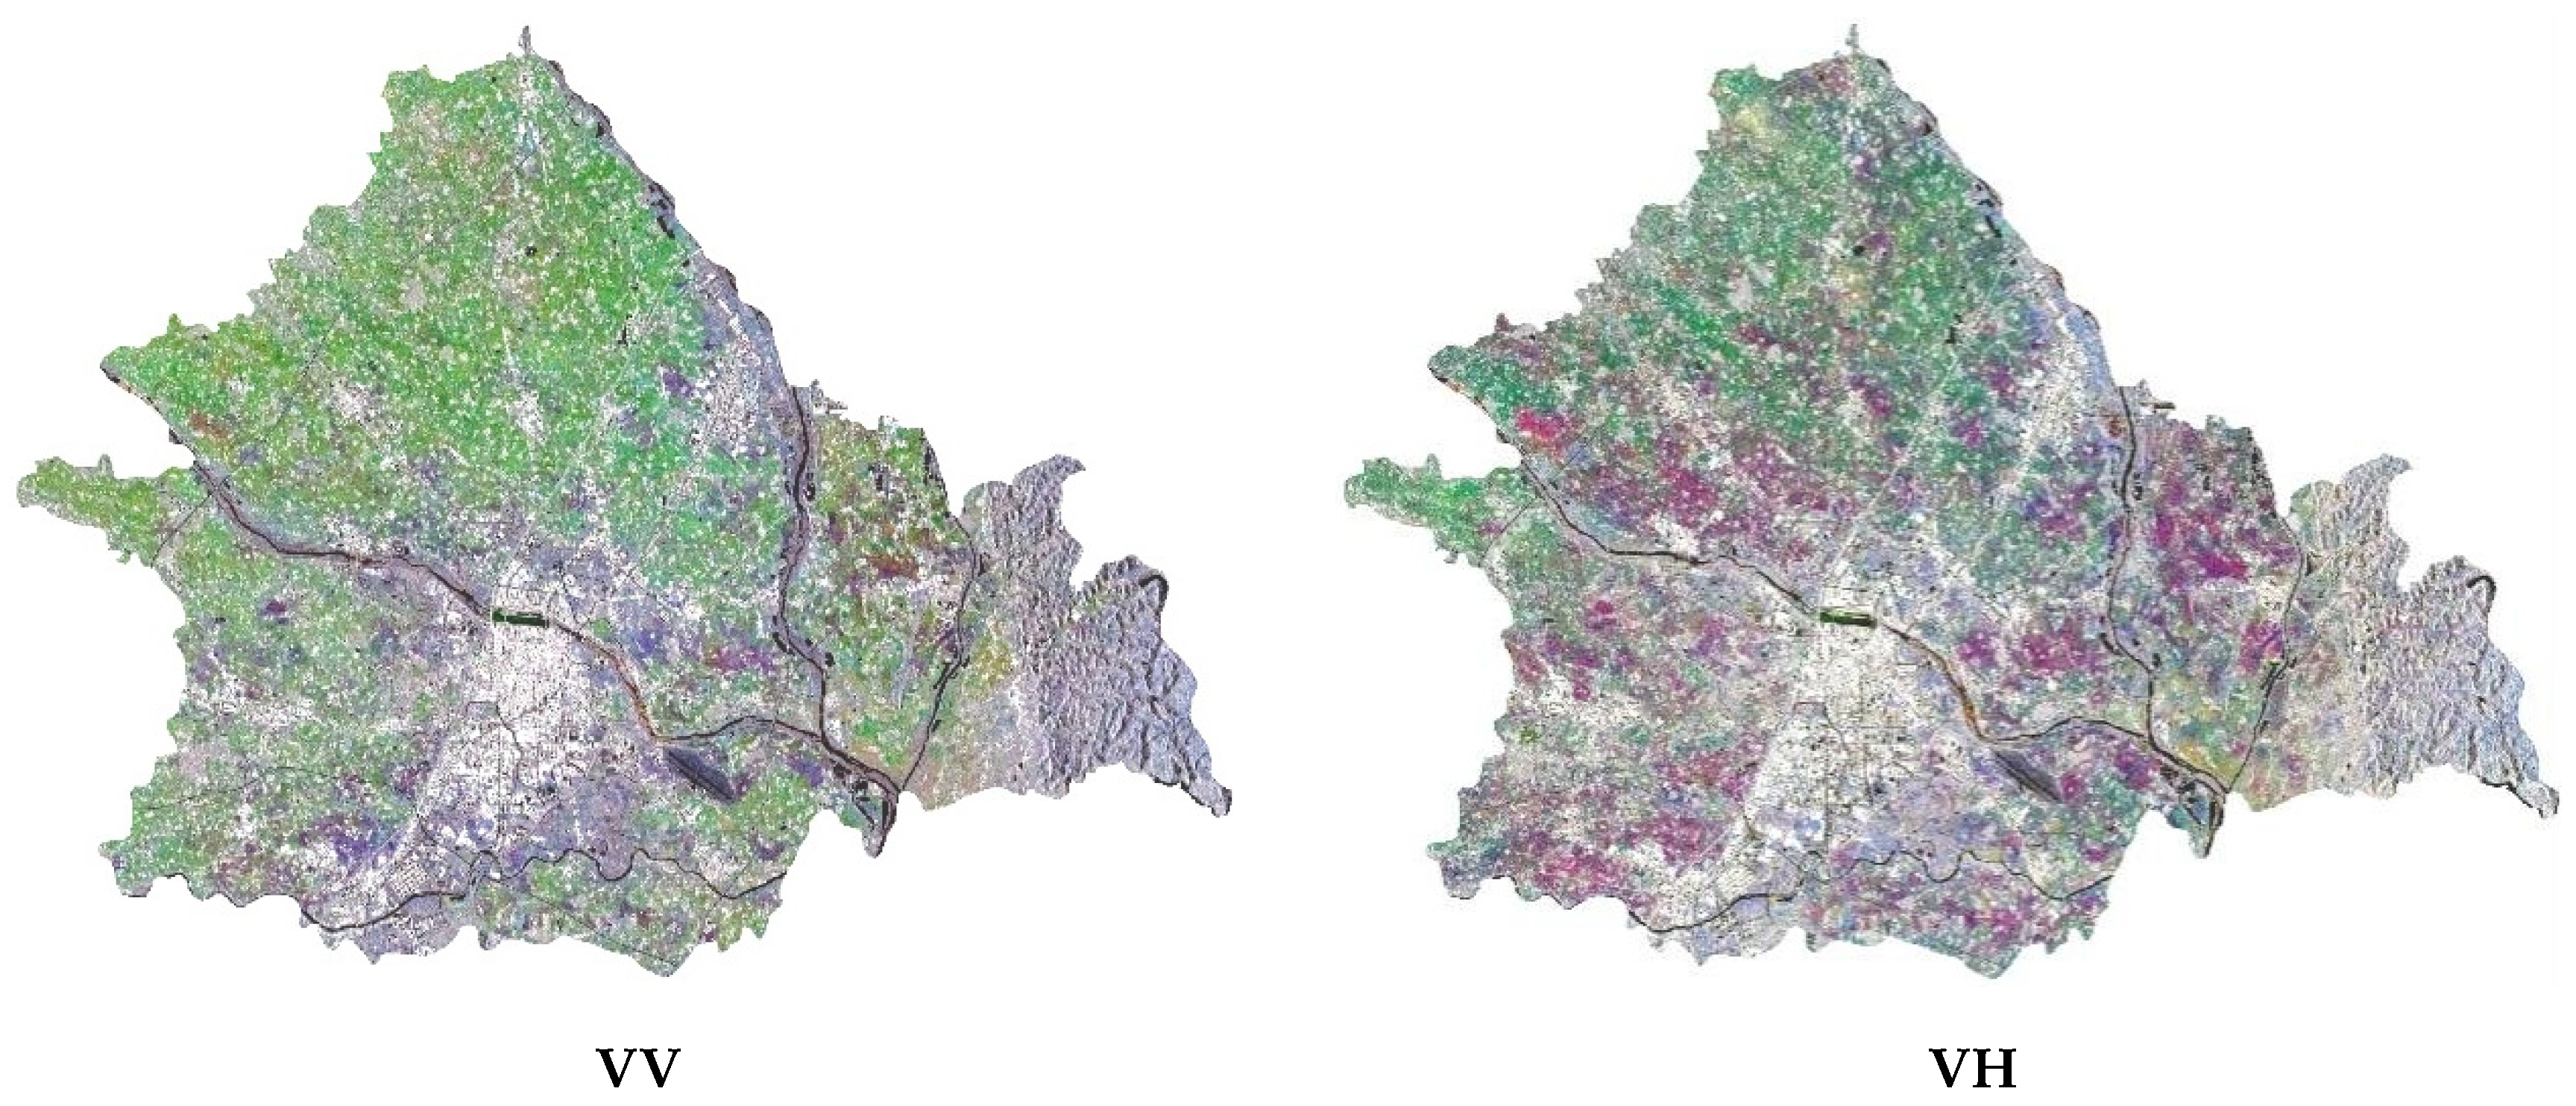
27] was conducted on the registered images to remove the speckle noise of the radar image. This method can be applied to single-band and multi-time-phase radar images. Multi-time-phase radar filtering includes De Grand and anisotropic nonlinear diffusion. In this study, De Grand was adopted to process multi-time-phase SAR in the study area. GAMMA-MAP filtering was used in this study. The window was set to 5 × 5. Three RGB channels were used to display VV polarization and VH polarization in the study area after preprocessing.
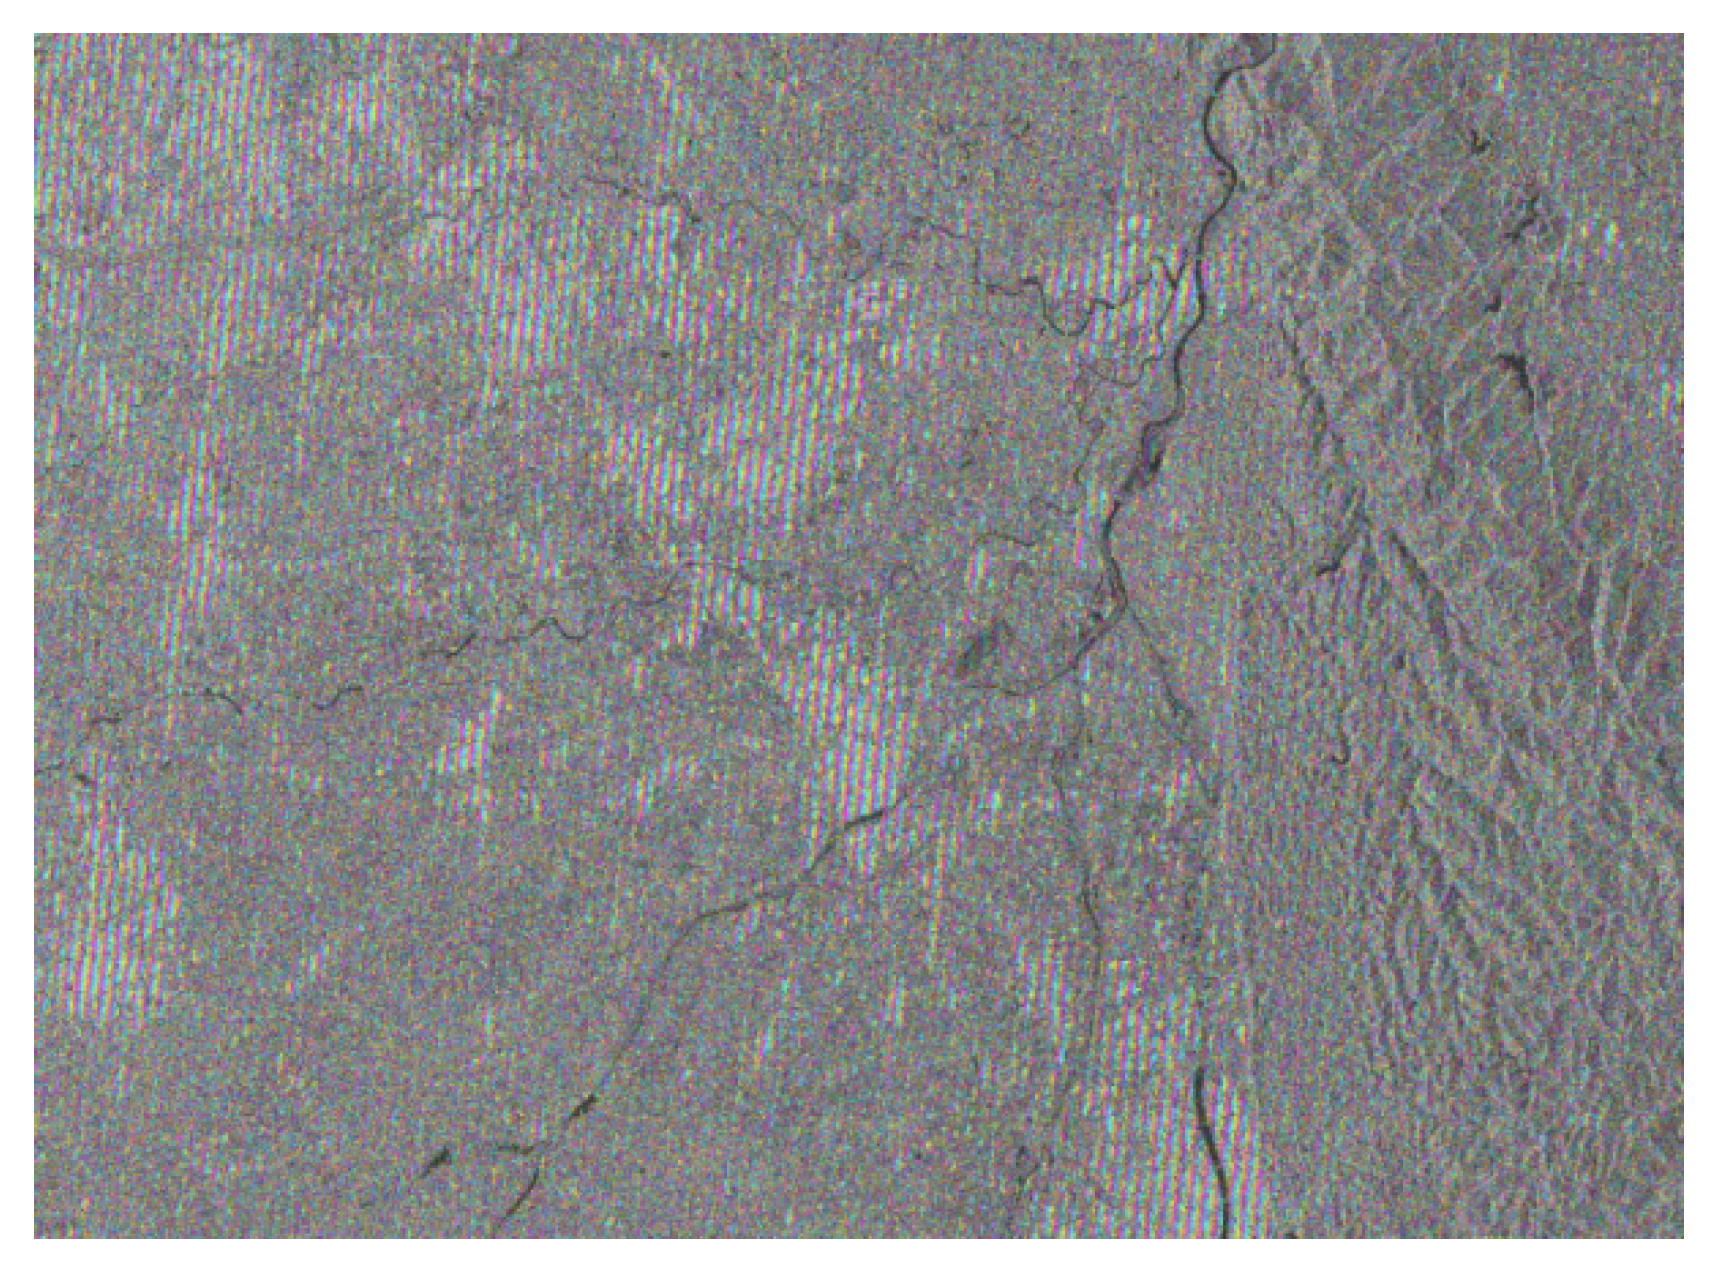
On the basis of the image after geocoding, RGB channels were used to display the composite graph of VV and VH polarization (R (05/19), G (06/12), B (07/18)) in the study area. The results are shown in Figure 4.

2.4. Extraction and Analysis of Rice Coherence in the Sentinel-1A Image

The purpose of SAR image interference processing is to obtain the index representing the similarity between two images or among many SAR complex images, called coherence [28]. The similarity of target scatterers is reflected by radar echo. The similarity information and intensity information of ground objects provide the information related to target scatterers. The study on the surface activities in a specific region should be realized through decoherence in the interference analysis. The coherence coefficient is an important index of coherence. It is introduced to measure the similarity of measured ground objects. On the basis of many SAR images at different times in the study area, quantitative analysis was adopted to monitor the change of rice-planting area in different growth periods so as to extract the rice-planting area.
The rice in the study area is cultivated from March to April, including seeding and seedling raising. The rice is transplanted in May, matures in August, and is harvested in September. During the whole period, the rice field exhibits obvious changes. Therefore, this study was based on InSAR technology, and the changes in the rice field were monitored by using Sentinel-1A data in the process of transplanting, heading, ripening, and harvesting of rice so as to provide a reference for the identification of rice-planting areas.
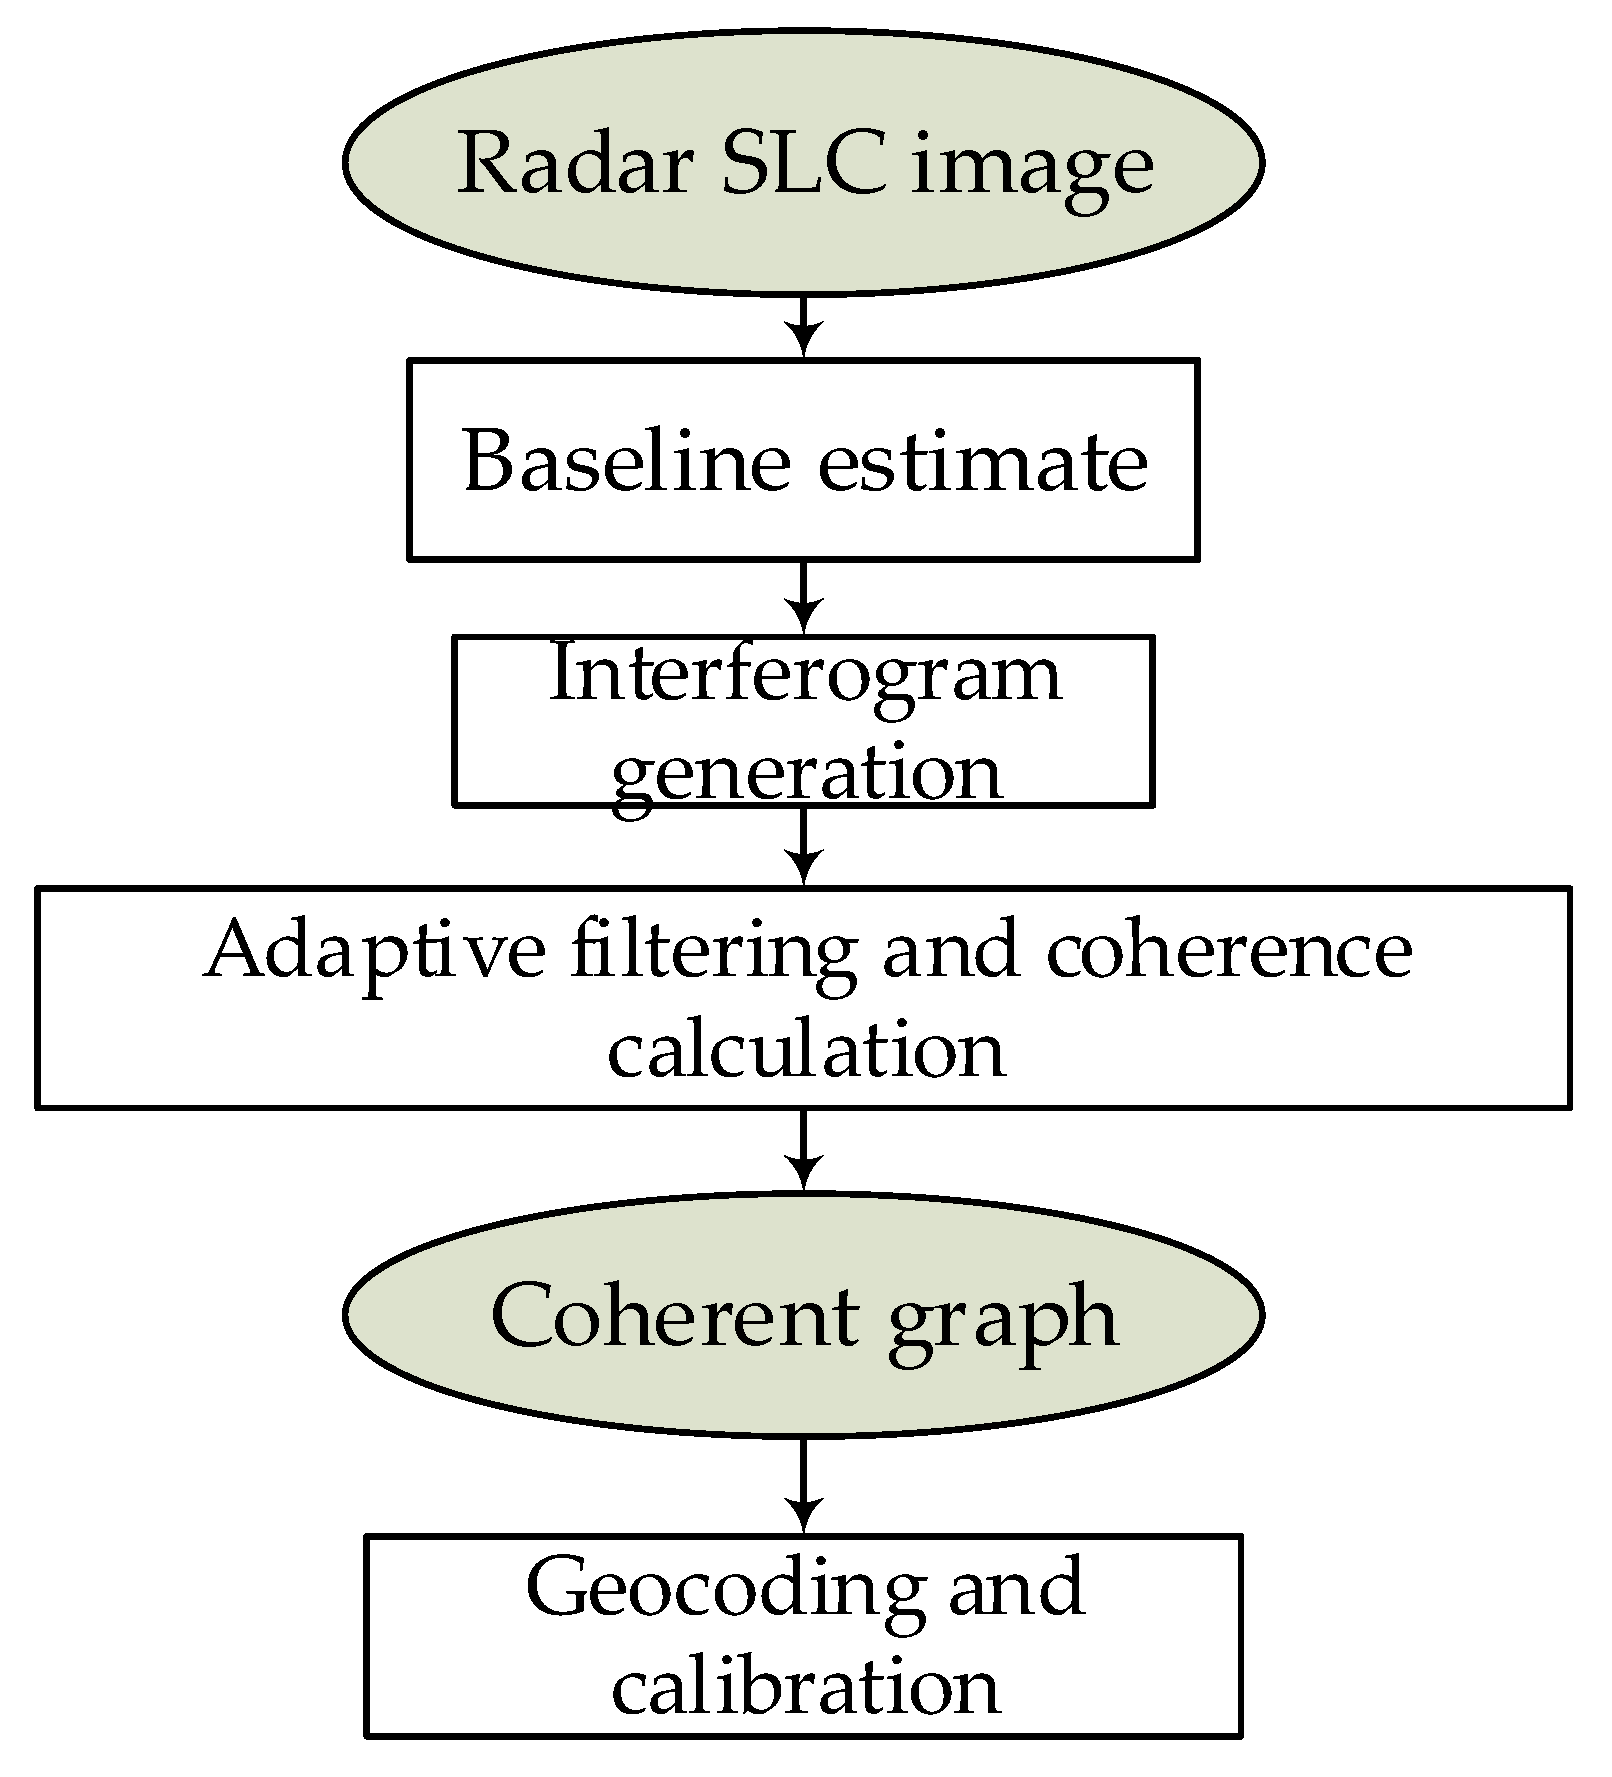
The coherence of VV and VH polarization in Sentinel-1 time series was calculated on the basis of the SARscape module, and then the coherence coefficient is obtained. The data processing for calculating the coherence (Figure 5) included baseline estimate, interferogram generation, self-adaptive filtering, coherence calculation, registration, geocoding and calibration, and cutting the study areas.
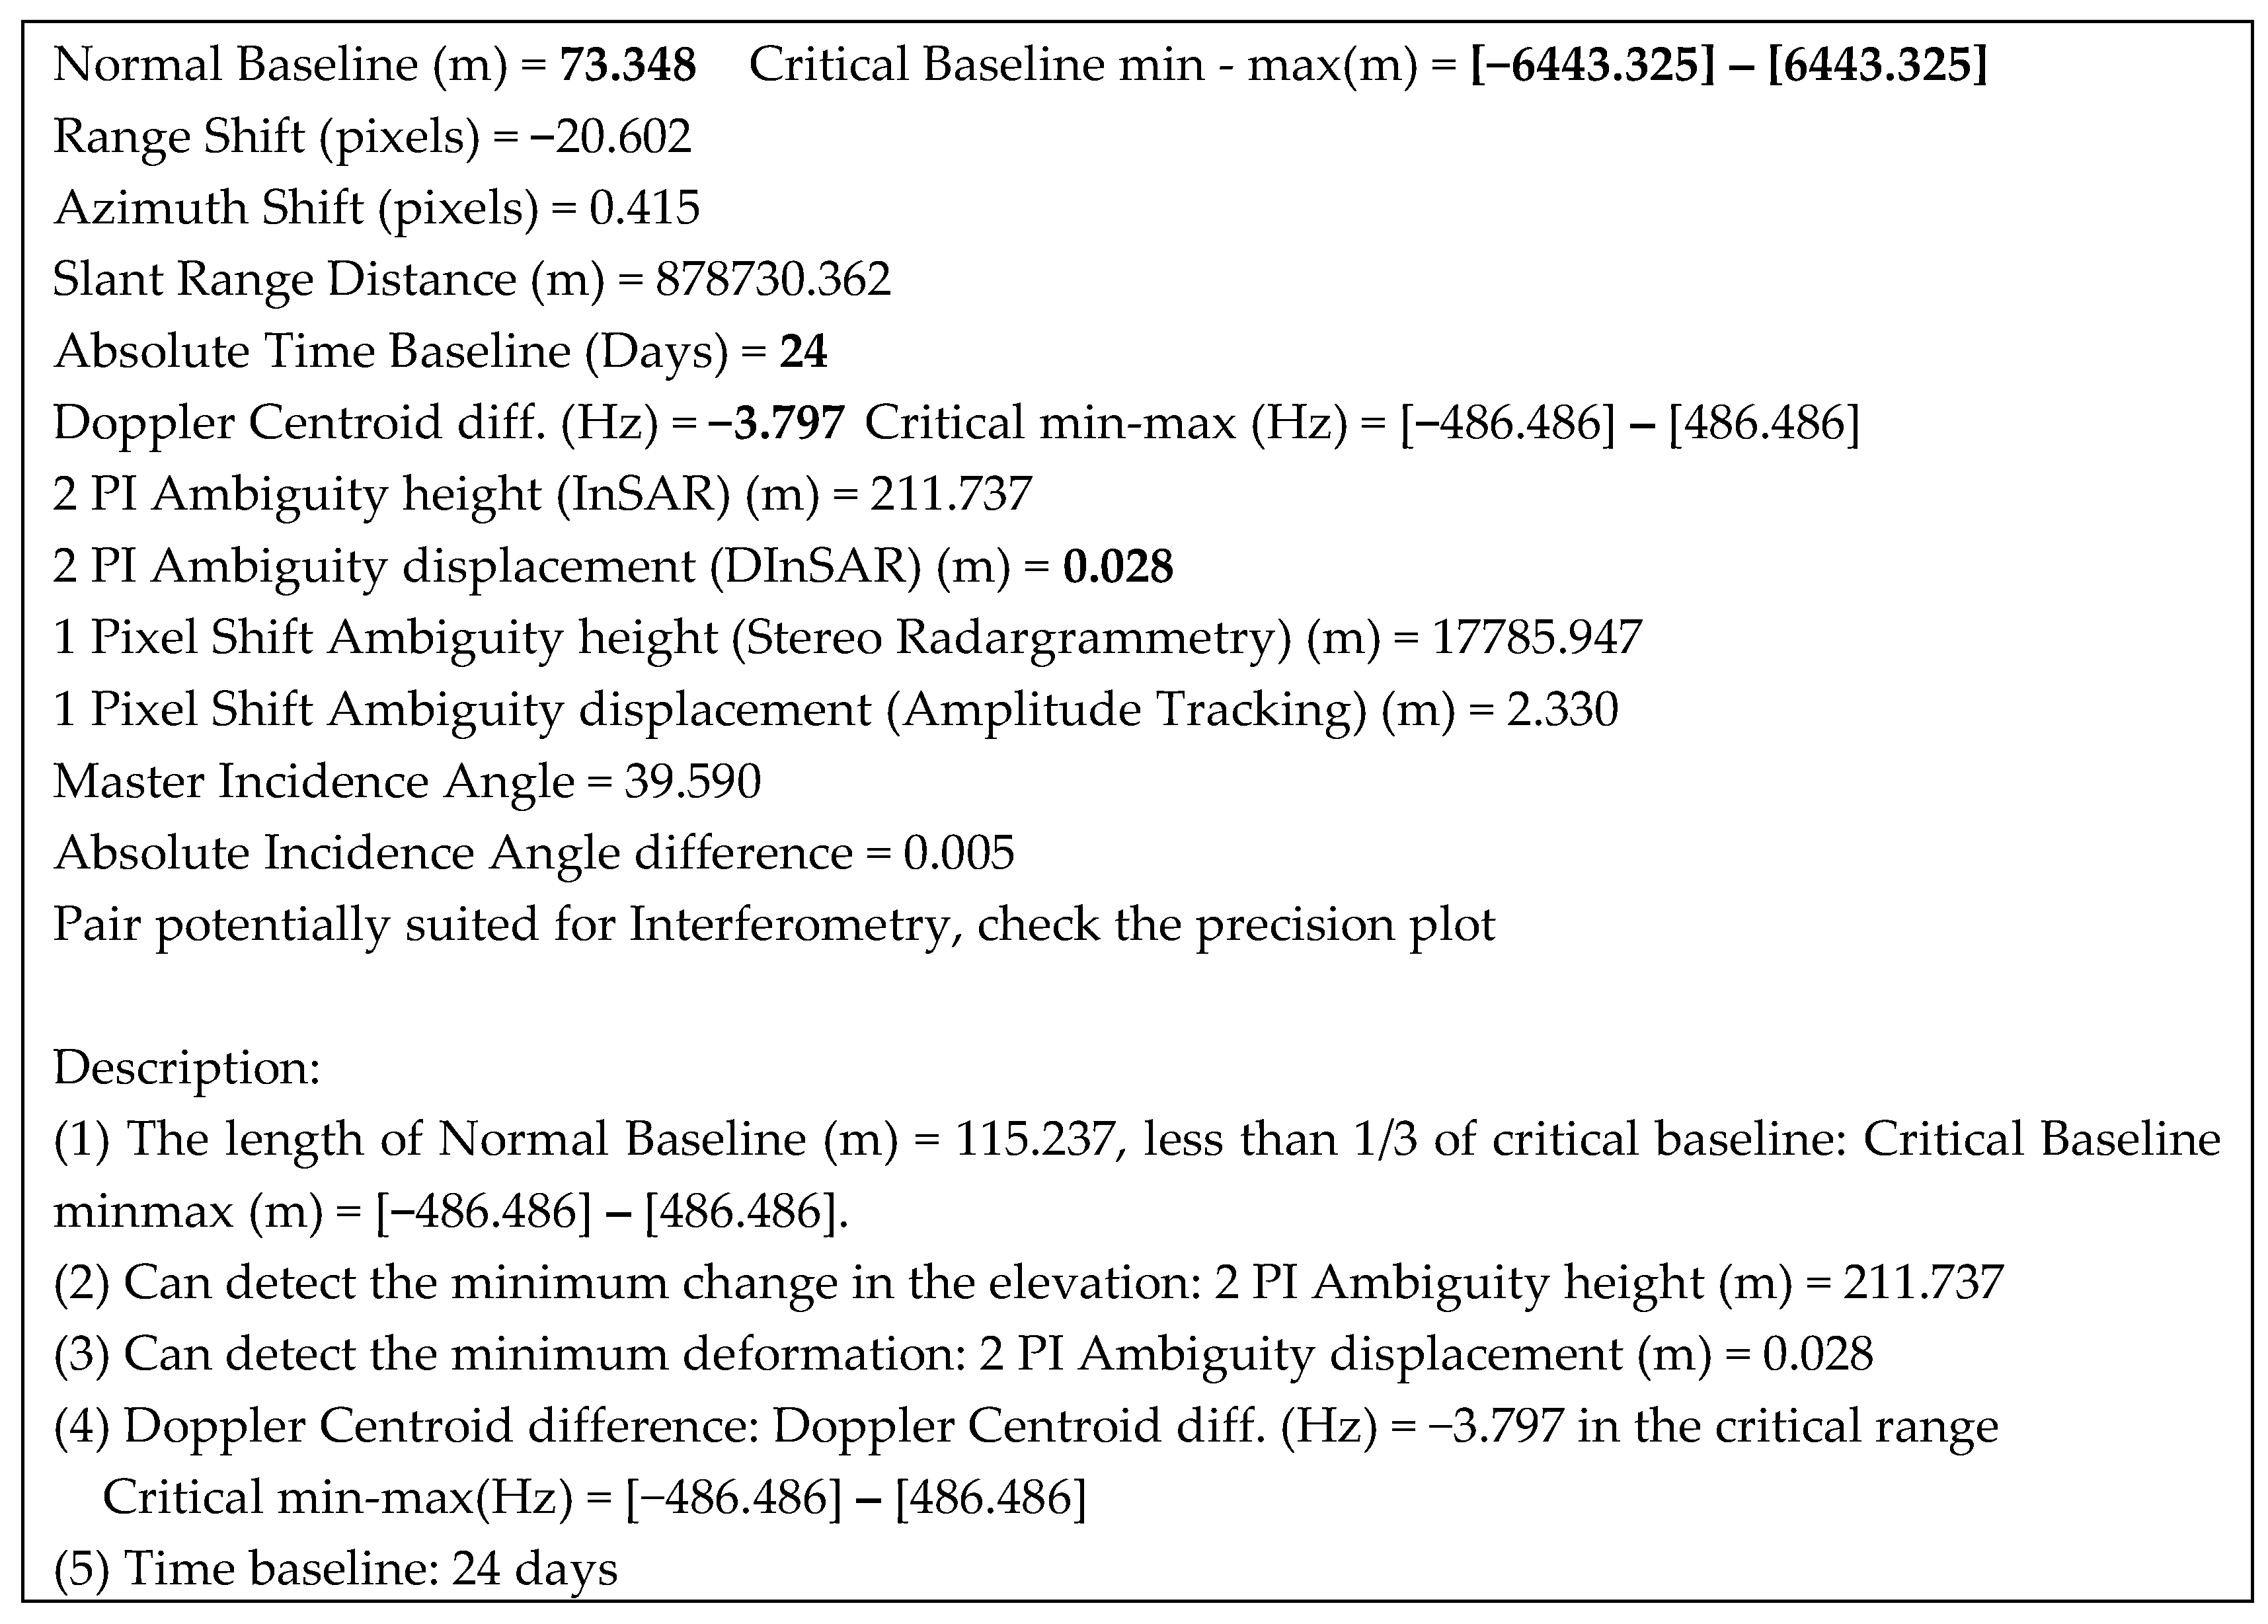
The baseline is an important part in coherence generation. The baseline and slope distance of two SAR images form a triangle so as to produce the coherence. The baseline estimate is used to evaluate the quality of interference image pair. Thus, interference can happen. The SAR images generally used for change monitoring must meet the following conditions: the same sensor, the same ascending track (descending track), and incident angle. Taking the SAR image in rice field cultivation monitoring as an example, the sensor, ascending track, and incident angle meet the use conditions [29]. When at least two antennas are overlapped in obtaining the ground reflection, interference can be produced. The baseline-estimated relevant parameters of this study are shown in 
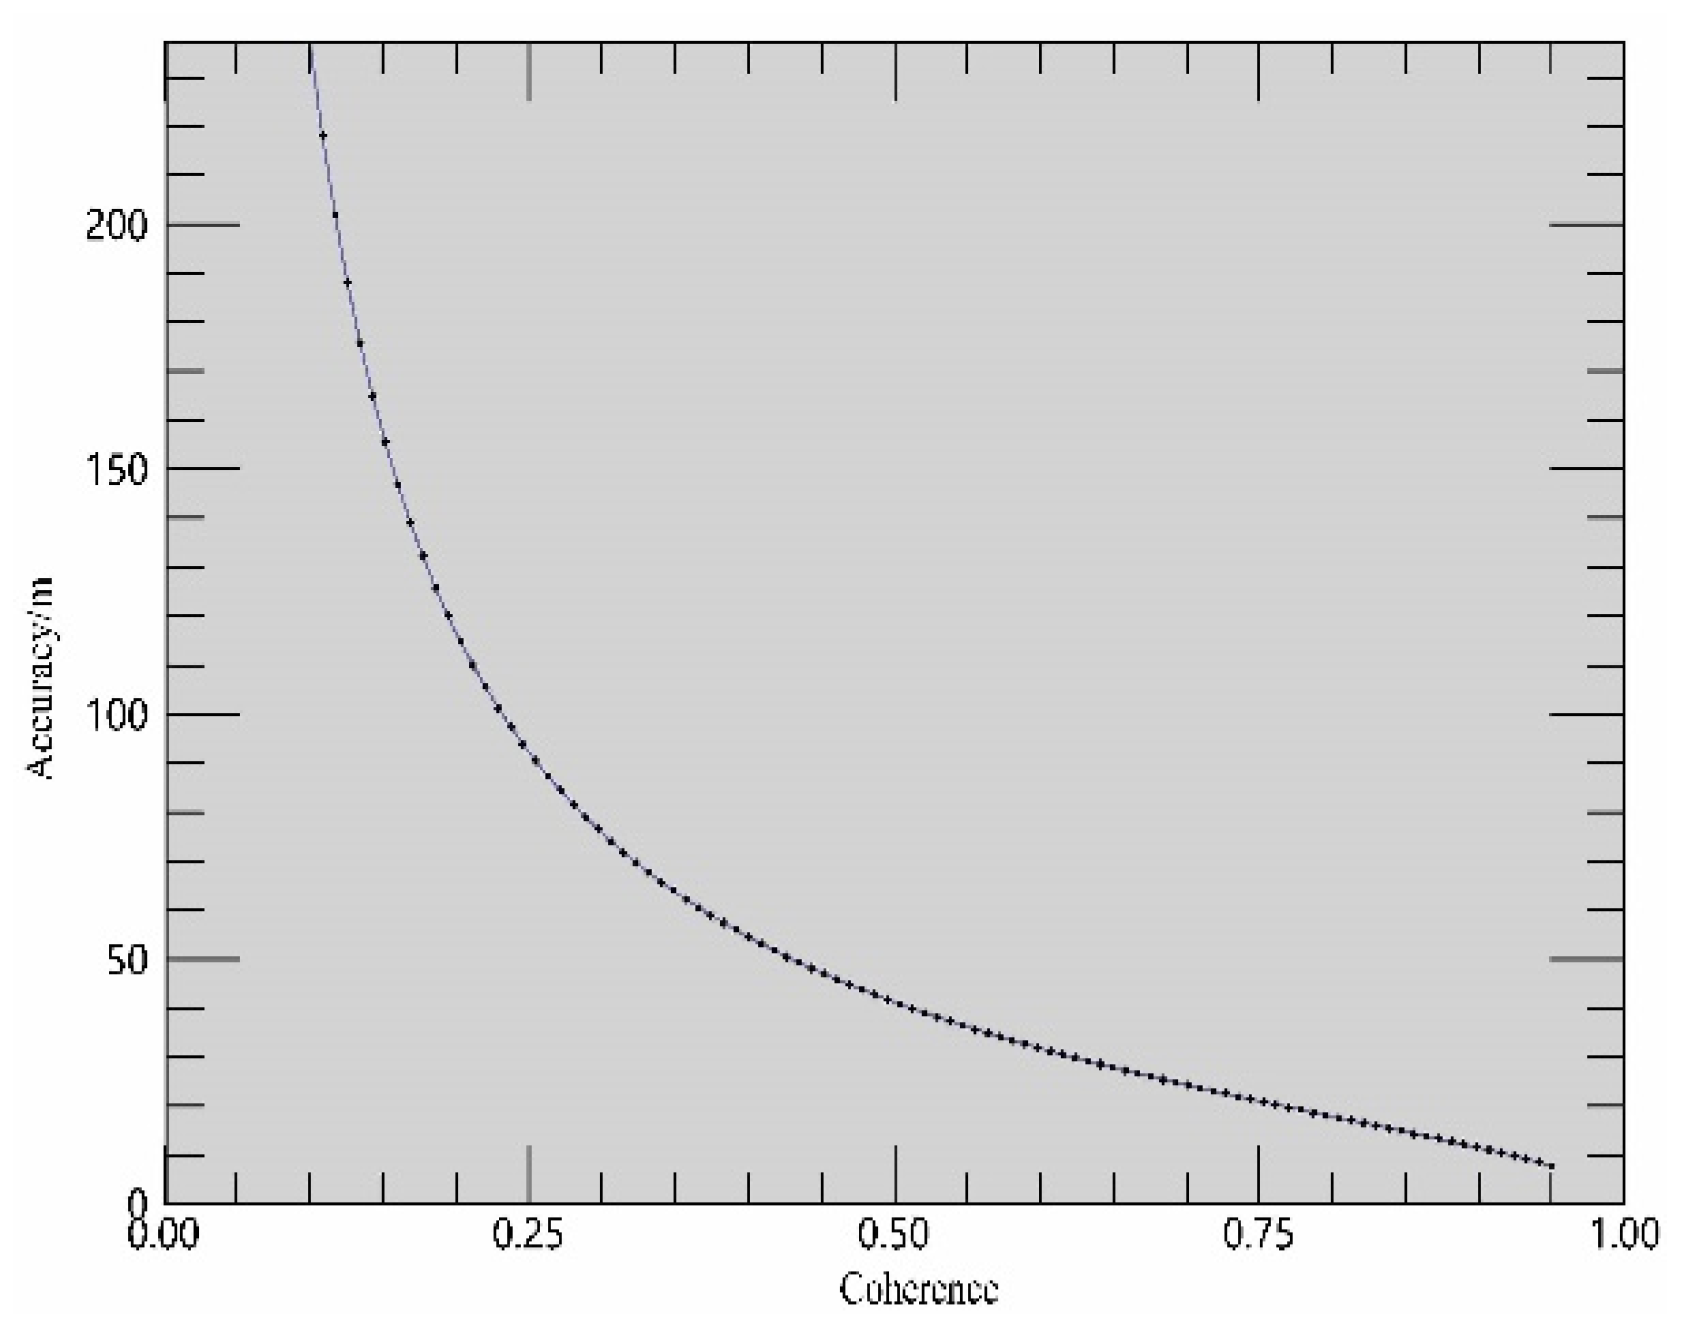
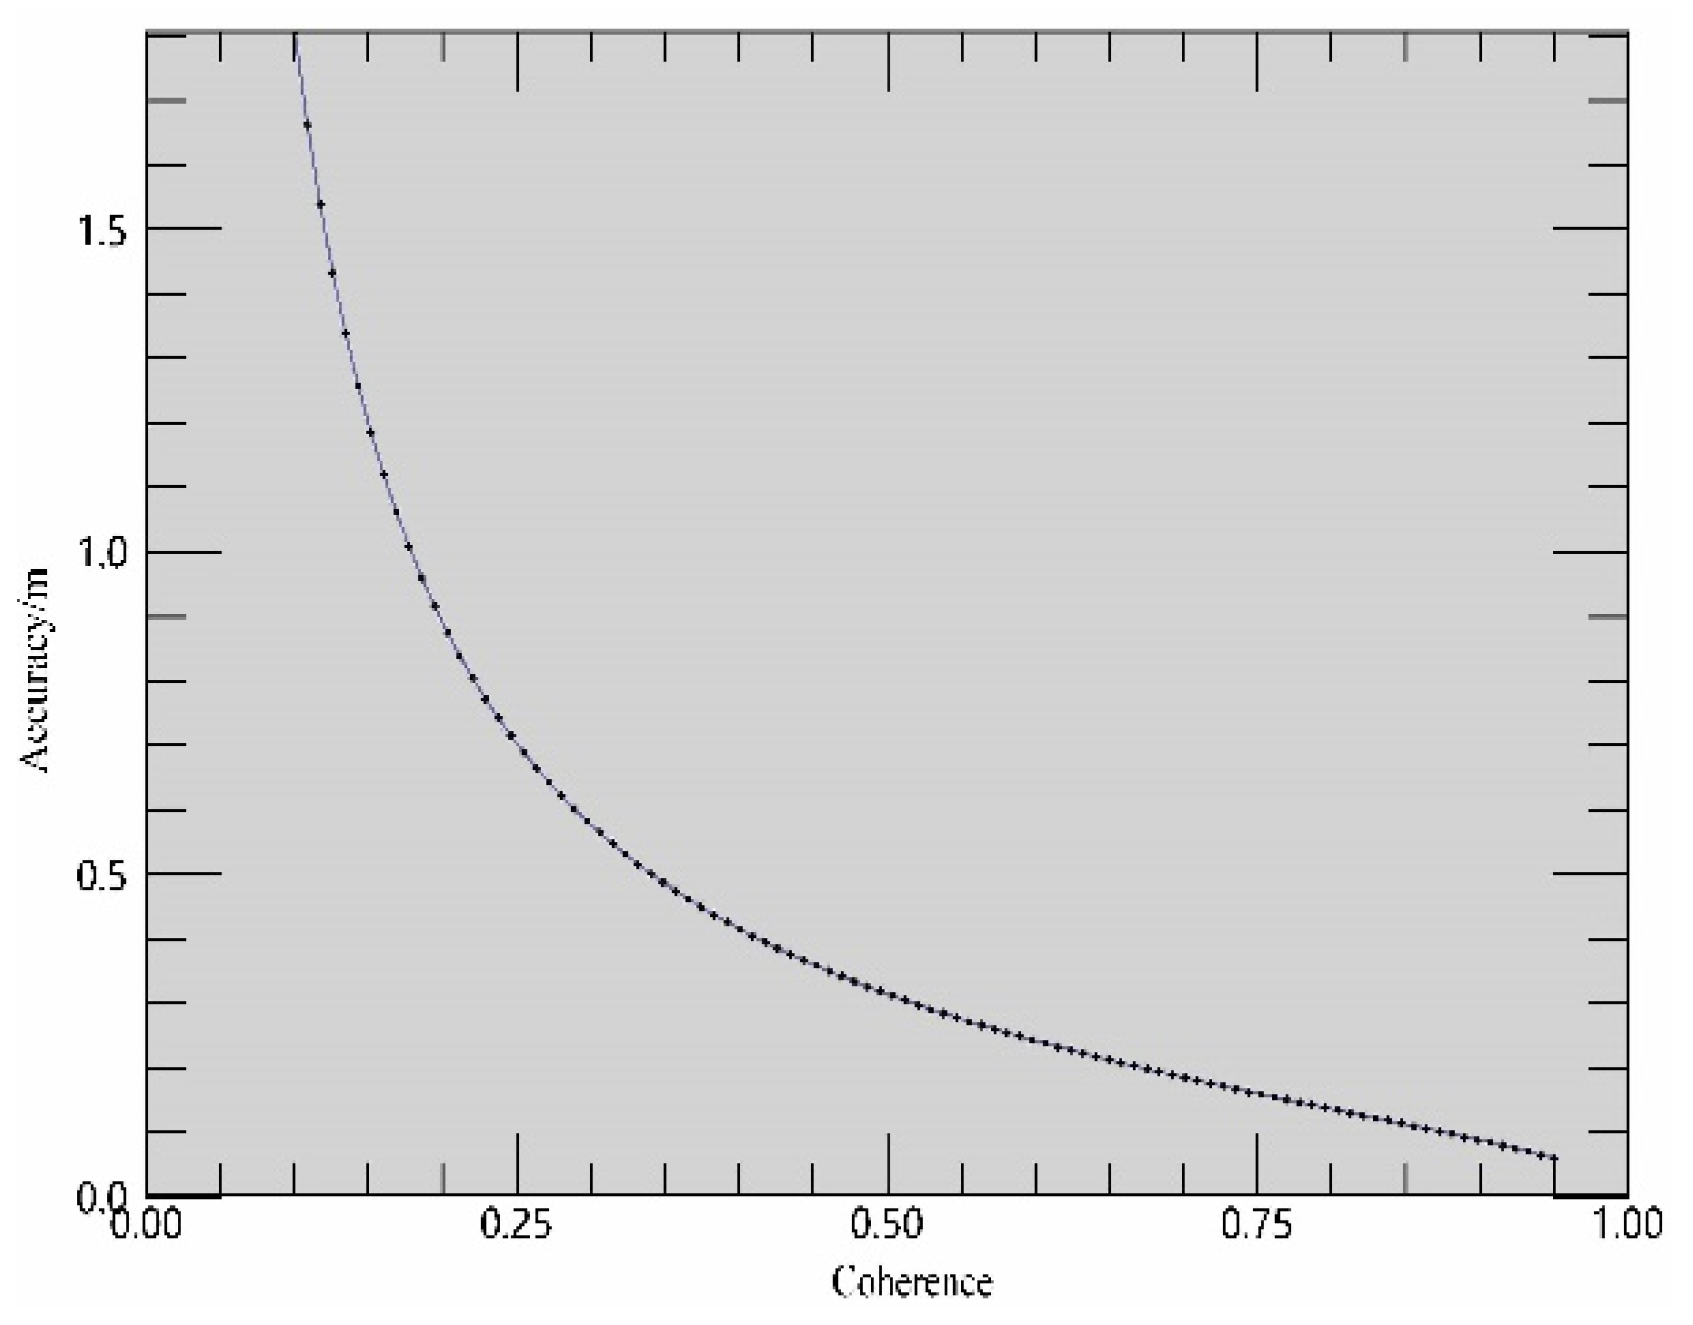
Figure 6. The accuracy of elevation and deformation increases with the increase of coherence. The baseline is 73.348 m long, which is far less than the critical baseline (486.486 m). The minimum change in the elevation that can be detected is 211.737 m, and the minimum deformation is 0.028 m. The baseline estimate result (Figure 7 and Figure 8) shows that the quality of interference image pair used in the research satisfies the requirement of InSAR technology [30].
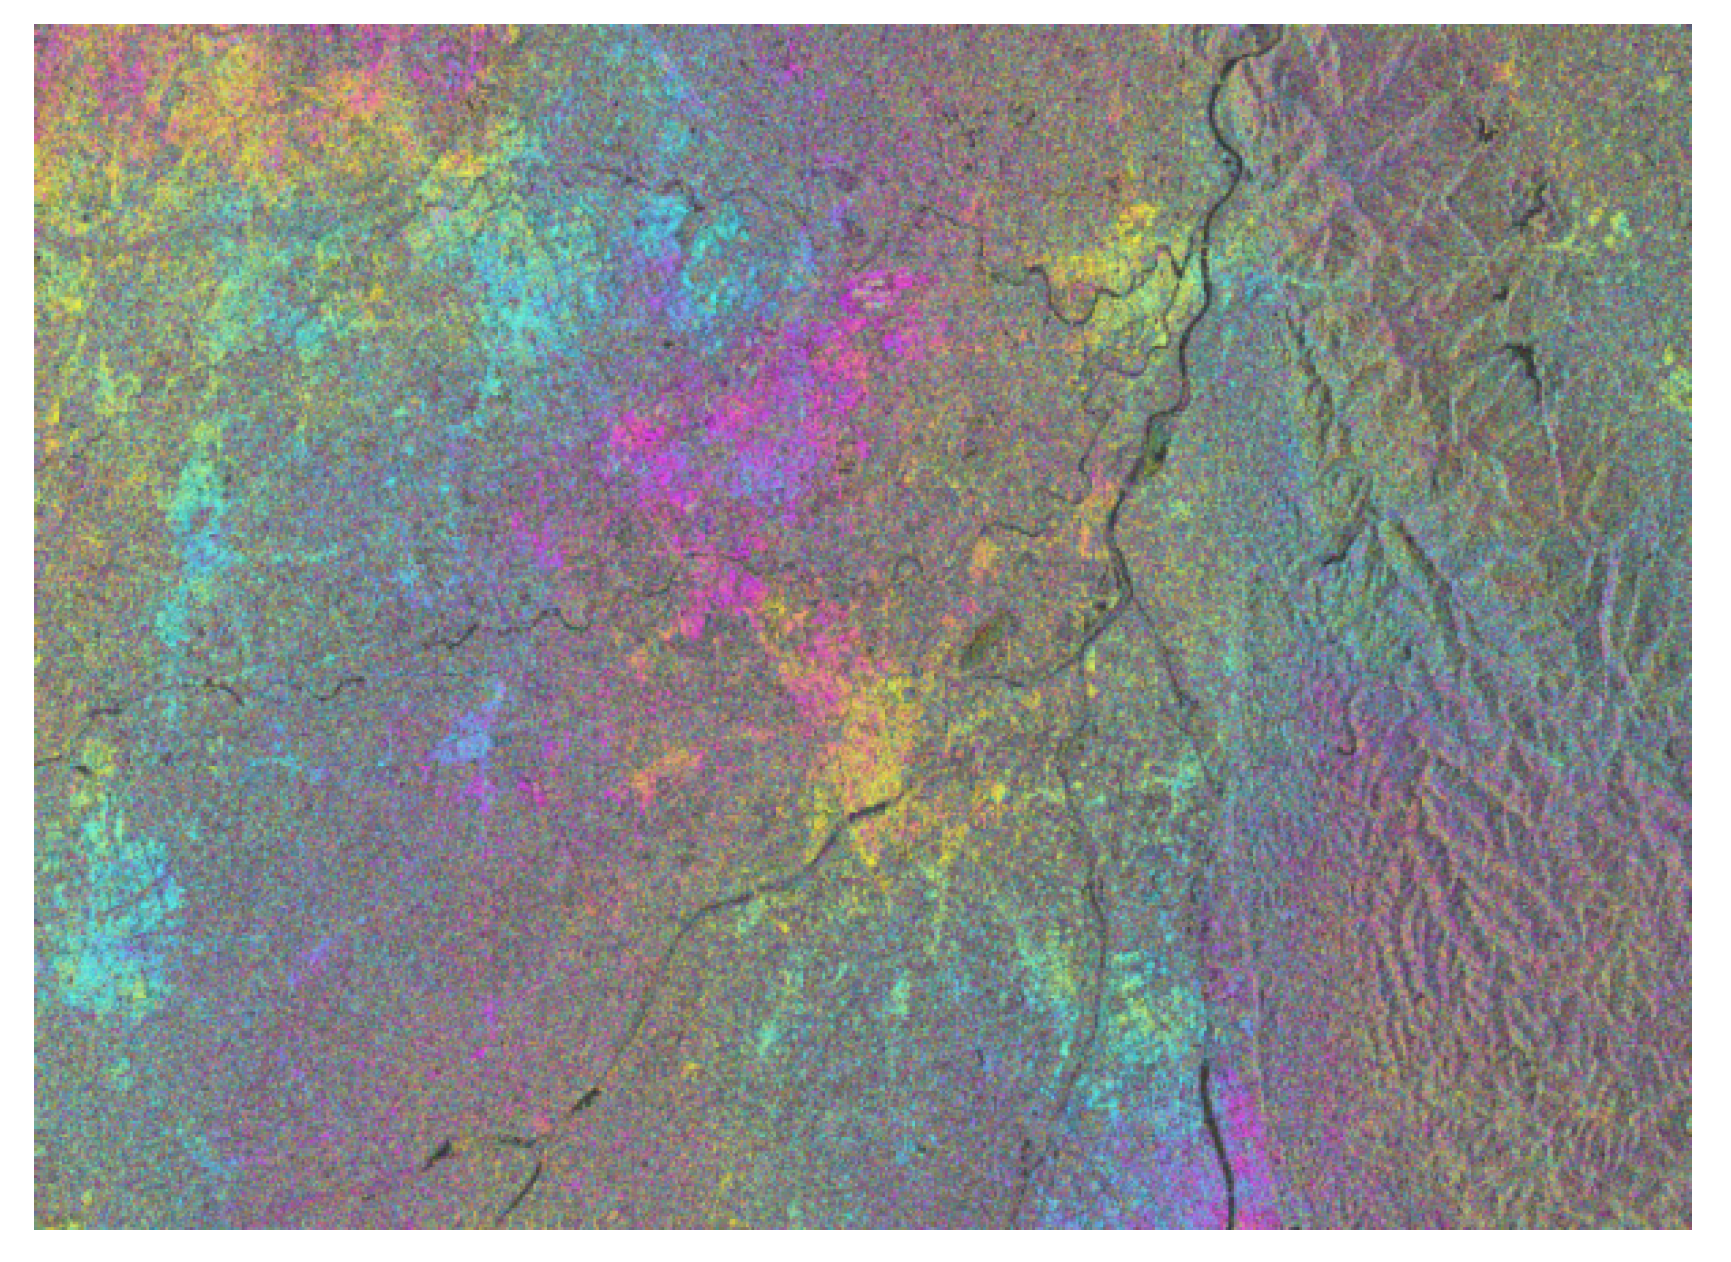
On the premise that the baseline estimate meets the interference processing, the interferogram was generated. The interferogram generation results include interferogram (Figure 9) and flattened interferogram (Figure 10).
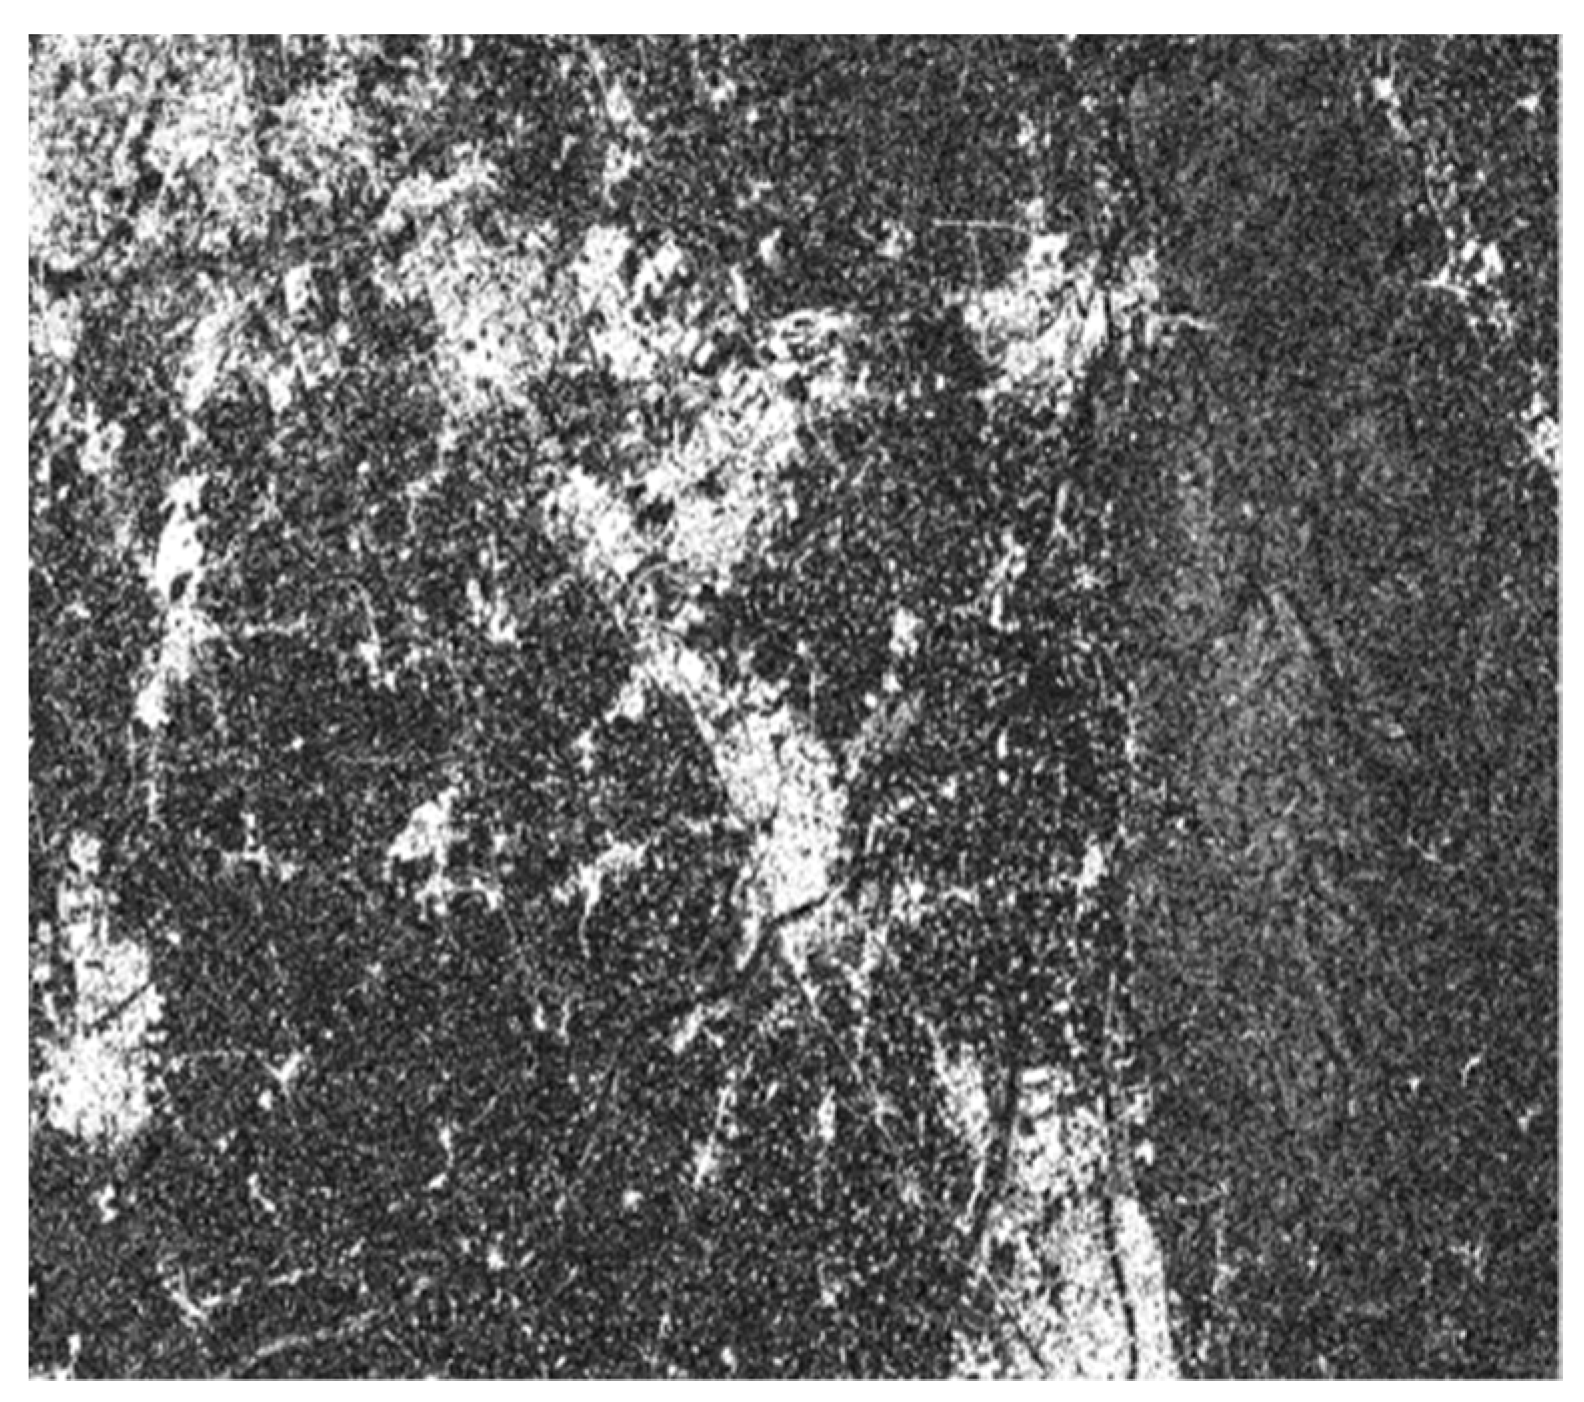
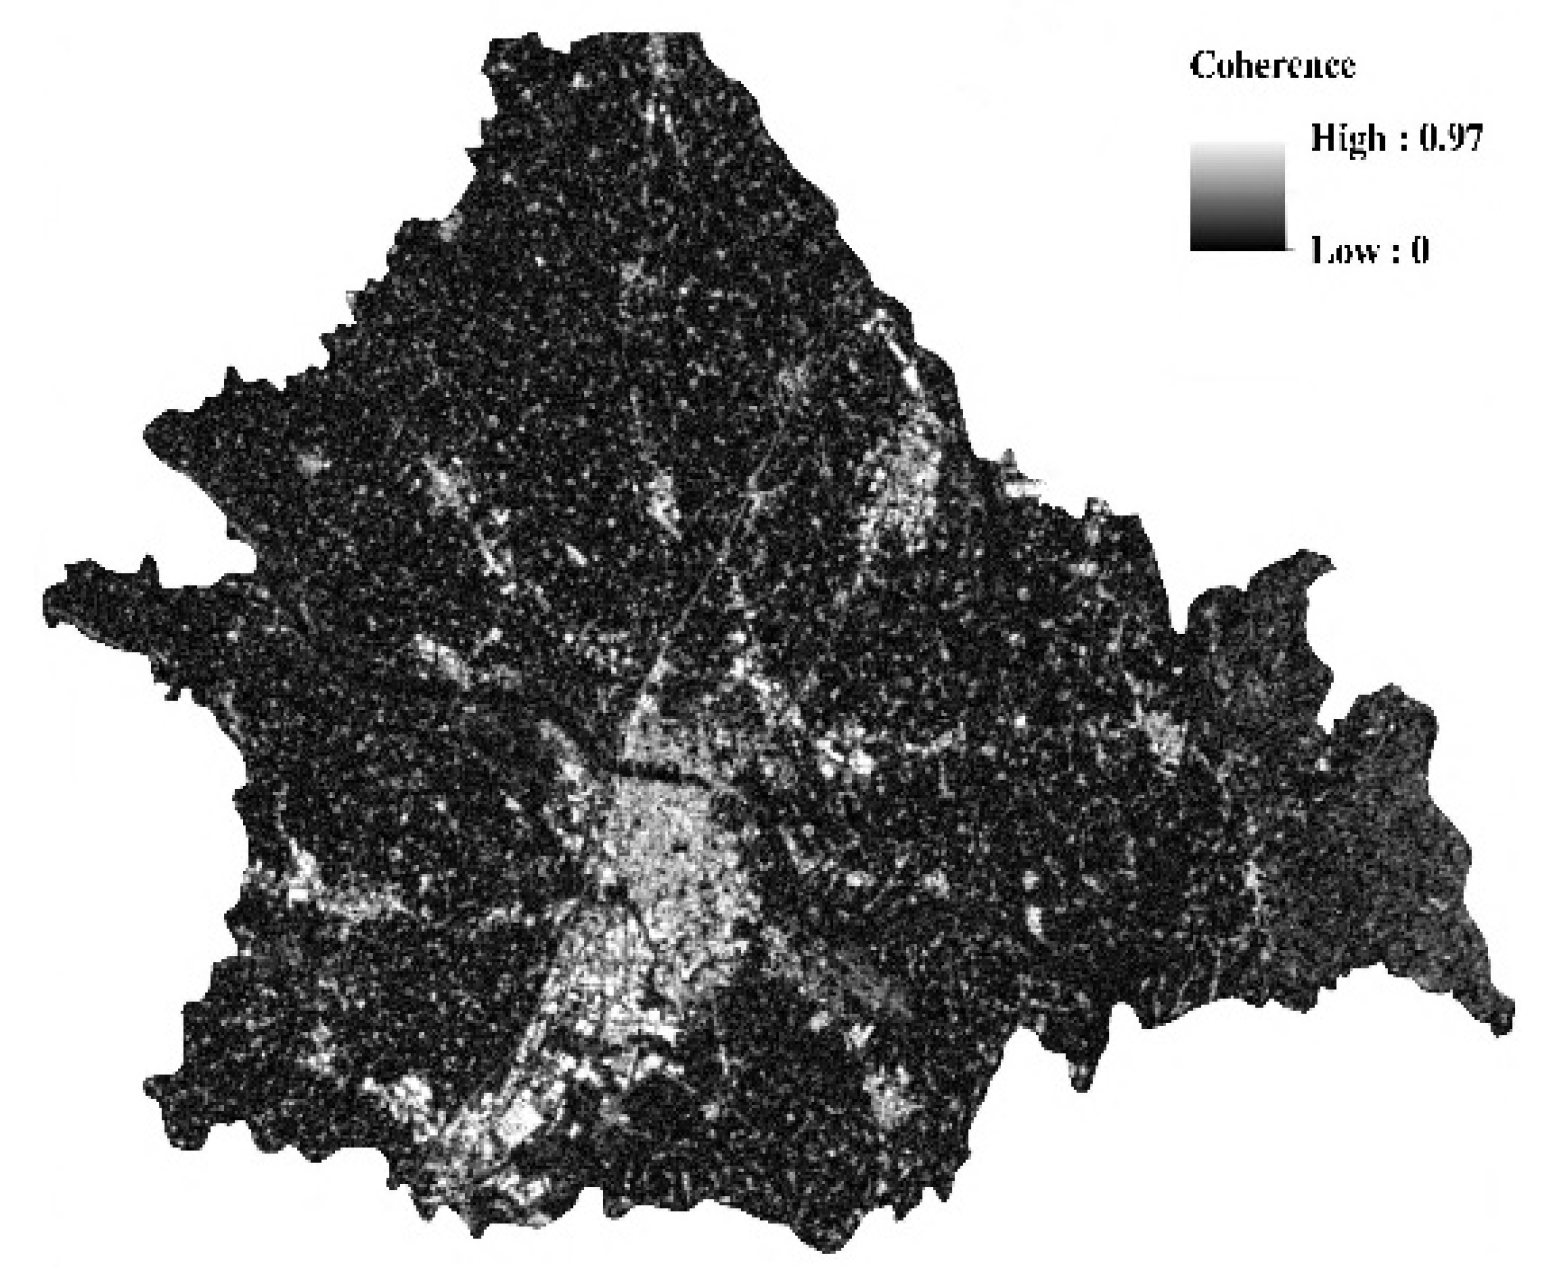
On the basis of the interferogram, self-adaptive filtering and coherence calculation were performed, and the Sentinel-1 coherence graph (Figure 11 and Figure 12) was obtained. The coherence coefficient of the study area was extracted. Preprocessing of the interferometric data included the selection of the suitable SLC pairs for InSAR data analysis, then splitting Sentinel-1 data into sub-swath levels covering the study area (IW2 and IW3), selecting VV polarization for the InSAR coherence analysis, and applying a precise orbit file, followed by co-registration to the sub-pixel accuracy using the Sentinel-1 TOPS co-registration algorithm.

3. Result

3.1. Extraction and Analysis of Rice Coherence

3.1.1. The Change of Coherence Coefficient of VV Polarization

On the basis of the analysis of the change in the coherence coefficient of VV polarimetric ground objects, the coherence coefficient of rice first decreases and then increases (Figure 13). Among them, the minimum value appears in August, when the rice is mature. The radar backscatter coefficient mainly represents the backscatter intensity of rice canopy. In May, the backscatter coefficient of rice mainly represents the backscatter intensity of the water in the rice field. Therefore, the coherence coefficient is small and varies greatly. After harvesting the rice in September, the radar backscatter coefficient mainly comes from the surface soil or the surface water in the rice field after harvest. Therefore, the coherence coefficient is similar to that in June and varies slightly. The coherence coefficients of artificial buildings from June to October are more than 0.46, and the difference between the maximum and the minimum is 0.06. The mean value is far higher than that of rice, water area, and vegetation.
If the coherence coefficient is greater, the coherence is higher; that is, it varies less. Most of the artificial buildings in the study area are buildings, roads, etc., which change slightly with time. Due to time variation and low single-to-noise ratio, the water surface shows low interference coherence. The study area is located in the subtropical monsoon climate zone. Thus, the growing period of rice overlaps with the rainy season. The seasonal sudden rainfall will cause the rise of water level and the expansion of water area. However, the coherence coefficient of the water changes by not more than 0.01. The climate of Guanghan belongs to the subtropical monsoon climate, but the city is located in the core area of Chengdu Plain. Therefore, there is no large area of vegetation that is common in subtropical monsoon climate zones, such as subtropical evergreen broad-leaved forest. Small areas of vegetation are mostly present in the study area. Therefore, although the rainfall increases, the vegetation grows insignificantly in the growing period of rice. During this period, the coherence coefficient varies slightly (Table 3).

3.1.2. The Change of Coherence Coefficient of VH Polarization

Different from the change in VV polarization coherence coefficient, the change in VH polarization coherence coefficient of rice shows a wave shape (Figure 14). The minimum coherence coefficient is observed in June, August, and October, whereas the maximum coherence coefficient is observed in July and September. Similar to the VV polarization coherence coefficient, the VH polarization coherence coefficient of artificial buildings is greater than 0.37, which is far higher than that of rice, water area, and vegetation. The change in the VH polarization coherence coefficient of water is similar to that of the VV polarization coherence coefficient. Due to time variation and low single-to-noise ratio, the surface shows low interference coherence. The study area is located in the subtropical monsoon climate zone, and thus the growth period of rice overlaps with the rainy season. The seasonal sudden rainfall will cause the rise of water level and the expansion of water area. However, the coherence coefficient of the water changes by not more than 0.01. The change in the VH polarization coherence coefficient of vegetation is also similar to that of VV polarization (Table 4).
On the basis of the VV and VH polarization coherence coefficients of ground objects, the VV polarization coherence coefficient of artificial buildings is greater than the VH polarization coherence coefficient. No remarkable difference can be observed between the VV and VH polarization coherence coefficients of rice, vegetation, and water area. However, the VV and VH polarization coherence coefficients can be used to better distinguish artificial buildings from other ground objects. The VV polarization coherence coefficient can be used to distinguish rice from water area and vegetation in August and September, whereas the VH polarization coherence coefficient can also be used to well distinguish rice from water area and vegetation in August and October. However, after harvesting the rice in October, the SAR images show two intensities of soil and water in the rice field. In addition, the base time in this study is May. The difference between rice planting and harvest is little. Therefore, the coherence coefficient in October is not highly available. It may be more effective to distinguish rice by using the coherence coefficients of two time phases, namely, rice maturity and harvest. On the basis of the comprehensive analysis on the polarization coherence coefficients, this study shows that the polarization interferogram introduced by InSAR technology can support rice identification.

3.2. Extraction and Analysis of Backscattering Characteristics of Rice

On the basis of the time-series Sentinel-1A image, the rice-planting areas were extracted according to the backscatter coefficients of various land types in the growth period of rice.

3.2.1. Change in the VV Polarization Object Backscatter Coefficient

The VV polarization backscatter coefficients of artificial buildings are greater than −3.98 (Table 5), whereas the backscatter coefficients of water areas are less than −19.21. The two ground objects can be well distinguished from rice and vegetation. Except in the rice maturation period on July 18, the polarization backscatter coefficient of rice is slightly higher than that of vegetation and lower than that of vegetation in other periods (Figure 15).

3.2.2. Change in the VH Polarization Backscatter Coefficient of Ground Objects

Similar to VV polarization, artificial buildings and water area have the maximum and minimum polarization backscatter coefficients, respectively (Figure 16). Both can be distinguished from rice and vegetation obviously. However, the polarization backscatter coefficients of vegetation and rice are in a spirally interweaved state. The polarization backscatter coefficient of rice basically shows an increasing trend in the whole growth cycle, except from mid-July to mid-August, which shows a decreasing trend. The polarization backscatter coefficient of vegetation can be better distinguished from rice on June 12, but there is little difference in other months (Table 6).

3.2.3. Change in the VV/VH Polarization Backscatter Coefficients of Ground Objects

VV/VH is the ratio of VV polarization to VH polarization (Figure 17). The change trend of the VV/VH ratio of artificial buildings and water area is similar to that of VV and VH polarization backscatter coefficients, which can be used to distinguish between rice and vegetation. Except in other months, the VV/VH value of vegetation is difficult to distinguish from rice on 12 June and 11 August (Table 7).
By comprehensively considering VV, VH, VV/VH, coherence coefficient, and other parameters of Sentinel-1 SAR image, this study aimed to comparatively analyze the rice identification results under two conditions, namely, time series and combination of time series and coherence coefficient so as to verify the contribution of SAR polarization coherence coefficient to rice identification.

3.3. Rice Identification on the Basis of the Time-Series Sentinel-1A SAR

On the basis of the comprehensive analysis of VV, VH, VV/VH, coherence coefficient, and other parameters, the features with great difference among different ground objects were considered. In addition, the features were used as the basic features of rice identification so as to rapidly extract the rice-planting areas. Classification was made based on the VV and VH polarization on 12 June, VV polarization on 11 August, and VV/VH value in two months. In addition, the results are shown in R (12/06VV), G (11/08VV), and B (12/06VH)) in three channels (Figure 18). In Figure 18, rice is colored red and dark brown, water is colored black, artificial buildings are colored yellow and white, and vegetation is colored dark green. Therefore, the color can be used to easily distinguish rice from other ground objects.

3.4. Rice Identification on the Basis of Time-Series SAR + Coherence Coefficient

Time series + coherence coefficient refers to time-series SAR combined with the polarization coherence coefficients on 12 June and 11 August, and the results are shown in R (12/06VV), G (11/08VV), and B (12/06VV coherence coefficient) in three channels (Figure 19). In Figure 19, rice is colored dark red, water is colored black, artificial buildings are colored blue and white, and vegetation is colored light green. The color can be used to easily distinguish rice from other ground objects.

3.5. Accuracy Evaluation

To further verify the accuracy of rice extraction on the basis of SAR image, the rice-planting area in the study area was extracted by using object-oriented classification method (segmentation scale 10; the proportion of each band is 1) on the basis of Sentinel-2 optical remote sensing image. The local effect is shown in Figure 20. To verify the reliability of the classification result, 200 validation sample points of four land types were collected from Google Earth, and the classification accuracy of the statistical area of rice in Guanghan City in 2017 was evaluated by using an error matrix based on TTA Mask.
The classification accuracies of time-series SAR and time-series SAR combined with coherence coefficient are shown in Table 8 and Table 9, respectively. The user classification accuracy of Scheme 1 is 78%, whereas that of Scheme 2 is improved by 3%. On the basis of area verification in Table 10, the accuracy of Scheme 2 is improved by 2.05% compared to that of Scheme 1. On the basis of the verification result of the error matrix and statistical area accuracy, the accuracy can be improved significantly after the coherence coefficient is combined with time-series SAR classification. On the basis of the rice area statistical accuracy in Table 10, the accuracy of the rice-planting area extraction of Scheme 2 is significantly higher than that of Scheme 1.
Figure 20 shows that the rice-planting area extracted by this scheme basically corresponds to the spatial position extracted by the optical image (Area A in Figure 20). This scheme proves to be practical and has significance for the large-scale monitoring of rice and other food crops.
The polarization backscatter coefficient of rice cannot be easily distinguished from vegetation in the SAR image, which leads to error in the extraction of rice and vegetation information. On the basis of InSAR, the coherence coefficient was introduced in this study, which helps to distinguish rice and vegetation information and improve the identification accuracy.
Finally, on the basis of the analysis of the overall accuracy and Kappa coefficient of the two schemes, the overall accuracy is improved by 2.74%, and the Kappa coefficient is improved by 0.366 due to the use of coherence coefficient. On the basis of the above analysis, the introduction of coherence coefficient to extract the rice-planting area can significantly improve not only the accuracy of rice identification but also the accuracy of land cover classification. Moreover, it is of great significance for studies on land cover on the basis of SAR images.
In cloudy regions, the application of optical image is restricted. The SAR image can penetrate through clouds and mists and therefore make up for the limitation of optical image. Hence, the use of optical image or SAR image should be determined according to the characteristics of the study area, research purpose, and research methods in rice monitoring and other fields. In this selection, the accuracy difference in the rice extraction result between optical image and SAR image should be analyzed under different cloud covers to obtain a scale. This scale can be used to determine which data source should be selected efficiently and quickly.

4. Conclusions

In this study, the core area of Chengdu Plain was taken as a case example. The polarization coherence coefficient of rice on the basis of InSAR technology was analyzed, and the polarization backscatter coefficient and polarization coherence coefficient of rice on the basis of time-series SAR image were extracted. The two schemes based on time-series SAR image and time-series SAR combined with the coherence coefficient were analyzed to identify the rice-planting area. The following conclusions can be drawn:
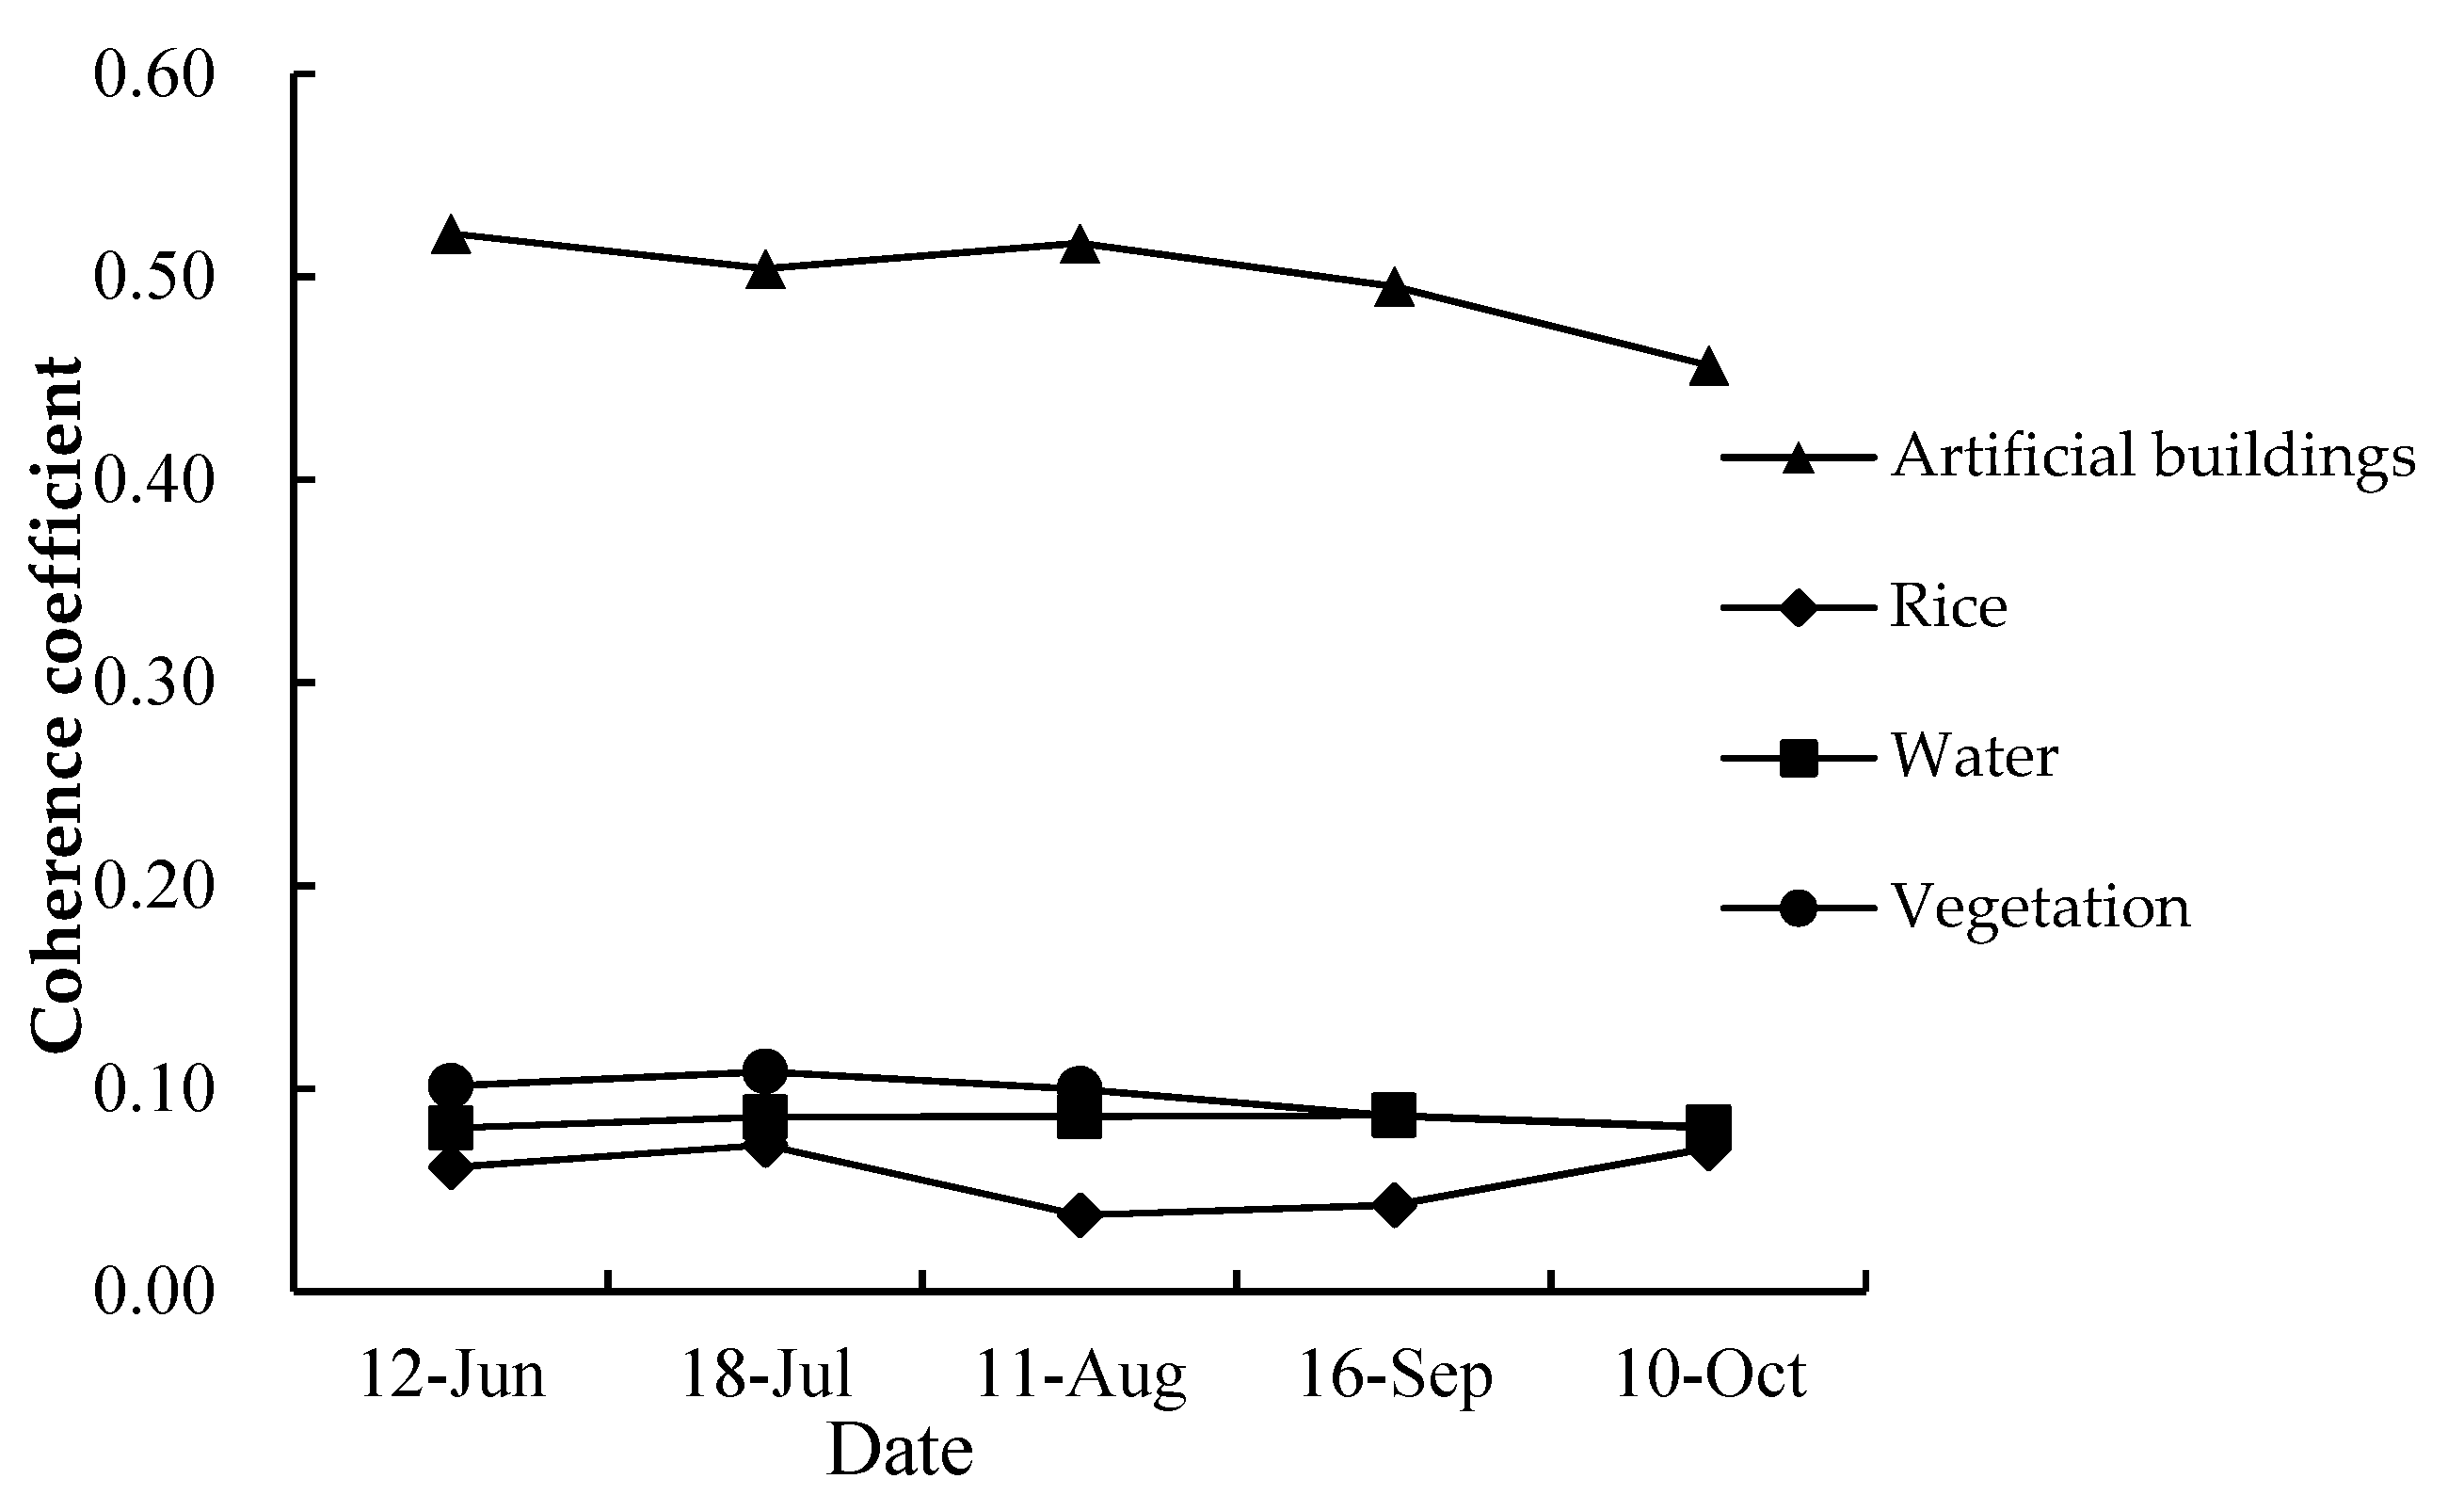
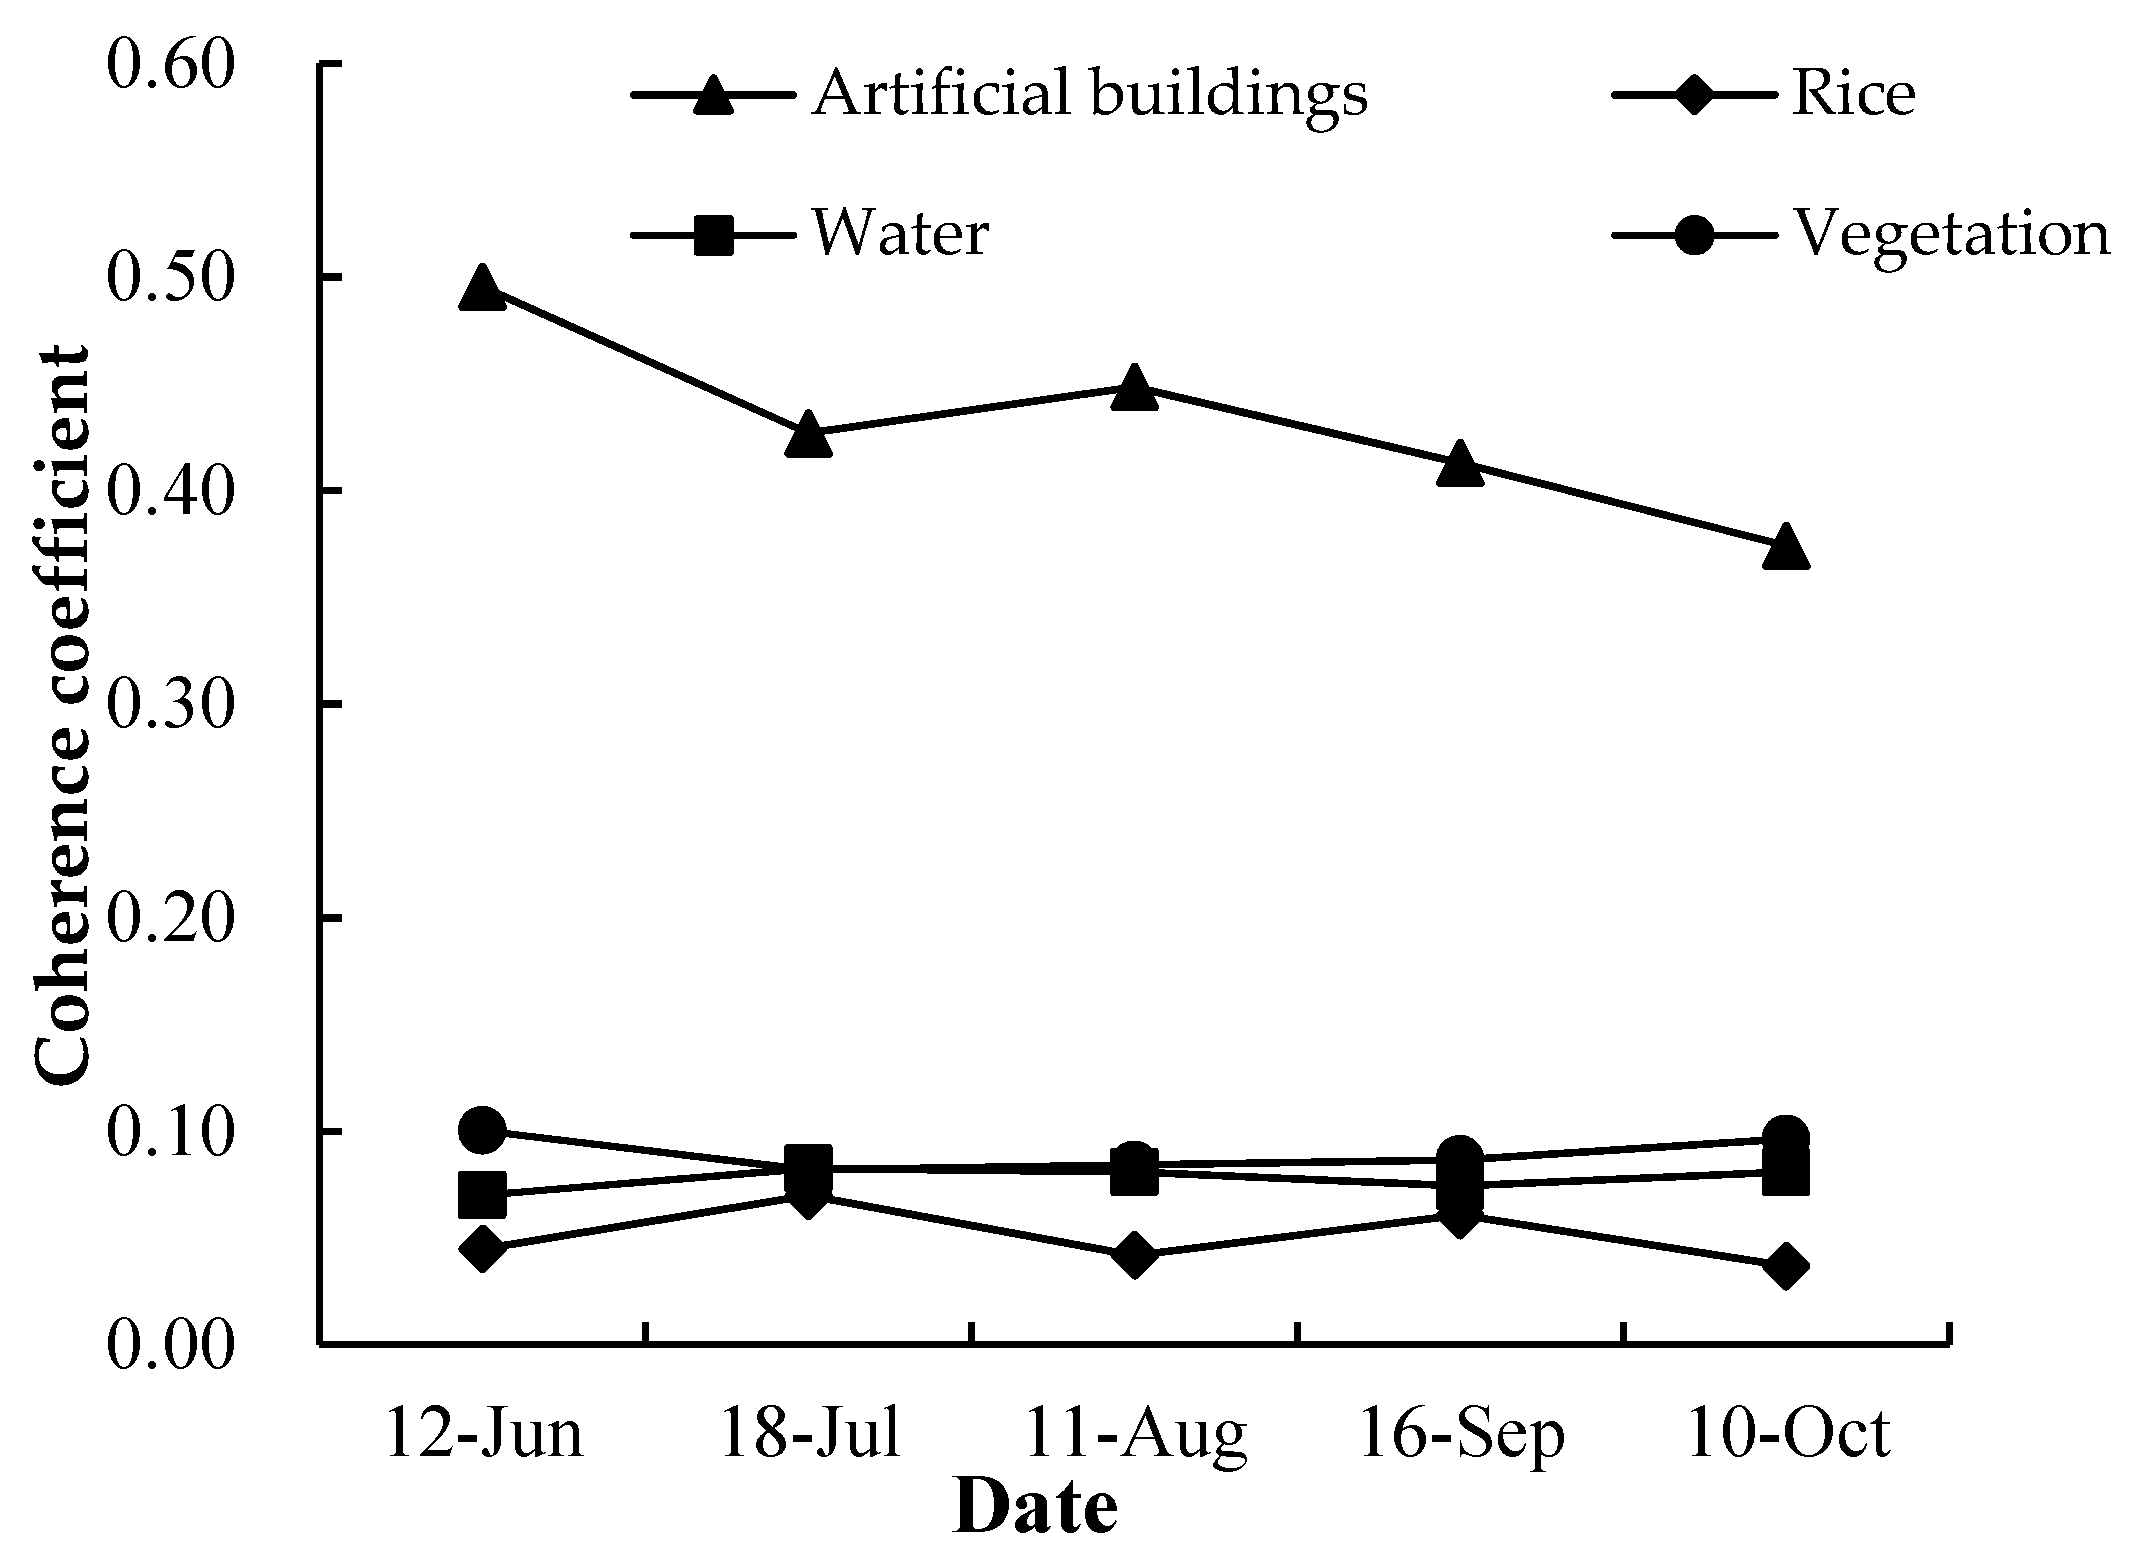
(1) The VV and VH polarization coherence coefficients of typical ground objects during the growing period of rice were obtained on the basis of InSAR technology. The analysis showed that the VV and VH polarization coherence coefficients can be used to well distinguish artificial buildings from other ground objects. The VV polarization coherence coefficient can be used to well distinguish rice from water area and vegetation in August and September; the VH polarization coherence coefficient can also be used to well distinguish rice from water area and vegetation in August and October.
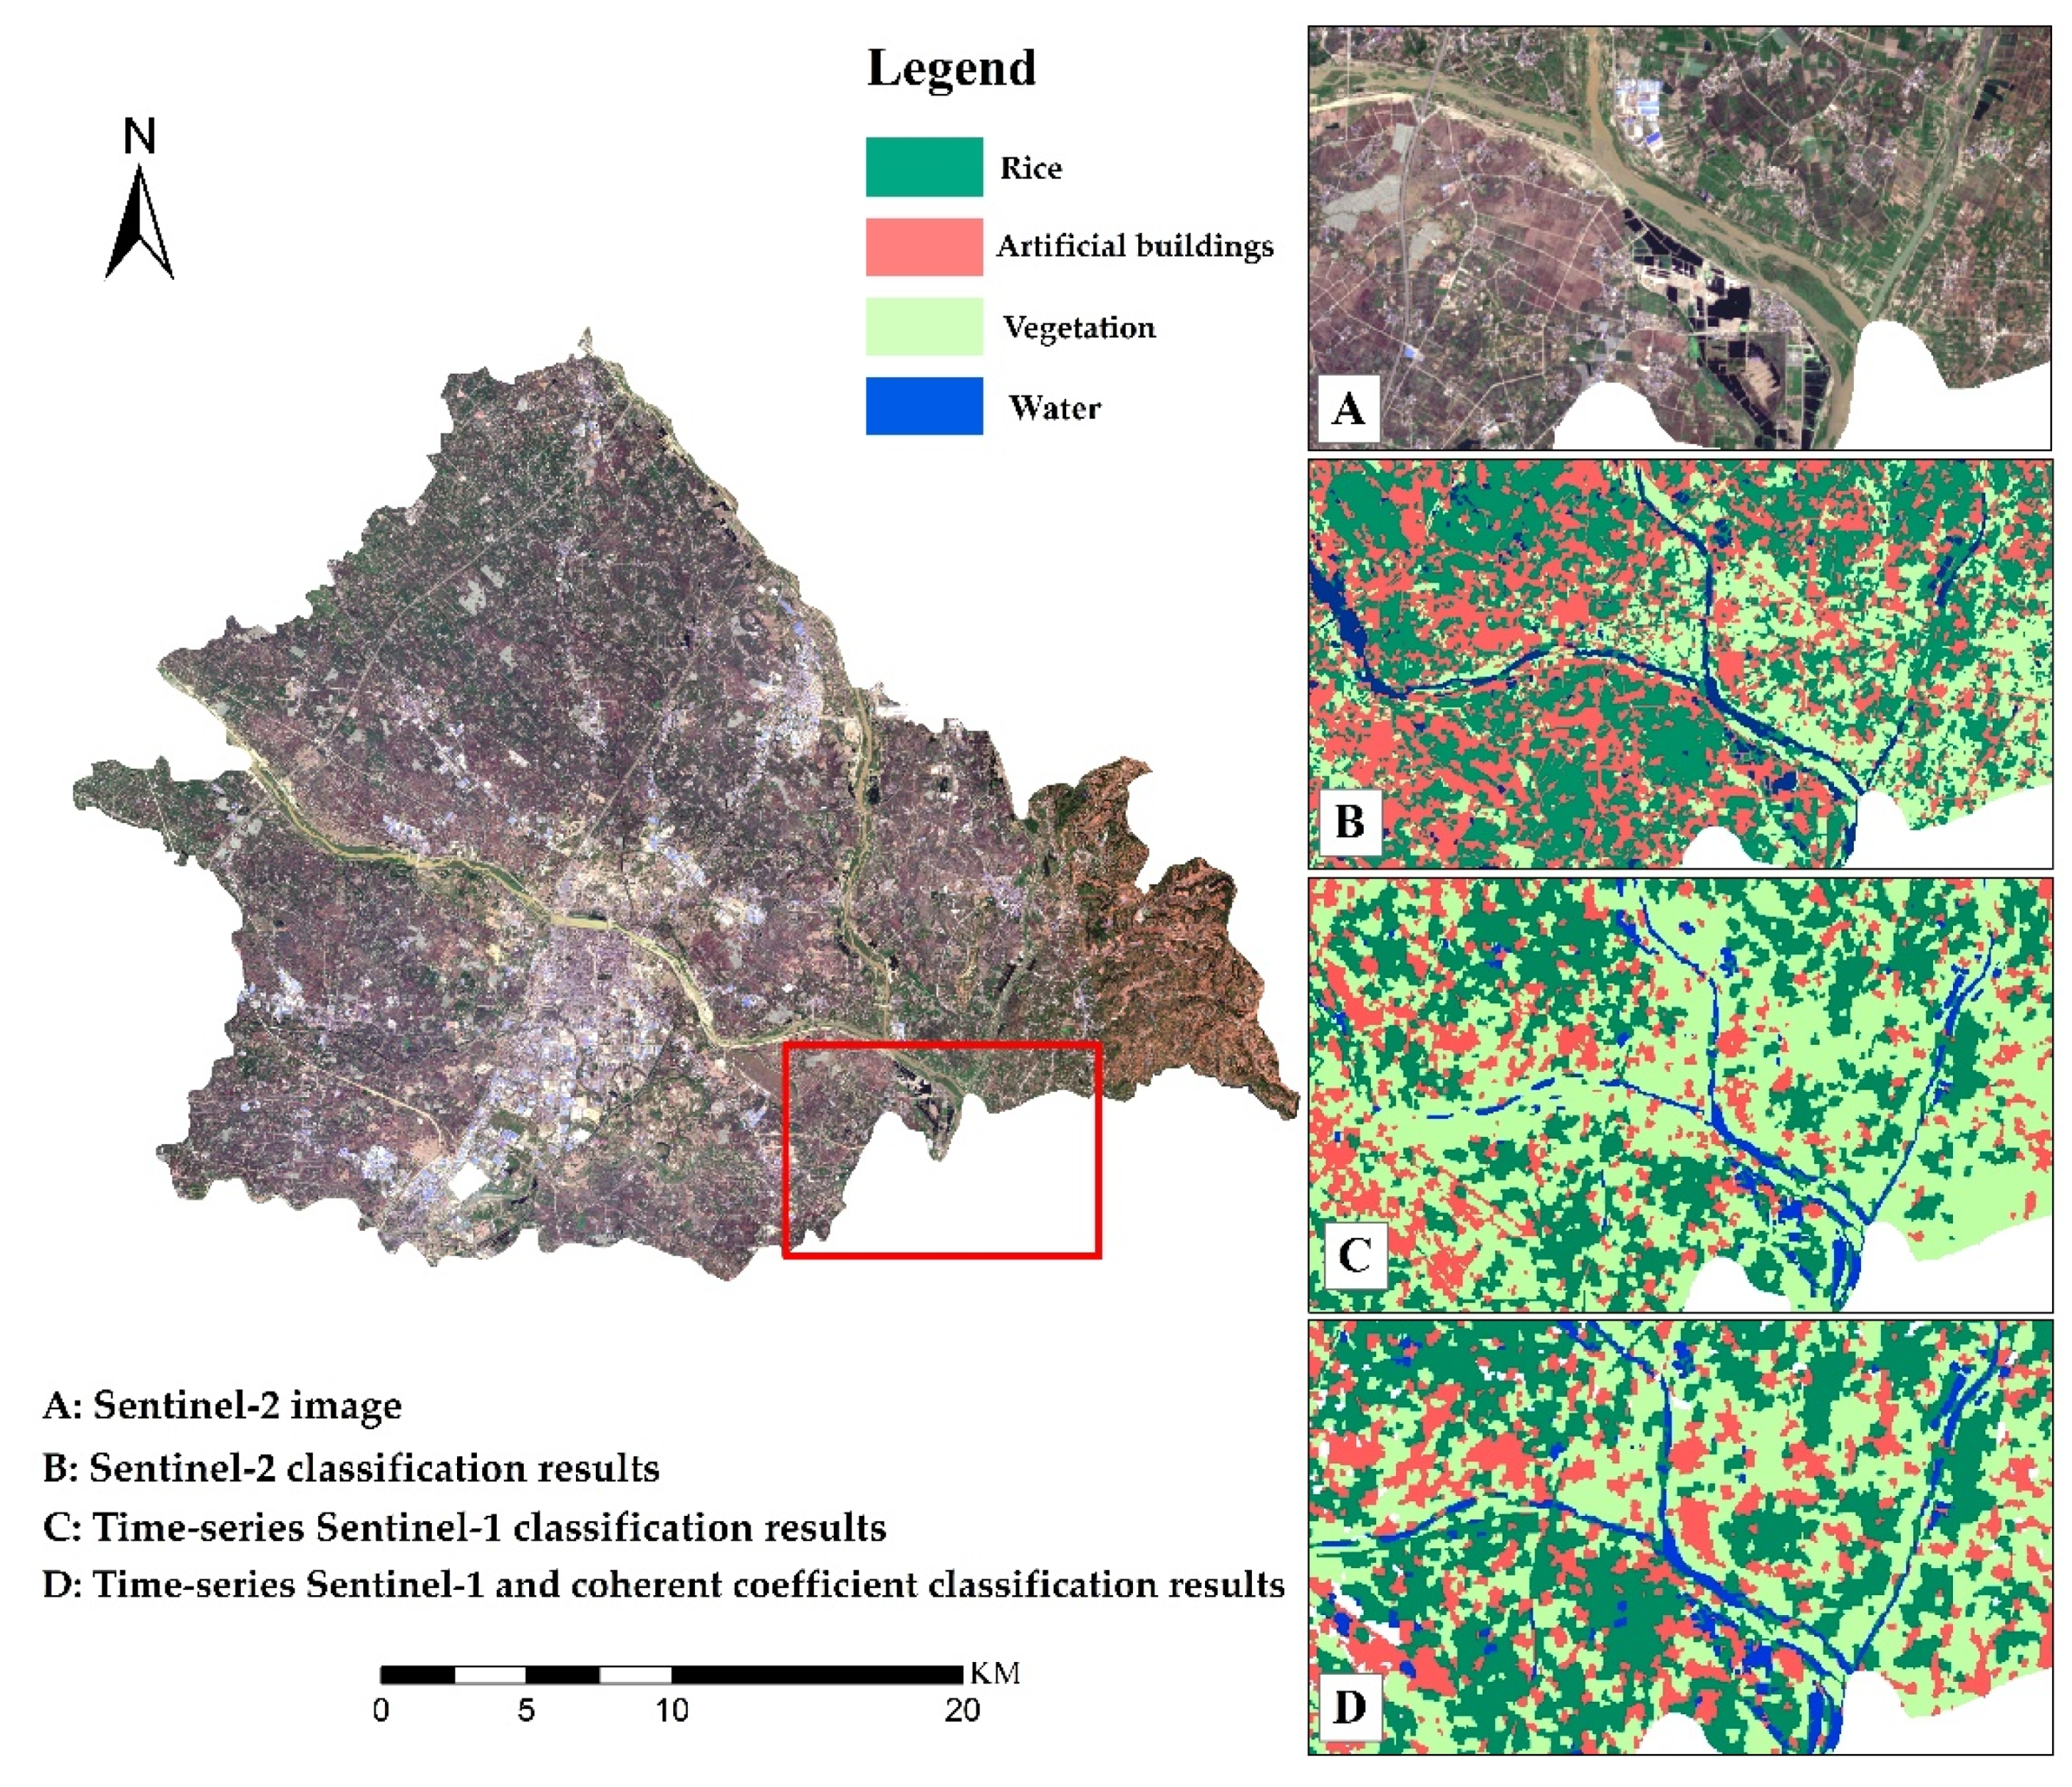
(2) The rice identification accuracy on the basis of time-series Sentinel-1 SAR image is lower than that of time-series Sentinel-1 SAR image combined with InSAR technology. The user accuracies of both methods are 78% and 81%, respectively. The rice identification result based on Sentinel-2 optical remote sensing images was compared with three rice identification results based on Sentinel-1 SAR images. Compared with single-time-phase SAR, the time-series SAR image can distinguish rice and vegetation information more significantly, thus improving the rice identification accuracy. The introduction of coherence coefficient not only improves the classification accuracy of artificial buildings but also significantly distinguishes vegetation and rice, thus improving the identification accuracy. Rice identification on the basis of time-series Sentinel-1 SAR image combined with InSAR technology can achieve a good classification result, which shows that the coherence coefficient improves rice identification.
(3) In monitoring rice and other crops in cloudy regions, optical data are preferred if they are available. If optical data are lacking, SAR data can be used to monitor crops. The Sentinel-1 series images reach 250 km in width, which is significantly conducive to large-scale rice monitoring or mapping in plains or areas with small topographic relief.

Author Contributions

R.Z. and H.L. designed and wrote the original draft; Z.T., S.Y. and D.L. assisted with the formal analysis; T.Z. assisted with the methodology. All authors have read and agreed to the published version of the manuscript.

Funding

This research was funded by Asian Cooperation Fund Project: Demonstration Project of Water Resources Distribution and Land Use Dynamic Remote Sensing Monitoring Technology in the Lancang-Mekong River Basin; the National Key Research and Development Program of China (grant number 2016YFB0501403); China Postdoctoral Science Foundation (2020M670609).

Data Availability Statement

Not applicable.

Conflicts of Interest

The authors declare no conflict of interest.

References

  1. Boschetti, M.; Busetto, L.; Manfron, G.; Laborte, A.; Asilo, S.; Pazhanivelan, S.; Nelson, A. PhenoRice: A method for automatic extraction of spatio-temporal information on rice crops using satellite data time series. Remote Sens. Environ. 2017, 194, 347–365. [Google Scholar] [CrossRef] [Green Version]
  2. Liu, H.Y.; Wang, F.X.; Yang, S.Y. Fast Semisupervised classification using histogram-based density estimation for large-scale polarimetric SAR data. IEEE Geosci. Remote Sens. Lett. 2019, 16, 1844–1848. [Google Scholar] [CrossRef]
  3. Ulaby, F.T.; Kouyate, F.; Brisco, B.; Williams, T.H.L. Textural infornation in sar images. IEEE Trans. Geosci. Remote Sens. 1986, 24, 235–245. [Google Scholar] [CrossRef]
  4. Panigrahy, S.; Chakraborty, M.; Sharma, S.A.; Kundu, N.; Ghose, S.C.; Pal, M. Early estimation of rice area using temporal ERS-1 synthetic aperture radar data a case study for the Howrah and Hughly districts of West Bengal, India. Int. J. Remote Sens. 1997, 18, 1827–1833. [Google Scholar] [CrossRef]
  5. De Bernardis, C.G.; Vicente-Guijalba, F.; Martinez-Marin, T.; Lopez-Sanchez, J.M. Estimation of Key Dates and Stages in Rice Crops Using Dual-Polarization SAR Time Series and a Particle Filtering Approach. IEEE J. Sel. Top. Appl. Earth Obs. Remote Sens. 2015, 8, 1008–1018. [Google Scholar] [CrossRef] [Green Version]
  6. Le Toan, T.; Ribbes, F.; Wang, L.; Floury, N.; Ding, K.; Kong, J.A.; Fujita, M.; Kurosu, T. Rice crop mapping and monitoring using ERS-1 data based on experiment and modeling results. IEEE Trans. Geosci. Remote Sens. 1997, 35, 41–56. [Google Scholar] [CrossRef]
  7. Gao, H.; Wang, C.C.; Yang, M.H.; Hu, C.C.; Luo, X.J. Scattering feature analysis and classification of crops based on GF-3 polSAR data. Eng. Surv. Mapp. 2019, 28, 50–56. [Google Scholar]
  8. Neetu; Ray, S.S. Evaluation of different approaches to the fusion of Sentinel -1 SAR data and Resourcesat 2 LISS III optical data for use in crop classification. Remote Sens. Lett. 2020, 11, 1157–1166. [Google Scholar] [CrossRef]
  9. Mosleh, M.; Hassan, Q.; Chowdhury, E. Application of Remote Sensors in Mapping Rice Area and Forecasting Its Production: A Review. Sensors 2015, 15, 769–791. [Google Scholar] [CrossRef] [Green Version]
  10. Zhang, R.; Tang, X.; You, S.; Duan, K.; Luo, H. A novel feature-level fusion framework using optical and sar remote sensing images for land use/land cover (lulc) classification in cloudy mountainous area. Appl. Sci. 2020, 10, 2928. [Google Scholar] [CrossRef]
  11. Bazzi, H.; Baghdadi, N.; El Hajj, M.; Zribi, M.; Minh, D.H.T.; Ndikumana, E.; Courault, D.; Belhouchette, H. Mapping Paddy Rice Using Sentinel-1 SAR Time Series in Camargue, France. Remote Sens. 2019, 11, 887. [Google Scholar] [CrossRef] [Green Version]
  12. Nguyen, D.B.; Gruber, A.; Wagner, W. Mapping rice extent and cropping scheme in the Mekong Delta using Sentinel-1A data. Remote Sens. Lett. 2016, 7, 1209–1218. [Google Scholar] [CrossRef]
  13. Avtar, R.; Mohan, G.; Misra, P.; Kurasaki, M.; Minh, H.V.T. Geo-information monitoring and mapping of rice cropping pattern in flooding area in the vietnamese mekong delta using sentinel-1a data: A case of an giang province. Int. J. Geo Inf. 2019, 8, 211. [Google Scholar] [CrossRef] [Green Version]
  14. Chen, S.; Guo, B.; Zhang, R.; Zang, W.; Zhang, H. Quantitatively determine the dominant driving factors of the spatial—temporal changes of vegetation npp in the hengduan mountain area during 2000–2015. J. Mt. Sci. 2021, 18, 427–445. [Google Scholar] [CrossRef]
  15. Seonyoung, P.; Jungho, I.; Seohui, P.; Cheolhee, Y.; Hyangsun, H.; Jinyoung, R. Classification and mapping of paddy rice by combining landsat and sar time series data. Remote Sens. 2018, 10, 447. [Google Scholar] [CrossRef] [Green Version]
  16. Lasko, K.; Vadrevu, K.P.; Tran, V.T.; Justice, C. Mapping double and single crop paddy rice with sentinel-1a at varying spatial scales and polarizations in hanoi, vietnam. IEEE J. Sel. Top. Appl. Earth Obs. Remote Sens. 2018, 11, 498–512. [Google Scholar] [CrossRef]
  17. Liao, H.; Wdowinski, S.; Li, S. Regional-scale hydrological monitoring of wetlands with sentinel-1 insar observations: Case study of the south florida everglades-sciencedirect. Remote Sens. Environ. 2020, 251, 112501. [Google Scholar] [CrossRef]
  18. Bouaraba, A.; Belhadj-Aissa, A.; Borghys, D.; Acheroy, M.; Closson, D. InSAR Phase Filtering via Joint Subspace Projection Method: Application in Change Detection. IEEE Geosci. Remote Sens. Lett. 2014, 11, 1817–1820. [Google Scholar] [CrossRef]
  19. Ghulam, A.; Porton, I.; Freeman, K. Detecting subcanopy invasive plant species in tropical rainforest by integrating optical and microwave (InSAR/PolInSAR) remote sensing data, and a decision tree algorithm. ISPRS J. Photogramm. Remote Sens. 2014, 88, 174–192. [Google Scholar] [CrossRef]
  20. Jiang, M.; Yong, B.; Tian, X.; Malhotra, R.; Hu, R.; Li, Z.; Yu, Z.; Zhang, X. The potential of more accurate InSAR covariance matrix estimation for land cover mapping. ISPRS J. Photogramm. Remote Sens. 2017, 126, 120–128. [Google Scholar] [CrossRef]
  21. Yang, Z.; Li, Z.; Zhu, J.; Yi, H.; Hu, J.; Feng, G. Deriving Dynamic Subsidence of Coal Mining Areas Using InSAR and Logistic Model. Remote Sens. 2017, 9, 125. [Google Scholar] [CrossRef] [Green Version]
  22. Zhaohua, C.; Lori, W.; Sarah, B.; Amir, B.; Benoit, M.; Jon, P.; Jason, D.; Danny, B. Characterizing marsh wetlands in the Great Lakes Basin with C-band InSAR observations. Remote Sens. Environ. 2020, 242, 111750. [Google Scholar]
  23. Bayer, B.; Simoni, A.; Schmidt, D.; Bertello, L. Using advanced insar techniques to monitor landslide deformations induced by tunneling in the Northern Apennines, Italy. Eng. Geol. 2017, 226, 20–32. [Google Scholar] [CrossRef]
  24. Qu, Y.; Zhao, W.; Yuan, Z.; Chen, J. Crop Mapping from Sentinel-1 Polarimetric Time-Series with a Deep Neural Network. Remote Sens. 2020, 12, 2493. [Google Scholar] [CrossRef]
  25. Supriatna, R.; Wibowo, A.; Shidiq, I.P.A.; Gandharum, L. Spatio-temporal analysis of rice field phenology using sentinel-1 image in karawang regency west java, indonesia. Int. J. Geomate 2019, 17, 101–106. [Google Scholar] [CrossRef]
  26. Plank, S.; Juessi, M.; Martinis, S.; Twele, A. Mapping of flooded vegetation by means of polarimetric sentinel-1 and alos-2/palsar-2 imagery. Int. J. Remote Sens. 2017, 38, 3831–3850. [Google Scholar] [CrossRef]
  27. Le, T.T.; Atto, A.M.; Trouve, E.; Nicolas, J. Adaptive multitemporal sar image filtering based on the change detection matrix. IEEE Geosci. Remote Sens. Lett. 2014, 11, 1826–1830. [Google Scholar]
  28. Amitrano, D.; Belfiore, V.; Cecinati, F.; Di Martino, G.; Iodice, A.; Mathieu, P.-P.; Medagli, S.; Poreh, D.; Riccio, D.; Ruello, G. Urban Areas Enhancement in Multitemporal SAR RGB Images Using Adaptive Coherence Window and Texture Information. IEEE J. Sel. Top. Appl. Earth Obs. Remote Sens. 2016, 9, 3740–3752. [Google Scholar] [CrossRef]
  29. Kim, J.-W.; Lu, Z.; Lee, H.; Shum, C.; Swarzenski, C.M.; Doyle, T.W.; Baek, S.-H. Integrated analysis of PALSAR/Radarsat-1 InSAR and ENVISAT altimeter data for mapping of absolute water level changes in Louisiana wetlands. Remote Sens. Environ. 2009, 113, 2356–2365. [Google Scholar] [CrossRef]
  30. Yuan, Z.; Lu, Z.; Chen, L.; Xing, X. A closed-form robust cluster-analysis-based multibaseline insar phase unwrapping and filtering algorithm with optimal baseline combination analysis. IEEE Trans. Geosci. Remote Sens. 2020, 99, 1–12. [Google Scholar] [CrossRef]
Figure 1. Location of the study area.
Applsci 11 06923 g001
Figure 2. The framework of the study.
Applsci 11 06923 g002
Figure 3. Sentinel-1 SAR data preprocessing process.
Applsci 11 06923 g003
Figure 4. Synthetic map of the research area after Sentinel-1A (VV) and (VH) polarization (R (05/19), G (06/12), B (07/18)).
Applsci 11 06923 g004
Figure 5. InSAR processing flow.
Applsci 11 06923 g005
Figure 6. Baseline estimate result.
Applsci 11 06923 g006
Figure 7. Relationship diagram between Sentinel-1 elevation accuracy and coherence.
Applsci 11 06923 g007
Figure 8. Relationship diagram between Sentinel-1 deformation accuracy and coherence.
Applsci 11 06923 g008
Figure 9. Sentinel-1 interferogram.
Applsci 11 06923 g009
Figure 10. Sentinel-1 flattened interferogram.
Applsci 11 06923 g010
Figure 11. Sentinel-1 coherence map.
Applsci 11 06923 g011
Figure 12. Sentinel-1 coherence map after geocoding.
Applsci 11 06923 g012
Figure 13. Sentinel-1 VV polarization coherence coefficient map.
Applsci 11 06923 g013
Figure 14. Sentinel-1 VH polarization coherence coefficient map.
Applsci 11 06923 g014
Figure 15. VV polarization backscatter coefficient of ground objects.
Applsci 11 06923 g015
Figure 16. Sentinel-1 VH polarization backscatter coefficient of ground objects.
Applsci 11 06923 g016
Figure 17. Sentinel-1 VV/VH polarization backscatter coefficient of ground objects.
Applsci 11 06923 g017
Figure 18. Multi-time-phase RGB composite image.
Applsci 11 06923 g018
Figure 19. Multi-temporal and coherence coefficient RGB composite map.
Applsci 11 06923 g019
Figure 20. Local effect map of rice identification result.
Applsci 11 06923 g020
Table 1. Phenological stage of rice growth in the study area.
TimePhenological Stage
Late MarchSeeding
Mid-April Seeding–emerging
Late AprilRaising on seed bed
Early MayTransplanting–turning green
Early JulyBooting–heading
Mid-JulyBooting–heading
Mid-AugustGrouting–milky ripe
Late AugustMilky ripe–mature
Early SeptemberMature–harvesting
Mid-September Mature–harvesting
Table 2. Sentinel-1A data.
Imaging ModeAcquisition TimeTrack NumberResolutionMulti-Look ResolutionPolarization Type
IW19 May 201712810 × 9.9920 × 19.988VH/VV
IW12 June 201712810 × 9.9920 × 19.988VH/VV
IW18 July 201712810 × 9.9920 × 20.002VH/VV
IW11 August 201712810 × 9.9920 × 19.988VH/VV
IW16 September 201712810 × 9.9920 × 20.003VH/VV
IW10 October 201712810 × 9.9920 × 19.988VH/VV
Table 3. Coherence coefficient of ground objects of VV polarization.
12-June18-July11-August16-September10-October
Artificial buildings0.520.500.520.500.46
Rice0.060.070.040.040.07
Water area0.080.090.090.090.08
Vegetation0.100.110.100.090.08
Table 4. Coherence coefficient of VH polarization.
12-June18-July11-August16-September10-October
Artificial buildings0.500.430.450.410.37
Rice0.040.070.040.060.04
Water area0.070.080.080.070.08
Vegetation0.100.080.080.090.10
Table 5. VV polarization backscatter coefficient of ground objects.
19-May12-June18-July11-August16-September10-October
Artificial buildings−5.20−4.15−4.10−4.97−3.98−3.99
Rice−12.23−11.51−10.05−12.71−11.26−10.40
Water area−20.10−19.21−19.74−20.25−19.51−19.58
Vegetation−10.70−9.79−10.41−11.60−9.63−9.65
Table 6. VH polarization backscatter coefficient of ground objects.
19-May12-June18-July11-August16-September10-October
Artificial buildings−11.86−11.65−11.03−11.25−10.67−10.83
Rice−18.69−18.94−16.40−17.34-15.74−14.93
Water area−23.75−23.28−22.91−23.14−22.94−23.07
Vegetation−19.67−16.67−17.17−17.00−15.00−15.34
Table 7. VV/VH polarization backscatter coefficient of ground objects.
19-May12-June18-July11-August16-September10-October
Artificial buildings0.450.460.380.410.400.38
Rice0.690.610.670.730.720.70
Water area0.850.820.860.880.850.85
Vegetation0.650.590.720.740.640.63
Table 8. Time-series SAR classification accuracy.
Artificial BuildingsRiceWater AreaVegetationTotalUser Accuracy (%, UA)
Artificial Buildings1701271120085.00
Rice1115652820078.00
Water area52188520094.00
Vegetation1221815920079.50
Total198191208203800
Mapping accuracy (%, PA)85.8681.6890.3878.33
Overall accuracy (OA) = 84.13%Kappa coefficient = 0.7883
Remark: PA: Producer’s Accuracy; OA: Overall Accuracy; UA: User’s Accuracy.
Table 9. Classification accuracy of time-series SAR and coherence coefficients.
Artificial BuildingsRiceWater AreaVegetationTotalUser Accuracy (%, UA)
Artificial Buildings175961020087.50
Rice916262320081.00
Water area12189820094.50
Vegetation1016516920084.50
Total195189206210800
Mapping accuracy (%, PA)89.7485.7191.7580.48
Overall accuracy (OA) = 86.87%Kappa coefficient = 0.8249
Table 10. Statistical accuracy of rice area.
Classification SchemeStatistical Area/Hectare Classification Area/HectareAccuracy%
Time series261912143581.84
Time series + coherence coefficient 261912197283.89
Publisher’s Note: MDPI stays neutral with regard to jurisdictional claims in published maps and institutional affiliations.

