
Catalytic Pyrolysis of Lignin Model Compounds (Pyrocatechol, Guaiacol, Vanillic and Ferulic Acids) over Nanoceria Catalyst for Biomass Conversion

 , ,
, ,
Abstract
:1. Introduction
2. Materials and Methods
3. Results and Discussion
3.1. FT-IR Spectroscopic Studies
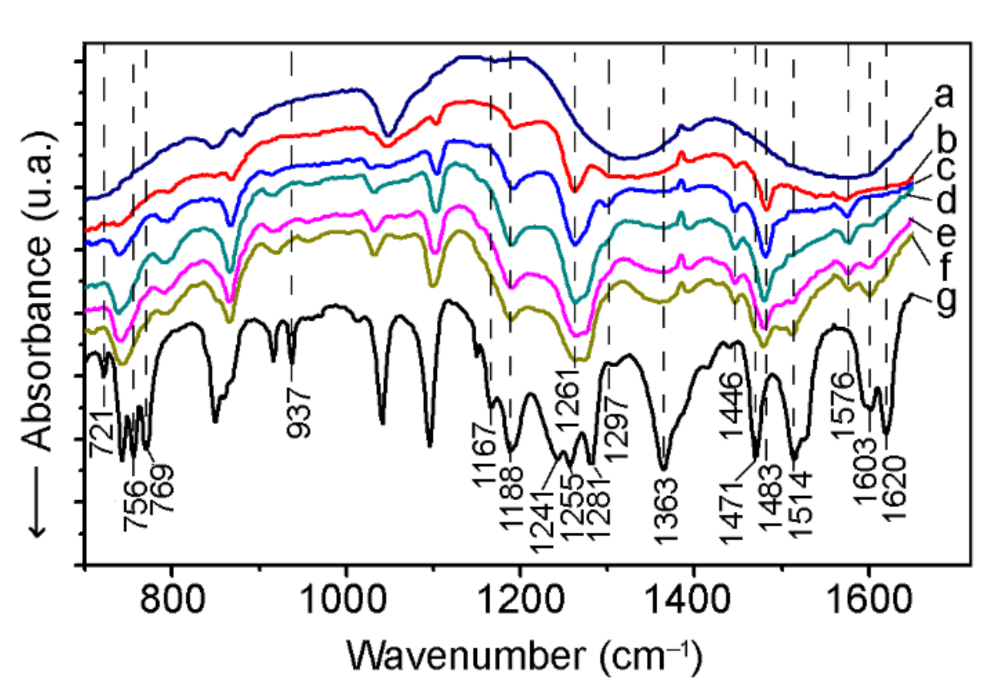
3.1.1. Pyrocatechol
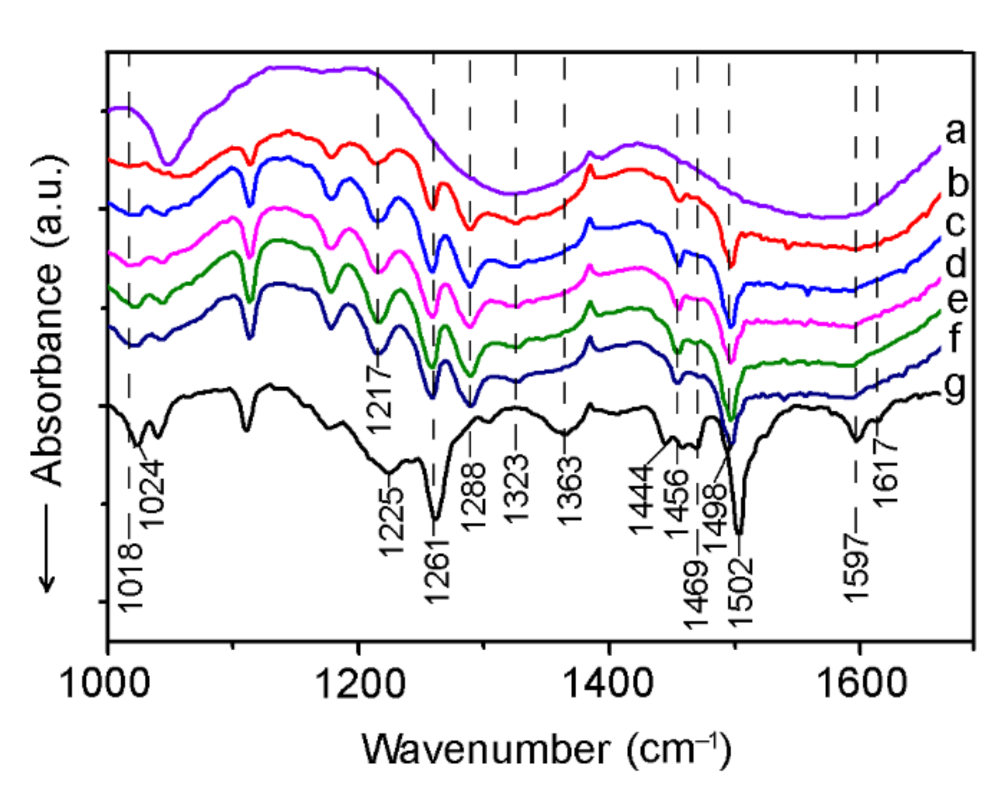
3.1.2. Guaiacol
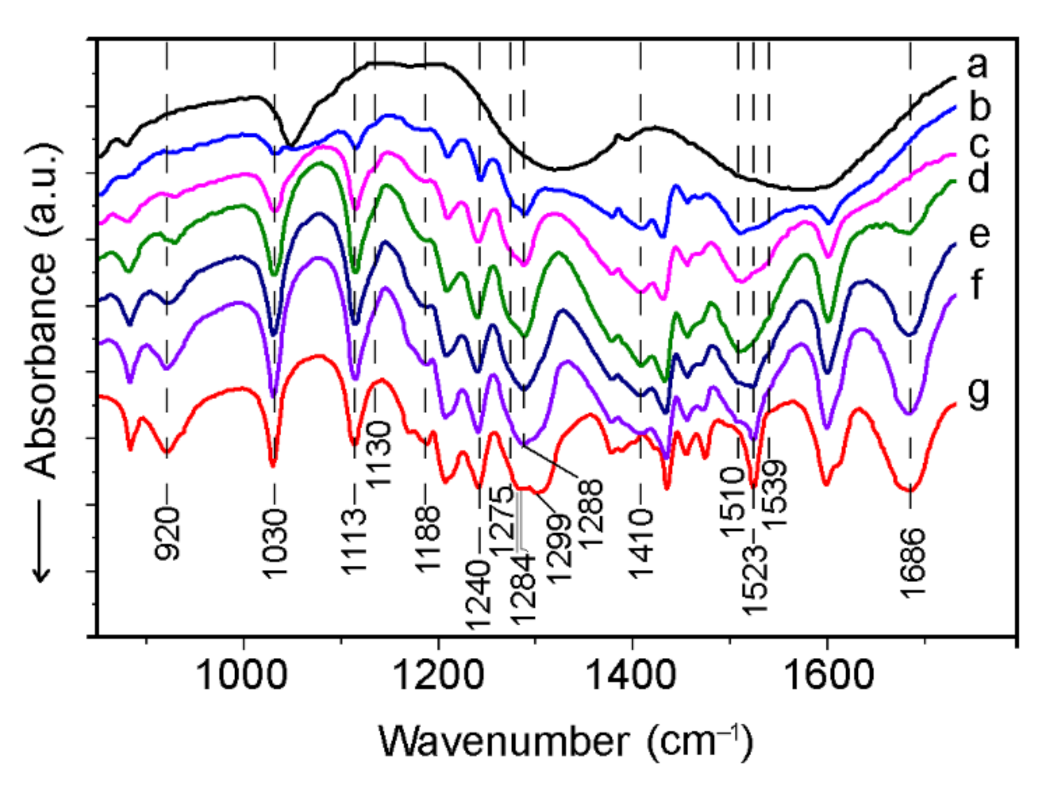
3.1.3. Vanillic Acid
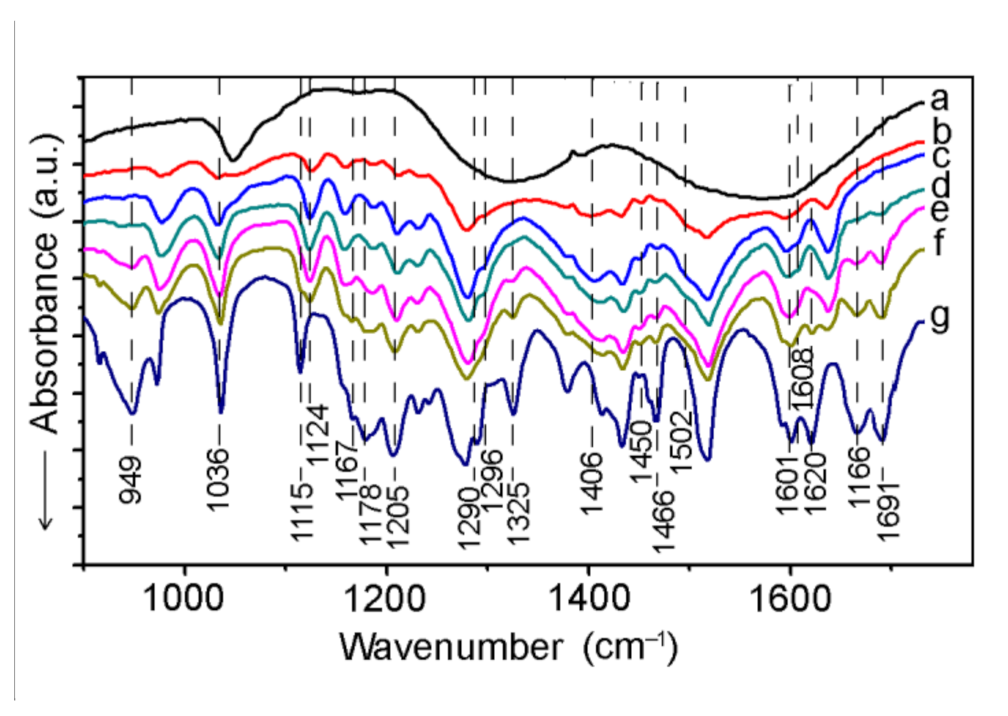
3.1.4. Ferulic Acid
3.2. Thermal Transformations of Model Lignin Compounds on the Surface of CeO2
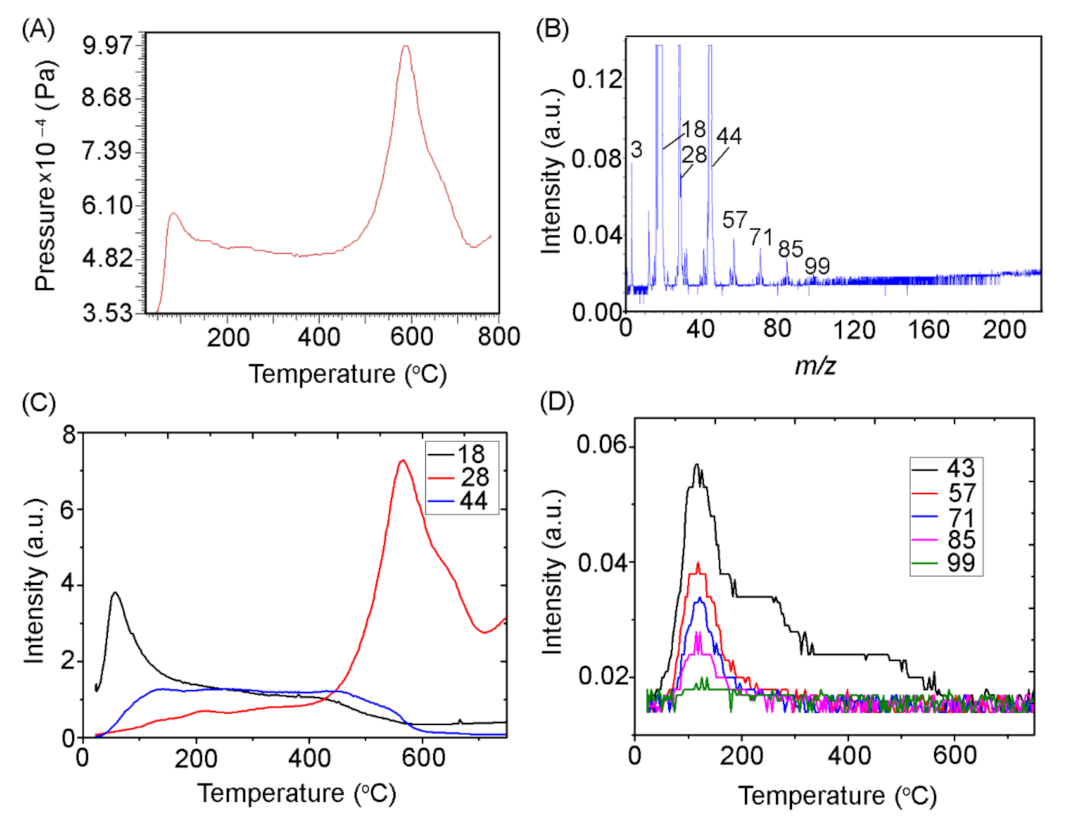
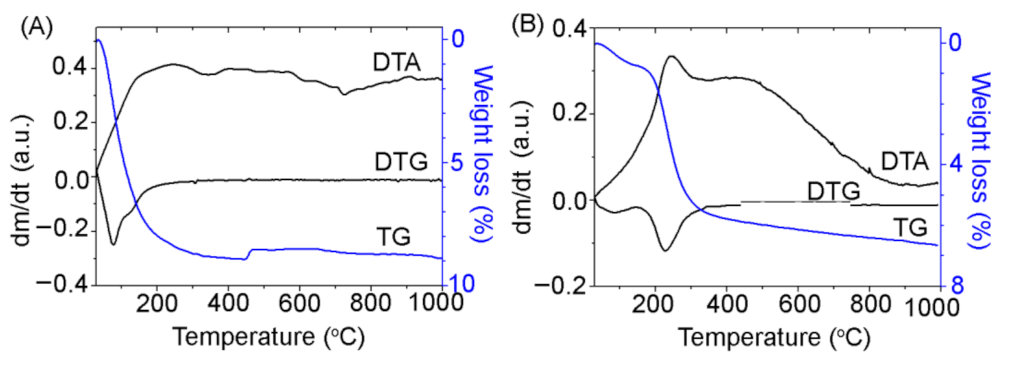
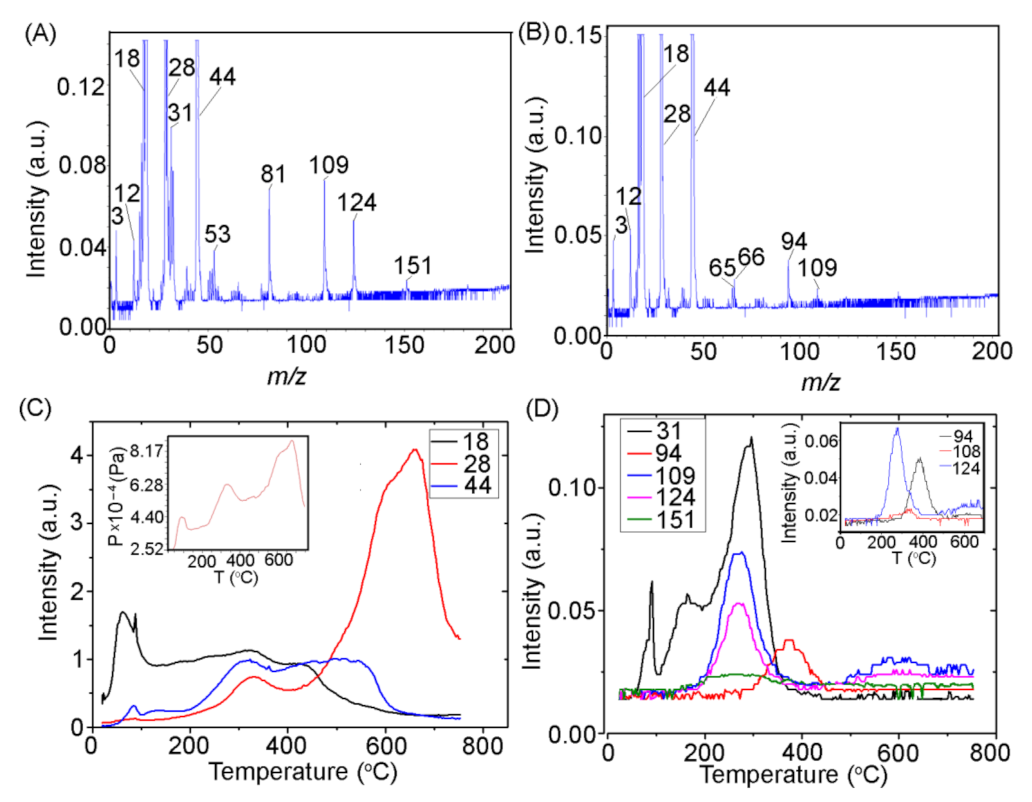
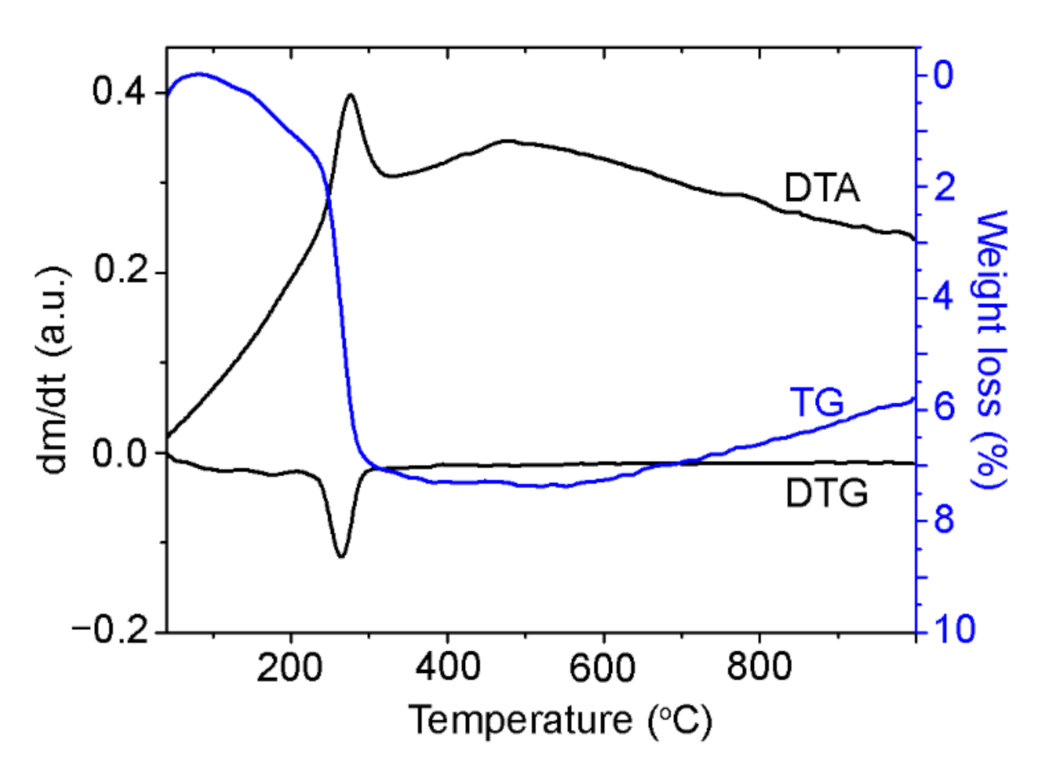
3.2.1. Pyrocatechol
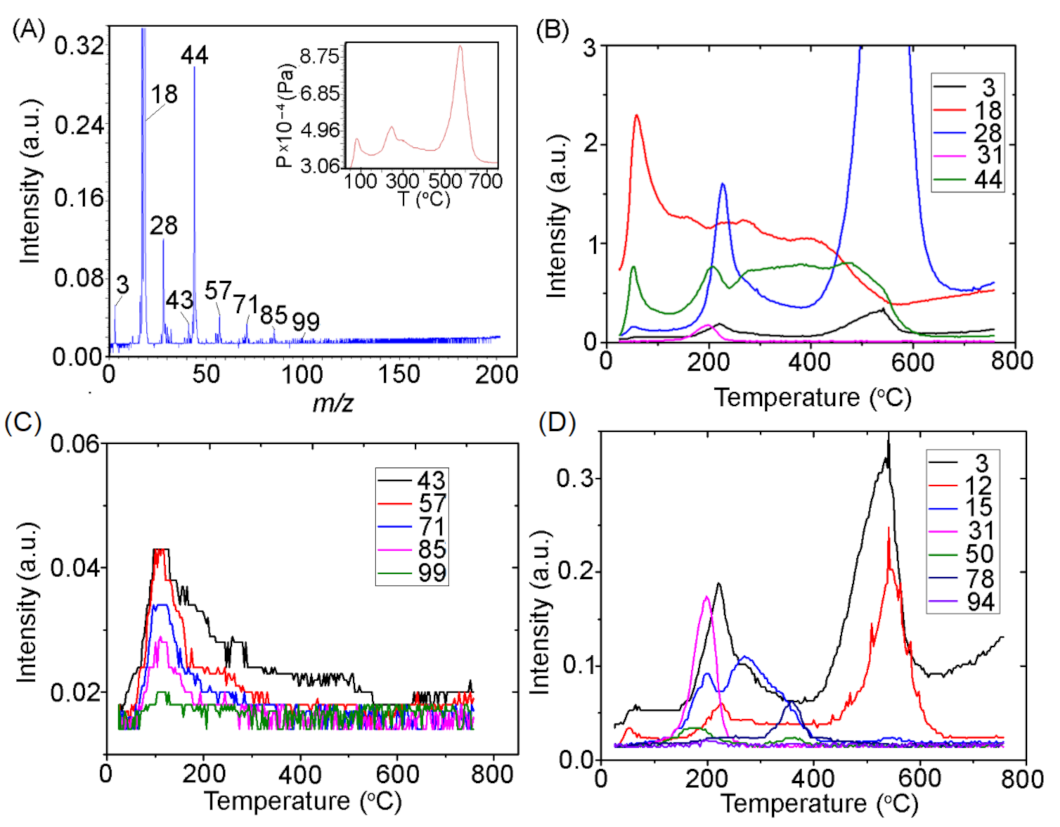
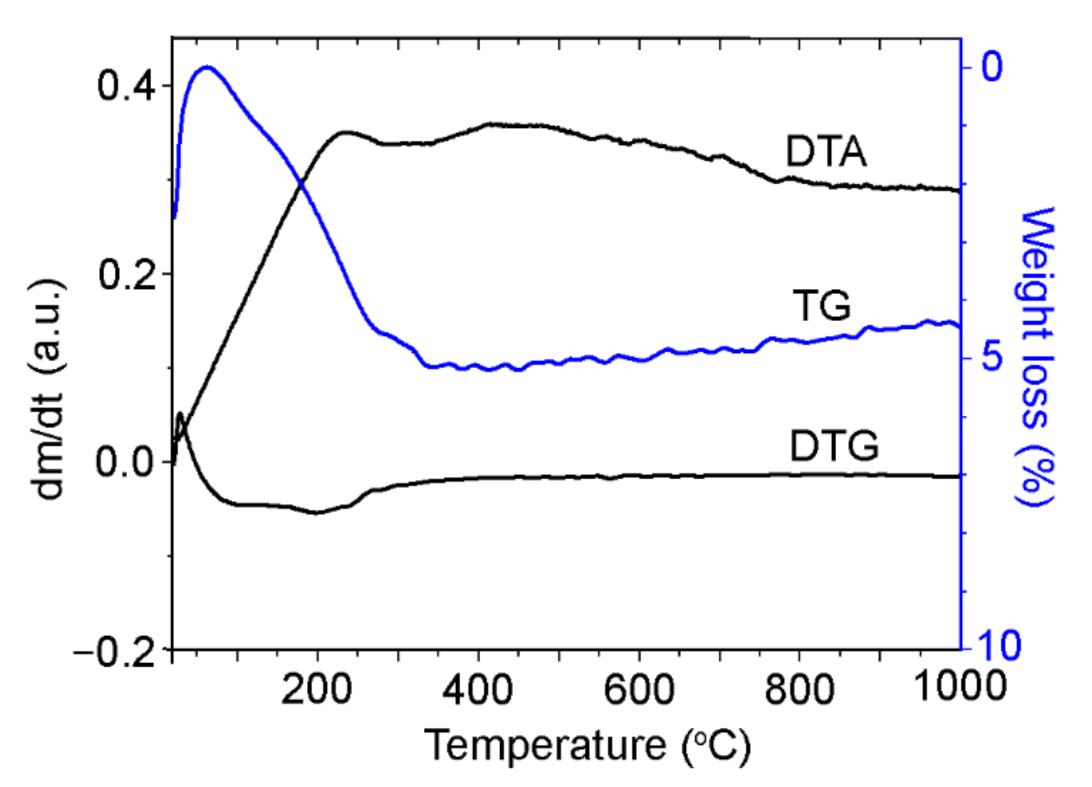
3.2.2. Guaiacol
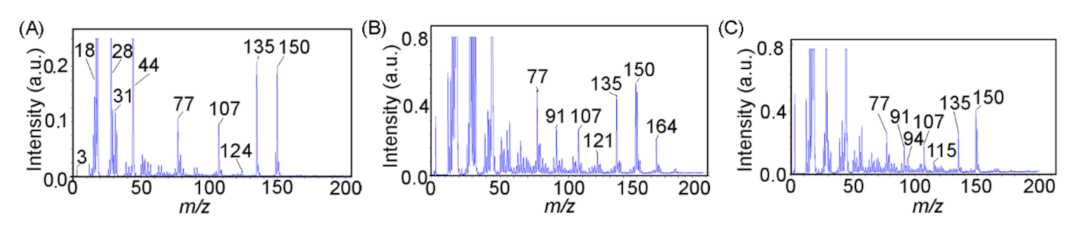
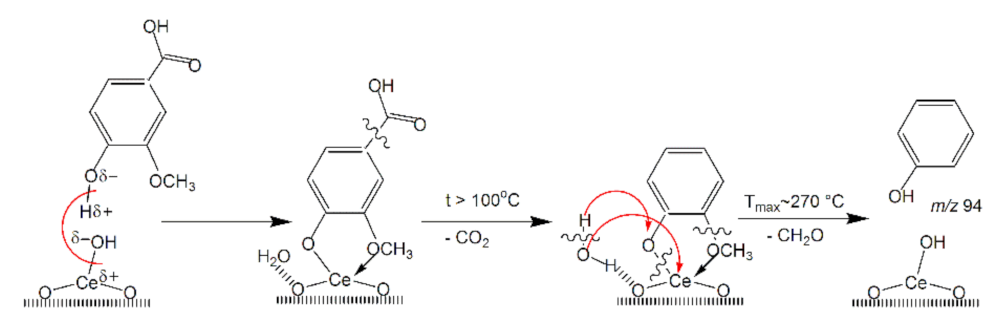
3.2.3. Vanillic Acid
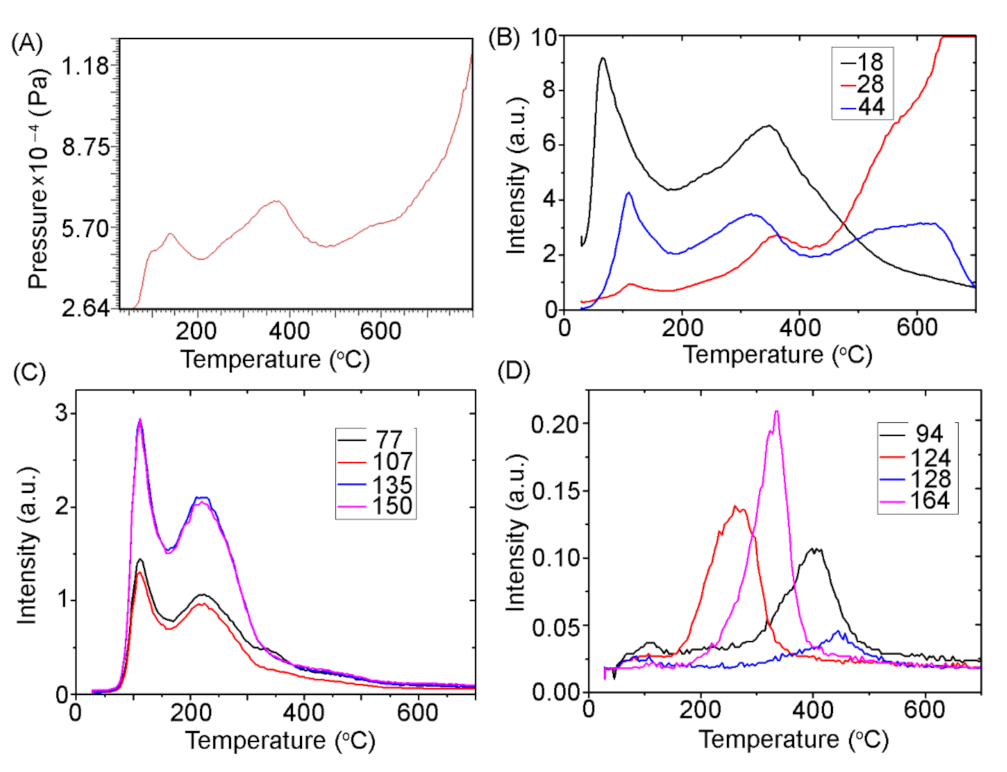
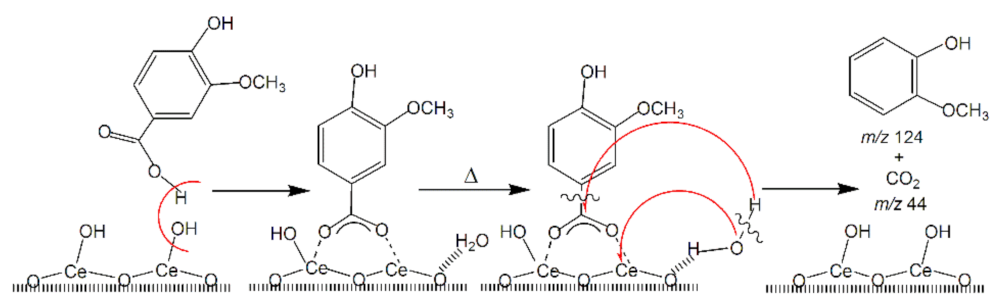
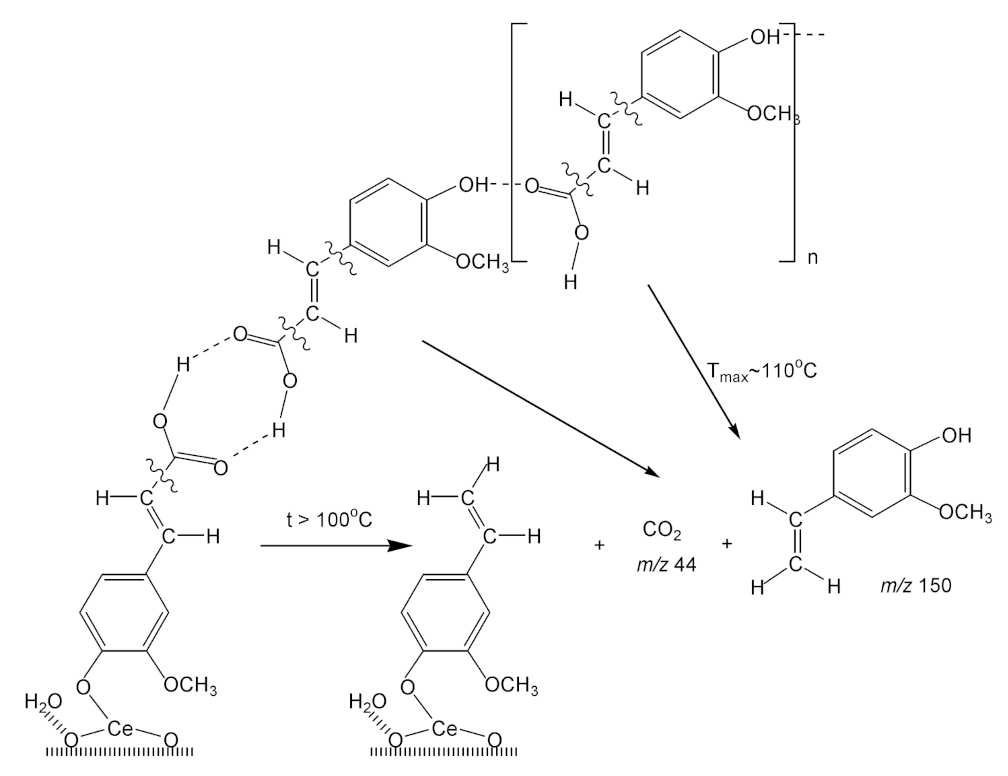
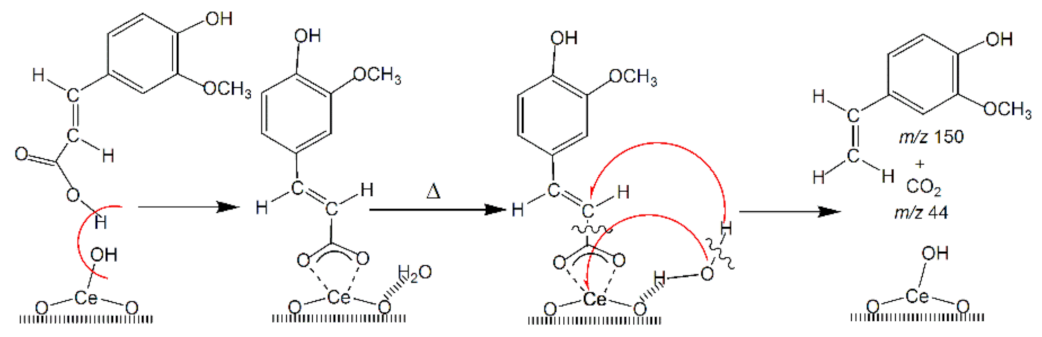
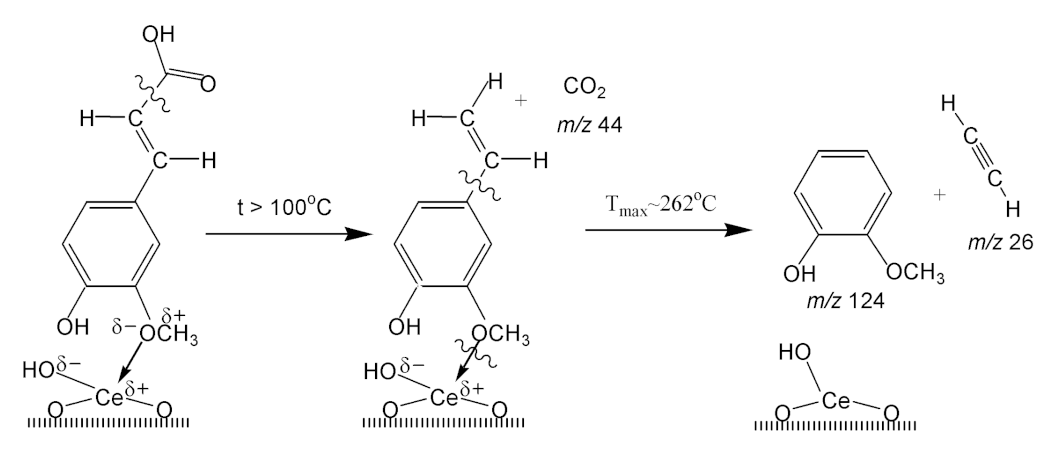
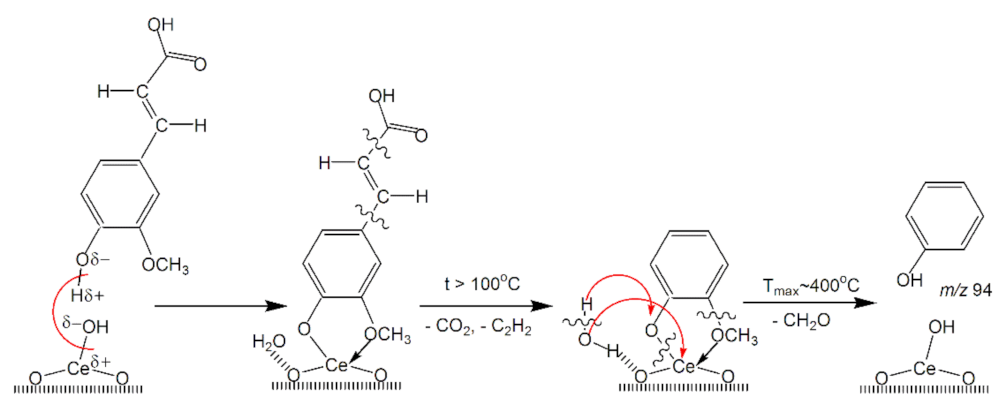
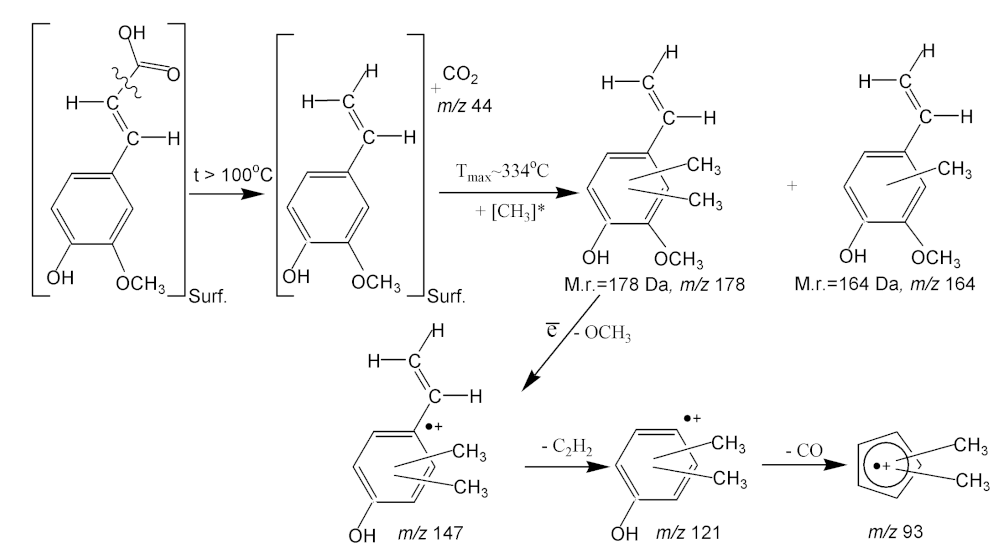
3.2.4. Ferulic Acid
3.2.5. Kinetic Parameters of the Catalytic Reactions of Vanillic and Ferulic Acids during Pyrolysis over Nanoceria Catalyst
4. Conclusions
Author Contributions
Funding
Institutional Review Board Statement
Informed Consent Statement
Data Availability Statement
Conflicts of Interest
References
- Isikgor, F.H.; Becer, C.R. Lignocellulosic biomass: A sustainable platform for the production of bio-based chemicals and polymers. Polym. Chem. 2015, 6, 4497–4559. [Google Scholar] [CrossRef] [Green Version]
- Van Wyk, J.P.H. Biotechnology and the utilization of biowaste as a resource for bioproduct development. TRENDS Biotech. 2001, 19, 172–177. [Google Scholar] [CrossRef]
- Chakar, F.S.; Ragauskas, A.J. Review of current and future softwood kraft lignin process chemistry. Ind. Crop. Prod. 2004, 20, 131–141. [Google Scholar] [CrossRef]
- Linger, J.G.; Vardon, D.R.; Guarnieri, M.T.; Karp, E.M.; Hunsinger, G.B.; Franden, M.A.; Beckham, G.T. Lignin valorization through integrated biological funneling and chemical catalysis. Proc. Natl. Acad. Sci. USA 2014, 111, 12013–12018. [Google Scholar] [CrossRef] [Green Version]
- Ragauskas, A.J.; Beckham, G.T.; Biddy, M.J.; Chandra, R.; Chen, F.; Davis, M.F.; Davison, B.H.; Dixon, R.A.; Gilna, P.; Keller, M.; et al. Lignin valorization: Improving lignin processing in the biorefinery. Science 2014, 344, 1246843. [Google Scholar] [CrossRef]
- Tuck, C.O.; Pérez, E.; Horváth, I.T.; Sheldon, R.A.; Poliakoff, M. Valorization of biomass: Deriving more value from waste. Science 2012, 337, 695–699. [Google Scholar] [CrossRef] [PubMed]
- Boerjan, W.; Ralph, J.; Baucher, M. Lignin biosynthesis. Annu. Rev. Plant Biol. 2003, 54, 519–546. [Google Scholar] [CrossRef]
- Zakzeski, J.; Bruijnincx, P.C.; Jongerius, A.L.; Weckhuysen, B.M. The catalytic valorization of lignin for the production of renewable chemicals. Chem. Rev. 2010, 110, 3552–3599. [Google Scholar] [CrossRef]
- Mathers, R.T. How well can renewable resources mimic commodity monomers and polymers? J. Polym. Sci. Part A Polym. Chem. 2012, 50, 1–15. [Google Scholar] [CrossRef]
- Zhang, Z.; Song, J.; Han, B. Catalytic transformation of lignocellulose into chemicals and fuel products in ionic liquids. Chem. Rev. 2017, 117, 6834–6880. [Google Scholar] [CrossRef] [PubMed]
- Li, G.; Luo, Z.; Wang, W.; Cen, J. A Study of the Mechanisms of Guaiacol Pyrolysis Based on Free Radicals Detection Technology. Catalysts 2020, 10, 295. [Google Scholar] [CrossRef] [Green Version]
- Yefremova, S.; Zharmenov, A.; Sukharnikov, Y.; Bunchuk, L.; Kablanbekov, A.; Anarbekov, K.; Kulik, T.; Nikolaichuk, A.; Palianytsia, B. Rice husk hydrolytic lignin transformation in carbonization process. Molecules 2019, 24, 3075. [Google Scholar] [CrossRef] [Green Version]
- Wang, H.; Tucker, M.; Ji, Y. Recent development in chemical depolymerization of lignin: A review. J. Appl. Chem. 2013, 2013, 838645. [Google Scholar] [CrossRef] [Green Version]
- Ormond, T.K.; Baraban, J.H.; Porterfield, J.P.; Scheer, A.M.; Hemberger, P.; Troy, T.P.; Ahmed, M.; Nimlos, M.R.; Robichaud, D.J.; Daily, J.W.; et al. Thermal decompositions of the lignin model compounds: Salicylaldehyde and catechol. J. Phys. Chem. A 2018, 122, 5911–5924. [Google Scholar] [CrossRef] [PubMed] [Green Version]
- González-Baró, A.C.; Parajón-Costa, B.S.; Franca, C.A.; Pis-Diez, R. Theoretical and spectroscopic study of vanillic acid. J. Mol. Struct. 2008, 889, 204–210. [Google Scholar] [CrossRef]
- Totong, S.; Daorattanachai, P.; Laosiripojana, N.; Idem, R. Catalytic depolymerization of alkaline lignin to value-added phenolic-based compounds over Ni/CeO2-ZrO2 catalyst synthesized with a one-step chemical reduction of Ni species using NaBH4 as the reducing agent. Fuel Process. Technol. 2020, 198, 106248. [Google Scholar] [CrossRef]
- Cheng, H.; Wu, S.; Huang, J.; Zhang, X. Direct evidence from in situ FTIR spectroscopy that o-quinonemethide is a key intermediate during the pyrolysis of guaiacol. Anal. Bioanal. Chem. 2017, 409, 2531–2537. [Google Scholar] [CrossRef]
- Bertero, M.; Gorostegui, H.A.; Orrabalis, C.J.; Guzmán, C.A.; Calandri, E.L.; Sedran, U. Characterization of the liquid products in the pyrolysis of residual chañar and palm fruit biomasses. Fuel 2014, 116, 409–414. [Google Scholar] [CrossRef]
- Furimsky, E. Catalytic hydrodeoxygenation. Appl Catal. A Gen. 2000, 199, 147–190. [Google Scholar] [CrossRef]
- Hemberger, P.; Custodis, V.B.; Bodi, A.; Gerber, T.; van Bokhoven, J.A. Understanding the mechanism of catalytic fast pyrolysis by unveiling reactive intermediates in heterogeneous catalysis. Nature Commun. 2017, 8, 15946. [Google Scholar] [CrossRef]
- Mathew, S.; Abraham, T.E.; Sudheesh, S. Rapid conversion of ferulic acid to 4-vinyl guaiacol and vanillin metabolites by Debaryomyces hansenii. J. Mol. Catal. B Enzym. 2007, 44, 48–52. [Google Scholar] [CrossRef]
- Fiddler, W.; Parker, W.E.; Wasserman, A.E.; Doerr, R.C. Thermal decomposition of ferulic acid. J. Agric. Food Chem. 1967, 15, 757–761. [Google Scholar] [CrossRef]
- Kulik, T.V.; Barvinchenko, V.N.; Palyanytsya, B.B.; Lipkovska, N.A.; Dudik, O.O. Thermal transformations of biologically active derivatives of cinnamic acid by TPD MS investigation. J. Anal. Appl. Pyrol. 2011, 90, 219–223. [Google Scholar] [CrossRef]
- Zhang, P.H.; Yu, X.Y.; Weng, L.X.; Sun, L.L.; Mao, Z.C.; Zhang, Y.L. Degradation of Ferulic Acid by the Endophytic Fungus Colletotrichum gloeosporioides TMTM-13 Associated with Ostrya rehderiana Chun. ACS Omega 2019, 4, 21000–21004. [Google Scholar] [CrossRef] [PubMed] [Green Version]
- Lesage-Meessen, L.; Haon, M.; Delattre, M.; Thibault, J.F.; Ceccaldi, B.C.; Asther, M. An attempt to channel the transformation of vanillic acid into vanillin by controlling methoxyhydroquinone formation in Pycnoporus cinnabarinus with cellobiose. Appl. Microbiol. Biotechnol. 1997, 47, 393–397. [Google Scholar] [CrossRef]
- Abdelkafi, S.; Sayadi, S.; Ali Gam, Z.B.; Casalot, L.; Labat, M. Bioconversion of ferulic acid to vanillic acid by Halomonas elongata isolated from table-olive fermentation. FEMS Microbiol. Lett. 2006, 262, 115–120. [Google Scholar] [CrossRef] [Green Version]
- Ye, M.; Yue, T.; Yuan, Y. Evolution of polyphenols and organic acids during the fermentation of apple cider. J. Sci. Food Agric. 2014, 94, 2951–2957. [Google Scholar] [CrossRef]
- De Heredia, J.B.; Torregrosa, J.; Dominguez, J.R.; Peres, J.A. Kinetic model for phenolic compound oxidation by Fenton’s reagent. Chemosphere 2001, 45, 85–90. [Google Scholar] [CrossRef]
- Fiorentino, A.; Gentili, A.; Isidori, M.; Monaco, P.; Nardelli, A.; Parrella, A.; Temussi, F. Environmental effects caused by olive mill wastewaters: Toxicity comparison of low-molecular-weight phenol components. J. Agric. Food Chem. 2003, 51, 1005–1009. [Google Scholar] [CrossRef]
- Sayadi, S.; Allouche, N.; Jaoua, M.; Aloui, F. Detrimental effects of high molecular-mass polyphenols on olive mill wastewater biotreatment. Process Biochem. 2000, 35, 725–735. [Google Scholar] [CrossRef]
- Ramos-Cormenzana, A.; Juarez-Jimenez, B.; Garcia-Pareja, M.P. Antimicrobial activity of olive mill wastewaters (alpechin) and biotransformed olive oil mill wastewater. Int. Biodeterior. Biodegrad. 1996, 38, 283–290. [Google Scholar] [CrossRef]
- Xie, X.G.; Dai, C.C. Degradation of a model pollutant ferulic acid by the endophytic fungus Phomopsis liquidambari. Biores. Technol. 2015, 179, 35–42. [Google Scholar] [CrossRef]
- Sudarsanam, P.; Peeters, E.; Makshina, E.V.; Parvulescu, V.I.; Sels, B.F. Advances in porous and nanoscale catalysts for viable biomass conversion. Chem. Soc. Rev. 2019, 48, 2366–2421. [Google Scholar] [CrossRef]
- Kabakcı, S.B.; Hacıbektaşoğlu, Ş. Catalytic Pyrolysis of Biomass. Pyrolysis 2017, 7, 167–196. [Google Scholar] [CrossRef] [Green Version]
- Schimming, S.M.; LaMont, O.D.; König, M.; Rogers, A.K.; D’Amico, A.D.; Yung, M.M.; Sievers, C. Hydrodeoxygenation of guaiacol over ceria–zirconia catalysts. ChemSusChem 2015, 8, 2073–2083. [Google Scholar] [CrossRef]
- Deng, W.; Zhang, H.; Wu, X.; Li, R.; Zhang, Q.; Wang, Y. Oxidative conversion of lignin and lignin model compounds catalyzed by CeO2-supported Pd nanoparticles. Green Chem. 2015, 17, 5009–5018. [Google Scholar] [CrossRef]
- Ohta, H.; Kobayashi, H.; Hara, K.; Fukuoka, A. Hydrodeoxygenation of phenols as lignin models under acid-free conditions with carbon-supported platinum catalysts. Chem. Commun. 2011, 47, 12209–12211. [Google Scholar] [CrossRef] [Green Version]
- Grams, J.; Niewiadomski, M.; Ryczkowski, R.; Ruppert, A.M.; Kwapiński, W. Activity and characterization of Ni catalyst supported on CeO2–ZrO2 for thermo-chemical conversion of cellulose. Int. J. Hydrogen Energy 2016, 41, 8679–8687. [Google Scholar] [CrossRef]
- Song, W.L.; Dong, Q.; Hong, L.; Tian, Z.Q.; Tang, L.N.; Hao, W.; Zhang, H. Activating molecular oxygen with Au/CeO2 for the conversion of lignin model compounds and organosolv lignin. RSC Adv. 2019, 9, 31070–31077. [Google Scholar] [CrossRef] [Green Version]
- Yoshikawa, T.; Shinohara, S.; Yagi, T.; Ryumon, N.; Nakasaka, Y.; Tago, T.; Masuda, T. Production of phenols from lignin-derived slurry liquid using iron oxide catalyst. Appl. Catal. B Environ. 2014, 146, 289–297. [Google Scholar] [CrossRef] [Green Version]
- Fronzi, M.; Soon, A.; Delley, B.; Traversa, E.; Stampfl, C. Stability and morphology of cerium oxide surfaces in an oxidizing environment: A first-principles investigation. J. Chem. Phys. 2009, 131, 104701. [Google Scholar] [CrossRef] [Green Version]
- Spanier, J.E.; Robinson, R.D.; Zhang, F.; Chan, S.W.; Herman, I.P. Size-dependent properties of CeO2−y nanoparticles as studied by Raman scattering. Phys. Rev. B 2001, 64, 245407. [Google Scholar] [CrossRef] [Green Version]
- Mortensen, P.M.; Grunwaldt, J.D.; Jensen, P.A.; Jensen, A.D. Screening of catalysts for hydrodeoxygenation of phenol as a model compound for bio-oil. ACS Catal. 2013, 3, 1774–1785. [Google Scholar] [CrossRef]
- Zaytseva, Y.A.; Panchenko, V.N.; Simonov, M.; Shutilov, A.; Zenkovets, G.; Renz, M.; Simakova, I. Effect of Gas Atmosphere on Catalytic Behaviour of Zirconia, Ceria and Ceria Zirconia Catalysts in Valeric Acid Ketonization. Top. Catal. 2013, 56, 846–855. [Google Scholar] [CrossRef] [Green Version]
- Kulyk, K.; Palianytsia, B.; Alexander, J.; Azizova, L.; Borysenko, M.; Larsson, M.; Kartel, M.; Kulik, T. Kinetics of Valeric Acid Ketonization and Ketenization in Catalytic Pyrolisis on Nanosized SiO2, γ-Al2O3 CeO2/SiO2, Al2O3/TiO2 and TiO2/Al2O3. Chem. Phys. Chem. 2017, 18, 1943–1955. [Google Scholar] [CrossRef] [PubMed]
- Kulik, T.; Palianytsia, B.; Larsson, M. Catalytic Pyrolysis of Aliphatic Carboxylic Acids into Symmetric Ketones over Ceria-Based Catalysts: Kinetics, Isotope Effect and Mechanism. Catalysts 2020, 10, 179. [Google Scholar] [CrossRef] [Green Version]
- Lange, J.P.; Price, R.; Ayoub, P.M.; Louis, J.; Petrus, L.; Clarke, L.; Gosselink, H. Valeric biofuels: A platform of cellulosic transportation fuels. Angew. Chem. Int. Ed. 2010, 49, 4479–4483. [Google Scholar] [CrossRef] [PubMed]
- Li, S.; Deng, W.; Wang, S.; Wang, P.; An, D.; Li, Y.; Zhang, Q.; Wang, Y. Catalytic transformation of cellulose and its derivatives into functionalized organic acids. ChemSusChem 2018, 11, 1995–2028. [Google Scholar] [CrossRef]
- Barvinchenko, V.N.; Lipkovskaya, N.A.; Kulik, T.V. Adsorption of Natural 3-Phenylpropenic Acids on Cerium Dioxide Surface. Colloid J. 2019, 81, 1–7. [Google Scholar] [CrossRef]
- Kulik, T.V.; Lipkovska, N.A.; Barvinchenko, V.N.; Palyanytsya, B.B.; Kazakova, O.A.; Dovbiy, O.A.; Pogorelyi, V.K. Interactions between bioactive ferulic acid and fumed silica by UV–vis spectroscopy, FT–IR, TPD MS investigation and quantum chemical methods. J. Colloid Interface Sci. 2009, 339, 60–68. [Google Scholar] [CrossRef]
- Janković, I.A.; Šaponjić, Z.V.; Čomor, M.I.; Nedeljković, J.M. Surface modification of colloidal TiO2 nanoparticles with bidentate benzene derivatives. J. Phys. Chem. C 2009, 113, 12645–12652. [Google Scholar] [CrossRef]
- Connor, P.A.; Dobson, K.D.; McQuillan, A.J. New sol-gel attenuated total reflection infrared spectroscopic method for analysis of adsorption at metal oxide surfaces in aqueous solutions. Chelation of TiO2, ZrO2, and Al2O3 surfaces by catechol, 8-quinolinol, and acetylacetone. Langmuir 1995, 11, 4193–4195. [Google Scholar] [CrossRef]
- Bobkova, E.Y.; Vasilyeva, V.S.; Ksenofontov, M.A.; Ostrovskaya, L.E.; Shundalov, M.B. Spectral and energy characteristics of dihydroxybenzenes in the crystalline state. Bull. BSU Ser. Phys. 2009, 3, 7–13. [Google Scholar]
- Nelson, N.C.; Manzano, J.S.; Sadow, A.D.; Overbury, S.H.; Slowing, I.I. Selective hydrogenation of phenol catalyzed by palladium on high-surface-area ceria at room temperature and ambient pressure. ACS Catal. 2015, 5, 2051–2061. [Google Scholar] [CrossRef] [Green Version]
- Singh, V.; Naka, T.; Takami, S.; Sahraneshin, A.; Togashi, T.; Aoki, N.; Adschiri, T. Hydrothermal synthesis of inorganic–organic hybrid gadolinium hydroxide nanoclusters with controlled size and morphology. Dalton Trans. 2013, 42, 16176–16184. [Google Scholar] [CrossRef]
- Huang, W.; Jiang, P.; Wei, C.; Zhuang, D.; Shi, J. Low-temperature one-step synthesis of covalently chelated ZnO/dopamine hybrid nanoparticles and their optical properties. J. Mater. Res. 2008, 23, 1946–1952. [Google Scholar] [CrossRef]
- Hachani, R.; Lowdell, M.; Birchall, M.; Hervault, A.; Mertz, D.; Begin-Colin, S.; Thanh, N.T.K. Polyol synthesis, functionalisation, and biocompatibility studies of superparamagnetic iron oxide nanoparticles as potential MRI contrast agents. Nanoscale 2016, 8, 3278–3287. [Google Scholar] [CrossRef] [PubMed] [Green Version]
- Togashi, T.; Naka, T.; Asahina, S.; Sato, K.; Takami, S.; Adschiri, T. Surfactant-assisted one-pot synthesis of superparamagnetic magnetite nanoparticle clusters with tunable cluster size and magnetic field sensitivity. Dalton Trans. 2011, 40, 1073–1078. [Google Scholar] [CrossRef]
- Dugandžić, I.M.; Jovanović, D.J.; Mančić, L.T.; Zheng, N.; Ahrenkiel, S.P.; Milošević, O.B.; Nedeljković, J.M. Surface modification of submicronic TiO2 particles prepared by ultrasonic spray pyrolysis for visible light absorption. J. Nanopart. Res. 2012, 14, 1157. [Google Scholar] [CrossRef]
- Janković, I.A.; Šaponjić, Z.V.; Džunuzović, E.S.; Nedeljković, J.M. New hybrid properties of TiO 2 nanoparticles surface modified with catecholate type ligands. Nanoscale Res. Lett. 2010, 5, 81–88. [Google Scholar] [CrossRef] [Green Version]
- Savić, T.D.; Janković, I.A.; Šaponjić, Z.V.; Čomor, M.I.; Veljković, D.Ž.; Zarić, S.D.; Nedeljković, J.M. Surface modification of anatase nanoparticles with fused ring catecholate type ligands: A combined DFT and experimental study of optical properties. Nanoscale 2012, 4, 1612–1619. [Google Scholar] [CrossRef]
- Wang, X.; Zhu, S.; Wang, S.; Wang, J.; Fan, W.; Lv, Y. Ni nanoparticles entrapped in nickel phyllosilicate for selective hydrogenation of guaiacol to 2-methoxycyclohexanol. Appl. Catal. A Gen. 2018, 568, 231–241. [Google Scholar] [CrossRef]
- Wang, X.; Zhu, S.; Wang, S.; He, Y.; Liu, Y.; Wang, J.; Lv, Y. Low temperature hydrodeoxygenation of guaiacol into cyclohexane over Ni/SiO2 catalyst combined with Hβ zeolite. RSC Adv. 2019, 9, 3868–3876. [Google Scholar] [CrossRef] [Green Version]
- Nakanishi, K. Infrared Adsorption Spectroscopy; Practical; Holden Day: San Francisco, CA, USA, 1962; p. 216. [Google Scholar]
- Clavijo, E.; Menéndez, J.R.; Aroca, R. Vibrational and surface-enhanced Raman spectra of vanillic acid. J. Raman Spectrosc. Int. J. Orig. Work Asp. Raman Spectrosc. Incl. High. Order Process. Brillouin Rayleigh Scatt. 2008, 39, 1178–1182. [Google Scholar] [CrossRef] [Green Version]
- Khvan, A.M.; Kristallovich, E.L.; Abduazimov, K.A. Complexation of caffeic and ferulic acids by transition-metal ions. Chem. Nat. Comp. 2001, 37, 72–75. [Google Scholar] [CrossRef]
- Sharpe, E.; Frasco, T.; Andreescu, D.; Andreescu, S. Portable ceria nanoparticle-based assay for rapid detection of food antioxidants (NanoCerac). Analyst 2013, 138, 249–262. [Google Scholar] [CrossRef] [Green Version]
- Palacios, E.G.; Juárez-López, G.; Monhemius, A.J. Infrared spectroscopy of metal carboxylates: II. Analysis of Fe (III), Ni and Zn carboxylate solutions. Hydrometallurgy 2004, 72, 139–148. [Google Scholar] [CrossRef]
- Yost, E.C.; Tejedor-Tejedor, M.I.; Anderson, M.A. In situ CIR-FTIR characterization of salicylate complexes at the goethite/aqueous solution interface. Environ. Sci. Technol. 1990, 24, 822–828. [Google Scholar] [CrossRef]
- Tunesi, S.; Anderson, M.A. Surface effects in photochemistry: An in situ cylindrical internal reflection-Fourier transform infrared investigation of the effect of ring substituents on chemisorption onto titania ceramic membranes. Langmuir 1992, 8, 487–495. [Google Scholar] [CrossRef]
- Parrino, F.; Augugliaro, V.; Camera-Roda, G.; Loddo, V.; López-Muñoz, M.J.; Márquez-Álvarez, C.; Palmisano, G.; Palmisano, L.; Puma, M.A. Visible-light-induced oxidation of trans-ferulic acid by TiO2 photocatalysis. J. Catal. 2012, 295, 254–260. [Google Scholar] [CrossRef] [Green Version]
- Sebastian, S.; Sundaraganesan, N.; Manoharan, S. Molecular structure, spectroscopic studies and first-order molecular hyperpolarizabilities of ferulic acid by density functional study. Spectrochim. Acta A 2009, 74, 312–323. [Google Scholar] [CrossRef]
- Ferrer, E.G.; Salinas, M.V.; Correa, M.J.; Vrdoljak, F.; Williams, P.A.M. ALP Inhibitors: Vanadyl(IV) Complexes of Ferulic and Cinnamic Acid. Z. Naturforsch 2005, 305–311. [Google Scholar] [CrossRef]
- Kalinowska, M.; Piekut, J.; Bruss, A.; Follet, C.; Sienkiewicz-Gromiuk, J.; Świsłocka, R.; Rzączyńska, Z.; Lewandowski, W. Spectroscopic (FT-IR, FT-Raman,1H,13C NMR, UV/VIS), thermogravimetric and antimicrobial studies of Ca(II), Mn(II),Cu(II), Zn(II) and Cd(II) complexes of ferulic acid. Spectrochim. Acta A Mol. Biomol. Spectrosc. 2014, 122, 631–638. [Google Scholar] [CrossRef] [PubMed]
- Świsłocka, R.; Regulska, E.; Samsonowicz, M.; Lewandowski, W. Experimental and theoretical study on benzoic acid derivatives. J. Molec. Struct. 2013, 1044, 181–187. [Google Scholar] [CrossRef]
- Lebedev, A.T. Mass Spectrometry in Organic Chemistry; Binom: Moscow, Russia, 2003; p. 493. [Google Scholar]
- Zhao, C.; He, J.; Lemonidou, A.A.; Li, X.; Lercher, J.A. Aqueous-phase hydrodeoxygenation of bio-derived phenols to cycloalkanes. J. Catal. 2011, 280, 8–16. [Google Scholar] [CrossRef]
- Sharma, R.K.; Bakhshi, N.N. Catalytic upgrading of biomass-derived oils to transportation fuels and chemicals. Can. J. Chem. Eng. 1991, 69, 1071–1081. [Google Scholar] [CrossRef]
- Nastasiienko, N.; Palianytsia, B.; Kartel, M.; Larsson, M.; Kulik, T. Thermal Transformation of Caffeic Acid on the Nanoceria Surface Studied by Temperature Programmed Desorption Mass-Spectrometry, Thermogravimetric Analysis and FT–IR Spectroscopy. Colloids Interfaces 2019, 3, 34. [Google Scholar] [CrossRef] [Green Version]
- Kulik, T.V.; Lipkovska, N.O.; Barvinchenko, V.M.; Palyanytsya, B.B.; Kazakova, O.A.; Dudik, O.O.; Menyhárd, A.; László, K. Thermal transformation of bioactive caffeic acid on fumed silica seen by UV–Vis spectroscopy, thermogravimetric analysis, temperature programmed desorption mass spectrometry and quantum chemical methods. J. Colloid Interface Sci. 2016, 470, 132–141. [Google Scholar] [CrossRef]
- Sato, S.; Koizumi, K.; Nozaki, F. Ortho-selective methylation of phenol over CeO2 catalyst. Appl. Catal. A Gen. 1995, 133, L7–L10. [Google Scholar] [CrossRef]
- Wandas, R.; Surygala, J.; Śliwka, E. Conversion of cresols and naphthalene in the hydroprocessing of three-component model mixtures simulating fast pyrolysis tars. Fuel 1996, 75, 687–694. [Google Scholar] [CrossRef]
- NIST Chemistry Web Book. NIST Standard Reference Database Number 69. Available online: https://webbook.nist.gov/chemistry (accessed on 24 June 2021).
- Kulyk, K.; Ishchenko, V.; Palyanytsya, B.; Khylya, V.; Borysenko, M.; Kulyk, T. A TPD-MS study of the interaction of coumarins and their heterocyclic derivatives with a surface of fumed silica and nanosized oxides CeO2/SiO2, TiO2/SiO2, Al2O3/SiO2. J. Mass Spectrom. 2010, 45, 750–761. [Google Scholar] [CrossRef] [PubMed]
- Kulik, T.V.; Barvinchenko, V.N.; Palyanitsa, B.B.; Smirnova, O.V.; Pogorelyi, V.K.; Chuiko, A.A. A desorption mass spectrometry study of the interaction of cinnamic acid with a silica surface. Russ. J. Phys. Chem. 2007, 8, 83–90. [Google Scholar] [CrossRef]


| Assignments | Frequency (cm−1) | Ref. | |
|---|---|---|---|
| P | P/СеО2 | ||
| β(СН) | 721 | – | [53] |
| β(СН) | 937 | – | [53] |
| δ(OH) + δ(CH)) | 756 | – | [53] |
| ν(CC) + ν(CO) + β(CCC)) | 769 | – | [53] |
| ν(CO) + ν(CC) + β(CCH) | 1167 | – | [53] |
| β(CCH) + ν(CC) + β(COH) | 1188 | 1188 | [51,53] |
| β(CCH) + β(COH) + ν(CC) | 1242 | – | [53] |
| β(CCH) + β(COH) + ν(CC) | 1255 | 1261 | [51,53] |
| ν(CC) + ν(CO) + β(CCC) | 1281 | – | [51,53] |
| β(CCH) + β(COH) + ν(CC) | 1363 | 1361 | [53] |
| β(COH) + ν(CО) | – | 1273 * | |
| ν(CО)- | – | 1297 | |
| β(CCH) + ν(СС) + β(COH) + β(CCO) | 1440 | 1446 | [53] |
| ν(СС) + β(CH) | 1471 | – | [53] |
| ν(СС) + β(CH) | – | 1483 | |
| ν(СС) + β(CH) | 1514 | 1514 * | [53] |
| ν(СС) + β(CH) | – | 1576 | |
| ν(СС) + β(CH) | 1603 | 1603 * | [53] |
| ν(СС) + β(CH) | 1620 | – | [53] |
| Assignments | Frequency (cm−1) | Ref. | |
|---|---|---|---|
| G | G/СеО2 | ||
| νs(СОСН3) | 1024 | 1018 | [63] |
| νаs(СОСН3) | 1225 | 1217 | [63] |
| ν(CОН) | 1261 | 1261 | [63] |
| ν(CО)- | – | 1288 | [63] |
| ν(CО)- | – | 1323 | [63] |
| β(СОН) | 1363 | – | [63] |
| β(СН3) | 1444 | – | [63] |
| β(СН3) | 1469 | – | [63] |
| ν(CC) + β(СН3) | 1458 | 1456 | [63] |
| ν(CO) | 1508 | 1498 | [63] |
| ν(CC) | 1597 | 1595 | [63] |
| ν(CC) | 1617 | – | [63] |
| Assignments | Frequency (cm−1) | Ref. | |
|---|---|---|---|
| VA | VA/СеО2 | ||
| δ(СOН) | 920 | - * | [15] |
| νs(СОСН3) | 1030 | 1018 | [15] |
| β(СН3) | 1113 | 1113 | [61] |
| β(СН3) | 1188 | 1188 | [15,65] |
| νаs(СОСН3) | 1240 | 1240 | [15] |
| ν(СОар) | 1284 | 1288 | [15] |
| ν(CОH) + β(OH) | 1299 | - | [15] |
| ν(CО)- | - | 1275 | |
| β(СН3) | 1456 | 1456 | [15,65] |
| β(СН3) | 1473 | 1467 | [15,65] |
| νs(СОО−) | - | 1410 | |
| νas(СОО−) | - | 1539 | |
| ν(C = O) | 1686 | - * | [15] |
| Assignments | Frequency (cm−1) | Ref. | |
|---|---|---|---|
| FA | FA/СеО2 | ||
| δ(СOН) | 920 | - | [64,74] |
| νs(СОСН3) | 1036 | 1034 | [72,73] |
| β(СН3) | 1115 | 1124 | [73] |
| β(ОН)ар | 1167 | - | [73] |
| β(ОН)ар | 1178 | - | [73] |
| νаs(СОСН3) | 1205 | 1211 | [72,73] |
| ν(СО)ар | 1290 | - | [72,73] |
| ν(CО)ар− | - | 1296 | |
| ν(CО) | - | 1405 | |
| νs(СОО−) | 1450 | ||
| β(СН3) | 1466 | 1468 | [64,72] |
| νаs(СОО−) | - | 1502 | |
| ν(СС)ар | 1601 | 1601 | [72] |
| ν(C = О) | - | 1608 | |
| ν(С = С) | 1620 | 1637 | [72] |
| νs(СОО−) | 1666 | - | [72] |
| νs(СОО−) | 1691 | - | [72] |
| Sample | Stage | Tmax (°С) | Volatiles (%) | Char (%) |
|---|---|---|---|---|
| P/СеО2 | I | 85 | 8.4 | 19.3 |
| II | 224 | 72.3 | ||
| Σ(I + II) | 80.7 |
| Sample | Stage | Tmax (°С) | Volatiles (%) | Char (%) |
|---|---|---|---|---|
| G/СеО2 | I | 100 | 20.3 | 30.4 |
| II | 180 | 49.3 | ||
| Σ(I + II) | 69.6 |
| Sample | Stage | Tmax (°С) | Volatiles (%) | Char (%) |
|---|---|---|---|---|
| VA/СеО2 | I | 115 | 4.3 | 21.8 |
| VA/СеО2 | II | 175 | 10.9 | |
| VA/СеО2 | III | 265 | 63.0 | |
| VA/СеО2 | Σ(I + II + III) | 78.2 |
| Sample | Stage | Tmax (°С) | Volatiles (%) | Char (%) |
|---|---|---|---|---|
| FA/СеО2 | I | 120 | 7.7 | 12.6 |
| II | 158 | 11.5 | ||
| III | 219 | 23.0 | ||
| IV | 259 | 45.2 | ||
| Σ(I–IV) | 87.4 |
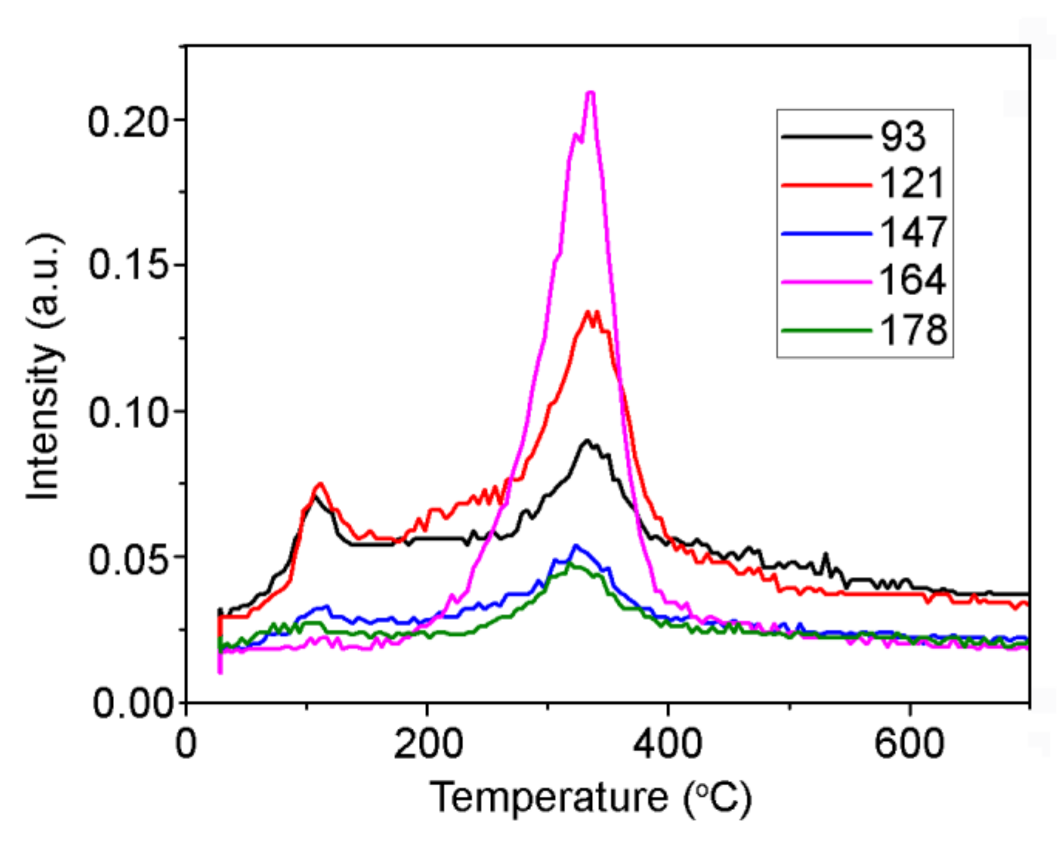
| Pyrolysis Product or Its Fragment Ion | Scheme | m/z1 | I, a.u. | Trange, C | Tmax, °C | n | E≠, kJ/mol | ν0, s −1 | ∆S≠, cal/(K×mol) | R2 2 |
|---|---|---|---|---|---|---|---|---|---|---|
| FA | ||||||||||
| Phenol | 7 | 94 | 0.107 | 250–570 | 407 | 1 | 118 | 5.013 × 10⁶ | −29 | 0.949 |
| Guaiacol | 6 | 124 | 0.139 | 150–375 | 260 | 1 | 78 | 1.665 × 10⁵ | −36 | 0.957 |
| 4-Vinylguaiacol | 2 | 150 | 3.0 | 70–200 | 120 | - | - | - | - | - |
| 3 | 150 | 2.2 | 100–400 | 220 | - | - | - | - | - | |
| 4-Vinylmethylguaiacol | 8 | 164 | 0.209 | 188–427 | 332 | 1 | 109 | 1.628 × 10⁷ | −27 | 0.984 |
| 4-Vinyldimethylguaiacol | 8 | 178 | 0.047 | 237–432 | 318 | 1 | 114 | 4.200 × 10⁷ | −25 | 0.951 |
| Naphthalene | - | 128 | 0.04 | 320–520 | 430 | - | - | - | - | - |
| VA | ||||||||||
| Phenol | 2 | 94 | 0.05 | 295–471 | 382 | 1 | 121 | 1.371 × 10⁷ | −27 | 0.965 |
| Cresol | - | 108 | 0.023 | 238–374 | 322 | 1 | 137 | 3.383 × 10⁹ | −16 | 0.944 |
| Guaiacol | 1 | 124 | 0.067 | 193–390 | 275 | 1 | 91 | 1.575× 10⁶ | −31 | 0.938 |
| 109 | 0.097 | 190–411 | 276 | 1 | 90 | 1.124 × 10⁶ | −32 | 0.905 | ||
| 81 | 0.087 | 190–397 | 274 | 1 | 82 | 1.743 × 10⁵ | −35 | 0.937 | ||
| Vanillin | - | 151 | 0.026 | 180–420 | ~271 | - | - | - | - | - |
Publisher’s Note: MDPI stays neutral with regard to jurisdictional claims in published maps and institutional affiliations. |
© 2021 by the authors. Licensee MDPI, Basel, Switzerland. This article is an open access article distributed under the terms and conditions of the Creative Commons Attribution (CC BY) license (https://creativecommons.org/licenses/by/4.0/).
Share and Cite
Nastasiienko, N.; Kulik, T.; Palianytsia, B.; Laskin, J.; Cherniavska, T.; Kartel, M.; Larsson, M. Catalytic Pyrolysis of Lignin Model Compounds (Pyrocatechol, Guaiacol, Vanillic and Ferulic Acids) over Nanoceria Catalyst for Biomass Conversion. Appl. Sci. 2021, 11, 7205. https://0-doi-org.brum.beds.ac.uk/10.3390/app11167205
Nastasiienko N, Kulik T, Palianytsia B, Laskin J, Cherniavska T, Kartel M, Larsson M. Catalytic Pyrolysis of Lignin Model Compounds (Pyrocatechol, Guaiacol, Vanillic and Ferulic Acids) over Nanoceria Catalyst for Biomass Conversion. Applied Sciences. 2021; 11(16):7205. https://0-doi-org.brum.beds.ac.uk/10.3390/app11167205
Chicago/Turabian StyleNastasiienko, Nataliia, Tetiana Kulik, Borys Palianytsia, Julia Laskin, Tetiana Cherniavska, Mykola Kartel, and Mats Larsson. 2021. "Catalytic Pyrolysis of Lignin Model Compounds (Pyrocatechol, Guaiacol, Vanillic and Ferulic Acids) over Nanoceria Catalyst for Biomass Conversion" Applied Sciences 11, no. 16: 7205. https://0-doi-org.brum.beds.ac.uk/10.3390/app11167205