
A Fast Method for Estimating the Emission Factors of Air Pollutants from In-Use Vehicles Fleet

1
Center for Environment, Health and Welfare Research, Korea Institute of Science and Technology (KIST), Seoul 02792, Korea
2
Clean Air Center, Korea Institute of Science and Technology (KIST), Seoul 02792, Korea
3
Department of Social Welfare, Incheon National University, 119, Academy-ro, Yeonsu-gu, Incheon 22012, Korea
4
Center for FRIEND Project, Korea Institute of Science and Technology (KIST), Seoul 02792, Korea
*
Authors to whom correspondence should be addressed.
Appl. Sci. 2021, 11(16), 7206; https://0-doi-org.brum.beds.ac.uk/10.3390/app11167206
Submission received: 5 July 2021
/
Revised: 29 July 2021
/
Accepted: 29 July 2021
/
Published: 5 August 2021
(This article belongs to the Special Issue Advances in Gaseous and Particulate Air Pollutants Measurement)
Abstract
:Featured Application
This work suggests a new fast method for estimating real-world vehicle emissions by monitoring the concentration profiles of air pollutants with traveling distances inside the roadway tunnels using a mobile laboratory. Like portable emission measurement systems, it can be a useful methodology to verify and complement the emission factors based on simulated driving cycles of the chassis or engine dynamometer facilities in laboratories.
Abstract
The real-world emission factors of gaseous and particulate air pollutants emitted from in-use vehicles, can be rapidly estimated using monitoring data of their concentration profiles from inside roadway tunnels using a mobile laboratory equipped with fast monitoring instruments. The concentrations of CO2 and particle-bound polycyclic aromatic hydrocarbons (PM-PAHs) and NOx, were observed to increase linearly with traveling distance inside two successive roadway tunnels: the Hongjimun Tunnel and the Jeongneung Tunnel on the Naebu Express Way in Seoul, Korea, except for a small region of decrease. In the decreasing regions, within a few hundred meters of the entrance and before the exit, outside background air with low concentrations of air pollutants was thought to have intruded. From the slopes of the linear regression between distance and concentrations, a fleet-averaged (light-, medium-, and heavy-duty vehicles with 54%, 36%, and 10%, respectively) emission factor of CO2, PM-PAHs, and NOx at an average speed of ~60 km h−1 could be calculated as 197 ± 38 g km−1, 4.2 ± 0.8 × 10⁻⁴ g km−1, and 0.530 ± 0.230 g km−1, respectively, which are within the ranges of values reported in the literature. For each tunnel, the emission factors of CO2, PM-PAHs, and NOx estimated on days with higher-than-normal fractions of heavy-duty vehicles, were higher than those on other days. From these results, the new fast method proposed in this study is considered useful for estimating real-world emission factors of air pollutants by using a mobile laboratory as a complementary tool to traditional tunnel studies. This method can be used to rapidly make emission maps at roadway tunnels in mega-cities like Seoul, Korea, for urban air-quality management.
1. Introduction
Vehicles are well known as major air-pollutant sources in urban areas, especially in mega-cities such as Seoul, Korea. Among vehicle emissions are hazardous gases such as CO and NOx, greenhouse gases including CO2, and carcinogens including polycyclic aromatic hydrocarbons (PAHs). In 2012, diesel exhaust particles were classified as carcinogenic (Group 1) for lung cancer based on a cohort and case study [1,2]. Therefore, the emission of air pollutants from vehicles should be managed to improve air quality and public health and mitigate global warming.
In general, the emission factors of air pollutants from in-use vehicles have been estimated during standard driving cycles with chassis dynamometer facilities in laboratories [3,4,5,6]. However, measuring real-world emission factors on real roads is also necessary. To investigate the average real-world emissions of the in-use vehicle fleet in the area where the tunnel is located, tunnel studies have been carried out using two-location measurements for distance-based emission factors [7,8,9,10,11,12,13,14,15], and using one-location measurement for fuel-based emission factors [16,17,18]. Recently, attempts have been made to obtain real-world emission factors from on-road measurements through the development of real-time mobile monitoring systems such as portable emission measurement systems (PEMS) [6,19,20,21], remote sensing devices (RSDs) [22,23,24], and mobile laboratories (MLs) [21,25].
Even though tunnel studies are thought to be an effective method to investigate real-world emission factors for a large-volume traffic fleet, they cannot separate the condition-specific (hot start and cold start) or vehicle-specific (gasoline and diesel vehicles, old and new vehicles) emissions [17]. On the contrary, the PEMS method can provide the emission factors for detailed conditions of a test vehicle but are limited to the instrumented vehicle at a time, and chase measurements can capture the emissions from individual vehicles followed by a mobile laboratory; chasing the target vehicles is difficult under real-world traffic conditions [15]. Stationary measurements using RSD can accumulate the much larger sample size measured in a short time and can be used for instantaneous identification of high emitter vehicles, but can measure only a snapshot (~0.5 s) of a given vehicle’s journey [24].
For tunnel measurements for obtaining distance-based emission factors, the concentrations of air pollutants are monitored simultaneously at the entrance and exit locations over a certain period using two sets of the same instruments to calculate emission factors, a method that requires high survey efforts for the many tunnels in urban areas. In traditional tunnel studies, without ventilation, the emission factors of air pollutants are calculated by Equation (1) [8,9,10,11,12,14,15]:
where Cent and Cexit are the concentrations (mg m−3) of an air pollutant measured at two locations near the tunnel entrance and exit, respectively, ua is the cross-sectional average velocity of airflow (m s−1), which is constant regardless of location because of the lack of ventilation, A is the cross-sectional area (m2), t is the sampling time (s) over which the concentrations are averaged, N is the number of vehicles passing through the tunnel during the sampling time, and L is the distance (m) between the two monitoring locations inside the tunnel.
For cases with exhaust and intake ventilation, a more generalized Equation (2) can be used with the assumption of steady-state conditions [12]:
where uent and uexit are the cross-sectional average velocities of airflow (m s−1) at the two locations near the entrance and exit, respectively, a is 1 for intake ventilation and 2 for exhaust ventilation, with a velocity of uv (m s−1) at the ventilation holes whose total area is Av (m2), and Cv is the concentration of the air pollutant in the intake or exhaust air.
In this study, a rapid method for estimating the real-world emission factors of air pollutants from in-use vehicles is suggested as a complementary tool to traditional tunnel measurements.
2. Methods
Figure 1 shows a schematic diagram of the control volume inside a roadway tunnel. The assumption is made that no significant concentration change exists with the y- or z-axis compared to that of the x-axis. Differential Equation (3) can be derived from the law of conservation of mass. In Equation (3), the left side means the net mass change of air pollutant inside the control volume, which is determined with four terms of right hand side, i.e., increase by horizontal inflow (first term), decrease by horizontal outflow (second term), increase by vertical inflow of fresh air (third term), and increase by emission from vehicles (last term).
where c is the concentration measured inside the tunnel, subscript 0 and bg are the concentrations at the entrance and in the background area around the tunnel, respectively, uv is the velocity of the dilution air that uniformly enters the tunnel through the ceiling via the ventilation holes, l and h are the road width (m) and tunnel height (m), respectively, EF is the emission factor (g km−1) of a certain air pollutant, n is the traffic volume per second (vehicles s−1), and R is the emission rate (g m−2 s−1). The air velocity inside the roadway tunnel, ua, and the emission rate, R, can be expressed as Equation (4). In Equation (4), the value of 1000 represents the unit conversion from kilometers to meters.
If no change with time occurs (i.e., for steady-state conditions), the concentration c is defined by Equation (5). If uv is zero, namely, the average velocity of airflow is constant through the whole tunnel because of the lack of artificial ventilation, and Equation (5) becomes a linear relationship, similar to Equation (6):
In the steady-state case, one can derive the linearly proportional relationship of the measured air-pollutant concentration, c, with distance, x, by continuous monitoring with a mobile laboratory over a short driving time. After obtaining a slope of the measured concentration of a target air pollutant with distance, by linear fitting of y = αx + β, EF can be finally estimated from Equation (7):
3. Measurements
3.1. Monitoring Area
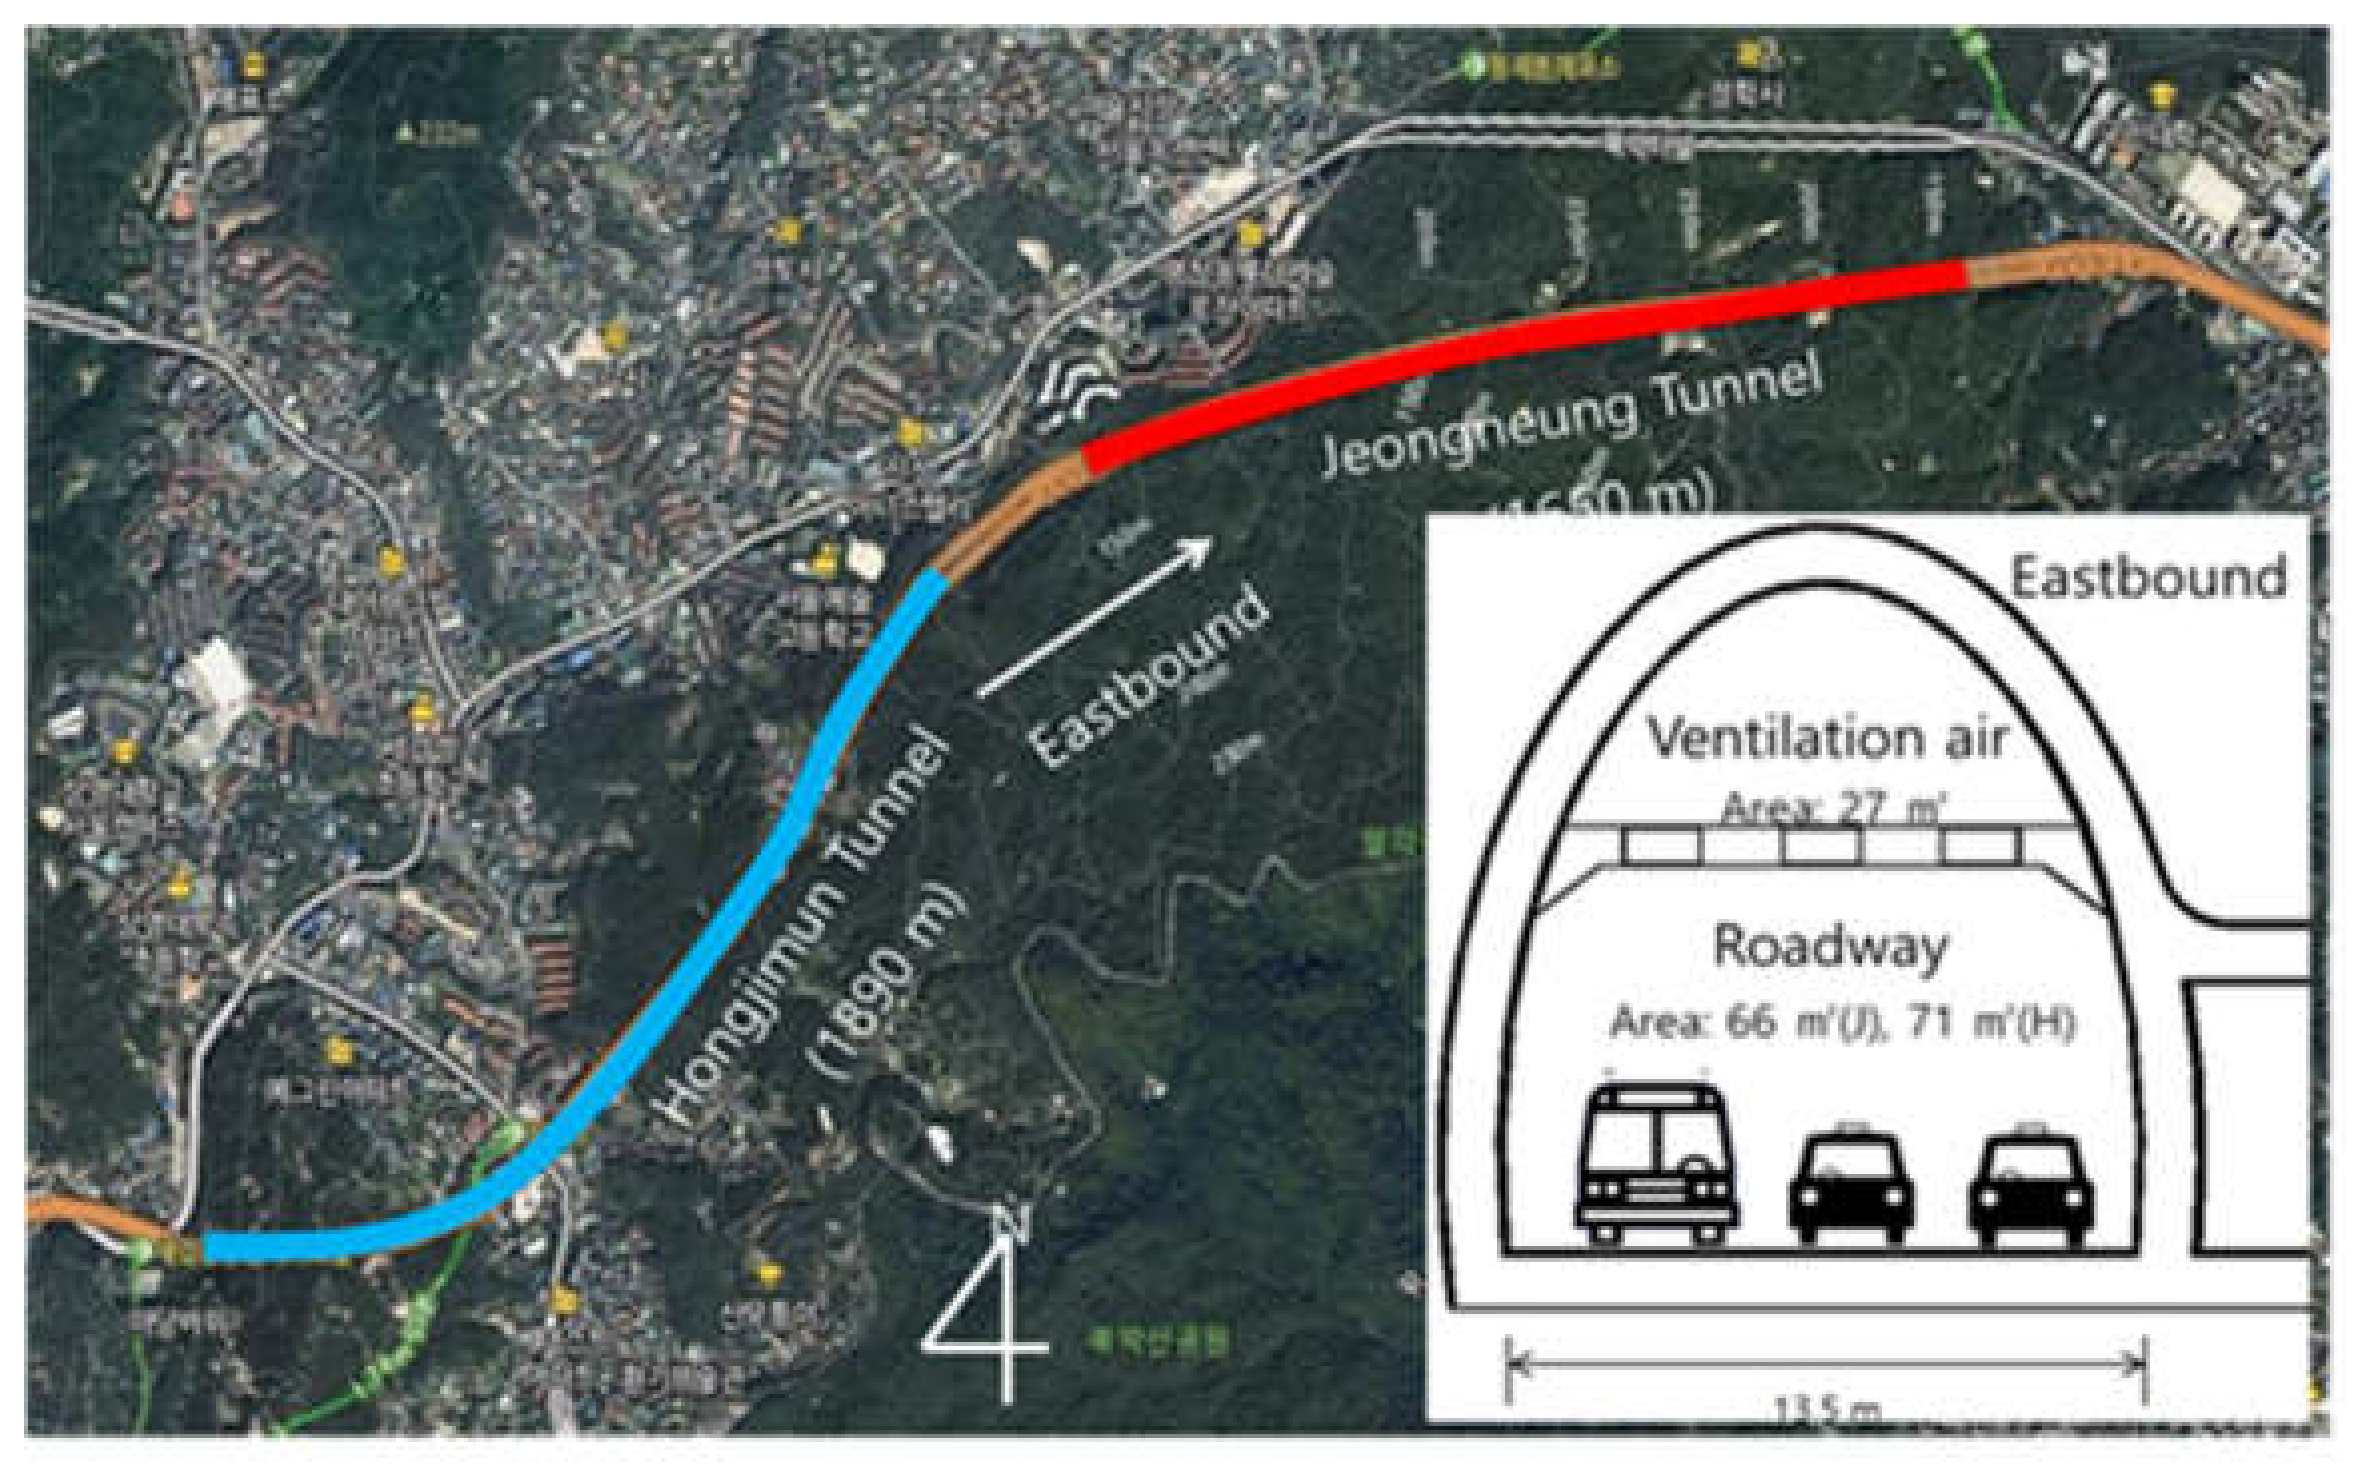
Figure 2 shows the monitoring area of the Hongjimun and Jeongneung tunnels on the eastbound Naebu Express Way in the elevated mountain area of Seoul, Korea, in which the real-world emission factors of air pollutants were examined in this study. The concentration profiles of air pollutants were obtained using a mobile laboratory driving through the two roadway tunnels. As shown in the schematic diagram at the right corner of Figure 2, for both tunnels, the eastbound bore has three lanes, which are separated from the westbound lanes.
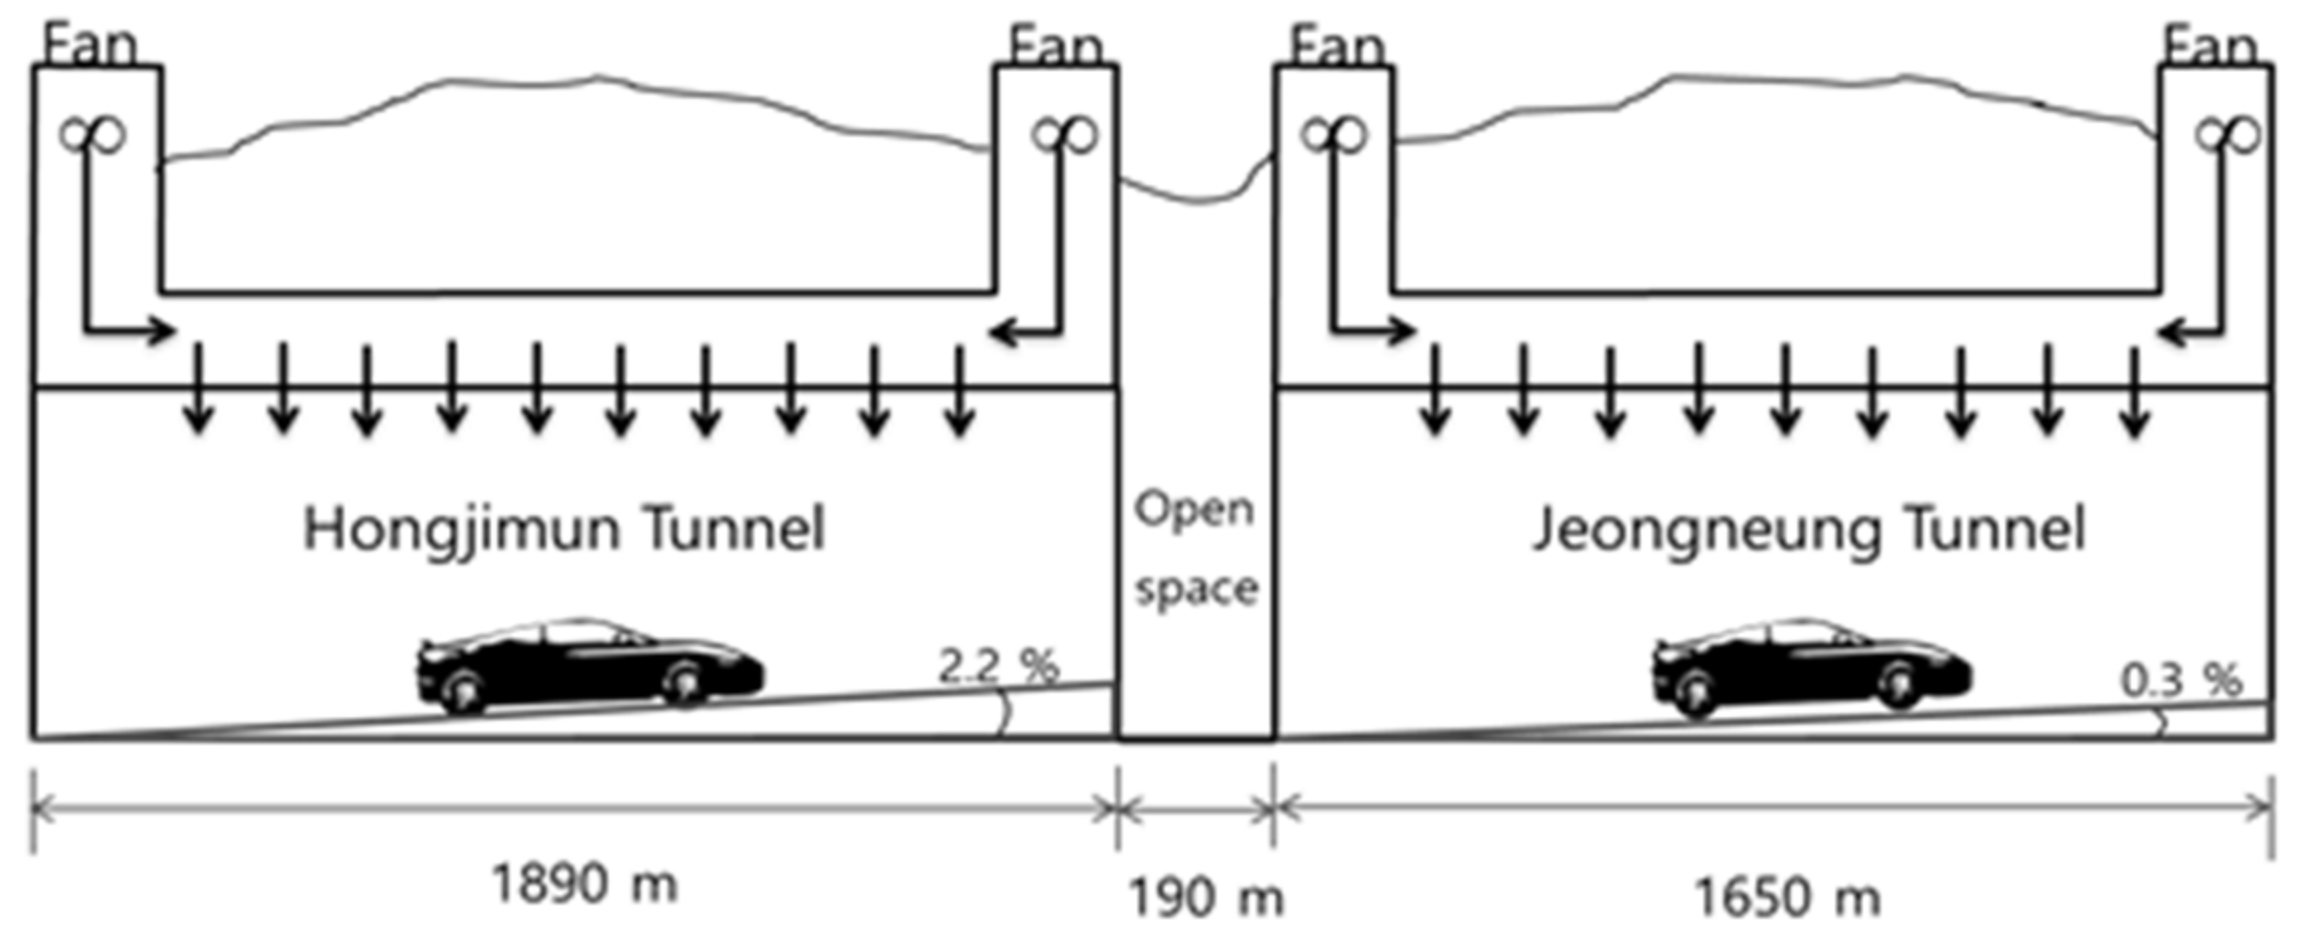
As shown in Figure 3, the lengths of the Hongjimun Tunnel, the Jeongneung Tunnel, and the open space between the two tunnels are 1890 m, 1650 m, and 190 m, respectively. Manual ventilation is created with a semi-transverse ventilation utility through the ventilation sections on the ceiling for air supply or exhaust derived from two fans at the end of each tunnel for training and emergency events such as cases of high pollution. The slope of the road inside the Hongjimun Tunnel is about 2.2%, which is slightly steeper than that of the Jeongneung Tunnel (0.3%). The traffic volume through the two tunnels is identical because no exit or entrance ramp exists between them.
3.2. Monitoring Instruments
The concentrations of CO2, particle-bound PAHs (PM-PAHs), and NOx were measured with a continuous gas analyzer (CO12M, Environmental S.A., France), a PAH monitor (PAS 2000, EcoChem, League City, TX, USA), and a NO-NO2-NOx analyzer (AC32M, Environmental S.A., Poissy, France), respectively, equipped in a mobile laboratory. The NOx analyzer used in this study can alternately measure NO and NOx concentrations every 5 s, then calculate NO2 concentrations by subtracting the NO concentrations from the NOx concentrations. The average concentration ratio of NO/NO2 was in the range of 7~10 inside the tunnels. These gas analyzers were regularly calibrated in the range of 1000 ppm and 1000 ppb with standard gases. The difference in concentrations between span gases and measured values was less than 1%. Zeroing the gas analyzers and the PAH monitor was conducted using N2 gas with a purity of 99.999% and by turning off its internal pump, respectively, before measurements. The PAH monitor is reported to detect particle-bound PAHs with three or more benzene rings were detected through the measurement of electrons emitted by organic molecules on particles irradiated by UV light [27,28]. The mobile laboratory used in this study was a diesel-powered van developed for on-road measurements using real-time instruments during driving [29,30,31,32,33]. Sampling inlets for gases and particles were made separately of Teflon tubing and conductive materials such as stainless steel and conductive tube, respectively, to minimize wall losses. The sampling mouth diameter for particles was designed for isokinetic sampling at a driving speed of 50 km h−1. Residence times in the sampling inlets ranged from 2 to 10 s. The averaging time and delay time were 3 and 18 s, respectively, for CO2, 6 and 13 s, respectively, for particle-bound PAHs, and 5 and 32 s, respectively, for NOx. The update time of the latitude, longitude, and vehicle speed data measured by GPS (742, Ascen, Korea) was 1 s, but the GPS generated no data inside the tunnels. The distance was calculated from the duration of time passing and the tunnel length, with the assumption of constant vehicle speed inside the tunnels. The average velocities of airflow inside the tunnel were measured using ultrasonic sensors on the right and left walls of the tunnels at 260 and 400 m, respectively, before the exit of the Hongjimun Tunnel, and at 104 and 244 m, respectively, before the exit of the Jeongneung Tunnel. These sensors were managed by the tunnel management office. As the ventilation fan was not operating (uv = 0) during the mobile measurements, the air velocity, ua, could be considered constant as ua,0 over the whole tunnel, according to Equation (4). The airflow was mainly caused by vehicle movement.
Table 1 shows outlines of the mobile monitoring measurements from 8 February to 15 March, when the vertical air velocity of dilution air, uv was zero. The average traveling speed of the mobile laboratory ranged from 29 to 71 km h−1. The total traffic volume was 3700 ± 82 vehicles h−1, among which 6.6 ± 0.9% were heavy-duty (HD) vehicles. The temperature and relative humidity inside the tunnels ranged from 6 °C to 11 °C and from 27% to 41%, respectively. The hourly average velocity of airflow showed a linear relationship with the average vehicle speed, except for the Hongjimun Tunnel data from 15 March. On 15 March, the prevailing wind direction in Seoul was nearly the same as the direction of vehicle movement around the Hongjimun Tunnel entrance, which is thought to have contributed to the higher average velocity of airflow inside the tunnel on this date.
4. Results
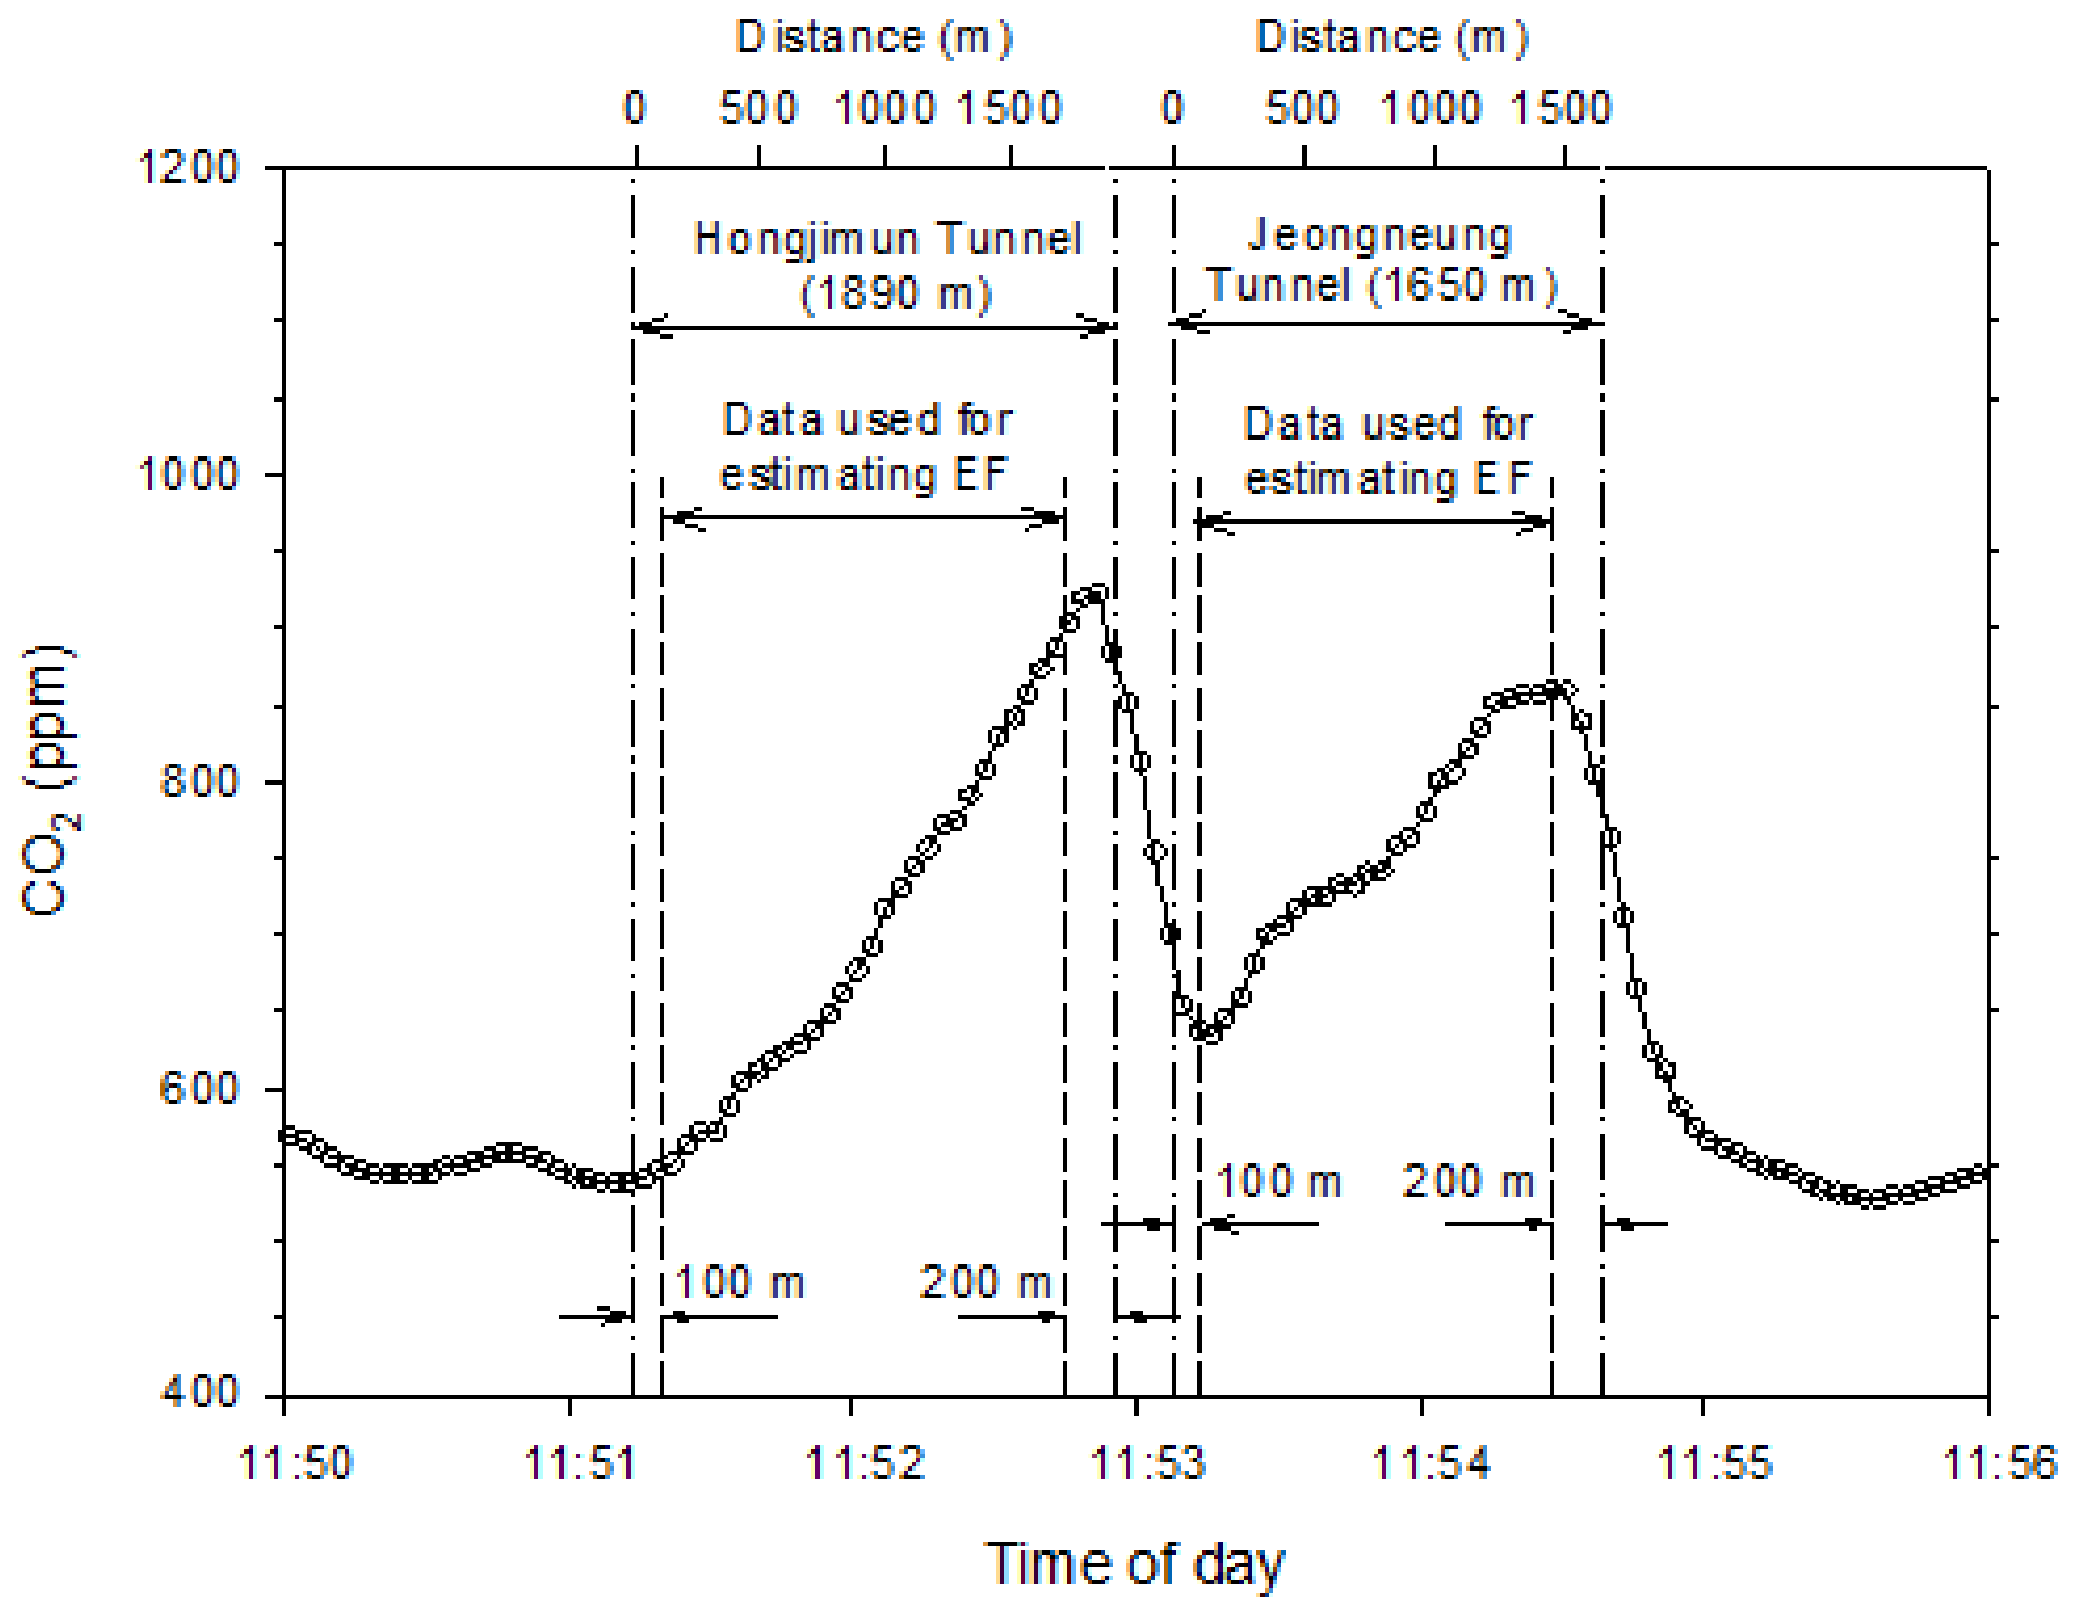
Figure 4 shows the profile of CO2 concentrations measured by the mobile laboratory on 8 February. CO2 concentrations increased linearly from approximately 540 ppm after entering the Hongjimun Tunnel to 923 ppm, then rapidly decreased a few seconds before the exit. During travel on the open road between the two tunnels, the CO2 concentration decreased by approximately 220 ppm because of dilution with outdoor air. The CO2 concentration still decreased until 145 m, for several seconds after entering the Jeongneung Tunnel, probably because of the dilution effect of outdoor air that had penetrated into the tunnel in the boundary layer region on the tunnel ceiling. Gouriou et al. [34] explained this phenomenon of decreasing concentration near tunnel entrances by two vertical layer modeling on particle concentration data. From 145 m, the CO2 concentration increased inside the Jeongneung Tunnel until 1451 m, which was approximately 200 m before the exit. The decreased concentrations observed at locations just before the tunnel exit were thought to be due to the penetration of outdoor air, as for the entrance region. Therefore, the slope of linear correlation between tunnel distance and air-pollutant concentration was derived only for data taken from 100 m after each tunnel entrance to 200 m before each tunnel exit, as shown in Figure 4.
The obtained data also reflect the importance of a tunnel design as a proper ventilation method of air pollutants. For example, if these two tunnels were not divided into two, the maximum concentration of air pollutants would be almost doubled at the exit of the tunnel compared to the observed pollution level. For the energy savings of ventilation as well as the protection of drivers and workers who might be exposed by seriously high concentrations of air pollutants, tunnel design should consider the expected air pollution levels inside a tunnel.
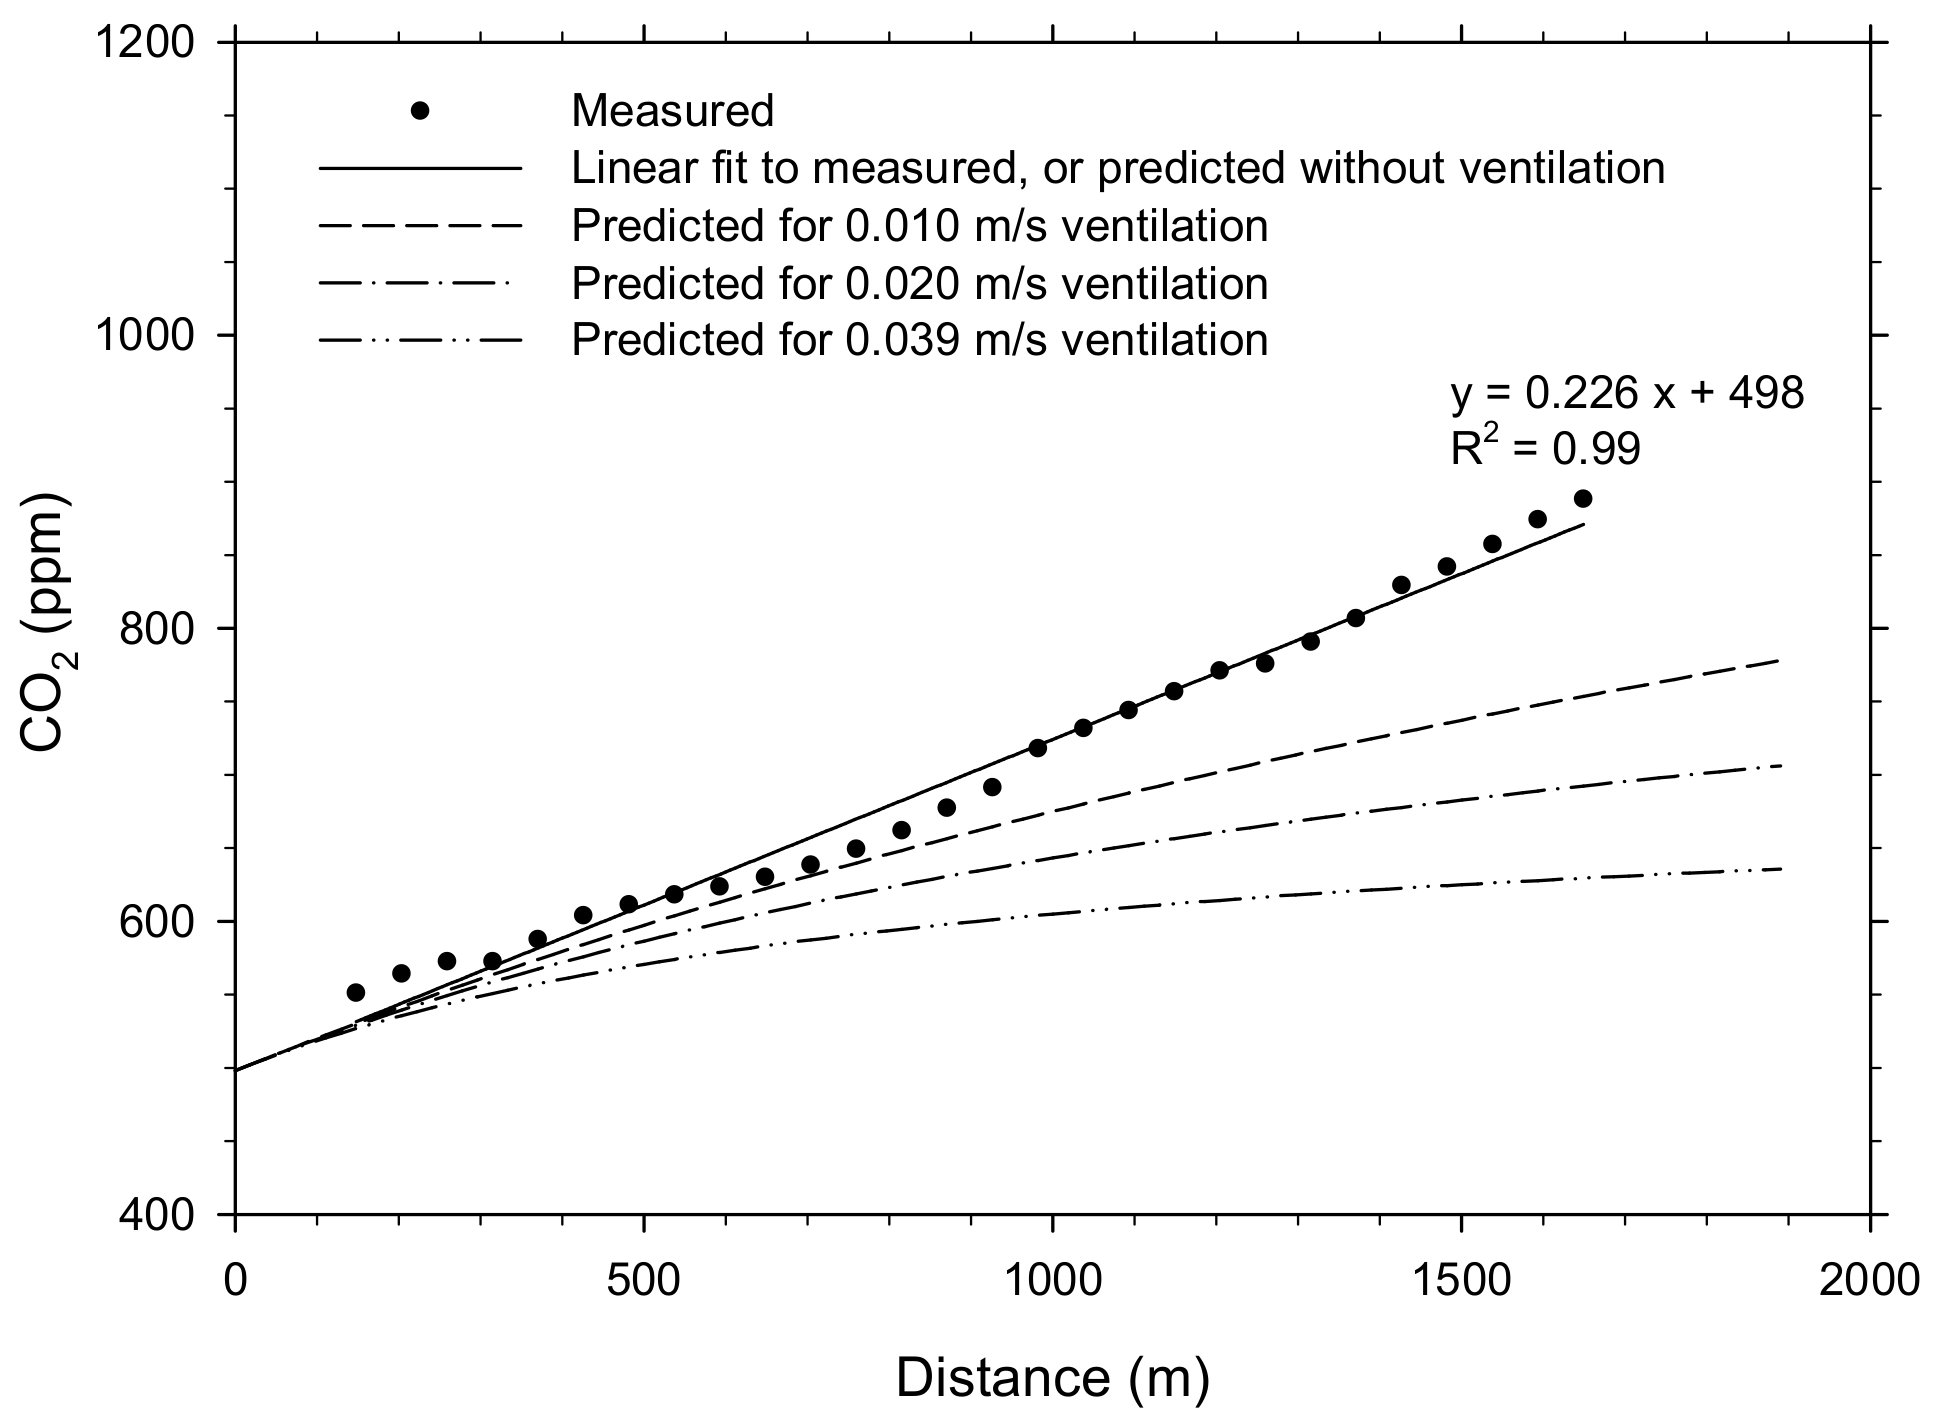
Figure 5 shows the relationship between distance and CO2 concentration on 8 February. When inserting a slope of 0.226 ppm m−1 (0.435 mg m−3) to the variable α in Equation (7), the EF is calculated as 201 g km−1. If the ventilation velocity of the air supply is assumed as 0.010, 0.020, or 0.039 m s−1 for emergency events, the CO2 concentration can be predicted to be reduced significantly according to Equation (5), as shown in Figure 5. In this case, the background CO2 concentration, Cbg, was assumed to be 498 ppm, which was the y-axis intercept of the linear regression in the case without ventilation.
Table 2 shows a summary of CO2, PM-PAHs, and NOx emission factors estimated by the fast method proposed in this study. On 8 February, a data storage problem occurred for the PAH monitor and NOx analyzer of the mobile laboratory. The determination coefficient for the linear regression, R2, is greater than 0.86 for all measurement data.
The average CO2 emission factor estimated from the Jeongneung Tunnel data was 172 ± 30 (136–200) g km−1, which is approximately 23% lower than the 223 ± 26 (201–253) g km−1 measured in the Hongjimum Tunnel. The average PM-PAH emission factor estimated from the Jeongneung Tunnel data was 3.5 × 10⁻⁴ (3.3–3.7 × 10⁻⁴) g km−1, which is approximately 27% lower than the 4.8 × 10⁻⁴ (4.5–5.2 × 10⁻⁴) g km−1 measured in the Hongjimun Tunnel. The average NOx emission factor estimated from the Jeongneung Tunnel data was 0.578 (0.458–0.896) g km−1, which is approximately 20% higher than the 0.481 (0.301–0.726) g km−1 measured in the Hongjimun Tunnel. Although no difference exists in traffic volume or the fraction of vehicle types between the two tunnels, there was a little difference in the emission factors between successive tunnels as much as 20~27%. At the 0.05 level of significance, Mann–Whitney test shows no statistical difference in emission factors for PM-PAHs, and NOx except CO2 between two tunnels. One of the possible reasons why CO2 emission factors in the Hongjimun Tunnel is greater than those in the Jeongneung Tunnel might be the relatively steeper slope of the road in the Hongjimun Tunnel, which may probably increase fuel consumption slightly, but this is considered not to significantly affect the emission of NOx and PM-PAHs. The higher fraction of HDVs on 15 March is considered to be one of the major reasons for the greater CO2 PM-PAH, and NOx emission factors on this date.
Table 3 shows the comparison of CO2 emission factors estimated from the Hongjimun and Jeongneung tunnels, with literature values calculated at the speed of 68 km h−1 from a regression equation based on the chassis dynamometer results and PEMS measurement data [35,36]. The fleet average CO2 emission factor derived from the two roadway tunnels in this study shows a similar level to that of medium-duty diesel vehicles, and is between those of light-duty gasoline vehicles and heavy-duty diesel vehicles. If the CO2 emission factors of the LDVs, MDVs, and HDVs that traveled inside the two tunnels on the measurement days are assumed to be those of light-duty gasoline vehicles, medium-duty diesel vehicles, and heavy-duty diesel vehicles, respectively, then the fleet average CO2 emission factor is calculated as 165 ± 5 g km−1, which is very close to the fleet averages (light-, medium-, and heavy-duty vehicles with 54%, 36%, and 10%, respectively) at the average speed of ~60 km h−1 measured in the Hongjimun and Jeongneung tunnels by the fast method proposed in this study.
The fleet average emission factor of PM-PAHs is estimated as 4.2 ± 0.8 × 10⁻⁴ g km−1, which is roughly between those of LDVs and HDVs, as obtained by simultaneous roadside measurements at two locations inside the Gubrist freeway tunnel near Zürich [9].
The fleet average emission factor of NOx is estimated as 0.530 g km−1, which is between those of LDGVs obtained by PEMS in Chinese megacities (Beijing, Shenzhen, and Guangzhou), and LDDVs by PEMS in Seoul metropolitan area, Korea [6,37]. A Chinese study was conducted for the LDGVs with Euro level 0 to 4 while a Korean study measured LDDVs with Euro level 3 to 5.
5. Discussion
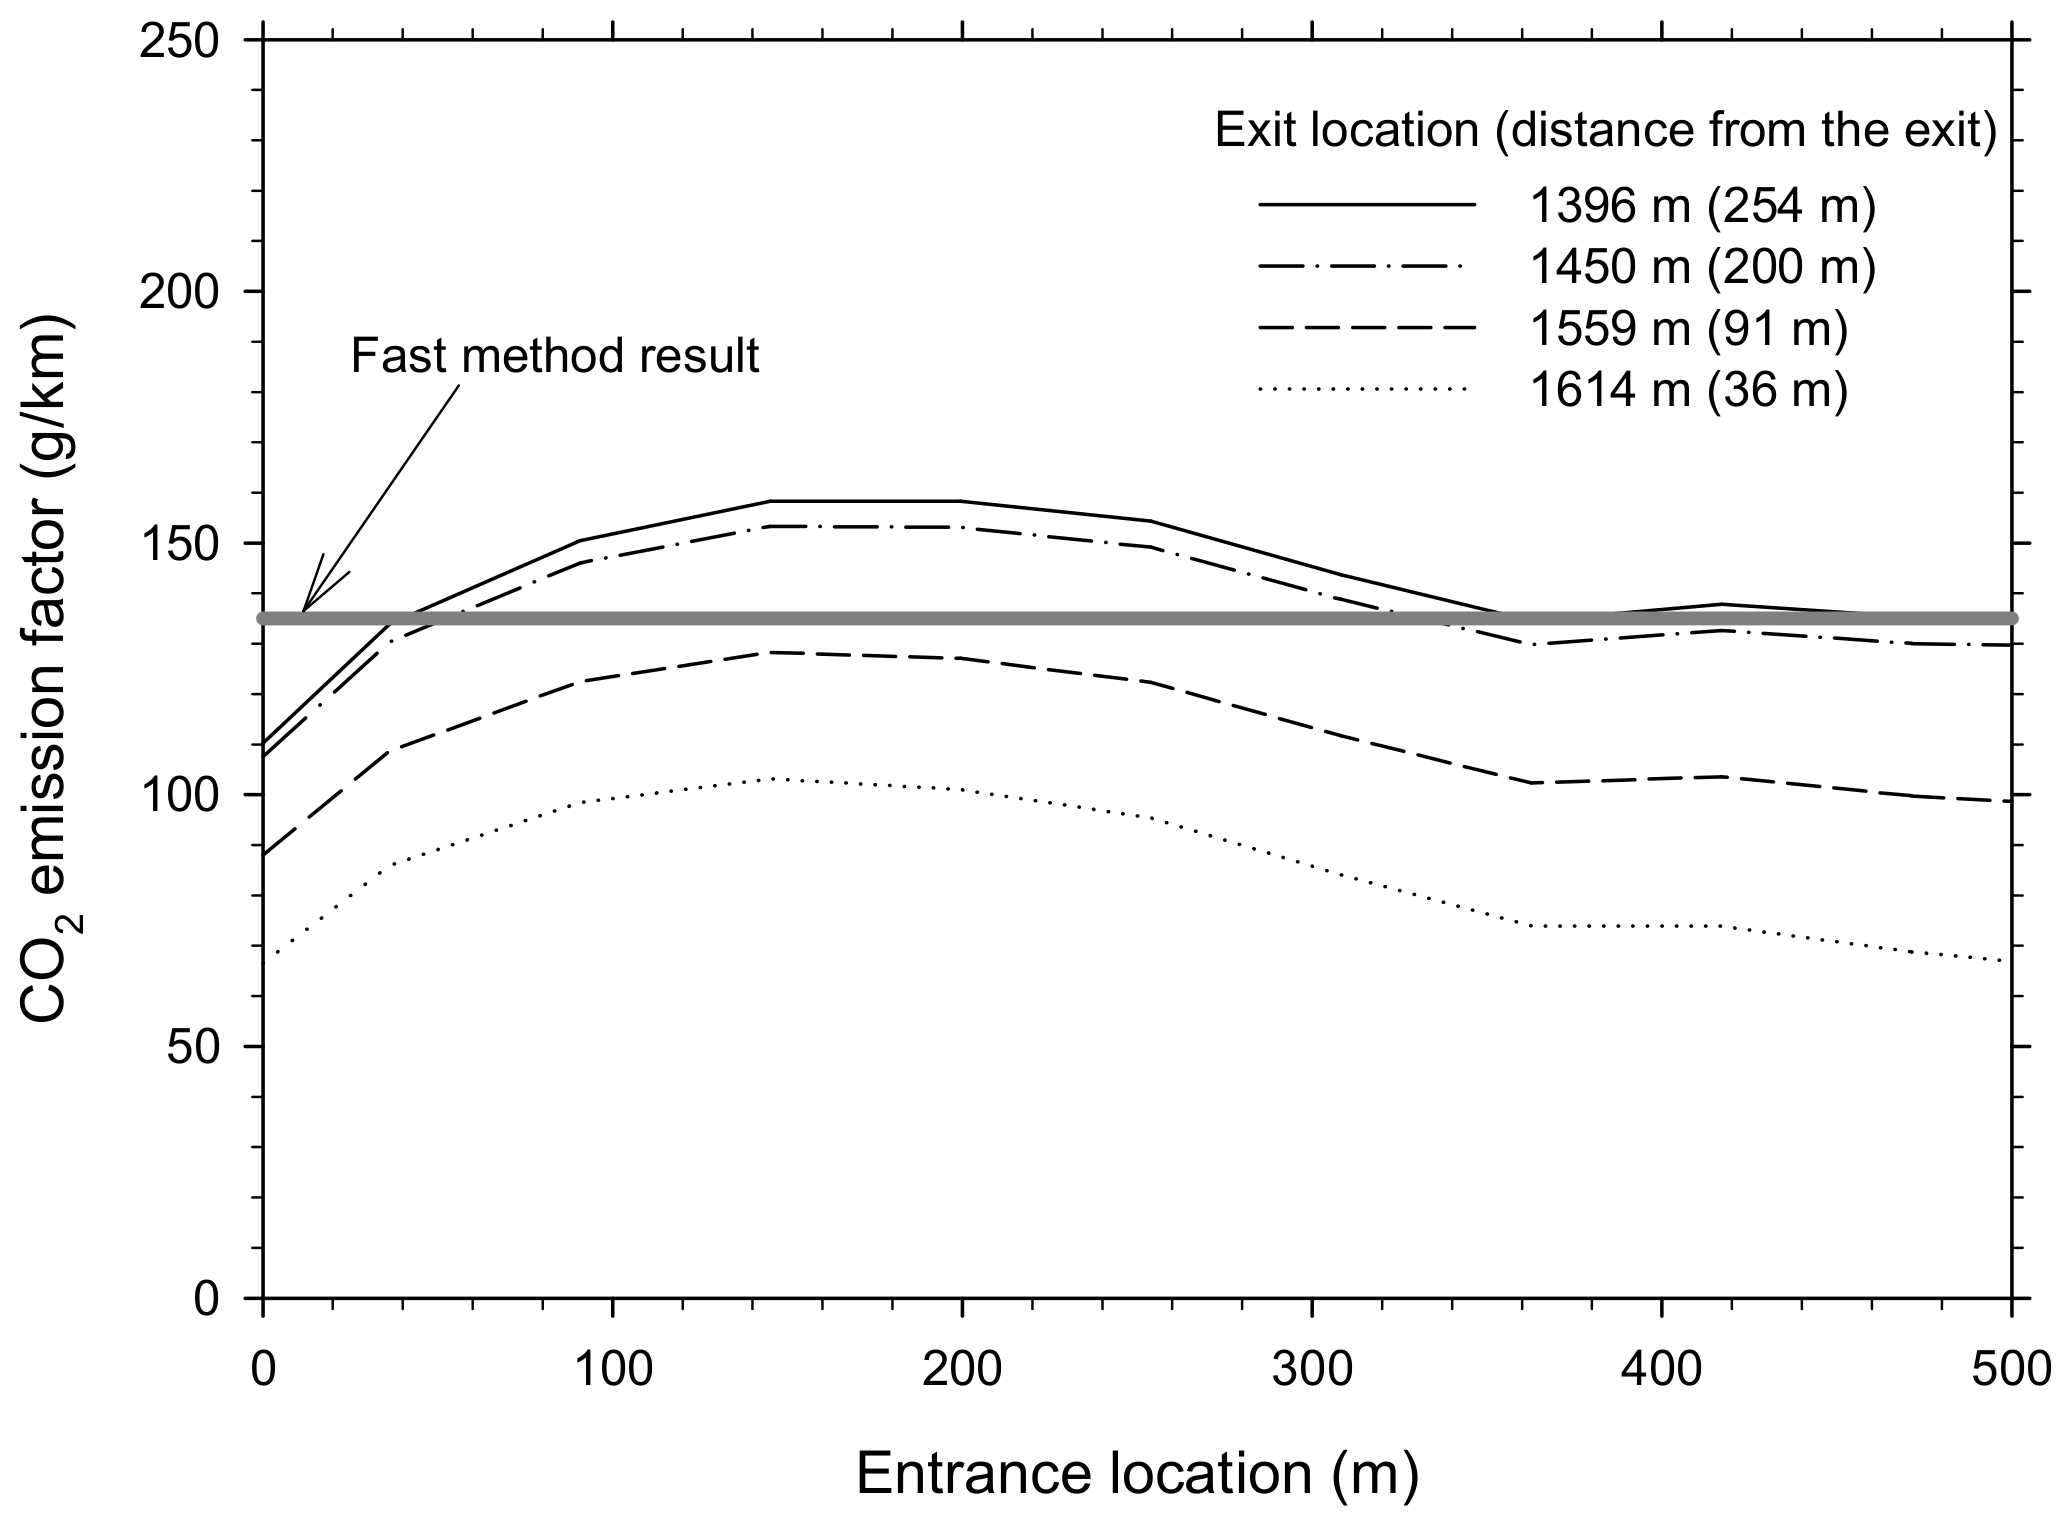
For traditional tunnel studies, air pollutants have been measured simultaneously at the entrance and exit zones of roadway tunnels to investigate real-world emission factors. In general, the roadway tunnel is thought of as a dynamic flux chamber where airflow direction is always parallel to that of vehicle movement at any location, implying that maximum concentrations of air pollutants might be observed at the exit of the tunnel when the vertical air velocity of diluted air was zero. Because of this thought, little attention has been paid to the location of the two measurement points inside the tunnel. From the concentration profiles measured in this study using a mobile laboratory, however, decreasing concentrations of air pollutants were sometimes observed just after tunnel entrances and just before tunnel exits, which could have caused data artifacts when estimating the emission factors from two-location measurement data. Figure 6 shows the change in the CO2 emission factor estimated by the traditional method using Equation (1) on the mobile laboratory data from 8 February, when the entrance and exit locations were assumed to be 0–500 m and 1396–1650 m, respectively.
As shown in Figure 4 and Figure 6, the decreasing trend of CO2 concentration just inside the tunnel entrance might cause a negative artifact; in other words, underestimation of the CO2 emission factor by about 18% when the entrance and exit locations are assumed to be 0 and 1396 m, respectively, compared with the results of the fast method. The trend of decreasing CO2 concentration just before the tunnel exit might also cause underestimations of the CO2 emission factor by approximately 32% when the entrance and exit locations are assumed to be 145 and 1614 m, respectively. Therefore, the spatial distribution of air-pollutant concentrations should be examined to determine the two optimal monitoring locations for reliable emission factor results. The mobile laboratory was concluded to be a useful complementary monitoring tool for studies of the spatial distribution of air pollution, even inside roadway tunnels over a short time.
6. Conclusions
To establish a new traffic-related environmental policy and to evaluate existing ones, the real-world emission factors of gaseous and particulate air pollutants emitted from in-use vehicles need to be investigated at low cost over short time periods on many different major roads in mega-cities such as Seoul, Korea.
In this study, a new rapid method for estimating the realistic emission factors of air pollutants emitted from the vehicle fleet, by on-road real-time monitoring inside roadway tunnels using a mobile laboratory, was proposed. The applicability of the new rapid method was successfully evaluated for CO2, particle-bound PAHs, and NOx in two successive roadway tunnels on an expressway in Seoul, Korea. The air pollutant concentrations increased linearly with the traveling distance inside the tunnels, except for the span from 100 m after the tunnel entrance to 200 m before the tunnel exit. This linear relationship between the air pollutant concentrations and traveling distance could be converted to emission factors if additional information such as traffic volume and air velocity is given.
Although limitations exist, such as the possibility of contamination from the exhaust plumes of neighboring vehicles [19], and the assumption of steady-state conditions during the data collection interval of traffic volume and air velocity, the similar levels of emission factors estimated for the two successive tunnels support the suggestion that this new method works well. This method is expected to be utilized in the creation of emission maps at roadway tunnels and in the evaluation of the effect of traffic-related environmental policies such as an increase in electric vehicles by accumulating the emission factors of hazardous air pollutants from in-use vehicle fleets in many places with tunnels in mega-cities or nationwide for air-quality management. In addition, new techniques with image processing for monitoring fleet composition inside the tested tunnel can be used together for fast output calculation. Furthermore, the results also reflect the importance of a design for a well-ventilated tunnel to protect drivers and workers who can be potentially exposed to seriously high air pollutants.
Author Contributions
Conceptualization and resources, G.-N.B.; methodology, S.-B.L. and B.-E.P.; validation, K.H.K., S.-B.L. and G.-N.B.; data curation, S.-B.L. and B.-E.P.; writing—original draft preparation, S.-B.L.; writing—review and editing, K.H.K. and G.-N.B.; visualization, S.-B.L. and B.-E.P.; supervision, G.-N.B.; project administration, S.-B.L. and G.-N.B.; funding acquisition, S.-B.L. and G.-N.B. All authors have read and agreed to the published version of the manuscript.
Funding
This study was supported in part by the Center for Environmentally Friendly Vehicles (3-4-0-11) funded by the Ministry of Environment and in part by the Technology Development Program to Solve Climate Changes through the National Research Foundation of Korea (NRF) funded by the Ministry of Science, ICT (2019M1A2A2103954).
Institutional Review Board Statement
Not applicable.
Informed Consent Statement
Not applicable.
Data Availability Statement
Not applicable.
Acknowledgments
All authors would like to thank the Hongjimun Tunnel Management Office for providing the information about the Hongjimun and Jeongneung tunnels.
Conflicts of Interest
The authors declare no conflict of interest. The funders had no role in the design of the study; in the collection, analyses, or interpretation of data; in the writing of the manuscript, or in the decision to publish the results.
References
- Attfield, M.D.; Schleiff, P.L.; Lubin, J.H.; Blair, A.; Stewart, P.A.; Vermeulen, R.; Coble, J.B.; Silverman, D.T. The Diesel Exhaust in Miners Study: A Cohort Mortality Study with Emphasis on Lung Cancer. J. Natl. Cancer Inst. 2012, 104, 869–883. [Google Scholar] [CrossRef]
- Silverman, D.T.; Samanic, C.M.; Lubin, J.H.; Blair, A.E.; Stewart, P.A.; Vermeulen, R.; Coble, J.B.; Rothman, N.; Schleiff, P.L.; Travis, W.D.; et al. The Diesel Exhaust in Miners Study: A Nested Case-Control Study of Lung Cancer and Diesel Exhaust. J. Natl. Cancer Inst. 2012, 104, 855–868. [Google Scholar] [CrossRef]
- Fujita, E.M.; Zielinska, B.; Campbell, D.E.; Arnott, W.P.; Sagebiel, J.C.; Mazzoleni, L.; Chow, J.C.; Gabele, P.A.; Crews, W.; Snow, R.; et al. Variations in Speciated Emissions from Spark-Ignition and Compression-Ignition Motor Vehicles in California’s South Coast Air Basin. J. Air Waste Manag. Assoc. 2007, 57, 705–720. [Google Scholar] [CrossRef]
- Franco, V.; Kousoulidou, M.; Muntean, M.; Ntziachristos, L.; Hausberger, S.; Dilara, P. Road vehicle emission factors development: A review. Atmos. Environ. 2013, 70, 84–97. [Google Scholar] [CrossRef]
- Bakeas, E.B.; Karavalakis, G. Regulated, carbonyl and polycyclic aromatic hydrocarbon emissions from a light-duty vehicle fueled with diesel and biodiesel blends. Environ. Sci. Process. Impacts 2013, 15, 412–422. [Google Scholar] [CrossRef] [PubMed]
- Ro, S.; Park, J.; Shin, M.; Lee, J. Developing on-Road NOx Emission Factors for Euro 6b Light-Duty Diesel Trucks in Korean Driving Conditions. Energies 2021, 14, 1041. [Google Scholar] [CrossRef]
- Pierson, W.R.; Brachaczek, W.W. Particulate Matter Associated with Vehicles on the Road. II. Aerosol Sci. Technol. 1982, 2, 1–40. [Google Scholar] [CrossRef]
- Chirico, R.; Prevot, A.; DeCarlo, P.; Heringa, M.F.; Richter, R.; Weingartner, E.; Baltensperger, U. Aerosol and trace gas vehicle emission factors measured in a tunnel using an Aerosol Mass Spectrometer and other on-line instrumentation. Atmos. Environ. 2011, 45, 2182–2192. [Google Scholar] [CrossRef]
- Kristensson, A.; Johansson, C.; Westerholm, R.; Swietlicki, E.; Gidhagen, L.; Wideqvist, U.; Vesely, V. Real-world traffic emission factors of gases and particles measured in a road tunnel in Stockholm, Sweden. Atmos. Environ. 2004, 38, 657–673. [Google Scholar] [CrossRef]
- Weingartner, E.; Keller, C.; Stahel, W.; Burtscher, H.; Baltensperger, U. Aerosol emission in a road tunnel. Atmos. Environ. 1997, 31, 451–462. [Google Scholar] [CrossRef]
- Handler, M.; Puls, C.; Zbiral, J.; Marr, I.; Puxbaum, H.; Limbeck, A. Size and composition of particulate emissions from motor vehicles in the Kaisermühlen-Tunnel, Vienna. Atmos. Environ. 2008, 42, 2173–2186. [Google Scholar] [CrossRef]
- Jamriska, M.; Morawska, L.; Thomas, S.; He, C. Diesel Bus Emissions Measured in a Tunnel Study. Environ. Sci. Technol. 2004, 38, 6701–6709. [Google Scholar] [CrossRef] [Green Version]
- Imhof, D.; Weingartner, E.; Prevot, A.; Ordonez, C.; Kurtenbach, R.; Wiesen, P.; Rodler, J.; Sturm, P.; McCrae, I.; Ekström, M.; et al. Aerosol and NOx emission factors and submicron particle number size distributions in two road tunnels with different traffic regimes. Atmos. Chem. Phys. Discuss. 2006, 6, 2215–2230. [Google Scholar] [CrossRef] [Green Version]
- Gaga, E.O.; Ari, A.; Akyol, N.; Üzmez, Ö.Ö.; Kara, M.; Chow, J.C.; Watson, J.G.; Özel, E.; Döğeroğlu, T.; Odabasi, M. Determination of real-world emission factors of trace metals, EC, OC, BTEX, and semivolatile organic compounds (PAHs, PCBs and PCNs) in a rural tunnel in Bilecik, Turkey. Sci. Total Environ. 2018, 643, 1285–1296. [Google Scholar] [CrossRef]
- Raparthi, N.; Debbarma, S.; Phuleria, H.C. Development of real-world emission factors for on-road vehicles from motorway tunnel measurements. Atmos. Environ. X 2021, 10, 100113. [Google Scholar] [CrossRef]
- Abdallah, C.; Afif, C.; Sauvage, S.; Borbon, A.; Salameh, T.; Kfoury, A.; Leonardis, T.; Karam, C.; Formenti, P.; Doussin, J.; et al. Determination of gaseous and particulate emission factors from road transport in a Middle Eastern capital. Transp. Res. Part D Transp. Environ. 2020, 83, 102361. [Google Scholar] [CrossRef]
- Li, X.; Dallmann, T.R.; May, A.A.; Presto, A.A. Seasonal and Long-Term Trend of on-Road Gasoline and Diesel Vehicle Emission Factors Measured in Traffic Tunnels. Appl. Sci. 2020, 10, 2458. [Google Scholar] [CrossRef] [Green Version]
- Dallmann, T.; Onasch, T.B.; Kirchstetter, T.W.; Worton, D.; Fortner, E.C.; Herndon, S.C.; Wood, E.C.; Franklin, J.P.; Worsnop, D.R.; Goldstein, A.H.; et al. Characterization of particulate matter emissions from on-road gasoline and diesel vehicles using a soot particle aerosol mass spectrometer. Atmos. Chem. Phys. Discuss. 2014, 14, 7585–7599. [Google Scholar] [CrossRef] [Green Version]
- Johnson, K.; Durbin, T.; Cocker, D.; Miller, W.; Bishnu, D.; Maldonado, H.; Moynahan, N.; Ensfield, C.; Laroo, C. On-road comparison of a portable emission measurement system with a mobile reference laboratory for a heavy-duty diesel vehicle. Atmos. Environ. 2009, 43, 2877–2883. [Google Scholar] [CrossRef]
- Lee, T.; Frey, H.C. Evaluation of Representativeness of Site-Specific Fuel-Based Vehicle Emission Factors for Route Average Emissions. Environ. Sci. Technol. 2012, 46, 6867–6873. [Google Scholar] [CrossRef]
- Wang, H.; Wu, Y.; Zhang, K.M.; Zhang, S.; Baldauf, R.W.; Snow, R.; Deshmukh, P.; Zheng, X.; He, L.; Hao, J. Evaluating mobile monitoring of on-road emission factors by comparing concurrent PEMS measurements. Sci. Total Environ. 2020, 736, 139507. [Google Scholar] [CrossRef]
- Ko, Y.-W.; Cho, C.-H. Characterization of large fleets of vehicle exhaust emissions in middle Taiwan by remote sensing. Sci. Total Environ. 2006, 354, 75–82. [Google Scholar] [CrossRef]
- Huang, Y.; Organ, B.; Zhou, J.L.; Surawski, N.; Hong, G.; Chan, E.F.; Yam, Y.S. Remote sensing of on-road vehicle emissions: Mechanism, applications and a case study from Hong Kong. Atmos. Environ. 2018, 182, 58–74. [Google Scholar] [CrossRef]
- Davison, J.; Bernard, Y.; Borken-Kleefeld, J.; Farren, N.; Hausberger, S.; Sjödin, Å.; Tate, J.E.; Vaughan, A.R.; Carslaw, D.C. Distance-based emission factors from vehicle emission remote sensing measurements. Sci. Total Environ. 2020, 739, 139688. [Google Scholar] [CrossRef] [PubMed]
- Wang, X.; Westerdahl, D.; Chen, L.C.; Wu, Y.; Hao, J.; Pan, X.; Guo, X.; Zhang, K.M. Evaluating the air quality impacts of the 2008 Beijing Olympic Games: On-road emission factors and black carbon profiles. Atmos. Environ. 2009, 43, 4535–4543. [Google Scholar] [CrossRef]
- Park, B.-E.; See, S.-B.; Lee, D.-H.; Lee, S.J.; Woo, D.-K.; Choi, J.-H.; Jin, H.-C.; Bae, G.-N.; Yun, S.-T. Spatial Distribution of Air Pollution Level inside Roadway Tunnels in Urban Area. Part. Aerosol Res. 2012, 8, 17–28. [Google Scholar]
- Burtscher, M. Measurement and Characteristics of Combustion Aerosols with Special Consideration of Photoelectric Charging and Charging by Flame Ions. J. Aerosol Sci. 1992, 23, 549–595. [Google Scholar] [CrossRef]
- Dunbar, J.C.; Lin, C.I.; Vergucht, I.; Wong, J.; Durant, J.L. Estimating the Contributions of Mobile Sources of PAH to Urban Air Using Real-time PAH Monitoring. Sci. Total Environ. 2001, 279, 1–19. [Google Scholar] [CrossRef]
- Kwak, K.-H.; Woo, S.H.; Kim, K.H.; Lee, S.-B.; Bae, G.-N.; Ma, Y.-I.; Sunwoo, Y.; Baik, J.-J. On-Road Air Quality Associated with Traffic Composition and Street-Canyon Ventilation: Mobile Monitoring and CFD Modeling. Atmosphere 2018, 9, 92. [Google Scholar] [CrossRef] [Green Version]
- Kim, K.H.; Kwak, K.-H.; Lee, J.Y.; Woo, S.H.; Kim, J.B.; Lee, S.-B.; Ryu, S.H.; Kim, C.H.; Bae, G.-N.; Oh, I. Spatial Mapping of a Highly Non-Uniform Distribution of Particle-Bound PAH in a Densely Populated Urban Area. Atmosphere 2020, 11, 496. [Google Scholar] [CrossRef]
- Kim, K.H.; Woo, D.; Lee, S.-B.; Bae, G.-N. On-Road Measurements of Ultrafine Particles and Associated Air Pollutants in a Densely Populated Area of Seoul, Korea. Aerosol Air Qual. Res. 2015, 15, 142–153. [Google Scholar] [CrossRef] [Green Version]
- Kim, K.H.; Lee, S.-B.; Woo, D.; Bae, G.-N. Influence of wind direction and speed on the transport of particle-bound PAHs in a roadway environment. Atmos. Pollut. Res. 2015, 6, 1024–1034. [Google Scholar] [CrossRef]
- Kim, K.H.; Lee, S.-B.; Woo, S.H.; Bae, G.-N. NOx profile around a signalized intersection of busy roadway. Atmos. Environ. 2014, 97, 144–154. [Google Scholar] [CrossRef]
- Gouriou, F.; Morin, J.-P.; Weill, M.-E. On-road measurements of particle number concentrations and size distributions in urban and tunnel environments. Atmos. Environ. 2004, 38, 2831–2840. [Google Scholar] [CrossRef]
- NIER. Establishment of Climate Change Responding System for Transport Sector (II). Transp. Pollut. Res. Cent. Natl. Inst. Environ. Res. 2009, 27, 64–69. [Google Scholar]
- Lee, T.-W.; Keel, J.-H.; Park, J.-H.; Park, Y.-H.; Hong, J.-H.; Lee, D.-Y. Speed-based Emission Factor regarding Vehicle Specific Power and Acceleration during On-road Driving. Trans. KSAE 2011, 19, 73–81. [Google Scholar]
- Huo, H.; Yao, Z.; Zhang, Y.; Shen, X.; Zhang, Q.; Ding, Y.; He, K. On-board measurements of emissions from light-duty gasoline vehicles in three mega-cities of China. Atmos. Environ. 2012, 49, 371–377. [Google Scholar] [CrossRef]
- Lee, T.; Park, J.; Kwon, S.; Lee, J.; Kim, J. Variability in operation-based NOx emission factors with different test routes, and its effects on the real-driving emissions of light diesel vehicles. Sci. Total Environ. 2013, 461–462, 377–385. [Google Scholar] [CrossRef] [PubMed]
Figure 1.
Schematic of the control volume in a tunnel.

Figure 2.
Monitoring area of the roadway tunnels in this study (Adapted from Park et al. [26]).
Figure 2.
Monitoring area of the roadway tunnels in this study (Adapted from Park et al. [26]).

Figure 3.
Side-view diagram of the tunnels in this study (Adapted from Park et al. [26]).
Figure 3.
Side-view diagram of the tunnels in this study (Adapted from Park et al. [26]).

Figure 4.
CO2 concentration profile obtained on 8 February.

Figure 5.
Comparison of measured and predicted CO2 concentrations inside the Hongjimun Tunnel on 8 February.
Figure 5.
Comparison of measured and predicted CO2 concentrations inside the Hongjimun Tunnel on 8 February.

Figure 6.
Changes in CO2 emission factors estimated by the traditional method with the mobile laboratory data measured inside the Jeongneung Tunnel on 8 February.
Figure 6.
Changes in CO2 emission factors estimated by the traditional method with the mobile laboratory data measured inside the Jeongneung Tunnel on 8 February.


Table 1.
Outlines of the mobile monitoring measurements from inside the tunnels.
| Date | 8 February | 22 February | 8 March | 15 March |
|---|---|---|---|---|
| Traveling time (s) (b) | 101/94 | 232/107 | 101/84 | 115/86 |
| Average vehicle speed (km h−1) (b) | 67/65 | 29/56 | 67/71 | 59/66 |
| LDV/MDV/HDV (a) traffic volume (vehicles h−1) (traffic percentage) | 2073/1374/241 (56/37/7%) | 2166/1421/210 (57/37/6%) | 1987/1366/246 (55/38/7%) | 2001/1429/286 (54/38/8%) |
| Velocity of airflow (m s−1) (b) | 6.7/6.2 | 4.1/6.1 | 6.8/7.9 | 7.5/7.7 |
| Temperature/RH (°C/%) | 6/40 | 11/40 | 8/41 | 8/27 |
| Wind direction/speed (c) (o/m s−1) | 68/1.6 | 278/2.5 | 226/7.5 | 281/6.0 |
(a) LDV: light-duty vehicle, MDV: medium-duty vehicle, HDV: heavy-duty vehicle, (b) Hongjimun/Jeongneung tunnels, (c) Automatic weather station data at Songwol-dong, Seoul.
Table 2.
Summary of the estimated CO2, PM-PAH, and NOx emission factors.
| Date | Hongjimun Tunnel | Jeongneung Tunnel | ||||
|---|---|---|---|---|---|---|
| CO2 (g km−1) | PM-PAHs (g km−1) | NOx (g km−1) | CO2 (g km−1) | PM-PAHs (g km−1) | NOx (g km−1) | |
| 8 February | 201 | NA (a) | NA (a) | 136 | NA (a) | NA (a) |
| 22 February | 237 | 4.7 | 0.301 | 200 | 3.7 × 10⁻⁴ | 0.458 |
| 8 March | 202 | 4.5 × 10⁻⁴ | 0.415 | 157 | 3.5 × 10⁻⁴ | 0.381 |
| 15 March | 253 | 5.2 × 10⁻⁴ | 0.726 | 193 | 3.3 × 10⁻⁴ | 0.896 |
| Average | 223 ± 26 | 4.8 × 10⁻⁴ ± 0.4 × 10⁻⁴ | 0.481 ± 0.220 | 172 ± 30 | 3.5 × 10⁻⁴ ± 0.2 × 10⁻⁴ | 0.578 ± 0.278 |
(a) NA: not applicable.
Table 3.
Estimated emission factors of air pollutants by vehicles.
| Pollutant | This Study (a) (Range) | Literature Values at the Speed of 68 km h−1 |
|---|---|---|
| CO2 (g km−1) | 197 ± 38 (136–253) | LD GV (b) 116 [35] MD RV (c) 153 [35], 184 [36] HD Bus (d) 637 [34] |
| PM-PAHs (g km−1) | 4.2 ± 0.8 × 10⁻⁴ (3.3–5.2 × 10⁻⁴) | 1.2 (e)–30.1 (f) × 10−4 [10] |
| NOx (g km−1) | 0.530 ± 0.230 (0.301–0.896) | LDGV 0.05–0.47 [37] LDDV (g) 0.19–1.41 [38] LDDT (h) 0.55–1.83 [6] |
(a) Light-, medium-, and heavy-duty vehicles with 54%, 36%, and 10%, respectively, at the average speed of ~60 km h−1, (b) Light-duty gasoline vehicle, (c) Medium-duty diesel recreation vehicle, (d) Heavy-duty diesel bus, (e) Light-duty vehicle, (f) Heavy-duty vehicle, (g) Light-duty diesel vehicle, (h) Light-duty diesel truck.
Publisher’s Note: MDPI stays neutral with regard to jurisdictional claims in published maps and institutional affiliations. |
© 2021 by the authors. Licensee MDPI, Basel, Switzerland. This article is an open access article distributed under the terms and conditions of the Creative Commons Attribution (CC BY) license (https://creativecommons.org/licenses/by/4.0/).
Share and Cite
MDPI and ACS Style
Lee, S.-B.; Kim, K.H.; Park, B.-E.; Bae, G.-N. A Fast Method for Estimating the Emission Factors of Air Pollutants from In-Use Vehicles Fleet. Appl. Sci. 2021, 11, 7206. https://0-doi-org.brum.beds.ac.uk/10.3390/app11167206
AMA Style
Lee S-B, Kim KH, Park B-E, Bae G-N. A Fast Method for Estimating the Emission Factors of Air Pollutants from In-Use Vehicles Fleet. Applied Sciences. 2021; 11(16):7206. https://0-doi-org.brum.beds.ac.uk/10.3390/app11167206
Chicago/Turabian StyleLee, Seung-Bok, Kyung Hwan Kim, Bo-Eun Park, and Gwi-Nam Bae. 2021. "A Fast Method for Estimating the Emission Factors of Air Pollutants from In-Use Vehicles Fleet" Applied Sciences 11, no. 16: 7206. https://0-doi-org.brum.beds.ac.uk/10.3390/app11167206
Note that from the first issue of 2016, this journal uses article numbers instead of page numbers. See further details here.