
Evaluating Prediction Models of Creep and Drying Shrinkage of Self-Consolidating Concrete Containing Supplementary Cementitious Materials/Fillers


Abstract
:1. Introduction
1.1. Creep Models
1.2. Drying Shrinkage Models
2. Experimental Investigation
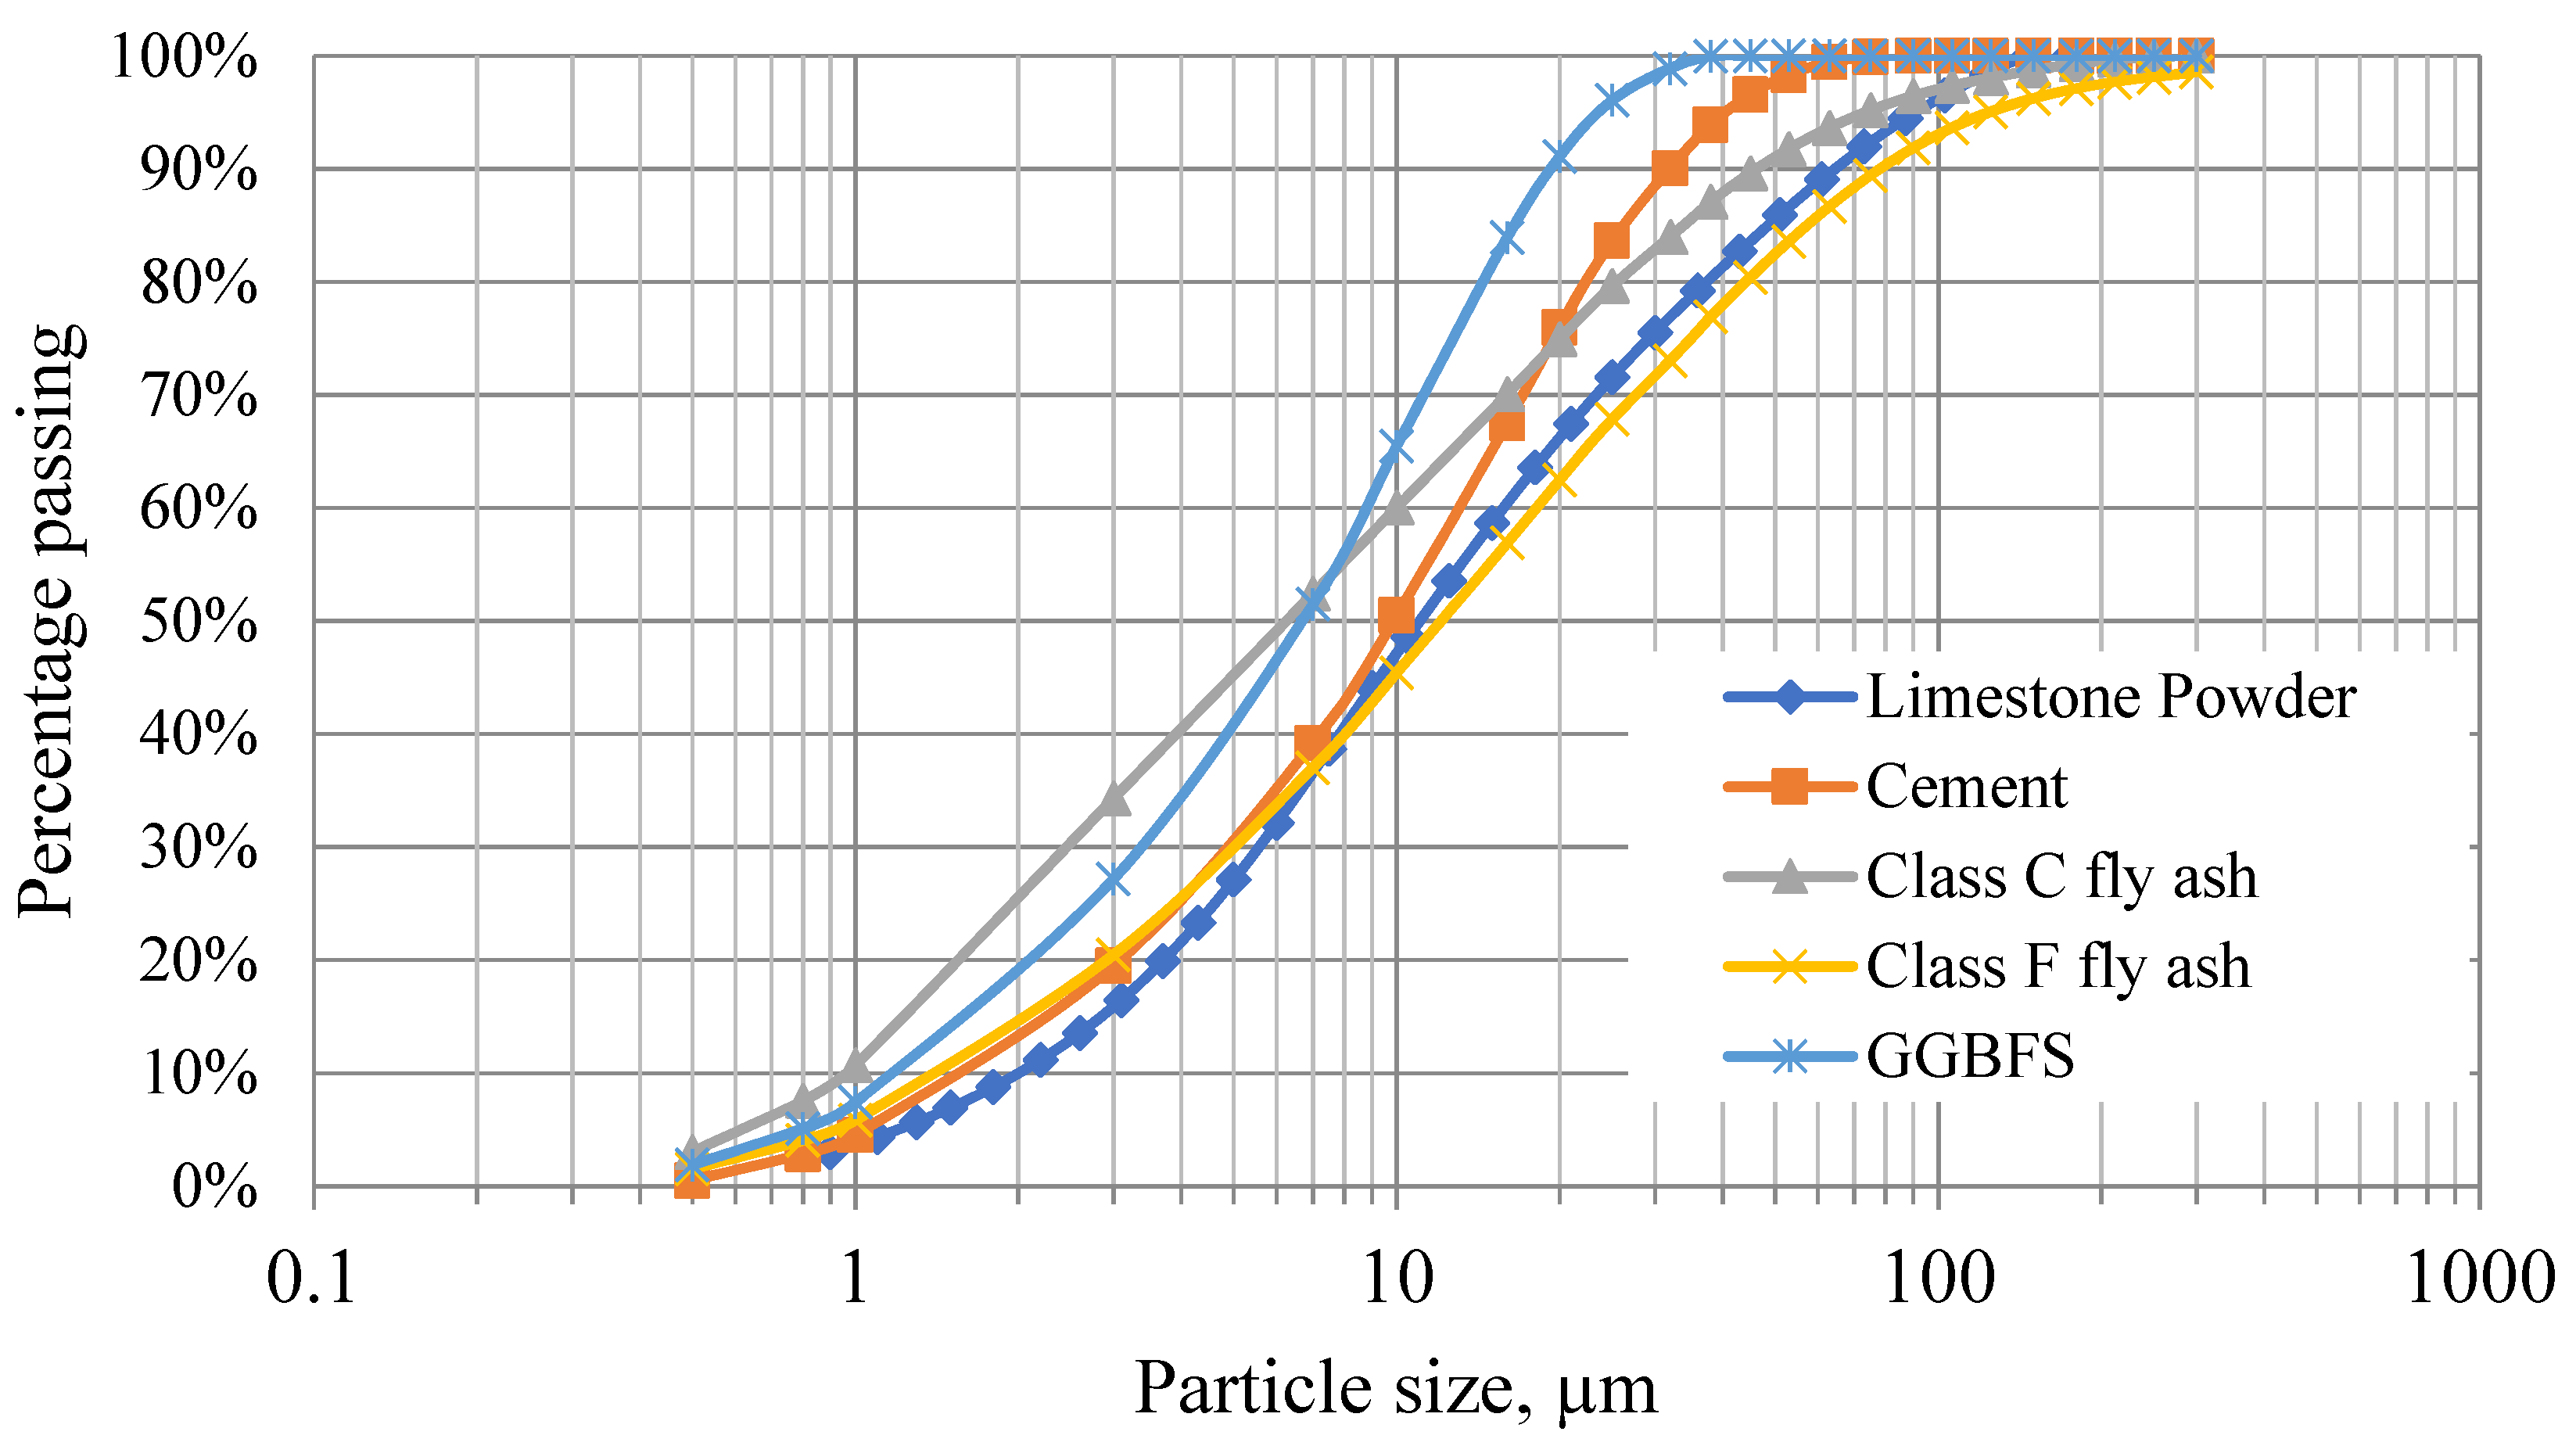
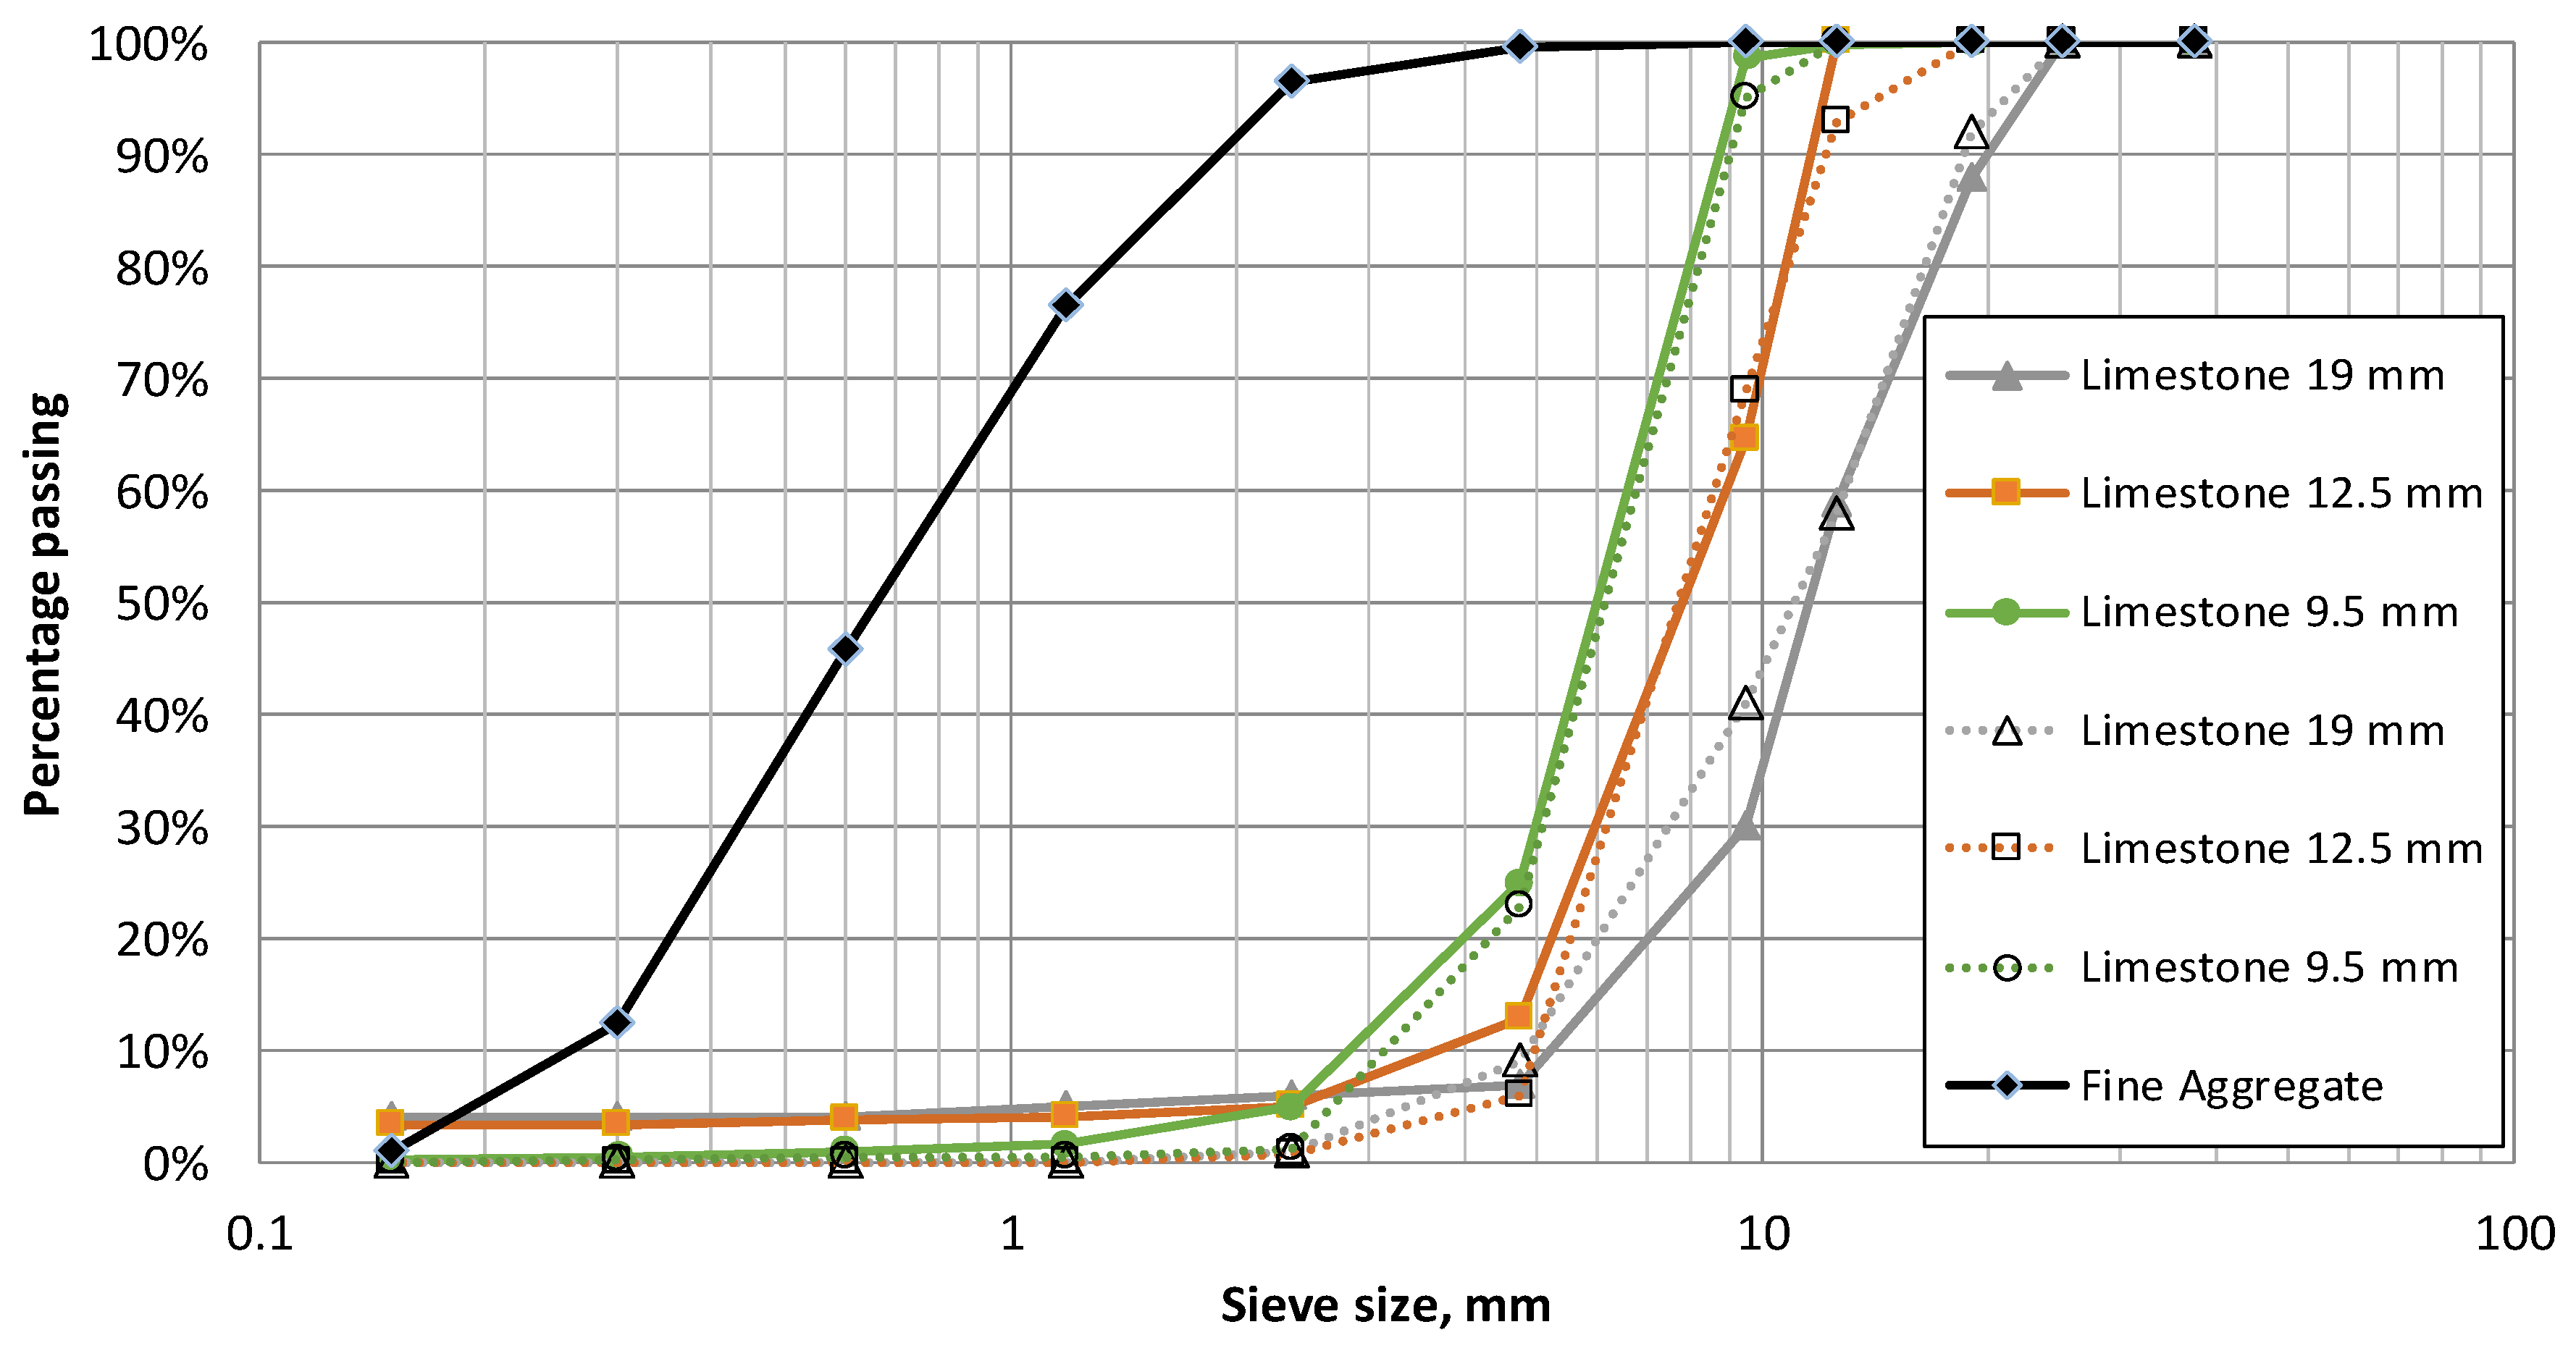
2.1. Material Properties
2.2. Mixture Proportioning
2.3. Workability Testing
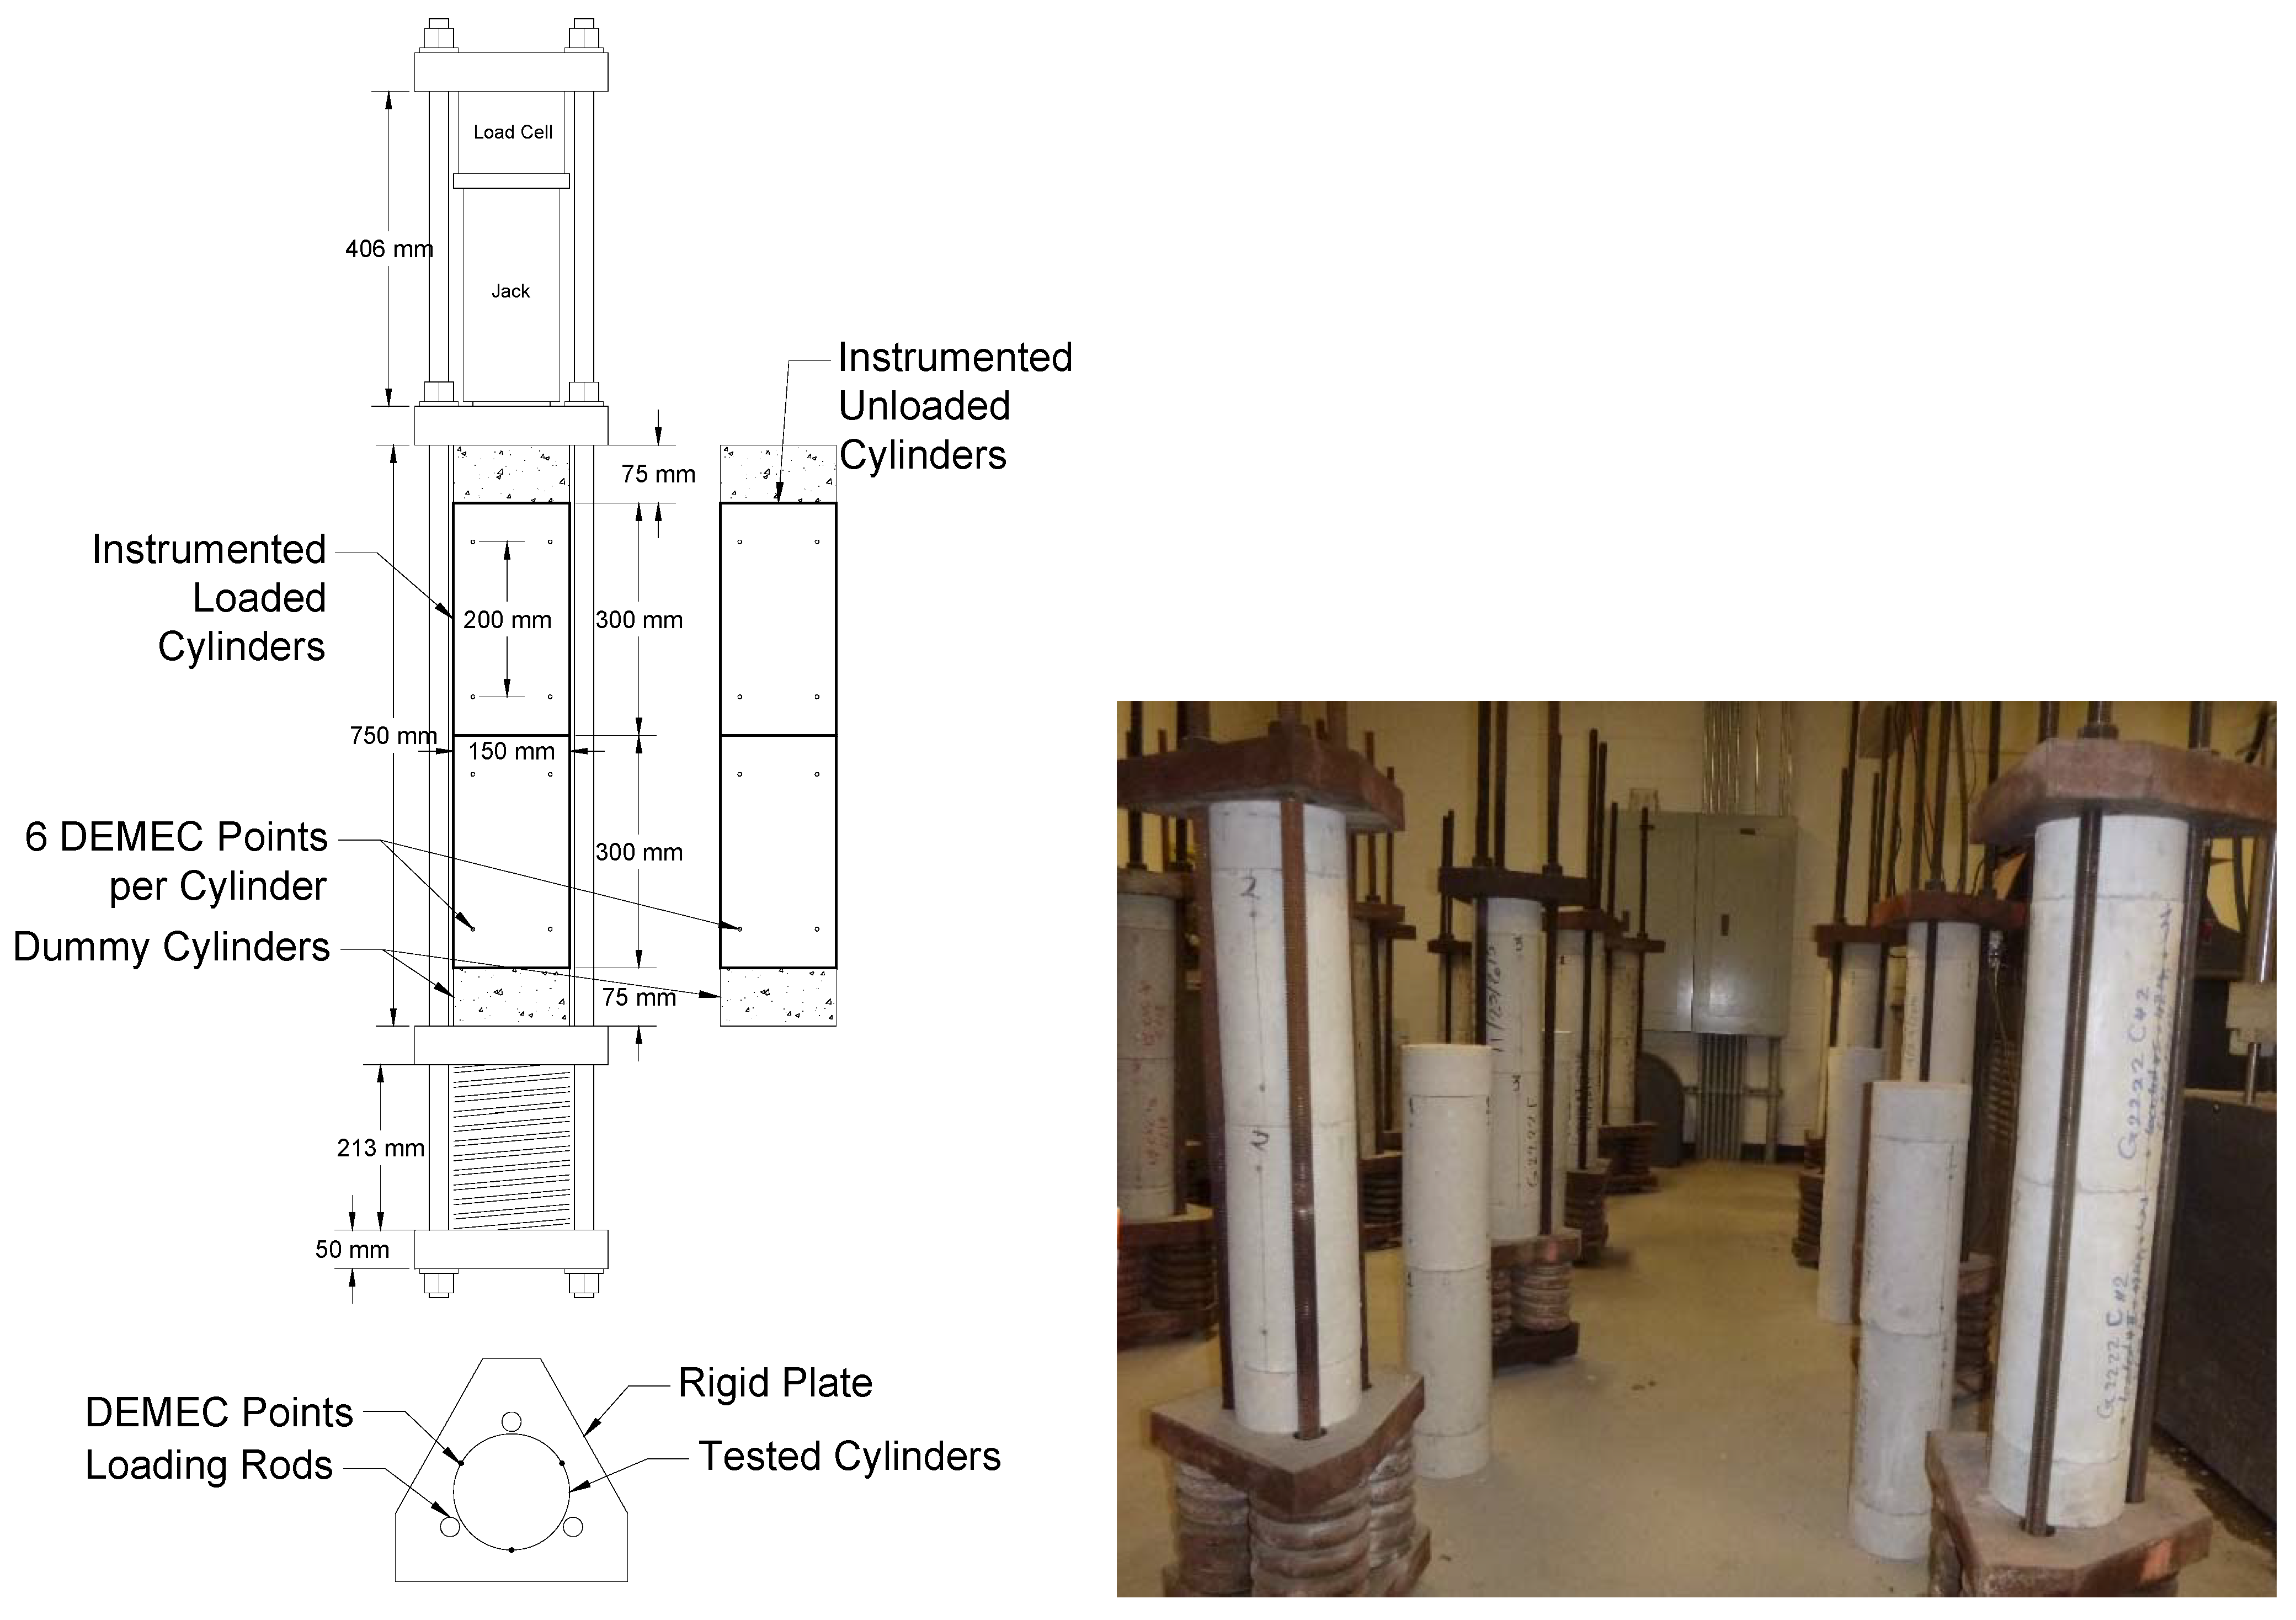
2.4. Creep Testing
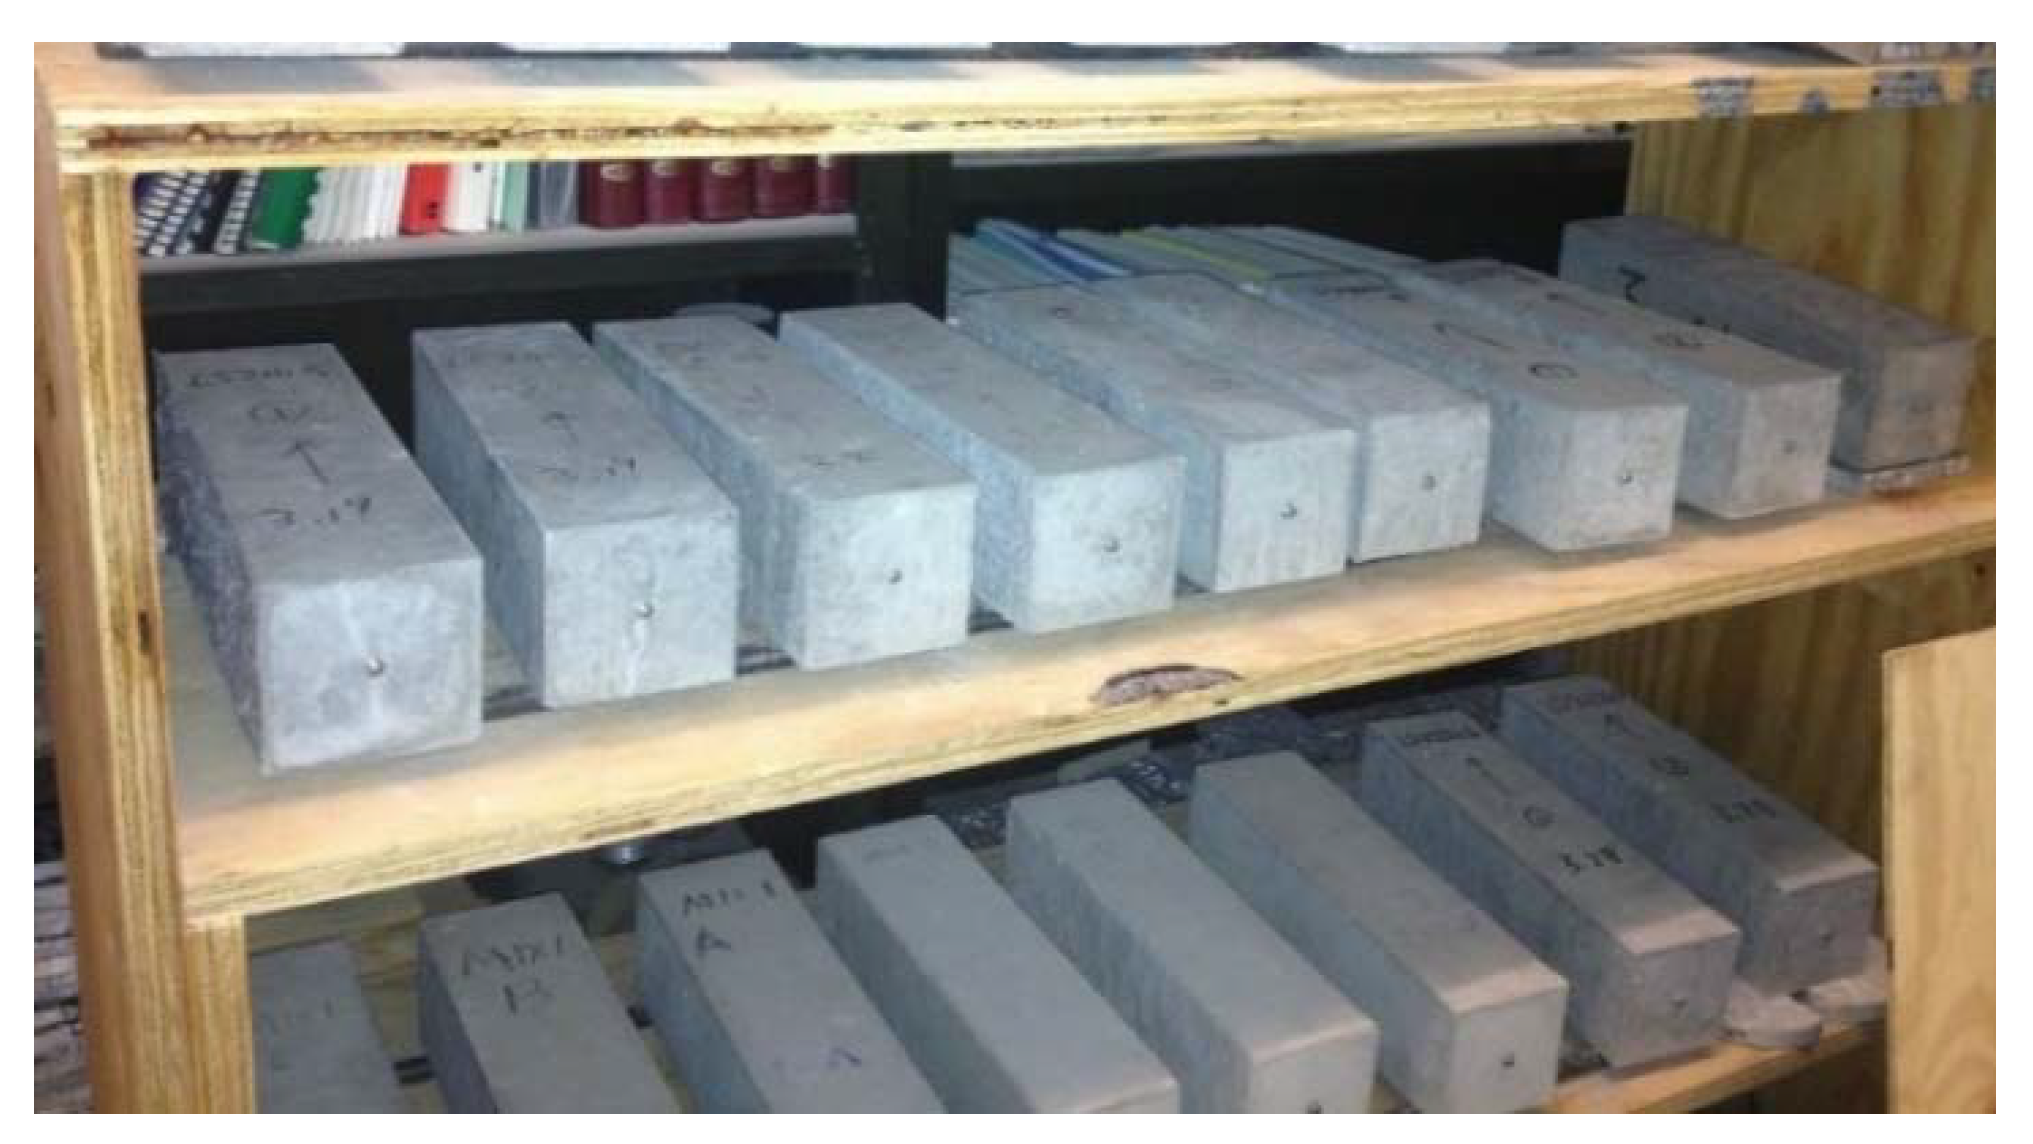
2.5. Drying Shrinkage Testing
3. Results and Discussion
3.1. Workability Properties
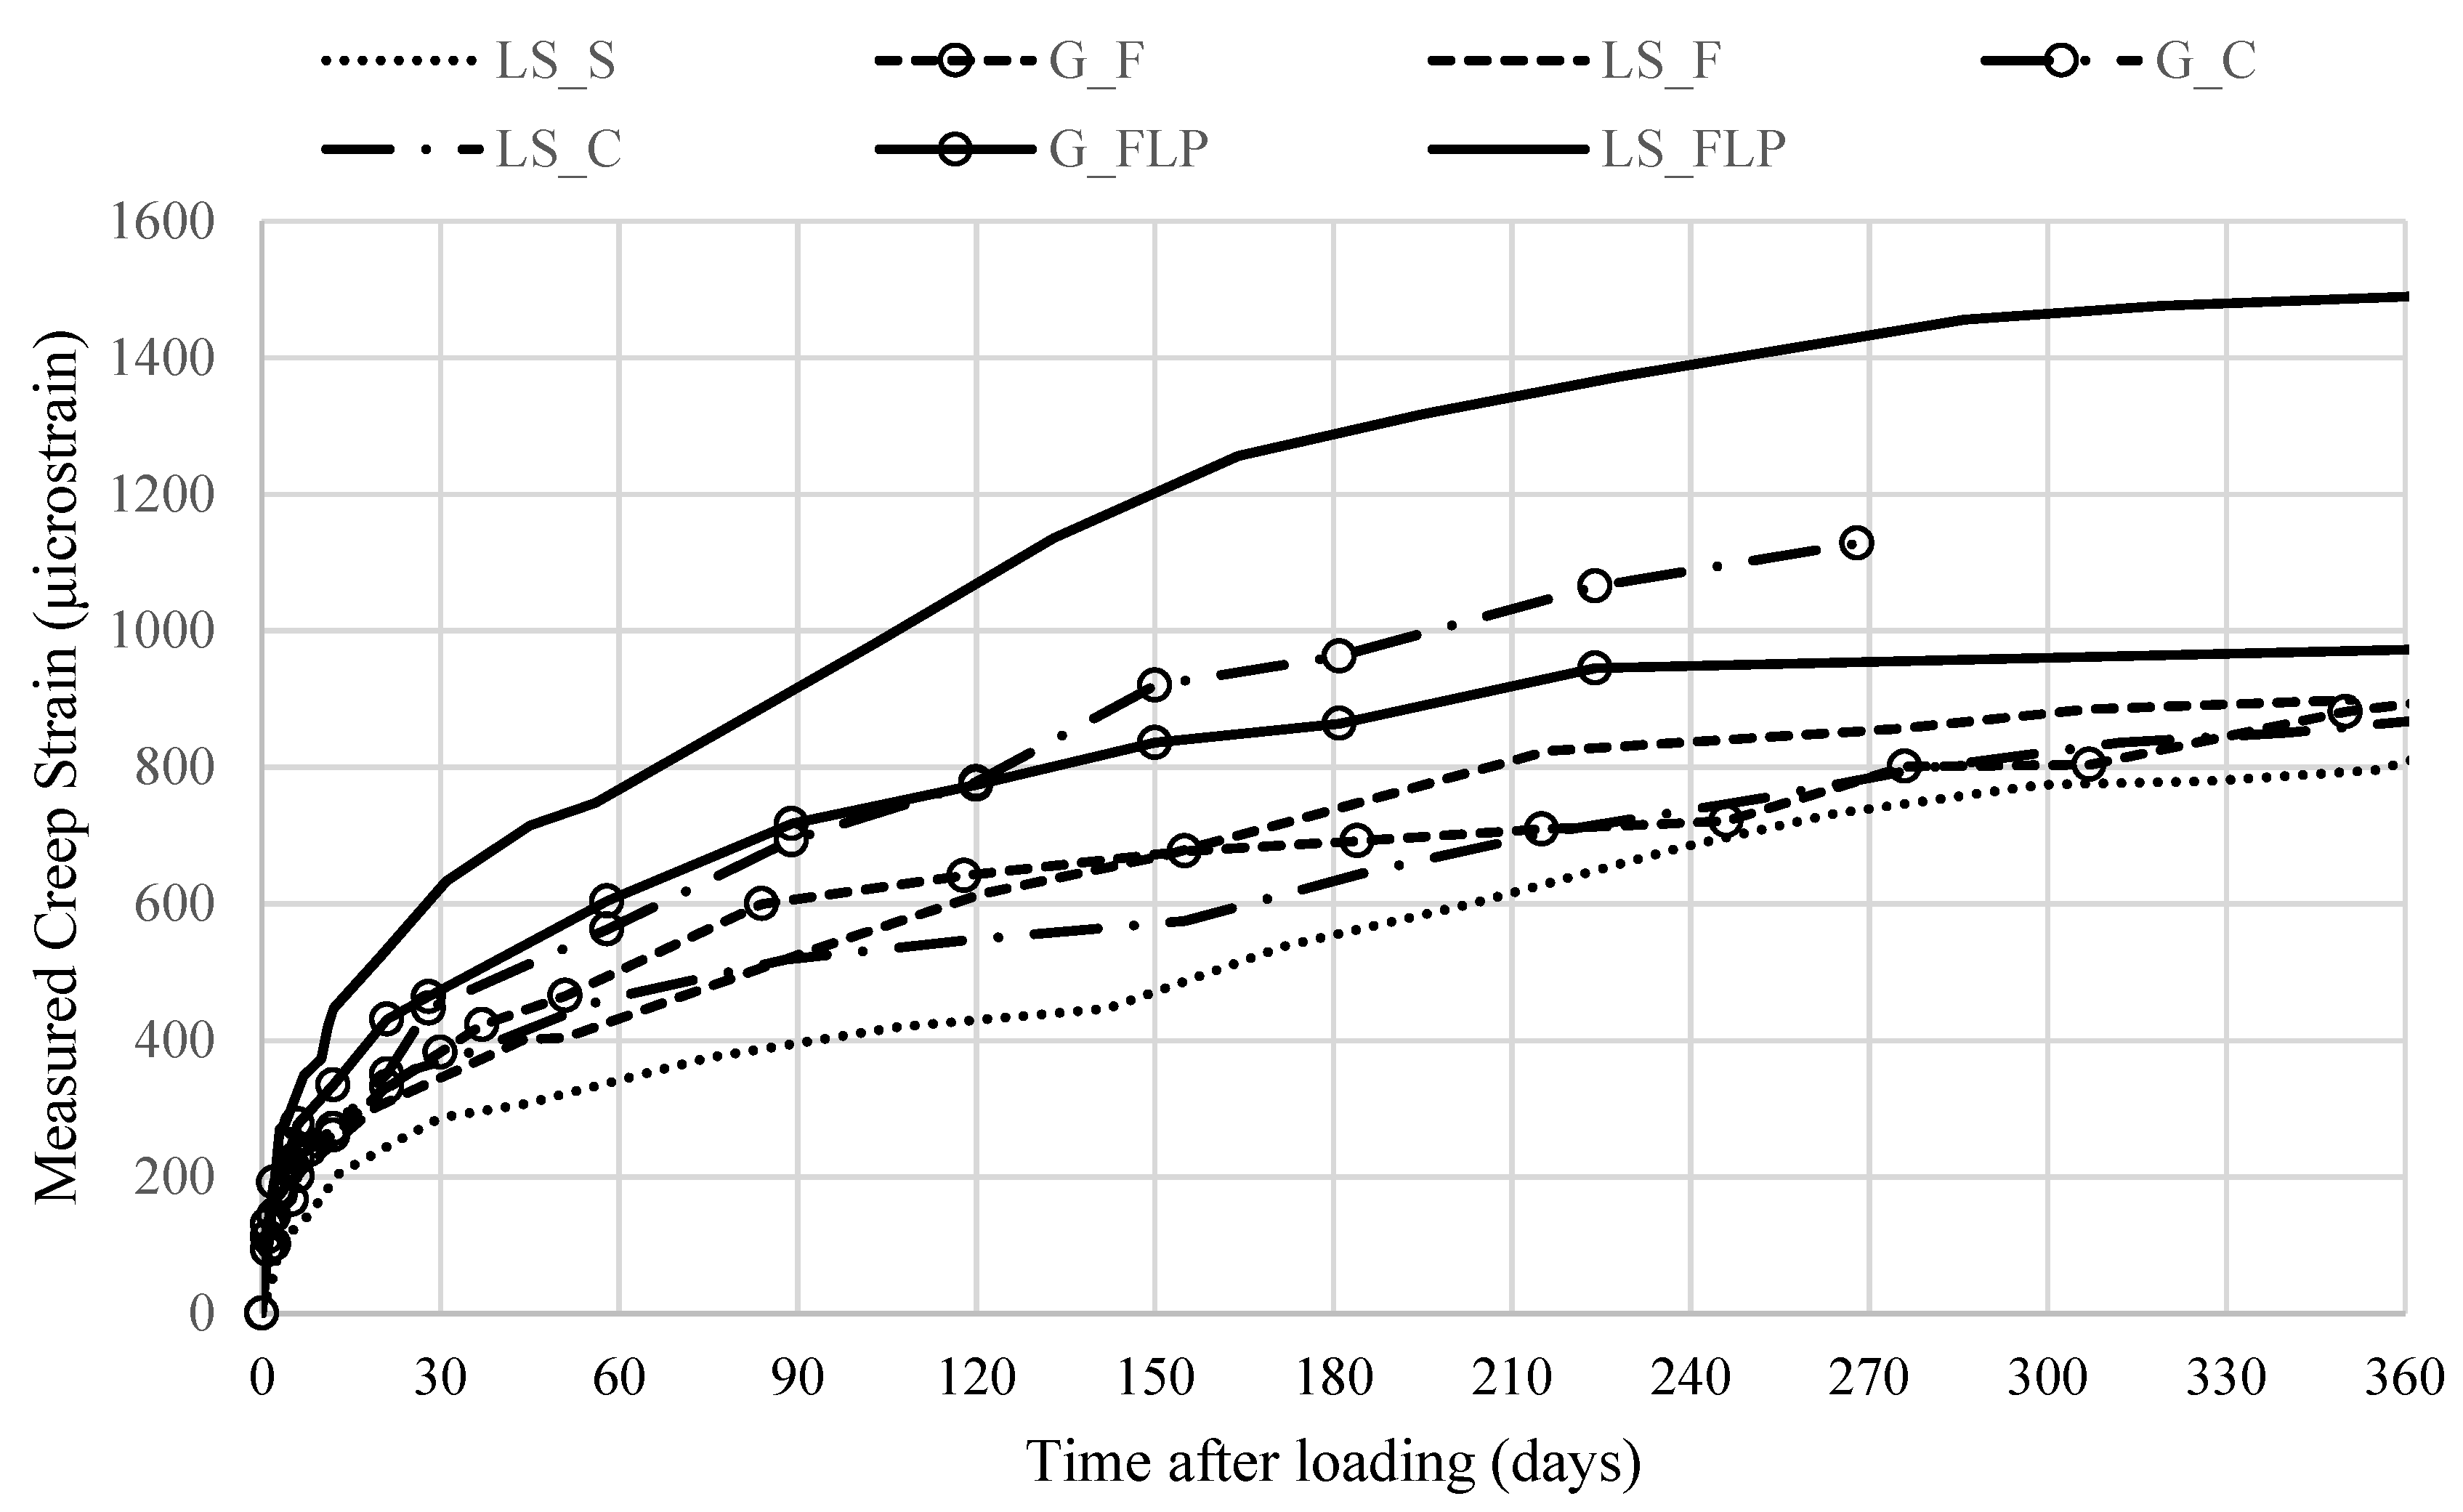
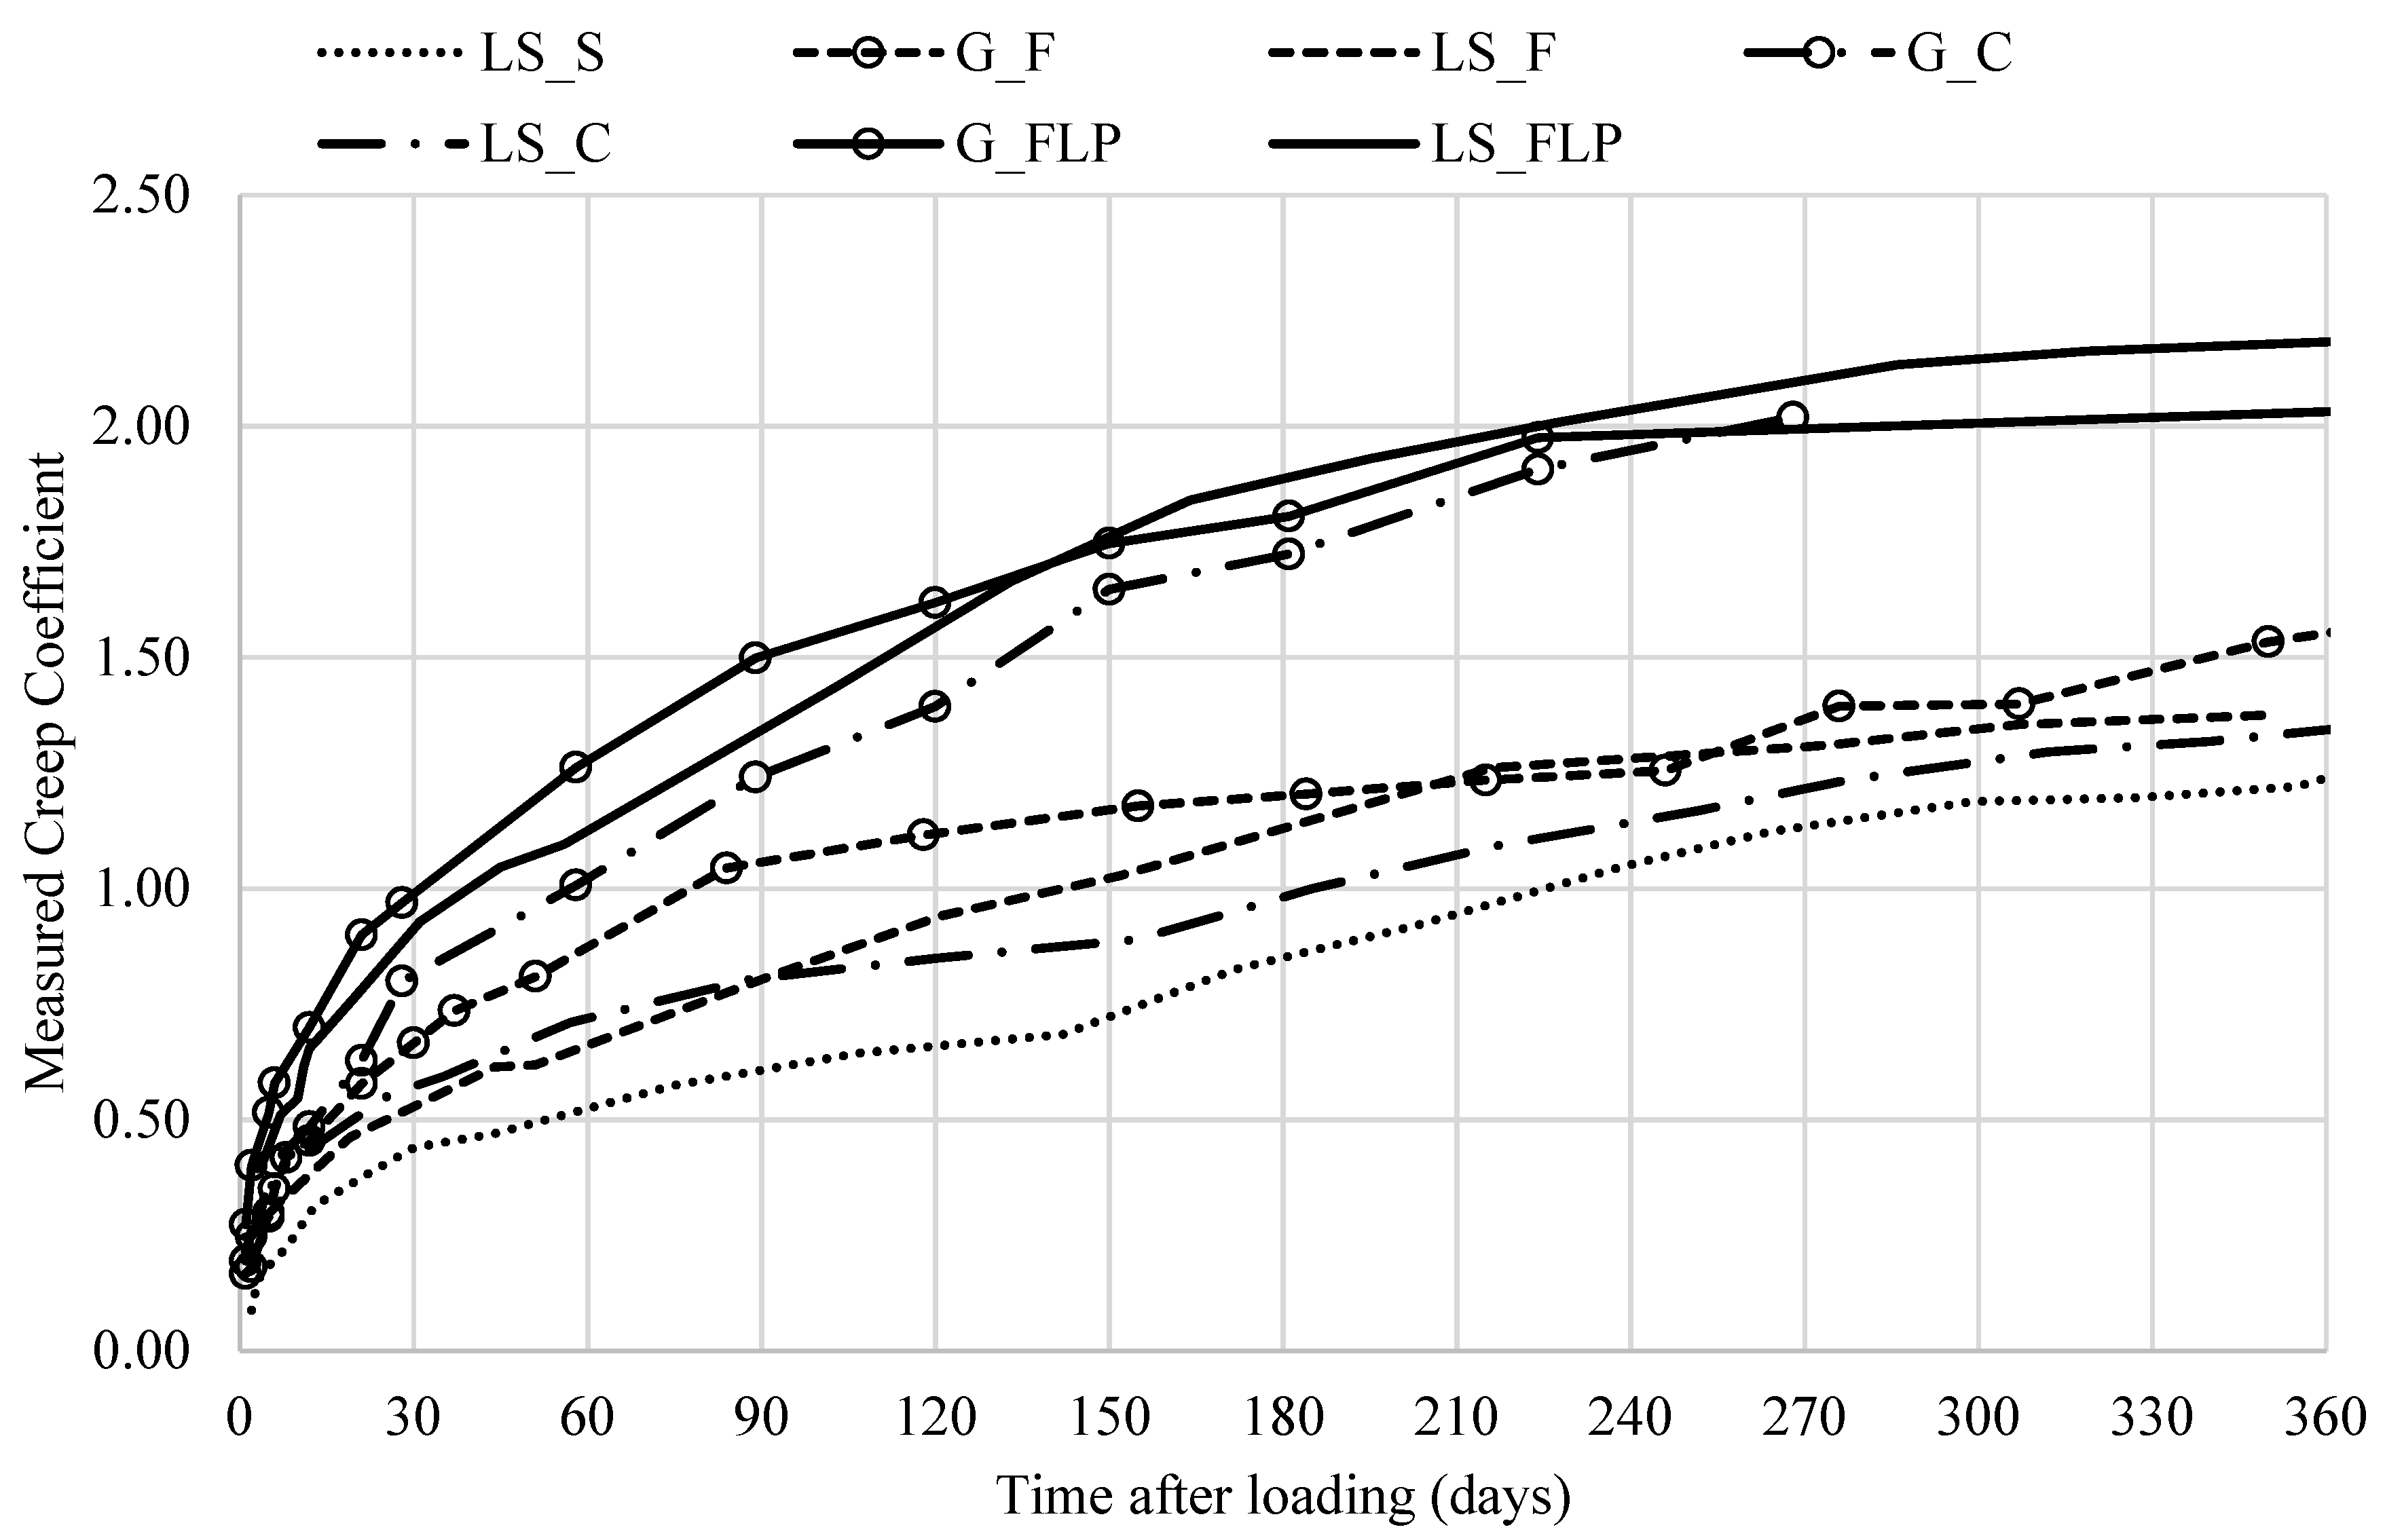
3.2. Creep Coefficient
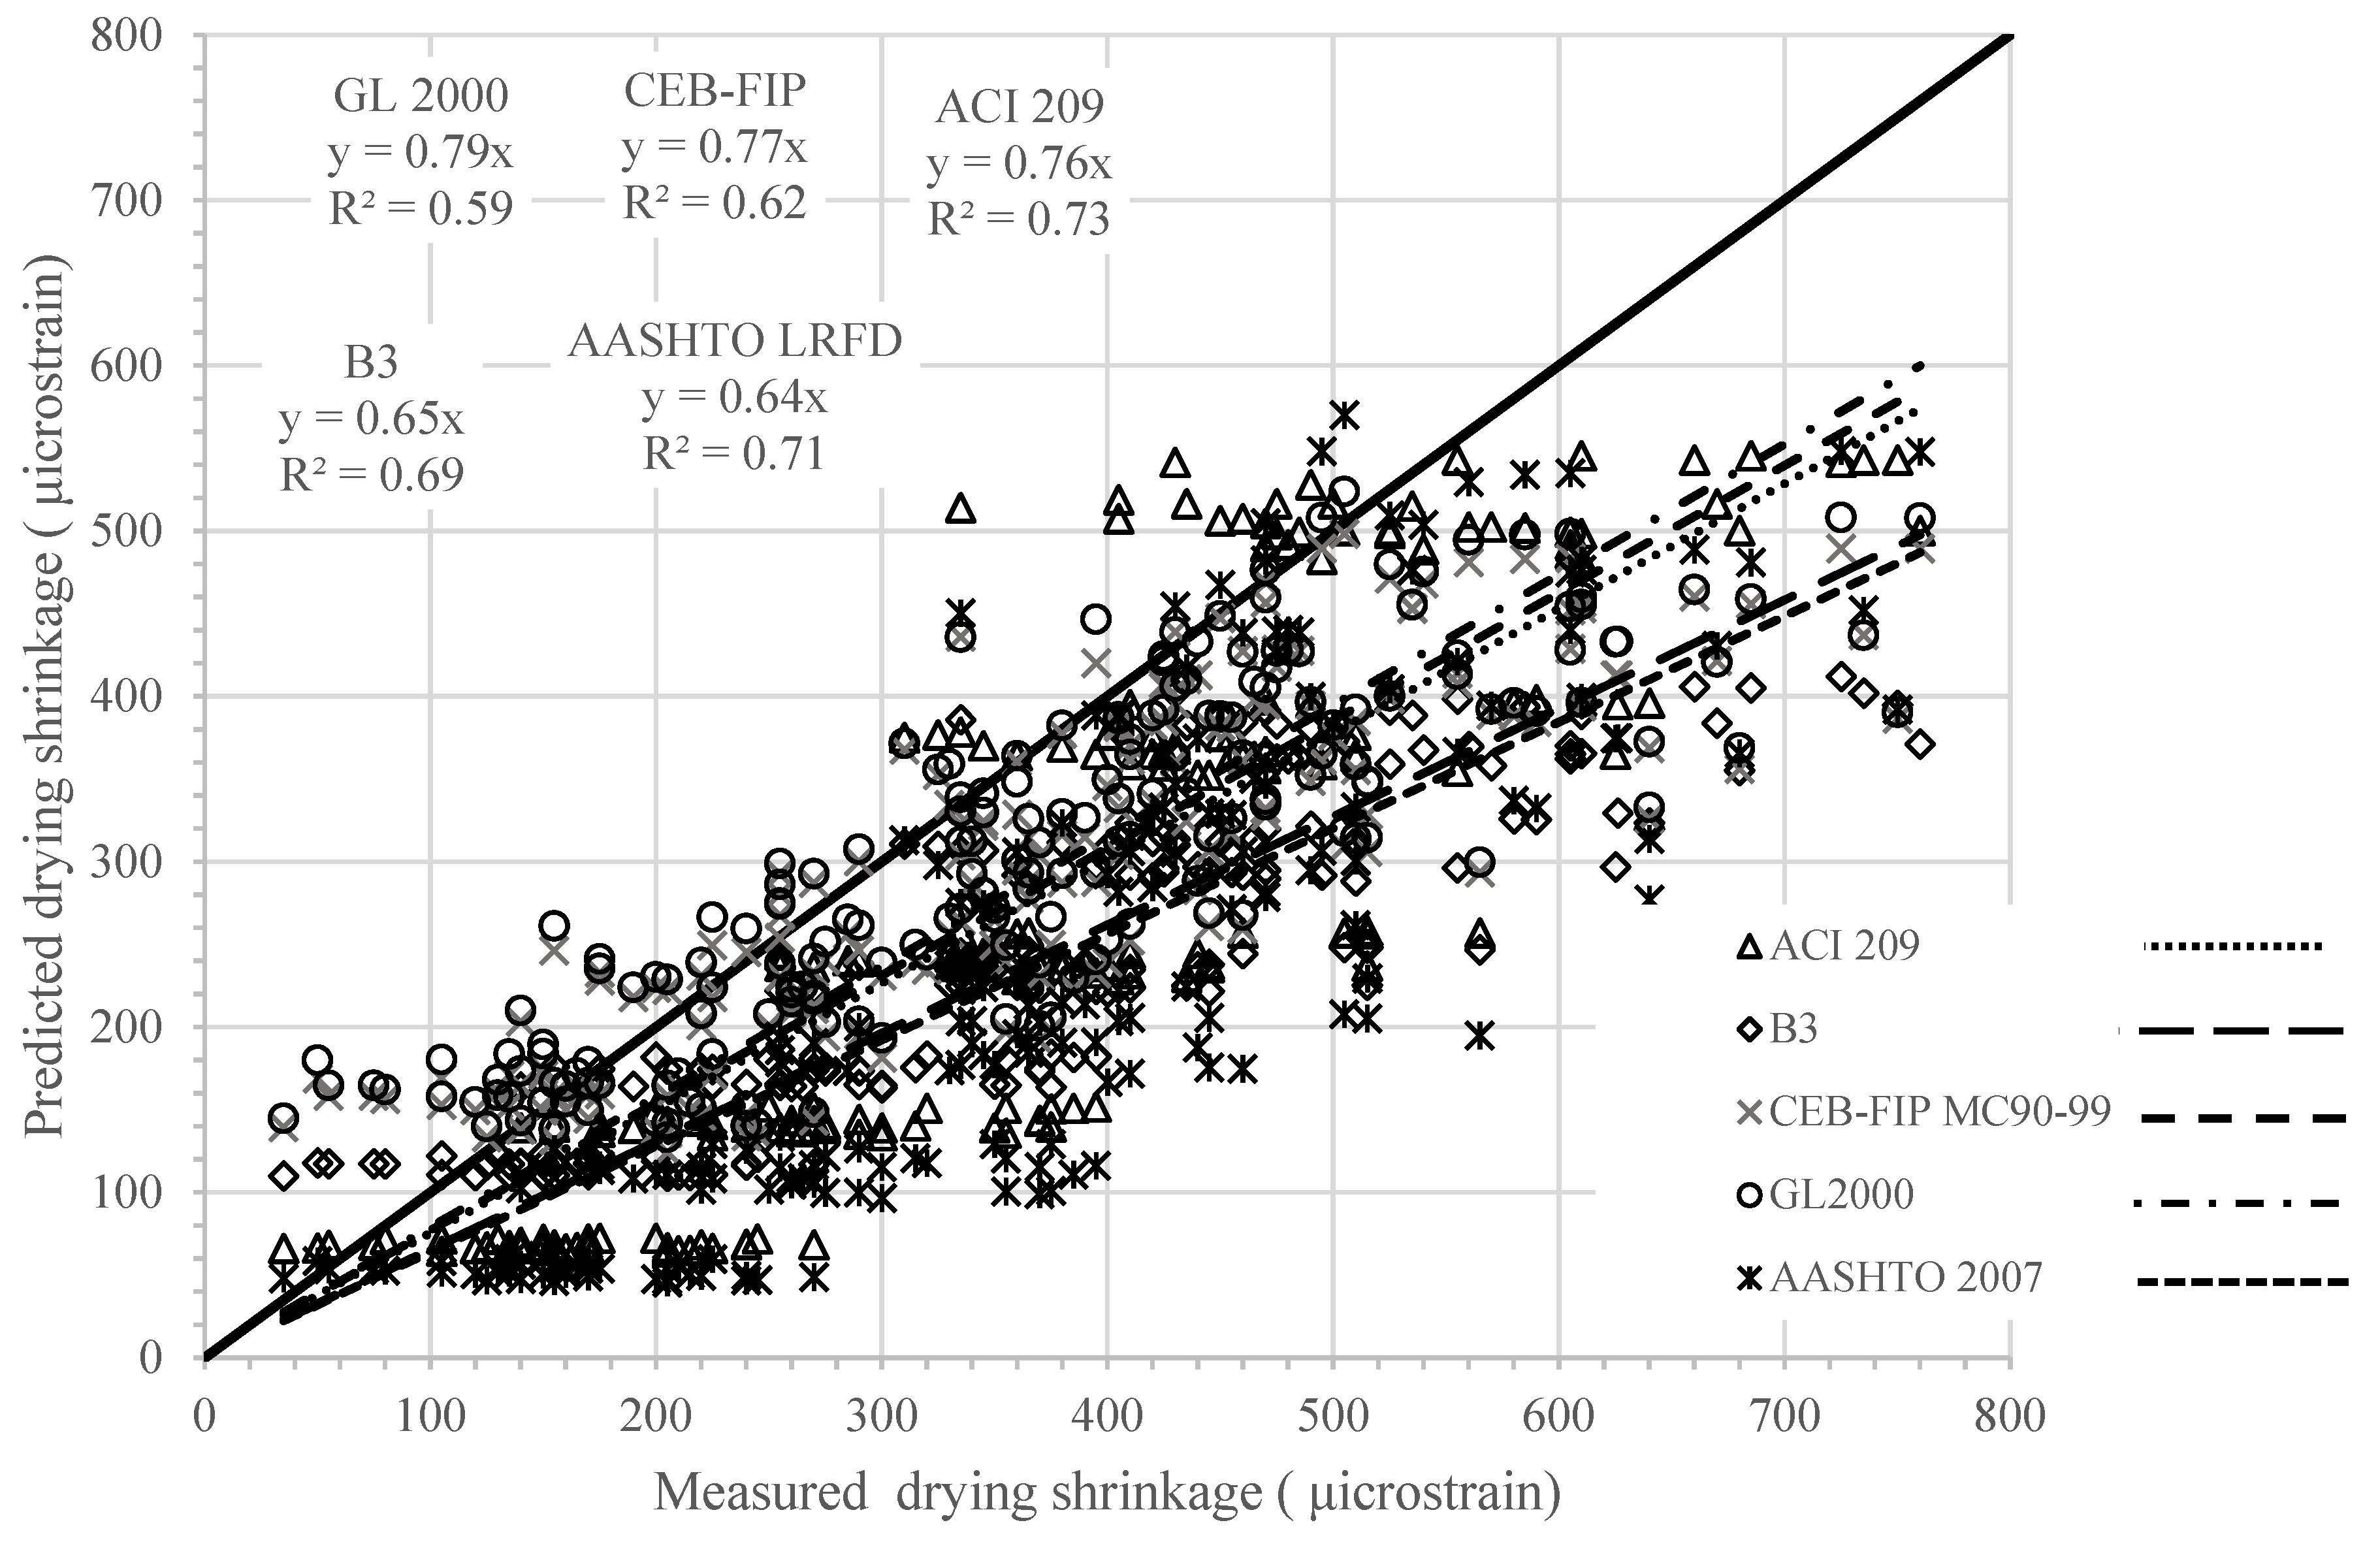
3.3. Drying Shrinkage Strains
4. Conclusions
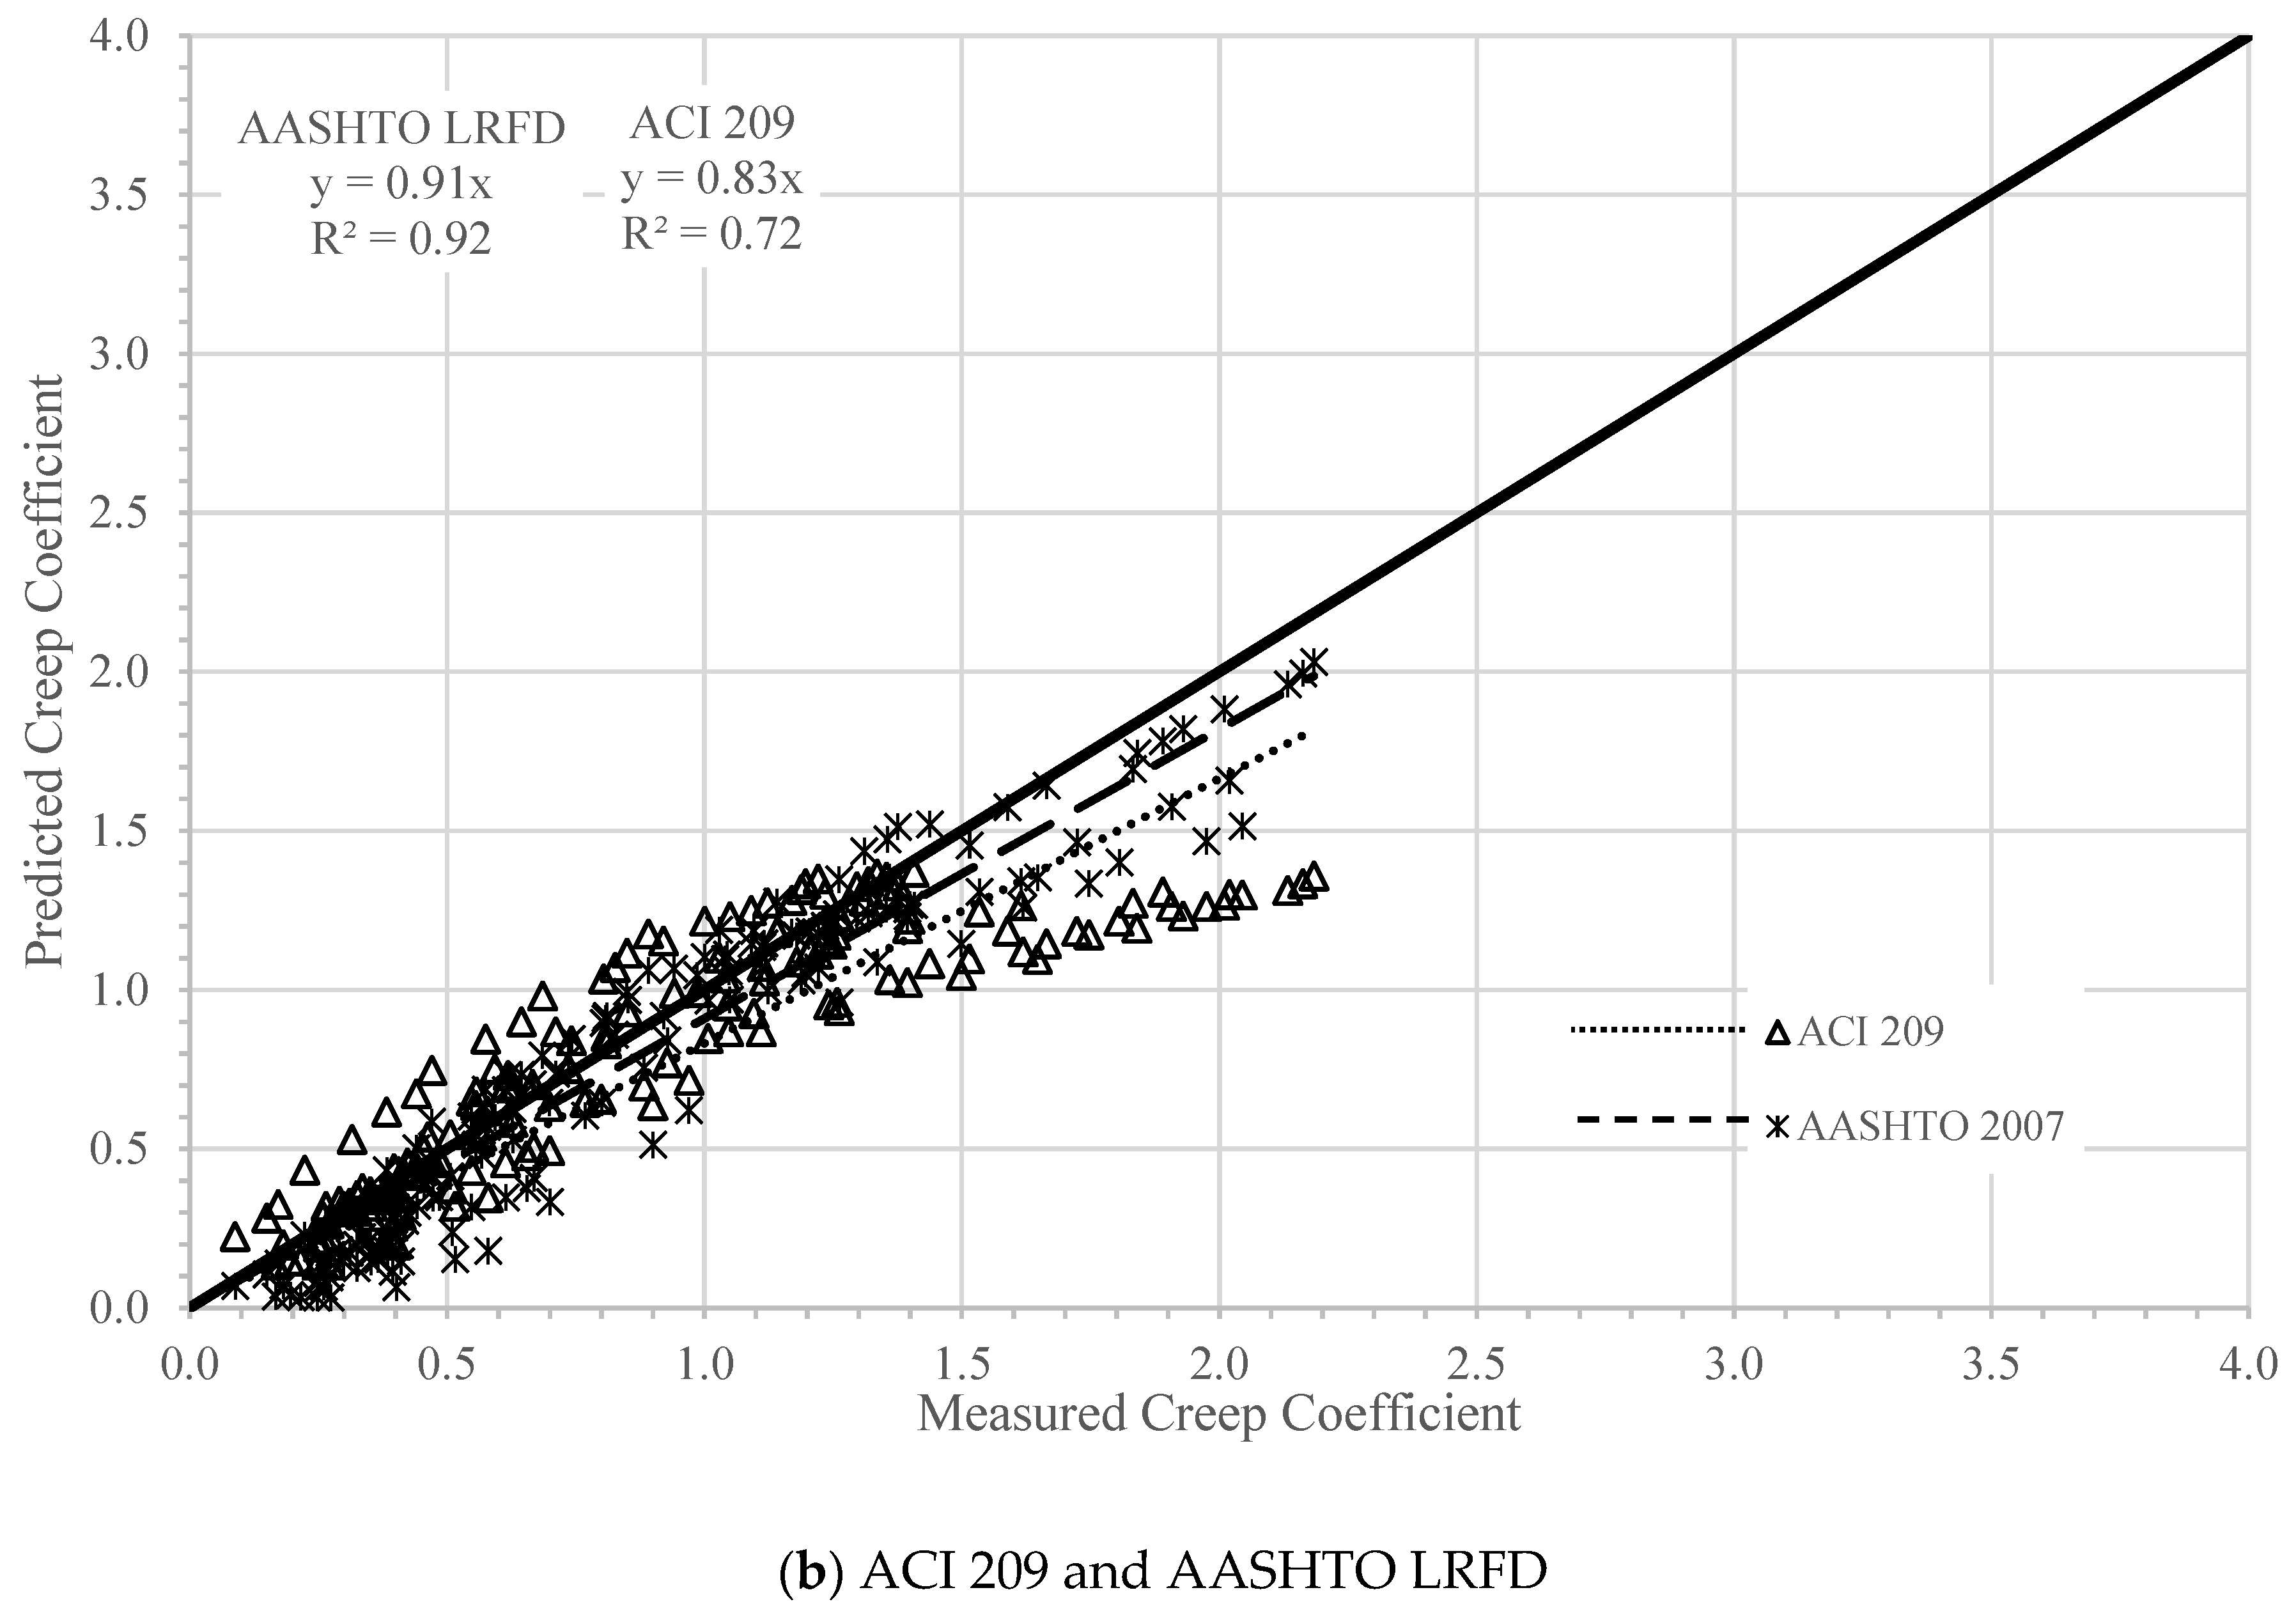
- The AASHTO LRFD model provided better prediction for creep coefficient of SCC with lower scattering of data when different types of SCM/filler were used. On the other hand, using limestone powder increased measured creep strains more than predicted and required the use of a modification factor (greater than 1.0) in all models.
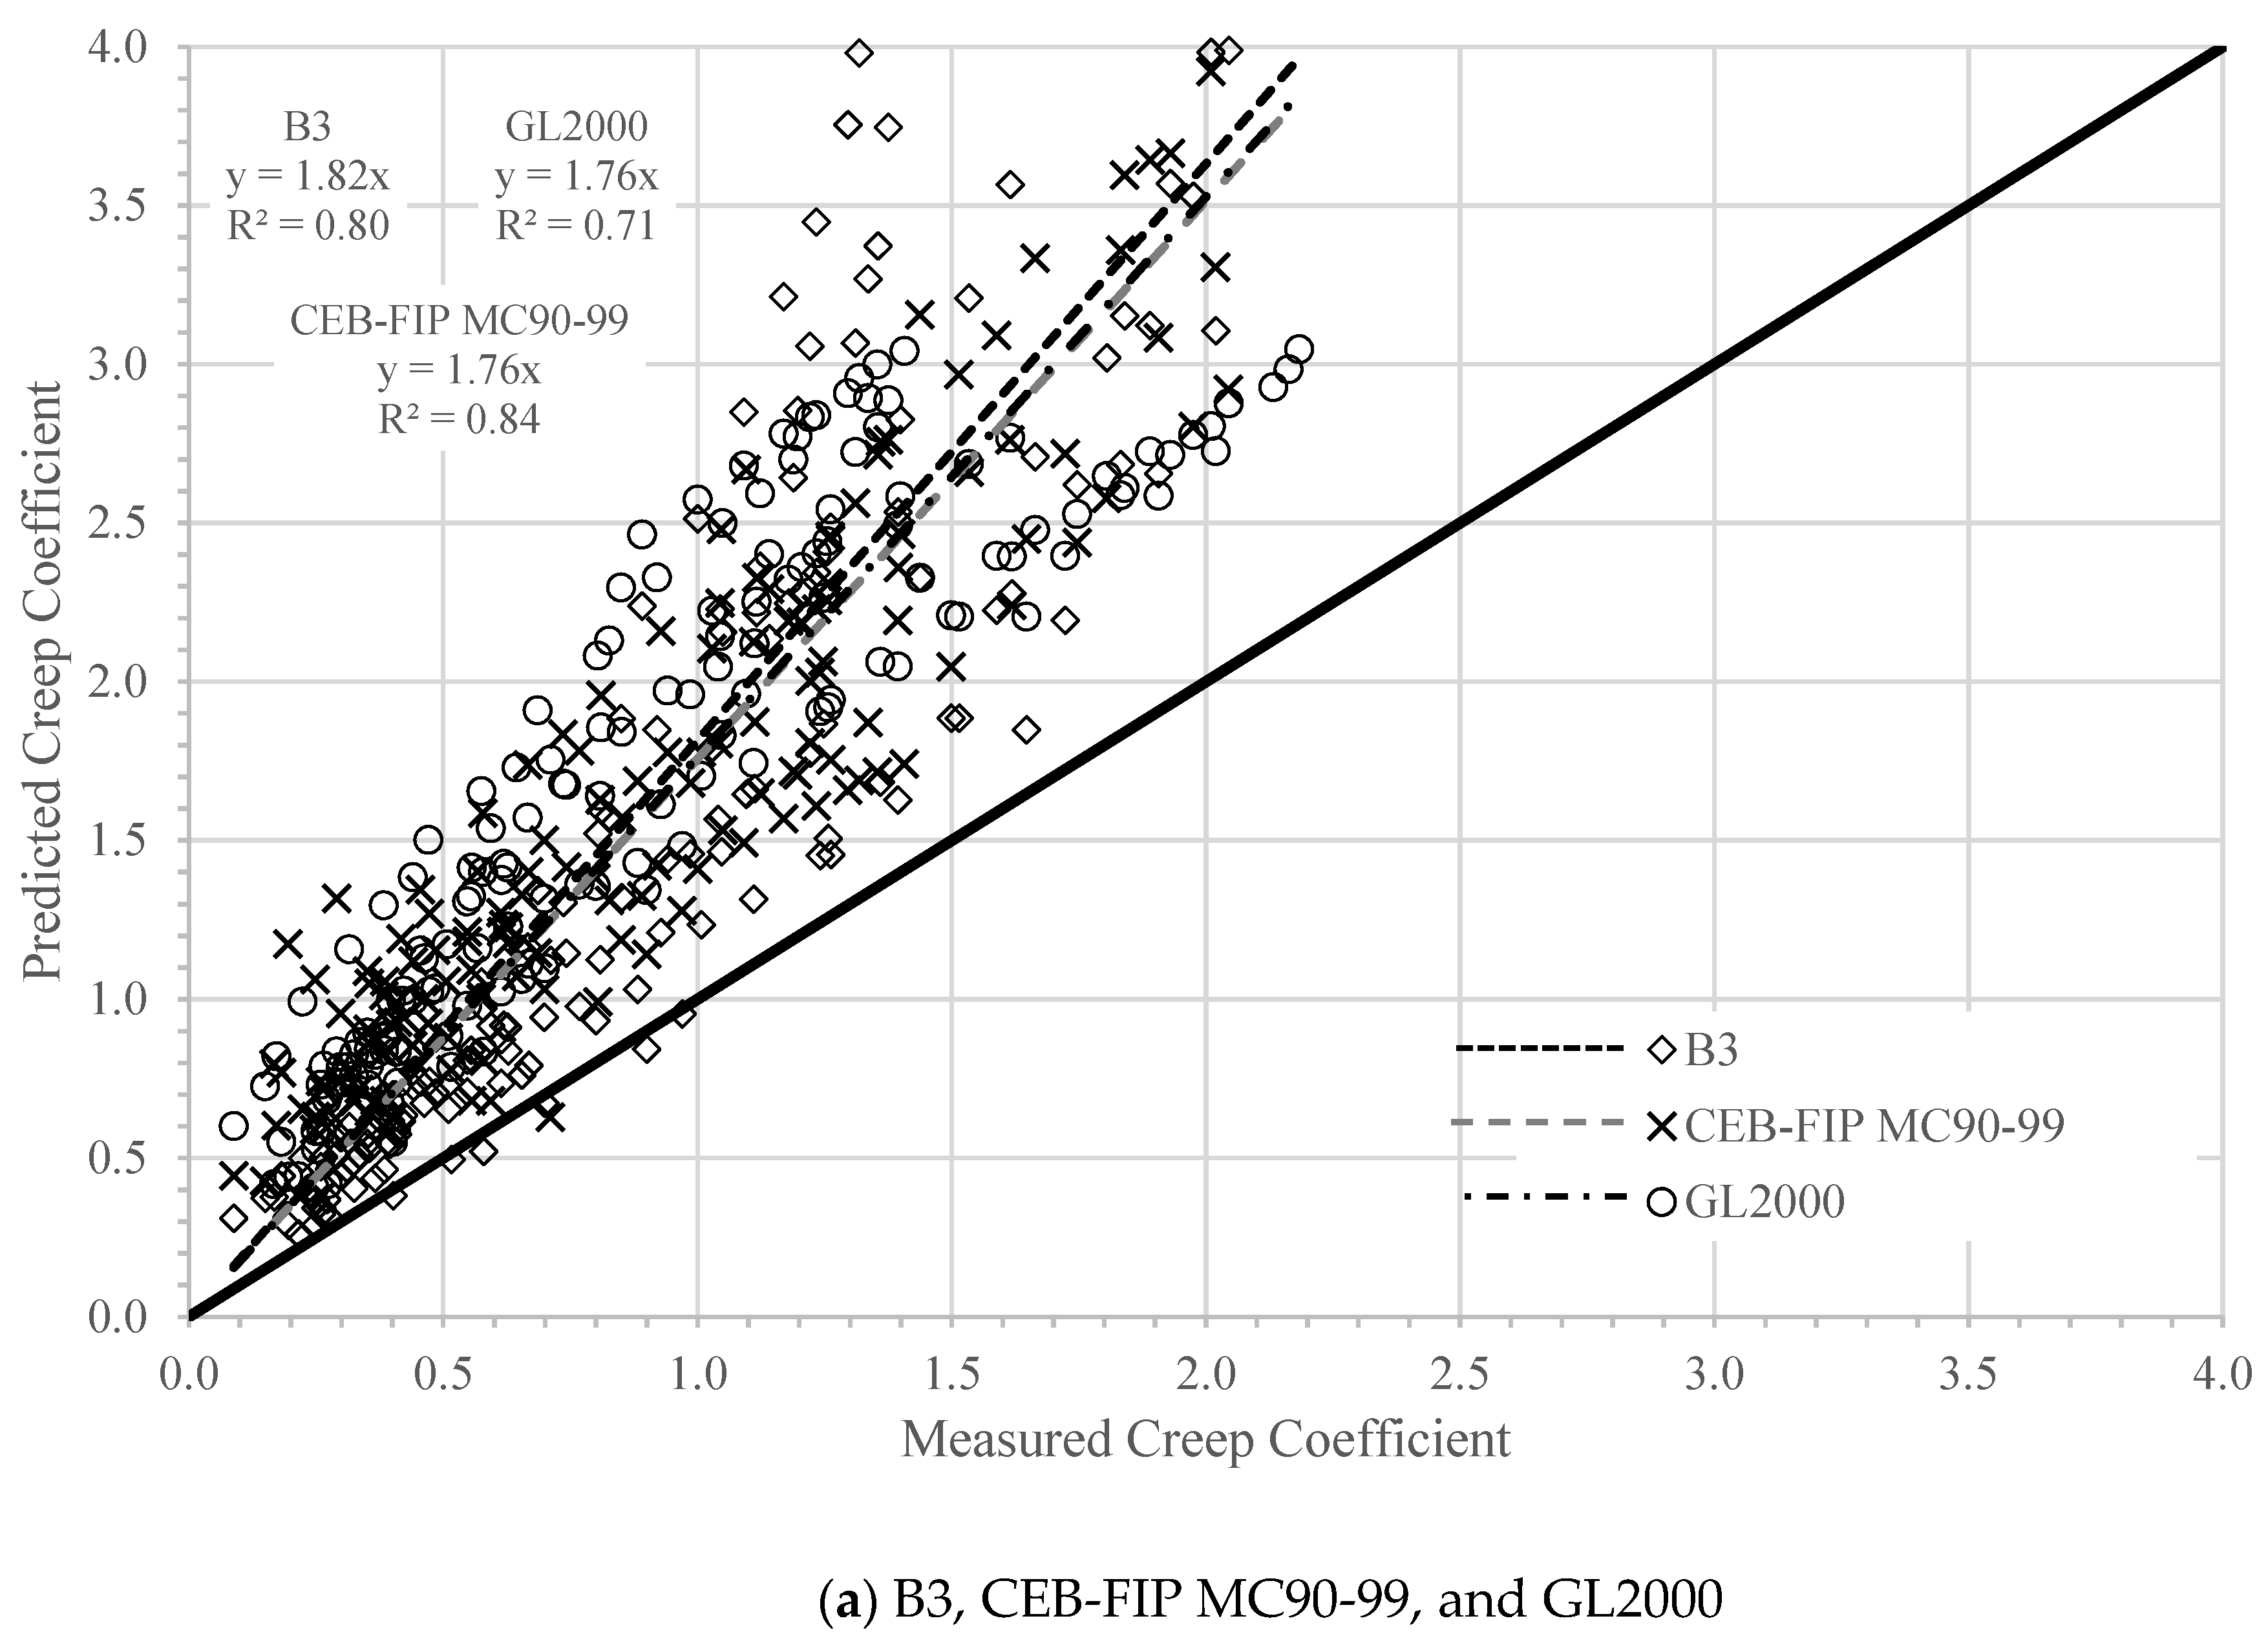
- The AASHTO LRFD and ACI 209 models provided similar predictions of creep coefficient for SCC, while CEB-FIP MC90-99, B3 and GL2000 models overestimated the creep coefficient significantly.
- Regardless of the type of SCM/filler, CEB-FIP MC90-99 and GL2000 models provided similar prediction of creep coefficient and drying shrinkage of SCC.
- All models provided lower prediction of drying shrinkage of SCC. However, GL2000, CEB-FIP MC90-99, and ACI 209 models provided better prediction than AASHTO LRFD and B3 models.
- Modification factors were needed for all drying shrinkage prediction models to account for the higher drying shrinkage of SCC mixtures. The values of these factors depend on the type of SCM/filler used.
Author Contributions
Funding
Institutional Review Board Statement
Informed Consent Statement
Data Availability Statement
Acknowledgments
Conflicts of Interest
Notations
| Compliance function for drying creep at concrete age t when loading and drying starts at ages to and tc, respectively, B3 model | |
| Compliance function for basic creep at concrete age t when loading starts at age to, B3 model | |
| Mean modulus of elasticity of concrete when loading starts at age to, psi | |
| d = 4V/S | Average thickness of a member, in., ACI 209R-92 model |
| f | Member shape and size constant, days, ACI 209R-92 model |
| h | Relative humidity expressed as a decimal |
| kc | Factor for the effect of the volume-to-surface ratio, AASHTO 2007 |
| kf | Factor for the effect of concrete strength, AASHTO 2007 |
| kh, β(h) | Correction term for effect of humidity on shrinkage according to B3 and GL2000 models, respectively |
| khc | Humidity factor for creep, AASHTO 2007 |
| khs | Humidity factor for shrinkage, AASHTO 2007 |
| ks | Factor for the effect of the volume-to-surface ratio, AASHTO 2007 |
| ktd | Time development factor, AASHTO 2007 |
| kvs | Factor for the effect of the volume-to-surface ratio of the component, AASHTO 2007 |
| q1 | Inverse of asymptotic elastic modulus, l/psi, B3 model |
| S(t − tc), βs(t − tc) or β(t − tc) | Correction term for effect of time on shrinkage according to B3, CEB MC90, or GL2000 models, respectively |
| t | Age of concrete, days |
| t − tc | Duration of drying |
| tc | Age of concrete when drying starts at end of moist curing, days |
| to | Age of concrete at loading, days |
| V/S | Volume-surface ratio, in. |
| α | Member shape and size constant, 1.0, ACI 209R-92 model |
| βc(t − to) | Correction term for effect of time on creep coefficient according to CEB MC90 and CEB MC90-99 models |
| εcso | Notional shrinkage coefficient, in./in., CEB MC90 model |
| εshu or εsh ͚ | Notional ultimate shrinkage strain, in./in., ACI 209R-92 and GL2000 models and B3 model, respectively |
| Ψ | Ratio of fine aggregate to total aggregate by weight expressed as percentage, ACI 209R-92 model |
| ϕo | Notional creep coefficient (dimensionless), CEB MC90-99 and GL2000 models |
| ϕu | Ultimate (in time) creep coefficient, ACI 209R-92 model |
| Φ(tc) | The correction term for the effect of drying before loading, 1.0, GL2000 model |
References
- ACI Committee 237. Self-Consolidating Concrete; American Concrete Institute: Farmington, MI, USA, 2007; p. 29. [Google Scholar]
- AASHTO. AASHTO LRFD Bridge Design Specifications, 7th ed.; American Association of Highway and Transportation Officials: Washington, DC, USA, 2014. [Google Scholar]
- ACI Committee 209. Prediction of Creep, Shrinkage, and Temperature Effects in Concrete Structure; American Concrete Institute: Farmington, MI, USA, 1997; p. 47. [Google Scholar]
- ACI Committee 209. Guide for Modeling and Calculating Shrinkage and Creep in Hardened Concrete; American Concrete Institute: Farmington, MI, USA, 2008; p. 45. [Google Scholar]
- CEB-FIP. Structural Concrete-Textbook on Behavior, Design and Performance Updated Knowledge of the CEB/FIP Model Code 1990; Federation International du Béton: Lausanne, Switzerland, 1999; pp. 37–52. [Google Scholar]
- Bažant, Z.P.; Baweja, S. Creep and Shrinkage Prediction Model for Analysis and Design of Concrete Structures: Model B3. Adam Neville Symposium: Creep and Shrinkage-Structural Design Effects, ACI SP–194; Al-Manaseer, A., Ed.; American Concrete Institute: Farmington Hills, MI, USA, 2000; pp. 1–83. [Google Scholar]
- Gardner, N.J.; Lockman, M.J. Design Provisions for Drying Shrinkage and Creep of Normal-Strength Concrete. ACI Mater. J. 2001, 98, 159–167. [Google Scholar]
- Leemann, A.; Lura, P.; Loser, R. Shrinkage and Creep of SCC—The Influence of Paste Volume and Binder Composition. Construct. Build. Mater. 2011, 25, 2283–2289. [Google Scholar] [CrossRef] [Green Version]
- Turcry, P.; Loukili, A.; Haidar, K.; Pijaudier-Cabot, G.; Belarbi, A. Cracking Tendency of Self-Compacting Concrete Subjected to Restrained Shrinkage. Experimental Study and Modeling. J. Mater. Civ. Eng. 2006, 18, 46–54. [Google Scholar] [CrossRef] [Green Version]
- Heirman, G.; Vandewalle, L.; Van Gemert, D.; Boel, V.; Audenaert, K.; De Schutter, G.; Desmet, B.; Vantomme, J. Time-dependent deformations of Limestone Powder Type Self-Compacting Concrete. Eng. Struct. 2008, 30, 2945–2956. [Google Scholar] [CrossRef]
- Kavanaugh, B.P. Creep Behavior of Self-Consolidating Concrete. Master’s Thesis, Auburn University, Auburn, AL, USA, 2008; p. 209. [Google Scholar]
- Kim, Y.H.; Trejo, D.; Hueste, M.B.D.; Kim, J.J. Experimental Study on Creep and Durability of High-Early-Strength Self-Consolidating Concrete for Precast Elements. ACI Mater. J. 2011, 108, 128–138. [Google Scholar]
- AASHTO. AASHTO LRFD Bridge Design Specifications, 4th ed.; American Association of Highway and Transportation Officials: Washington, DC, USA, 2007. [Google Scholar]
- AASHTO. AASHTO LRFD Bridge Design Specifications, 3rd ed.; American Association of Highway and Transportation Officials: Washington, DC, USA, 2004. [Google Scholar]
- Khayat, K.H.; Mitchell, D. Self-Consolidating Concrete for Precast, Prestressed Concrete Bridge Elements; National Corporative Highway Research Program (NCHRP), Report 628; Transportation Research Board: Washington, DC, USA, 2009. [Google Scholar]
- Landsberger, G.A.; Fernandez-Gomez, J. Evaluation of Creep Prediction Models for Self-Consolidating Concrete. In Proceedings of the 5th International RILEM Symposium on Self-Compacting Concrete, Ghent, Belgium, 3–5 September 2007; pp. 605–610. [Google Scholar]
- Naito, C.J.; Parent, G.; Brunn, G. Performance of bulb-tee girders made with self-consolidating concrete. PCI J. 2006, 51, 72–85. [Google Scholar] [CrossRef]
- Mokarem, D.W. Development of Concrete Shrinkage Performance specifications. Ph.D. Dissertation, Civil and Environmental Engineering, Virginia Polytechnic Institute, State University, Blacksburg, VA, USA, 2002; p. 225. [Google Scholar]
- Vikan, H.; Hammer, T.A.; Kjellsen, O. Drying Shrinkage of SCC—Influence of the Composition of Ternary Composite Cements. In Proceedings of the 6th International RILEM Symposium on Self-Compacting Concrete, Montreal, Canada; Springer: Dordrecht, The Netherlands, 2010; pp. 271–282. [Google Scholar]
- Gesoğlu, M.; Güneyisi, E.; Özbay, E. Properties of self-compacting concretes made with binary, ternary, and quaternary cementitious blends of fly ash, blast furnace slag, and silica fume. Construct. Build. Mater. 2009, 23, 1847–1854. [Google Scholar] [CrossRef]
- Güneyisi, E.; Gesoğlu, M.; Özbay, E. Strength and drying shrinkage properties of self-compacting concretes incorporating multi-system blended mineral admixtures. Construct. Build. Mater. 2010, 24, 1878–1887. [Google Scholar] [CrossRef]
- Schindler, A.K.; Barnes, R.W.; Roberts, J.B.; Rodriguez, S. Properties of Self-Consolidating Concrete for Prestressed Members. ACI Mater. J. 2007, 104, 53–61. [Google Scholar]
- Lange, D.A.; Struble, L.J.; Dambrosia, M.D.; Shen, L.; Tejeda-Dominguez, F.; Birch, B.F.; Brinks, A.J. Performance and Acceptance of Self—Consolidating Concrete; Report FHWA-ICT-08-020; Illinois Center for Transportation: Rantoul, IL, USA, 2008. [Google Scholar]
- Hu, J.; Wang, K. Effect of Coarse Aggregate Characteristics on Concrete Rheology. Elsevier J. Construct. Build. Mater. 2011, 25, 1196–1204. [Google Scholar] [CrossRef]
- Morcous, G.; Wang, K.; Taylor, P.C.; Shah, S. Self-Consolidating Concrete for Cast-in-Place Bridge Components; National Corporative Highway Research Program (NCHRP), Report 819; Transportation Research Board: Washington, DC, USA, 2016. [Google Scholar]


| Chemical Component | Type I/II Cement (%) | Class C Fly Ash (%) | Class F Fly Ash (%) | Limestone Powder (%) | GGBFS (%) |
|---|---|---|---|---|---|
| SiO2 | 20.10 | 42.46 | 50.87 | 1.56 | 31.63 |
| Al2O3 | 4.44 | 19.46 | 20.17 | - | 11.30 |
| Fe2O3 | 3.09 | 5.51 | 5.27 | 0.48 | 0.34 |
| SO3 | 3.18 | 1.20 | 0.61 | 1.77 | 3.30 |
| CaO | 62.94 | 21.54 | 15.78 | 52.77 | 41.31 |
| MgO | 2.88 | 4.67 | 3.19 | 0.48 | 10.77 |
| Na2O | 0.10 | 1.42 | 0.69 | 0.03 | 0.19 |
| K2O | 0.61 | 0.68 | 1.09 | 0.09 | 0.36 |
| P2O5 | 0.06 | 0.84 | 0.44 | - | 0.02 |
| TiO2 | 0.24 | 1.48 | 1.29 | - | 0.56 |
| SrO | 0.09 | 0.32 | 0.35 | - | 0.04 |
| BaO | - | 0.67 | 0.35 | - | - |
| LOI | 2.22 | 0.19 | 0.07 | 42.50 | - |
| PROPERTY | Limestone NMSA | Gravel NMSA | River Sand | ||||
|---|---|---|---|---|---|---|---|
| 19.0 mm | 12.5 mm | 9.5 mm | 19.0 mm | 12.5 mm | 9.5 mm | ||
| Specific Gravity (SSD) | 2.66 | 2.66 | 2.66 | 2.74 | 2.68 | 2.69 | 2.62 |
| Absorption % | 1.3 | 1.3 | 1.3 | 1.1 | 1.4 | 1.4 | 0.5 |
| S/A Ratio | 0.45 | 0.47 | 0.50 | 0.45 | 0.47 | 0.50 | N/A |
| Combined DRUW (kg/m3) | 1874 | 1890 | 1890 | 2035 | 1986 | 1970 | N/A |
| Voids, % | 29.0 | 28.4 | 28.4 | 23.7 | 25.9 | 27.0 | N/A |
| Sieve Size | Sand and Limestone | Sand and Gravel | |||||
|---|---|---|---|---|---|---|---|
| S/A Ratio | S/A Ratio | ||||||
| No. | mm | 0.45 | 0.47 | 0.50 | 0.45 | 0.47 | 0.50 |
| 19.0 mm | 12.5 mm | 9.5 mm | 19.0 mm | 12.5 mm | 9.5 mm | ||
| 1″ | 25.4 | 100.0 | 100.0 | 100.0 | 100.0 | 100.0 | 100.0 |
| 3/4″ | 19 | 93.4 | 100.0 | 100.0 | 97.8 | 100.0 | 100.0 |
| 1/2″ | 12.5 | 77.5 | 100.0 | 100.0 | 79.7 | 95.8 | 99.9 |
| 3/8″ | 9.5 | 61.5 | 81.3 | 99.4 | 67.6 | 82.5 | 97.0 |
| #4 | 4.75 | 48.7 | 53.7 | 62.4 | 48.3 | 48.4 | 60.9 |
| #8 | 2.36 | 46.7 | 48.0 | 50.8 | 43.9 | 45.4 | 48.8 |
| #16 | 1.18 | 37.2 | 38.2 | 39.2 | 34.6 | 36.1 | 38.5 |
| #30 | 0.6 | 22.9 | 23.6 | 23.5 | 20.8 | 21.7 | 23.1 |
| #50 | 0.3 | 7.8 | 7.7 | 6.6 | 5.7 | 6.0 | 6.4 |
| #100 | 0.15 | 2.6 | 2.2 | 0.6 | 0.5 | 0.5 | 0.5 |
| #200 | 0 | - | - | - | - | - | - |
| (a) | ||||||||||||||||||||
| Coarse Aggregate | Crushed Limestone (LS) | |||||||||||||||||||
| SCMs and Fillers | 25% Class C Fly Ash (C) | 25% Class F Fly Ash (F) | 30% GGBFS (S) | 20% Class F Fly Ash + 15% LSP (FLP) | ||||||||||||||||
| Filling Ability | Low Flow (LF) | High Flow (HF) | Low Flow (LF) | High Flow (HF) | Low Flow (LF) | High Flow (HF) | Low Flow (LF) | High Flow (HF) | ||||||||||||
| NMAS | 19 mm | 12.5 mm | 19 mm | 12.5 mm | 9.5 mm | 19 mm | 12.5 mm | 19 mm | 12.5 mm | 9.5 mm | 19 mm | 12.5 mm | 19 mm | 12.5 mm | 9.5 mm | 19 mm | 12.5 mm | 19 mm | 12.5 mm | 9.5 mm |
|---|---|---|---|---|---|---|---|---|---|---|---|---|---|---|---|---|---|---|---|---|
| Cement I/II, kg/m3 | 315 | 317 | 337 | 339 | 348 | 315 | 317 | 337 | 339 | 348 | 309 | 311 | 320 | 322 | 331 | 271 | 273 | 289 | 292 | 299 |
| SCM, kg/m3 | 105 | 106 | 112 | 113 | 116 | 105 | 106 | 112 | 113 | 116 | 132 | 133 | 137 | 138 | 142 | 83 | 84 | 89 | 90 | 92 |
| Filler, kg/m3 | 0 | 0 | 0 | 0 | 0 | 0 | 0 | 0 | 0 | 0 | 0 | 0 | 0 | 0 | 0 | 62 | 63 | 67 | 67 | 69 |
| Coarse Agg., kg/m3 | 915 | 867 | 900 | 853 | 792 | 915 | 867 | 900 | 853 | 792 | 915 | 867 | 908 | 860 | 798 | 915 | 867 | 900 | 853 | 792 |
| Natural Sand, kg/m3 | 749 | 769 | 737 | 757 | 792 | 749 | 769 | 737 | 757 | 792 | 749 | 769 | 743 | 763 | 798 | 749 | 769 | 737 | 757 | 792 |
| Water, kg/m3 | 166 | 175 | 166 | 175 | 181 | 166 | 175 | 166 | 175 | 181 | 166 | 175 | 166 | 175 | 181 | 166 | 175 | 166 | 175 | 181 |
| HRWRA, mL/100 kg | 780 | 910 | 780 | 1040 | 845 | 390 | 260 | 520 | 520 | 845 | 780 | 650 | 1170 | 1040 | 975 | 715 | 585 | 780 | 780 | 975 |
| VMA, mL/100 kg | 0 | 0 | 390 | 0 | 0 | 195 | 0 | 195 | 390 | 0 | 0 | 0 | 195 | 195 | 0 | 0 | 0 | 195 | 390 | 0 |
| AEA, mL/100 kg | 98 | 98 | 98 | 98 | 98 | 98 | 98 | 98 | 98 | 98 | 98 | 98 | 98 | 98 | 98 | 98 | 98 | 98 | 98 | 98 |
| Paste Volume % | 37.0 | 38.0 | 38.0 | 39.0 | 40.0 | 37.0 | 38.0 | 38.0 | 39.0 | 40.0 | 37.0 | 38.0 | 37.5 | 38.5 | 39.5 | 37.0 | 38.0 | 38.0 | 39.0 | 40.0 |
| (b) | ||||||||||||||||||||
| Coarse Aggregate | Gravel (G) | |||||||||||||||||||
| SCMs and Fillers | 25% Class C Fly Ash (C) | 25% Class F Fly Ash (F) | 30% GGBFS (S) | 20% Class F Fly Ash + 15% LSP (FLP) | ||||||||||||||||
| Filling Ability | Low Flow (LF) | High Flow (HF) | Low Flow (LF) | High Flow (HF) | Low Flow (LF) | High Flow (HF) | Low Flow (LF) | High Flow (HF) | ||||||||||||
| NMSA | 19 mm | 12.5 mm | 19 mm | 12.5 mm | 9.5 mm | 19 mm | 12.5 mm | 19 mm | 12.5 mm | 9.5 mm | 19 mm | 12.5 mm | 19 mm | 12.5 mm | 9.5 mm | 19 mm | 12.5 mm | 19 mm | 12.5 mm | 9.5 mm |
| Cement I/II, kg/m3 | 293 | 295 | 337 | 339 | 348 | 293 | 295 | 337 | 339 | 348 | 287 | 290 | 320 | 344 | 331 | 261 | 263 | 289 | 292 | 299 |
| SCM, kg/m3 | 98 | 98 | 112 | 113 | 116 | 98 | 98 | 112 | 113 | 116 | 123 | 124 | 137 | 147 | 142 | 80 | 81 | 89 | 90 | 92 |
| Filler, kg/m3 | 0 | 0 | 0 | 0 | 0 | 0 | 0 | 0 | 0 | 0 | 0 | 0 | 0 | 0 | 0 | 60 | 61 | 67 | 67 | 69 |
| Coarse Agg., kg/m3 | 937 | 888 | 908 | 860 | 797 | 937 | 888 | 908 | 860 | 797 | 937 | 888 | 915 | 853 | 804 | 930 | 881 | 908 | 860 | 797 |
| Natural Sand, kg/m3 | 767 | 788 | 743 | 763 | 797 | 767 | 788 | 743 | 763 | 797 | 767 | 788 | 749 | 757 | 804 | 761 | 782 | 743 | 763 | 797 |
| Water, kg/m3 | 166 | 175 | 166 | 175 | 181 | 166 | 175 | 166 | 175 | 181 | 166 | 175 | 166 | 175 | 181 | 166 | 175 | 166 | 175 | 181 |
| HRWRA, mL/100 kg | 325 | 98 | 585 | 325 | 520 | 455 | 260 | 455 | 325 | 358 | 390 | 325 | 650 | 455 | 488 | 195 | 195 | 390 | 488 | 390 |
| VMA, mL/100 kg | 0 | 0 | 195 | 0 | 195 | 0 | 0 | 130 | 195 | 195 | 0 | 0 | 195 | 0 | 0 | 0 | 0 | 130 | 195 | 0 |
| AEA, mL/100 kg | 98 | 98 | 98 | 98 | 98 | 98 | 98 | 98 | 98 | 98 | 98 | 98 | 98 | 98 | 98 | 98 | 98 | 98 | 98 | 98 |
| Paste Volume % | 36.0 | 37.0 | 38.0 | 39.0 | 40.0 | 36.0 | 37.0 | 38.0 | 39.0 | 40.0 | 36.0 | 37.0 | 37.5 | 39.5 | 39.5 | 36.5 | 37.5 | 38.0 | 39.0 | 40.0 |
| Model Name | (t,to) |
|---|---|
| AASHTO LRFD [2] | 1.9 ks khc kf ktd |
| ACI 209 [3,4] | ϕu |
| CEB-FIP MC90-99 [5] | βc(t − to) |
| B3 [6] | |
| GL 2000 [7] | Φ |
| Model Name | Drying Shrinkage Strain Prediction Equation, (t,tc) |
|---|---|
| AASHTO LRFD [2] | ks khs kf ktd |
| ACI 209 [3,4] | εshu |
| CEB-FIP MC90-99 [5] | εcso βs(t − tc) |
| B3 [6] | εsh ͚ kh S(t − tc) |
| GL 2000 [7] | β(h) β(t − tc) |
| Coarse Aggregate Type | NMSA (mm) | ID | Slump Flow | J-Ring | Caisson | Penetration | Column Technique | Long Trough | Static Stability | Dynamic Yield Stress | Plastic Viscosity | Yield Torque | Slope | |||
|---|---|---|---|---|---|---|---|---|---|---|---|---|---|---|---|---|
| Dav (mm) | T50 (s) | VSI | ∆D (mm) | ∆H (mm) | FC (%) | Pd (mm) | Seg. (%) | Seg. (%) | HVSI | Pa | Pa-s | N-m | N-m-s | |||
| Limestone | 19 | C_LF | 654 | 1.9 | 0 | 102 | 14 | 75.5% | 4 | 5.2% | 7.2% | 1 | 78.7 | 1.07 | 1.11 | 2.95 |
| 19 | F_LF | 667 | 1.2 | 1 | 114 | 14 | 79.0% | 2 | 13.2% | N/A | 0 | 61.95 | 0.93 | 1.01 | 2.94 | |
| 19 | S_LF | 578 | 1.7 | 0 | 83 | 16 | 80.6% | 6 | 4.2% | N/A | 1 | 53.54 | 1.17 | 1.14 | 3.34 | |
| 19 | FLP_LF | 572 | 1.9 | 0 | 38 | 16 | 70.2% | 3 | 2.1% | N/A | 0 | 49.87 | 0.83 | 1.02 | 2.87 | |
| 19 | C_HF | 635 | 2.0 | 0 | 19 | 6 | 75.5% | 3 | 0.4% | 32.0% | 1 | 37.87 | 1.73 | 0.78 | 3.89 | |
| 19 | F_HF | 686 | 1.2 | 1 | 64 | 14 | 86.1% | 6 | 3.9% | 35.7% | 1 | 26.8 | 0.87 | 0.61 | 3.32 | |
| 19 | S_HF | 686 | 2.0 | 1 | 13 | 13 | 78.3% | 10 | 10.8% | 10.2% | 0 | 10.73 | 1.95 | 0.54 | 4.78 | |
| 19 | FLP_HF | 660 | 2.0 | 1 | 19 | 11 | 81.4% | 6 | 13.9% | 24.3% | 1 | 53.11 | 1.08 | 0.88 | 3.83 | |
| 12.5 | C_LF | 629 | 2.0 | 1 | 32 | 5 | 80.8% | 3 | 2.0% | N/A | 0 | 45.44 | 0.97 | 1.03 | 3.29 | |
| 12.5 | F_LF | 641 | 2.0 | 0 | 22 | 4 | 91.5% | 6 | 10.1% | N/A | 0 | 51.56 | 1.07 | 0.84 | 3.13 | |
| 12.5 | S_LF | 572 | 2.0 | 0 | 13 | 14 | 81.7% | 6 | 0.0% | N/A | 1 | 47.08 | 1.39 | 1 | 3.96 | |
| 12.5 | FLP_LF | 660 | 2.0 | 1 | 6 | 10 | 91.2% | 6 | 4.9% | N/A | 0 | 40.73 | 0.89 | 0.84 | 2.48 | |
| 12.5 | C_HF | 660 | 2.0 | 0 | 6 | 3 | 71.4% | 4 | 2.1% | 5.21% | 1 | 29.29 | 0.71 | 0.65 | 2.03 | |
| 12.5 | F_HF | 673 | 2.0 | 0 | 38 | 11 | 79.6% | 5 | 5.2% | 39.9% | 1 | 39.5 | 1.03 | 0.8 | 3.08 | |
| 12.5 | S_HF | 775 | 2.0 | 0 | 25 | 0 | 95.8% | 3 | 5.50% | 35.6% | 1 | 14.77 | 1.08 | 0.68 | 3.3 | |
| 12.5 | FLP_HF | 692 | 2.0 | 1 | 6 | 3 | 94.2% | 13 | 8.1% | 23.4% | 1 | 30.88 | 0.82 | 0.86 | 3.11 | |
| 9.5 | C_HF | 679 | 2.0 | 0 | 13 | 13 | 83.3% | 4 | 3.4% | 25.5% | 0 | 24.61 | 1 | 0.87 | 3.35 | |
| 9.5 | F_HF | 737 | 2.0 | 1 | 13 | 6 | 91.4% | 2 | 0.0% | 11.9% | 1 | 27.6 | 0.88 | 0.87 | 2.47 | |
| 9.5 | S_HF | 667 | 2.7 | 0 | 0 | 8 | 89.5% | 14 | 3.0% | 18.3% | 0 | 20.29 | 1.73 | 0.78 | 4.69 | |
| 9.5 | FLP_HF | 705 | 1.7 | 0 | 6 | N/A | 93.7% | 6 | 3.8% | N/A | 0 | 33.3 | 1.09 | 0.7 | 2.64 | |
| Gravel | 19 | C_LF | 622 | 1.6 | 1 | 51 | 13 | 86.2% | 3 | 12.7% | N/A | 1 | 87.63 | 1.89 | 3.79 | 1.28 |
| 19 | F_LF | 622 | 1.2 | 1 | 32 | 6 | 90.2% | 6 | 9.5% | N/A | 1 | 50.72 | 0.79 | 2.71 | 1.04 | |
| 19 | S_LF | 597 | 1.9 | 0 | 19 | 16 | 82.8% | 3 | 9.8% | N/A | 0 | 45.16 | 1.42 | 3.24 | 1.5 | |
| 19 | FLP_LF | 565 | 1.4 | 0 | 6 | 19 | 73.2% | 0 | 17.4% | N/A | 1 | 43.5 | 0.64 | 2.51 | 1.17 | |
| 19 | C_HF | 692 | 1.3 | 1 | 19 | 6 | 91.8% | 13 | 3.7% | 19.3% | 1 | 38.63 | 1.23 | 3.01 | 0.98 | |
| 19 | F_HF | 724 | 1.2 | 1 | 13 | 0 | 96.2% | 19 | 18.9% | 45.0% | 1 | 18.58 | 0.82 | 2.63 | 0.76 | |
| 19 | S_HF | 705 | 2.3 | 1 | 19 | 6 | 95.1% | 25 | 18.4% | 45.5% | 1 | 13.5 | 1.98 | 2.15 | 1.19 | |
| 19 | FLP_HF | 711 | 1.6 | 1 | 32 | 6 | 94.1% | 16 | 19.3% | 37.6% | 1 | 12.83 | 0.57 | 2.11 | 0.65 | |
| 12.5 | C_LF | 635 | 1.0 | 0 | 25 | 3 | 87.6% | 6 | 1.0% | N/A | 1 | 55.2 | 0.77 | 2.68 | 1.18 | |
| 12.5 | F_LF | 565 | 1.4 | 0 | 70 | 19 | 71.2% | 0 | 4.8% | N/A | 0 | 44.47 | 0.62 | 2.32 | 0.99 | |
| 12.5 | S_LF | 591 | 1.8 | 0 | 0 | 13 | 82.3% | 6 | 2.7% | 6.9% | 1 | 31.1 | 1.15 | 2.72 | 1.06 | |
| 12.5 | FLP_LF | 597 | 1.0 | 0 | 32 | 6 | 89.6% | 3 | 5.1% | N/A | 0 | 25.92 | 0.59 | 1.91 | 0.72 | |
| 12.5 | C_HF | 660 | 1.5 | 0 | 25 | 6 | 94.4% | 13 | 4.1% | 25.5% | 0 | 25.98 | 0.52 | 2.17 | 0.84 | |
| 12.5 | F_HF | 660 | 1.1 | 0 | 13 | 6 | 88.4% | 6 | 1.4% | 4.3% | 0 | 8.36 | 0.4 | 1.49 | 0.79 | |
| 12.5 | S_HF | 686 | 2.3 | 0 | 0 | 13 | 92.4% | 6 | 12.7% | 16.8% | 0 | 1.39 | 0.68 | 1.38 | 0.58 | |
| 12.5 | FLP_HF | 699 | 0.9 | 1 | 13 | 6 | 93.9% | 13 | 9.0% | 20.9% | 1 | 15.77 | 0.46 | 1.56 | 0.87 | |
| 9.5 | C_HF | 699 | 1.4 | 0 | 38 | 6 | 93.9% | 16 | 5.1% | 15.6% | 0 | 18.93 | 0.88 | 2.61 | 0.56 | |
| 9.5 | F_HF | 730 | 1.3 | 1 | 19 | 6 | 93.5% | 25 | 11.4% | 15.8% | 0 | 9.75 | 0.74 | 1.44 | 0.68 | |
| 9.5 | S_HF | 667 | 1.8 | 1 | 13 | 6 | 89.5% | 6 | 18.1% | 5.0% | 0 | 0 | 0.53 | 1.49 | 0.53 | |
| 9.5 | FLP_HF | 686 | 1.1 | 0 | 19 | 0 | 95.2% | 16 | 12.4% | 2.4% | 0 | 11.36 | 0.69 | 2.03 | 0.45 | |
| SCM/Filler Prediction Model | Ratio of Predicted-to-Measured Creep Coefficient | |||||||||||||
|---|---|---|---|---|---|---|---|---|---|---|---|---|---|---|
| F | S | C | FLP | All Mixtures | ||||||||||
| Number of Data Points | Average | Variance | Number of Data Points | Average | Variance | Number of Data Points | Average | Variance | Number of Data Points | Average | Variance | Average | Variance | |
| AASHTO LRFD | 38 | 0.87 | 0.08 | 19 | 0.98 | 0.02 | 34 | 0.78 | 0.09 | 33 | 0.69 | 0.07 | 0.82 | 0.07 |
| ACI 209 | 38 | 0.98 | 0.02 | 19 | 1.49 | 0.15 | 34 | 0.98 | 0.04 | 33 | 0.69 | 0.01 | 0.97 | 0.09 |
| CEB-FIP MC90-99 | 38 | 2.38 | 0.75 | 19 | 2.09 | 0.87 | 34 | 1.80 | 0.67 | 33 | 1.82 | 0.14 | 2.05 | 0.54 |
| B3 | 38 | 1.76 | 0.11 | 19 | 1.83 | 0.47 | 34 | 2.18 | 0.17 | 33 | 1.44 | 0.17 | 1.71 | 0.24 |
| GL2000 | 38 | 2.19 | 0.08 | 19 | 3.24 | 1.47 | 34 | 2.18 | 0.21 | 33 | 1.55 | 0.02 | 2.15 | 0.50 |
| Limestone Mixtures | Measured Drying Shrinkage (μ-Strain) | Compressive Strength (kg/cm2) | |||||
|---|---|---|---|---|---|---|---|
| ID | NMAS | 3 Day | 7 Day | 14 Day | 28 Day | 56 Day | |
| LS_F_19_LF | 19 mm | 215 | 265 | 365 | 410 | 480 | 45 |
| LS_F_19_HF | 19 mm | 150 | 225 | 340 | 430 | 460 | 45 |
| LS_F_12.5_LF | 12.5 mm | 35 | 140 | 255 | 420 | 525 | 52 |
| LS_F_12.5_HF | 12.5 mm | 270 | 260 | 345 | 400 | 435 | 49 |
| LS_F_9.5_HF | 9.5 mm | 170 | 270 | 365 | 490 | 555 | 48 |
| LS_FLP_19_LF | 19 mm | 155 | 175 | 410 | 425 | 470 | 39 |
| LS_FLP_19_HF | 19 mm | 55 | 370 | 335 | 450 | 535 | 40 |
| LS_FLP_12.5_LF | 12.5 mm | 80 | 175 | 290 | 380 | 450 | 41 |
| LS_FLP_12.5_HF | 12.5 mm | 150 | 190 | 270 | 360 | 485 | 45 |
| LS_FLP_9.5_HF | 9.5 mm | 130 | 200 | 360 | 410 | 430 | 43 |
| LS_S_19_LF | 19 mm | 120 | 260 | 380 | 460 | 475 | 45 |
| LS_S_19_HF | 19 mm | 135 | 205 | 255 | 310 | 335 | 44 |
| LS_S_12.5_LF | 12.5 mm | 205 | 375 | 445 | 470 | 570 | 54 |
| LS_S_12.5_HF | 12.5 mm | 240 | 290 | 330 | 335 | 405 | 55 |
| LS_S_9.5_HF | 9.5 mm | 200 | 250 | 335 | 470 | 610 | 53 |
| LS_C_19_LF | 19 mm | 160 | 260 | 395 | 495 | 605 | 45 |
| LS_C_19_HF | 19 mm | 125 | 275 | 285 | 345 | 405 | 55 |
| LS_C_12.5_LF | 12.5 mm | 205 | 300 | 400 | 510 | 680 | 61 |
| LS_C_12.5_HF | 12.5 mm | 155 | 370 | 410 | 455 | 500 | 56 |
| LS_C_9.5_HF | 9.5 mm | 245 | 355 | 460 | 640 | 750 | 54 |
| Gravel Mixtures | Measured Drying Shrinkage (μ-Strain) | Compressive Strength (kg/cm2) | |||||
|---|---|---|---|---|---|---|---|
| ID | NMAS | 3 Day | 7 Day | 14 Day | 28 Day | 56 Day | |
| G_F_19_LF | 19 mm | 135 | 225 | 360 | 440 | 495 | 32 |
| G_F_19_HF | 19 mm | 140 | 275 | 380 | 465 | 525 | 36 |
| G_F_12.5_LF | 12.5 mm | 150 | 255 | 330 | 395 | 505 | 30 |
| G_F_12.5_HF | 12.5 mm | 220 | 270 | 255 | 325 | 475 | 47 |
| G_F_9.5_HF | 9.5 mm | 130 | 320 | 505 | 580 | 660 | 38 |
| G_FLP_19_LF | 19 mm | 75 | 220 | 340 | 420 | 535 | 40 |
| G_FLP_19_HF | 19 mm | 105 | 290 | 435 | 555 | 605 | 33 |
| G_FLP_12.5_LF | 12.5 mm | 50 | 155 | 345 | 425 | 585 | 33 |
| G_FLP_12.5_HF | 12.5 mm | 160 | 255 | 370 | 455 | 605 | 40 |
| G_FLP_9.5_HF | 9.5 mm | 150 | 375 | 515.3 | 626 | 725 | 32 |
| G_S_19_LF | 19 mm | 210 | 355 | 365 | 470 | 540 | 37 |
| G_S_19_HF | 19 mm | 165 | 315 | 390 | 430 | 470 | 36 |
| G_S_12.5_LF | 12.5 mm | 170 | 240 | 335 | 425 | 560 | 34 |
| G_S_12.5_HF | 12.5 mm | 140 | 220 | 350 | 405 | 490 | 53 |
| G_S_9.5_HF | 9.5 mm | 175 | 395 | 515 | 590 | 685 | 39 |
| G_C_19_LF | 19 mm | 205 | 300 | 405 | 445 | 610 | 40 |
| G_C_19_HF | 19 mm | 170 | 270 | 445 | 510 | 610 | 39 |
| G_C_12.5_LF | 12.5 mm | 225 | 350 | 515 | 625 | 760 | 32 |
| G_C_12.5_HF | 12.5 mm | 240 | 260 | 440 | 510 | 670 | 47 |
| G_C_9.5_HF | 9.5 mm | 105 | 385 | 565 | 640 | 735 | 43 |
| SCM/Filler Prediction Model | Ratio of Predicted-to-Measured Drying Shrinkage Strain | |||||||||||||
|---|---|---|---|---|---|---|---|---|---|---|---|---|---|---|
| F | FLP | S | C | All Mixtures | ||||||||||
| Number of Data Points | Average | Variance | Number of Data Points | Average | Variance | Number of Data Points | Average | Variance | Number of Data Points | Average | Variance | Average | Variance | |
| AASHTO LRFD | 50 | 0.63 | 0.07 | 50 | 0.68 | 0.05 | 50 | 0.58 | 0.06 | 50 | 0.48 | 0.03 | 0.59 | 0.06 |
| ACI 209 | 50 | 0.75 | 0.08 | 50 | 0.77 | 0.05 | 50 | 0.71 | 0.08 | 50 | 0.60 | 0.04 | 0.71 | 0.07 |
| GL2000 | 50 | 0.99 | 0.24 | 50 | 1.09 | 0.30 | 50 | 0.89 | 0.05 | 50 | 0.74 | 0.03 | 0.93 | 0.17 |
| CEB-FIP MC90-99 | 50 | 0.96 | 0.22 | 50 | 1.08 | 0.27 | 50 | 0.84 | 0.03 | 50 | 0.72 | 0.03 | 0.90 | 0.15 |
| B3 | 50 | 0.76 | 0.13 | 50 | 0.82 | 0.13 | 50 | 0.69 | 0.02 | 50 | 0.60 | 0.02 | 0.72 | 0.06 |
Publisher’s Note: MDPI stays neutral with regard to jurisdictional claims in published maps and institutional affiliations. |
© 2021 by the authors. Licensee MDPI, Basel, Switzerland. This article is an open access article distributed under the terms and conditions of the Creative Commons Attribution (CC BY) license (https://creativecommons.org/licenses/by/4.0/).
Share and Cite
Asaad, M.; Morcous, G. Evaluating Prediction Models of Creep and Drying Shrinkage of Self-Consolidating Concrete Containing Supplementary Cementitious Materials/Fillers. Appl. Sci. 2021, 11, 7345. https://0-doi-org.brum.beds.ac.uk/10.3390/app11167345
Asaad M, Morcous G. Evaluating Prediction Models of Creep and Drying Shrinkage of Self-Consolidating Concrete Containing Supplementary Cementitious Materials/Fillers. Applied Sciences. 2021; 11(16):7345. https://0-doi-org.brum.beds.ac.uk/10.3390/app11167345
Chicago/Turabian StyleAsaad, Micheal, and George Morcous. 2021. "Evaluating Prediction Models of Creep and Drying Shrinkage of Self-Consolidating Concrete Containing Supplementary Cementitious Materials/Fillers" Applied Sciences 11, no. 16: 7345. https://0-doi-org.brum.beds.ac.uk/10.3390/app11167345