Article

Trapped Modes and Negative Refraction in a Locally Resonant Metamaterial: Transient Insights into Manufacturing Bounds for Ultrasonic Applications

by
Domenico Tallarico
1 and
Stewart G. Haslinger
2,*
1
Laboratory for Acoustics/Noise Control, Swiss Federal Laboratories for Materials Science and Technology (EMPA), Überlandstrasse 129, 8600 Dübendorf, Switzerland
2
Department of Mathematical Sciences, University of Liverpool, Liverpool L69 3BX, UK
*
Author to whom correspondence should be addressed.
Submission received: 4 July 2021 / Revised: 7 August 2021 / Accepted: 13 August 2021 / Published: 18 August 2021
(This article belongs to the Special Issue Advances in Elastic Micro-Structured Systems and Metamaterials)

Abstract

:
The transient scattering of in-plane elastic waves from a finite-sized periodic structure, comprising a regular grid of Swiss-cross holes arranged according to a square lattice, is considered. The theoretical and numerical modelling focuses on the unexplored ultrasonic frequency regime, well beyond the first, wide, locally resonant band-gap of the structure. Dispersive properties of the periodic array, determined by Bloch–Floquet analysis, are used to identify candidates for high-fidelity GPU-accelerated transient scattering simulations. Several unusual wave phenomena are identified from the simulations, including negative refraction, focusing, partial cloaking, and wave trapping. The transient finite element modelling framework offers insights on the lifetimes of such phenomena for potential practical applications. In addition, nonideal counterparts with rough edges are modelled using characteristic statistical parameters commonly observed in additive manufacturing. The analysis shows that the identified wave effects appear likely to be robust with respect to potential manufacturing uncertainties in future studies.

1. Introduction

In recent years, the design and fabrication of metamaterials have demonstrated exotic effects and phenomena for all types of travelling waves, from electromagnetic [1] to mechanical [2]. The terminology of metamaterial was first used to describe a class of structured materials (or composites) for which wave effects arise as a collective manifestation of locally resonant constituent units [3]. The resonant frequency of a metamaterial’s subunit depends only on its inertia and restoring force, meaning that the incident wavelength may be several orders of magnitude greater than the physical dimension of the constituent subunits. This sub-wavelength property is characteristic of all metamaterials; therefore, it is now widely accepted that the definition has been broadened to include all sub-wavelength systems that support exotic wave effects not found in nature. Examples for mechanical metamaterials and phononic crystals include negative refraction [4], superlensing [5], filtering [6], and cloaking [7].
The nature of metamaterial resonant subunits affects the wave propagation effects, but the most commonly used class of metamaterials is characterised by periodic repetitions of unit cells. Analytical techniques use Bloch–Floquet theory to construct dispersion diagrams, from which stop and pass bands are easily identifiable, as well as special features such as Dirac points and standing modes [8]. Structured elastic Kirchhoff–Love plates, comprising periodic distributions of scatterers and also referred to as platonic crystals [9], have attracted great interest in the last fifteen years. These two-dimensional elastic plate analogues of photonic crystals feature many of the anisotropic effects typically observed in photonics, such as ultra-refraction, Dirac-like cones and topological insulator, and edge mode properties for flexural [10,11,12,13,14] waves. Similar effects have also been observed for in-plane elastic waves [15,16,17]. This article considers a two-dimensional locally resonant metamaterial for in-plane elastic waves: a plain-strain, homogeneous medium is patterned with a doubly periodic array of cross-shaped perforations.
Previous studies related to similar systems include the articles by Miniaci et al. [18] and Avialiotis et al. [19]. The focus of [18] was a polyvinyl chloride phononic plate and the identification and location of complete band gaps for a square lattice of crosslike holes using numerical methods and experimental validations. Very good agreement between the predicted band gap frequencies and the experimental results was found. In order to perform ultrasonic pitch-catch experimental tests, the plate was machined to produce hollow and rounded cross-cylinder inclusions [18], with a tolerance of 0.1 mm for each cross (with characteristic length 18 mm) within a 20 × 20 mm2 unit cell. For incident frequencies up to 50 kHz, the corresponding wavelengths are of the order 18 mm, i.e., of the same order as the inclusions. As stated by [18], the study was motivated by the work of [20], in which an extensive numerical investigation indicated that cross-shaped holes could generate multiple and complete band gaps within this lower frequency range.
A subsequent study [19] investigated finite width slabs of a metamaterial patterned with cross-shaped holes, using a semianalytical solution of the relaxed micromorphic model [21,22,23] to identify wave scattering properties. Solutions were compared with frequency-domain finite element simulations and the reflection and transmission coefficients (and band gap locations) showed excellent agreement over a range of frequencies and angles of incidence. The dimensions of this material were significantly smaller than those considered by [18], with the area of the unit cell being 400 times smaller (1 × 1 mm2 compared with 20 × 20 mm2). Consequently, frequencies were considerably larger with band gaps covering a range from 100 kHz up to 2.5 MHz.
Our new study investigates exotic wave effects predicted by Bloch–Floquet dispersion surfaces and explicit time-domain finite element (FE) simulations within pass bands at higher frequencies (i.e., above the band gaps investigated by [19]). Phenomena such as negative refraction, cloaking, wave-trapping, and long-wavelength enveloped wave modes (with wavelengths much larger than those for the resonant subunits at the microscopic scale) are demonstrated using transient, accelerated GPU (graphics processing unit) implementation [24]. The time-domain approach described here uses modelling methods similar to those applied for other high-fidelity FE studies of elastic wave propagation [25,26,27], for which experimental validations were also performed.
Future studies of the model described here are likely to use experimental methods to reproduce the predicted wave behaviours. In order to manufacture the metamaterial, additive manufacturing methods may be used, which will result in microscopically rough versions of the cross-shaped inclusions. Additional FE studies are presented for perturbed versions of the crosses, using roughness statistical parameter values typically recorded for metal parts created by additive manufacturing methods [28,29,30].
The article is organised as follows: Section 2 reviews the governing equations, underlying assumptions, and dispersion properties. The FE model generation is also described in detail. Section 3 discusses the examples showing transient wave phenomena for the periodic and perturbed periodic structures. Concluding remarks and the future outlook for the model are drawn together in Section 4.

2. Governing Equations and Methods

2.1. Isotropic Elasticity and Plane-Strain Approximation

The plane-strain approximation pertaining to in-plane elastic displacement u = ( u 1 , u 2 ) T results in the following partial differential equation (Lamé system [31])
μ 2 u + ( λ + μ ) · u + F = ρ 2 t 2 u ,
where μ and λ are the Lamé parameters, F is an external in-plane body force, ∇ is the gradient in Cartesian coordinates in two-dimensional (2D) space, ρ is the density, a · b is the scalar product of two vectors a , b R 2 , and t represents time.
By introducing u = u 0 exp ( i κ · x i ω t ) ) in Equation (1), and in the absence of body forces ( F = 0 ), a characteristic equation for the amplitudes u 0 can be derived. The notations κ and ω are used to represent the wave vector, and radian frequency, respectively. Such characteristic eigenvalue problems have nontrivial solutions if and only if
ω / κ = c s , p ,
where c s = μ / ρ and c p = ( λ + 2 μ ) / ρ , are shear and compression wave speed, respectively, and κ = | κ | .

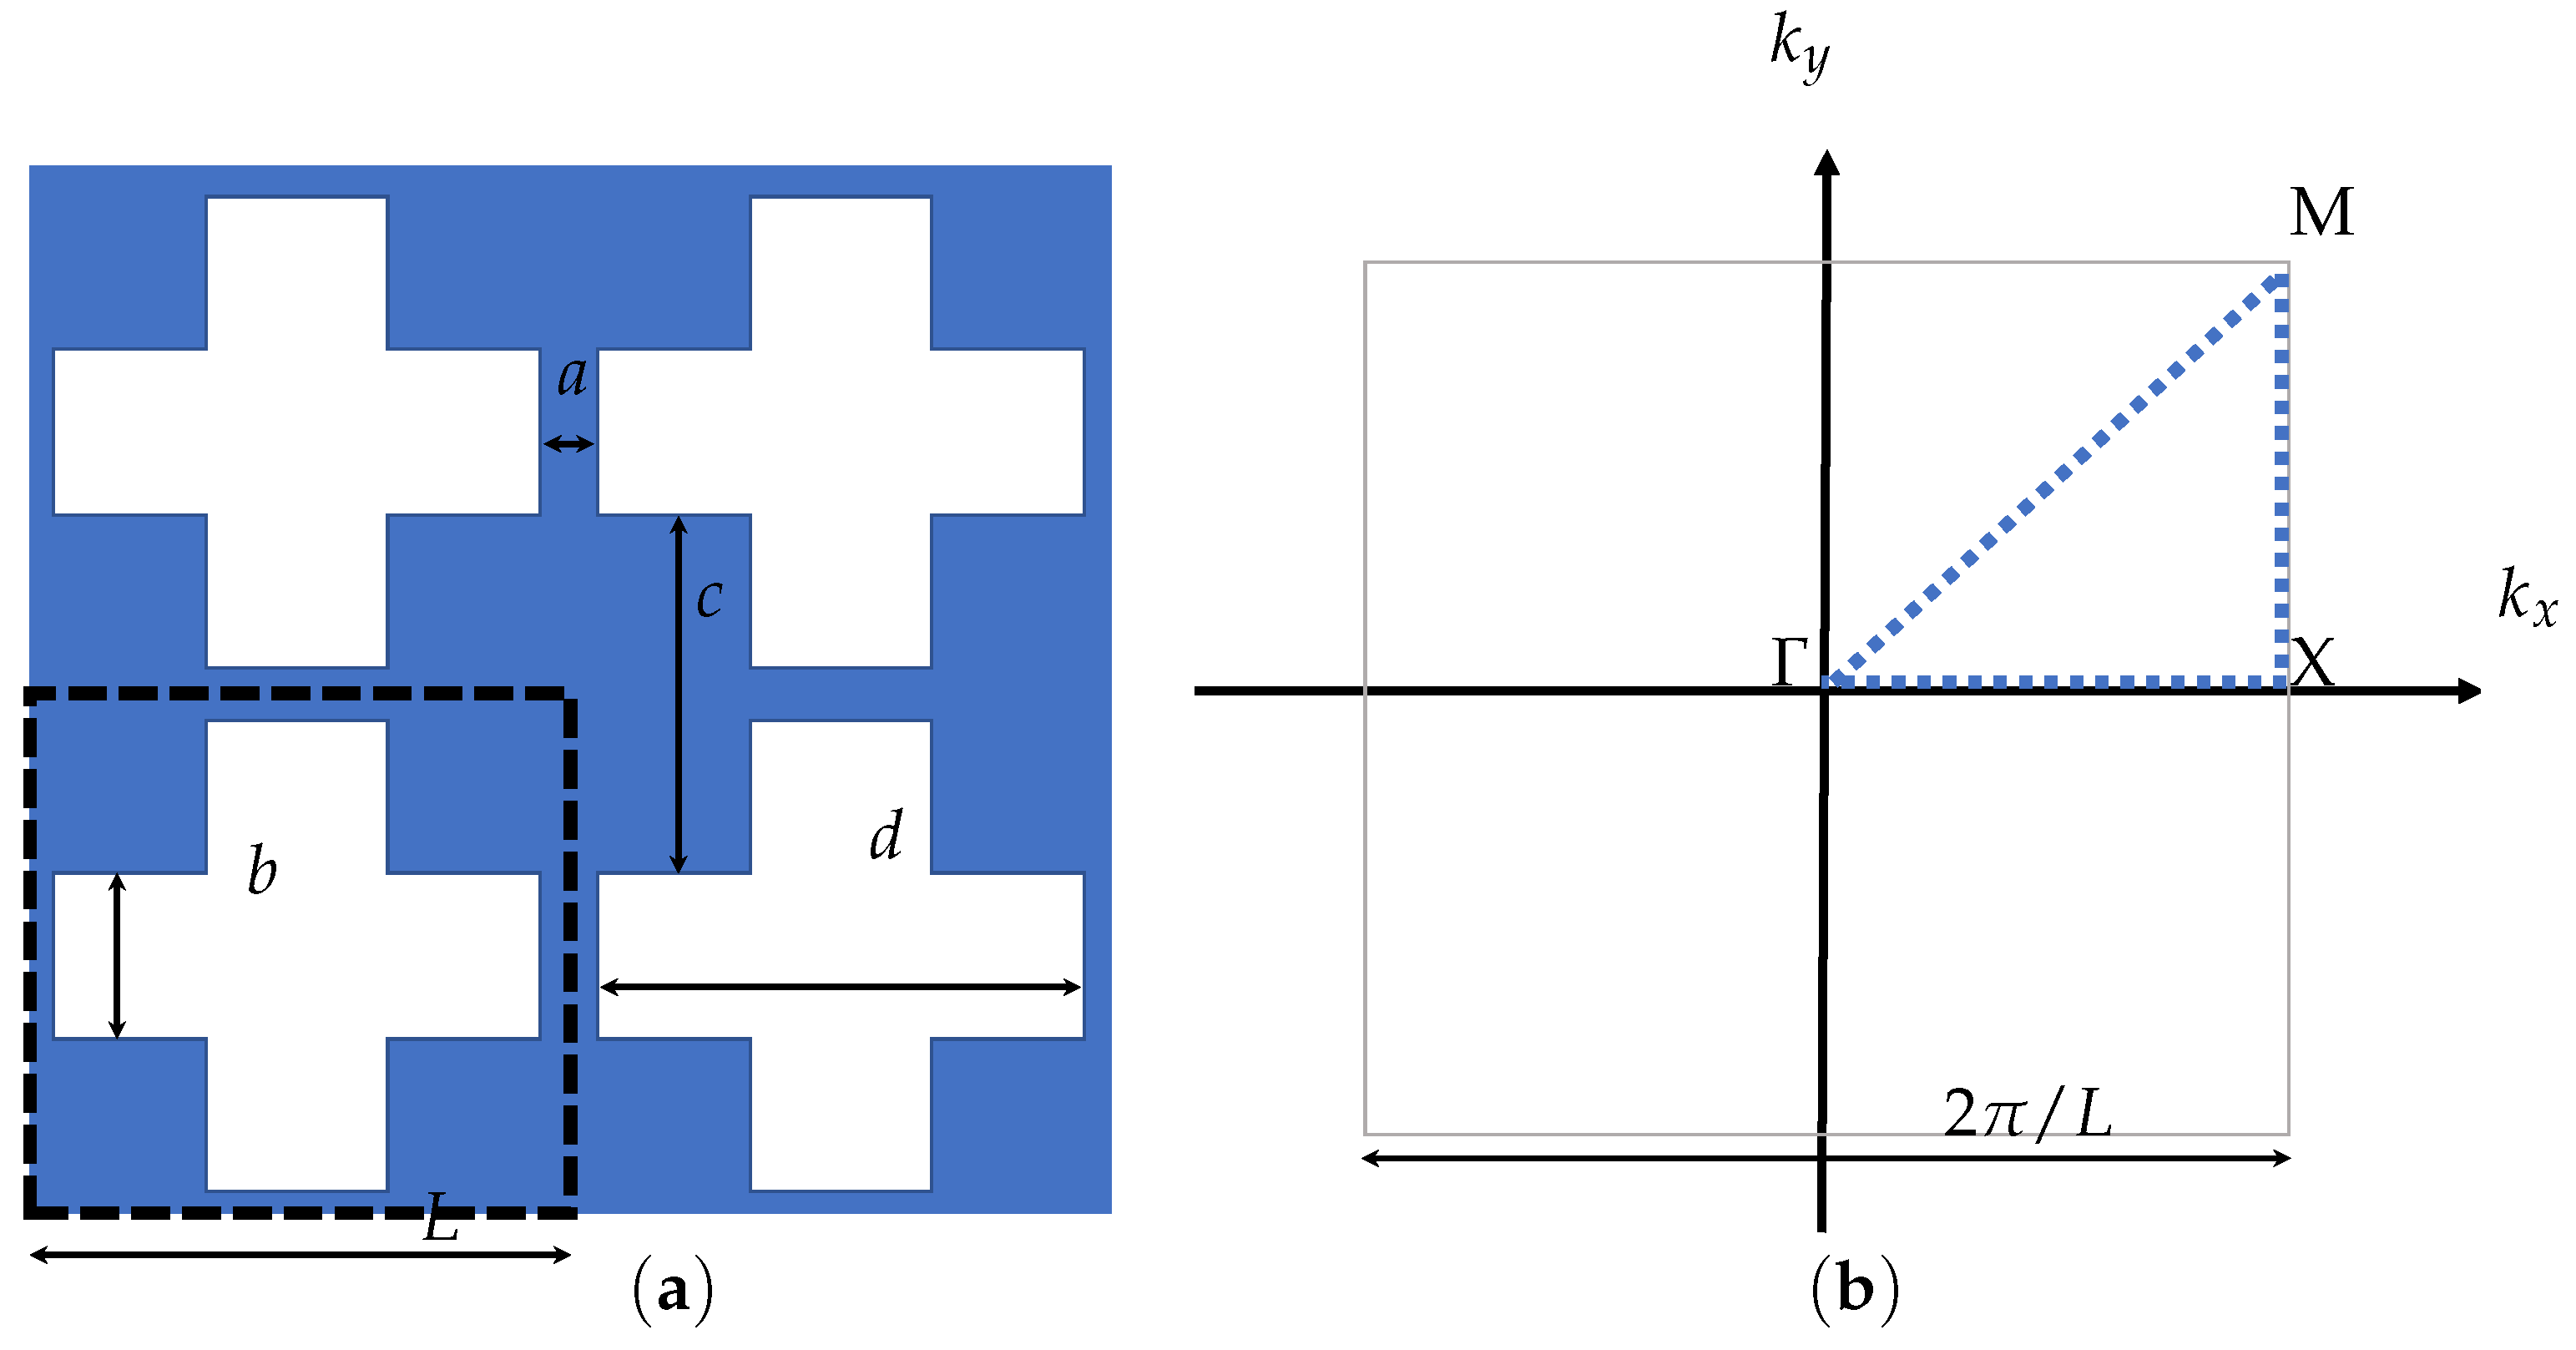
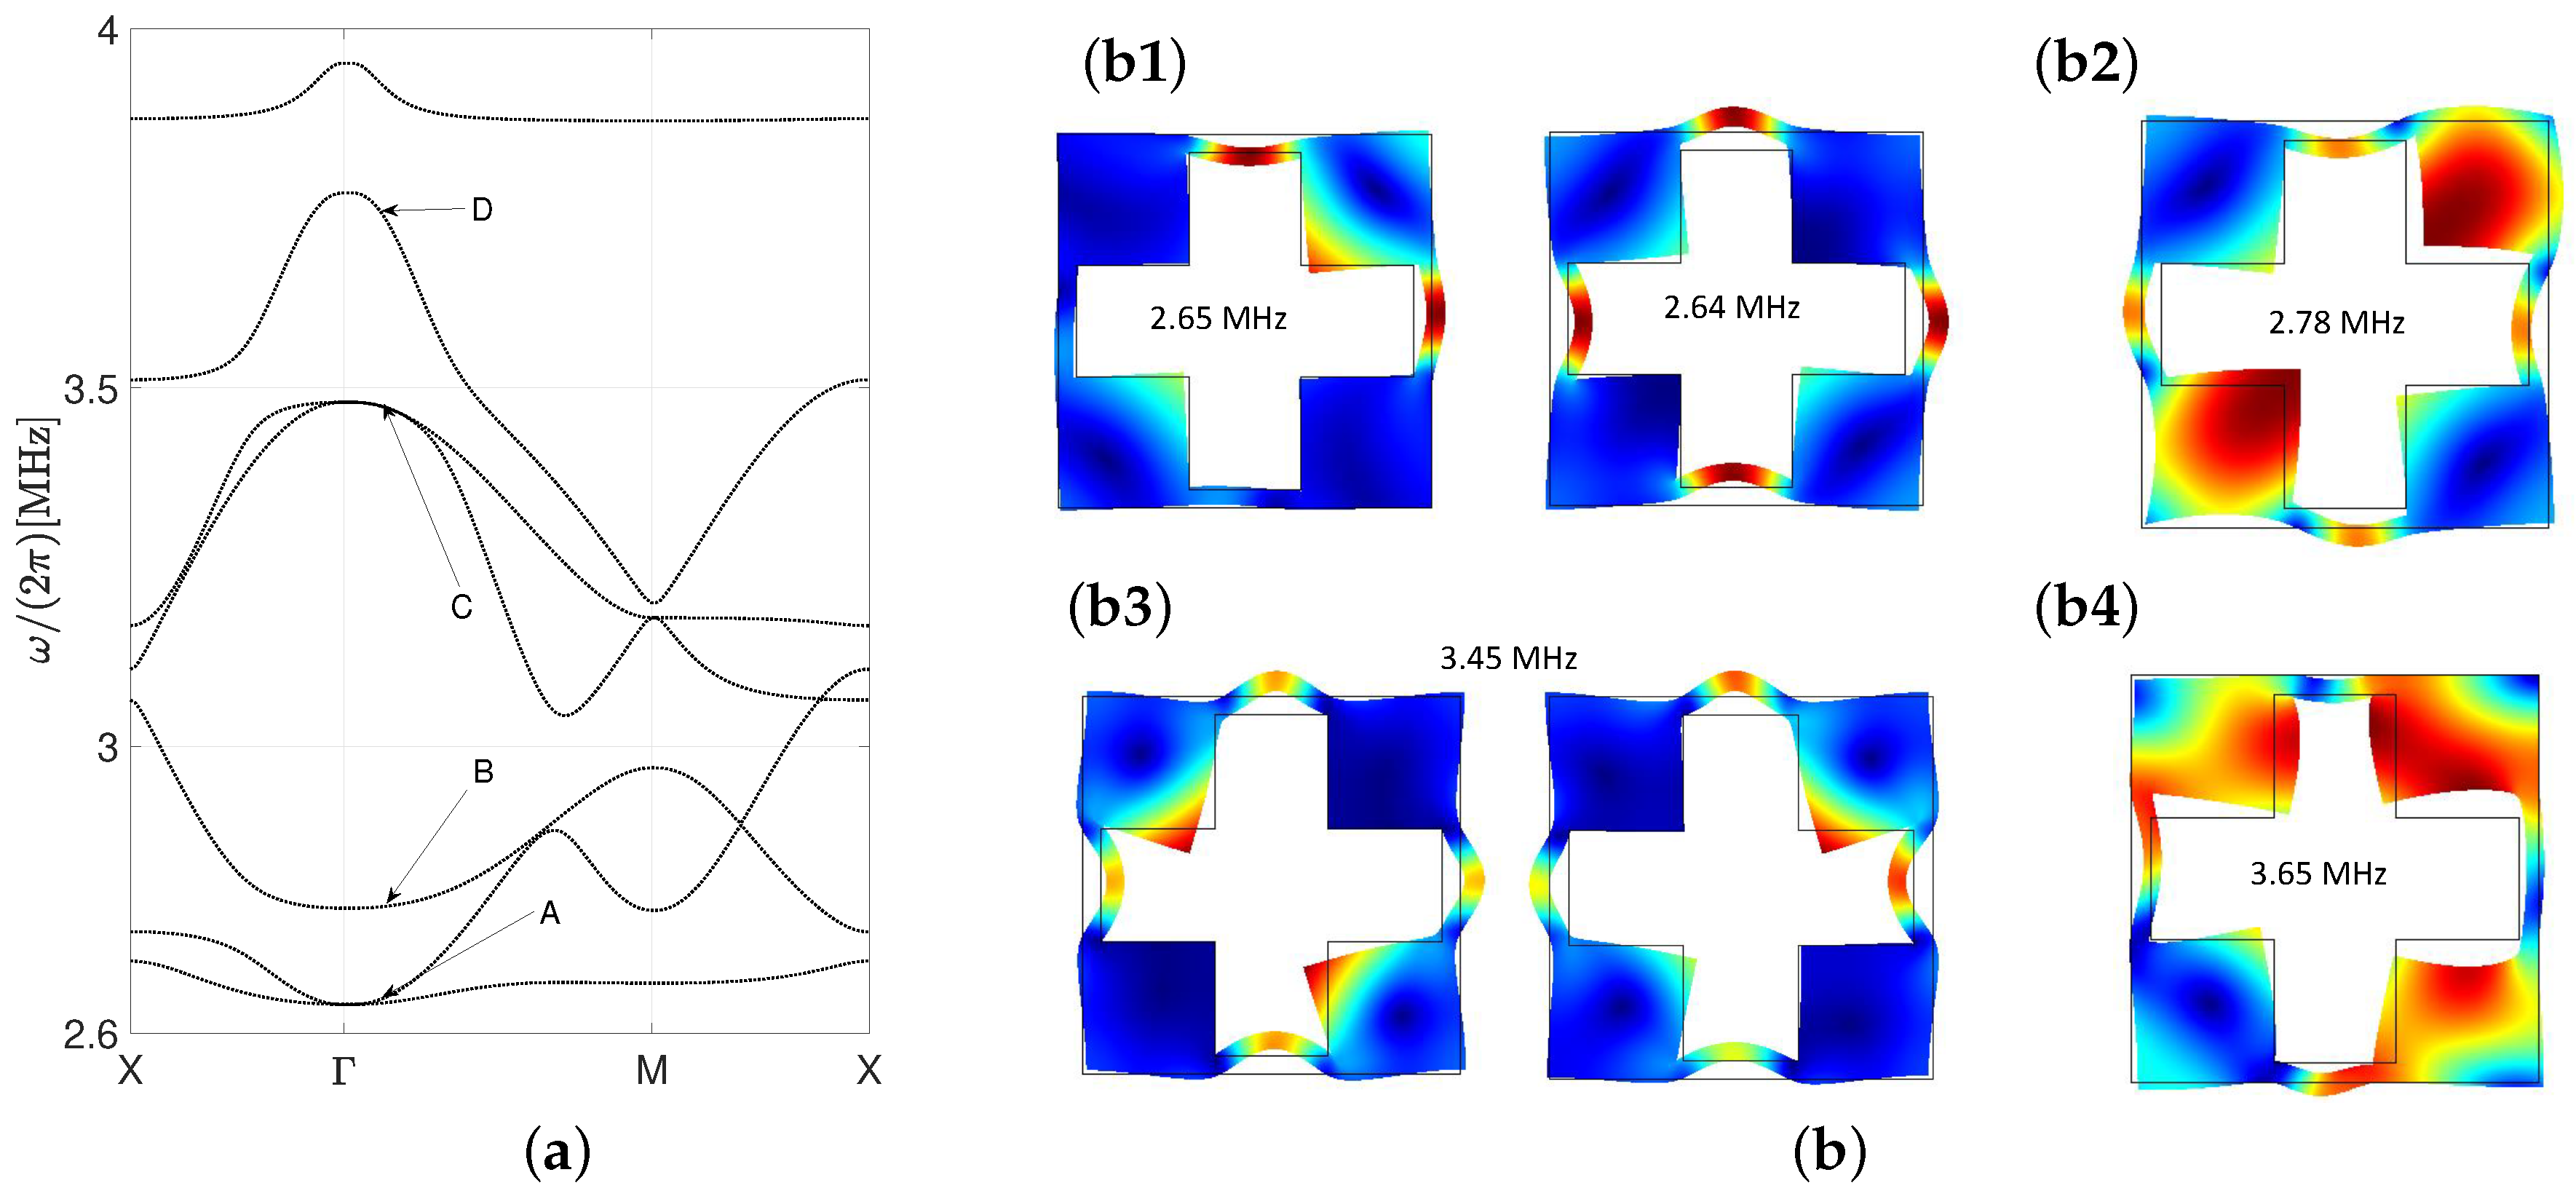
2.2. Dispersive Properties of a Swiss-Cross Periodic Structure

In this manuscript, we are interested in dynamically exciting a metastructure whose building blocks are enclosed within the dashed black square of Figure 1a. The blue region represents plane-strain aluminium (material parameter values are provided in Section 2.3 when describing the finite element models) whereas the white region, reminiscent of a Swiss cross, is void, with zero traction boundary conditions prescribed on its boundaries, i.e.,
σ i j n j = 0 .
The unit vector n j n j ( x 1 , x 2 ) is normal to the line delimiting the void and σ i j are the in-plane components of the plane-strain elastic stress tensor. Bloch–Floquet quasi-periodic boundary conditions [32] for the displacement field are
u ( x + ξ 1 L 1 + ξ 2 L 2 ) = exp ( i ξ 1 k · L 1 + i ξ 2 k · L 2 ) u ( x ) , with x Ω ,
where ( ξ 1 , ξ 2 ) Z 2 , k = ( k x , k y ) T , L 1 = L ( 1 , 0 ) T , L 2 = L ( 0 , 1 ) T , and Ω is the region enclosed by the dashed square in Figure 1a. The dispersion surfaces for the unit cell illustrated in Figure 1a are obtained by performing the following computational steps:
  • FE discretisation of the time-harmonic counterpart of the Lamé system of Equation (1);
  • prescription of Bloch–Floquet quasi-periodic conditions as in Equation (4), along with F = 0 and zero-traction conditions (see Equation (3)) at the boundaries of the Swiss-cross holes;
  • solution of the resulting eigenvalue problem for the Bloch frequency ω as a function of the Bloch vector k in the first Brillouin zone represented in Figure 1b.
The high symmetry points in Figure 1b are
Γ = 0 0 , X = π L 1 0 and M = π L 1 1 .
In order to obtain a fine resolution of the dispersive properties, the first Brillouin zone was sampled using 100 × 100 equally spaced points. The problem was then solved by using the commercial FE software COMSOL Multiphysics.
Table 1 summarises the geometric parameter values of the unit cell represented in Figure 1a. In Figure 2a, we present the high-frequency dispersion diagrams projected over the boundaries of the irreducible Brillouin zone. Figure 2b shows some selected eigenmodes associated with the corresponding branches of the dispersion curves.
Once the Bloch dispersion surfaces ω ( k ) are obtained, it is possible to evaluate the group velocity of waves travelling parallel to the wave vector k , as
v g ( k ) = k ω ( k ) ,
by using standard numerical gradient routines. The group velocity landscape of the structure is presented in Section 3. As originally documented in the seminal book by Joannopoulos et al. [32], focusing on photonic crystals, the comparison of isofrequency contours and group velocity of the bulk homogenous external medium (2) with those of the periodic microstructured medium give invaluable information about the capability of metamaterials to effectively “mould" the flow of waves.

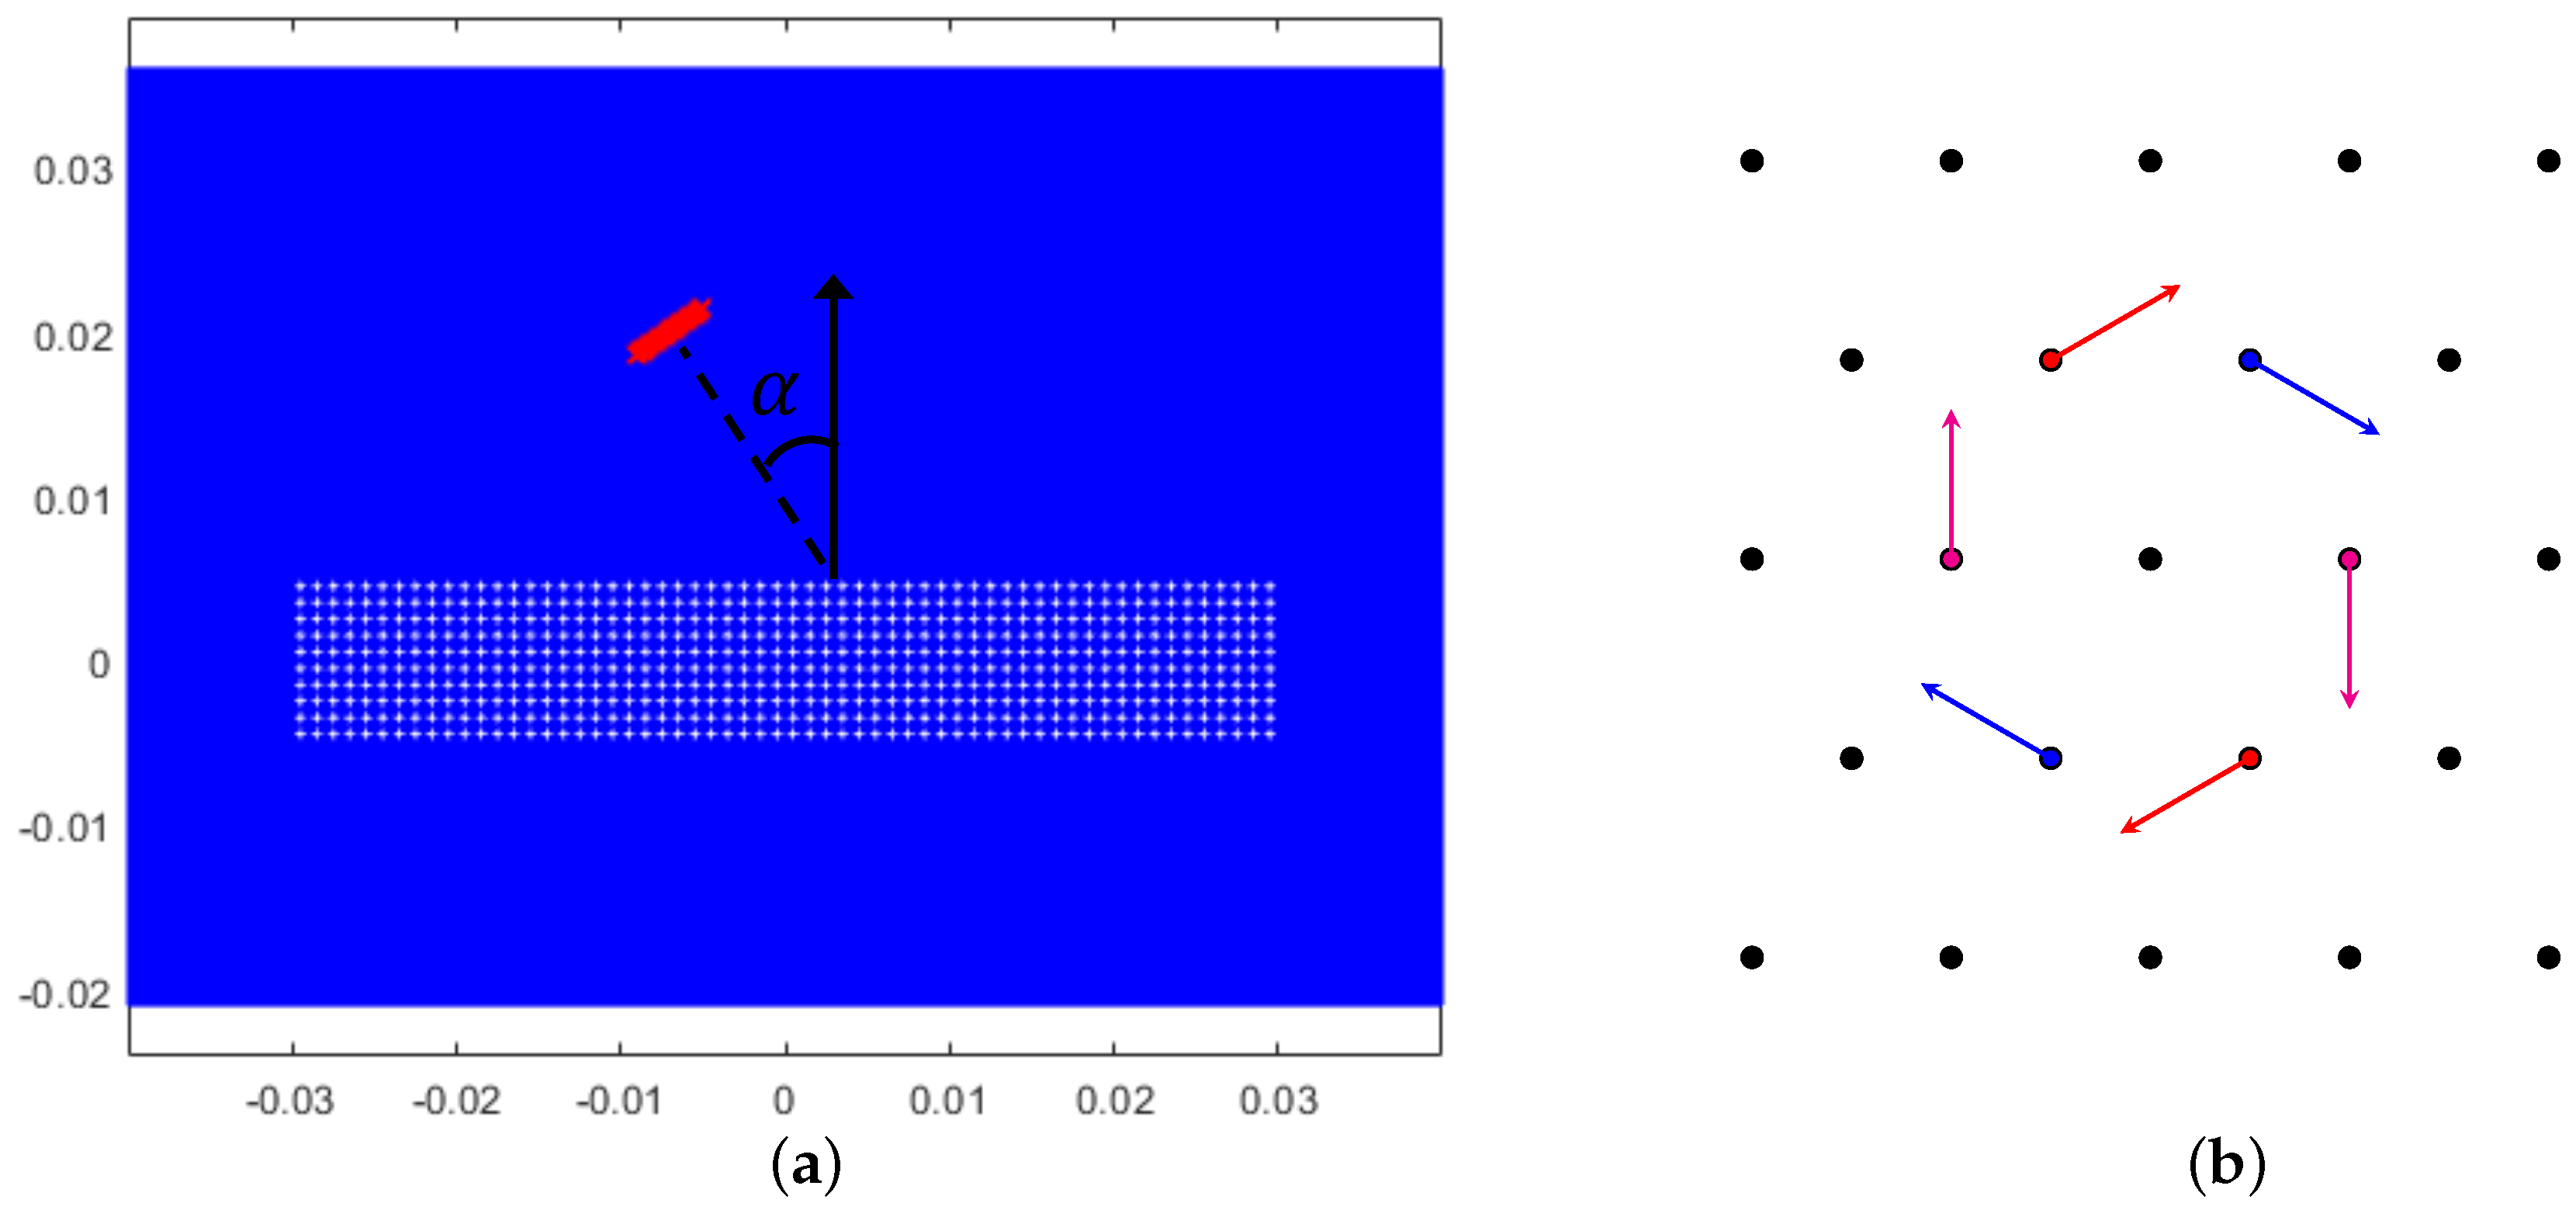
2.3. Transient GPU-Accelerated FE Models

The underlying finite element model’s spatial domain is illustrated in Figure 3a for the case of an incident Gaussian beam. Various dimensions of the metamaterial slab were considered but the case of ten rows of sixty identical unit cells is shown in Figure 3a, covering horizontal and vertical distances of 60 mm and 10 mm, respectively. Absorbing layers, to reduce the effect of unwanted reflections from the sides of the truncated two-dimensional homogeneous part of the domain, are applied to the horizontal and vertical extremities of the domain. The thickness of the absorbing layers is chosen to be > 3 λp, following the recommendations of previous literature [33] to ensure that unwanted reflections are minimised; the notation λp denotes the longitudinal, or compression, wavelength. The dependence of the absorbing layer parameter value, on the longer wavelength scale, accounts for the mode conversions that occur as the incident shear wave interacts with the metamaterial and its constituent subunits.
The wavelength is determined by the incident centre frequency, f = ω / 2 π , and the material parameters of the media. Aluminium material parameters (Young’s modulus, Poisson’s ratio, and density) are assumed here: E = 70 Gpa , ν = 0.33 , ρ = 2700 kg / m 3 to define compression and shear wave speeds of c p = 6198 and c s = 3122 m/s. The two homogeneous parts of the domain in Figure 3a, above and below the metamaterial slab, are defined by these aluminium material parameters. The central portion was also initially defined in the same way but the cross-shaped holes are excised to create the periodic array of unit cells. Zero traction boundary conditions (see Equation (3)) are applied to the edges of the crosses, whose dimensions are illustrated in Figure 1a and Table 1.
Each unit cell is a 1 mm × 1 mm square that contains a symmetrical cross (resembling the Swiss cross) with length and width 0.9 mm. Therefore, the spacing between the left and right ends of neighbouring crosses is 0.1 mm. As shown in Figure 1a, all sublengths of this study’s fundamental cross are equal, i.e., 0.3 mm, whereas the Swiss cross (also known as the emblem of the Red Cross) possesses a sublength ratio of 7:6, for which the central square has relative length 6.
The initial studies investigated for this article were periodic arrays of these regular crosses, with slab sizes varying from 10 × 60 slabs to 24 × 60, for which the first number represents the number of repeating rows. The domain was meshed with element length Δx = 0.02 mm using the explicit time-domain finite element software package Pogo [24], and its in-built meshing tool, pogoMesh. The element size is minimised to improve the accuracy of the results observed. It is well known that for two-dimensional explicit time domain FE studies [24,34], thirty elements per wavelength is more than sufficient for convergence of the results. Since a range of frequencies were used here, the mesh size was chosen to ensure convergence for all cases considered. The highest centre frequency in the examples that follow is 3.3 MHz, which corresponds to a shear wavelength of λs = 0.95 mm, equating to close to fifty elements per shear wavelength, ensuring convergence for all examples presented. Figure 4a illustrates the mesh of plain-strain, linear, 3-noded triangular elements around a cross-shaped hole; the pogoMesh function generates an irregular mesh in the immediate vicinity of the edges and vertices, but reverts to a regular form as the distance from the interface increases.
The size of the FE model varies with the slab of metamaterial investigated. For example, a 10 ×60 example, with beam angle α = 35° varies from −26 mm to 36 mm in the vertical direction, and −40 mm to 40 mm in the horizontal dimension, producing a domain consisting of around 25 million triangular elements and degrees of freedom (DOFs) for the two-dimensional model. A larger domain is required to accommodate a smaller beam angle, or a point source at distance. For example, the case of a point source located 40 mm from the top of the slab requires a domain with more than 50 million DOFs, ranging from −40 mm to 40 mm in the horizontal direction, and from −56 mm to 56 mm in the vertical direction.
The use of Pogo [24], a GPU-driven explicit transient FE software package, has enabled a step change in modelling capability for the elastic metamaterial considered here. Standard CPU-driven software packages for time domain computations begin to show instability for model-sizes > 10 million DOFs, and simulations become increasingly inefficient with respect to run-times. In contrast, several examples considered here exceeded 50 million DOFs with no stability issues and run-times of less than ten minutes on a standard PC with a single Nvidia GTX 1080Ti GPU card possessing 11 GB of memory. The results are also highly accurate for very large and complex models; the three-dimensional studies of elastic wave attenuation and scattering in polycrystalline solids [26,35] investigate models with up to 1 billion DOFs. Models that would take several days for standard CPU-driven transient schemes can be run in a matter of hours using parallel GPU-implementation.
The underlying excitation is a 200-cycle Hann-windowed tone-burst (numerical investigations were initially conducted to optimise the number of cycles) with centre frequencies selected from the higher frequency dispersion surfaces in Figure 2. Two types of shear wave excitation were considered, a Gaussian beam or point source. The Gaussian beam used a 5 mm source line, highlighted with red markers in Figure 3, wherein the underlying signal was applied to each source node with appropriate weighting to steer the beam at the chosen incident angle α (see Figure 3a).
The point-source excitation method is illustrated in Figure 3b. Similarly, appropriate weightings were applied to the relevant nodes to produce an incident shear wave, whose homogeneous medium wavelength is determined by λ = c s / f , where f denotes the centre frequency of the excitation. Note that a phase difference of π is applied to nodes diametrically opposite to one another (indicated by arrows of the same colour) in Figure 3b. In order to generate a compression wave point source, the arrows in Figure 3b would be rotated by π / 2 in the anticlockwise direction, to obtain the required weightings.
Each simulation was run for T = 120 μ s , with the excitation signal length defined by the ratio of number of cycles to the frequency. For explicit time-domain numerical methods, it is essential that the Courant–Friedrichs–Lewy convergence condition [36] is satisfied. The finite element simulation time step Δ t was determined by the choice of Courant number C and the equation [36]
Δ t = C Δ x / c p .
The Courant number C must be less than one, and it is recommended to be lower than 0.7, so our choice of C = 0.3 ensures convergence for accurate results. The mode-converted compression wave speed, rather than shear wave speed, is used in Equation (7) to ensure that the time steps are sufficiently small to capture the wave propagation with optimal accuracy. As discussed by [26], a structured, regular mesh, as illustrated in the majority of Figure 4a, is likely to perform better than an irregular mesh. This is because the irregular mesh has a wider range of element sizes to account for sharp spatial features. Therefore, it is not possible to then achieve the same value of the Courant number everywhere, even if there is only one wave mode and material parameter definition present. Optimal results are obtained by reducing the area of the spatial domain that contains irregular meshing elements, something that pogoMesh [24] achieves in a highly efficient manner.

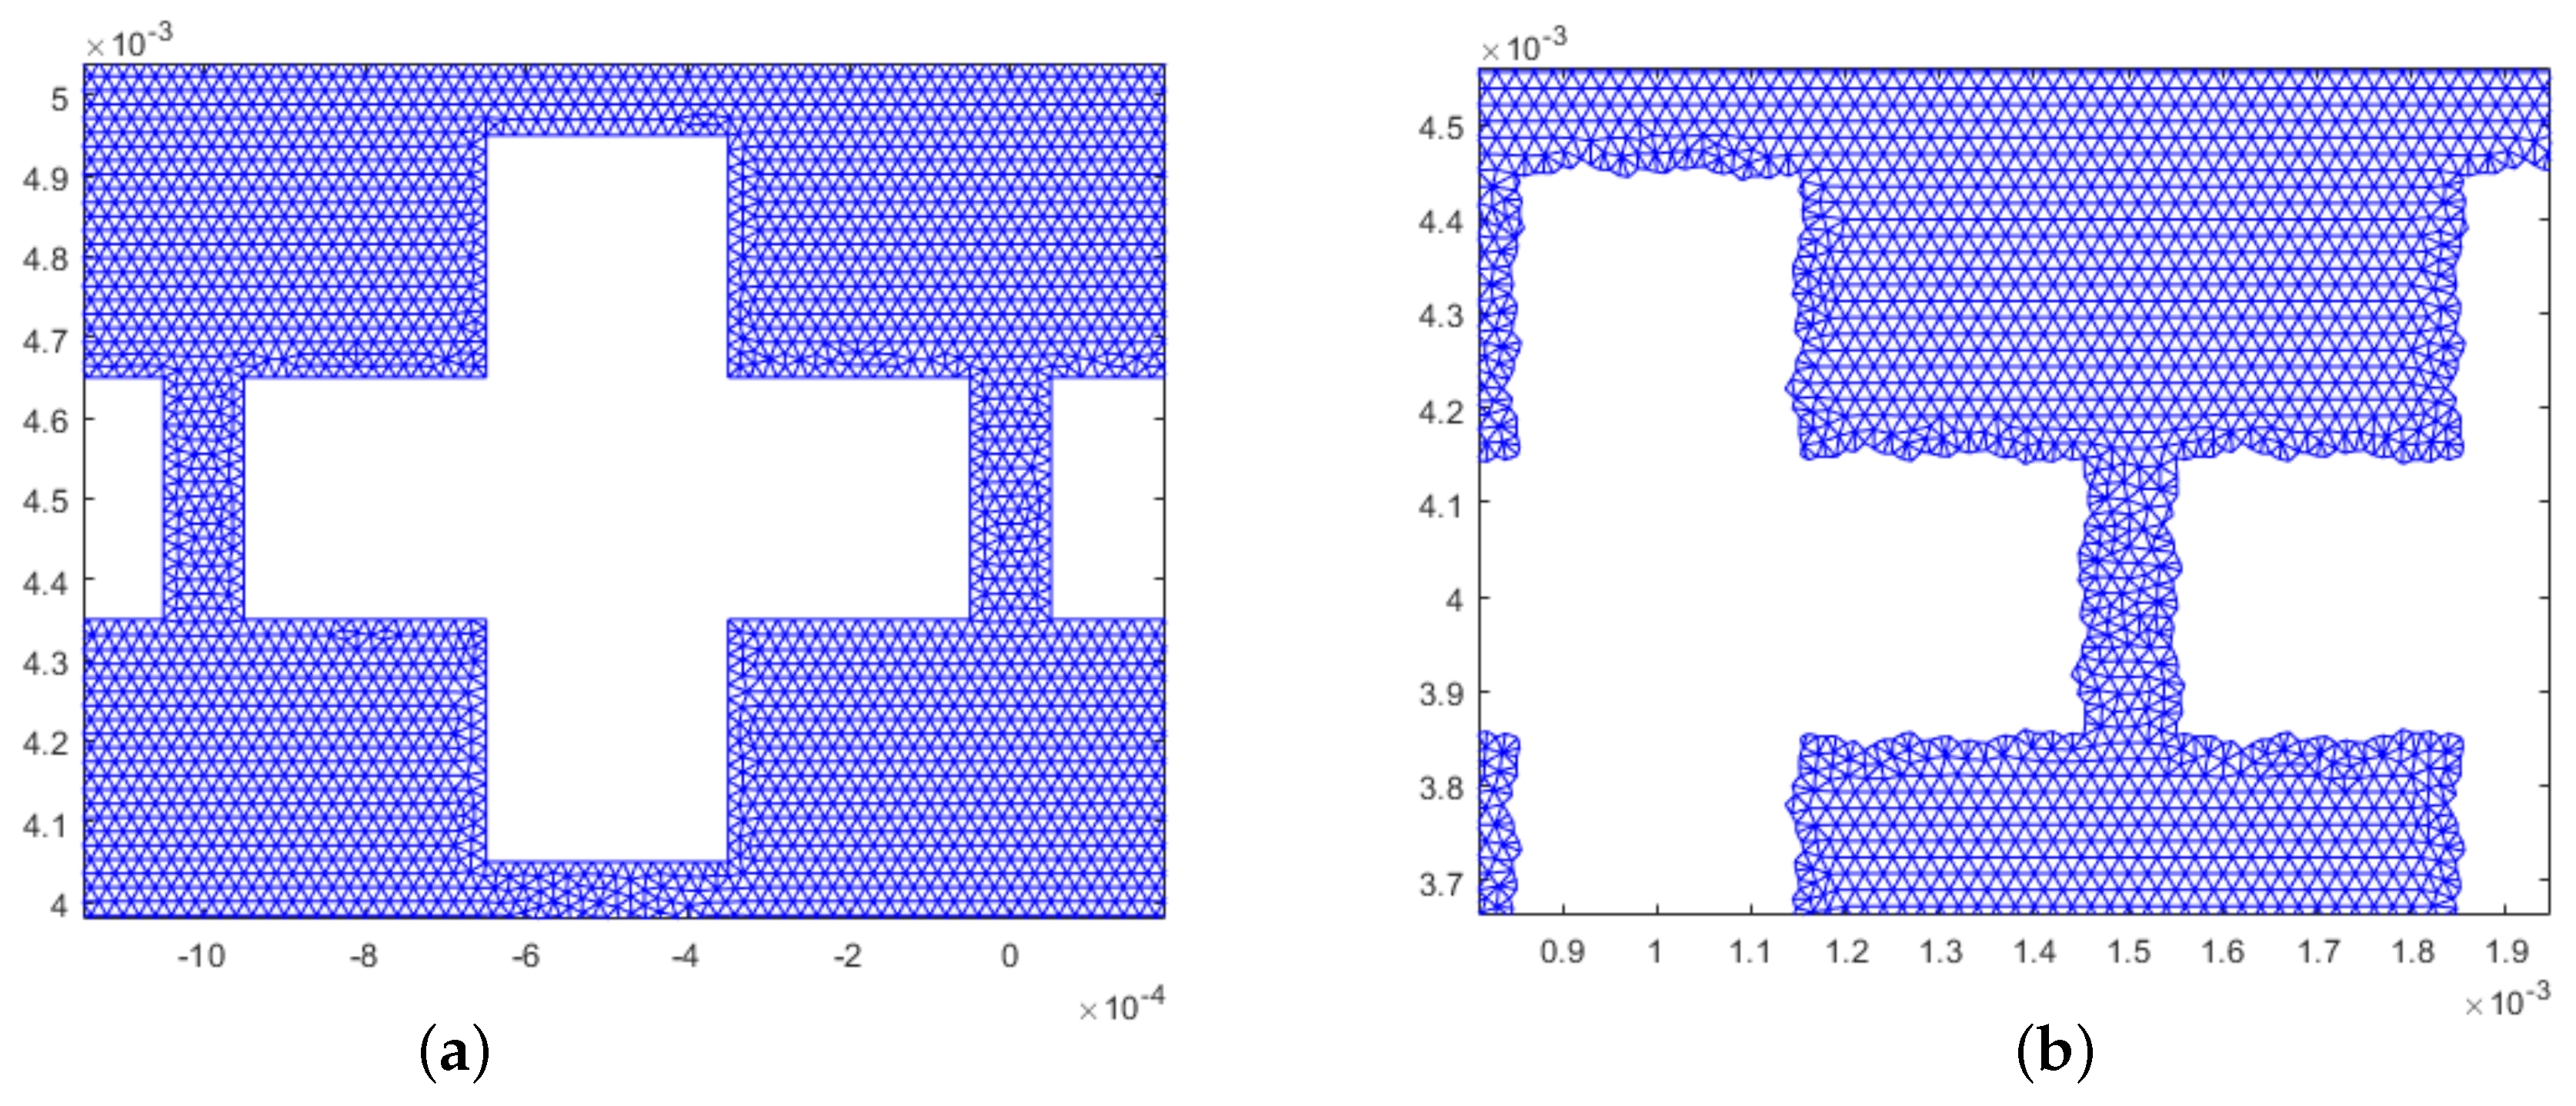
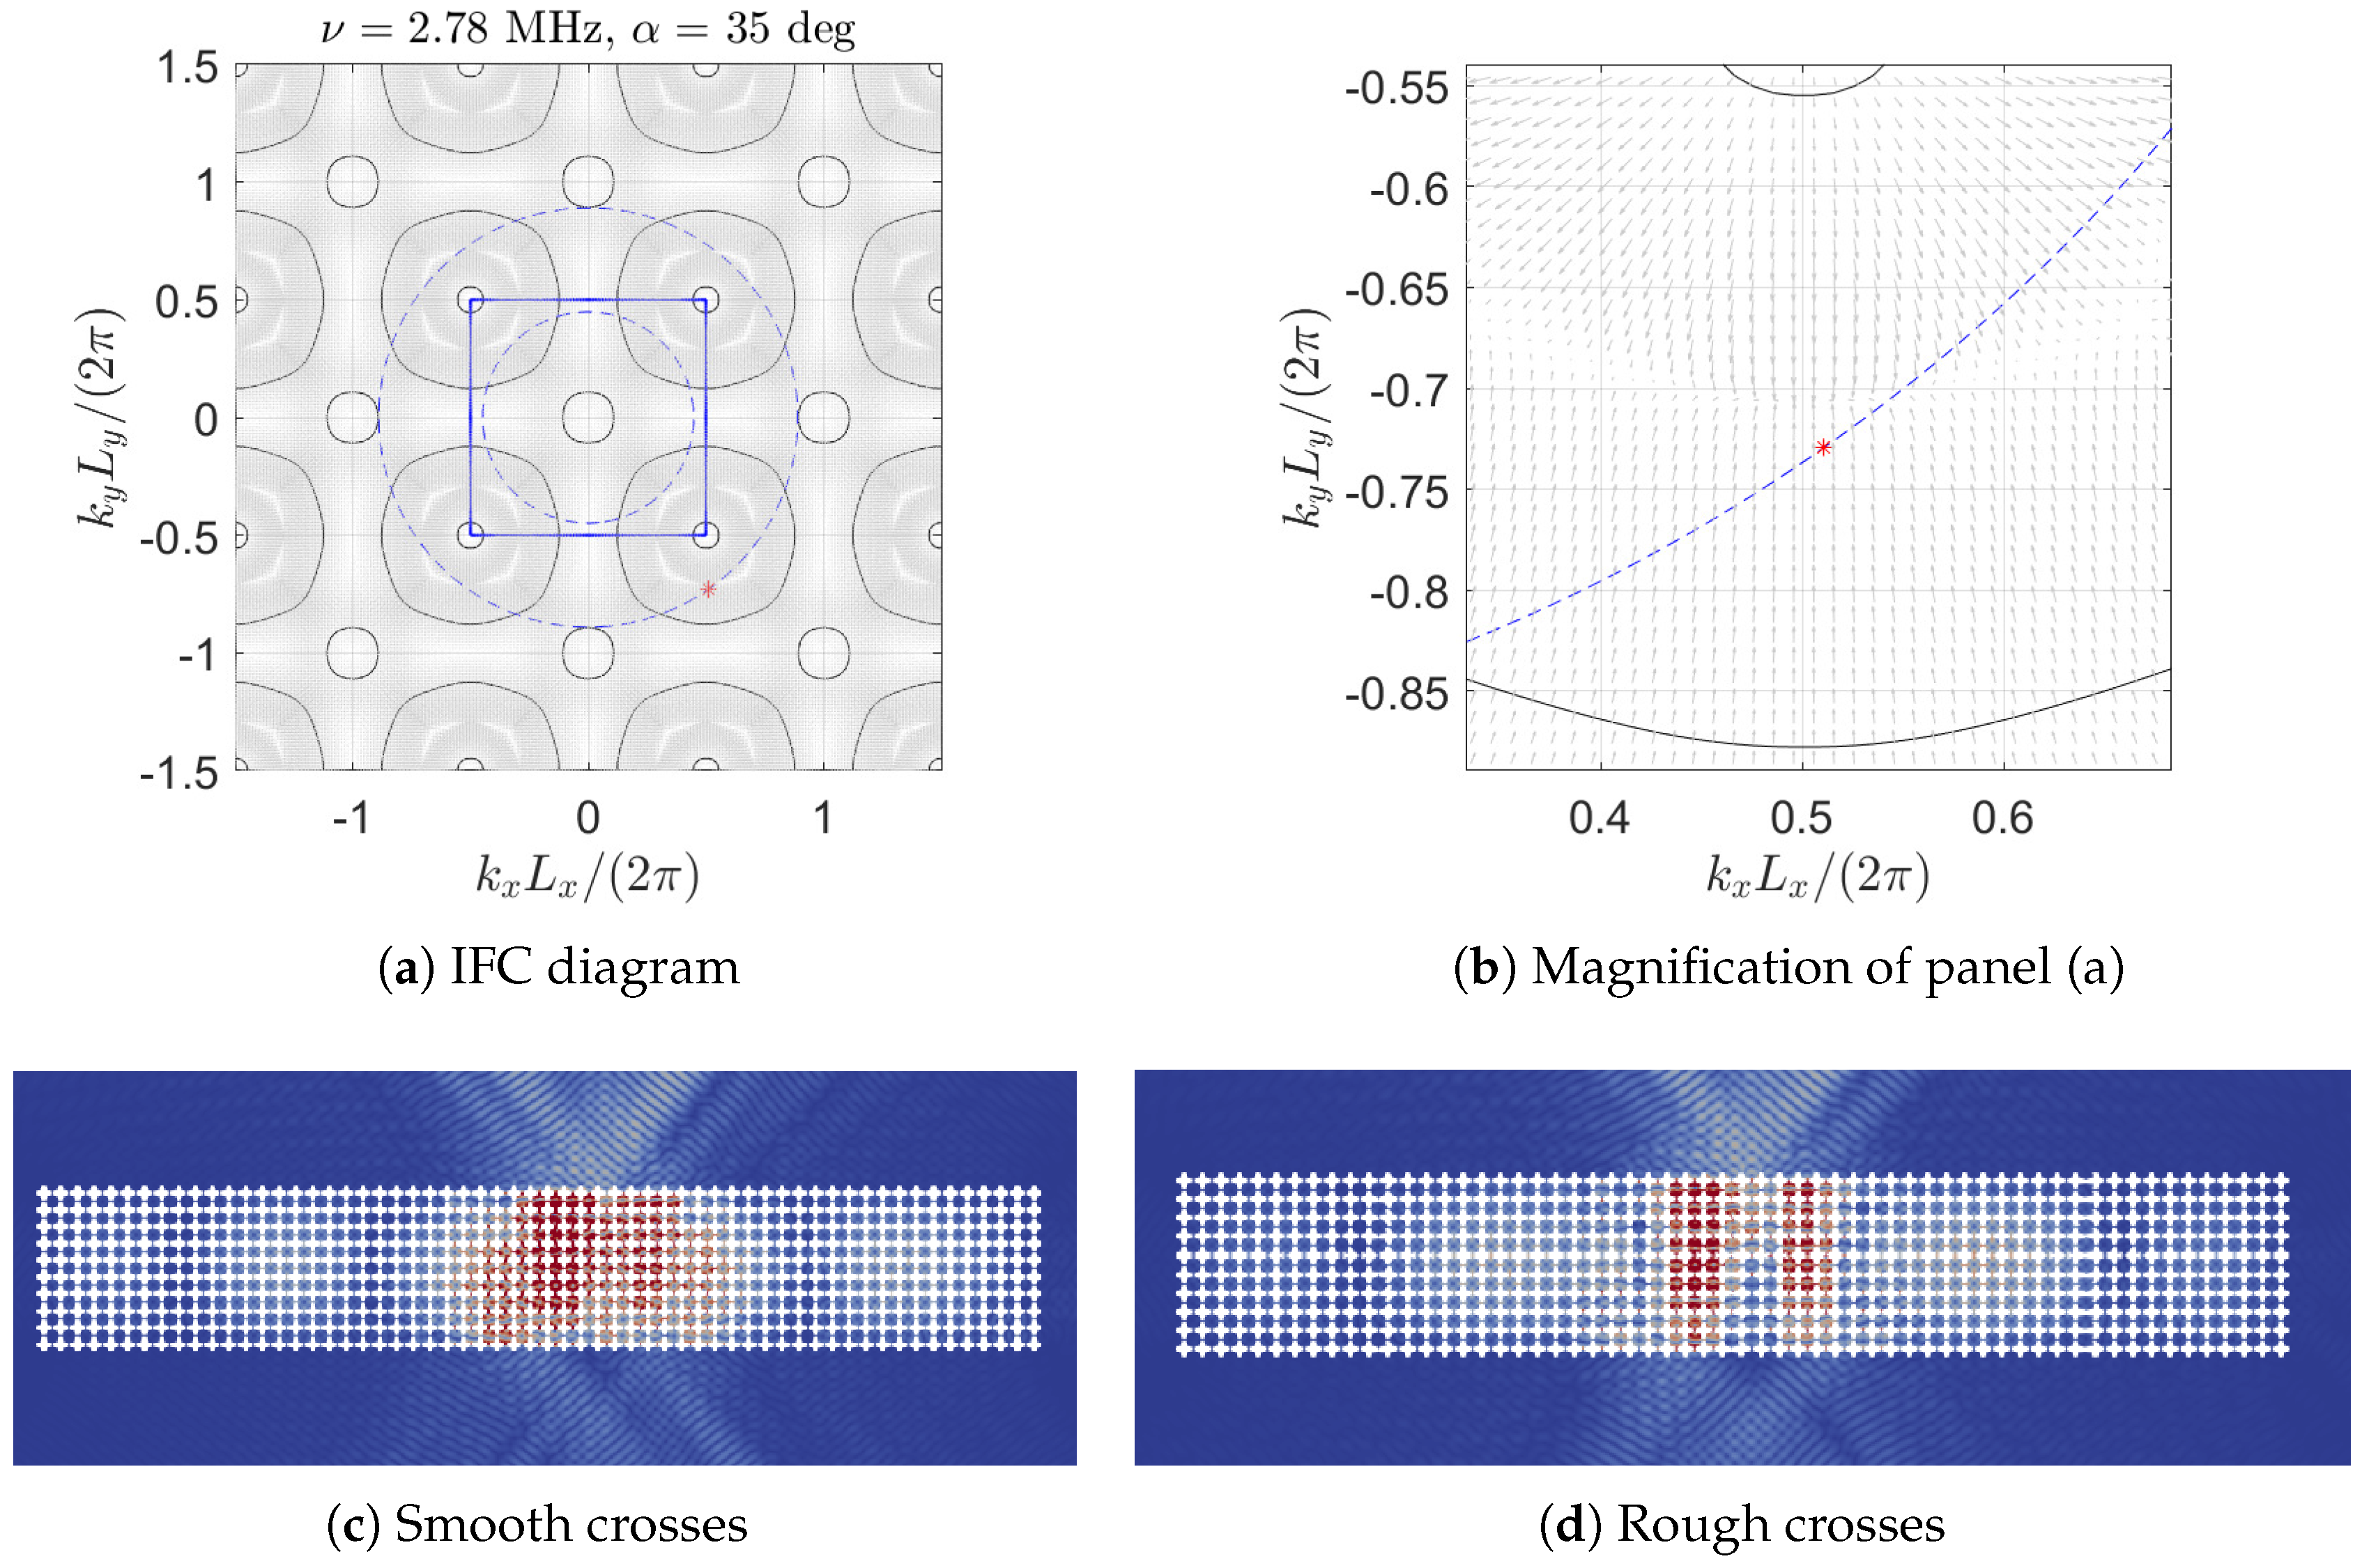
2.4. Rough Interfaces Model Generation

In order to investigate the robustness of the wave phenomena and the practicalities of manufacturing specimens of the metamaterial in the future, accompanying studies of perturbed cross-shaped holes were performed. Surface roughness may be regarded as a random process that requires statistical techniques for characterisation [37]. Typically, a rough surface may be described by its deviation from a smooth reference surface. For example, the rough surface of a pipe would be described by height deviations from a smooth cylindrical surface, whereas the rough sea would be measured relative to a smooth plane.
There are two important aspects of surface roughness to consider: the spread of heights above and below the mean reference surface and the lateral variation of these heights along the surface. Numerous statistical distributions and parameters have been used to describe these properties, including the root mean square (rms) height δ and correlation functions [38], which are defined in two-dimensional space as follows:
δ = < h 2 > , < h > = h p ( h ) d h = 0 ; C ( r ) = < h ( x 1 ) h ( x 1 + r ) > δ 2 ,
where x 1 is the coordinate direction along which the extent of the surface is defined, h is the variation in height from the mean line x 2 = 0 , p ( h ) is a probability density function, and < > denotes spatial averaging over the surface. The quantity r in (8) is the distance between any two points on the surface. A height correlation function C ( r ) describes the extent to which information about the height at one point on a surface determines, on average, the height at another point. A Gaussian correlation function is assumed here, following previous literature [38], but alternative distributions are also possible and investigated [37]. Note that with the definition in (8), C ( 0 ) = 1 and C ( ) = 0 so that as distance r increases, C ( r ) decreases. The characteristic correlation length, λ 0 , is the distance over which C ( r ) falls to 1 / e .
In additive manufacturing studies of surface roughness, an alternative measure of the variation of height about the reference surface is commonly used. For example, in the recent investigations [28,29,30], the arithmetic average of the absolute values of height profile deviations, R a , was reported. The difference between R a and δ is most easily understood by comparing their equations:
R a = 1 L 0 L | h ( x ) | d x ; δ = 1 L 0 L h ( x ) 2 d x ,
where L is the length of the rough surface. Although the two measures are similar, in general, the rms value δ will produce slightly higher values than R a – for example, in the event of a single large peak or deep valley.
Recent investigations of the surface finish of additively manufactured parts made from alloys containing aluminium (for example, Ti6Al4V, a titanium alloy stabilised with aluminium, and AlSi10Mg) by [28,29] indicate that the roughness parameter R a typically ranges from 2–25 μm. For our study of the effect of roughness on the wave phenomena observed for the regular cross-shaped holes, randomly rough surfaces of length 0.3 mm (characterised by a value of δ = 5 μm, which is in the aforementioned range) were generated and used to define the perturbed crosses shown in Figure 4b. The rough surfaces were generated by using a weighted moving average approach to correlate randomly generated height values, following the work of Ogilvy for ultrasonic nondestructive testing applications [38].
To ensure sufficient convergence and accuracy of the modelling results, the time-stepping of the FE simulation was adjusted to account for the addition of roughness in the models. Equation (7) was modified to replace Δx with Δx/4, which matched the roughness parameter values for δ and λ0. This change led to a significant increase in simulation run-time. For the regular models and T = 120 μs, the time-step Δt calculated from Equation (7) was Δt = 9.7 × 10 −10 s, leading to around 124,000 time steps. However, for the rough crosses, Δt was reduced to 2.4 × 10 −10 s, leading to nearly 500,000 time steps and a run-time approximately four times longer. The incident wavelength is of the order of the size of the cross-shaped hole, so it is expected that interaction with the defined roughness, which is realistic for additive manufacturing methods but around sixty times smaller, should have a minimal effect on the exotic wave effects observed for the regular, periodic structure.

3. Results and Discussion

As mentioned in Section 1, the main focus of this article is the scattering of waves within the high-frequency pass-band of a finite-sized slab of elastic metamaterial comprising a cluster of Swiss cross-shaped building blocks, as shown in Figure 1. The dispersion diagram, projected over the boundaries of the irreducible first Brillouin zone, is presented in Figure 2a, with an emphasis on the high-frequency regime of interest (>2.5 MHz). For a complete overview of the dispersive behaviour of the periodic systems of Swiss crosslike holes in Figure 1, the reader is referred to [19], where the focus is on complete band-gaps.
Despite the horizontal and vertical extents of the slab in Figure 3 being finite, the dispersive properties of bulk aluminium, and of the infinite periodic microstructured constituent, provide invaluable information for wave scattering phenomena within a finite structure. Previous studies, also using Bloch–Floquet quasi-periodicity to derive dispersions surfaces from which interesting frequencies were identified for finite substructures, have been carried out in several research fields, including civil [39,40] and biomedical [41,42] engineering.

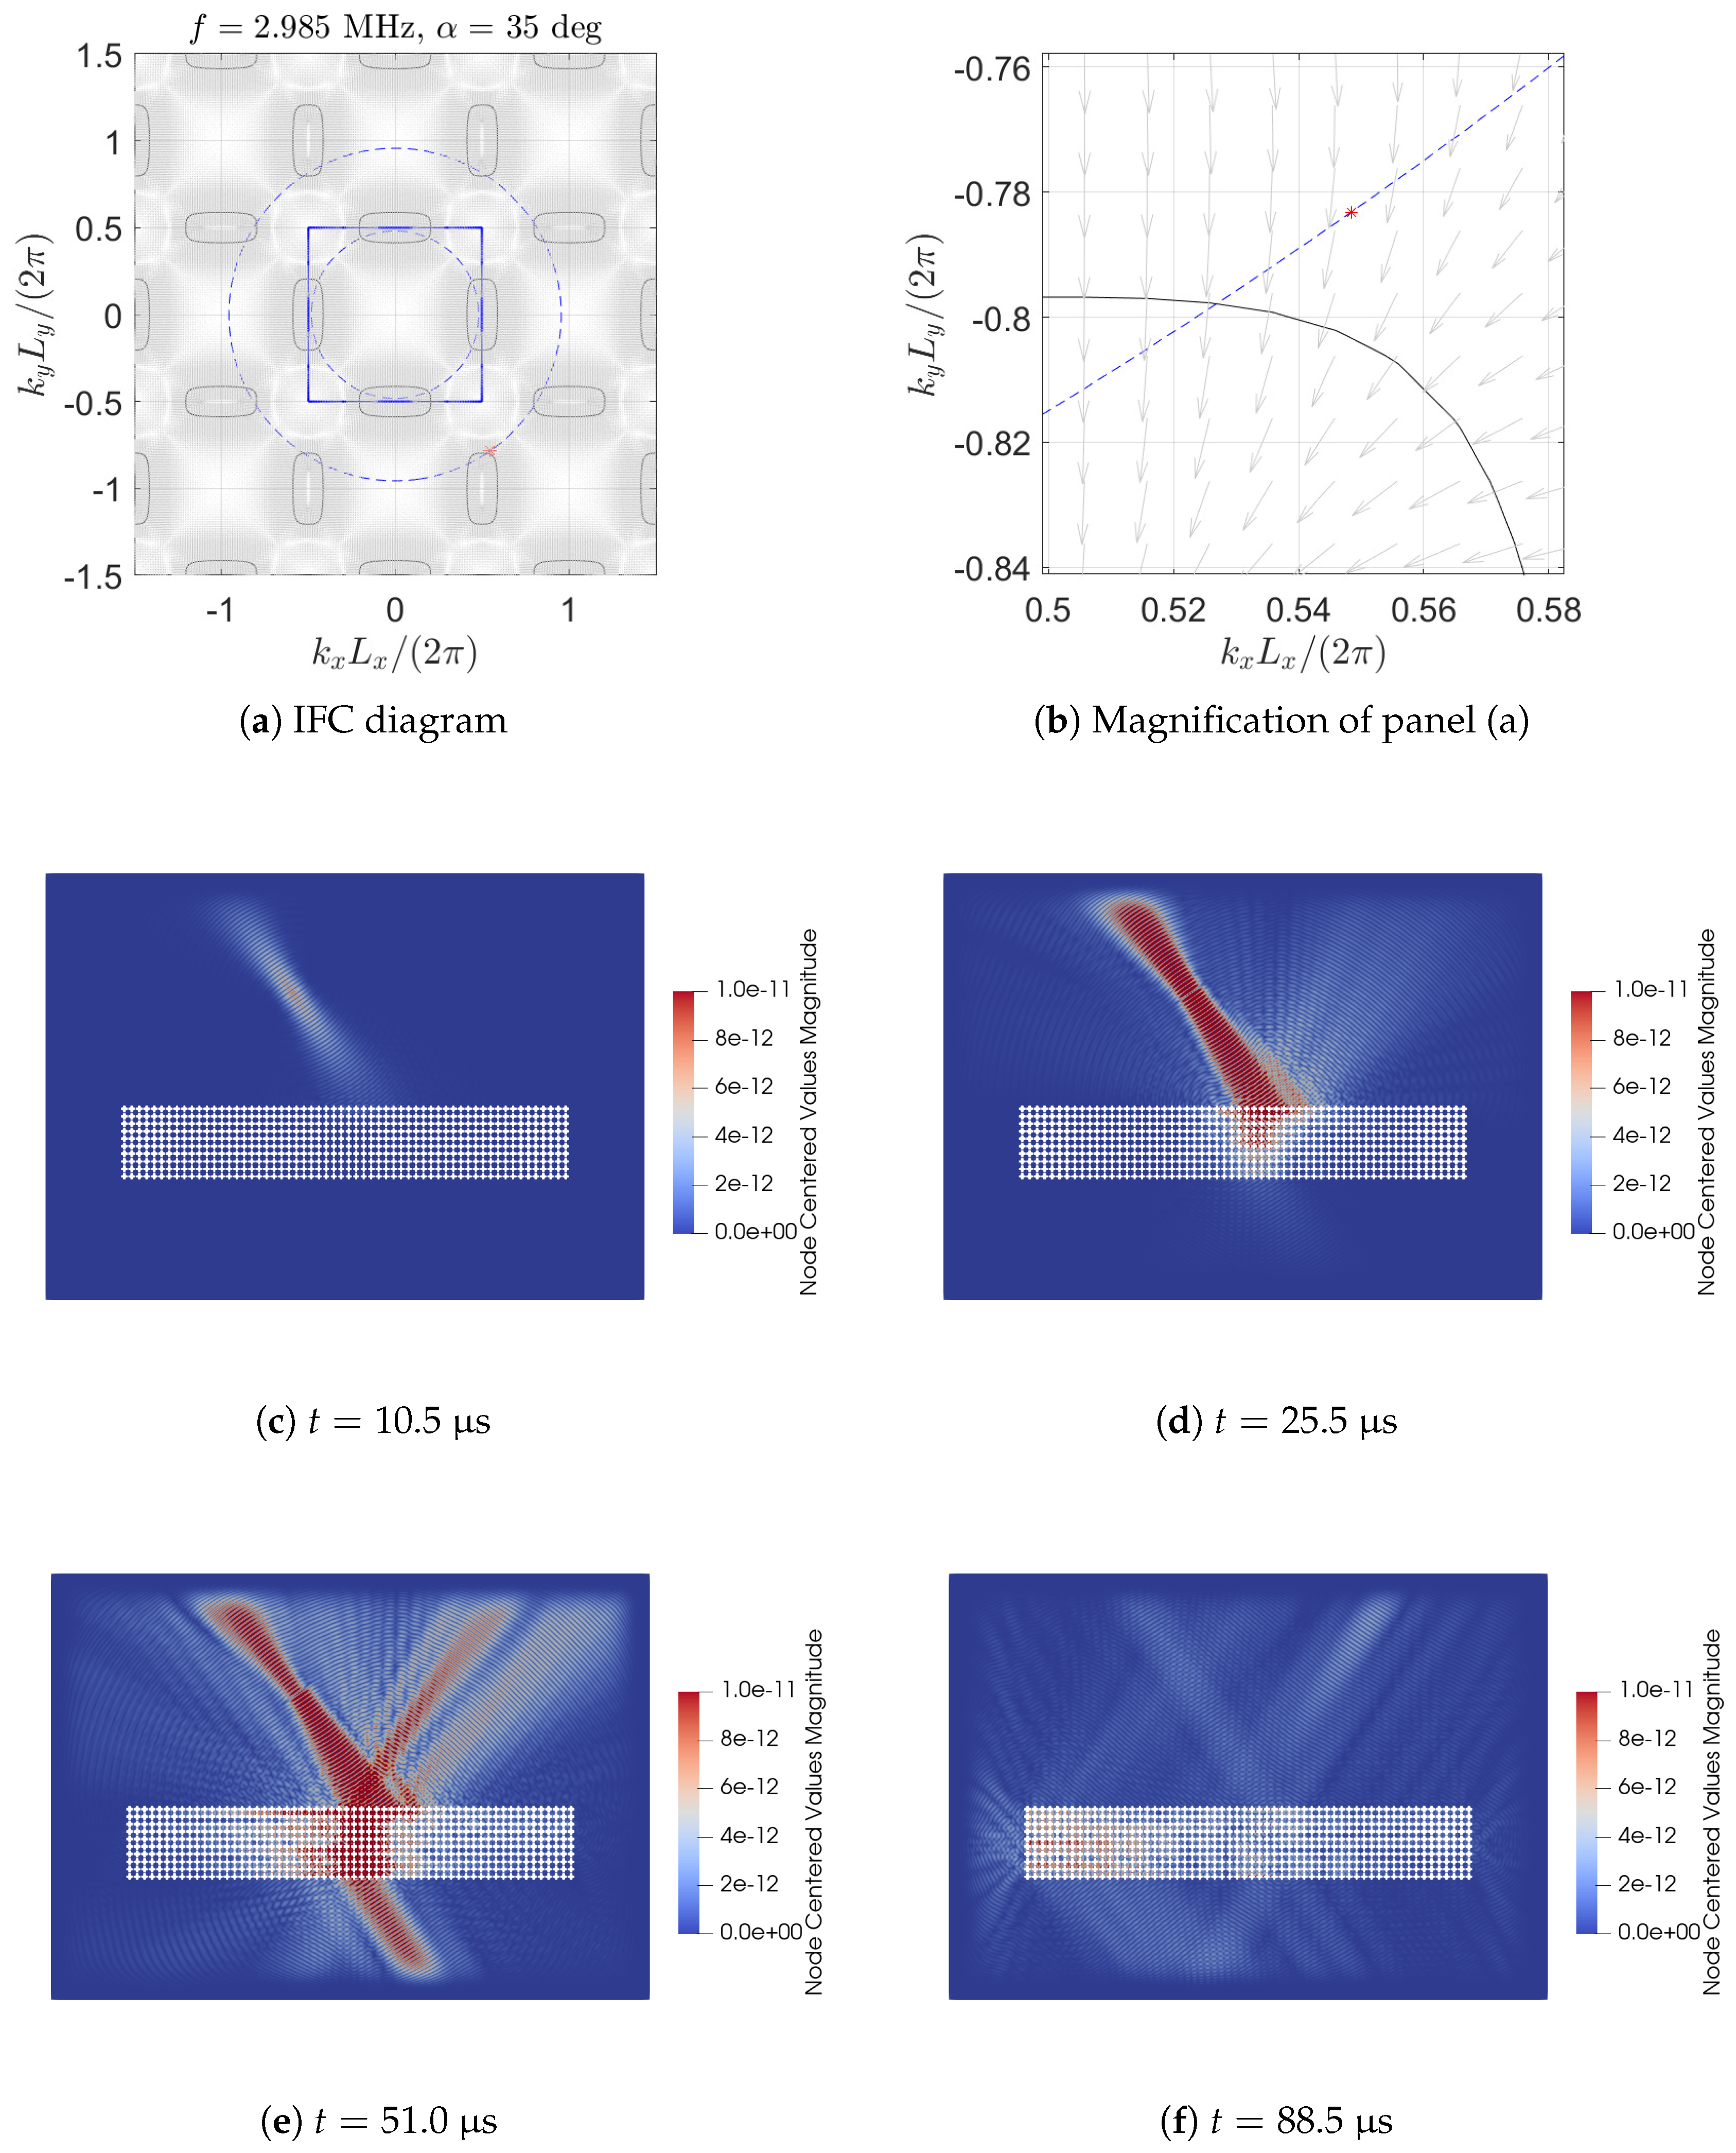
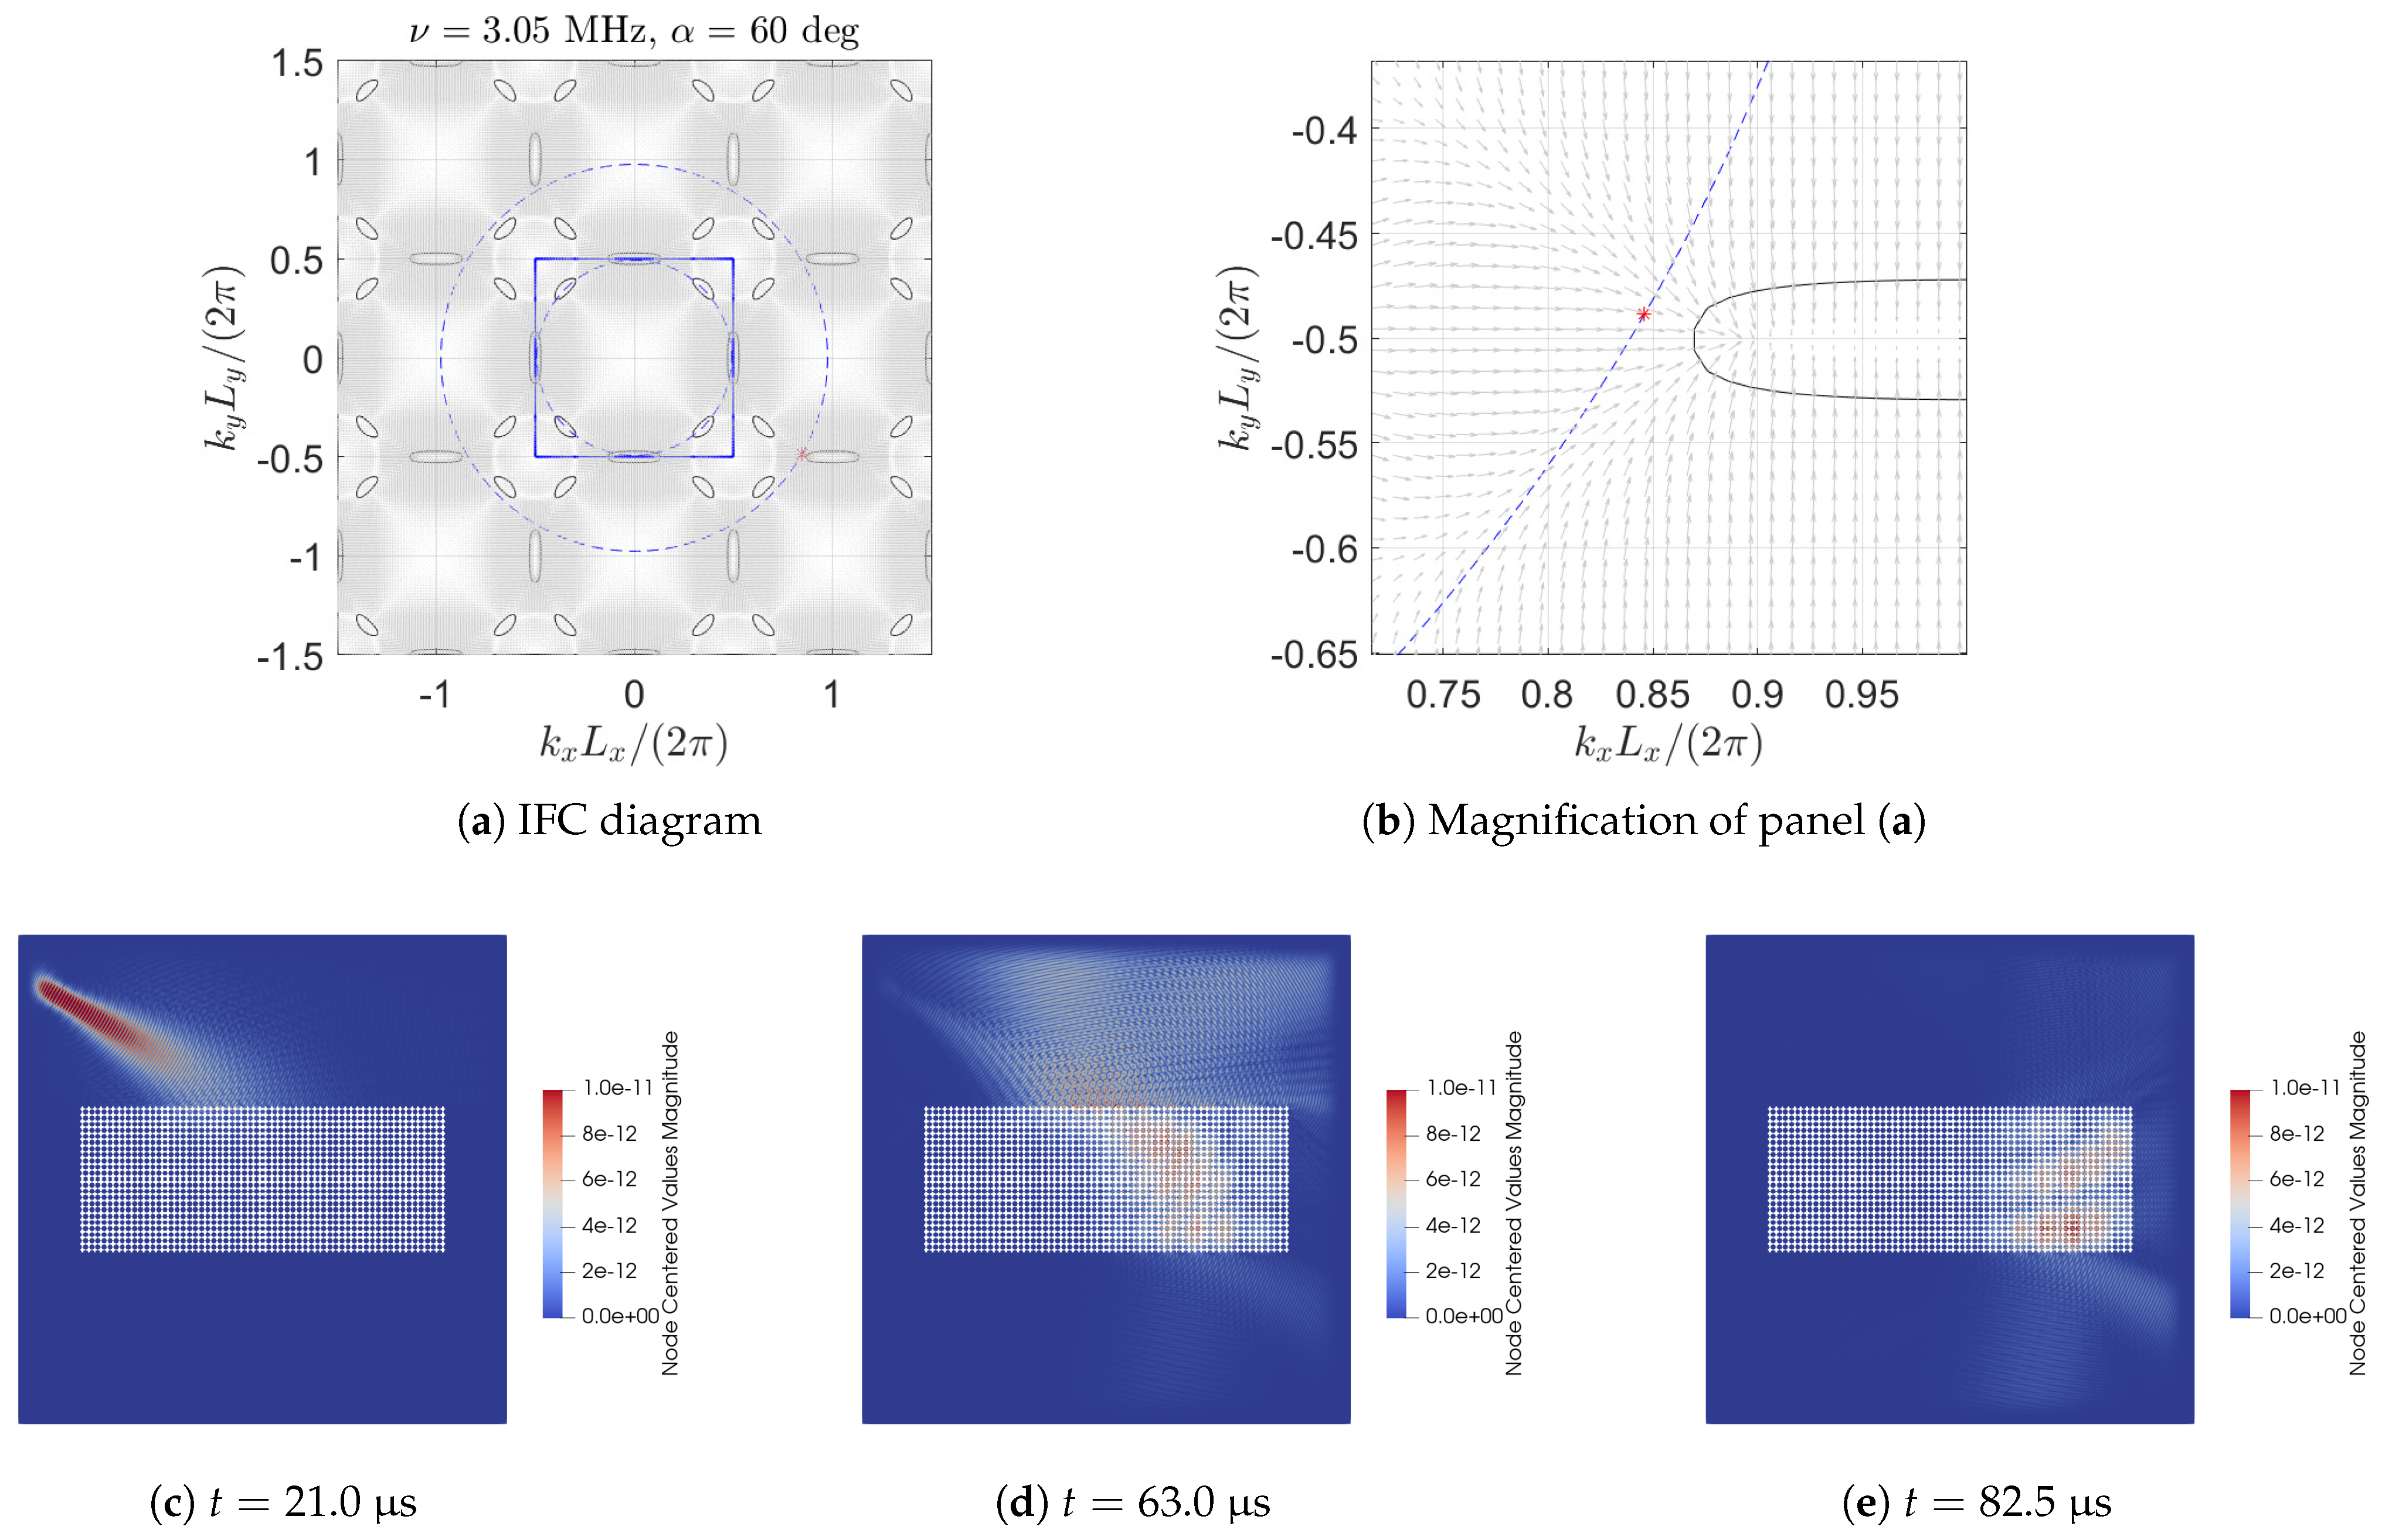
3.1. Negative Refraction and Wave Trapping

A first illustrative example is shown in Figure 5 using several panels to demonstrate and explain negative refraction and wave trapping phenomena. Isofrequency contour (IFC) diagrams are often also referred to as slowness contour diagrams in the literature. However, in this article, the contours are represented in terms of dimensionless wave-number components rather than slowness components (whose dimensions are s/m). In Figure 5a,b, the IFCs of both the interior and exterior media are shown. The black solid lines in Figure 5a represent the IFC of the microstructured medium, whereas the blue dashed lines represent the IFC of plain-strain aluminium (see Equation (2)).
The IFC of the Swiss crosslike hole system is repeated periodically outside of the first Brillouin zone (see the blue square in Figure 5a). In addition to the IFC, which gives information about the phase velocity of the interior and exterior media, we also show the group velocity in the microstructured medium (see the grey arrows), estimated by evaluating the numerical gradient (see Equation (6)), associated with the Bloch–Floquet dispersion surfaces.
Figure 5b is an enlargement of Figure 5a, by which the group velocity distribution can be observed more clearly. It is shown that close to the coincidence point, i.e., at α = 35° and marked with a red asterisk, the group velocity is negative and points in the opposite x-direction, with respect to the group velocity of the shear-dominated incident wave. This situation results in negative refraction at the first interface (i.e., the top row of Swiss-cross holes), which can be seen in the transient FE instantaneous displacement in Figure 5c,d.
Figure 5e shows a time-frame at which the beam emerges from the slab, with approximately the same angle as the angle of incidence but shifted. At approximately three quarters of the transient simulation duration, Figure 5f shows transient localisation of waves, with an accumulation of the displacement field on the left side of the slab. This is consistent with the general group velocity landscape in Figure 5b, where the favoured direction of the group velocity, in the vicinity of the coincident point, is towards the left.

3.2. Partial Cloaking

Figure 6 illustrates an example of partial cloaking for an extended slab (24 × 60 rows). Again, the IFC (see Figure 6a,b) predicts the effective behaviour of the structure to waves impinging at a given angle of incidence and certain centre frequency f = 3.05 MHz. More specifically, in the neighbourhood of the coincidence point for shear waves, the group velocity points in the same direction as the group velocity of the incident wave.
The panels Figure 6c–e display a time evolution of the shear-dominated Gaussian beam. Across all featured time frames, the transmitted beam approximately maintains the incident direction, with limited—yet still clearly visible—refraction and reflection. In this sense, an observer can feel the effect of the original incident beam on the other side of the slab, hence the use of the term “partial cloaking”. There is also evidence of trapped modes within the slab throughout the simulation time window, as shown in Figure 6d,e, which is predicted by the flat dispersion curves in Figure 2a.

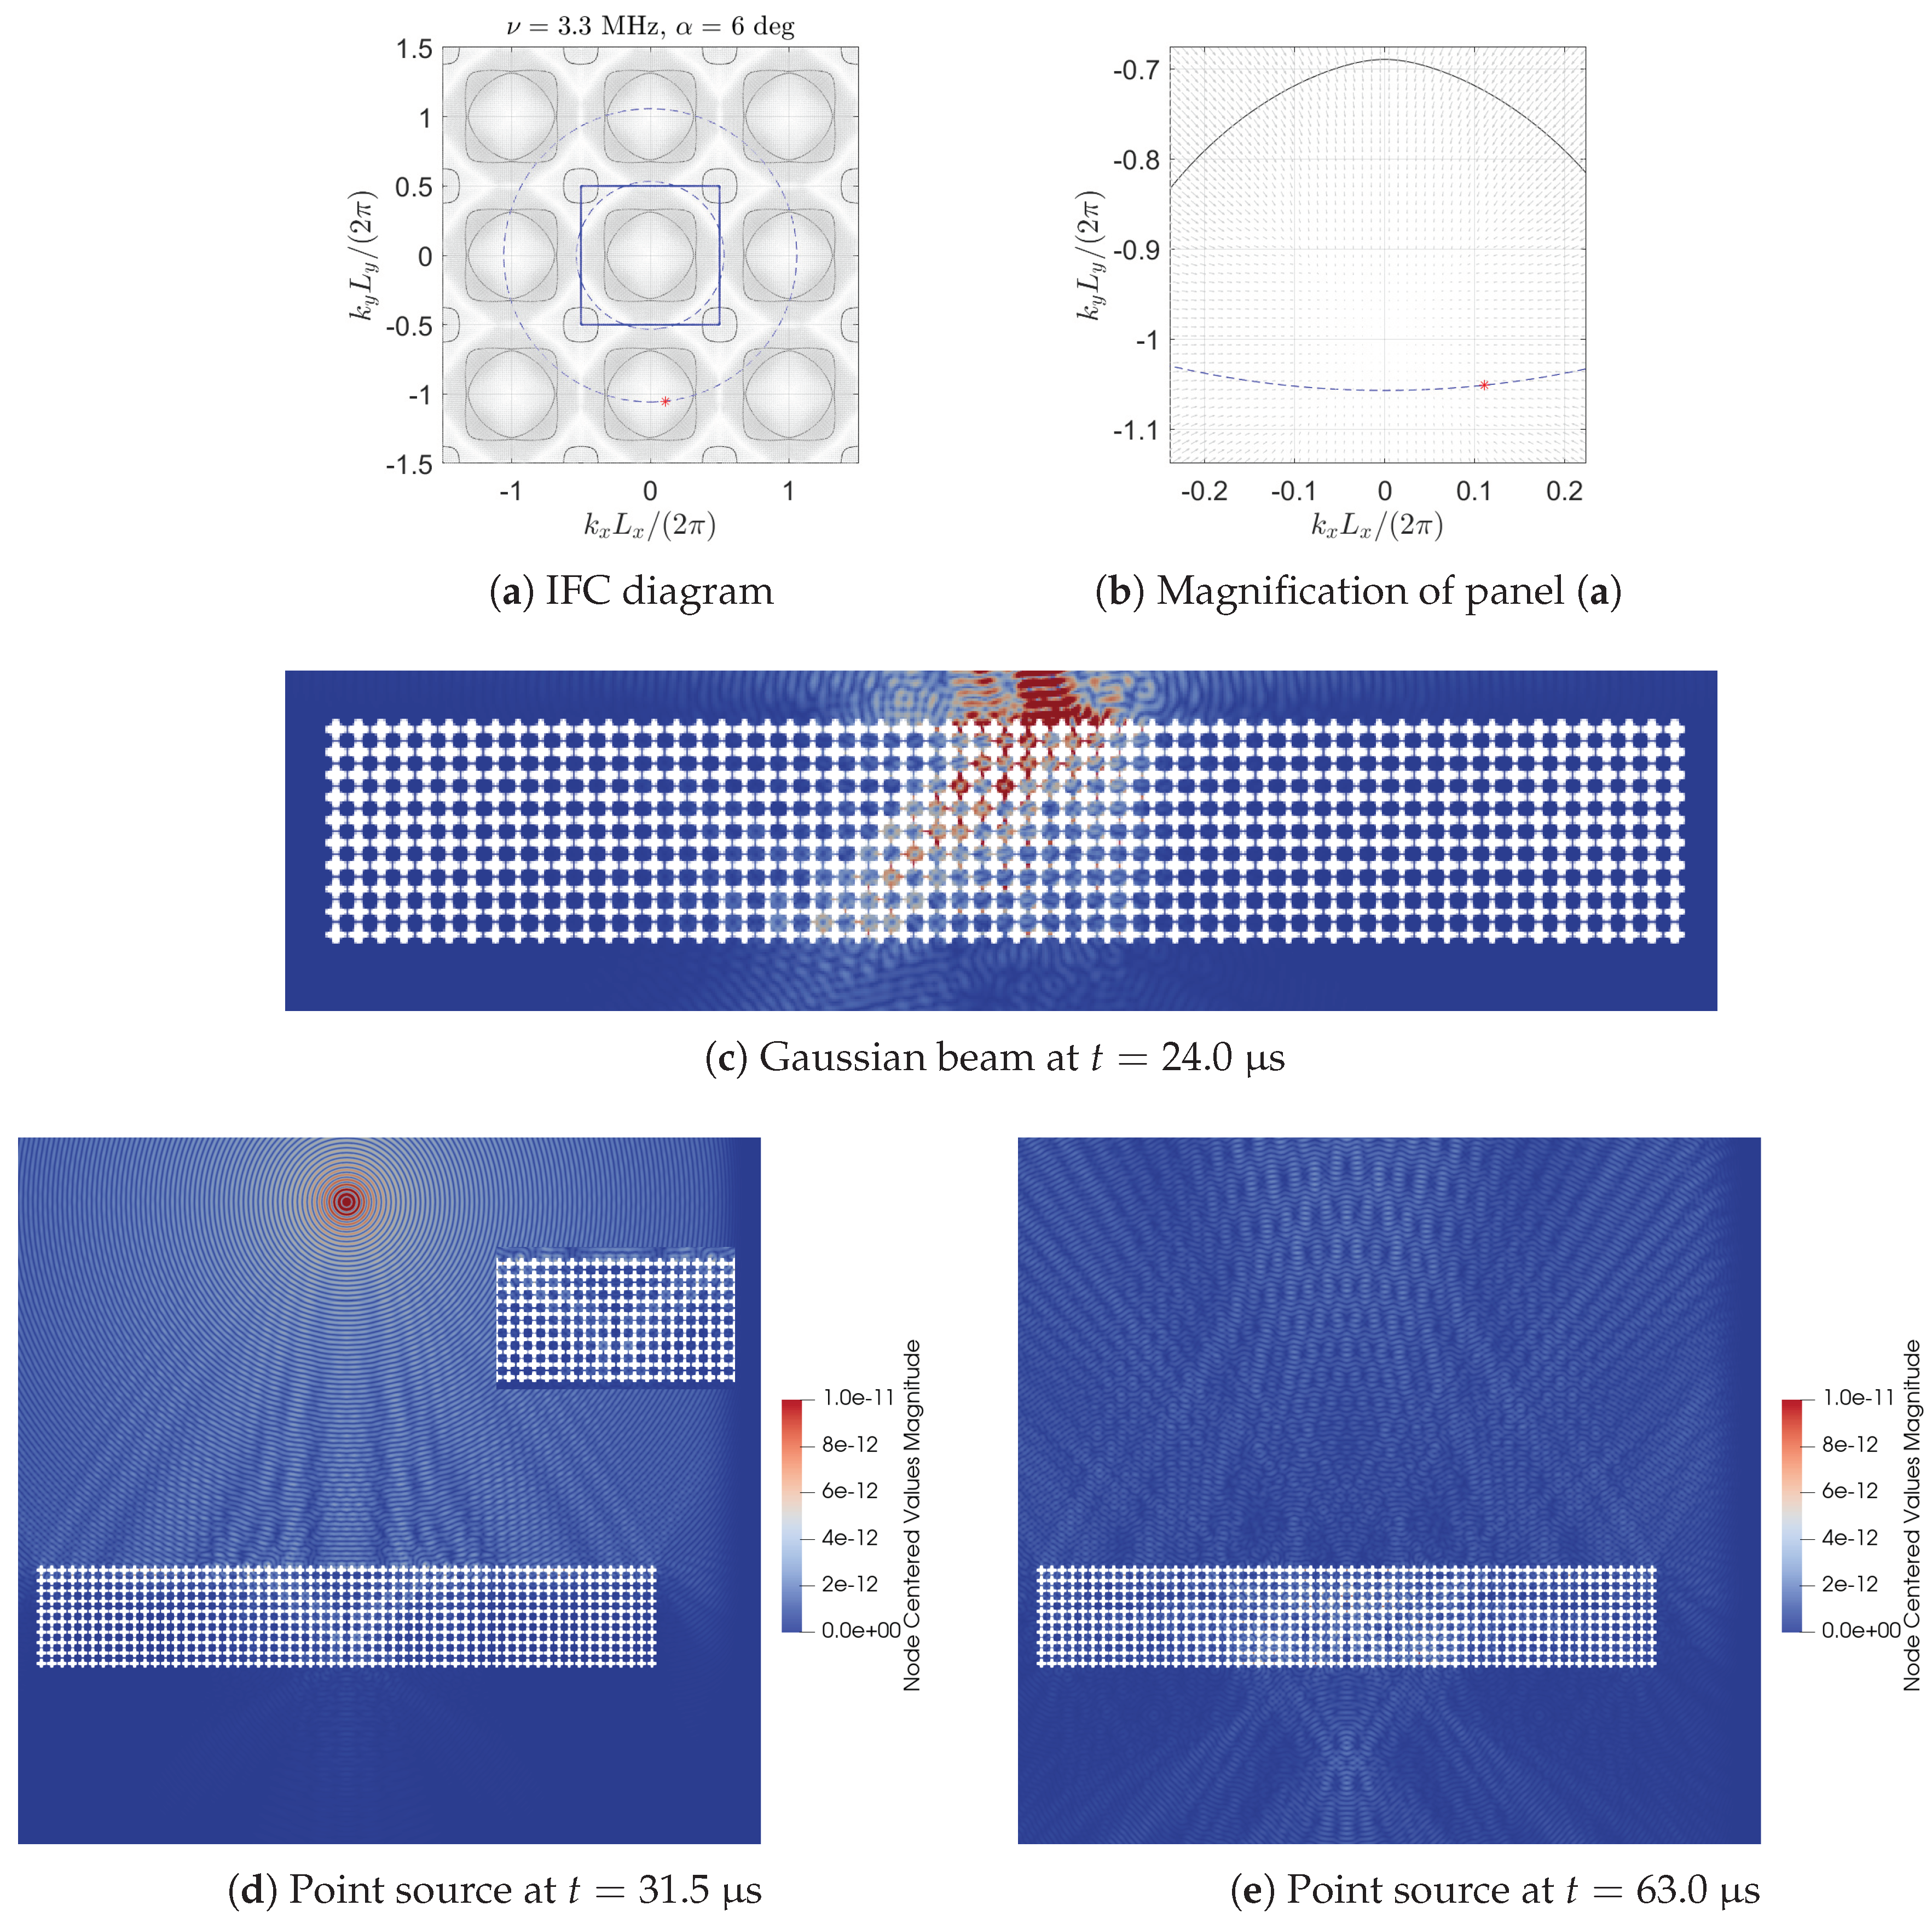
3.3. Focusing and Long Wavelength Envelopes

In Figure 7, we investigate focusing effects of the slab. The dispersive behaviour of the periodic slab at f = 3.3 MHz is exploited, exhibiting negative group velocity across most of the first Brillouin zone. In Figure 7c, the slab is insonified with a Gaussian beam oriented at α = 6° incidence. The instantaneous displacement shows a clear negative refractive behaviour of the incident beam. In Figure 7d,e, a similar behaviour is observed, where an image develops firstly within the interior of the slab (magnified in the inset of Figure 7d) and, at a later time, in the transmission region beyond the slab of metamaterial.
In Figure 8, we show scattering of waves by a rough microstructured slab (described in Section 2.4), and its smooth counterpart, for which a long-wavelength enveloped wave mode phenomenon is observed. Figure 8c,d show the scattering effects at the same time point within the simulations. Apart from a small difference in phase, due to the finer mesh for the rough crosses leading to a smaller time step, the results for the smooth and rough cases are almost indistinguishable. It can clearly be seen that the long-wavelength envelope within the slab is around ten unit cells in length, but is only marginally affected by the roughness. Similarly, the beam refraction at the interface (consistent with the IFC diagrams in Figure 8a,b) is observed for both the smooth and rough crosses. This example of comparing rough and smooth crosses is one of five individual cases that was studied in this work, providing preliminary insights for future investigation of the practical implementation of the Swiss cross-shaped holes metamaterial. These initial results indicate that the wave effects are likely to be unaffected by perturbation from smooth-edged crosses that would result when manufacturing the structures for future experimental validations. However, Monte Carlo analysis over a wide range of roughness and frequencies, similar to previous studies [25], will reveal more comprehensive understanding.

4. Conclusions

The theoretical and numerical modelling of the metamaterial comprising periodically repeated Swiss cross-shaped holes demonstrated exotic wave effects at high frequencies. As well as beam steering and focusing applications, the structures show potential for elastic energy reservoirs. For example, the long-wavelength envelope wave mode in Figure 8 has an extended lifetime, as can be observed by viewing the videos in the supplementary material, for both the smooth and rough crosses considered here. Therefore, slabs of the microstructured material may be used to store elastic energy and possibly release it on demand to act externally on the homogeneous medium or other slabs of microstructured material.
Bloch–Floquet theory and the resulting isofrequency contour diagrams were used to predict trapped waves, negative refraction, and cloaking phenomena. High-fidelity and rapid finite element simulations in the transient regime illustrated these effects. The use of GPU-driven implementation provides a step change in modelling capability, with run-times hundreds of times faster than with standard CPU-driven software, and the capability to investigate models with several hundred million degrees of freedom. This increase in modelling fidelity and efficiency is crucial for future experimental validation and manufacturing, as well as extensions to three-dimensional space.
The study here was broadened with a view to future applications and the manufacturing of metamaterial samples. Additive manufacturing methods, such as selective laser melting, produce parts with remnant surface roughness. The cross-shaped holes were also analysed for cases when the smooth edges were replaced with rough edges (characterised by statistical parameters following Gaussian distributions). The wave effects were shown to be robust, with little difference between smooth and rough cases except for small changes in phase due to the finer domain mesh required for the perturbed case. These preliminary results indicate that the manufacture of the metamaterial, following refined model-informed design for specific wave phenomena, may be expected to be largely unaffected by surface roughness finish. The access to modelling run-times of minutes and hours, compared with days and weeks, enables a much broader range of parameter value analysis. It is envisaged that extensive Monte Carlo studies, covering wide ranges of frequency and roughness parameters, will identify potential manufacturing bounds.

Supplementary Materials

Author Contributions

Conceptualization, D.T. and S.G.H.; methodology, D.T. and S.G.H.; software, D.T. (COMSOL Multiphysics and MATLAB) and S.G.H. (Pogo); formal analysis, D.T.; investigation, D.T and S.G.H; original draft preparation, D.T. and S.G.H. All authors have read and agreed to the published version of the manuscript.

Funding

This research received no external funding.

Institutional Review Board Statement

Not applicable.

Informed Consent Statement

Not applicable.

Data Availability Statement

Videos of all transient simulations referred to in this article are available in the Supplementary Material.

Acknowledgments

DT and SGH acknowledge the support of the University of Liverpool Research Centre in Mathematics and Modelling which provided funds for a research visit of DT to Liverpool in February 2020, during which the concept of this work was conceived.

Conflicts of Interest

The authors declare no conflict of interest.

References

  1. Danila, O.; Manaila-Maximean, D. Bifunctional Metamaterials Using Spatial Phase Gradient Architectures: Generalized Reflection and Refraction Considerations. Materials 2021, 14, 2201. [Google Scholar] [CrossRef] [PubMed]
  2. Misseroni, D.; Colquitt, D.J.; Movchan, A.B.; Movchan, N.V.; Jones, I.S. Cymatics for the cloaking of flexural vibrations in a structured plate. Sci. Rep. 2016, 6, 1–11. [Google Scholar] [CrossRef] [Green Version]
  3. Ma, G.; Sheng, P. Acoustic metamaterials: From local resonances to broad horizons. Sci. Adv. 2016, 2, e1501595. [Google Scholar] [CrossRef] [PubMed] [Green Version]
  4. Li, J.; Chan, C.T. Double-negative acoustic metamaterial. Phys. Rev. E 2004, 70, 055602. [Google Scholar] [CrossRef] [PubMed] [Green Version]
  5. Craster, R.V.; Guenneau, S. Acoustic Metamaterials: Negative Refraction, Imaging, Lensing and Cloaking; Springer Science & Business Media: Berlin/Heidelberg, Germany, 2012; Volume 166. [Google Scholar]
  6. Haslinger, S.G.; Movchan, N.V.; Movchan, A.B.; Jones, I.S.; Craster, R.V. Controlling flexural waves in semi-infinite platonic crystals with resonator-type scatterers. Q. J. Mech. Appl. Math. 2017, 70, 216–247. [Google Scholar] [CrossRef]
  7. Kadic, M.; Bückmann, T.; Schittny, R.; Wegener, M. Metamaterials beyond electromagnetism. Rep. Prog. Phys. 2013, 76, 126501. [Google Scholar] [CrossRef]
  8. McPhedran, R.C.; Movchan, A.B.; Movchan, N.V.; Brun, M.; Smith, M.J.A. ‘Parabolic’ trapped modes and steered Dirac cones in platonic crystals. Proc. R. Soc. A Math. Phys. Eng. Sci. 2015, 471, 20140746. [Google Scholar] [CrossRef] [Green Version]
  9. McPhedran, R.C.; Movchan, A.B.; Movchan, N.V. Platonic crystals: Bloch bands, neutrality and defects. Mech. Mater. 2009, 41, 356–363. [Google Scholar] [CrossRef]
  10. Farhat, M.; Guenneau, S.; Enoch, S. High directivity and confinement of flexural waves through ultra-refraction in thin perforated plates. EPL (Europhys. Lett.) 2010, 91, 54003. [Google Scholar] [CrossRef]
  11. Torrent, D.; Mayou, D.; Sánchez-Dehesa, J. Elastic analog of graphene: Dirac cones and edge states for flexural waves in thin plates. Phys. Rev. B 2013, 87, 115143. [Google Scholar] [CrossRef]
  12. Morvaridi, M.; Carta, G.; Brun, M. Platonic crystal with low-frequency locally-resonant spiral structures: Wave trapping, transmission amplification, shielding and edge waves. J. Mech. Phys. Solids 2018, 121, 496–516. [Google Scholar] [CrossRef] [Green Version]
  13. Chaplain, G.J.; Makwana, M.P.; Craster, R.V. Rayleigh–Bloch, topological edge and interface waves for structured elastic plates. Wave Motion 2019, 86, 162–174. [Google Scholar] [CrossRef] [Green Version]
  14. Makwana, M.P.; Craster, R.V. Geometrically navigating topological plate modes around gentle and sharp bends. Phys. Rev. B 2018, 98, 184105. [Google Scholar] [CrossRef] [Green Version]
  15. Joseph, L.M.; Craster, R.V. Asymptotics for Rayleigh–Bloch Waves along Lattice Line Defects. Multiscale Model. Simul. 2013, 11, 871–889. [Google Scholar] [CrossRef] [Green Version]
  16. Tallarico, D.; Trevisan, A.; Movchan, N.V.; Movchan, A.B. Edge Waves and Localization in Lattices Containing Tilted Resonators. Front. Mater. 2017, 4, 16. [Google Scholar] [CrossRef]
  17. Garau, M.; Nieves, M.; Carta, G.; Brun, M. Transient response of a gyro-elastic structured medium: Unidirectional waveforms and cloaking. Int. J. Eng. Sci. 2019, 143, 115–141. [Google Scholar] [CrossRef]
  18. Miniaci, M.; Marzani, A.; Testoni, N.; De Marchi, L. Complete band gaps in a polyvinyl chloride (PVC) phononic plate with cross-like holes: Numerical design and experimental verification. Ultrasonics 2015, 56, 251–259. [Google Scholar] [CrossRef]
  19. Aivaliotis, A.; Tallarico, D.; d’Agostino, M.V.; Daouadji, A.; Neff, P.; Madeo, A. Frequency-and angle-dependent scattering of a finite-sized meta-structure via the relaxed micromorphic model. Arch. Appl. Mech. 2020, 90, 1073–1096. [Google Scholar] [CrossRef]
  20. Wang, Y.F.; Wang, Y.S. Multiple wide complete bandgaps of two-dimensional phononic crystal slabs with cross-like holes. J. Sound Vib. 2013, 332, 2019–2037. [Google Scholar] [CrossRef]
  21. Neff, P.; Ghiba, I.-D.; Madeo, A.; Placidi, L.; Rosi, G. A unifying perspective: The relaxed linear micromorphic continuum. Contin. Mech. Thermodyn. 2014, 26, 639–681. [Google Scholar] [CrossRef] [Green Version]
  22. Neff, P.; Ghiba, I.D.; Lazar, M.; Madeo, A. The relaxed linear micromorphic continuum: Well-posedness of the static problem and relations to the gauge theory of dislocations. Q. J. Mech. Appl. Math. 2015, 68, 53–84. [Google Scholar] [CrossRef]
  23. Neff, P.; Madeo, A.; Barbagallo, G.; d’Agostino, M.V.; Abreu, R.; Ghiba, I.D. Real wave propagation in the isotropic-relaxed micromorphic model. Proc. R. Soc. A Math. Phys. Eng. Sci. 2017, 473, 20160790. [Google Scholar] [CrossRef]
  24. Huthwaite, P. Accelerated finite element elastodynamic simulations using the GPU. J. Comput. Phys. 2014, 257, 687–707. [Google Scholar] [CrossRef] [Green Version]
  25. Haslinger, S.G.; Lowe, M.J.S.; Huthwaite, P.; Craster, R.V.; Shi, F. Elastic shear wave scattering by randomly rough surfaces. J. Mech. Phys. Solids 2020, 137, 103852. [Google Scholar] [CrossRef]
  26. Huang, M.; Sha, G.; Huthwaite, P.; Rokhlin, S.I.; Lowe, M.J.S. Maximizing the accuracy of finite element simulation of elastic wave propagation in polycrystals. J. Acoust. Soc. Am. 2020, 148, 1890–1910. [Google Scholar] [CrossRef] [PubMed]
  27. Zimmermann, A.A.E.; Huthwaite, P.; Pavlakovic, B. High-resolution thickness maps of corrosion using SH1 guided wave tomography. Proc. R. Soc. A 2021, 477, 20200380. [Google Scholar] [CrossRef]
  28. Boschetto, A.; Bottini, L.; Veniali, F. Roughness modeling of AlSi10Mg parts fabricated by selective laser melting. J. Mater. Process. Technol. 2017, 241, 154–163. [Google Scholar] [CrossRef]
  29. Boschetto, A.; Bottini, L.; Veniali, F. Surface roughness and radiusing of Ti6Al4V selective laser melting-manufactured parts conditioned by barrel finishing. Int. J. Adv. Manuf. Technol. 2018, 94, 2773–2790. [Google Scholar] [CrossRef]
  30. Alfieri, V.; Argenio, P.; Caiazzo, F.; Sergi, V. Reduction of surface roughness by means of laser processing over additive manufacturing metal parts. Materials 2017, 10, 30. [Google Scholar] [CrossRef] [Green Version]
  31. Movchan, A.B.; Movchan, N.V. Mathematical Modelling of Solids with Nonregular Boundaries; CRC Press: Boca Raton, FL, USA, 1995; Volume 3. [Google Scholar]
  32. Joannopoulos, J.D.; Johnson, S.G.; Winn, J.N.; Meade, R.D. Photonic Crystals: Molding the Flow of Light, 2nd ed.; Princeton University Press: Princeton, NJ, USA, 2008. [Google Scholar]
  33. Rajagopal, P.; Drozdz, M.; Skelton, E.A.; Lowe, M.J.S.; Craster, R.V. On the use of absorbing layers to simulate the propagation of elastic waves in unbounded isotropic media using commercially available finite element packages. NDT E Int. 2012, 51, 30–40. [Google Scholar] [CrossRef]
  34. Drozdz, M.B. Efficient Finite Element Modelling of Ultrasound Waves in Elastic Media. Ph.D. Thesis, Imperial College London, London, UK, 2008. [Google Scholar]
  35. Huang, M.; Sha, G.; Huthwaite, P.; Rokhlin, S.I.; Lowe, M.J.S. Longitudinal wave attenuation in polycrystals with elongated grains: 3D numerical and analytical modeling. J. Acoust. Soc. Am. 2021, 149, 2377–2394. [Google Scholar] [CrossRef] [PubMed]
  36. Courant, R.; Friedrichs, K.; Lewy, H. Über die partiellen Differenzengleichungen der mathematischen Physik. Math. Ann. 1928, 100, 32–74. [Google Scholar] [CrossRef]
  37. Ogilvy, J.A. Theory of Wave Scattering from Random Rough Surfaces; CRC Press: Boca Raton, FL, USA, 1991. [Google Scholar]
  38. Ogilvy, J.A. Computer simulation of acoustic wave scattering from rough surfaces. J. Phys. D Appl. Phys. 1988, 21, 260–277. [Google Scholar] [CrossRef]
  39. Carta, G.; Movchan, A.B.; Argani, L.P.; Bursi, O.S. Quasi-periodicity and multi-scale resonators for the reduction of seismic vibrations in fluid-solid systems. Int. J. Eng. Sci. 2016, 109, 216–239. [Google Scholar] [CrossRef] [Green Version]
  40. Carta, G.; Giaccu, G.F.; Brun, M. A phononic band gap model for long bridges. The ‘Brabau’ bridge case. Eng. Struct. 2017, 140, 66–76. [Google Scholar] [CrossRef]
  41. Frecentese, S.; Argani, L.P.; Movchan, A.B.; Movchan, N.V.; Carta, G.; Wall, M.L. Waves and fluid–solid interaction in stented blood vessels. Proc. R. Soc. A Math. Phys. Eng. Sci. 2018, 474, 20170670. [Google Scholar] [CrossRef]
  42. Frecentese, S.; Papathanasiou, T.K.; Movchan, A.B.; Movchan, N.V. Dispersion of waves and transmission–reflection in blood vessels with structured stents. Proc. R. Soc. A 2019, 475, 20180816. [Google Scholar] [CrossRef] [Green Version]
Figure 1. Panel (a) is a schematic representation of a 2 × 2 cluster of unit cells comprising Swiss-cross holes. The black dashed square of side-length L encloses an individual unit cell. Panel (b) shows the first Brillouin zone of the unit cell in panel (a), where the dashed blue lines indicate its irreducible fraction.
Applsci 11 07576 g001
Figure 2. (a) Dispersion diagram of the unit cell in Figure 1a along the irreducible Brillouin zone path XΓMX of Figure 1b. (b) Selected Bloch–Floquet eigenmodes associated with the wave vector located one tenth along the length of the branch ΓM, see Figure 1b, for several frequencies in the range 2.65 MHz to 3.65 MHz. Figures (b1) to (b4) correspond to the frequencies labelled A to D in panel (a).
Applsci 11 07576 g002
Figure 3. (a) Finite element model domain for shear wave Gaussian beam incidence. The angle α is 35° and the slab of metamaterial, sandwiched by homogeneous aluminium media, consists of 600 cross-shaped holes. Absorbing layers of length 8 mm are applied to all sides of the domain. (b) Alternative point-source excitation for shear waves. The weighting applied to each of the six excitation nodes is highlighted by the directions of the arrows.
Applsci 11 07576 g003
Figure 4. (a) Meshed domain in the vicinity of a regular Swiss cross-shaped hole. (b) Mesh in the vicinity of rough cross-shaped holes defined by the roughness parameters δ = 5 μm and λ0 = 5 μm.
Applsci 11 07576 g004
Figure 5. Scattering of a shear-dominated Gaussian beam at centre frequency f = 2.985 MHz and an angle of incidence α = 35°. Panels (a,b) show the IFC diagram (and its magnification); the red asterisk represents the intersection point of the Gaussian beam propagation direction and the isofrequency contours. Panels (cf) show the magnitude of the displacement field at different times in the FE simulation, with the total time being T = 120 μs.
Applsci 11 07576 g005
Figure 6. Scattering of a shear-dominated Gaussian beam at centre frequency f = 3.05 MHz and an angle of incidence α = 60°. Panels (a,b) show the IFC diagram (and its magnification); the red asterisk represents the intersection point of the Gaussian beam propagation direction and the isofrequency contours. Panels (ce) show the magnitude of the displacement field at different times in the FE simulation, with the total time being T = 120 μs.
Applsci 11 07576 g006
Figure 7. Scattering of a shear-dominated Gaussian beam at an angle of incidence α = 6° and a point source at (0, 40mm), both with centre frequency f = 3.3 MHz. Panels (a,b) show the IFC diagram (and its magnification); the red asterisk represents the intersection point of the Gaussian beam propagation direction and the isofrequency contours. Panels (ce) show the magnitude of the displacement field at different times in the FE simulation, with the total time being T = 120 μs. The inset of panel (d) is a magnification of the centre of the slab.
Applsci 11 07576 g007
Figure 8. Effect of roughness on the scattering of a Gaussian beam with α = 35° and f = 2.78 MHz. The roughness is defined by δ = 5 μm and λ0 = 5 μm. Panels (a,b) show the IFC diagram (and its magnification) for smooth crosses. Panels (c,d) show simulation snapshots for the smooth and rough cases at the same time, t = 93 μs, with the total time being T = 120 μs.
Applsci 11 07576 g008
Table 1. Geometric parameters, as in Figure 1a, defining the Swiss-cross holes unit cell.
a [mm]b [mm]c [mm]d [mm]L [mm]
0.10.30.70.91
Publisher’s Note: MDPI stays neutral with regard to jurisdictional claims in published maps and institutional affiliations.

