Article

Development of an Automatic Ultrasound Image Classification System for Pressure Injury Based on Deep Learning

1
Department of Imaging Nursing Science, Graduate School of Medicine, The University of Tokyo, Tokyo 1130033, Japan
2
Imaging Technology Center, Fujifilm Corporation, Tokyo 1070052, Japan
3
Department of Gerontological Nursing/Wound Care Management, Graduate School of Medicine, The University of Tokyo, Tokyo 1130033, Japan
4
Global Nursing Research Center, Graduate School of Medicine, The University of Tokyo, Tokyo 1130033, Japan
5
Division of Ultrasound, Department of Diagnostic Imaging, Tokyo Medical University Hospital, Tokyo 1600023, Japan
6
Department of Plastic, Reconstructive, and Aesthetic Surgery, The University of Tokyo Hospital, Tokyo 1138655, Japan
7
Department of Dermatology, Graduate School of Medicine, The University of Tokyo, Tokyo 1130033, Japan
8
Department of Nursing, The University of Tokyo Hospital, Tokyo 1138655, Japan
*
Author to whom correspondence should be addressed.
Submission received: 22 May 2021 / Revised: 19 August 2021 / Accepted: 23 August 2021 / Published: 25 August 2021
(This article belongs to the Special Issue Innovations in Ultrasound Imaging for Medical Diagnosis)

Abstract

:
The classification of ultrasound (US) findings of pressure injury is important to select the appropriate treatment and care based on the state of the deep tissue, but it depends on the operator’s skill in image interpretation. Therefore, US for pressure injury is a procedure that can only be performed by a limited number of highly trained medical professionals. This study aimed to develop an automatic US image classification system for pressure injury based on deep learning that can be used by non-specialists who do not have a high skill in image interpretation. A total 787 training data were collected at two hospitals in Japan. The US images of pressure injuries were assessed using the deep learning-based classification tool according to the following visual evidence: unclear layer structure, cobblestone-like pattern, cloud-like pattern, and anechoic pattern. Thereafter, accuracy was assessed using two parameters: detection performance, and the value of the intersection over union (IoU) and DICE score. A total of 73 images were analyzed as test data. Of all 73 images with an unclear layer structure, 7 showed a cobblestone-like pattern, 14 showed a cloud-like pattern, and 15 showed an anechoic area. All four US findings showed a detection performance of 71.4–100%, with a mean value of 0.38–0.80 for IoU and 0.51–0.89 for the DICE score. The results show that US findings and deep learning-based classification can be used to detect deep tissue pressure injuries.

1. Introduction

Pressure injuries greatly affect patients’ quality of life [1,2]. Pressure injuries were associated with increased mortality [3,4], and severe pressure injury prolonged the hospital stay or disrupted discharge to home [5,6,7] and increased treatment costs [8]. Therefore, early identification of signs of pressure injury deterioration and providing appropriate treatment and care are required.
Pressure injuries are commonly characterized by skin deterioration, resulting in an open wound. Moreover, as most pressure injuries may be attributed to excessive friction and moisture on the skin surface, some of them often begin as “deep tissue pressure injuries” (DTPIs) that start deep below the skin surface at the bone–muscle interface [9]. DTPIs cause rapid deterioration of the skin. Therefore, in many cases, it is not determined that a patient has a DTPI until it worsens, and early detection, treatment, and care are extremely important.
Recently, various bedside technologies, including ultrasound (US) and subepidermal moisture measurement, have been used for the early detection of DTPIs. Although subepidermal moisture measurement is an extremely simple and useful method for the early detection of DTPIs by assessing skin physiological function [10,11], it cannot actually visualize deep tissues and continuously monitor their morphological condition. Conversely, US is a promising tool that allows noninvasive assessment of deep tissues for the early detection of DTPIs [12,13,14,15,16]. US is often available at the bedside, owing to recent advancements in image quality and portability, and a classification algorithm using US images for pressure injuries has been developed [17]. This algorithm suggests distinguishing the types based on four US findings: unclear layer structure, hypoechoic/anechoic lesions, boundary of hypoechoic/anechoic lesions, and pattern of hypoechoic/anechoic lesions (cloud-like pattern or cobblestone-like pattern). Since US findings can visualize the condition of deep tissue (unclear layer structure: slight edema; cobblestone-like pattern: strong edema; cloud-like pattern: necrotic tissue; anechoic pattern: liquid storage), they allow the selection of adequate wound treatment and care.
However, the classification of US images of pressure injury depends on the operator’s skill in image interpretation, and US for pressure injury is a procedure that can only be performed by a limited number of highly trained medical professionals. It is difficult to distinguish between cobblestone- and cloud-like patterns. The cobblestone-like pattern is a finding indicating severe edema, while the cloud-like pattern is one of the findings of DTPIs that indicates the presence of necrotic tissue [18], which can cause deterioration; therefore, it is necessary to distinguish them accurately. Therefore, the authors devised a support system to automatically classify US images of pressure injuries. Recently, deep learning techniques, commonly known as artificial intelligence (AI) functions or techniques, have been employed to automatically identify the wound area [19]. Although some studies have used machine learning to classify US images of the skin and soft tissue [20,21,22,23,24], no study has focused on US findings of pressure injuries or wound sites.
Therefore, this study aimed to develop an automatic US image classification system for pressure injury based on deep learning. This system enables the assessment of DTPIs using US by non-specialists who do not have a high skill in image interpretation. As a first step, the development was carried out using a deep learning-based segmentation method based on a U-Net convolutional neural network to extract ultrasound findings from ultrasound images. The evaluation was performed by calculating the detection rate of the new system against expert annotations.

2. Materials and Methods

This study was conducted through the following steps: data collection at the hospital, interpretation of ultrasound findings, annotation of the finding area, dataset creation (training/validation/test), postprocessing and organization, and discussion of evaluation results.

2.1. Development of the Deep Learning-Based Classification System

2.1.1. U-Net

Deep learning is a powerful machine learning technique that can approximate complicated mapping of the input/output space without special preprocessing. A convolutional neural network (CNN) is a deep learning model that is commonly used in the field of image recognition. A CNN determines the best performance in various tasks, such as object detection and semantic segmentation [25]. U-Net [26] is a typical semantic segmentation method based on a CNN that consists of an encoder that extracts the image feature and a decoder that estimates the label map from the extracted feature. In DTPI evaluation, we used a U-Net to segment areas of US images. Considering the data shortage, we used a CNN-based architecture of ResNeXt-50 pretrained by general images as the encoder [27], while the decoder consisted of U-Net, as introduced in the study. ResNeXt-50 was selected because of its relatively small model size and accuracy. Additionally, we selected it because it has already been used in other segmentation tasks and is easy to use with distributed pretrained models.

2.1.2. Training Datasets

Training in machine learning is the step of providing example data with answers (labels) to a machine learning algorithm system. The training data were collected by a nursing researcher with at least 8 and 3 years of experience in ultrasound and ultrasound of pressure injuries, respectively, at a university hospital and long-term care hospital in Japan from November 2018 to December 2019. Participants included patients who were referred to the interdisciplinary pressure injury teams. The inclusion criteria were as follows: pressure injuries at any stage, that is, stage d1 to D5 or DU (unstageable) pressure injuries according to the DESIGN-R® scoring system [27,28]. The nursing researcher plotted US images as the training data. The training data were labeled under the supervision of an expert ultrasonographer with more than 20 years of clinical experience in detecting unclear layer structures, cobblestone-like patterns (reflecting strong edema), cloud-like patterns (reflecting suspected necrotic tissue), and anechoic patterns (reflecting liquid storage). The total number of data was 787. Figure 1 shows examples of the annotation in the training data.

2.1.3. Implementation

Input US images were resized to 512 × 384 pixels and randomly subjected to brightness change, contrast change, sharpness change, horizontal flip, and erasing. The original image size was 800 horizontal × 600 vertical, and 600/800 = 0.75. While maintaining the aspect ratio of the image, we adopted a value that is divisible when the image output is in a smaller size through the pooling layer in the model during training. We adopted 512 × 384 because there are some images that would be crushed and lost in the findings if the image size were reduced any further. We used an Adam optimizer for 100 epochs, and the learning rate was initialized to 1 × 10⁻⁵. Our source codes were written based on Keras, and our experiments were run on a single NVIDIA GTX 1080 Ti.

2.2. Evaluation of the Deep Learning-Based Classification System

2.2.1. Patients and Settings

Test data collection was conducted at a university hospital and a long-term care facility in Japan from November 2018 to December 2019. This test data dataset was collected from different participants than those present in the training set. The inclusion criteria were the same as those for the training data. The data were randomly divided by the researchers into training and test data.

2.2.2. US Technique

US images were collected by a single researcher using a portable US system with a 5–18 MHz probe (Noblus, Hitachi Aloka Medical, Ltd., Mitaka City, Tokyo, Japan), which provides a reasonable resolution for an image 20–30 mm below the skin surface. US was conducted at a frequency of 18 MHz. To prevent infection, the probe was covered with a disposable plastic wrapper and used for scanning. The gain during US was adjusted to the optimal level for each case. The focal point was set at the depth of the subcutaneous tissue according to the soft tissue thickness. During US, videos were obtained with the probe in the transverse and longitudinal directions. In either case, the probe was moved from the healthy portion to the pressure injury portion through the periwound skin.

2.2.3. Application of the Deep Learning-Based Classification System

All US images were processed by our developed tool. US images of the pressure injuries were classified based on the findings of DTPI in previous studies [17]. Unclear layer structures are shown in white, cobblestone-like patterns in yellow, cloud-like patterns in red, and anechoic patterns in purple.

2.2.4. Data Analysis

Initially, the US images of pressure injuries were assessed using the deep learning-based classification tool according to the following visual evidence: (a) unclear layer structure (representing slight edema), (b) cobblestone-like pattern (representing strong edema), (c) cloud-like pattern (representing suspected necrotic tissue), and (d) anechoic pattern (representing liquid storage). Subsequently, accuracy was assessed using two parameters that were calculated in each classification. First, the value of the intersection over union (IoU) was calculated, which is the area value of the common area between the correct region and the region identified by AI, divided by the area value of the sum of the two regions (Figure 2). The mean values of IoU and the DICE score were also calculated:
IoU = Area of Overlap/Area of Union
DICE score = Area of Overlap/Total area of Ground truth and AI result
Second, the detection performance (%) was calculated. We considered a detection to be “successful” if the detection rate was >0.5.
Detection rate = Area of Overlap/Area of Ground truth
The percentage of successful detections was calculated as the detection performance in each classification.

3. Results

A total of 73 images from five patients (three patients with d1 pressure injuries, one patient with d2, and one patient with D5) were analyzed as test data. Of all 73 images with an unclear layer structure, 7 showed a cobblestone-like pattern, 14 showed a cloud-like pattern, and 15 showed an anechoic area. Table 1 presents the results of the test for each US finding. All four US findings showed a detection performance of 71.4–100%, with a mean value of 0.38–0.80 for IoU and 0.51–0.89 for the DICE score. Figure 3 shows examples of successful results of automatic classification based on deep learning. Figure 4 shows examples of failed results of automatic classification based on deep learning.

4. Discussion

To the best of our knowledge, this study is the first to report on the development of a deep learning-based classification system that can detect change in the deep tissue in pressure injuries and distinguish between the types of US findings. Although real-time burn classification using ultrasound images in ex vivo porcine skin tissue has been presented previously [28], a real-time approach for the classification of ultrasound images on actual human wound sites has not been developed to date. Moreover, to date, the classification of US images of pressure injury depends on the operator’s skill in image interpretation, and US for pressure injury is a procedure that can only be performed by a limited number of highly trained medical professionals. However, in the future, this technology could allow non-specialist medical professionals to easily determine deep tissue conditions.
Our results show an overall high detection performance and overall high values of the IoU and DICE score, indicating that the classification of US images of pressure injuries by deep learning may be applicable in clinical practice. Conversely, the values of the IoU of the cobblestone- and cloud-like patterns were slightly lower compared to those in previous studies [29,30]. One of the reasons for this is that these two patterns are similar, and as shown in Figure 4, they are often misjudged. Moreover, hyperechoic findings of the bone were sometimes incorrectly detected as a cloud-like pattern, as shown in Figure 4. Clinically, high detection performance is a higher priority than the IoU in determining findings of DTPI, meaning low values of the IoU may be ignored. However, care should be taken because misjudgment of the cobblestone- and cloud-like patterns may lead to the selection of completely different treatment methods [17]. To improve the accuracy, more data should be collected and validated in the future.
This technology has the potential to enable point-of-care US (POCUS) for the treatment of pressure injuries at the bedside. Although the application is currently available on a desktop computer, it is expected that a handheld US device with AI-assisted functions will be developed in the near future. Since present and previous studies have used relatively high-quality equipment [17], image quality will be the key to making it possible in a handheld US device.
This study has several limitations. The first is the small number of subjects. It should be validated in more subjects in the future, especially with additional US images of the cobblestone- and cloud-like patterns. Conversely, further validation should be conducted with handheld US devices for POCUS purposes in the future. Second, this is limited to data obtained from thin older adult patients in Japan. To apply this to actual patients with DTPI, it would be necessary to collect data from patients with larger body sizes. Third, this study only evaluated a single point in the US images of pressure injuries. Therefore, it is unclear whether this automated US image classification system can be used to predict the deterioration of pressure injuries. In the future, it will be necessary to use this system to continuously observe how the US finding of pressure injury changes from the early stage. Finally, this study is in the initial step of developing an automatic ultrasound image classification system. Therefore, comparisons with other state-of-the-art approaches used in this field have not been conducted. Future studies need to compare our approach with methods such as vanilla U-Net, nnUNet, and classical (non-deep learning) techniques.

5. Conclusions

The results of this study show that US findings and deep learning-based classification can detect pressure injuries and distinguish between the types of DTPIs. To comprehensively assess pressure injuries with US deep learning-based classification, future studies should be conducted with a large number of participants.

Author Contributions

Conceptualization, M.M., G.N. and H.S.; methodology, M.M., M.K. (Mikihiko Karube), G.N. and H.S.; software, M.K.(Mikihiko Karube); validation, M.M. and M.K (Mikihiko Karube).; formal analysis, M.K. (Mikihiko Karube); investigation, M.M. and A.K. (Atsuo Kawamoto); resources, G.N., A.K. (Aya Kitamura), M.K. (Masakazu Kurita), T.M., C.H., A.K. (Akiko Kawasaki) and H.S.; data curation, G.N., A.K. (Aya Kitamura), M.K. (Masakazu Kurita), T.M., C.H. and A.K. (Akiko Kawasaki); writing—original draft preparation, M.M.; writing—review and editing, G.N., A.K. (Aya Kitamura), N.T. and Y.M.; visualization, M.M. and M.K. (Mikihiko Karube); supervision, H.S.; project administration, N.T.; funding acquisition, M.M. and H.S. All authors have read and agreed to the published version of the manuscript.

Funding

This study was partly supported by JSPS KAKENHI Grant Number 18K17427 (Grant-in-Aid for Young Scientists for M.M.) and 16H02694 (Grant-in-Aid for Scientific Research A).

Institutional Review Board Statement

This study was approved by the Research Ethics Committee of the University of Tokyo (No.3757-(8), 11591-(3), and 2020301NI) and conducted in accordance with the 1975 Declaration of Helsinki.

Informed Consent Statement

In the use of the data obtained from usual medical practice, all participants were given the opportunity to opt out by e-mail and on the website concerning the use of their data.

Acknowledgments

The authors are deeply grateful to the study participants, sonographers, and all of those who greatly contributed to this study.

Conflicts of Interest

Masaru Matsumoto, Mikihiko Karube, Nao Tamai, and Yuka Miura belong to a social collaboration department that receives funding from Fujifilm Corporation. The other authors have disclosed no conflicts of interest.

References

  1. Franks, P.J.; Winterberg, H.; Moffatt, C.J. Health-related quality of life and pressure ulceration assessment in patients treated in the community. Wound Repair Regen. 2002, 10, 133–140. [Google Scholar] [CrossRef] [PubMed]
  2. Gorecki, C.; Brown, J.M.; Nelson, E.A.; Briggs, M.; Schoonhoven, L.; Dealey, C.; Defloor, T.; Nixon, J. Impact of pressure ulcers on quality of life in older patients: A systematic review. J. Am. Geriatr. Soc. 2009, 57, 1175–1183. [Google Scholar] [CrossRef] [PubMed]
  3. Jaul, E.; Calderon-Margalit, R. Systemic factors and mortality in elderly patients with pressure ulcers. Int. Wound J. 2015, 12, 254–259. [Google Scholar] [CrossRef] [PubMed]
  4. Leijon, S.; Bergh, I.; Terstappen, K. Pressure ulcer prevalence, use of preventive measures, and mortality risk in an acute care population: A quality improvement project. JWOCN 2013, 40, 469–474. [Google Scholar] [CrossRef] [PubMed]
  5. Chacon, J.M.F.; Blanes, L.; Borba, L.G.; Rocha, L.R.M.; Ferreira, L.M. Direct variable cost of the topical treatment of stages III and IV pressure injuries incurred in a public university hospital. J. Tissue Viability 2017, 26, 108–112. [Google Scholar] [CrossRef] [PubMed]
  6. Nakagami, G.; Sanada, H.; Iizaka, S.; Kadono, T.; Higashino, T.; Koyanagi, H.; Haga, N. Predicting delayed pressure ulcer healing using thermography: A prospective cohort study. J. Wound Care 2010, 19, 465–466, 468, 470. [Google Scholar] [CrossRef] [PubMed]
  7. Vetrano, D.L.; Landi, F.; De Buyser, S.L.; Carfì, A.; Zuccalà, G.; Petrovic, M.; Volpato, S.; Cherubini, A.; Corsonello, A.; Bernabei, R.; et al. Predictors of length of hospital stay among older adults admitted to acute care wards: A multicentre observational study. Eur. J. Intern. Med. 2014, 25, 56–62. [Google Scholar] [CrossRef] [PubMed]
  8. Brem, H.; Maggi, J.; Nierman, D.; Rolnitzky, L.; Bell, D.; Rennert, R.; Golinko, M.; Yan, A.; Lyder, C.; Vladeck, B. High cost of stage IV pressure ulcers. Am. J. Surg. 2010, 200, 473–477. [Google Scholar] [CrossRef] [PubMed] [Green Version]
  9. Bouten, C.V.; Oomens, C.W.; Baaijens, F.P.; Bader, D.L. The etiology of pressure ulcers: Skin deep or muscle bound? Arch. Phys. Med. Rehabil. 2003, 84, 616–619. [Google Scholar] [CrossRef] [PubMed]
  10. Scafide, K.N.; Narayan, M.C.; Arundel, L. Bedside technologies to enhance the early detection of pressure injuries: A systematic review. JWOCN 2020, 47, 128–136. [Google Scholar] [CrossRef] [PubMed]
  11. Oliveira, A.L.; Moore, Z.; O’Connor, T.; Patton, D. Accuracy of ultrasound, thermography and subepidermal moisture in predicting pressure ulcers: A systematic review. J. Wound Care 2017, 26, 199–215. [Google Scholar] [CrossRef] [Green Version]
  12. Aoi, N.; Yoshimura, K.; Kadono, T.; Nakagami, G.; Iizaka, S.; Higashino, T.; Araki, J.; Koshima, I.; Sanada, H. Ultrasound assessment of deep tissue injury in pressure ulcers: Possible prediction of pressure ulcer progression. Plast. Reconstr. Surg. 2009, 124, 540–550. [Google Scholar] [CrossRef] [Green Version]
  13. Higashino, T.; Nakagami, G.; Kadono, T.; Ogawa, Y.; Iizaka, S.; Koyanagi, H.; Sasaki, S.; Haga, N.; Sanada, H. Combination of thermographic and ultrasonographic assessments for early detection of deep tissue injury. Int. Wound J. 2014, 11, 509–516. [Google Scholar] [CrossRef]
  14. Shimizu, Y.; Mutsuzaki, H.; Tachibana, K.; Tsunoda, K.; Hotta, K.; Fukaya, T.; Ikeda, E.; Yamazaki, M.; Wadano, Y. A survey of deep tissue injury in elite female wheelchair basketball players. J. Back Musculoskelet. Rehabil. 2017, 30, 427–434. [Google Scholar] [CrossRef]
  15. Swaine, J.M.; Breidahl, W.; Bader, D.L.; Oomens, C.W.J.; O’Loughlin, E.; Santamaria, N.; Stacey, M.C. Ultrasonography detects deep tissue injuries in the subcutaneous layers of the buttocks following spinal cord injury. Top. Spinal Cord Injury Rehabil. 2018, 24, 371–378. [Google Scholar] [CrossRef] [Green Version]
  16. Yabunaka, K.; Nakagami, G.; Miyagaki, T.; Sasaki, S.; Hayashi, C.; Sanada, H. Color Doppler ultrasonography to evaluate hypoechoic areas in pressure ulcers: A report of two cases. J. Med. Ultrasound 2018, 26, 163–165. [Google Scholar] [CrossRef] [PubMed]
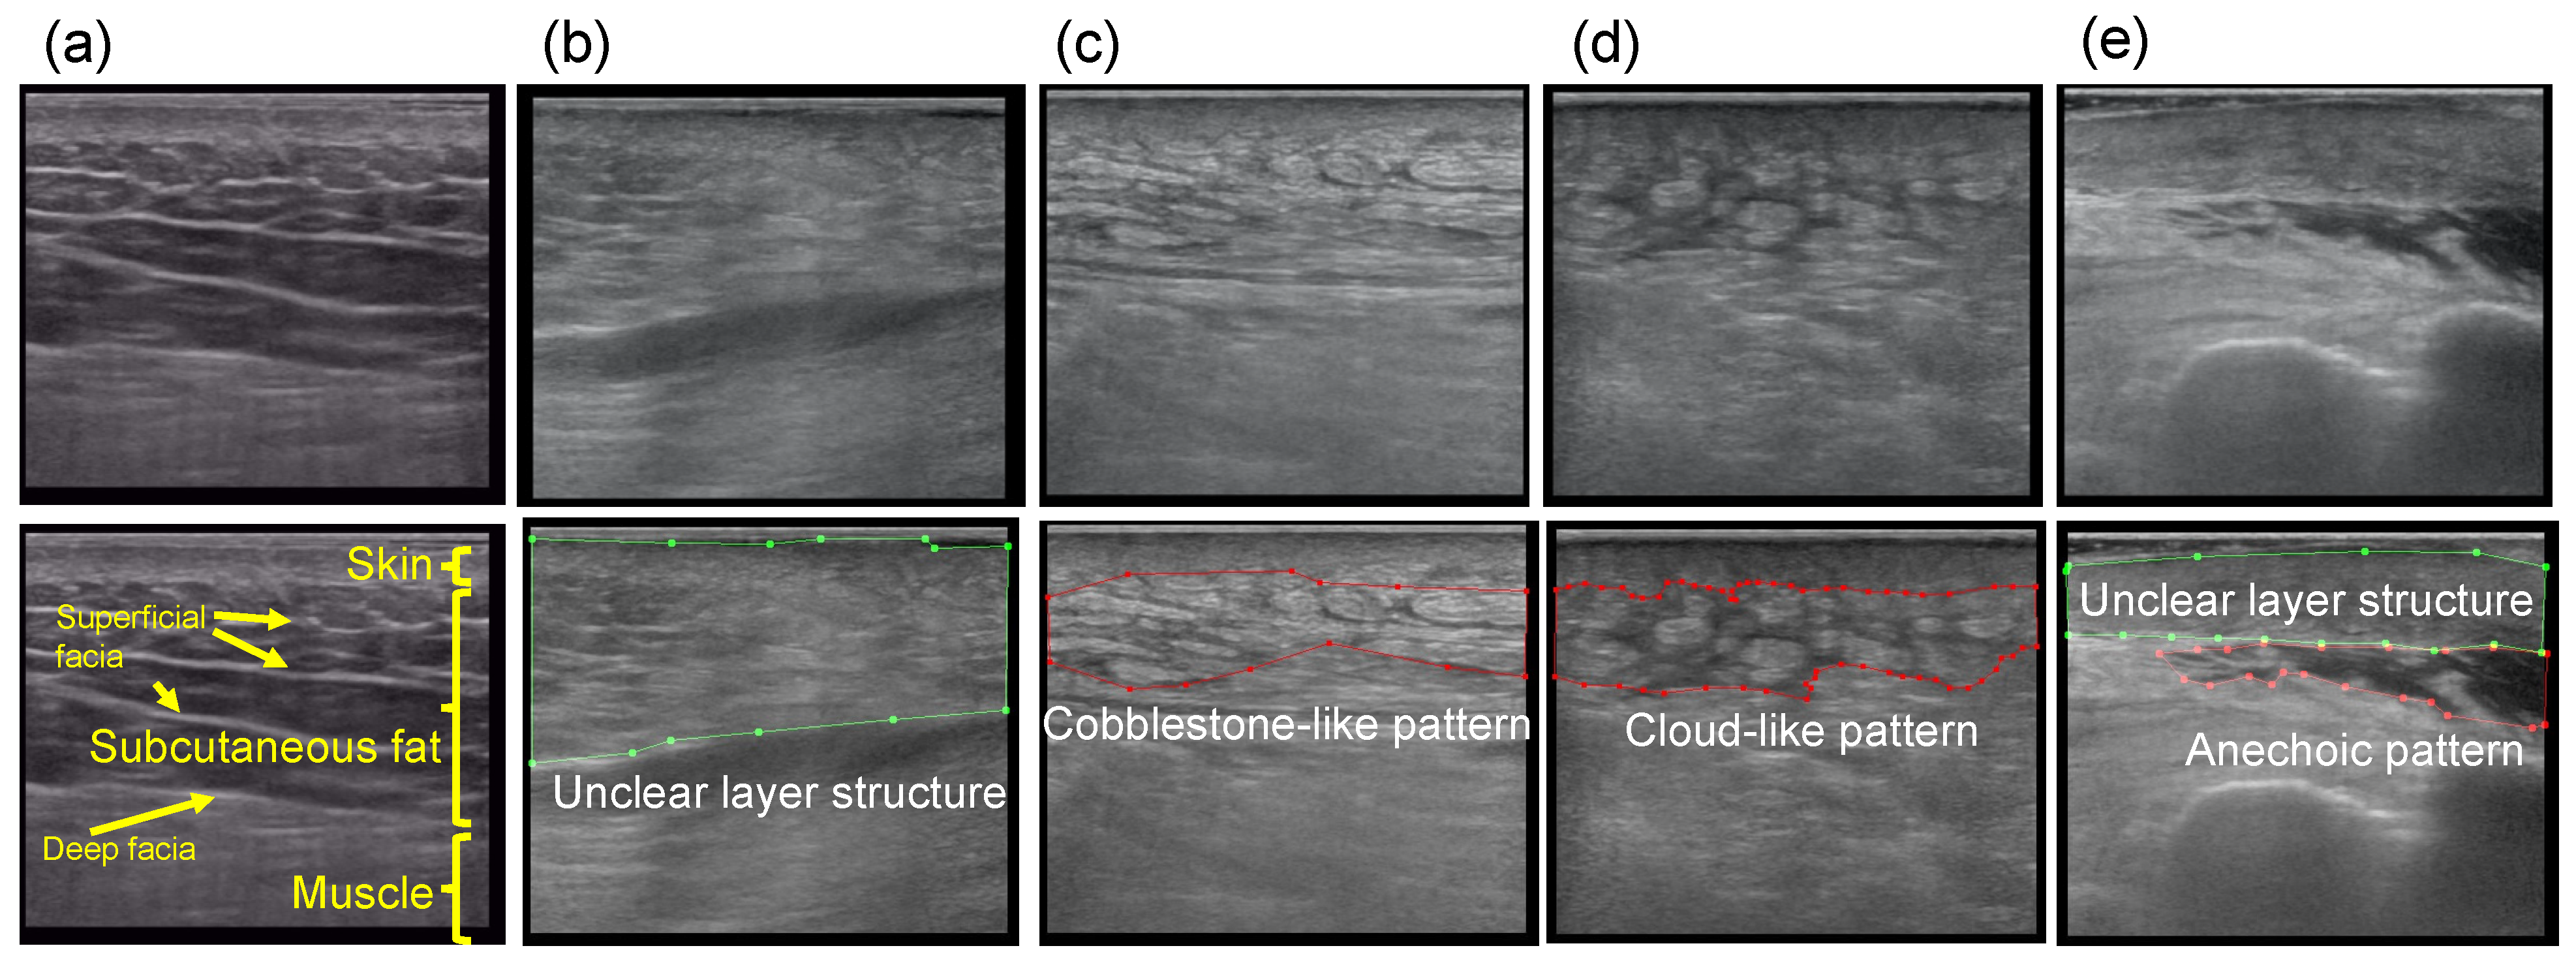
  17. Matsumoto, M.; Nakagami, G.; Kitamura, A.; Kurita, M.; Suga, H.; Miyake, T.; Kawamoto, A.; Sanada, H. Ultrasound assessment of deep tissue on the wound bed and periwound skin: A classification system using ultrasound images. J. Tissue Viability 2021, 30, 28–35. [Google Scholar] [CrossRef]
  18. Ueta, M.; Sugama, J.; Konya, C.; Matsuo, J.; Matsumoto, M.; Yabunaka, K.; Nakatani, T.; Tabata, K. Use of ultrasound in assessment of necrotic tissue in pressure ulcers with adjacent undermining. J. Wound Care 2011, 20, 503–504, 506, 508, passim. [Google Scholar] [CrossRef] [PubMed]
  19. Zahia, S.; Garcia Zapirain, M.B.; Sevillano, X.; González, A.; Kim, P.J.; Elmaghraby, A. Pressure injury image analysis with machine learning techniques: A systematic review on previous and possible future methods. Artif. Intell. Med. 2020, 102, 101742. [Google Scholar] [CrossRef]
  20. Xu, Y.; Wang, Y.; Yuan, J.; Cheng, Q.; Wang, X.; Carson, P.L. Medical breast ultrasound image segmentation by machine learning. Ultrasonics 2019, 91, 1–9. [Google Scholar] [CrossRef] [PubMed]
  21. Mielnik, P.; Fojcik, M.; Segen, J.; Kulbacki, M. A novel method of synovitis stratification in ultrasound using machine learning algorithms: Results from clinical validation of the MEDUSA project. Ultrasound Med. Biol. 2018, 44, 489–494. [Google Scholar] [CrossRef]
  22. Kise, Y.; Shimizu, M.; Ikeda, H.; Fujii, T.; Kuwada, C.; Nishiyama, M.; Funakoshi, T.; Ariji, Y.; Fujita, H.; Katsumata, A.; et al. Usefulness of a deep learning system for diagnosing Sjögren’s syndrome using ultrasonography images. Dentomaxillofac. Radiol. 2020, 49, 20190348. [Google Scholar] [CrossRef]
  23. Burlina, P.; Billings, S.; Joshi, N.; Albayda, J. Automated diagnosis of myositis from muscle ultrasound: Exploring the use of machine learning and deep learning methods. PLoS ONE 2017, 12, e0184059. [Google Scholar] [CrossRef]
  24. Antico, M.; Sasazawa, F.; Dunnhofer, M.; Camps, S.M.; Jaiprakash, A.T.; Pandey, A.K.; Crawford, R.; Carneiro, G.; Fontanarosa, D. Deep learning-based femoral cartilage automatic segmentation in ultrasound imaging for guidance in robotic knee arthroscopy. Ultrasound Med. Biol. 2020, 46, 422–435. [Google Scholar] [CrossRef]
  25. Russakovsky, O.; Deng, J.; Su, H.; Krause, J.; Satheesh, S.; Ma, S.; Huang, Z.; Karpathy, A.; Khosla, A.; Bernstein, M.; et al. ImageNet large scale visual recognition challenge. Int. J. Comput. Vis. 2015, 115, 211–252. [Google Scholar] [CrossRef] [Green Version]
  26. Ronneberger, O.; Fischer, P.; Brox, T. U-Net: Convolutional networks for biomedical image segmentation. In Proceedings of the Medical Image Computing and Computer-Assisted Intervention—MICCAI 2015, Munich, Germany, 5–9 October 2015; pp. 234–241. [Google Scholar]
  27. Xie, S.; Girshick, R.; Dollár, P.; Tu, Z.; He, K. Aggregated residual transformations for deep neural networks. In Proceedings of the 2017 IEEE Conference on Computer Vision and Pattern Recognition (CVPR), Honolulu, HI, USA, 21–26 July 2017; pp. 5987–5995. [Google Scholar]
  28. Lee, S.; Rahul; Ye, H.; Chittajallu, D.; Kruger, U.; Boyko, T.; Lukan, J.K.; Enquobahrie, A.; Norfleet, J.; De, S. Real-time burn classification using ultrasound imaging. Sci. Rep. 2020, 10, 5829. [Google Scholar] [CrossRef] [Green Version]
  29. Huang, C.; Zhou, Y.; Tan, W.; Qiu, Z.; Zhou, H.; Song, Y.; Zhao, Y.; Gao, S. Applying deep learning in recognizing the femoral nerve block region on ultrasound images. Ann. Transl. Med. 2019, 7, 453. [Google Scholar] [CrossRef]
  30. Vukicevic, A.M.; Radovic, M.; Zabotti, A.; Milic, V.; Hocevar, A.; Callegher, S.Z.; De Lucia, O.; De Vita, S.; Filipovic, N. Deep learning segmentation of Primary Sjögren’s syndrome affected salivary glands from ultrasonography images. Comput. Biol. Med. 2021, 129, 104154. [Google Scholar] [CrossRef]
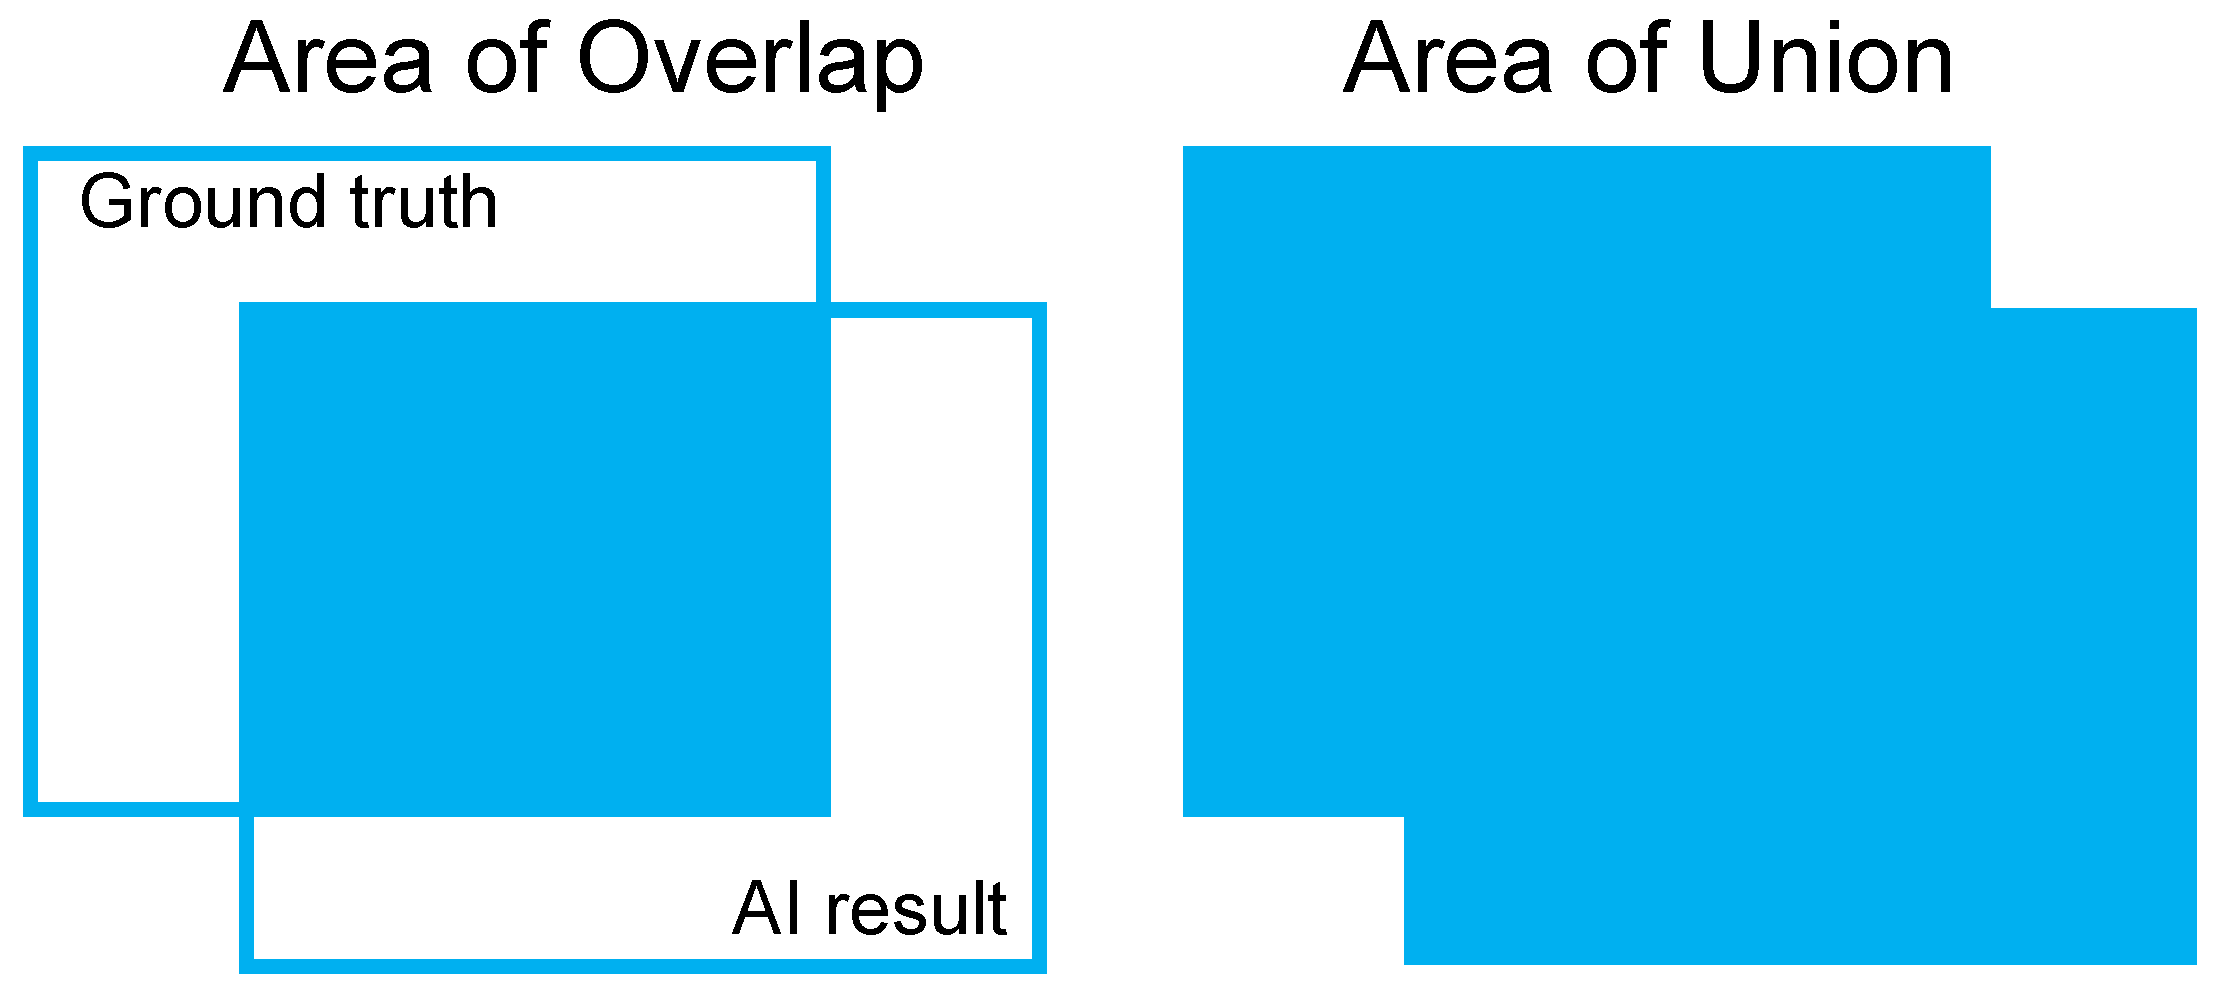
Figure 1. Examples of annotation in training data. (a) Normal and clear layer structure (excluded in the training data). (b) Unclear layer structure. (c) Cobblestone-like pattern. (d) Cloud-like pattern. (e) Anechoic pattern. The top images show the original image, and the bottom images show the annotated image. The polygons in the bottom images show the regions manually extracted by the expert.
Applsci 11 07817 g001
Figure 2. Area of overlap and union between the ground truth and AI result. Area of overlap indicates the common part of the area of the ground truth and AI result; area of union indicates the union set of the area of the ground truth and AI result.
Applsci 11 07817 g002
Figure 3. Examples of successful results of automatic classification based on deep learning. (a) Unclear layer structure. (b) Cobblestone-like pattern. (c) Cloud-like pattern. (d) Anechoic pattern. The “ground-truth” images show the regions that were manually annotated by the expert. The “deep-learning” images show the regions extracted as a result of automatic classification. White indicates an unclear layer structure, yellow indicates a cobblestone-like pattern image, red indicates a cloud-like pattern image, and purple indicates an anechoic pattern image. The values of the intersection over union (IoU) are, from left to right, 0.88, 0.57, 0.68, and 0.80.
Applsci 11 07817 g003
Figure 4. Examples of failed results of automatic classification based on deep learning. (a) Cobblestone-like pattern. (b) Cloud-like pattern. (c) Anechoic pattern. The “ground-truth” images show the regions that were manually annotated by the expert. The “deep-learning” images show the regions extracted as a result of automatic classification. White indicates an unclear layer structure, yellow indicates a cobblestone-like pattern image, red indicates a cloud-like pattern image, and purple indicates an anechoic pattern image. The values of the intersection over union (IoU) are, from left to right, 0.27, 0.42, and 0.27.
Applsci 11 07817 g004
Table 1. Results of the test for each ultrasonographic finding.
US FindingsDetection PerformanceMean Value of IoUMean Value of DICE ScoreNumber of Cases in Test DataNumber of Images in Test Data
Unclear layer structure100.0%0.800.89237
Cobblestone-like pattern85.7%0.560.7117
Cloud-like pattern71.4%0.380.51114
Anechoic pattern93.3%0.620.76115
IoU: intersection over union.
Publisher’s Note: MDPI stays neutral with regard to jurisdictional claims in published maps and institutional affiliations.

